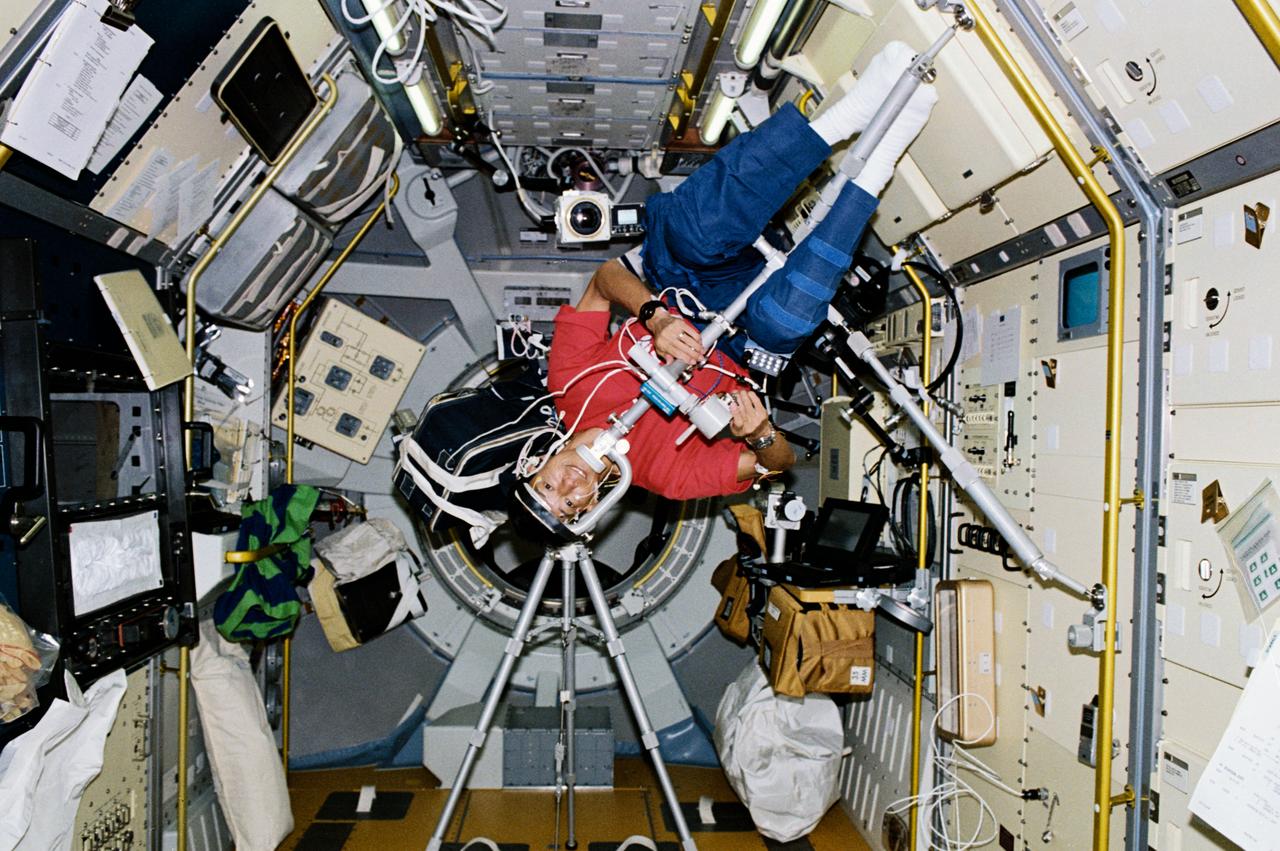
STS047-204-006 (12 - 20 Sept 1992) --- Dr. Mamoru Mohri, payload specialist representing Japan's National Space Development Agency (NASDA), participates in an experiment designed to learn more about Space Adaptation Syndrome (SAS). The experiment is titled, "Comparative Measurement of Visual Stability in Earth and Cosmic Space." During the experiment, Dr. Mohri tracked a flickering light target while eye movements and neck muscle tension were measured. This 45-degree angle position was one of four studied during the eight-day Spacelab-J mission.
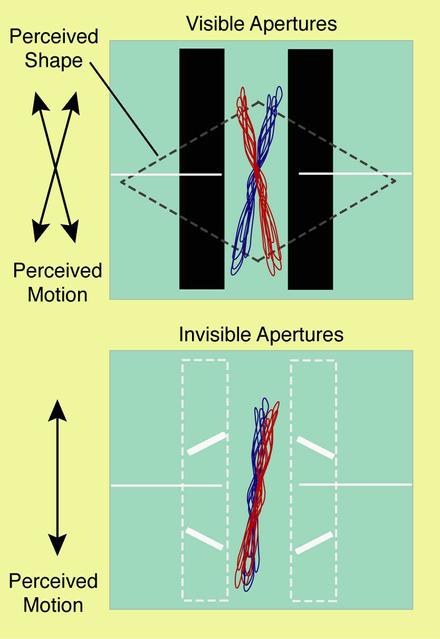
One concern about human adaptation to space is how returning from the microgravity of orbit to Earth can affect an astronaut's ability to fly safely. There are monitors and infrared video cameras to measure eye movements without having to affect the crew member. A computer screen provides moving images which the eye tracks while the brain determines what it is seeing. A video camera records movement of the subject's eyes. Researchers can then correlate perception and response. Test subjects perceive different images when a moving object is covered by a mask that is visible or invisible (above). Early results challenge the accepted theory that smooth pursuit -- the fluid eye movement that humans and primates have -- does not involve the higher brain. NASA results show that: Eye movement can predict human perceptual performance, smooth pursuit and saccadic (quick or ballistic) movement share some signal pathways, and common factors can make both smooth pursuit and visual perception produce errors in motor responses.
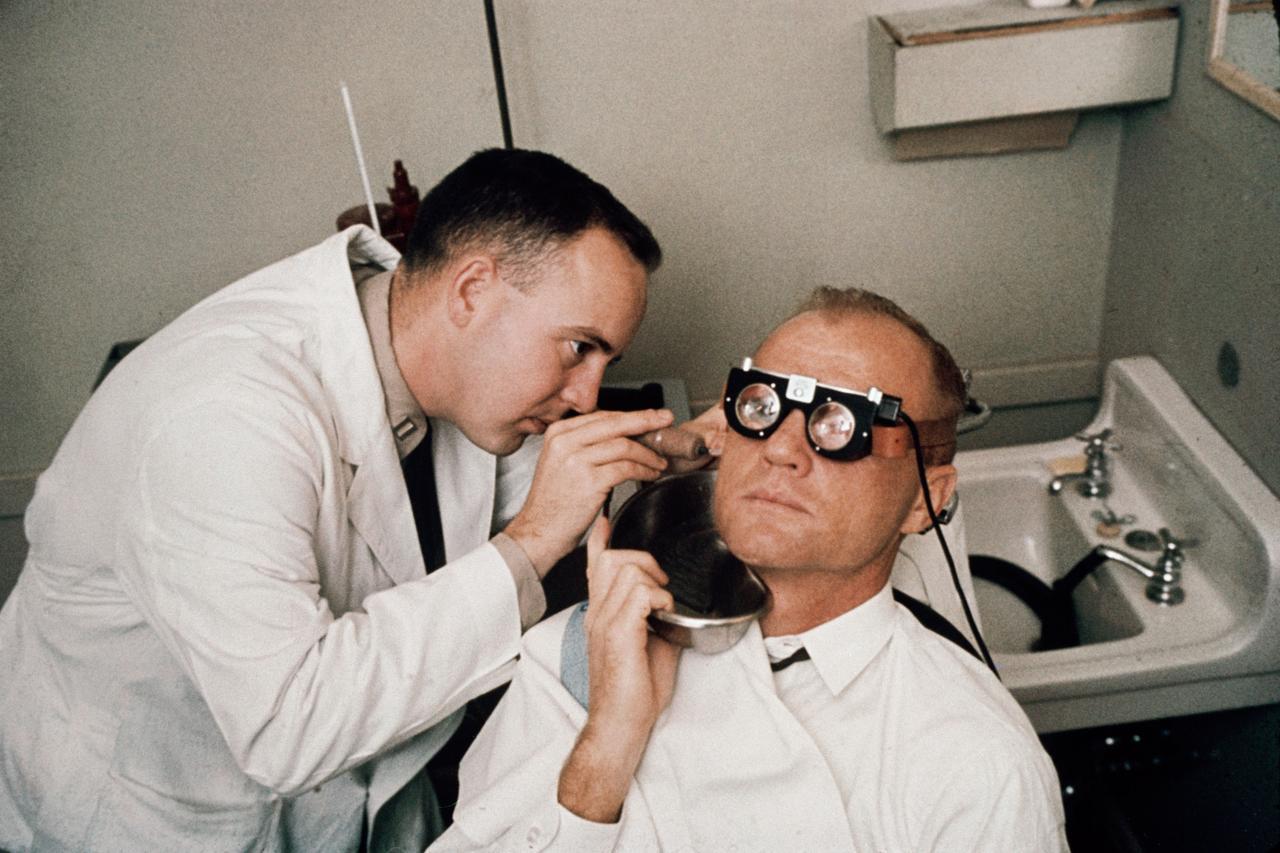
S64-14849 (1962) --- Astronaut John H. Glenn Jr.'s balance mechanism (semi-circular-canals) is tested by running cool water into his ear and measuring effect on eye motions (nystagmus). Photo credit: NASA
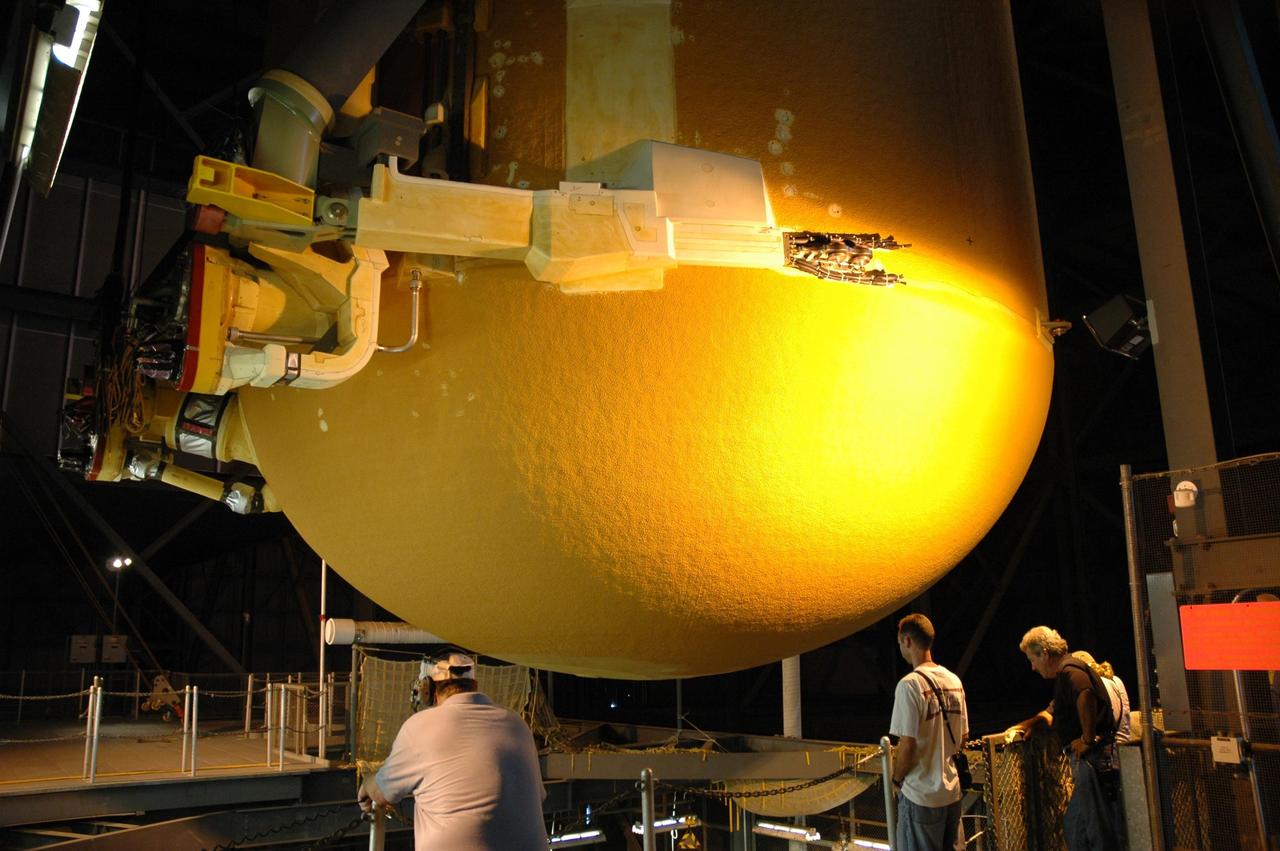
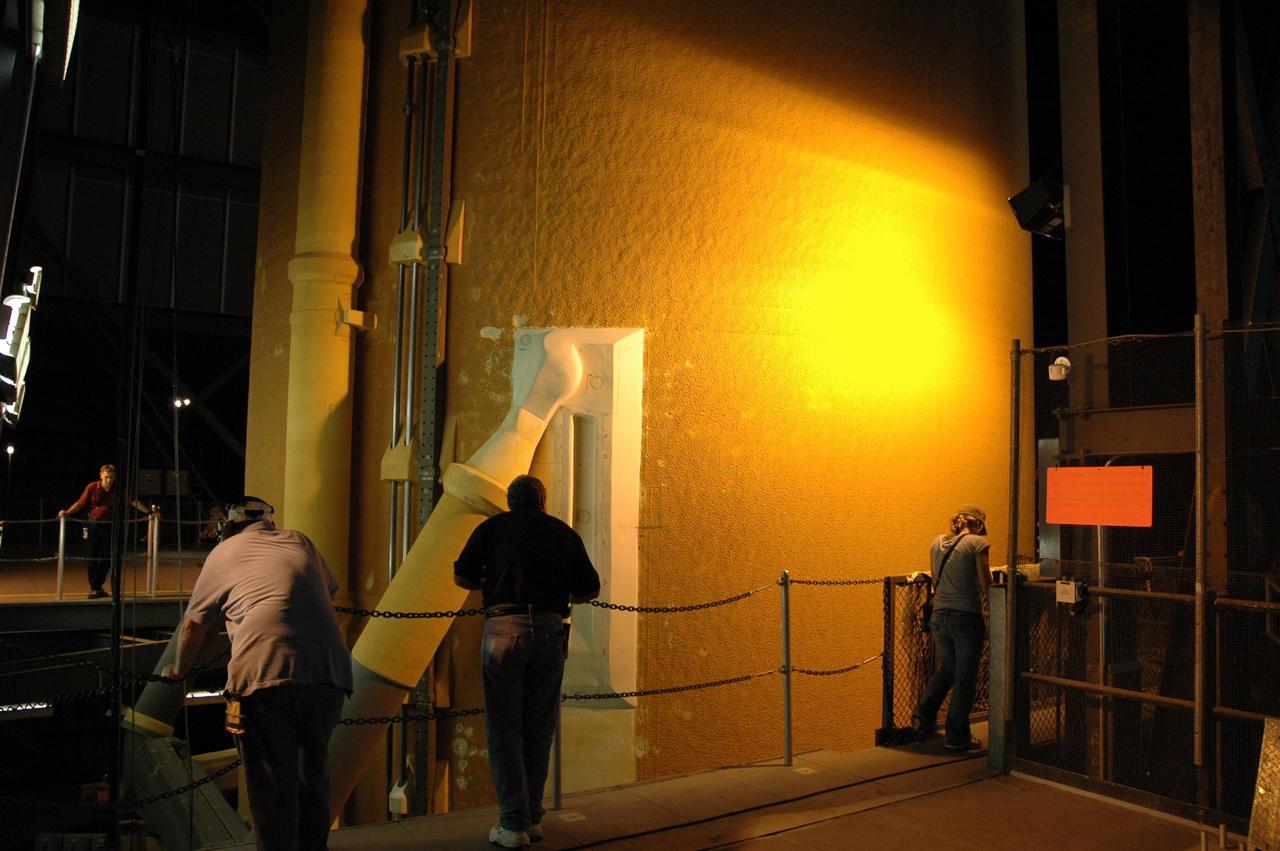
KENNEDY SPACE CENTER, FLA. -- In the Vehicle Assembly Building, workers keep an eye on the movement of external tank No. 125 as it is lowered into a checkout cell in high bay 4 for processing. The tank will be part of the space shuttle stack for mission STS-122 targeted to launch Dec. 6. Photo credit: NASA/Troy Cryder
KENNEDY SPACE CENTER, FLA. -- In the Vehicle Assembly Building, workers keep an eye on the movement of external tank No. 125 as it is lowered into a checkout cell in high bay 4 for processing. The tank will be part of the space shuttle stack for mission STS-122 targeted to launch Dec. 6. Photo credit: NASA/Troy Cryder
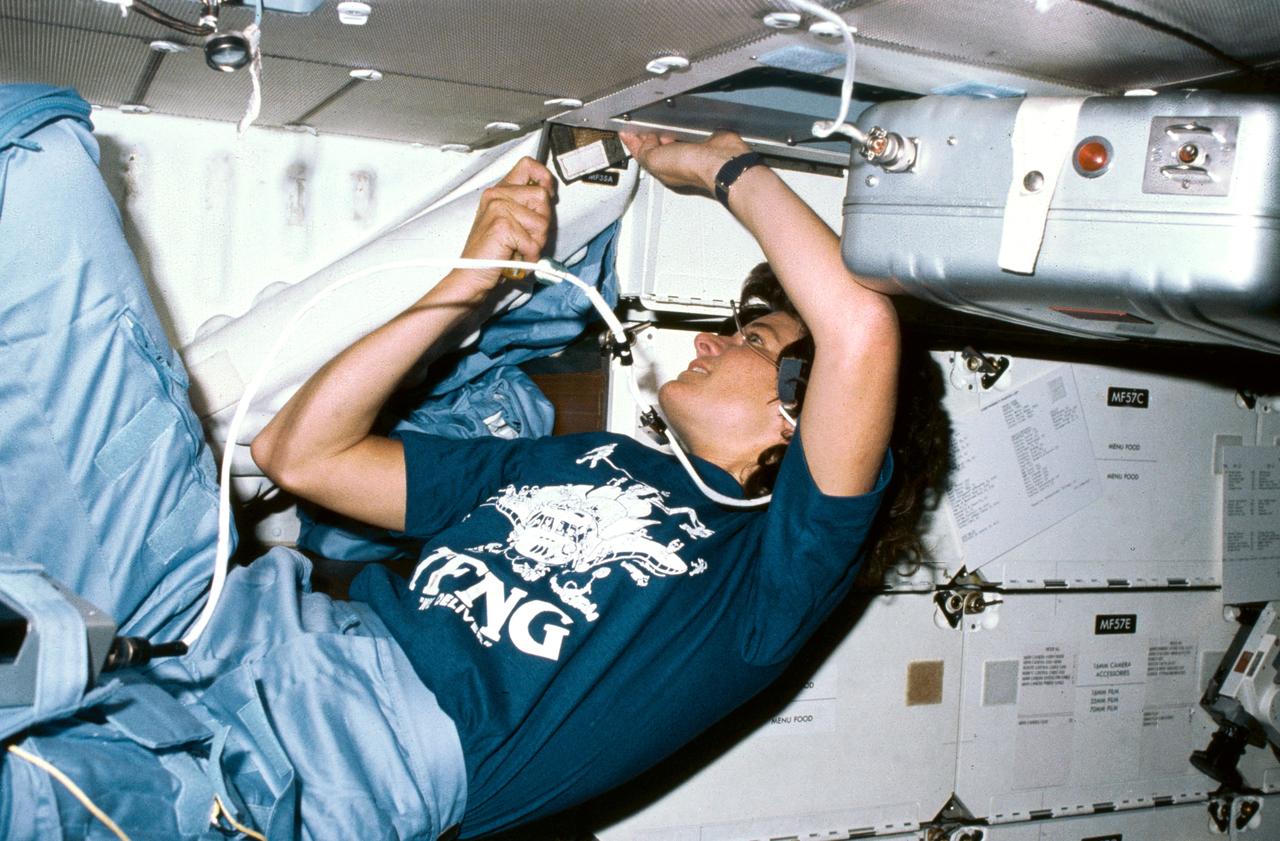
S83-35768 (18-24 June 1983) --- Astronaut Sally K. Ride, mission specialist for STS-7, uses a screw driver in order to clean out an air filtering system in the mid-deck of the Earth-orbiting Space Shuttle Challenger. Dr. Ride's constant wear garment bears some extras -- a cartoon of 35 busy astronauts around a Space Shuttle and the acronym TFNG, below which is written, "We deliver!" TFNG stands for thirty-five new guys, referring to the 1978 class of astronaut candidates (ASCAN) from which Dr. Ride and three of her crew members hail. The tiny two-word declarative in white lettering refers to the successful deployment of two communications satellites. This photograph was made with a 35mm camera.
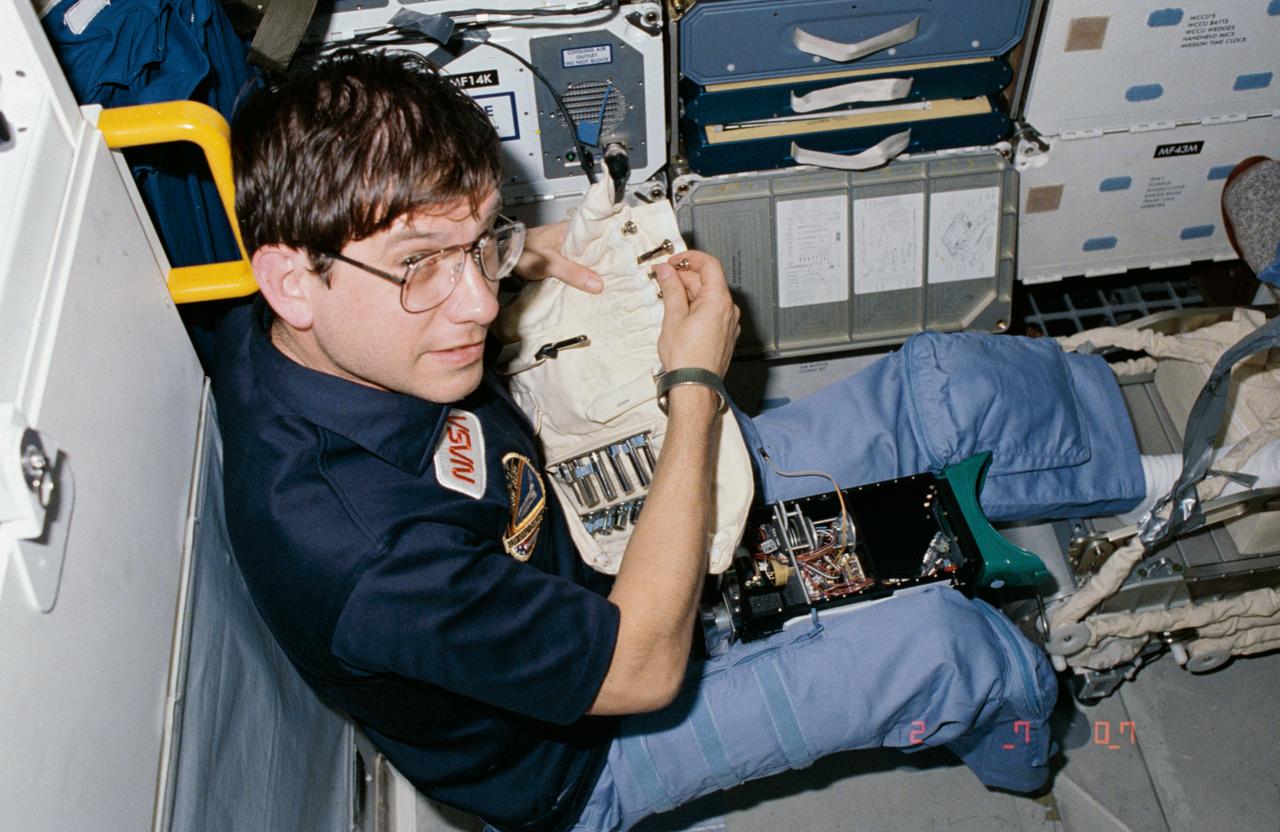
61C-05-035 (12-17 Jan 1986) --- Robert J. Cenker, 61-C payload specialist representing RCA, returns a tiny tool to its stowage position after adjusting the inner workings of a device used in one of a number of detailed supplementary objective (DSO) studies for NASA's Space Biomedical Research Institute. The device is a pair of ocular counter-rolling goggles used by U.S. Rep. Bill Nelson (D., Florida), 61-C's other payload specialist aboard the Columbia for this five-day flight.

In this fish-eye view, a worker oversees the movement of the Chandra X-ray Observatory into the payload bay of the orbiter Columbia. Chandra is the primary payload on mission STS-93, scheduled to launch no earlier than July 20 aboard Space Shuttle Columbia. The world's most powerful X-ray telescope, Chandra will allow scientists from around the world to see previously invisible black holes and high-temperature gas clouds, giving the observatory the potential to rewrite the books on the structure and evolution of our universe
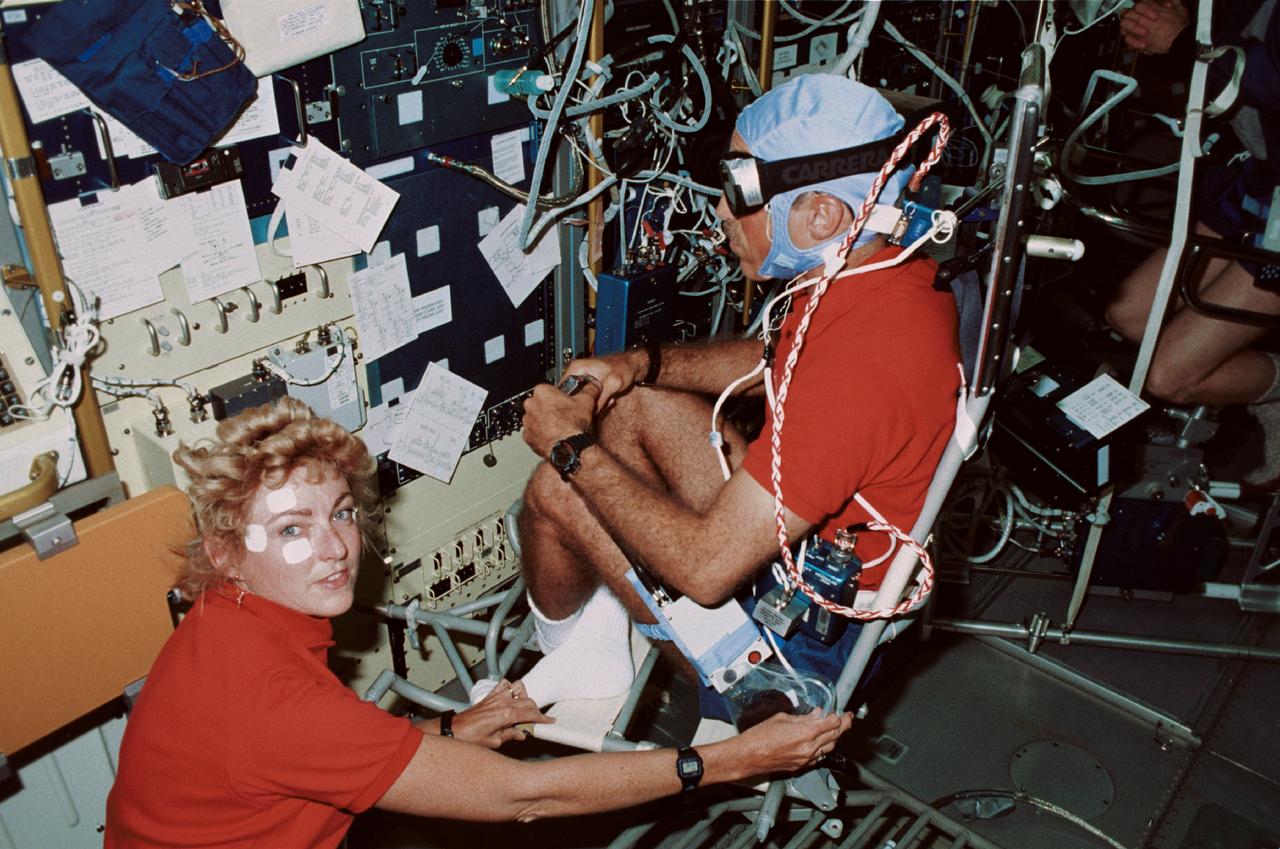
STS040-211-020 (5-14 June 1991) --- Vestibular experiment activities were captured onboard Columbia's Spacelab Life Sciences (SLS-1) module in this 35mm scene. Astronaut James P. Bagian, STS-40 mission specialist, is in a rotating chair while wearing an accelometer and electrodes to record head motion and horizontal and vertical eye movements during the rotations. Payload specialist Millie Hughes-Fulford, lower left, assists with the test.
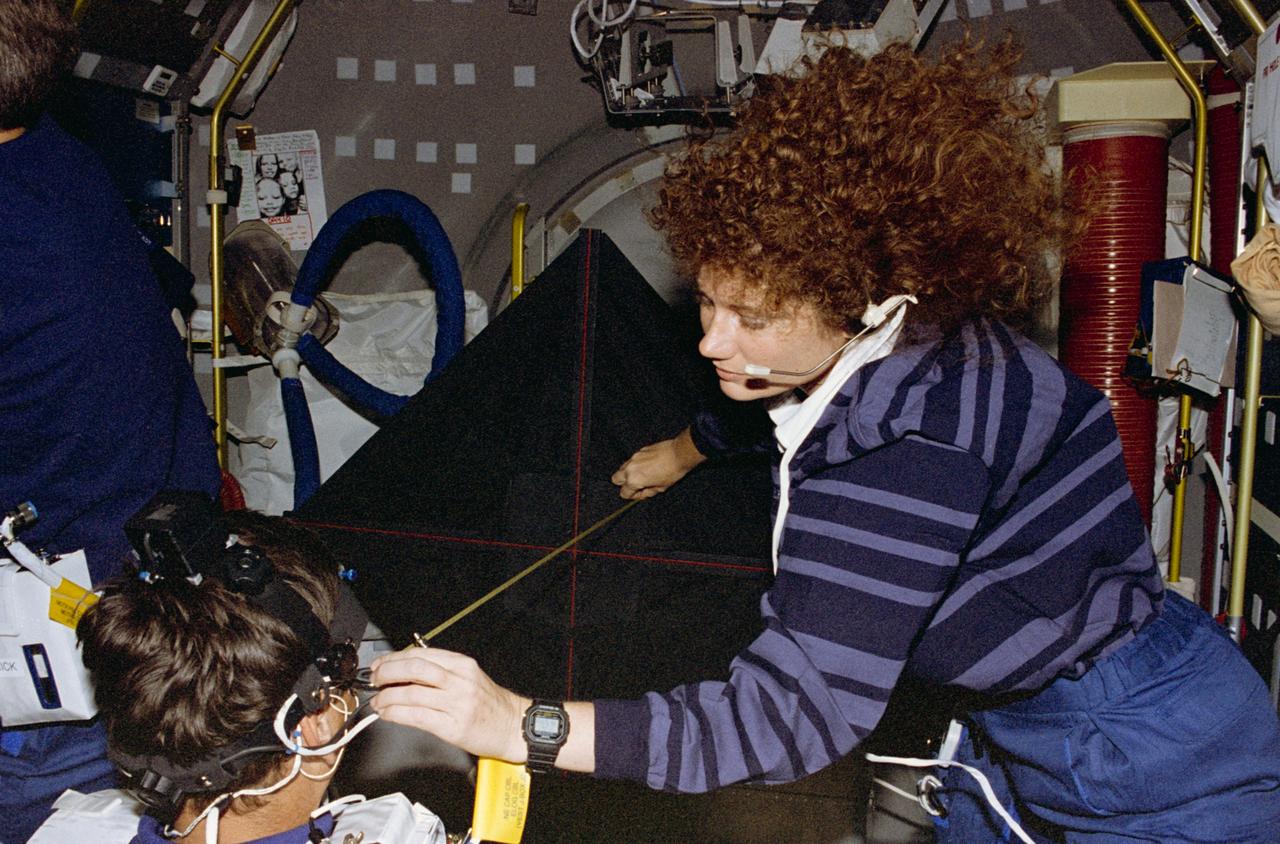
STS078-398-032 (20 June - 7 July 1996) --- Astronaut Susan J. Helms, payload commander, measures the distance between Jean-Jacques Favier’s head and the luminous torque, used for the Canal and Otolith Interaction Study (COIS) on the Life and Microgravity Spacelab (LMS-1) mission. Favier, representing the French Space Agency (CNES), is one of two international payload specialists on the almost-17-day flight. This view shows the Voluntary Head Movement (VHM) segment of the experiment. The VHM is meant to characterize how the coordination of head and eye movement changes as a result of spaceflight. Since most vestibular functions are influenced by gravity, the COIS experiment is meant to measure response differences in microgravity.
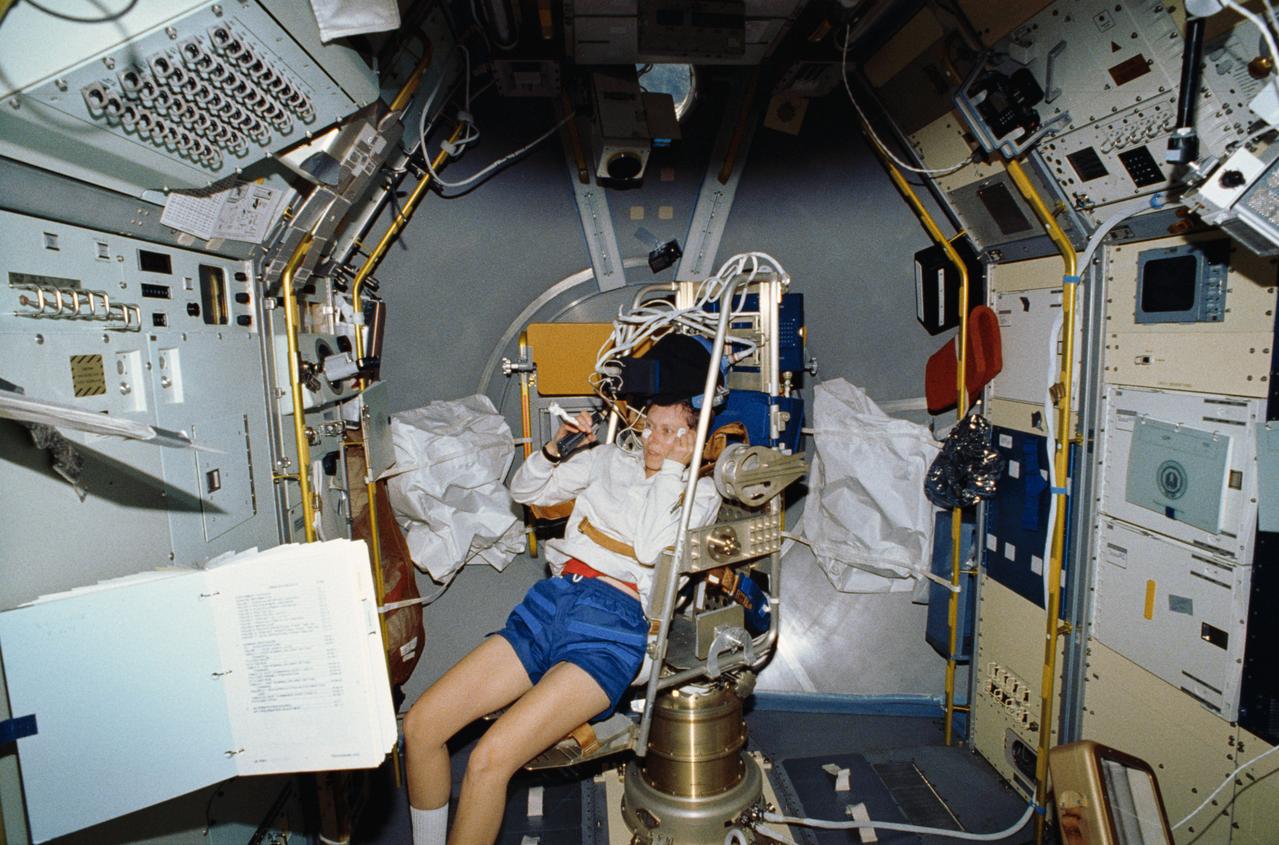
STS042-06-031 (30 Jan 1992) - - - STS-42 Payload Specialist Roberta L. Bondar gets into the Microgravity Vestibular Investigations (MVI) rotator chair to begin an experiment. The chair is mounted in the center aisle of the International Microgravity Laboratory 1 (IML-1) Spacelab (SL) module. Just above Bondar's head is the helmet assembly which is outfitted with accelerometers to measure head movements and visors that fit over each eye independently to provide visual stimuli. The chair system has three movement patterns: "sinusoidal" or traveling predictably back and forth over the same distance at a constant speed; "pseudorandom" or moving back and forth over varying distances; and "stepped" or varying speeds beginning and stopping suddenly.
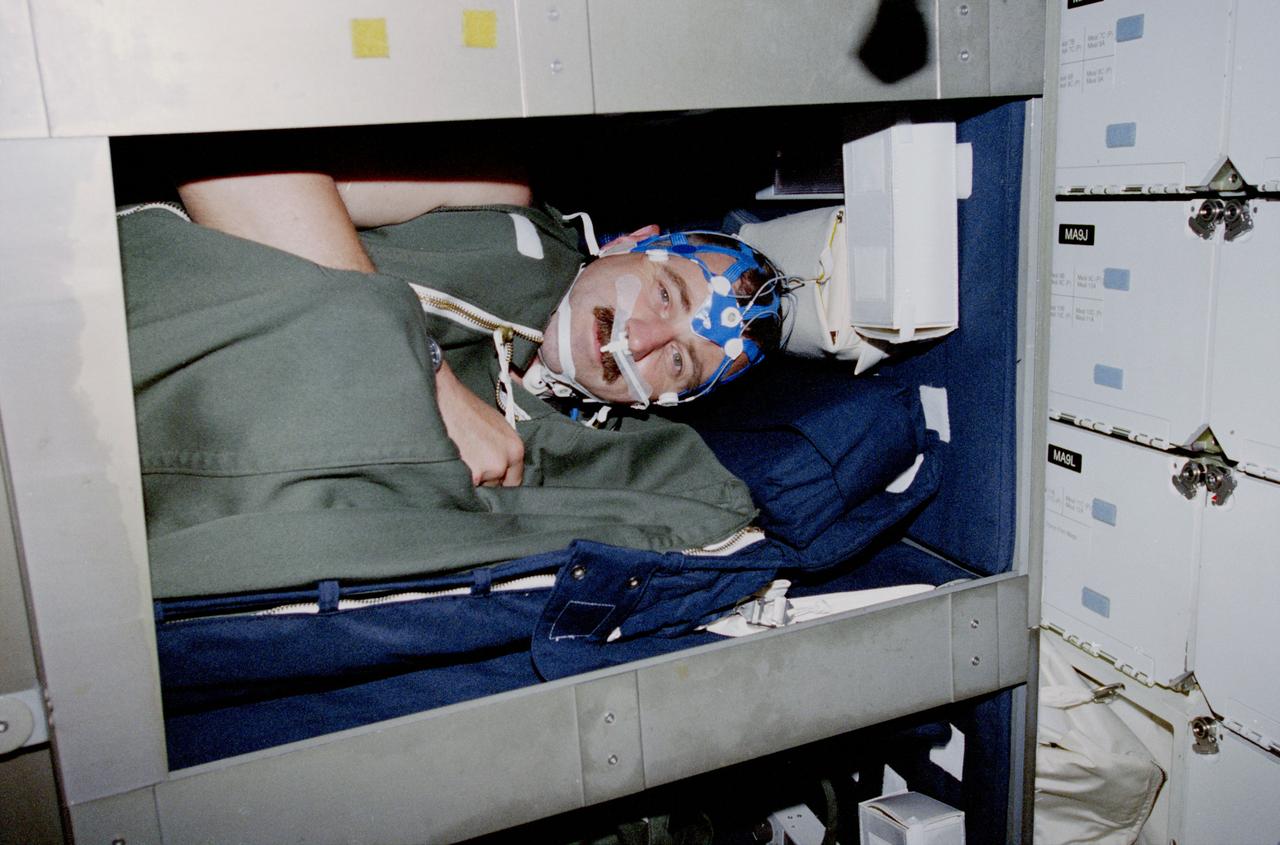
STS090-377-011 (17 APRIL-3 MAY 1998) --- Astronaut Dafydd R. (Dave) Williams, mission specialist representing the Canadian Space Agency (CSA), accomplishes more than one purpose when he sleeps in this bunk aboard the Earth-orbiting Space Shuttle Columbia. Conducting a Neurolab sleep experiment, Williams wears equipment which includes a sleep net (mesh cap that monitors and records brain waves); a Respiratory Inductance Plethysmograph (RIP) suit for monitoring respiration; and an activity monitor -- a device (out of view) worn on the wrist to detect and record body movement. Data on brain waves, eye movements, respiration, heart rate, and oxygen concentration are routed to a portable data recorder. The entire system has capabilities similar to a fully equipped sleep laboratory on Earth. The sleeping bag is conventional Shuttle ware and not part of the experiment.
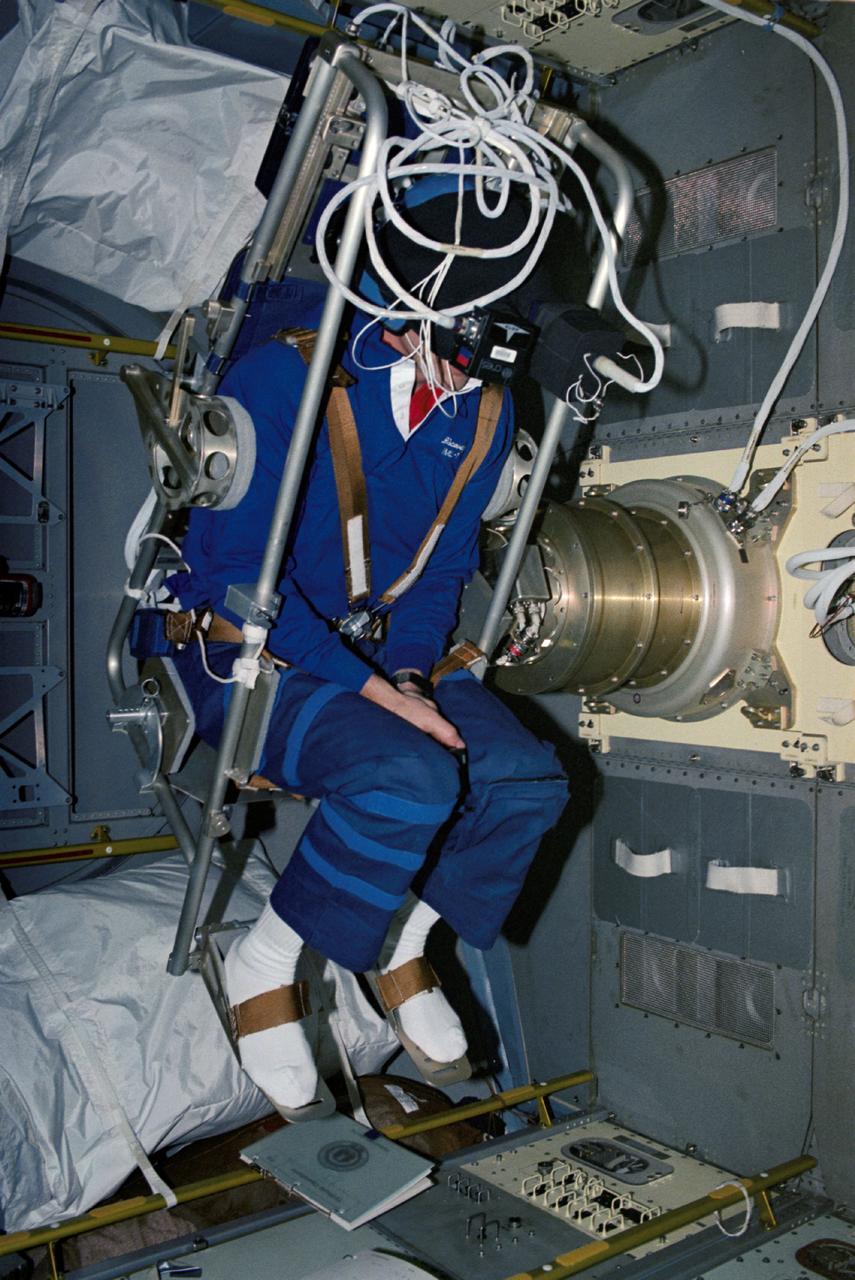
STS042-27-037 (22-30 Jan. 1992) --- Astronaut David C. Hilmers, STS-42 mission specialist, wearing a helmet assembly, sits in the Microgravity Vestibular Investigation (MVI) rotating chair. The scene is in the International Microgravity Laboratory (IML-1) science module aboard Discovery. Hilmers, a mission specialist, and six other crewmembers spent more than eight days in Earth-orbit conducting experiments. Hilmer's helmet assembly is outfitted with accelerometers to measure head movements and visors that fit over each eye independently to provide visual stimuli. The chair system has three movement patterns: "sinusoidal" or traveling predictably back and forth over the same distance at a constant speed; "pseudorandom" or moving back and forth over the varying distances; and "stepped" or varying speeds beginning and stopping suddenly.
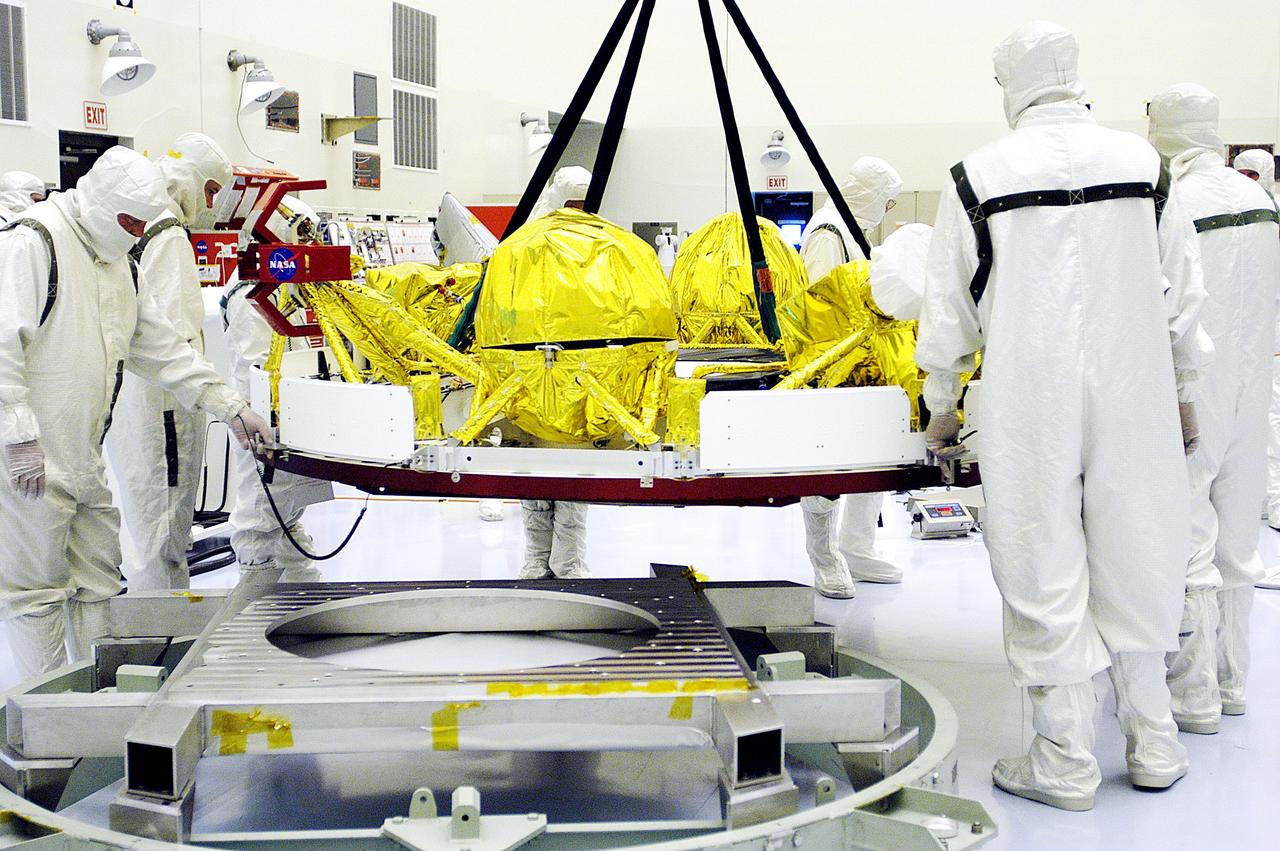
KENNEDY SPACE CENTER, FLA. - In the Payload Hazardous Servicing Facility, workers oversee the movement of the cruise stage of Mars Exploration Rover 1 (MER-1). The cruise stage will be integrated with the aeroshell, the entry vehicle. NASA’s twin Mars Exploration Rovers are designed to study the history of water on Mars. These robotic geologists are equipped with a robotic arm, a drilling tool, three spectrometers, and four pairs of cameras that allow them to have a human-like, 3D view of the terrain. Each rover could travel as far as 100 meters in one day to act as Mars scientists' eyes and hands, exploring an environment where humans can’t yet go. The MER-1 is scheduled to launch June 25 from Launch Pad 17-A, Cape Canaveral Air Force Station.
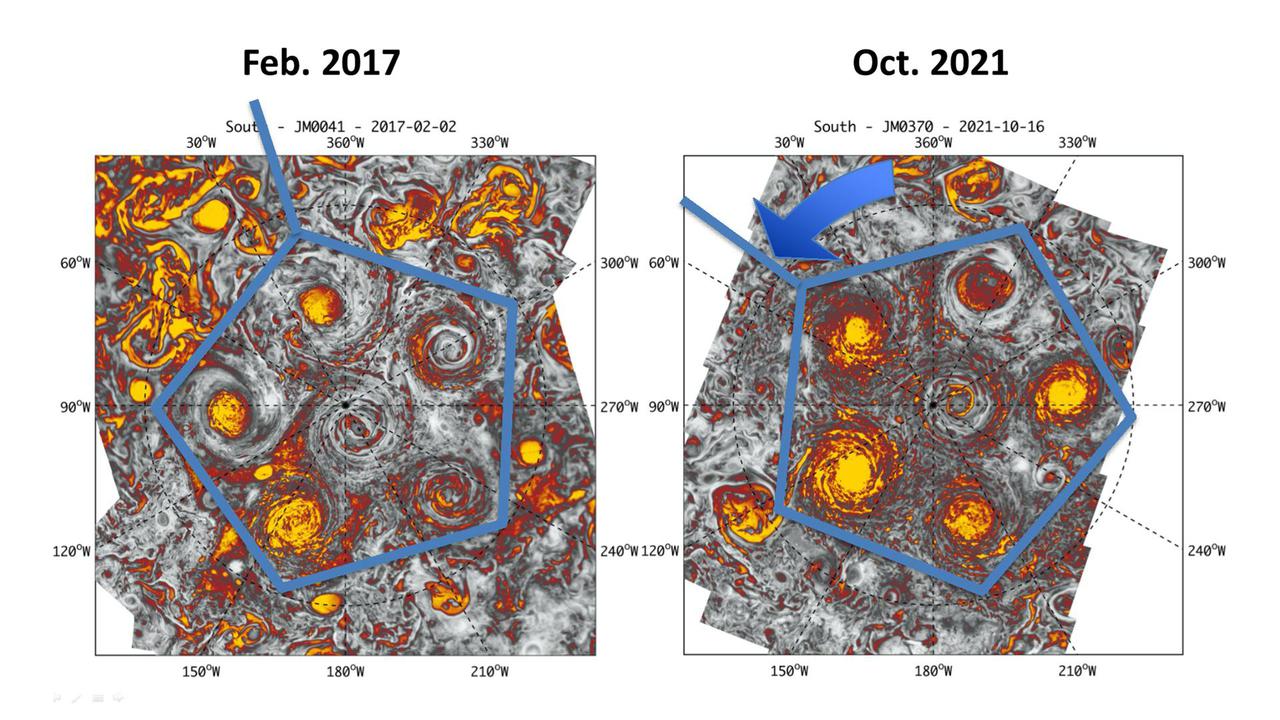
This annotated composite image depicts the movement of the polar and circumpolar cyclones of Jupiter's south pole between 2016 (left) and 2021 (right) as seen by the Jovian Infrared Auroral Mapper (JIRAM) instrument aboard NASA's Juno spacecraft. In both images, five cyclones are arranged as a pentagon, with a sixth cyclone in the center (south pole). JIRAM "sees" in infrared light not visible to the human eye. It was designed to capture the infrared light emerging from deep inside Jupiter, probing the weather layer down to 30 to 45 miles (50 to 70 kilometers) below Jupiter's cloud tops. https://photojournal.jpl.nasa.gov/catalog/PIA24967
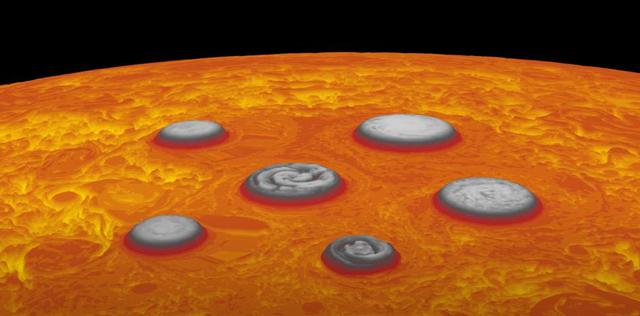
In this animation, forces created by movement toward the south pole of a circumpolar cyclone (farthest right) results in the temporary shift in location by the polar cyclone – the central cyclone directly over the pole – and the four other circumpolar cyclones. Data used to generate this animation was acquired by the Jovian Infrared Auroral Mapper (JIRAM) instrument aboard NASA's Juno spacecraft. JIRAM "sees" in infrared light not visible to the human eye. It was designed to capture the infrared light emerging from deep inside Jupiter, probing the weather layer down to 30 to 45 miles (50 to 70 kilometers) below Jupiter's cloud tops. Movie available at https://photojournal.jpl.nasa.gov/catalog/PIA24969
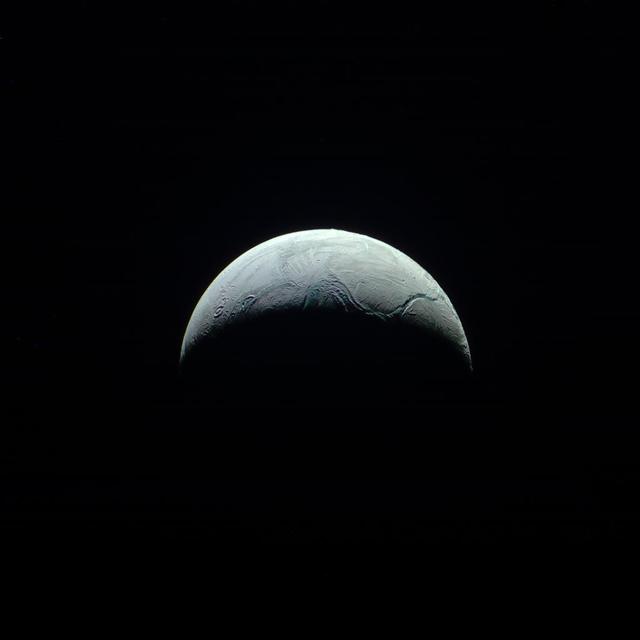
The heavens often seem vast and unchanging as seen from Earth, but movement in the skies is the norm. The relative motions of both Cassini and Enceladus over a 15-minute period create the movement seen in this movie sequence. Cassini has monitored Enceladus (313 miles or 504 kilometers across) with a particular interest in the plumes and the geology of the south polar region for many years. Different viewing geometries give scientists different information, and the resulting animation gives us a unique "spacecraft's eye" view of the flyby. The movie is a composite of six images taken with the Cassini spacecraft narrow-angle camera on Aug. 1, 2017 using filters that allow infrared, green, and ultraviolet light. The image filter centered on 930 nm (IR) is red in this image, the image filter centered on the green is green, and the image filter centered on 338 nm (UV) is blue. The view was obtained at a distance of approximately 112,000 miles (181,000 kilometers) from Enceladus. Image scale is about 0.6 mile (1 kilometer) per pixel. The animation is available at https://photojournal.jpl.nasa.gov/catalog/PIA21344
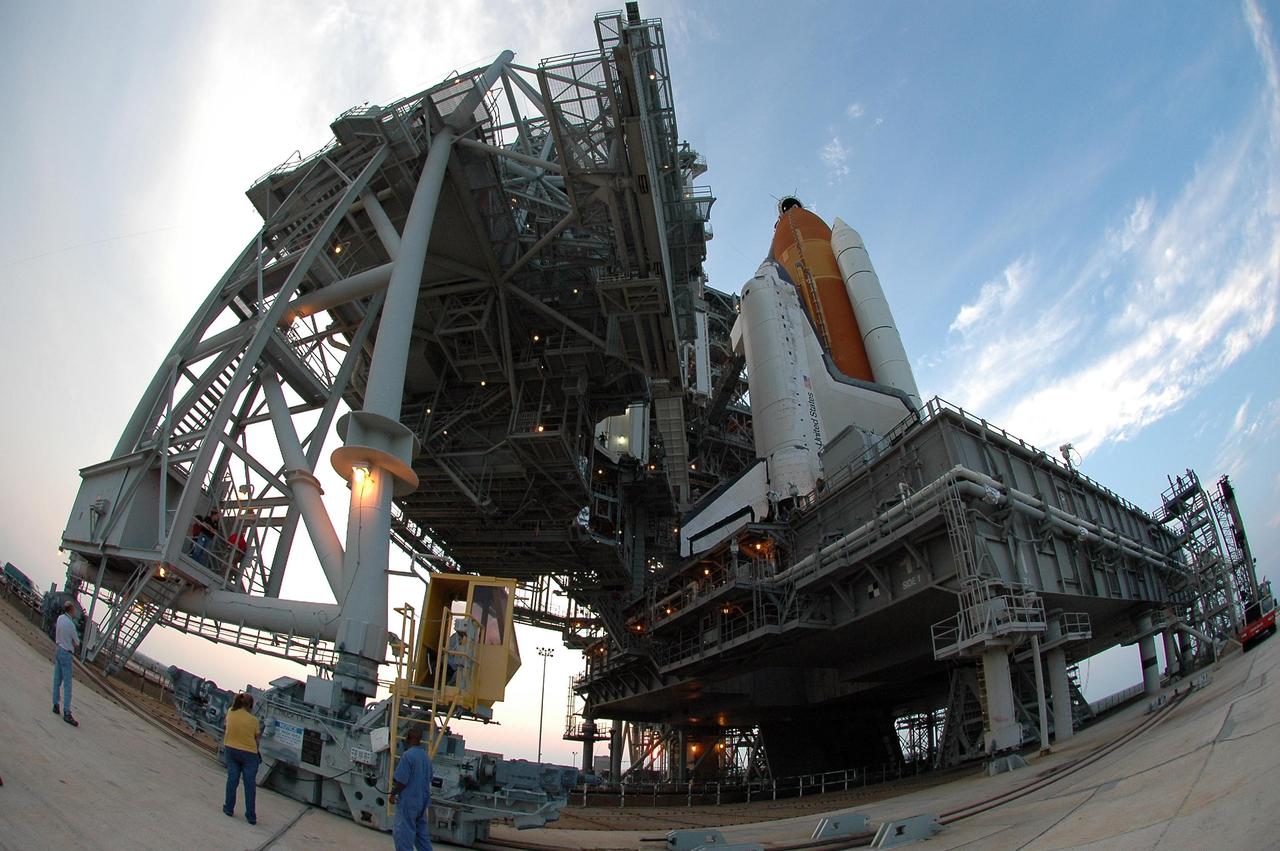
KENNEDY SPACE CENTER, FLA. - A fish-eye camera lens captures the movement of the rotating service structure (RSS) at left as it moves away from Space Shuttle Discovery in preparation for the July 1 launch from Launch Pad 39B. The RSS provides protected access to the orbiter for changeout and servicing of payloads at the pad. The structure is supported by a rotating bridge that pivots about a vertical axis on the west side of the pad's flame trench. The hinge column rests on the pad surface and is braced to the fixed service structure. Support for the outer end of the bridge is provided by two eight-wheel, motor-driven trucks that move along circular twin rails installed flush with the pad surface. The track crosses the flame trench on a permanent bridge. The RSS is 102 feet long, 50 feet wide and 130 feet high. The structure has orbiter access platforms at five levels to provide access to the payload bay while the orbiter is being serviced in the RSS. Each platform has independent extendable planks that can be arranged to conform to a payload's configuration. This mission is the 115th shuttle flight and the 18th U.S. flight to the International Space Station. Photo credit: NASA/Kim Shiflett
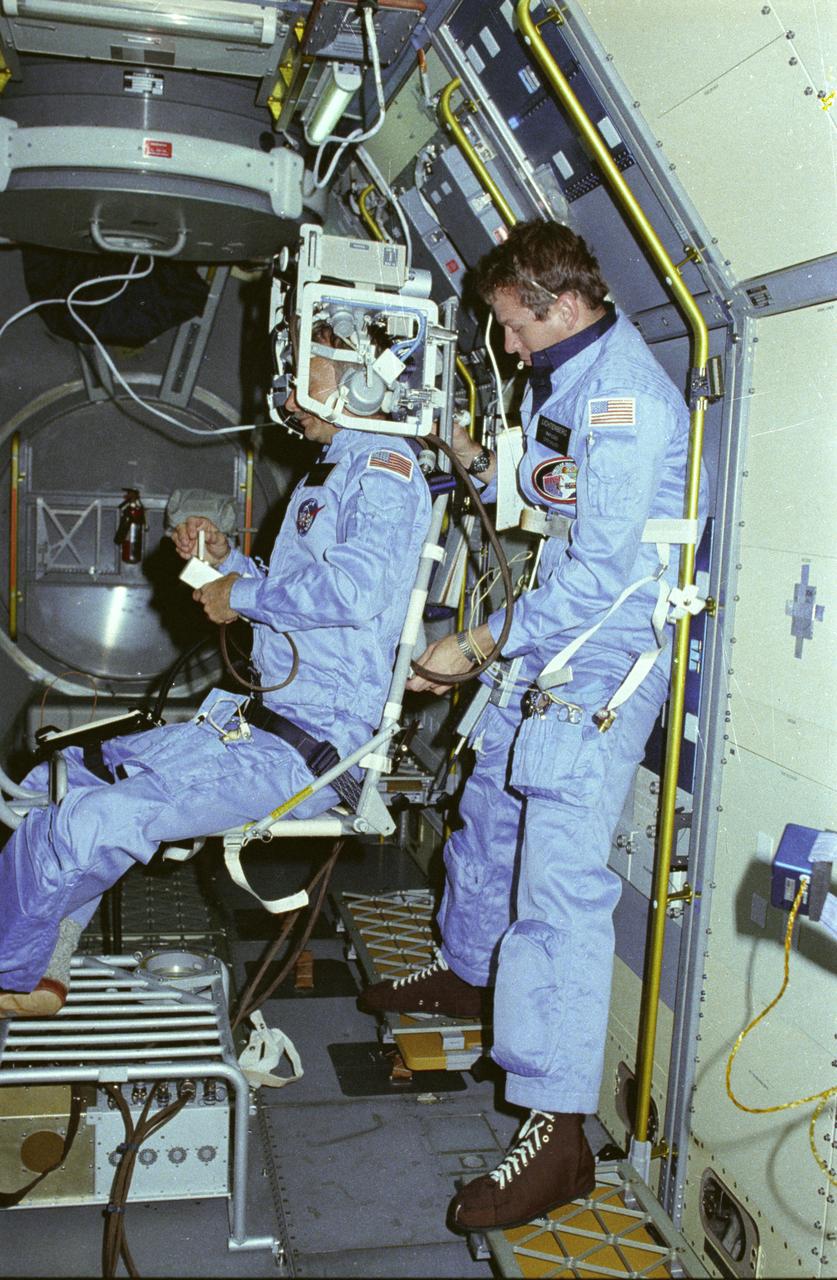
In this photograph, astronauts Owen Garriott on the body restriant system and Byron Lichtenberg prepare for a Vestibular Experiment during the Spacelab-1 mission. The Vestibular Experiments in Space were the study of the interaction among the otoliths, semicircular canals, vision, and spinal reflexes in humans. The main objective was to determine how the body, which receives redundant information for several sensory sources, interprets this information in microgravity. Another objective was to record and characterize the symptoms of space sickness experienced by crewmembers. The body restraint system was a rotating chair with a harness to hold the test subject in place. The crewmember wore an accelerometer and electrodes to record head motion and horizontal and vertical eye movement as the body rotated. The first Spacelab mission, Spacelab-1, sponsored jointly and shared equally by NASA and the European Space Agency, was a multidisciplinary mission; that is, investigations were performed in several different fields of scientific research. The overall goal of the mission was to verify Spacelab performance through a variety of scientific experiments. The Spacelab-1 was launched aboard the Space Shuttle Orbiter Columbia for the STS-9 mission on November 28, 1983. The Marshall Space Flight Center had management responsibilities for the mission.
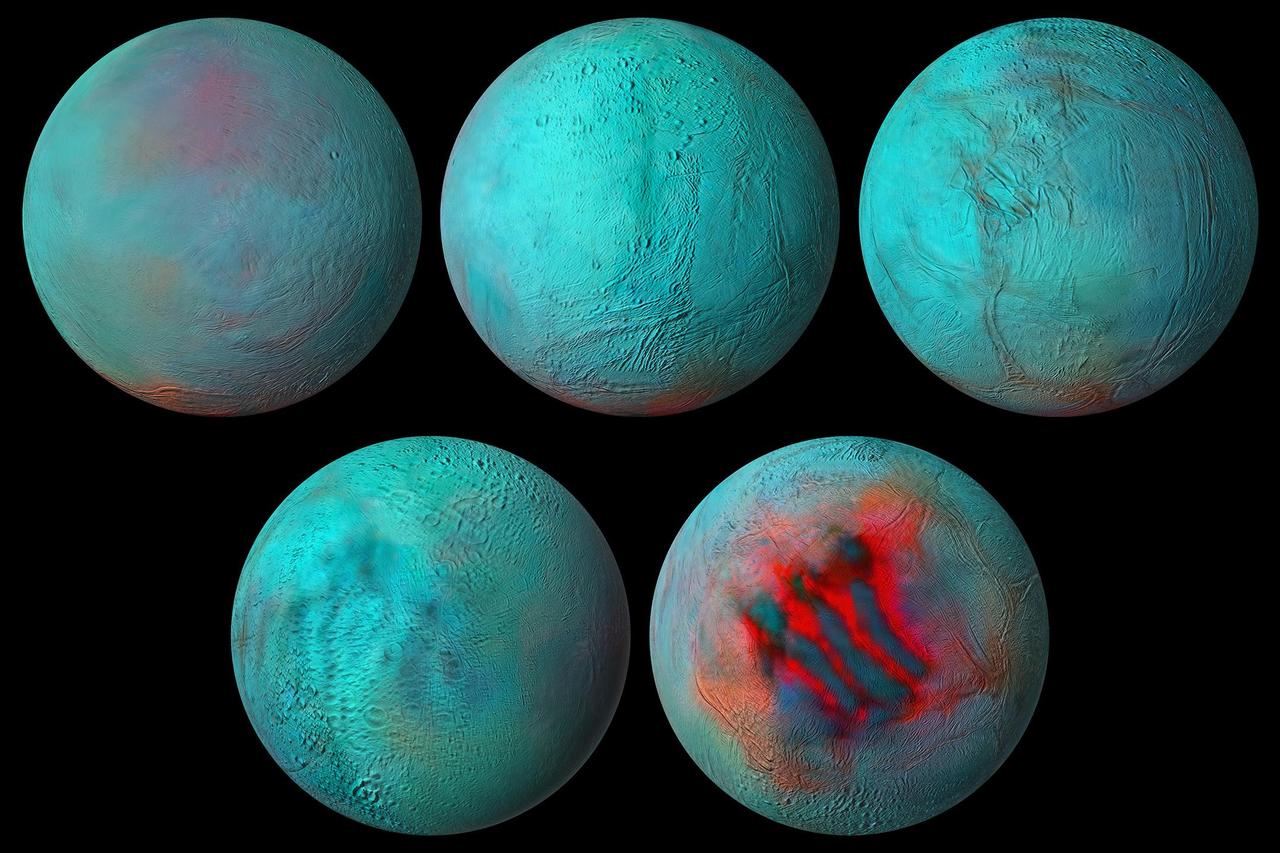
New composite images made from NASA's Cassini spacecraft data are the most detailed global infrared views ever produced of Saturn's moon Enceladus. And data used to build those images provides strong evidence that the northern hemisphere of the moon has been resurfaced with ice from its interior. During Cassini's 13-year exploration of the Saturn system, the spacecraft's Visible and Infrared Mapping Spectrometer (VIMS) collected light — both visible to the human eye and infrared light — reflected off the planet, its rings, and its 10 major icy moons. VIMS then separated light into its various wavelengths, information that tells scientists more about the makeup of the material reflecting it. Combined with detailed images captured by Cassini's Imaging Science Subsystem, the VIMS data was used to make the new global spectral map of Enceladus. It shows that infrared signals correlate with the geologic activity known to be ongoing at the south pole, where plumes of ice grains and vapor shoot out from an ocean that lies under the icy crust. The so-called "tiger stripe" gashes, where the plumes originate, are seen here. But some of the same infrared features are also seen in the northern hemisphere. That tells scientists not just that the northern area is covered with fresh ice but that the same kind of geologic activity, a resurfacing of the landscape, has occurred in both hemispheres. The resurfacing in the north may be due to icy jets, or a more gradual movement of ice through fractures in the crust, from the subsurface ocean to the surface. Movie available at https://photojournal.jpl.nasa.gov/catalog/PIA24023

This illustration lays a depiction of the sun's magnetic fields over an image captured by NASA’s Solar Dynamics Observatory on March 12, 2016. The complex overlay of lines can teach scientists about the ways the sun's magnetism changes in response to the constant movement on and inside the sun. Note how the magnetic fields are densest near the bright spots visible on the sun – which are magnetically strong active regions – and many of the field lines link one active region to another. This magnetic map was created using the PFSS – Potential Field Source Surface – model, a model of the magnetic field in the sun’s atmosphere based on magnetic measurements of the solar surface. The underlying image was taken in extreme ultraviolet wavelengths of 171 angstroms. This type of light is invisible to our eyes, but is colorized here in gold. Credits: NASA/SDO/AIA/LMSAL <b><a href="http://www.nasa.gov/audience/formedia/features/MP_Photo_Guidelines.html" rel="nofollow">NASA image use policy.</a></b> <b><a href="http://www.nasa.gov/centers/goddard/home/index.html" rel="nofollow">NASA Goddard Space Flight Center</a></b> enables NASA’s mission through four scientific endeavors: Earth Science, Heliophysics, Solar System Exploration, and Astrophysics. Goddard plays a leading role in NASA’s accomplishments by contributing compelling scientific knowledge to advance the Agency’s mission. <b>Follow us on <a href="http://twitter.com/NASAGoddardPix" rel="nofollow">Twitter</a></b> <b>Like us on <a href="http://www.facebook.com/pages/Greenbelt-MD/NASA-Goddard/395013845897?ref=tsd" rel="nofollow">Facebook</a></b> <b>Find us on <a href="http://instagrid.me/nasagoddard/?vm=grid" rel="nofollow">Instagram</a></b>
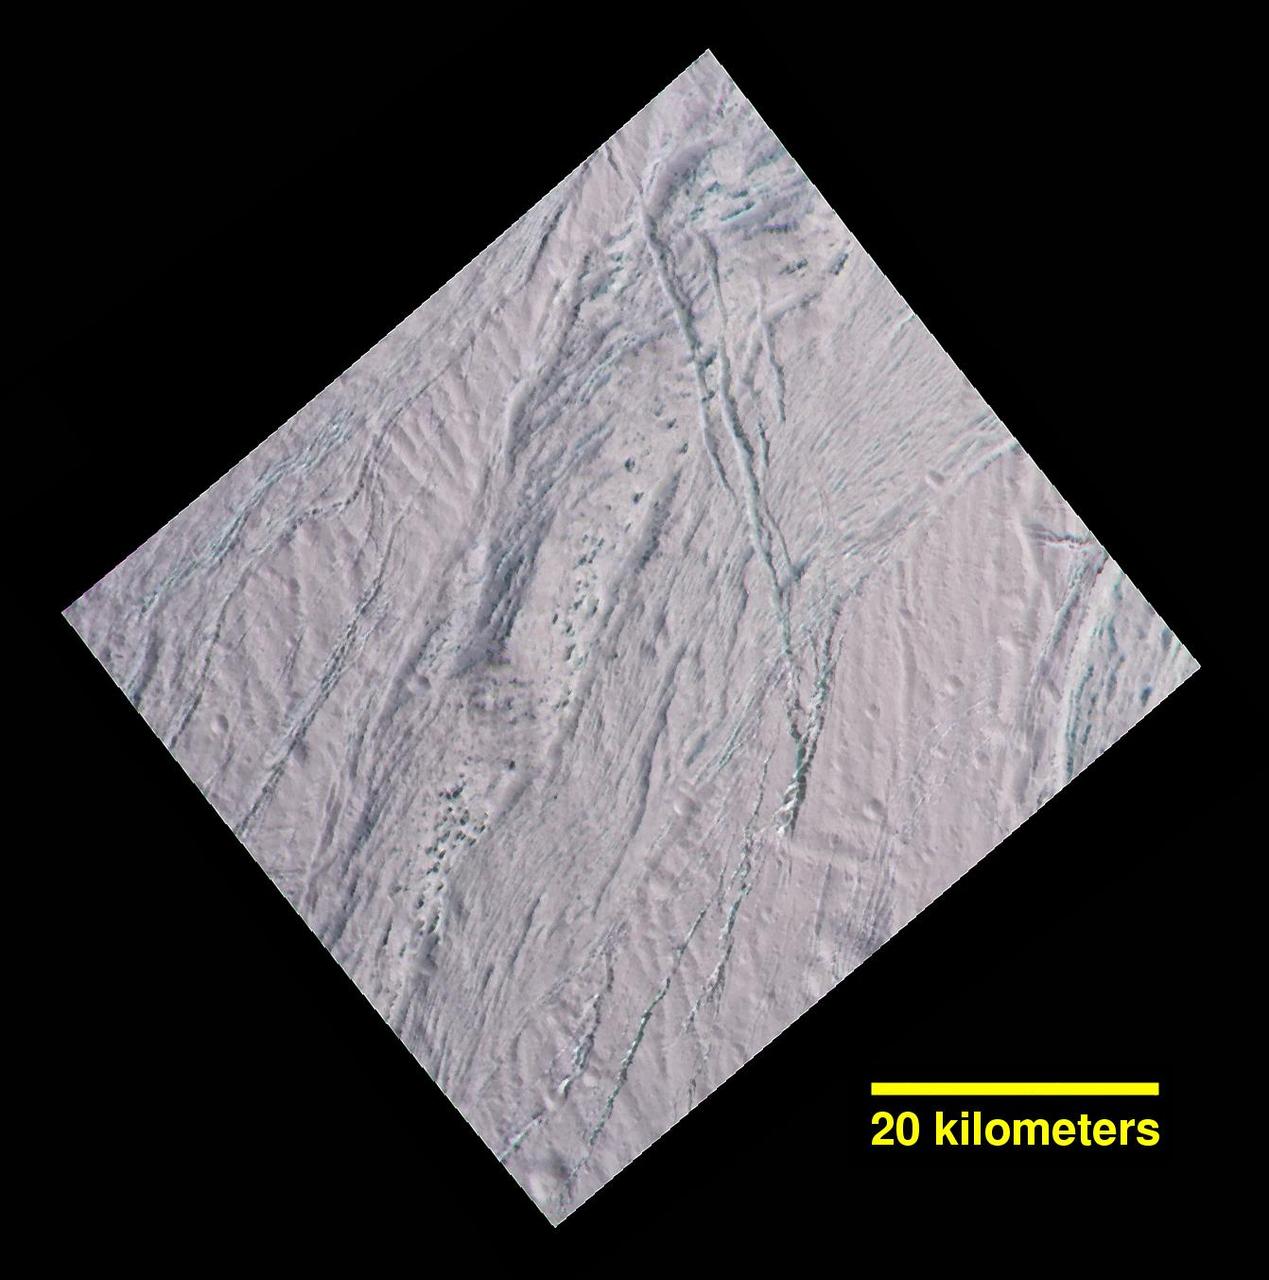
During its final close flyby of Saturn's moon Enceladus, NASA's Cassini spacecraft revisited a landscape, and a mystery, that it had originally glimpsed more than 10 years earlier. In views of this terrain captured during a 2005 flyby (see PIA06188), imaging scientists noticed small dark spots of an uncertain nature. Observing the same features in this false-color view, at higher resolution than before, provides some new insights. The spots are evidently large, relatively dark protrusions of solid "bedrock" ice and ice blocks scattered on and around the prominent ridge that runs across the scene from north to south (from top center toward lower left). The ice blocks range in size from dozens to hundreds of feet (tens to hundreds of meters). The false-color view uses an ultraviolet filter centered at 338 nanometers for blue, a green filter centered at 568 nanometers for green and a near-infrared filter centered at 930 nanometers for red -- thus covering a wider spectrum region than the human eye. As in earlier Cassini views of Enceladus using the same combination of color filters (see PIA06254), green-hued features represent coarse-grained or solid ice. Exposures of these kinds of ices are also found on the walls of cracks and troughs in this scene and elsewhere on Enceladus. To an observer on the surface, the prominent north-south trending ridge might look superficially like icy flatirons (tilted, triangular outcroppings of rock), but probably more shallowly dipping than terrestrial examples. The exposed line of ice blocks along its ridge crest might make it look a bit like a hogback (a narrow ridge with steep sides, often with vertical rocky outcrops along the top). On Enceladus, with no wind to scour loose particulate ice or "snow" off of them, the solid blocks are probably cleared by some combination of downslope movement of particulates, and perhaps sublimation. This image has a spatial scale of about 220 feet (67 meters) per pixel at its center, which is nearly twice the resolution of the earlier view (PIA06188). This terrain is on the moon's Saturn-facing side, a few degrees south of the equator. The view has been rotated so that north on Enceladus is up. The view was obtained by the Cassini spacecraft narrow-angle camera on Dec. 19, 2015. http://photojournal.jpl.nasa.gov/catalog/PIA20017
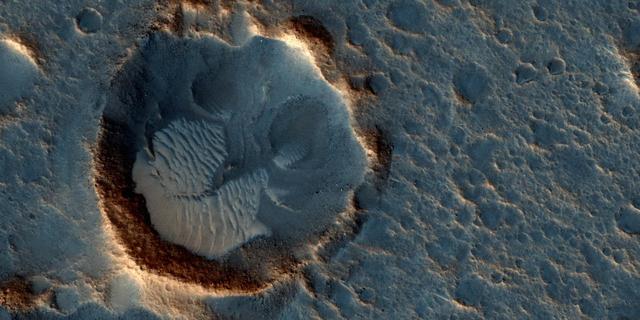
This image from the High Resolution Imaging Science Experiment (HiRISE) camera on NASA's Mars Reconnaissance Orbiter shows a location on Mars associated with the best-selling novel and Hollywood movie, "The Martian." This area is in the Acidalia Planitia region. In the novel and the movie, it is the landing site of a crewed mission named Ares 3. For the story's central character, Acidalia Planitia is within driving distance from where NASA's Mars Pathfinder, with its Sojourner rover, landed in 1997. An initial HiRISE image of the site was taken in April 2015 and is online at http://hirise.lpl.arizona.edu/ESP_040776_2115. A second one was taken May 17, 2015, and is shown here. Figure 1 is a stereo combination of the two, appearing three-dimensional when viewed through blue-red glasses with the red lens on the left One of the main objectives of the HiRISE camera is to carry out "monitoring science", which involves taking images of certain areas of high scientific interest on regular intervals. The team usually does so to monitor a seasonal or recurring process such as seasonal changes in carbon-dioxide ice near the poles, dune movement or recurring flow-like features on some slopes. HiRISE also takes repeated images of areas with active rovers, such as Curiosity, to help plan safe routes toward areas of high scientific interest. Another key responsibility for the HiRISE camera is to provide information for use in selection of landing sites for future missions. One technique is to image a site of interest at least twice when the weather conditions are similar, but with a small difference in viewing angle, much like what you would experience if you looked at something with only your right eye, then looked at it again with the left. By doing this, we are able to build a stereo view of the site, providing a chance to identify high and low points in the site more effectively. This resulting 3-D information can combined with elevation data from laser altimeters to create a highly accurate "digital terrain model" or DTM for short. DTMs allow researchers to view the locations in 3-D and to analyze them by measuring the exact height of features that could be hazardous to the future mission, such as large boulders or small impact craters. DTMs from HiRISE were a key factor in choosing the landing site for NASA's Curiosity Mars rover in Gale Crater and are being used to evaluate sites under consideration for the NASA's 2016 InSight Mars lander and Mars 2020 rover missions. The location of the site in this image is 31.3 degrees north latitude, 331.3 degrees east latitude. The image is an excerpt from HiRISE observation ESP_041277_2115. http://photojournal.jpl.nasa.gov/catalog/PIA19913
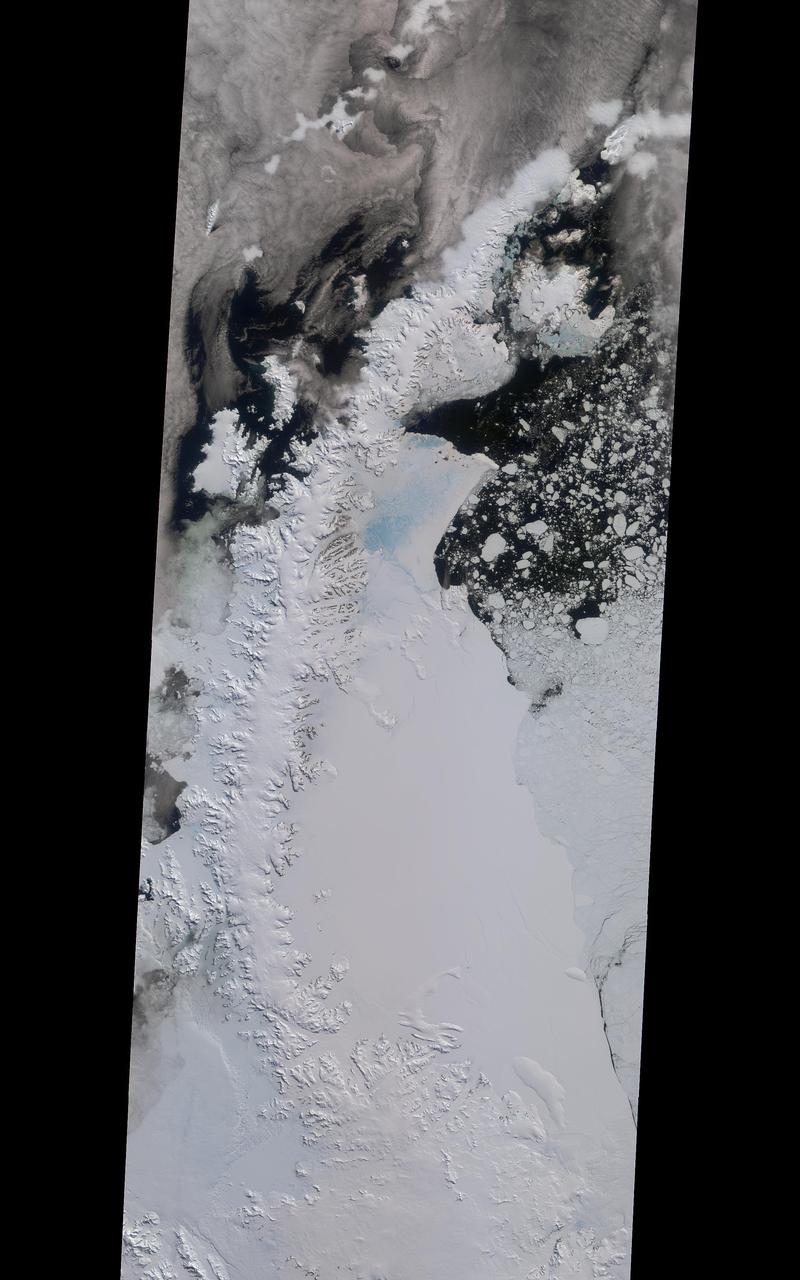
A rift in Antarctica's Larsen C ice shelf has grown to 110 miles (175 km) long, making it inevitable that an iceberg larger than Rhode Island will soon calve from the ice shelf. Larsen C is the fourth largest ice shelf in Antarctica, with an area of almost 20,000 square miles (50,000 square kilometers). The calving event will remove approximately 10 percent of the ice shelf's mass, according to the Project for Impact of Melt on Ice Shelf Dynamics and Stability (MIDAS), a UK-based team studying the ice shelf. Only 12 miles (20 km) of ice now separates the end of the rift from the ocean. The rift has grown at least 30 miles (50 km) in length since August, but appears to be slowing recently as Antarctica returns to polar winter. Project MIDAS reports that the calving event might destabilize the ice shelf, which could result in a collapse similar to what occurred to the Larsen B ice shelf in 2002. The Multi-angle Imaging SpectroRadiometer (MISR) instrument aboard NASA's Terra satellite captured views of Larsen C on August 22, 2016, when the rift was 80 miles (130 km) in length; December 8, 2016, when the rift was approximately 90 miles (145 km) long; and April 6, 2017. The MISR instrument has nine cameras, which view the Earth at different angles. The overview image, from December 8, shows the entire Antarctic Peninsula -- home to Larsen A, B, and C ice shelves -- in natural color (similar to how it would appear to the human eye) from MISR's vertical-viewing camera. Combining information from several MISR cameras pointed at different angles gives information about the texture of the ice. The accompanying GIF depicts the inset area shown on the larger image and displays data from all three dates in false color. These multiangular views -- composited from MISR's 46-degree backward-pointing camera, the nadir (vertical-viewing) camera, and the 46-degree forward-pointing camera -- represent variations in ice texture as changes in color, such that areas of rough ice appear orange and smooth ice appears blue. The Larsen C shelf is on the left in the GIF, bordered by the Weddell Sea on the upper right. The ice within the rift is orange, indicating movement, and the end of the rift can be tracked across the shelf between images. In addition, between December and April, the rift widened, pushing the future iceberg away from the shelf at its southern end. These data were acquired during Terra orbits 88717, 90290 and 92023. https://photojournal.jpl.nasa.gov/catalog/PIA21581
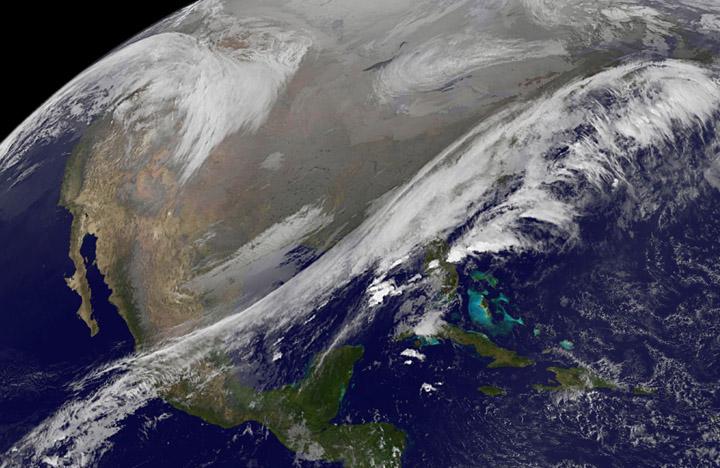
This NOAA's GOES satellite infrared image taken on Nov. 25 at 11:45 UTC (6:45 a.m. EST) shows two main weather systems over the U.S. Credit: NASA/NOAA GOES Project As the U.S. Thanksgiving holiday approaches this Thursday, November 27, NOAA's GOES-East and GOES-West satellites are keeping a weather eye out for storms that may affect early travelers. In an image from Nov. 25, the satellites show an active weather pattern is in place for travelers across the central and eastern U.S. NOAA's GOES-East satellite provides visible and infrared images over the eastern U.S. and the Atlantic Ocean, while NOAA's GOES-West satellite covers the western U.S. and Pacific Ocean from its fixed orbit in space. Data from both satellites were combined at NASA's GOES Project to create a full view of the U.S. on Nov. 25 at 11:45 UTC (6:45 a.m. EST). The image shows clouds associated with cold front stretching from the Gulf of Mexico over northern Florida and along the U.S. East coast to eastern Canada. Clouds associated with another area of low pressure are in the northern Rockies and northwestern U.S. To create the image, NASA/NOAA's GOES Project takes the cloud data from NOAA's GOES-East satellite and overlays it on a true-color image of land and ocean created by data from the Moderate Resolution Imaging Spectroradiometer, or MODIS, instrument that flies aboard NASA's Aqua and Terra satellites. Together, those data created the entire picture of the storm and show its movement. After the storm system passes, the snow on the ground becomes visible. NOAA's National Weather Service Weather Prediction Center said "a storm system will develop off the coast of the Carolinas early Wednesday (Nov. 25) and strengthen as it moves rapidly up the East Coast Wednesday into early Thursday (Nov. 26). Heavy snow is likely to begin in the central Appalachians early Wednesday morning, spreading northeast through the interior Mid-Atlantic into New England by Wednesday night. Winter Storm Watches are in effect for these areas." For travelers in the western U.S., the Northern Rocky Mountains are expected to receive more snow from the north side of a stationary frontal boundary. South of the boundary rain showers will affect the lower valley. The National Weather Service calls for cold weather to continue in the northern Plains and Upper Midwest as a Canadian surface high pressure rules the weather. The U.S. Southwest will experience nice weather for mid-week. In the Pacific Northwest, the National Weather Service noted that a warm front will bring rain, heavy at times, to the Cascades today and tonight. There will be a break in the heavier rains on Wednesday, then another period of heavy rain for the Cascades Wednesday night through Friday morning as a cold front slowly drags through the area. NOAA's GOES satellites provide the kind of continuous monitoring necessary for intensive data analysis. Geostationary describes an orbit in which a satellite is always in the same position with respect to the rotating Earth. This allows GOES to hover continuously over one position on Earth's surface, appearing stationary. As a result, GOES provide a constant vigil for the atmospheric triggers for severe weather conditions such as tornadoes, flash floods, hail storms and hurricanes.
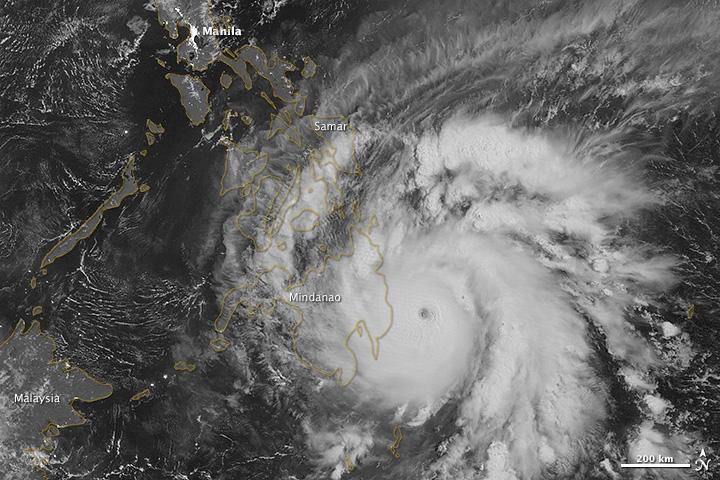
NASA image acquired December 3, 2012 As predicted, Typhoon Bopha made landfall on the Philippine island of Mindanao overnight December 3–4, 2012. Known in the Philippines as Pablo, the storm was blamed for 43 deaths and 25 injuries as of December 4, according to the Philippine Daily Inquirer. (To view the high res or to read more go to: <a href="http://1.usa.gov/XnYhVG" rel="nofollow">1.usa.gov/XnYhVG</a>) The Visible Infrared Imaging Radiometer Suite (VIIRS) on the Suomi NPP satellite acquired this image around 1:12 a.m. local time on December 4 (17:12 UTC on December 3). This image is from the VIIRS “day-night band,” which detects light in a range of wavelengths from green to near-infrared and uses filtering techniques to observe signals such as gas flares, auroras, wildfires, city lights, and reflected moonlight. Bopha remained a powerful typhoon as it made landfall on Mindanao, retaining a distinct eye and spiral shape as storm clouds stretched over the eastern part of the island. Unisys Weather reported that Bopha carried super-typhoon strength at the time it was coming ashore. William Straka, associate researcher at the Cooperative Institute for Meteorological Satellite Studies at the University of Wisconsin–Madison, estimated that the storm spanned at least 1,677 kilometers (1,042 miles). Bopha lost some strength after making landfall. On December 4 (late in the evening in the Philippines), the U.S. Navy’s Joint Typhoon Warning Center (JTWC) reported that the storm had maximum sustained winds of 95 knots (175 kilometers per hour) and gusts up to 115 knots (215 kilometers per hour)—still a fierce storm, but weakened since the previous day. The JTWC projected storm track showed Bopha continuing its movement toward the west-northwest, passing over the southern Philippines toward the South China Sea. NASA Earth Observatory image by Jesse Allen, using VIIRS day-night band data from the Suomi National Polar-orbiting Partnership. Suomi NPP is the result of a partnership between NASA, the National Oceanic and Atmospheric Administration, and the Department of Defense. Caption by Michon Scott. Instrument: Suomi NPP - VIIRS Credit: <b><a href="http://www.earthobservatory.nasa.gov/" rel="nofollow"> NASA Earth Observatory</a></b> <b><a href="http://www.nasa.gov/audience/formedia/features/MP_Photo_Guidelines.html" rel="nofollow">NASA image use policy.</a></b> <b><a href="http://www.nasa.gov/centers/goddard/home/index.html" rel="nofollow">NASA Goddard Space Flight Center</a></b> enables NASA’s mission through four scientific endeavors: Earth Science, Heliophysics, Solar System Exploration, and Astrophysics. Goddard plays a leading role in NASA’s accomplishments by contributing compelling scientific knowledge to advance the Agency’s mission. <b>Follow us on <a href="http://twitter.com/NASA_GoddardPix" rel="nofollow">Twitter</a></b> <b>Like us on <a href="http://www.facebook.com/pages/Greenbelt-MD/NASA-Goddard/395013845897?ref=tsd" rel="nofollow">Facebook</a></b> <b>Find us on <a href="http://instagrid.me/nasagoddard/?vm=grid" rel="nofollow">Instagram</a></b>

NASA's Lunar Reconnaissance Orbiter (LRO) recently captured a unique view of Earth from the spacecraft's vantage point in orbit around the moon. "The image is simply stunning," said Noah Petro, Deputy Project Scientist for LRO at NASA's Goddard Space Flight Center in Greenbelt, Maryland. "The image of the Earth evokes the famous 'Blue Marble' image taken by Astronaut Harrison Schmitt during Apollo 17, 43 years ago, which also showed Africa prominently in the picture." In this composite image we see Earth appear to rise over the lunar horizon from the viewpoint of the spacecraft, with the center of the Earth just off the coast of Liberia (at 4.04 degrees North, 12.44 degrees West). The large tan area in the upper right is the Sahara Desert, and just beyond is Saudi Arabia. The Atlantic and Pacific coasts of South America are visible to the left. On the moon, we get a glimpse of the crater Compton, which is located just beyond the eastern limb of the moon, on the lunar farside. LRO was launched on June 18, 2009, and has collected a treasure trove of data with its seven powerful instruments, making an invaluable contribution to our knowledge about the moon. LRO experiences 12 earthrises every day; however the spacecraft is almost always busy imaging the lunar surface so only rarely does an opportunity arise such that its camera instrument can capture a view of Earth. Occasionally LRO points off into space to acquire observations of the extremely thin lunar atmosphere and perform instrument calibration measurements. During these movements sometimes Earth (and other planets) pass through the camera's field of view and dramatic images such as the one shown here are acquired. This image was composed from a series of images taken Oct. 12, when LRO was about 83 miles (134 kilometers) above the moon's farside crater Compton. Capturing an image of the Earth and moon with LRO's Lunar Reconnaissance Orbiter Camera (LROC) instrument is a complicated task. First the spacecraft must be rolled to the side (in this case 67 degrees), then the spacecraft slews with the direction of travel to maximize the width of the lunar horizon in LROC's Narrow Angle Camera image. All this takes place while LRO is traveling faster than 3,580 miles per hour (over 1,600 meters per second) relative to the lunar surface below the spacecraft! The high-resolution Narrow Angle Camera (NAC) on LRO takes black-and-white images, while the lower resolution Wide Angle Camera (WAC) takes color images, so you might wonder how we got a high-resolution picture of the Earth in color. Since the spacecraft, Earth, and moon are all in motion, we had to do some special processing to create an image that represents the view of the Earth and moon at one particular time. The final Earth image contains both WAC and NAC information. WAC provides the color, and the NAC provides high-resolution detail. "From the Earth, the daily moonrise and moonset are always inspiring moments," said Mark Robinson of Arizona State University in Tempe, principal investigator for LROC. "However, lunar astronauts will see something very different: viewed from the lunar surface, the Earth never rises or sets. Since the moon is tidally locked, Earth is always in the same spot above the horizon, varying only a small amount with the slight wobble of the moon. The Earth may not move across the 'sky', but the view is not static. Future astronauts will see the continents rotate in and out of view and the ever-changing pattern of clouds will always catch one's eye, at least on the nearside. The Earth is never visible from the farside; imagine a sky with no Earth or moon - what will farside explorers think with no Earth overhead?" NASA's first Earthrise image was taken with the Lunar Orbiter 1 spacecraft in 1966. Perhaps NASA's most iconic Earthrise photo was taken by the crew of the Apollo 8 mission as the spacecraft entered lunar orbit on Christmas Eve Dec. 24, 1968. That evening, the astronauts -- Commander Frank Borman, Command Module Pilot Jim Lovell, and Lunar Module Pilot William Anders -- held a live broadcast from lunar orbit, in which they showed pictures of the Earth and moon as seen from their spacecraft. Said Lovell, "The vast loneliness is awe-inspiring and it makes you realize just what you have back there on Earth." Credit: NASA/Goddard/Arizona State University <b><a href="http://www.nasa.gov/audience/formedia/features/MP_Photo_Guidelines.html" rel="nofollow">NASA image use policy.</a></b> <b><a href="http://www.nasa.gov/centers/goddard/home/index.html" rel="nofollow">NASA Goddard Space Flight Center</a></b> enables NASA’s mission through four scientific endeavors: Earth Science, Heliophysics, Solar System Exploration, and Astrophysics. Goddard plays a leading role in NASA’s accomplishments by contributing compelling scientific knowledge to advance the Agency’s mission. <b>Follow us on <a href="http://twitter.com/NASAGoddardPix" rel="nofollow">Twitter</a></b> <b>Like us on <a href="http://www.facebook.com/pages/Greenbelt-MD/NASA-Goddard/395013845897?ref=tsd" rel="nofollow">Facebook</a></b> <b>Find us on <a href="http://instagrid.me/nasagoddard/?vm=grid" rel="nofollow">Instagram</a></b>