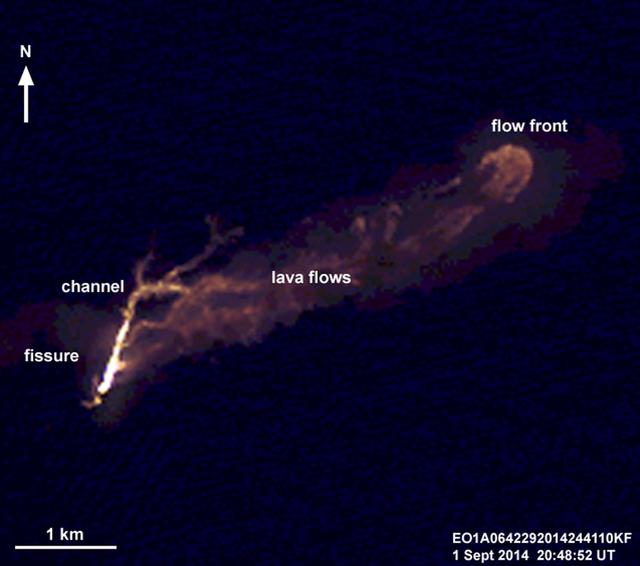
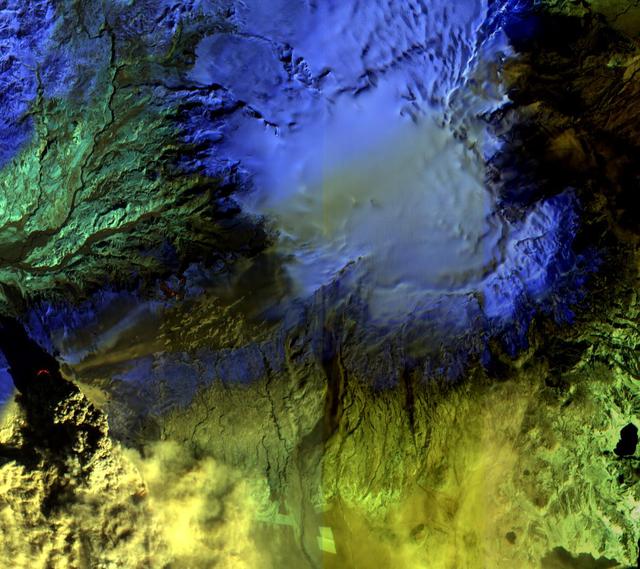
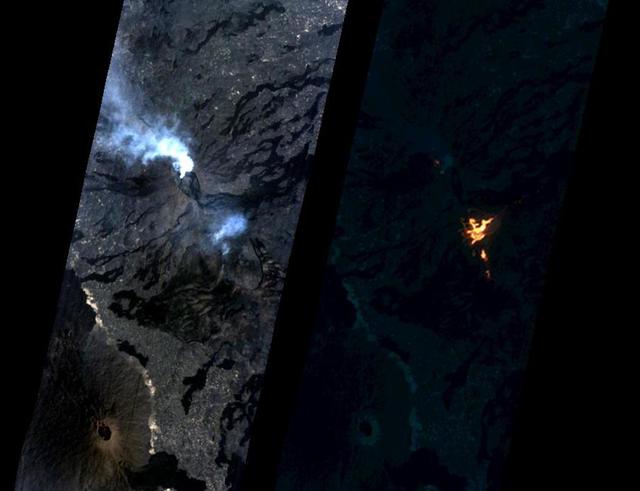
On the night of Sept. 1, 2014, NASA Earth Observing 1 EO-1 spacecraft observed the ongoing eruption at Holuhraun, Iceland. This false-color image that emphasizes the hottest areas of the vent and resulting lava flows.
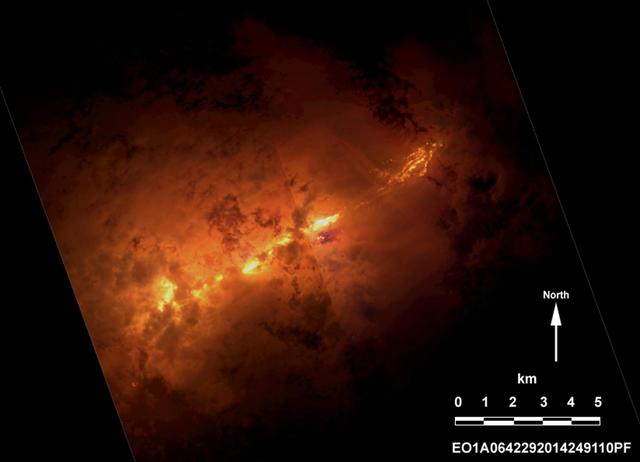
On the night of Sept. 6, 2014 NASA Earth Observing 1 EO-1 spacecraft observed the ongoing eruption at Holuhraun, Iceland. Partially covered by clouds, this scene shows the extent of the lava flows that have been erupting.
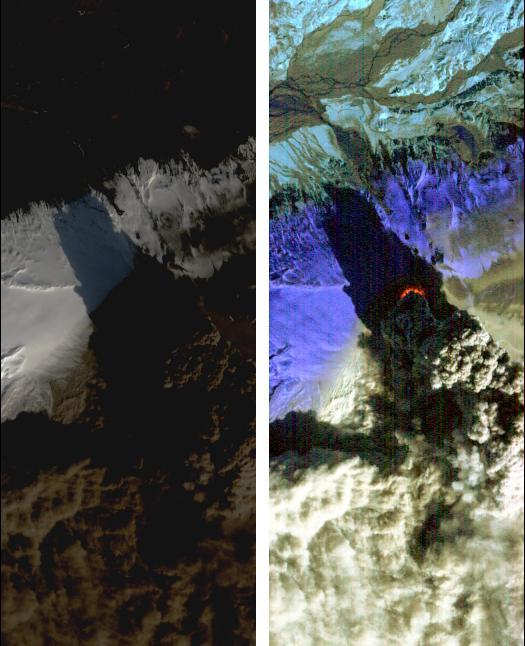
On Saturday, April 17, 2010, NASA Earth Observing-1 EO-1 spacecraft obtained this pair of images of the continuing eruption of Iceland Eyjafjallajökull volcano. On the left, new black ash deposits are visible on the ground.
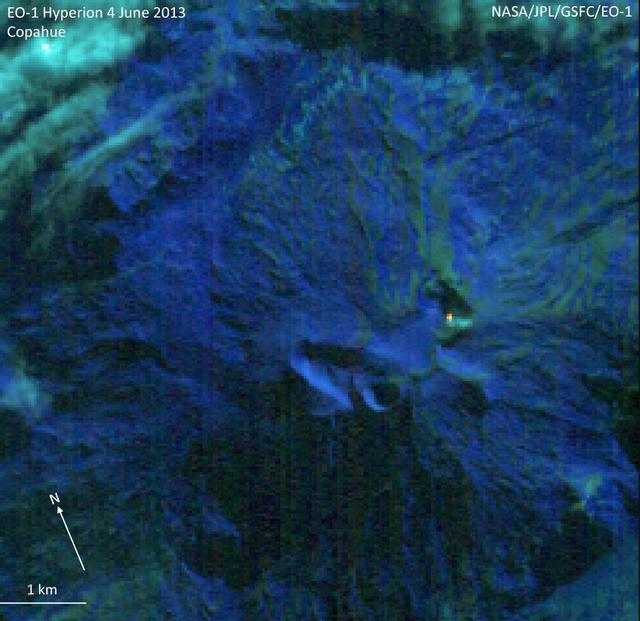
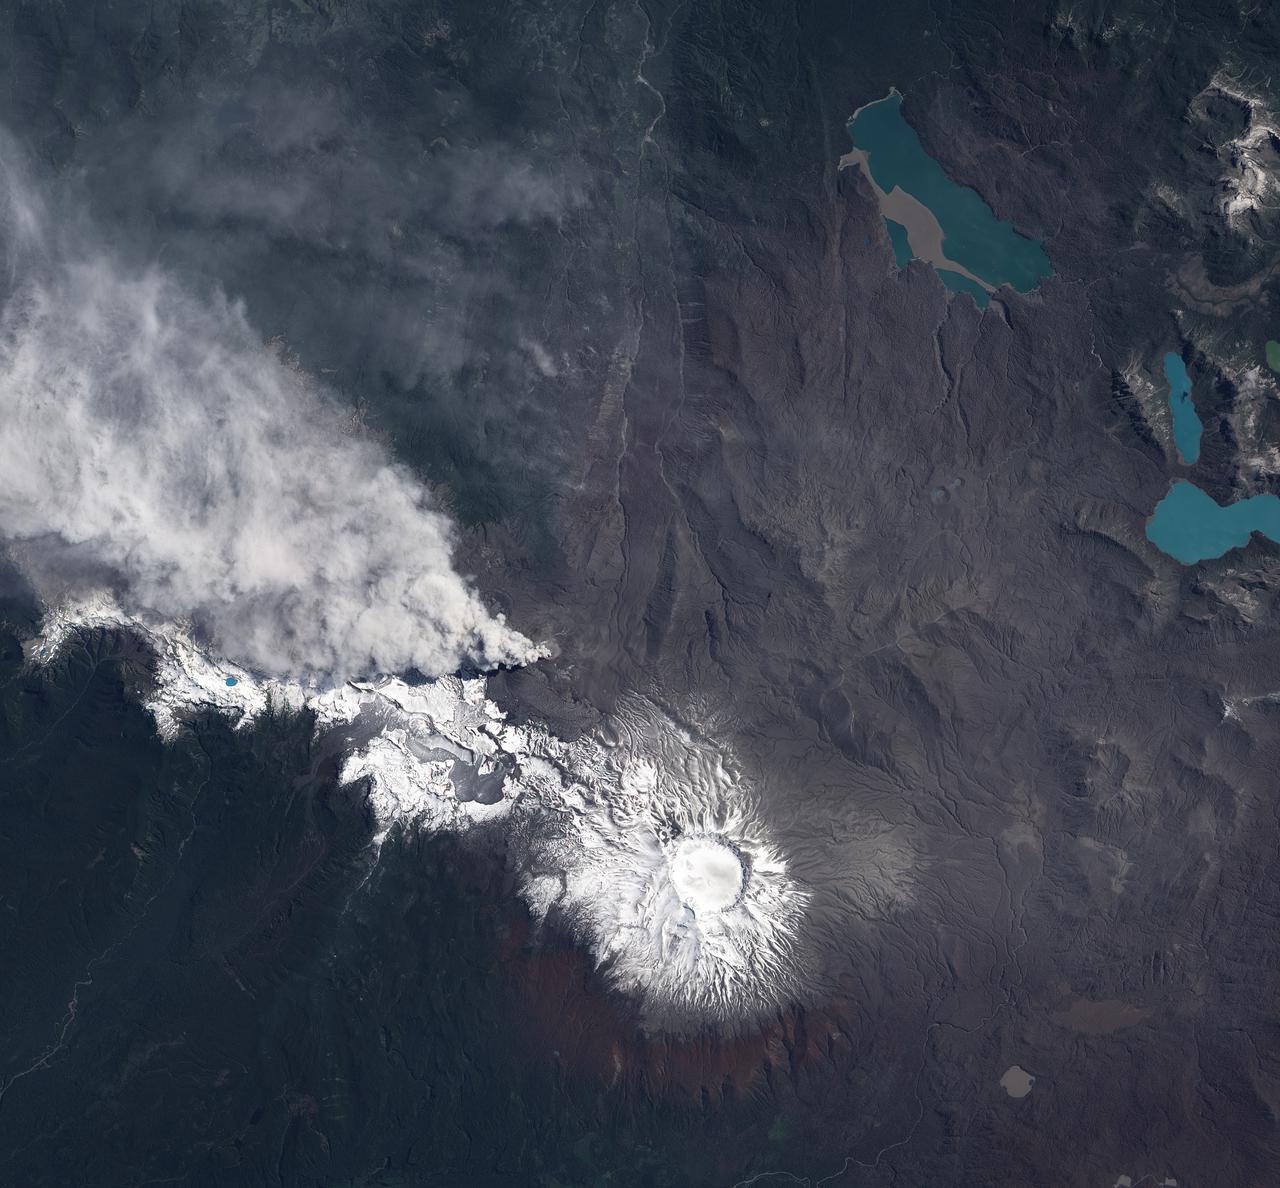
NASA Earth Observing-1 EO-1 spacecraft observed Copahue volcano, a 2965 meter high volcano on the Chile-Argentina border, on Jun. 4, 2013. Having recently displayed signs of unrest, the volcano is under close scrutiny by local volcanologists.
The Advanced Land Imager onboard NASA Earth Observing-1 EO-1 spacecraft obtained this false-color infrared image of Iceland Eyjafjallajökull volcano on April 17, 2010. A strong thermal source is visible at the base of the Eyjafjallajökull plume.
On June 14, 2011, NASA Earth Observing-1 EO-1 spacecraft obtained this image showing ash-rich volcanic plume billowing out of the vent, punching through a low cloud layer. The plume grey color is a reflection of its ash content.
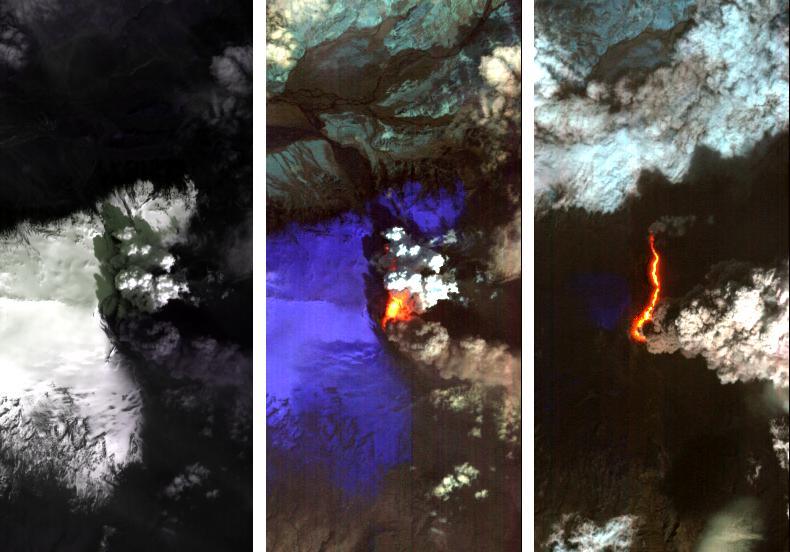
Dramatic changes have been observed at the Eyjafjallajökull volcano in Iceland by NASA's Earth Observing 1 (EO-1) spacecraft. On May 2, 2010, the Hyperion hyperspectral imager on EO-1 imaged Eyjafjallajökull and identified the extent of a lava flow extending northwards from the main eruption vent. This lava flow had been previously reported by volcanologists in Iceland, and is slowly carving its way north through the ice cap. The image on the left (Figure 1) is at visible wavelengths, and shows the persistent dark volcanic plume emanating from the main vent. This plume is still rich in ash, hence its brown coloration. This ash is still causing problems, threatening new airspace closures over parts of Europe. Large cracks at the edge of the crater are an indication of the extent of ice removal from the icecap during the eruption. To the north of this vent is another plume that is very white. This second plume is the result of ice being boiled off, generally non-explosively, by the heat from the silicate lava flow. As a result this plume is probably comprised mostly of water vapour. The black lava shows up clearly against the ice in the left-hand image. The image in the center (Figure 2) is a false-color image in the short-wavelength infrared. In this image, ice appears as blue and hot pixels appear as red. Very hot pixels appear as yellow and white. Red pixels, visible though the plume chart the extent of the lava flow, which has extended some 1.8 kilometers (1.1 miles) northwards from the area of the vent that is emitting the most energy. Total heat loss on May 2 was estimated to be at least 300 megawatts. The image on the right (Figure 3) shows the lava flow on May 4, 2010. The entire lava channel is now exposed, most of the overlying ice having been removed and the white plume has mostly disappeared. Without the plume obscuring heat loss from the lava flow, a better estimate of heat loss can be made. On May 4, the volcano was emitting at least 1,600 megawatts of energy. Each image covers an area measuring 7.7 kilometers (4.8 miles) wide, and has a resolution of 30 meters (98 feet) per pixel. The vertical direction is north-northeast. http://photojournal.jpl.nasa.gov/catalog/PIA13098
Momotombo volcano, Nicaragua, began erupting on Dec. 1, 2015, after more than a century of inactivity. On Dec. 4, 2015, the Advanced Land Imager (ALI) on NASA's Earth Observing 1 (EO-1) spacecraft observed the new eruption. This image is created from infrared data, and shows the incandescent active vent at the summit of the volcano and lava flowing down the side of the volcano. These data are being examined by scientists to determine where lava will flow, allowing assessment of possible threats to local infrastructure. The EO-1 data were obtained at an altitude of 438 miles (705 kilometers) and at a resolution of 98 feet (30 meters) per pixel at different visible and infrared wavelengths. The ALI image is 23 miles (37 kilometers) wide. http://photojournal.jpl.nasa.gov/catalog/PIA20203
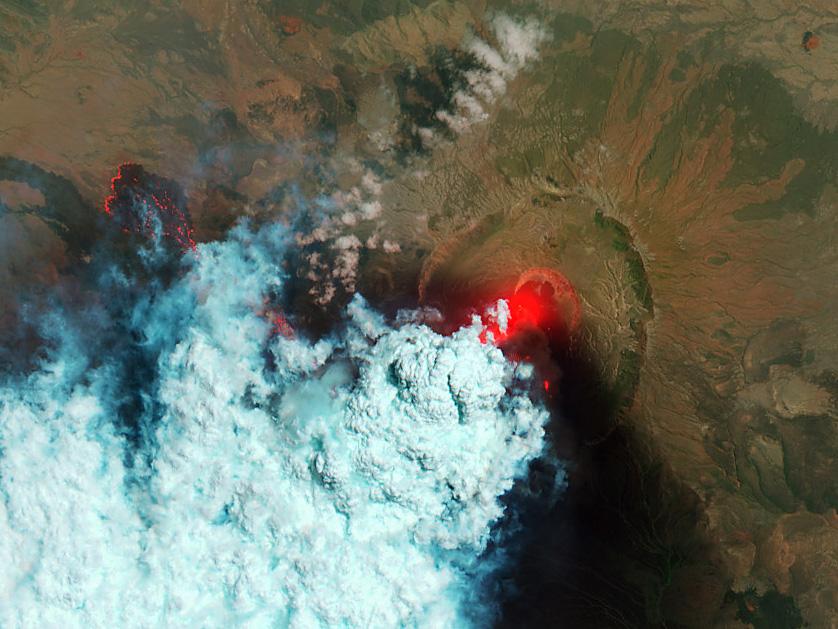
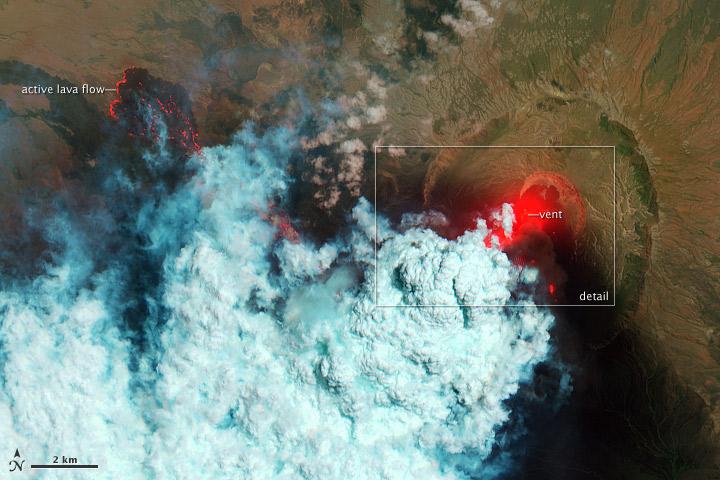
On Jan. 24, 2017, the Hyperion Imager on NASA's Earth Observing 1 (EO-1) spacecraft observed a new eruption at Erta'Ale volcano, Ethiopia, from an altitude of 438 miles (705 kilometers). Data were collected at a resolution of 98 feet (30 meters) per pixel at different visible and infrared wavelengths and were combined to create these images. A visible-wavelength image is on the left. An infrared image is shown on the right. The infrared image emphasizes the hottest areas and reveals a spectacular rift eruption, where a crack opens and lava gushes forth, fountaining into the air. The lava flows spread away from the crack. Erta'Ale is the location of a long-lived lava lake, and it remains to be seen if this survives this new eruption. The observation was scheduled via the Volcano Sensor Web, a network of sensors linked by artificial intelligence software to create an autonomous global monitoring program of satellite observations of volcanoes. The Volcano Sensor Web was alerted to this new activity by data from another spacecraft. http://photojournal.jpl.nasa.gov/catalog/PIA11239
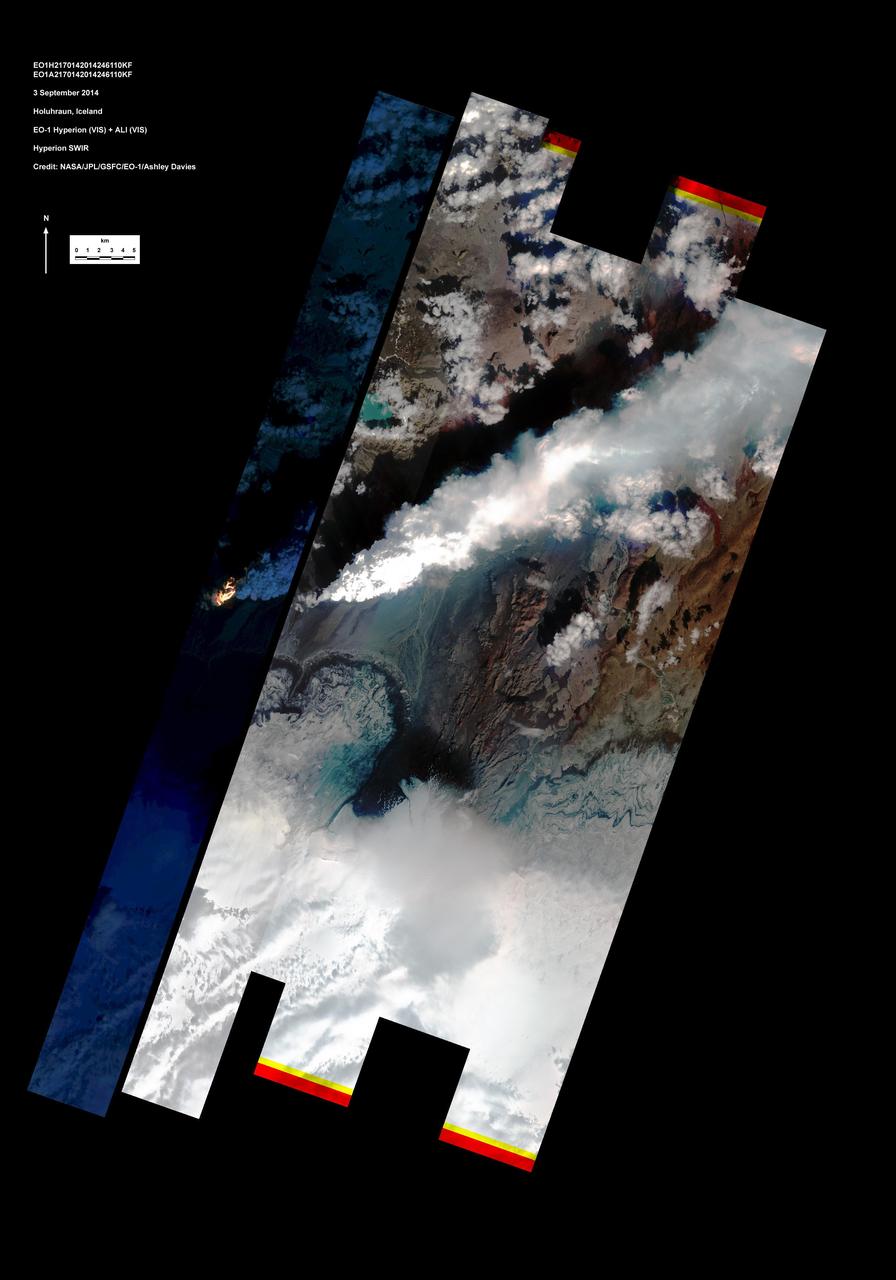
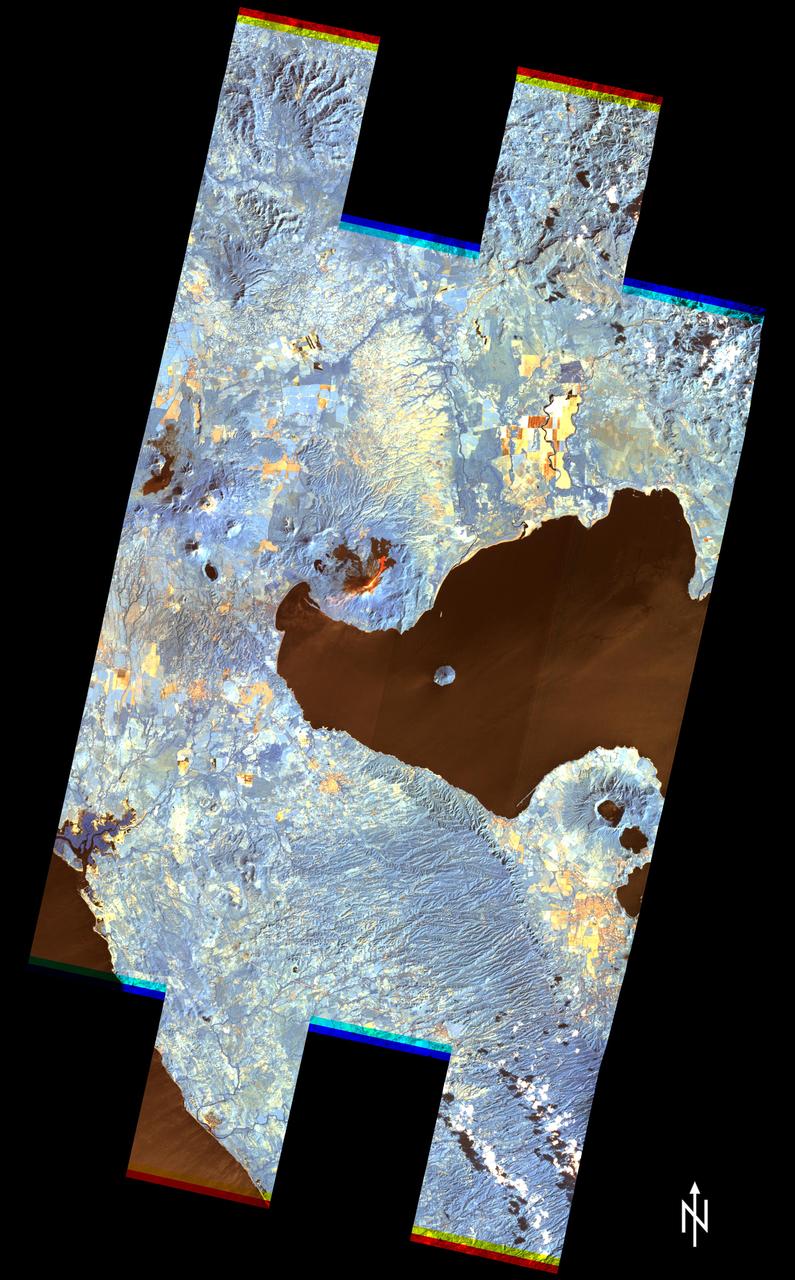
This image shows Iceland volcanic eruption monitored by NASA EO-1 spacecraft. To the south is the edge of Dyngjujökull and to the north is the volcano called Askja.
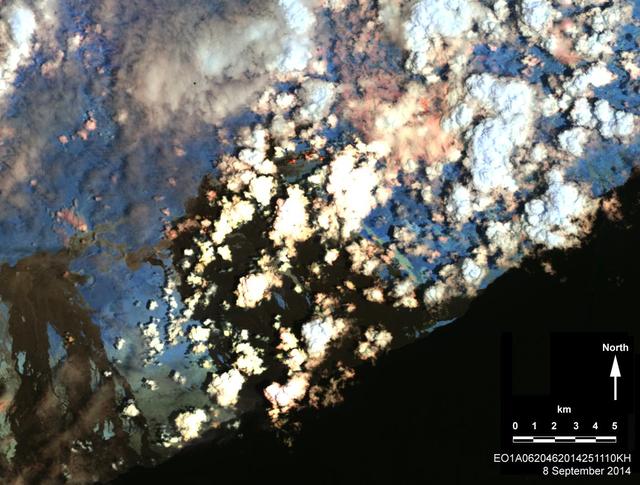
On Sept. 8, 2014, NASA Earth Observing 1 spacecraft obtained this infrared image of Kilauea volcano, Hawaii, which has been in continuous eruption since 1983. New lava flows can be seen.

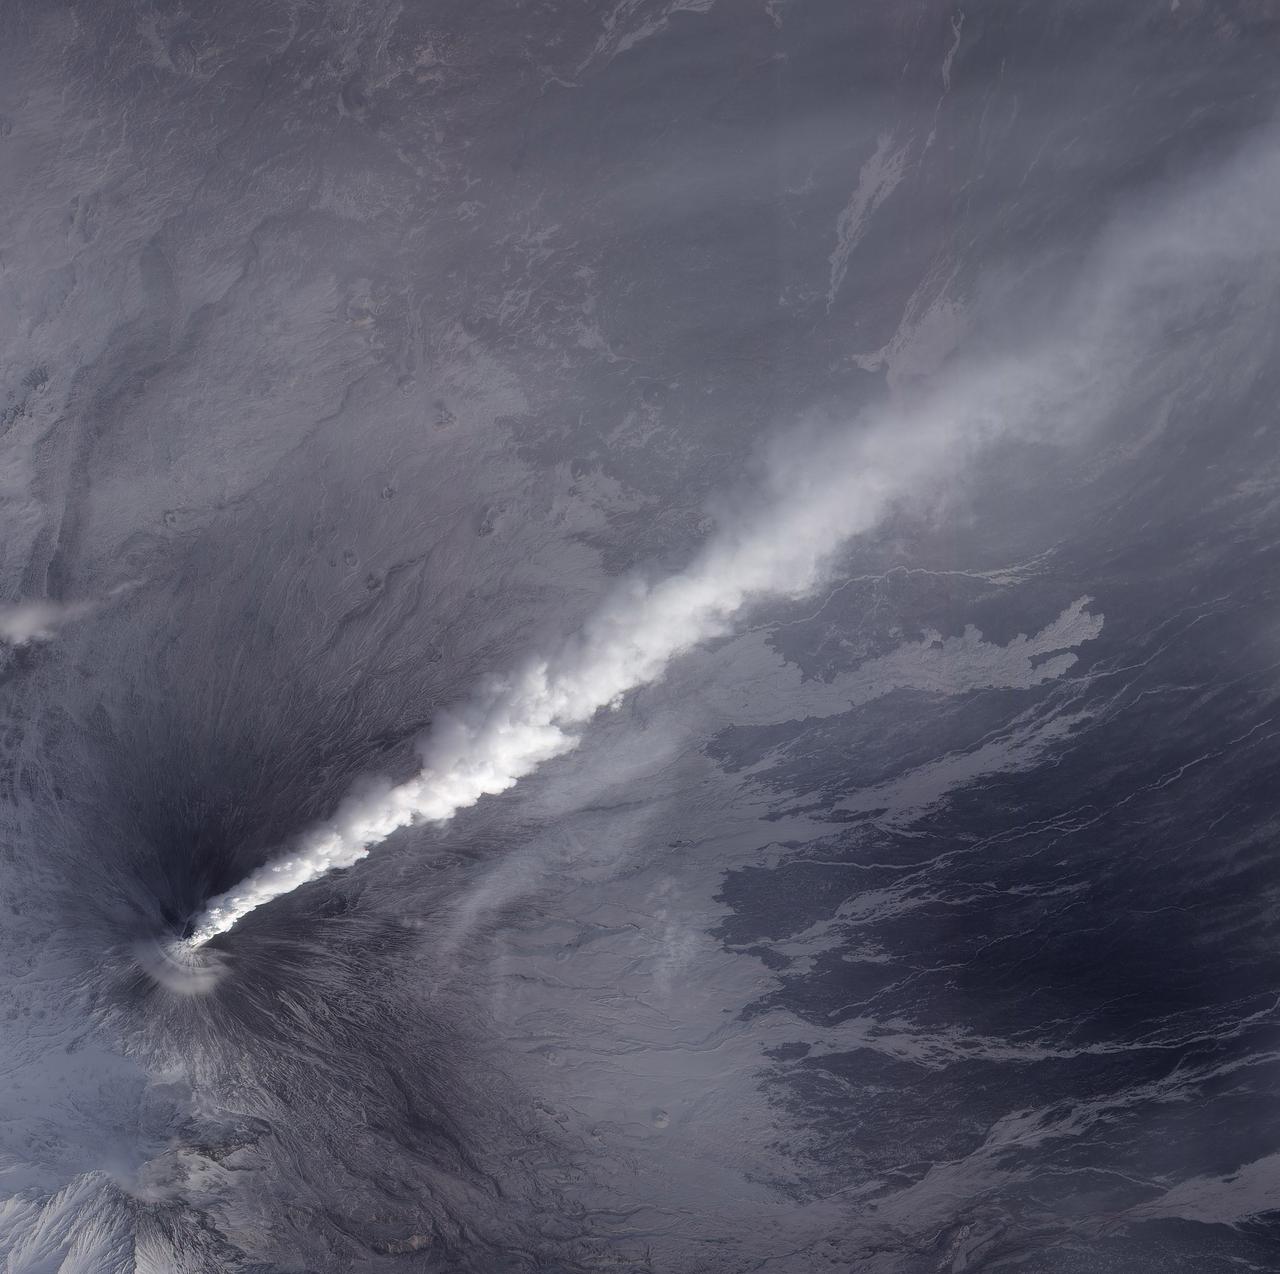
NASA image acquired Sept 7, 2010 Shiveluch (also spelled Sheveluch) is one of the largest and most active volcanoes on Russia’s Kamchatka Peninsula. It has been spewing ash and steam intermittently—with occasional dome collapses, pyroclastic flows, and lava flows, as well—for the past decade. Shiveluch is a stratovolcano, a steep-sloped formation of alternating layers of hardened lava, ash, and rocks thrown out by earlier eruptions. A lava dome has been growing southwest of the 3,283-meter (10,771-foot) summit. The Advanced Land Imager (ALI) on NASA’s Earth Observing-1 (EO-1) satellite acquired this image on September 7, 2010. Brown and tan debris—perhaps ash falls, perhaps mud from lahars—covers the southern landscape of the volcano, while the hills on the northern side remain covered in snow and ice. The Kamchatkan Volcanic Eruption Response Team (KVERT) reported that seismic activity at Shiveluch was "above background levels" from September 3-10. Ash plumes rose to an altitude of 6.5 kilometers (21,300 feet) on September 3-4, and gas-and-ash plumes were reported on September 7, when this image was acquired. According to the Smithsonian Institution's volcano program, at least 60 large eruptions of Shiveluch have occurred during the current Holocene Epoch of geological history. Intermittent explosive eruptions began in the 1990s, and the largest historical eruptions from Shiveluch occurred in 1854 and 1964. NASA Earth Observatory image created by Jesse Allen and Robert Simmon, using EO-1 ALI data provided courtesy of the NASA EO-1 team. Caption by Mike Carlowicz. Instrument: EO-1 - ALI Credit: NASA Earth Observatory NASA Goddard Space Flight Center contributes to NASA’s mission through four scientific endeavors: Earth Science, Heliophysics, Solar System Exploration, and Astrophysics. Goddard plays a leading role in NASA’s endeavors by providing compelling scientific knowledge to advance the Agency’s mission. Follow us on Twitter Join us on Facebook
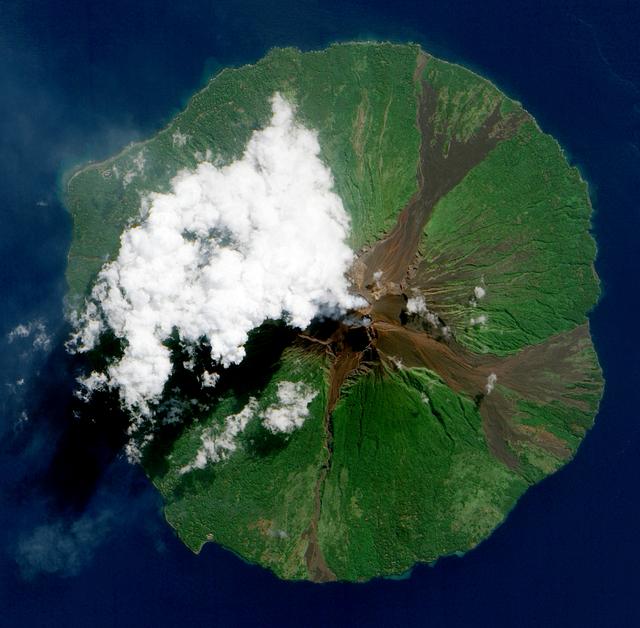
NASA image acquired June 16, 2010. Papua New Guinea’s Manam Volcano released a thin, faint plume on June 16, 2010, as clouds clustered at the volcano’s summit. The Advanced Land Imager (ALI) on NASA’s Earth Observing-1 (EO-1) satellite took this picture the same day. Rivulets of brown rock interrupt the carpet of green vegetation on the volcano’s slopes. Opaque white clouds partially obscure the satellite’s view of Manam. The clouds may result from water vapor from the volcano, but may also have formed independent of volcanic activity. The volcanic plume appears as a thin, blue-gray veil extending toward the northwest over the Bismarck Sea. Located 13 kilometers (8 miles) off the coast of mainland Papua New Guinea, Manam forms an island 10 kilometers (6 miles) wide. It is a stratovolcano. The volcano has two summit craters, and although both are active, most historical eruptions have arisen from the southern crater. NASA Earth Observatory image created by Jesse Allen, using EO-1 ALI data provided courtesy of the NASA EO-1 team. Caption by Michon Scott. Instrument: EO-1 - ALI To view the full image go to: <a href="http://earthobservatory.nasa.gov/NaturalHazards/view.php?id=44307&src=nhrss" rel="nofollow">earthobservatory.nasa.gov/NaturalHazards/view.php?id=4430...</a> <b><a href="http://www.nasa.gov/centers/goddard/home/index.html" rel="nofollow">NASA Goddard Space Flight Center</a></b> is home to the nation's largest organization of combined scientists, engineers and technologists that build spacecraft, instruments and new technology to study the Earth, the sun, our solar system, and the universe.
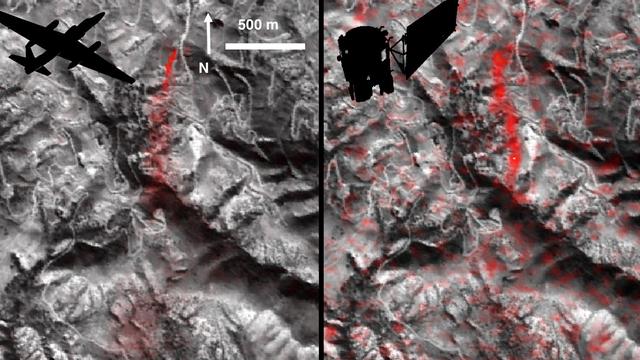
Atmospheric methane is a potent greenhouse gas, but the percentage of it produced through human activities is still poorly understood. Future instruments on orbiting satellites can help address this issue by surveying human-produced methane emissions. Recent data from the Aliso Canyon event, a large accidental methane release near Porter Ranch, California, demonstrates this capability. The Hyperion imaging spectrometer onboard NASA's EO-1 satellite successfully detected this release event on three different overpasses during the winter of 2015-2016. This is the first time the methane plume from a single facility has been observed from space. The orbital observations were consistent with airborne measurements. This image pair shows a comparison of detected methane plumes over Aliso Canyon, California, acquired 11 days apart in Jan. 2016 by: (left) NASA's AVIRIS instrument on a NASA ER-2 aircraft at 4.1 miles (6.6 kilometers) altitude and (right) by the Hyperion instrument on NASA's Earth Observing-1 satellite in low-Earth orbit. The additional red streaks visible in the EO-1 Hyperion image result from measurement noise -- Hyperion was not specifically designed for methane sensing and is not as sensitive as AVIRIS-NG. Additionally, the EO-1 satellite's current orbit provided poor illumination conditions. Future instruments with much greater sensitivity on orbiting satellites can survey the biggest sources of human-produced methane around the world. http://photojournal.jpl.nasa.gov/catalog/PIA20716
NASA image acquired December 4, 2010 After a respite of less than a month, Klyuchevskaya Volcano resumed erupting in late November 2010. The Global Volcanism Program reported several ash plumes that rose up to 7.9 kilometers (26,000 feet) above sea level from November 25–29. According to the Kamchatka Volcanic Eruption Response Team (KVERT) seismicity was “slightly above background levels” on November 26th and 27th, and they reported observations of strombolian activity on December 1st and 2nd. A plume of ash, steam, and other volcanic gases streamed from Klyuchevskaya on December 4, 2010, visible in this natural-color image acquired by the Advanced Land Imager (ALI) aboard the Earth Observing-1 (EO-1) satellite. In the large image, a much smaller plume is visible above neighboring Bezymianny Volcano. NASA Earth Observatory image by Jesse Allen & Robert Simmon, using ALI data from the NASA EO-1 team. Caption by Robert Simmon. Instrument: EO-1 - ALI Credit: <b><a href="http://www.earthobservatory.nasa.gov/" rel="nofollow"> NASA Earth Observatory</a></b> <b><a href="http://www.nasa.gov/centers/goddard/home/index.html" rel="nofollow">NASA Goddard Space Flight Center</a></b> enables NASA’s mission through four scientific endeavors: Earth Science, Heliophysics, Solar System Exploration, and Astrophysics. Goddard plays a leading role in NASA’s accomplishments by contributing compelling scientific knowledge to advance the Agency’s mission. <b>Follow us on <a href="http://twitter.com/NASA_GoddardPix" rel="nofollow">Twitter</a></b> <b>Join us on <a href="http://www.facebook.com/pages/Greenbelt-MD/NASA-Goddard/395013845897?ref=tsd" rel="nofollow">Facebook</a></b>
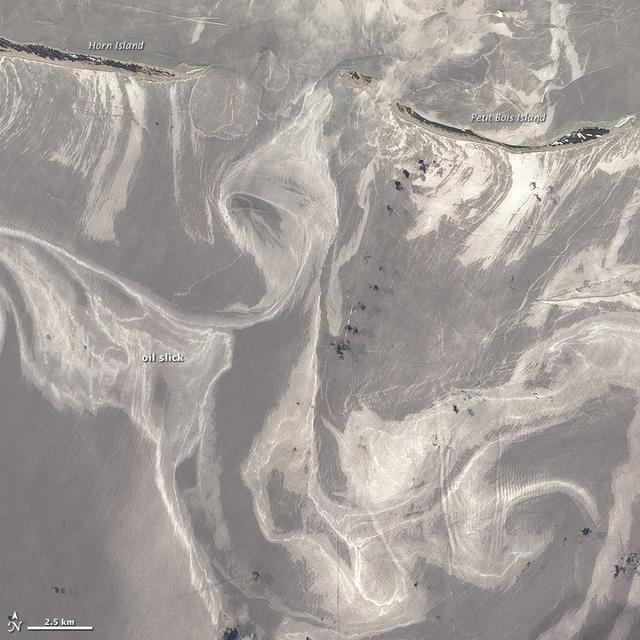
NASA image acquired June 26, 2010 As of June 27, 2010, the entire gulf-facing beachfront of several barrier islands in eastern Mississippi (offshore of Pascagoula) had received a designation of at least “lightly oiled” by the interagency Shoreline Cleanup Assessment Team that is responding to the disaster in the Gulf of Mexico. A few small stretches of Petit Bois Island had been labeled heavily or moderately oiled. (To view this image without a description go to: This high-resolution image shows Petit Bois Island (top right) and the eastern end of Horn Island (top left) on June 26. In general, oil-covered waters are silvery and cleaner waters are blue-gray. This pattern is especially consistent farther from the islands. The intensely bright patches of water directly offshore of the barrier islands, however, may be from a combination of factors, including sediment and organic material, coastal currents and surf, and oil. The islands provide a sense of scale for the ribbons of oil swirling into the area from the south. Petit Bois Island is about 10 kilometers (6 miles) long. It is one of seven barrier islands that, along with some mainland areas of Mississippi and Florida, make up the Gulf Islands National Seashore. According to the National Park Service Gulf Islands National Seashore Website, all the islands remained open to the public as of June 28, 2010, and clean-up crews were on hand to respond to any oil coming ashore. The large version of this image, which was captured by the Advanced Land Imager on NASA’s Earth Observing-1 (EO-1) satellite, shows a larger area, including the Mississippi Sound and parts of mainland Mississippi. Although oil has been observed in the Sound, it is unlikely that all the bright patches of water in that area are thickly oil-covered. Differences in brightness in coastal area waters may be due to other factors, including freshwater runoff, strong currents, and water depth and clarity. NASA Earth Observatory image created by Jesse Allen and Robert Simmon, using EO-1 ALI data provided courtesy of the NASA EO-1 team. Caption by Rebecca Lindsey. Instrument: EO-1 - ALI To see more images go to: <a href="http://earthobservatory.nasa.gov/" rel="nofollow">earthobservatory.nasa.gov/</a> <b><a href="http://www.nasa.gov/centers/goddard/home/index.html" rel="nofollow">NASA Goddard Space Flight Center</a></b> is home to the nation's largest organization of combined scientists, engineers and technologists that build spacecraft, instruments and new technology to study the Earth, the sun, our solar system, and the universe.
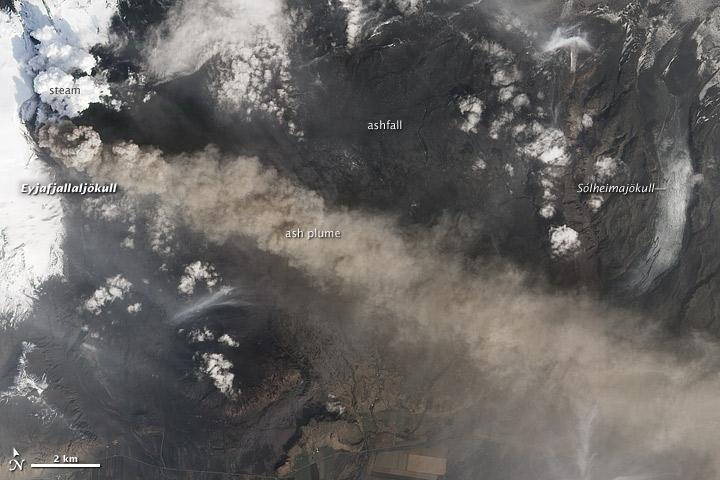
NASA satellite image acquired May 2, 2010 To see the full view of this image go to: <a href="http://www.flickr.com/photos/gsfc/4584266582/">www.flickr.com/photos/gsfc/4584266582/</a> Ash and steam continued billowing from Eyjafjallajökull Volcano in early May 2010. The Advanced Land Imager (ALI) on NASA’s Earth Observing-1 (EO-1) satellite captured this natural-color image on May 2, 2010. The volcano’s summit is near the left edge of this image, capped by a dark plume. The plume is dull gray-brown, indicating that its principal visible component is volcanic ash. Ash from the plume blows toward the east-southeast, passing over a charcoal-colored ash field on the land surface. Just to the north of Eyjafjallajökull’s summit are white puffs of steam, likely from surface lava flows vaporizing snow and glacial ice. On May 4, 2010, the Icelandic Meteorological Office warned that Eyjafjallajökull showed no signs of ending its eruptive activity in the near future. The Met Office reported that ash from the volcano had reached a height of 5.8 to 6.0 kilometers (19,000 to 20,000 feet) above sea level, and had spread 65 to 80 kilometers (40 to 50 miles) east-southeast of the volcano, where it impeded visibility for local residents. The Met Office also reported that lava continued flowing down a steep hill north of the crater. NASA image by Robert Simmon, using ALI data from the EO-1 team. Caption by Michon Scott. Instrument: EO-1 – ALI To view other images from the Earth Observatory go to: <a href="http://earthobservatory.nasa.gov/" rel="nofollow">earthobservatory.nasa.gov/</a> <b><a href="http://www.nasa.gov/centers/goddard/home/index.html" rel="nofollow">NASA Goddard Space Flight Center</a></b> is home to the nation's largest organization of combined scientists, engineers and technologists that build spacecraft, instruments and new technology to study the Earth, the sun, our solar system, and the universe.
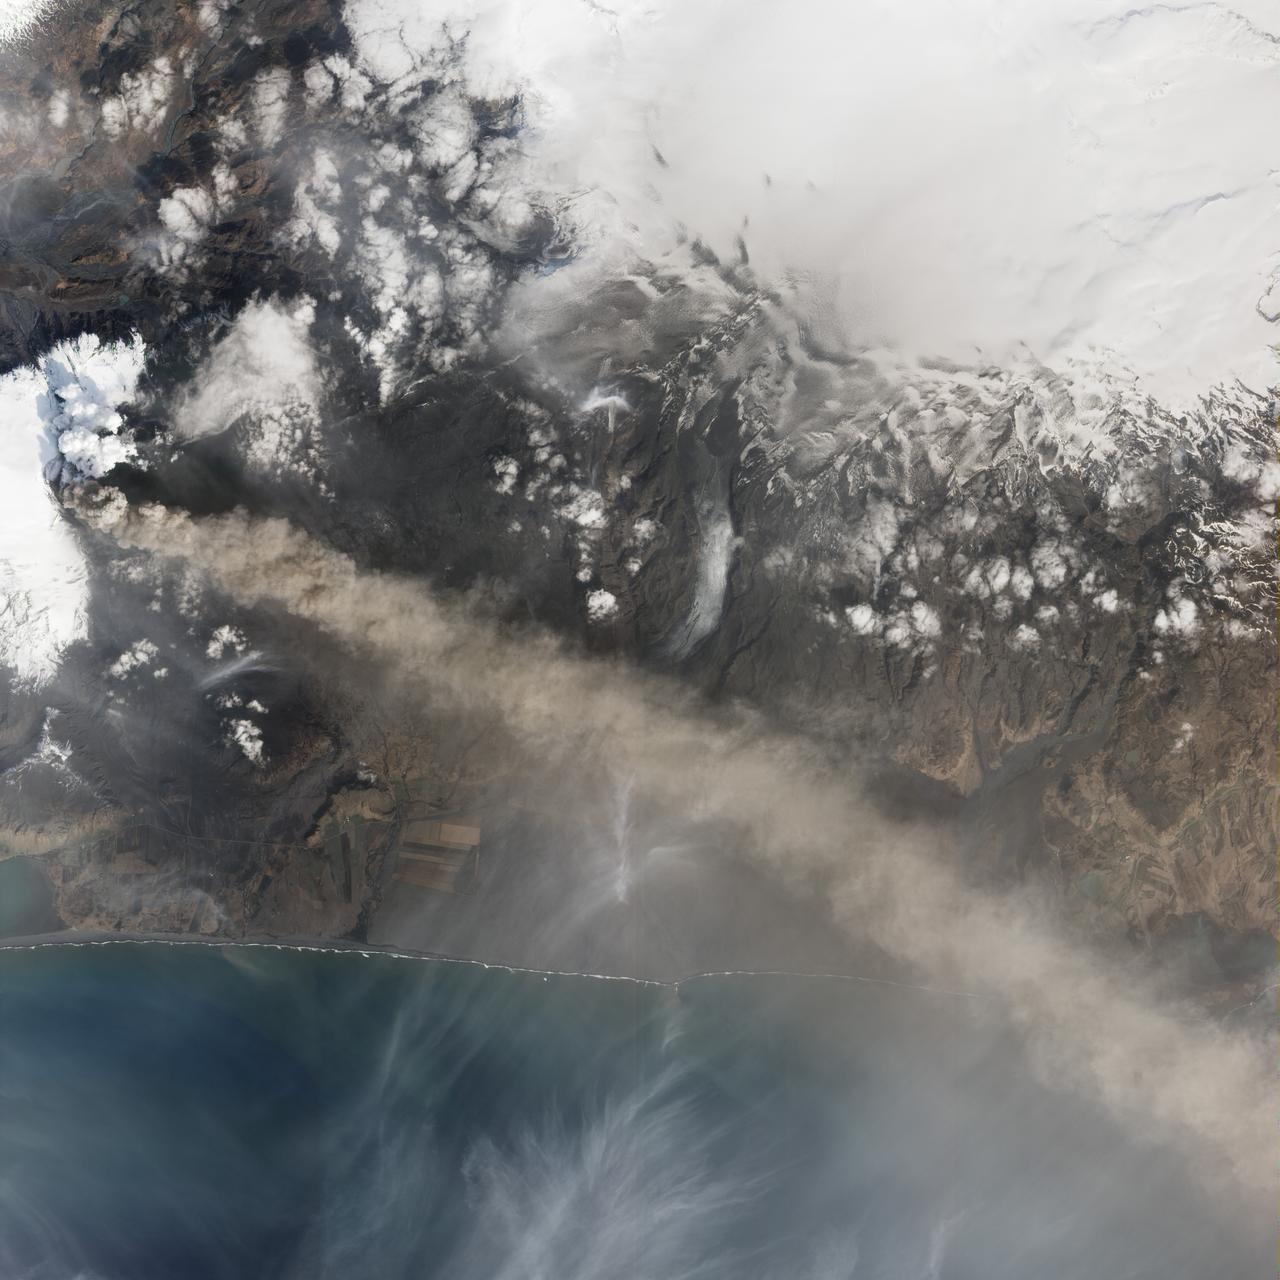
NASA satellite image acquired May 2, 2010 To view a detail of this image go to: <a href="http://www.flickr.com/photos/gsfc/4584266734/">www.flickr.com/photos/gsfc/4584266734/</a> Ash and steam continued billowing from Eyjafjallajökull Volcano in early May 2010. The Advanced Land Imager (ALI) on NASA’s Earth Observing-1 (EO-1) satellite captured this natural-color image on May 2, 2010. The volcano’s summit is near the left edge of this image, capped by a dark plume. The plume is dull gray-brown, indicating that its principal visible component is volcanic ash. Ash from the plume blows toward the east-southeast, passing over a charcoal-colored ash field on the land surface. Just to the north of Eyjafjallajökull’s summit are white puffs of steam, likely from surface lava flows vaporizing snow and glacial ice. On May 4, 2010, the Icelandic Meteorological Office warned that Eyjafjallajökull showed no signs of ending its eruptive activity in the near future. The Met Office reported that ash from the volcano had reached a height of 5.8 to 6.0 kilometers (19,000 to 20,000 feet) above sea level, and had spread 65 to 80 kilometers (40 to 50 miles) east-southeast of the volcano, where it impeded visibility for local residents. The Met Office also reported that lava continued flowing down a steep hill north of the crater. NASA image by Robert Simmon, using ALI data from the EO-1 team. Caption by Michon Scott. Instrument: EO-1 – ALI To view other images from the Earth Observatory go to: <a href="http://earthobservatory.nasa.gov/" rel="nofollow">earthobservatory.nasa.gov/</a> <b><a href="http://www.nasa.gov/centers/goddard/home/index.html" rel="nofollow">NASA Goddard Space Flight Center</a></b> is home to the nation's largest organization of combined scientists, engineers and technologists that build spacecraft, instruments and new technology to study the Earth, the sun, our solar system, and the universe.
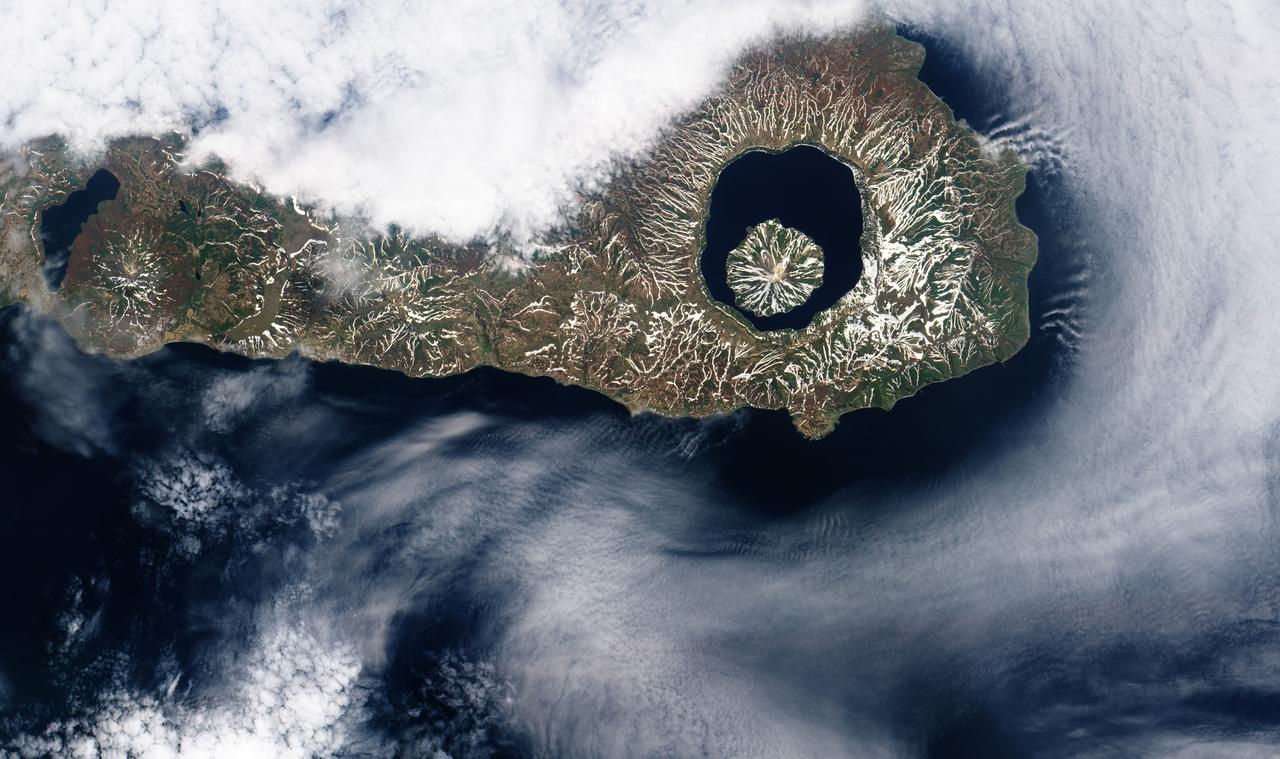
More than 9,000 years ago, a catastrophic volcanic eruption created a huge caldera on the southern end of Onekotan Island, one of the Kuril Islands, located off the southern tip of Russia’s Kamchatka Peninsula. Today, the ancient Tao-Rusyr Caldera is filled by the deep blue waters of Kal’tsevoe Lake. The Advanced Land Imager (ALI) on NASA’s Earth Observing-1 (EO-1) satellite acquired this true-color image of southern Onekotan on June 10, 2009. In this late-spring shot, snow or ice lingers on the land, forming white streaks on a brown-and-green land surface. In the northwest quadrant of the caldera is Krenitzyn Peak, which rises to a height of 1,325 meters (4,347 feet). Like the other Kuril Islands, Onekotan lies along the Pacific “Ring of Fire.” The Kuril Island volcanoes are fueled by magma generated by the subduction of the Pacific Plate under the Eurasian Plate, which takes place along a deep trench about 200 kilometers (120 miles) to the islands’ east. The only historical eruption at Krenitzyn Peak occurred in 1952, a week after a magnitude 9.0 earthquake along the subduction fault. NASA Earth Observatory image created by Robert Simmon, using EO-1 ALI data provided courtesy of the NASA EO-1 team. Caption by Michon Scott and Rebecca Lindsey. <b><a href="http://www.nasa.gov/audience/formedia/features/MP_Photo_Guidelines.html" rel="nofollow">NASA image use policy.</a></b> <b><a href="http://www.nasa.gov/centers/goddard/home/index.html" rel="nofollow">NASA Goddard Space Flight Center</a></b> enables NASA’s mission through four scientific endeavors: Earth Science, Heliophysics, Solar System Exploration, and Astrophysics. Goddard plays a leading role in NASA’s accomplishments by contributing compelling scientific knowledge to advance the Agency’s mission. <b>Follow us on <a href="http://twitter.com/NASAGoddardPix" rel="nofollow">Twitter</a></b> <b>Like us on <a href="http://www.facebook.com/pages/Greenbelt-MD/NASA-Goddard/395013845897?ref=tsd" rel="nofollow">Facebook</a></b> <b>Find us on <a href="http://instagrid.me/nasagoddard/?vm=grid" rel="nofollow">Instagram</a></b>

NASA image acquired July 17, 2011 In mid-July 2011, more than a month after the Missouri River broke through two levees and flooded fields near Hamburg, Iowa, muddy water lingered near the city. Hamburg residents were relieved, however, that a newly built levee had spared the town from flooding. On July 17, 2011, the Advanced Land Imager (ALI) on NASA’s Earth Observing-1 (EO-1) satellite captured this natural-color image. Compared to an image acquired on June 24, flooding has apparently receded slightly in some areas. Sediment-choked water nevertheless lingers on large swaths of land. On July 13, 2011, KETV of Omaha, Nebraska, reported that a newly built, 2-mile levee designed to protect Hamburg already exceeded federal standards. The U.S. Army Corps of Engineers handed control of the levee over to city officials on July 12. In the end, the levee was expected to cost the Army Corps $6 million, and the city of Hamburg about $800,000. On July 18, 2011, the Advanced Hydrological Prediction Service reported moderate flooding along the Missouri River not far from Hamburg, Iowa. In the northwest, the river reached 24.37 feet (7.43 meters) at Nebraska City. In the southeast, the river reached 38.98 feet (11.88 meters) at Brownville, Nebraska. NASA Earth Observatory image created by Jesse Allen and Robert Simmon, using EO-1 ALI data provided courtesy of the NASA EO-1 team. Caption by Michon Scott. Instrument: EO-1 - ALI Credit: <b><a href="http://www.earthobservatory.nasa.gov/" rel="nofollow"> NASA Earth Observatory</a></b> <b><a href="http://www.nasa.gov/centers/goddard/home/index.html" rel="nofollow">NASA Goddard Space Flight Center</a></b> enables NASA’s mission through four scientific endeavors: Earth Science, Heliophysics, Solar System Exploration, and Astrophysics. Goddard plays a leading role in NASA’s accomplishments by contributing compelling scientific knowledge to advance the Agency’s mission. <b>Follow us on <a href="http://twitter.com/NASA_GoddardPix" rel="nofollow">Twitter</a></b> <b>Like us on <a href="http://www.facebook.com/pages/Greenbelt-MD/NASA-Goddard/395013845897?ref=tsd" rel="nofollow">Facebook</a></b> <b>Find us on <a href="http://web.stagram.com/n/nasagoddard/?vm=grid" rel="nofollow">Instagram</a></b>
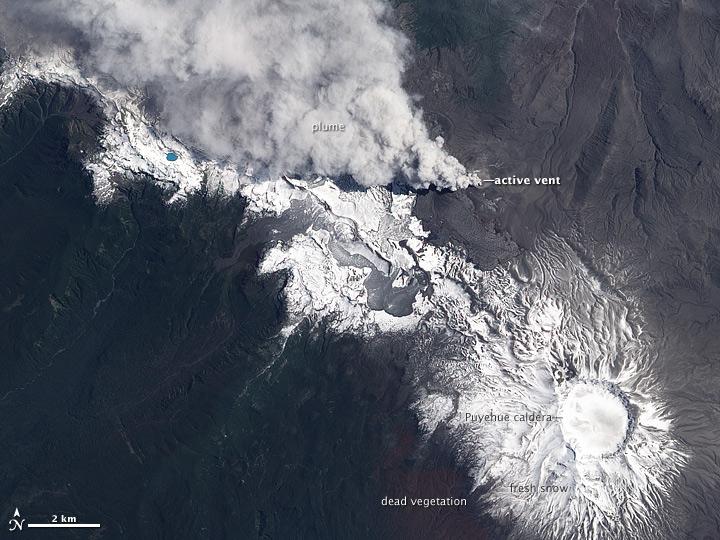
NASA image acquired December 23, 2011 In early June 2011, Chile’s Puyehue-Cordón Caulle Volcano erupted explosively, sending volcanic ash around the Southern Hemisphere. In late December 2011, activity at the volcano had calmed, but volcanic ash and steam continued to pour through the fissure that opened several months earlier. The Advanced Land Imager (ALI) on NASA’s Earth Observing-1 (EO-1) satellite captured this natural-color image on December 23, 2011. The active fissure lies northwest of the Puyehue caldera, and a plume blows from the fissure toward the west and north. This image shows not just ash but also snow on the volcano surface, including the caldera. Because volcanic ash regularly coats the land surface, the pristine snow probably fell recently. In a bulletin issued December 26, 2011, Chile’s Servicio Nacional de Geología y Minería (SERNAGEOMIN) characterized the activity over the previous 24 hours as a minor eruption of low intensity. Reaching an altitude of 2,236 meters (7,336 feet), Puyehue-Cordón Caulle is a stratovolcano, a steep-sloped, conical volcano composed of layers of ash, lava, and rocks released by previous eruptions. This volcano comprises part of the largest active geothermal area in the southern Andes. NASA Earth Observatory image created by Jesse Allen, using EO-1 ALI data provided courtesy of the NASA EO-1 team. Caption by Michon Scott. Instrument: EO-1 - ALI To view more images from this event go here: <a href="http://earthobservatory.nasa.gov/NaturalHazards/event.php?id=50859" rel="nofollow">earthobservatory.nasa.gov/NaturalHazards/event.php?id=50859</a> Credit: <b><a href="http://www.earthobservatory.nasa.gov/" rel="nofollow"> NASA Earth Observatory</a></b> <b><a href="http://www.nasa.gov/audience/formedia/features/MP_Photo_Guidelines.html" rel="nofollow">NASA image use policy.</a></b> <b><a href="http://www.nasa.gov/centers/goddard/home/index.html" rel="nofollow">NASA Goddard Space Flight Center</a></b> enables NASA’s mission through four scientific endeavors: Earth Science, Heliophysics, Solar System Exploration, and Astrophysics. Goddard plays a leading role in NASA’s accomplishments by contributing compelling scientific knowledge to advance the Agency’s mission. <b>Follow us on <a href="http://twitter.com/NASA_GoddardPix" rel="nofollow">Twitter</a></b> <b>Like us on <a href="http://www.facebook.com/pages/Greenbelt-MD/NASA-Goddard/395013845897?ref=tsd" rel="nofollow">Facebook</a></b> <b>Find us on <a href="http://instagrid.me/nasagoddard/?vm=grid" rel="nofollow">Instagram</a></b>

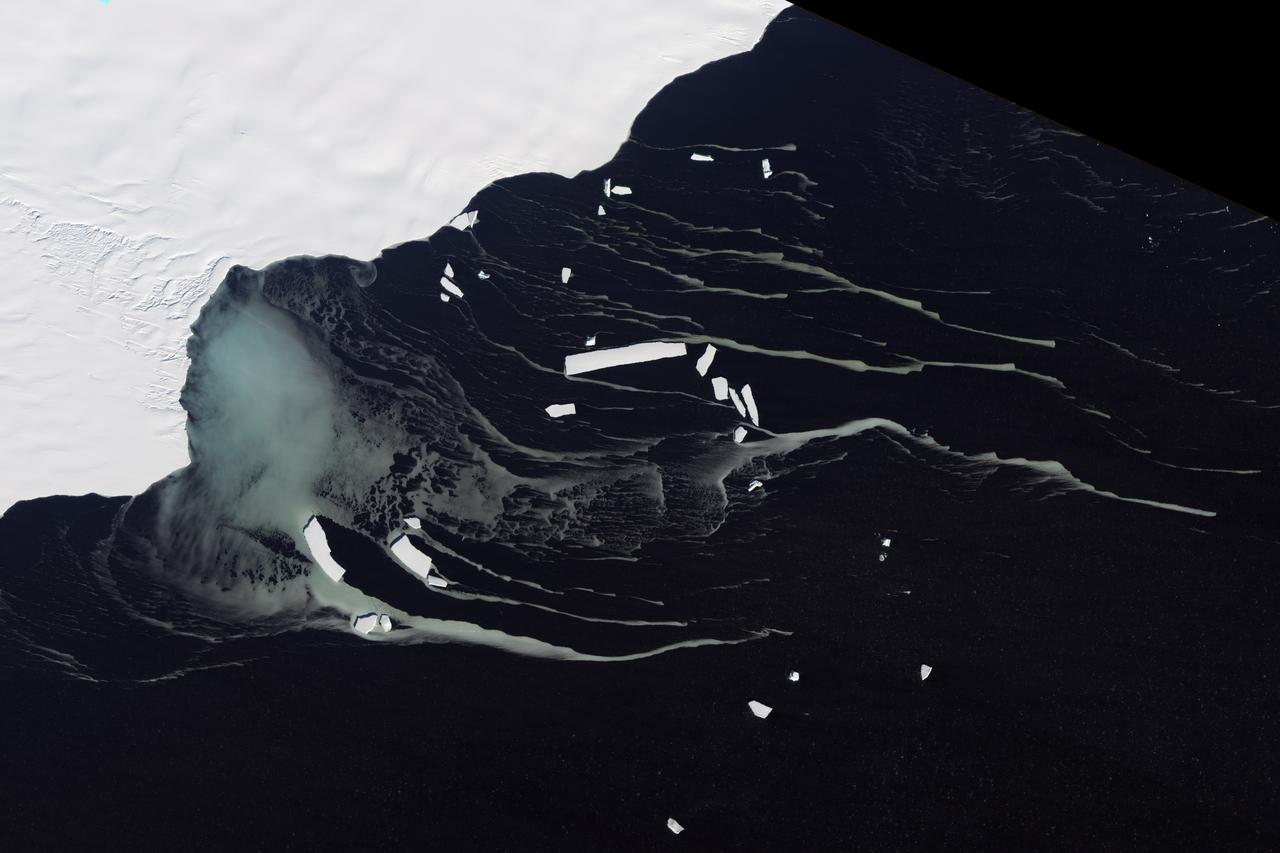
NASA image acquired September 6, 2010 The Matusevich Glacier flows toward the coast of East Antarctica, pushing through a channel between the Lazarev Mountains and the northwestern tip of the Wilson Hills. Constrained by surrounding rocks, the river of ice holds together. But stresses resulting from the glacier’s movement make deep crevasses, or cracks, in the ice. After passing through the channel, the glacier has room to spread out as it floats on the ocean. The expanded area and the jostling of ocean waves prompts the ice to break apart, which it often does along existing crevasses. On September 6, 2010, the Advanced Land Imager (ALI) on NASA’s Earth Observing-1 (EO-1) satellite captured this natural-color image of the margin of Matusevich Glacier. Shown here just past the rock-lined channel, the glacier is calving large icebergs. Low-angled sunlight illuminates north-facing surfaces and casts long shadows to the south. Fast ice anchored to the shore surrounds both the glacier tongue and the icebergs it has calved. Compared to the glacier and icebergs, the fast ice is thinner with a smoother surface. Out to sea (image left), the sea ice is even thinner and moves with winds and currents. Matusevich Glacier does not drain a significant amount of ice off of the Antarctic continent, so the glacier’s advances and retreats lack global significance. Like other Antarctic glaciers, however, Matusevich helps glaciologists form a larger picture of Antarctica’s glacial health and ice sheet volume. NASA Earth Observatory image created by Jesse Allen and Robert Simmon, using EO-1 ALI data provided courtesy of the NASA EO-1 team. Caption by Michon Scott based on image interpretation by Robert Bindschadler, NASA Goddard Space Flight Center, and Walt Meier, National Snow and Ice Data Center. Instrument: EO-1 - ALI Credit: <b><a href="http://www.earthobservatory.nasa.gov/" rel="nofollow"> NASA Earth Observatory</a></b> <b><a href="http://www.nasa.gov/centers/goddard/home/index.html" rel="nofollow">NASA Goddard Space Flight Center</a></b> enables NASA’s mission through four scientific endeavors: Earth Science, Heliophysics, Solar System Exploration, and Astrophysics. Goddard plays a leading role in NASA’s accomplishments by contributing compelling scientific knowledge to advance the Agency’s mission. <b>Follow us on <a href="http://twitter.com/NASA_GoddardPix" rel="nofollow">Twitter</a></b> <b>Join us on <a href="http://www.facebook.com/pages/Greenbelt-MD/NASA-Goddard/395013845897?ref=tsd" rel="nofollow">Facebook</a></b> To download the full resolution image go to: <a href="http://earthobservatory.nasa.gov/IOTD/view.php?id=46840" rel="nofollow">earthobservatory.nasa.gov/IOTD/view.php?id=46840</a>
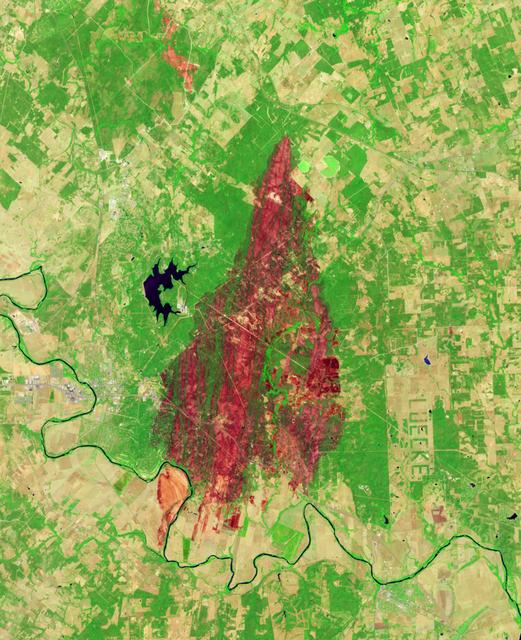
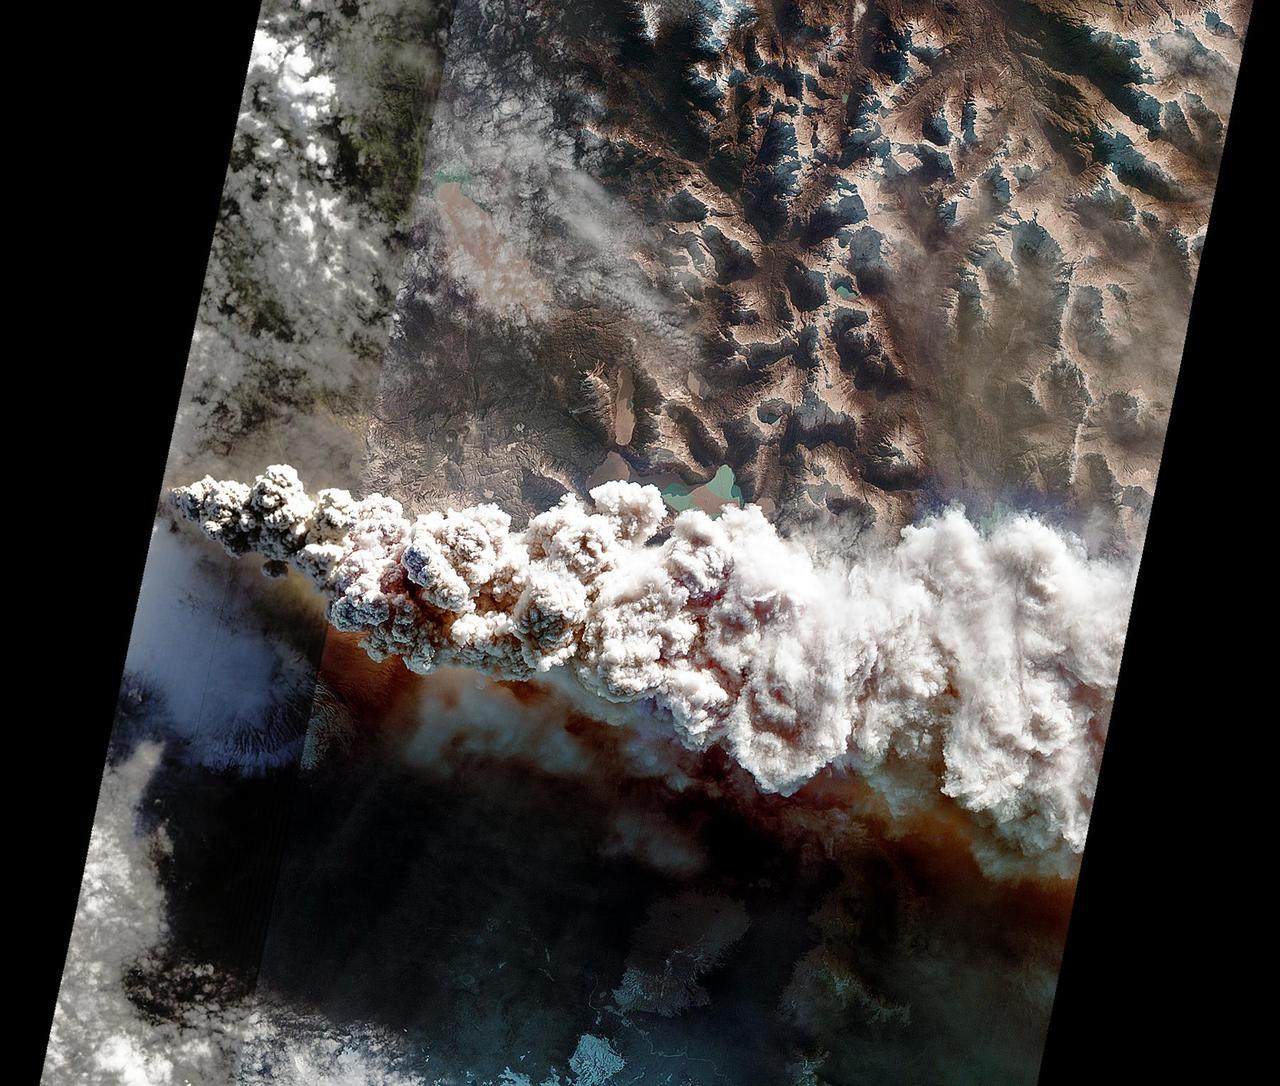
NASA image acquired September 12, 2011 To view more images from this event go to: <a href="http://earthobservatory.nasa.gov/NaturalHazards/event.php?id=52029" rel="nofollow">earthobservatory.nasa.gov/NaturalHazards/event.php?id=52029</a> The Bastrop County Complex Fire in southern Texas started on September 4, 2011. By September 13, 2011, the fire was 70 percent contained, but had scorched 34,068 acres (13,787 hectares). The Advanced Land Imager (ALI) on NASA’s Earth Observing-1 (EO-1) satellite captured this image of the affected region on September 12, 2011. This false-color image shows a wide-area view of the fire. Vegetation is bright green, and sparsely vegetated or bare land is green-yellow. The burn scar appears in shades of red and orange. The burn scar is far from uniform; burned areas are separated by unburned expanses. As of September 13, a re-entry plan had been established for residents of the region, the Incident Information System reported. Residents were warned, however, that they might see vegetation still smoldering or burning. Ongoing drought set the stage for severe fires in Texas in the slate summer of 2011. In early September, Tropical Storm Lee, which drenched other parts of the United States, brought strong winds to Texas, worsening the fires. NASA Earth Observatory image created by Jesse Allen and Robert Simmon, using EO-1 ALI data provided courtesy of the NASA EO-1 team. Caption by Michon Scott. Instrument: EO-1 - ALI Credit: <b><a href="http://www.earthobservatory.nasa.gov/" rel="nofollow"> NASA Earth Observatory</a></b> <b><a href="http://www.nasa.gov/audience/formedia/features/MP_Photo_Guidelines.html" rel="nofollow">NASA image use policy.</a></b> <b><a href="http://www.nasa.gov/centers/goddard/home/index.html" rel="nofollow">NASA Goddard Space Flight Center</a></b> enables NASA’s mission through four scientific endeavors: Earth Science, Heliophysics, Solar System Exploration, and Astrophysics. Goddard plays a leading role in NASA’s accomplishments by contributing compelling scientific knowledge to advance the Agency’s mission. <b>Follow us on <a href="http://twitter.com/NASA_GoddardPix" rel="nofollow">Twitter</a></b> <b>Like us on <a href="http://www.facebook.com/pages/Greenbelt-MD/NASA-Goddard/395013845897?ref=tsd" rel="nofollow">Facebook</a></b> <b>Find us on <a href="http://instagrid.me/nasagoddard/?vm=grid" rel="nofollow">Instagram</a></b>
NASA image acquired December 23, 2011 In early June 2011, Chile’s Puyehue-Cordón Caulle Volcano erupted explosively, sending volcanic ash around the Southern Hemisphere. In late December 2011, activity at the volcano had calmed, but volcanic ash and steam continued to pour through the fissure that opened several months earlier. The Advanced Land Imager (ALI) on NASA’s Earth Observing-1 (EO-1) satellite captured this natural-color image on December 23, 2011. The active fissure lies northwest of the Puyehue caldera, and a plume blows from the fissure toward the west and north. This image shows not just ash but also snow on the volcano surface, including the caldera. Because volcanic ash regularly coats the land surface, the pristine snow probably fell recently. In a bulletin issued December 26, 2011, Chile’s Servicio Nacional de Geología y Minería (SERNAGEOMIN) characterized the activity over the previous 24 hours as a minor eruption of low intensity. Reaching an altitude of 2,236 meters (7,336 feet), Puyehue-Cordón Caulle is a stratovolcano, a steep-sloped, conical volcano composed of layers of ash, lava, and rocks released by previous eruptions. This volcano comprises part of the largest active geothermal area in the southern Andes. NASA Earth Observatory image created by Jesse Allen, using EO-1 ALI data provided courtesy of the NASA EO-1 team. Caption by Michon Scott. Instrument: EO-1 - ALI To view more images from this event go here: <a href="http://earthobservatory.nasa.gov/NaturalHazards/event.php?id=50859" rel="nofollow">earthobservatory.nasa.gov/NaturalHazards/event.php?id=50859</a> Credit: <b><a href="http://www.earthobservatory.nasa.gov/" rel="nofollow"> NASA Earth Observatory</a></b> <b><a href="http://www.nasa.gov/audience/formedia/features/MP_Photo_Guidelines.html" rel="nofollow">NASA image use policy.</a></b> <b><a href="http://www.nasa.gov/centers/goddard/home/index.html" rel="nofollow">NASA Goddard Space Flight Center</a></b> enables NASA’s mission through four scientific endeavors: Earth Science, Heliophysics, Solar System Exploration, and Astrophysics. Goddard plays a leading role in NASA’s accomplishments by contributing compelling scientific knowledge to advance the Agency’s mission. <b>Follow us on <a href="http://twitter.com/NASA_GoddardPix" rel="nofollow">Twitter</a></b> <b>Like us on <a href="http://www.facebook.com/pages/Greenbelt-MD/NASA-Goddard/395013845897?ref=tsd" rel="nofollow">Facebook</a></b> <b>Find us on <a href="http://instagrid.me/nasagoddard/?vm=grid" rel="nofollow">Instagram</a></b>
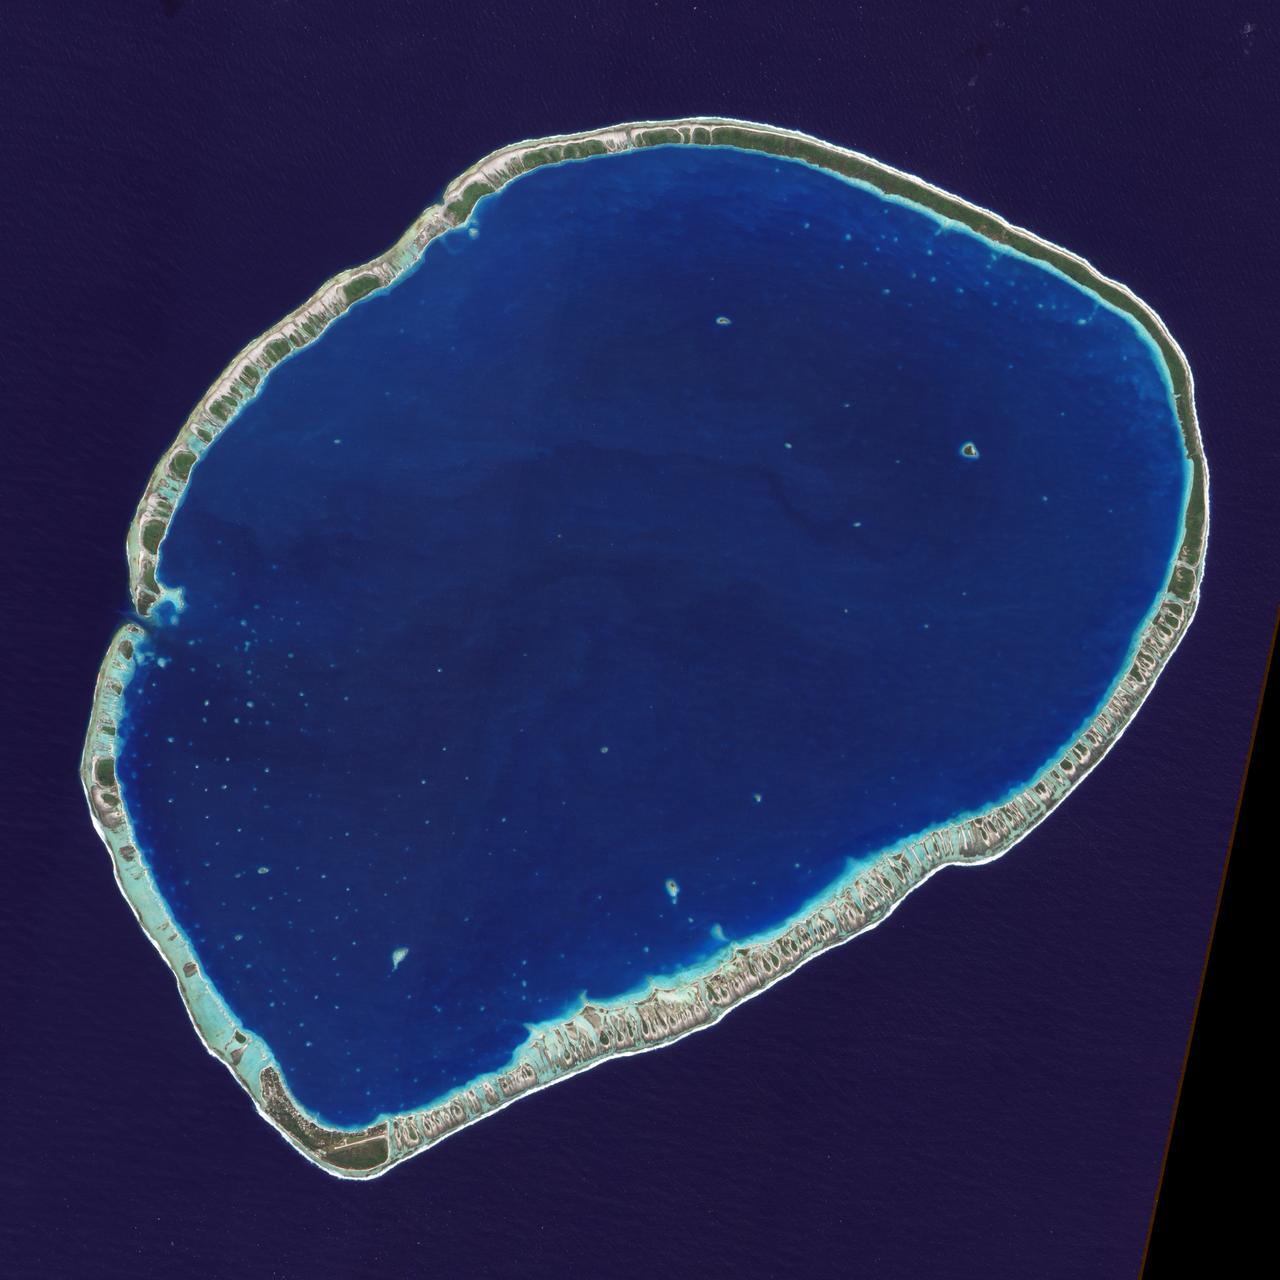
The islands and coral atolls of French Polynesia, located in the southern Pacific Ocean, epitomize the idea of tropical paradise: white sandy beaches, turquoise lagoons, and palm trees. Even from the distance of space, the view of these atolls is beautiful. This image from the Advanced Land Imager on NASA’s Earth Observing-1 (EO-1) satellite shows the southern part of Tikehau Atoll, one of the 78 coral atolls that make up the Tuamotu Archipelago. Patches of coral make star-like spots across the turquoise expanse of the lagoon. A line of tree-covered islets encircles the lagoon. At the southernmost tip of the atoll, a large islet accommodates a small village and an air strip. NASA image created by Jesse Allen, using EO-1 ALI data provided courtesy of the NASA EO-1 Team. Caption by Rebecca Lindsey. <b><a href="http://www.nasa.gov/audience/formedia/features/MP_Photo_Guidelines.html" rel="nofollow">NASA image use policy.</a></b> <b><a href="http://www.nasa.gov/centers/goddard/home/index.html" rel="nofollow">NASA Goddard Space Flight Center</a></b> enables NASA’s mission through four scientific endeavors: Earth Science, Heliophysics, Solar System Exploration, and Astrophysics. Goddard plays a leading role in NASA’s accomplishments by contributing compelling scientific knowledge to advance the Agency’s mission. <b>Follow us on <a href="http://twitter.com/NASAGoddardPix" rel="nofollow">Twitter</a></b> <b>Like us on <a href="http://www.facebook.com/pages/Greenbelt-MD/NASA-Goddard/395013845897?ref=tsd" rel="nofollow">Facebook</a></b> <b>Find us on <a href="http://instagrid.me/nasagoddard/?vm=grid" rel="nofollow">Instagram</a></b>
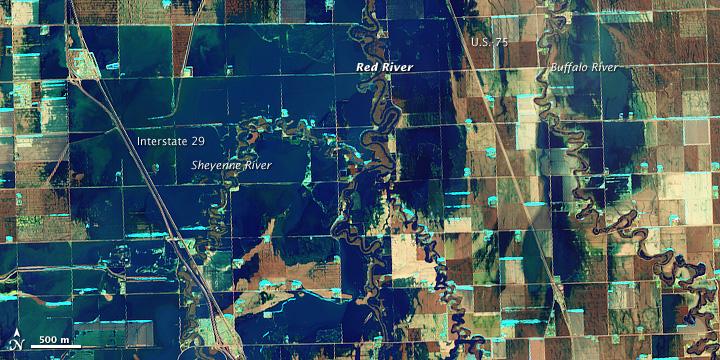
NASA Satellite image acquired March 21, 2010. To see a high res of this image go here: <a href="http://www.flickr.com/photos/gsfc/4455124807/in/photostream/">www.flickr.com/photos/gsfc/4455124807/in/photostream/</a> On March 21, 2010, the Red River crested at 36.99 feet (11.27 meters), according to the National Weather Service. The New York Times reported that the river’s crest was 1 foot (0.3 meters) below predictions and 4 feet (1 meter) below 2009’s record crest. A cold front passing through the area on March 19, 2010, slowed the rate of snowmelt feeding local rivers. That, combined with sandbags and dykes, spared the metropolitan area of Fargo, North Dakota, from serious flooding. North of town, however, agricultural fields and roads flooded. The Advanced Land Imager (ALI) on NASA’s Earth Observing-1 (EO-1) satellite captured these images of fields north of Fargo on March 21, 2010. The top image uses shortwave infrared light, and the bottom image uses visible light. Muddy waters and fallow fields blend together in the true-color image (bottom), but the false-color image (top) distinguishes better between water and land. Blue indicates water and green indicates vegetation. Fallow fields, bare ground, and paved surfaces appear in shades of brown. Cyan suggests pale water and/or sediment. Wide swaths of blue show large areas of standing water. The Sheyenne, Red, and Buffalo Rivers all flow through the area pictured here. According to The New York Times, flooding in rural areas around Fargo resulted primarily from the Red River’s failure to absorb water from the tributaries feeding it. Much of the standing water apparent in this image occurs around the Sheyenne and Buffalo Rivers. Overflowing tributaries left several inches of standing water in agricultural fields and on highways. About 10 miles (16 kilometers) north of Fargo, flooding forced the closure of Interstate 29. NASA image created by Jesse Allen, using EO-1 ALI data provided courtesy of the NASA EO-1 team and the United States Geological Survey. Caption by Michon Scott.. Instrument: EO-1 - ALI. To learn more about this image go here: <a href="http://earthobservatory.nasa.gov/NaturalHazards/view.php?id=43211" rel="nofollow">earthobservatory.nasa.gov/NaturalHazards/view.php?id=43211</a> To learn more about NASA's Goddard Space Flight Center go here: <a href="http://www.nasa.gov/centers/goddard/home/index.html" rel="nofollow">www.nasa.gov/centers/goddard/home/index.html</a>
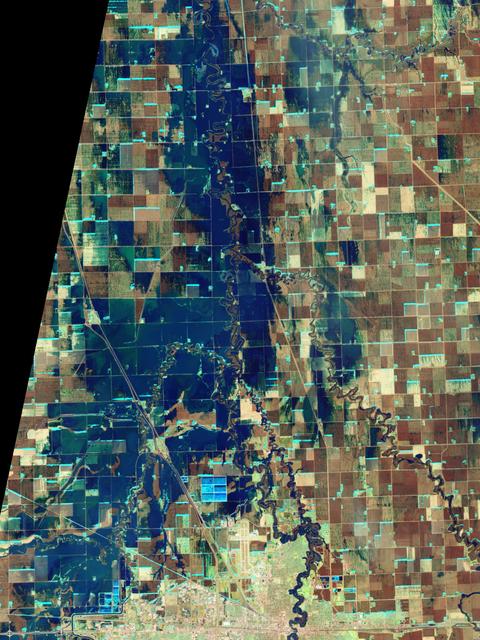
NASA Satellite image acquired March 21, 2010. To see a high res more detail of this image go here: <a href="http://www.flickr.com/photos/gsfc/4455125023/in/photostream/">www.flickr.com/photos/gsfc/4455125023/in/photostream/</a> On March 21, 2010, the Red River crested at 36.99 feet (11.27 meters), according to the National Weather Service. The New York Times reported that the river’s crest was 1 foot (0.3 meters) below predictions and 4 feet (1 meter) below 2009’s record crest. A cold front passing through the area on March 19, 2010, slowed the rate of snowmelt feeding local rivers. That, combined with sandbags and dykes, spared the metropolitan area of Fargo, North Dakota, from serious flooding. North of town, however, agricultural fields and roads flooded. The Advanced Land Imager (ALI) on NASA’s Earth Observing-1 (EO-1) satellite captured these images of fields north of Fargo on March 21, 2010. The top image uses shortwave infrared light, and the bottom image uses visible light. Muddy waters and fallow fields blend together in the true-color image (bottom), but the false-color image (top) distinguishes better between water and land. Blue indicates water and green indicates vegetation. Fallow fields, bare ground, and paved surfaces appear in shades of brown. Cyan suggests pale water and/or sediment. Wide swaths of blue show large areas of standing water. The Sheyenne, Red, and Buffalo Rivers all flow through the area pictured here. According to The New York Times, flooding in rural areas around Fargo resulted primarily from the Red River’s failure to absorb water from the tributaries feeding it. Much of the standing water apparent in this image occurs around the Sheyenne and Buffalo Rivers. Overflowing tributaries left several inches of standing water in agricultural fields and on highways. About 10 miles (16 kilometers) north of Fargo, flooding forced the closure of Interstate 29. NASA image created by Jesse Allen, using EO-1 ALI data provided courtesy of the NASA EO-1 team and the United States Geological Survey. Caption by Michon Scott. Instrument: EO-1 - ALI. To learn more about this image go here: <a href="http://earthobservatory.nasa.gov/NaturalHazards/view.php?id=43211" rel="nofollow">earthobservatory.nasa.gov/NaturalHazards/view.php?id=43211</a> To learn more about NASA's Goddard Space Flight Center go here: <a href="http://www.nasa.gov/centers/goddard/home/index.html" rel="nofollow">www.nasa.gov/centers/goddard/home/index.html</a>

Grinding glaciers and granite peaks mingle in Chile’s Torres del Paine National Park. The Advanced Land Imager (ALI) on NASA’s Earth Observing-1 (EO-1) satellite captured this summertime image of the park on January 21, 2013. This image shows just a portion of the park, including Grey Glacier and the mountain range of Cordillera del Paine. The rivers of glacial ice in Torres del Paine National Park grind over bedrock, turning some of that rock to dust. Many of the glaciers terminate in freshwater lakes, which are rich with glacial flour that colors them brown to turquoise. Skinny rivers connect some of the lakes to each other (image upper and lower right). Cordillera del Paine rises between some of the wide glacial valleys. The compact mountain range is a combination of soaring peaks and small glaciers, most notably the Torres del Paine (Towers of Paine), three closely spaced peaks emblematic of the mountain range and the larger park. By human standards, the mountains of Cordillera del Paine are quite old. But compared to the Rocky Mountains (70 million years old), and the Appalachians (about 480 million years), the Cordillera del Paine are very young—only about 12 million years old. A study published in 2008 described how scientists used zircon crystals to estimate the age of Cordillera del Paine. The authors concluded that the mountain range was built in three pulses, creating a granite laccolith, or dome-shaped feature, more than 2,000 meters (7,000 feet) thick. NASA Earth Observatory image created by Jesse Allen and Robert Simmon, using Advanced Land Imager data from the NASA EO-1 team. Caption by Michon Scott. Instrument: EO-1 - ALI View more info: <a href="http://earthobservatory.nasa.gov/IOTD/view.php?id=80266" rel="nofollow">earthobservatory.nasa.gov/IOTD/view.php?id=80266</a> Credit: <b><a href="http://www.earthobservatory.nasa.gov/" rel="nofollow"> NASA Earth Observatory</a></b> <b><a href="http://www.nasa.gov/audience/formedia/features/MP_Photo_Guidelines.html" rel="nofollow">NASA image use policy.</a></b> <b><a href="http://www.nasa.gov/centers/goddard/home/index.html" rel="nofollow">NASA Goddard Space Flight Center</a></b> enables NASA’s mission through four scientific endeavors: Earth Science, Heliophysics, Solar System Exploration, and Astrophysics. Goddard plays a leading role in NASA’s accomplishments by contributing compelling scientific knowledge to advance the Agency’s mission. <b>Follow us on <a href="http://twitter.com/NASA_GoddardPix" rel="nofollow">Twitter</a></b> <b>Like us on <a href="http://www.facebook.com/pages/Greenbelt-MD/NASA-Goddard/395013845897?ref=tsd" rel="nofollow">Facebook</a></b> <b>Find us on <a href="http://instagrid.me/nasagoddard/?vm=grid" rel="nofollow">Instagram</a></b>
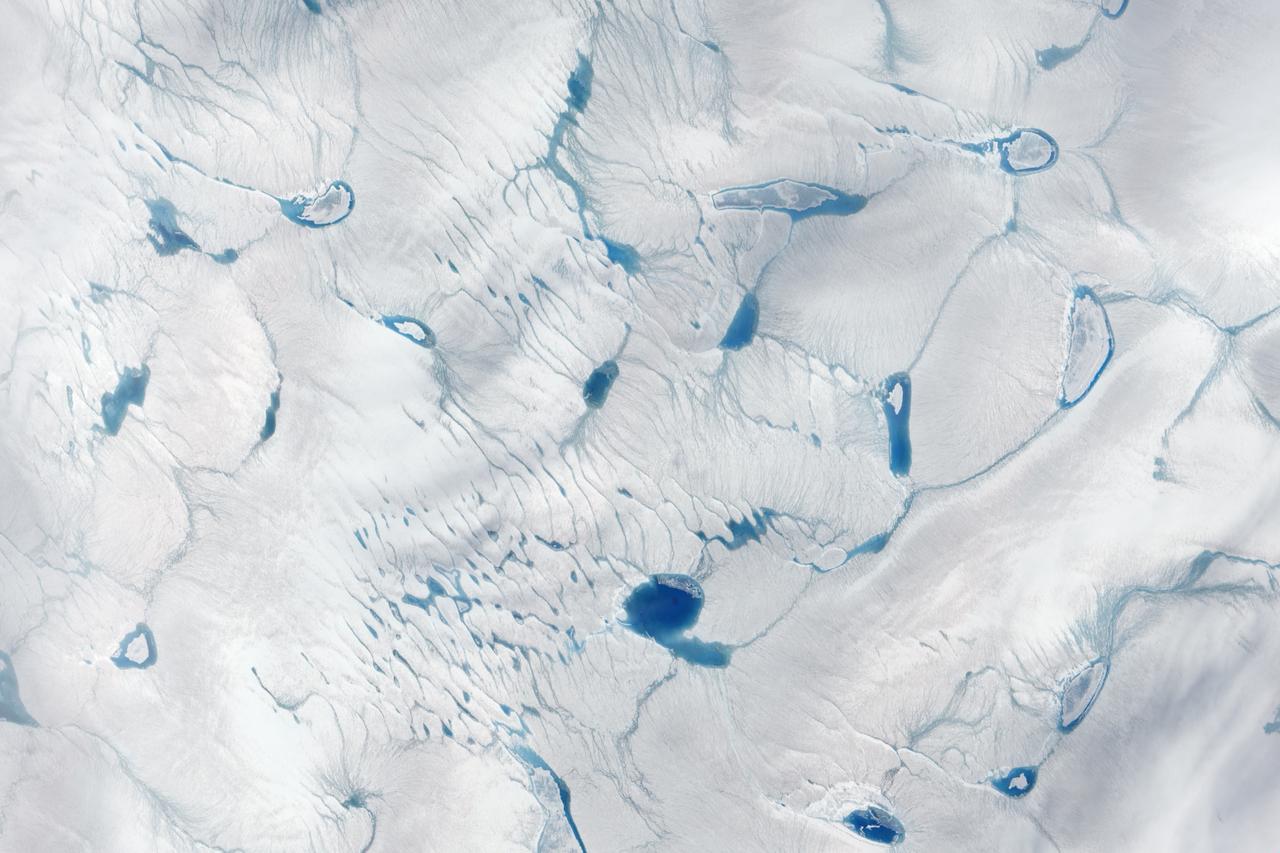
On June 15, 2016, the Advanced Land Imager (ALI) on NASA’s Earth Observing-1 satellite acquired a natural-color image of an area just inland from the coast of southwestern Greenland (120 kilometers southeast of Ilulisat and 500 kilometers north-northeast of Nuuk). According to Marco Tedesco, a professor at Columbia University’s Lamont Doherty Earth Observatory, melting in this area began relatively early in April but was not sustained. It started up again in May and grew into the watery June scene pictured above. Surface melt can directly contribute to sea level rise via runoff. It can also force its way through crevasses to the base of a glacier, temporarily speeding up ice flow and indirectly contributing to sea level rise. Also, ponding of meltwater can “darken” the ice sheet’s surface and lead to further melting. Read more: <a href="https://earthobservatory.nasa.gov/IOTD/view.php?id=88288" rel="nofollow">earthobservatory.nasa.gov/IOTD/view.php?id=88288</a> Credit: NASA Earth Observatory image by Jesse Allen, using EO-1 ALI data provided courtesy of the NASA EO-1 team <b><a href="http://www.nasa.gov/audience/formedia/features/MP_Photo_Guidelines.html" rel="nofollow">NASA image use policy.</a></b> <b><a href="http://www.nasa.gov/centers/goddard/home/index.html" rel="nofollow">NASA Goddard Space Flight Center</a></b> enables NASA’s mission through four scientific endeavors: Earth Science, Heliophysics, Solar System Exploration, and Astrophysics. Goddard plays a leading role in NASA’s accomplishments by contributing compelling scientific knowledge to advance the Agency’s mission. <b>Follow us on <a href="http://twitter.com/NASAGoddardPix" rel="nofollow">Twitter</a></b> <b>Like us on <a href="http://www.facebook.com/pages/Greenbelt-MD/NASA-Goddard/395013845897?ref=tsd" rel="nofollow">Facebook</a></b> <b>Find us on <a href="http://instagrid.me/nasagoddard/?vm=grid" rel="nofollow">Instagram</a></b>
NASA image acquired June 24, 2011 Since it began erupting on June 12, 2011, emissions from Eritrea’s Nabro Volcano have drifted over much of East Africa and the Middle East. Ash has displaced residents living near the volcano and disrupted flights in the region. Despite the volcano’s widespread effects, little is known about the eruption. Nabro is located in an isolated region along the border between Eritrea and Ethiopia, and few English-language reports have been published. Satellite remote sensing is currently the only reliable way to monitor the ongoing eruption. This satellite image is among the first detailed pictures of the erupting vent and lava flows. They were acquired by the Advanced Land Imager (ALI) aboard the Earth Observing-1 (EO-1) satellite on June 24, 2011. The bright red portions of the false-color image (top) indicate hot surfaces. Hot volcanic ash glows above the vent, located in the center of Nabro’s caldera. To the west of the vent, portions of an active lava flow (particularly the front of the flow) are also hot. The speckled pattern on upstream portions of the flow are likely due to the cool, hardened crust splitting and exposing fluid lava as the flow advances. The bulbous blue-white cloud near the vent is likely composed largely of escaping water vapor that condensed as the plume rose and cooled. The whispy, cyan clouds above the lava flow are evidence of degassing from the lava. NASA Earth Observatory image by Robert Simmon, using EO-1 ALI data. Caption by Robert Simmon. Instrument: EO-1 - ALI To download the high res go here: <a href="http://earthobservatory.nasa.gov/IOTD/view.php?id=51216" rel="nofollow">earthobservatory.nasa.gov/IOTD/view.php?id=51216</a> <b><a href="http://www.nasa.gov/centers/goddard/home/index.html" rel="nofollow">NASA Goddard Space Flight Center</a></b> enables NASA’s mission through four scientific endeavors: Earth Science, Heliophysics, Solar System Exploration, and Astrophysics. Goddard plays a leading role in NASA’s accomplishments by contributing compelling scientific knowledge to advance the Agency’s mission. <b>Follow us on <a href="http://twitter.com/NASA_GoddardPix" rel="nofollow">Twitter</a></b> <b>Like us on <a href="http://www.facebook.com/pages/Greenbelt-MD/NASA-Goddard/395013845897?ref=tsd" rel="nofollow">Facebook</a></b> <b>Find us on <a href="http://web.stagram.com/n/nasagoddard/?vm=grid" rel="nofollow">Instagram</a></b>

On September 24, 2013, a major strike-slip earthquake rattled western Pakistan, killing at least 350 people and leaving more than 100,000 homeless. The 7.7 magnitude quake struck the Baluchistan province of northwestern Pakistan. Amidst the destruction, a new island was created offshore in the Paddi Zirr (West Bay) near Gwadar, Pakistan. On September 26, 2013, the Advanced Land Imager (ALI) on NASA’s Earth Observing-1 (EO-1) satellite captured the top image of that new island, which sits roughly one kilometer (0.6 miles) offshore. Likely a “mud volcano,” the island rose from the seafloor near Gwadar on September 24, shortly after the earthquake struck about 380 kilometers (230 miles) inland. The lower image, acquired by the Operational Land Imager on the Landsat 8 satellite, shows the same area on April 17, 2013. In the satellite images, lighter shades of green and tan in the water reveal shallow seafloor or suspended sediment. The water depth around the new island is roughly 15 to 20 meters (50 to 65 feet), according to marine geologist Asif Inam of Pakistan’s National Institute of Oceanography. “The floor in that area is generally flat, but the gradient in this area changes quite abruptly,” Inam said. The top image from ALI is also clear enough to show the parallel ripples of waves marching toward the shore. Read more: <a href="https://earthobservatory.nasa.gov/IOTD/view.php?id=82146" rel="nofollow">earthobservatory.nasa.gov/IOTD/view.php?id=82146</a> NASA Earth Observatory image by Jesse Allen and Robert Simmon, using EO-1 ALI data from the NASA EO-1 team. <b><a href="http://www.nasa.gov/audience/formedia/features/MP_Photo_Guidelines.html" rel="nofollow">NASA image use policy.</a></b> <b><a href="http://www.nasa.gov/centers/goddard/home/index.html" rel="nofollow">NASA Goddard Space Flight Center</a></b> enables NASA’s mission through four scientific endeavors: Earth Science, Heliophysics, Solar System Exploration, and Astrophysics. Goddard plays a leading role in NASA’s accomplishments by contributing compelling scientific knowledge to advance the Agency’s mission. <b>Follow us on <a href="http://twitter.com/NASAGoddardPix" rel="nofollow">Twitter</a></b> <b>Like us on <a href="http://www.facebook.com/pages/Greenbelt-MD/NASA-Goddard/395013845897?ref=tsd" rel="nofollow">Facebook</a></b> <b>Find us on <a href="http://instagrid.me/nasagoddard/?vm=grid" rel="nofollow">Instagram</a></b>
NASA image acquired June 24, 2011 Since it began erupting on June 12, 2011, emissions from Eritrea’s Nabro Volcano have drifted over much of East Africa and the Middle East. Ash has displaced residents living near the volcano and disrupted flights in the region. Despite the volcano’s widespread effects, little is known about the eruption. Nabro is located in an isolated region along the border between Eritrea and Ethiopia, and few English-language reports have been published. Satellite remote sensing is currently the only reliable way to monitor the ongoing eruption. This satellite image is among the first detailed pictures of the erupting vent and lava flows. They were acquired by the Advanced Land Imager (ALI) aboard the Earth Observing-1 (EO-1) satellite on June 24, 2011. The bright red portions of the false-color image (top) indicate hot surfaces. Hot volcanic ash glows above the vent, located in the center of Nabro’s caldera. To the west of the vent, portions of an active lava flow (particularly the front of the flow) are also hot. The speckled pattern on upstream portions of the flow are likely due to the cool, hardened crust splitting and exposing fluid lava as the flow advances. The bulbous blue-white cloud near the vent is likely composed largely of escaping water vapor that condensed as the plume rose and cooled. The whispy, cyan clouds above the lava flow are evidence of degassing from the lava. NASA Earth Observatory image by Robert Simmon, using EO-1 ALI data. Caption by Robert Simmon. Instrument: EO-1 - ALI To download the high res go here: <a href="http://earthobservatory.nasa.gov/IOTD/view.php?id=51216" rel="nofollow">earthobservatory.nasa.gov/IOTD/view.php?id=51216</a> <b><a href="http://www.nasa.gov/centers/goddard/home/index.html" rel="nofollow">NASA Goddard Space Flight Center</a></b> enables NASA’s mission through four scientific endeavors: Earth Science, Heliophysics, Solar System Exploration, and Astrophysics. Goddard plays a leading role in NASA’s accomplishments by contributing compelling scientific knowledge to advance the Agency’s mission. <b>Follow us on <a href="http://twitter.com/NASA_GoddardPix" rel="nofollow">Twitter</a></b> <b>Like us on <a href="http://www.facebook.com/pages/Greenbelt-MD/NASA-Goddard/395013845897?ref=tsd" rel="nofollow">Facebook</a></b> <b>Find us on <a href="http://web.stagram.com/n/nasagoddard/?vm=grid" rel="nofollow">Instagram</a></b>
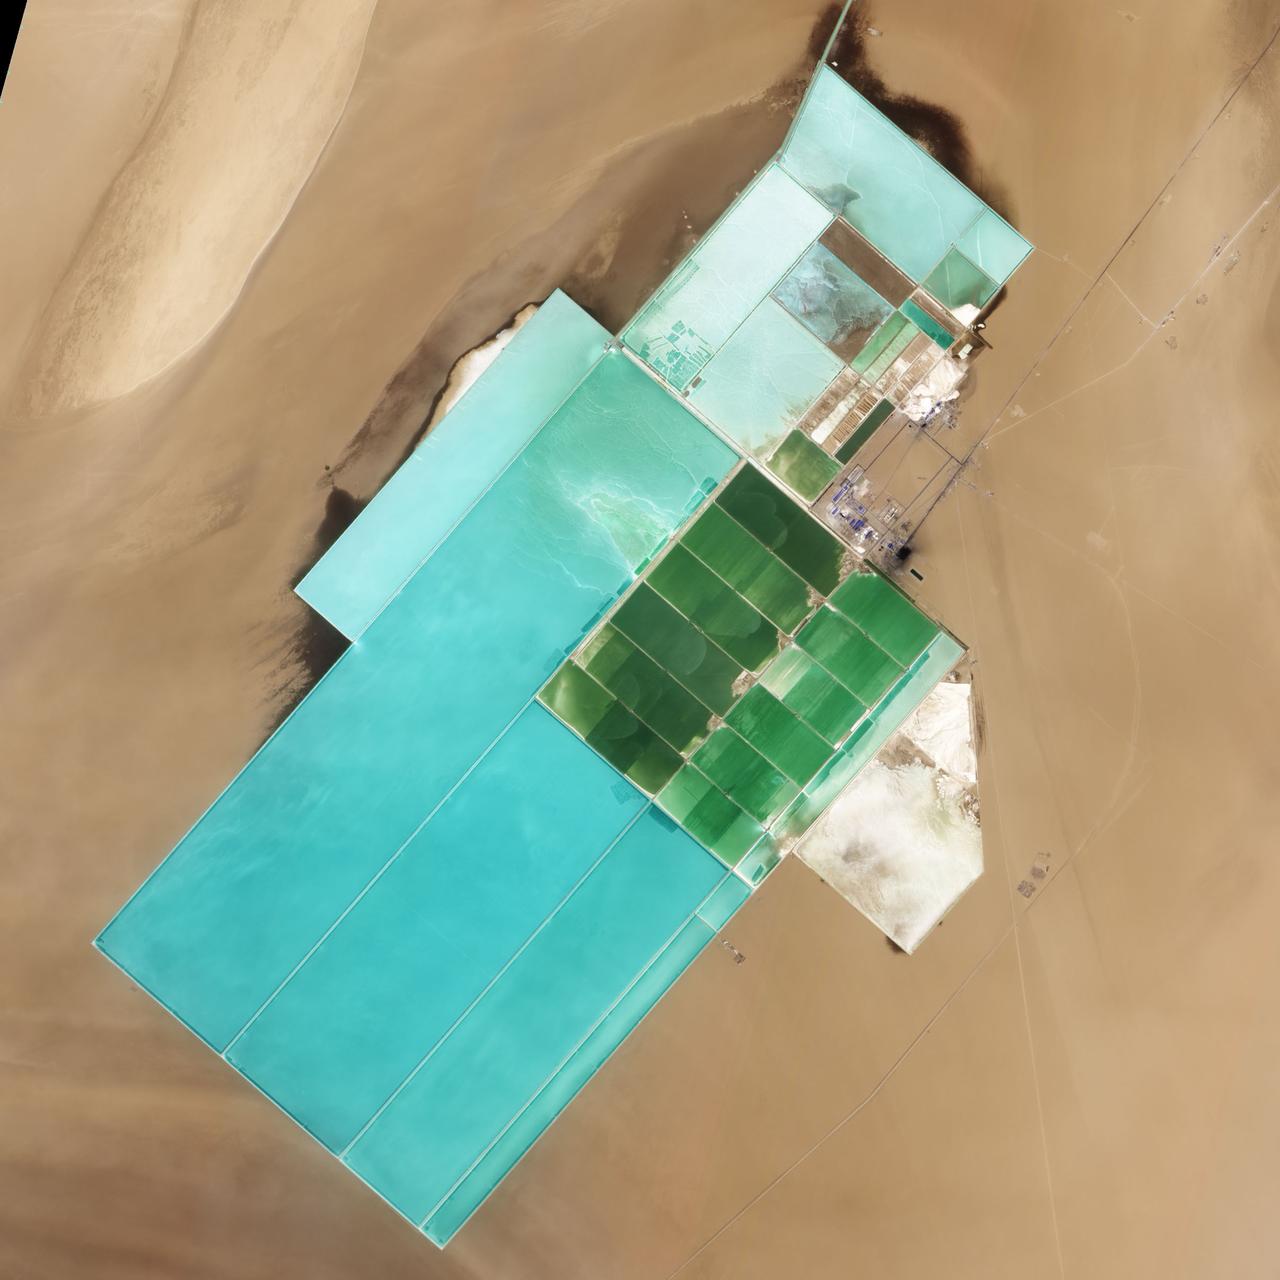
NASA image acquired May 17, 2011 Located in China’s resource-rich but moisture-poor Xinjiang autonomous region, Lop Nur is an uninviting location for any kind of agriculture. It sits at the eastern end of the Taklimakan Desert, where marching sand dunes can reach heights of 200 meters (650 feet), and dust storms rage across the landscape. Yet for all it lacks in agricultural appeal, Lop Nur offers something valuable to farmers the world over: potash. This potassium salt provides a major nutrient required for plant growth, making it a key ingredient in fertilizer. The discovery of potash at Lop Nur in the mid-1990s turned the area into a large-scale mining operation. The Advanced Land Imager (ALI) on NASA’s Earth Observing-1 (EO-1) satellite captured this natural-color image of Lop Nur on May 17, 2011. The rectangular shapes in this image show the bright colors characteristic of solar evaporation ponds. Around the evaporation ponds are the earth tones typical of sandy desert. During the early and middle Pleistocene epoch, this area held a large brackish lake. Uplift of the northern part of the lake in the late Pleistocene created hollows that became receptacles for potash deposition. The main potash deposits found at Lop Nur today are brine potash, and this site is the second-largest source of potash in China. Lop Nur slowly dried up in the Holocene. The area now receives average annual precipitation of just 31.2 millimeters (1.2 inches), and experiences annual evaporation of 2,901 millimeters (114 inches), according to a study published in 2008. The study found, however, that this area has experienced seven major climate changes since the end of the Pleistocene, including climatic conditions far more favorable to farming and settlement than today. Examination of plant and mollusk remains at the lake, as well as studies of sediments, indicate that the Lop Nur region experienced a severe drought about 3,000 years ago, followed by wetter conditions. Between 1,250 and 400 years ago, Lop Nur likely experienced the conditions most favorable to farming and settlement, and red willow trees grew in the area. Pottery dating from the Tang and Song dynasties further testifies to welcoming conditions at the lake centuries ago. Starting around 400 years ago, however, a more arid climate took hold, completely drying out Lop Nur. Today, by providing potash, the desiccated lake still supports agriculture, but it does so for farming efforts further afield. NASA Earth Observatory image created by Jesse Allen and Robert Simmon, using EO-1 ALI data provided courtesy of the NASA EO-1 team. Caption by Michon Scott. Instrument: EO-1 - ALI Credit: <b><a href="http://www.earthobservatory.nasa.gov/" rel="nofollow"> NASA Earth Observatory</a></b> <b><a href="http://www.nasa.gov/centers/goddard/home/index.html" rel="nofollow">NASA Goddard Space Flight Center</a></b> enables NASA’s mission through four scientific endeavors: Earth Science, Heliophysics, Solar System Exploration, and Astrophysics. Goddard plays a leading role in NASA’s accomplishments by contributing compelling scientific knowledge to advance the Agency’s mission. <b>Follow us on <a href="http://twitter.com/NASA_GoddardPix" rel="nofollow">Twitter</a></b> <b>Like us on <a href="http://www.facebook.com/pages/Greenbelt-MD/NASA-Goddard/395013845897?ref=tsd" rel="nofollow">Facebook</a></b> <b>Find us on <a href="http://web.stagram.com/n/nasagoddard/?vm=grid" rel="nofollow">Instagram</a></b>

NASA image acquired July 27, 2001 In southwestern Jordan lies an unusual landscape. Mountains of granite and sandstone rise next to valleys filled with red sand. Some of the mountains reach a height of about 1,700 meters (5,600 feet) above sea level, and many have near-vertical slopes. So alien is this landscape, it’s nicknamed “Valley of the Moon,” and it has served as the film set for a movie about Mars. Yet nomadic people have lived here for thousands of years. Declared a protected area in 1998, this unearthly landscape is Wadi Rum. The Advanced Land Imager (ALI) on NASA’s Earth Observing-1 (EO-1) satellite captured this natural-color image on July 27, 2001. The scene includes part of Wadi Rum and an adjacent area to the east. East of the protected area, fields with center-pivot irrigation make circles of green and brown (image upper right). As the earth tones throughout the image attest, the area is naturally arid, receiving little annual precipitation and supporting only sparse vegetation. Between rocky peaks, the sandy valleys range in color from beige to brick. Ancient granite rocks dating from the Precambrian underlie younger rocks, and some of these basement rocks have eroded into rugged, steep-sloped mountains. The granite mountains have risen thanks partly to crisscrossing fault lines under the park. Overlying the granite are sandstones from the Cambrian and Ordovician Periods, as well as loose sands. Lawrence of Arabia, who fought in the Arab Revolt of 1917–1918, made frequent references to Wadi Rum in his book The Seven Pillars of Wisdom. Likewise, a prominent feature of the protected area is named after the book. Several popular sites in Wadi Rum bear Lawrence of Arabia’s name, but whether he actually visited those sites is uncertain. To download the full high res go to: <a href="http://earthobservatory.nasa.gov/IOTD/view.php?id=49945" rel="nofollow">earthobservatory.nasa.gov/IOTD/view.php?id=49945</a> NASA Earth Observatory image created by Jesse Allen and Robert Simmon, using EO-1 ALI data provided courtesy of the NASA EO-1 team and the United States Geological Survey. Caption by Michon Scott. Instrument: EO-1 - ALI Credit: <b><a href="http://www.earthobservatory.nasa.gov/" rel="nofollow"> NASA Earth Observatory</a></b> <b><a href="http://www.nasa.gov/centers/goddard/home/index.html" rel="nofollow">NASA Goddard Space Flight Center</a></b> enables NASA’s mission through four scientific endeavors: Earth Science, Heliophysics, Solar System Exploration, and Astrophysics. Goddard plays a leading role in NASA’s accomplishments by contributing compelling scientific knowledge to advance the Agency’s mission. <b>Follow us on <a href="http://twitter.com/NASA_GoddardPix" rel="nofollow">Twitter</a></b> <b>Join us on <a href="http://www.facebook.com/pages/Greenbelt-MD/NASA-Goddard/395013845897?ref=tsd" rel="nofollow">Facebook</a></b>

NASA Image acquired March 24, 2010 To learn more and to download a high res version of this image go here: <a href="http://earthobservatory.nasa.gov/IOTD/view.php?id=43252" rel="nofollow">earthobservatory.nasa.gov/IOTD/view.php?id=43252</a> Iceland’s Eyjafjallajökull Volcano burst into life for the first time in 190 years on March 20, 2010. A 500-meter- (2,000-foot) long fissure opened in the Fimmvörduháls pass to the west of the ice-covered summit of Eyjafjallajökull. Lava fountains erupted fluid magma, which quickly built several hills of bubble-filled lava rocks (scoria) along the vent. A lava flow spread northeast, spilling into Hrunagil Gully. This natural-color satellite image shows lava fountains, lava flows, a volcanic plume, and steam from vaporized snow. The image was acquired on March 24, 2010, by the Advanced Land Imager (ALI) aboard NASA’s Earth Observing-1 (EO-1) satellite. The lava fountains are orange-red, barely visible at the 10-meter (33-foot) resolution of the satellite. The scoria cones surrounding the fissure are black, as is the lava flow extending to the northeast. White volcanic gases escape from the vent and erupting lava, while a steam plume rises where the hot lava meets snow. (The bright green color along the edge of the lava flow is an artifact of the sensor.) The eruption of Eyjafjallajökull was presaged by a series of earthquakes starting in early March. Over time, the earthquakes rose towards the surface, and land near the volcano rose at least 40 millimeters (2 inches)—both indications that magma was moving underneath the volcano. The eruption continued through at least March 26th, and may continue for several more months. Previous eruptions in the area have caused flooding due to the melting of glacial ice (a Jökulhlaup), but the current eruption is in an area covered by winter snow, not permanent ice. Although some past eruptions of Eyjafjallajökull were followed by larger, explosive eruptions at nearby Katla Volcano, there is currently no sign of activity at Katla. NASA image by Robert Simmon, using ALI data from the EO-1 team. Caption by Robert Simmon. Instrument: EO-1 - ALI <b><a href="http://www.nasa.gov/centers/goddard/home/index.html" rel="nofollow">NASA Goddard Space Flight Center</a></b> is home to the nation's largest organization of combined scientists, engineers and technologists that build spacecraft, instruments and new technology to study the Earth, the sun, our solar system, and the universe.
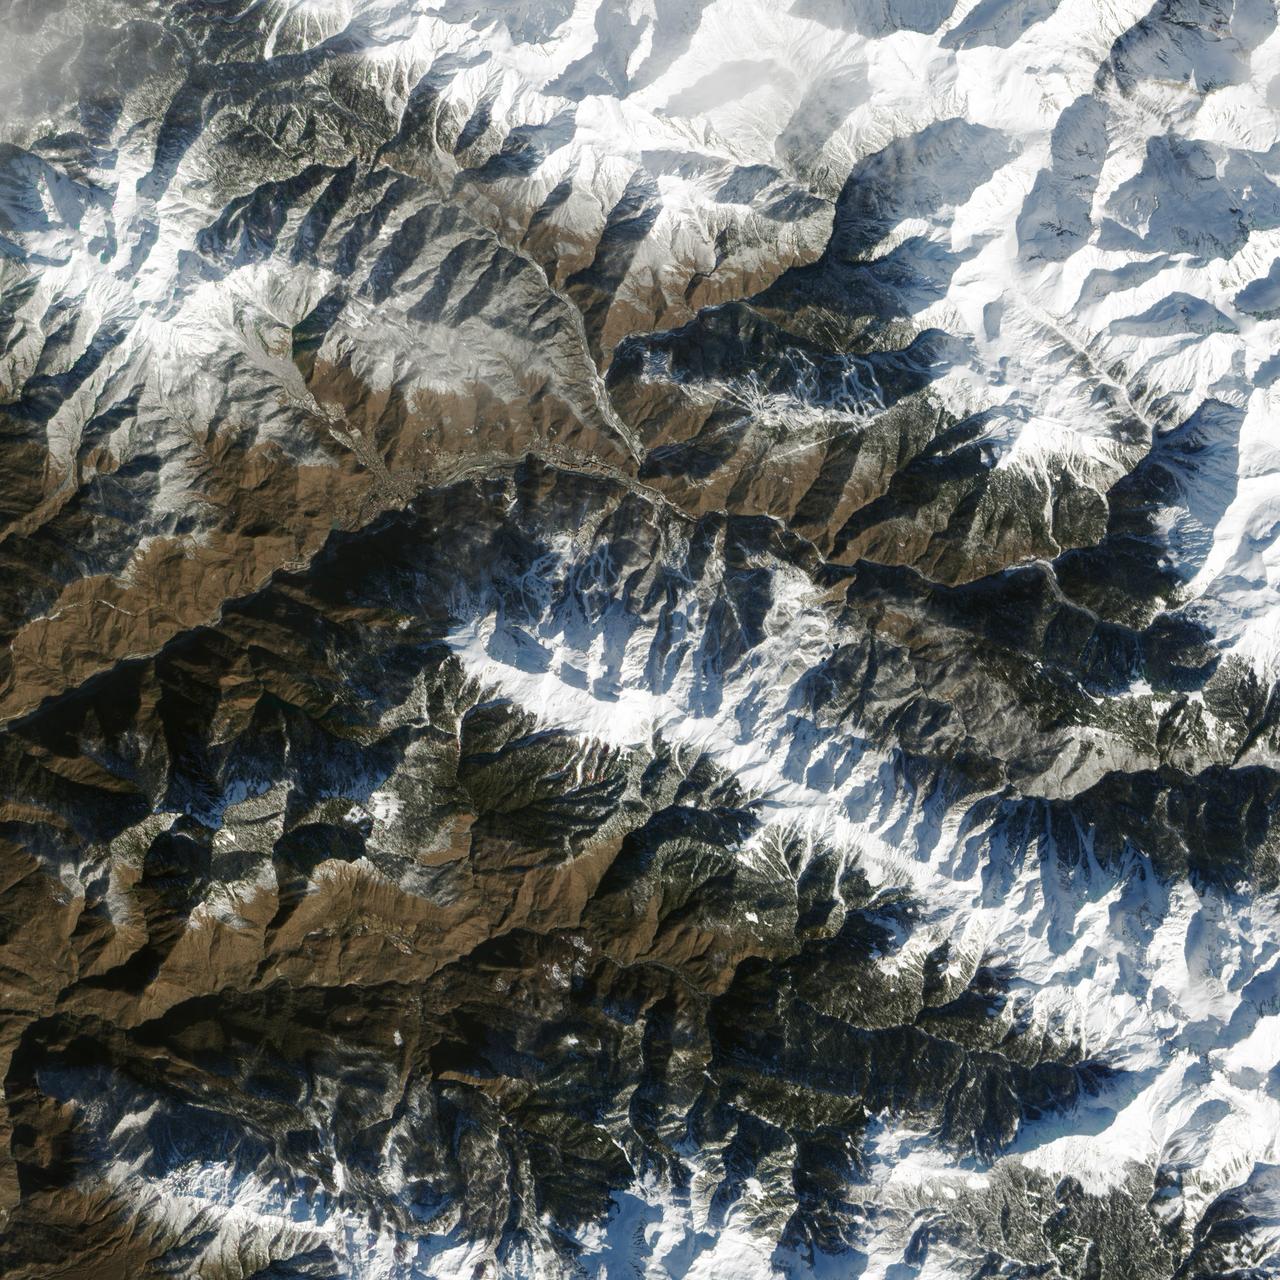
While Sochi is a coastal town on the Black Sea, the skiing events for the XXII Olympic Games are taking place about 40 kilometers (25 miles) inland. The venues are clustered around Krasnaya Polyana, a small town tucked between the Aibiga and Psekhako Ridges in the western Caucasus. This image—acquired by the Advanced Land Imager (ALI) on NASA’s Earth Observing-1 (EO-1) satellite on February 8, 2014—offers a view of the town and the ski facilities. The Rosa Khutor Alpine Center is the home to the downhill, snowboard, and freestyle events. The combined downhill skiing area measures about 20 kilometers (12 miles) in total, with the men’s downhill course stretching 3,500 meters (11,482 feet) and featuring a 1,075-meter (3,526 foot) change in elevation. The highest lift climbs to the summit of Rosa Peak, which rises 2,320 meters (7,612 feet). While not being used for the Olympics, the nearby Black Pyramid mountain has downhill skiing trails as well. The same steep slopes that make Rosa Peak good for skiing also elevate the risk of avalanches. To protect against falling snow, planners installed a series of gas pipes along the top of the ridge. The pipes emit bursts of oxygen and propane that create small, controlled avalanches. Event organizers also installed a series of earthen dams to steer snow away from infrastructure, and they have deployed two backhoes to the top of Aibiga Ridge to knock cornices away before they pose a risk. The Laura Cross-country Ski and Biathalon Center is located to the north on Psekhako Ridge. It includes two stadiums, each with their own start and finish zones, two track systems for skiing and biathlon, as well as shooting areas and warm-up zones. The center is named for the Laura River, a turbulent river that flows nearby. NASA Earth Observatory image by Jesse Allen and Robert Simmon, using EO-1 ALI data provided courtesy of the NASA EO-1 team. Caption by Adam Voiland. Instrument: EO-1 - ALI Read more: <a href="http://earthobservatory.nasa.gov/IOTD/view.php?id=83131&eocn=home&eoci=iotd_grid" rel="nofollow">earthobservatory.nasa.gov/IOTD/view.php?id=83131&eocn...</a> Credit: <b><a href="http://www.earthobservatory.nasa.gov/" rel="nofollow"> NASA Earth Observatory</a></b> <b><a href="http://www.nasa.gov/audience/formedia/features/MP_Photo_Guidelines.html" rel="nofollow">NASA image use policy.</a></b> <b><a href="http://www.nasa.gov/centers/goddard/home/index.html" rel="nofollow">NASA Goddard Space Flight Center</a></b> enables NASA’s mission through four scientific endeavors: Earth Science, Heliophysics, Solar System Exploration, and Astrophysics. Goddard plays a leading role in NASA’s accomplishments by contributing compelling scientific knowledge to advance the Agency’s mission. <b>Follow us on <a href="http://twitter.com/NASAGoddardPix" rel="nofollow">Twitter</a></b> <b>Like us on <a href="http://www.facebook.com/pages/Greenbelt-MD/NASA-Goddard/395013845897?ref=tsd" rel="nofollow">Facebook</a></b> <b>Find us on <a href="http://instagram.com/nasagoddard?vm=grid" rel="nofollow">Instagram</a></b>
Off the northeastern edge of Antarctica’s Amery Ice Shelf lies Mackenzie Bay, which was painted with a ghostly blue-green mass in early February 2012. Similarly colored tendrils also streamed northward across the ocean, their flow sometimes interrupted by icebergs. Multiple factors might account for the ghostly shapes, including low-lying clouds or katabatic winds—downslope winds blowing toward the coast, which can freeze the water at the ocean surface. But an intriguing and perhaps more likely explanation involves processes occurring below the ice shelf. An ice shelf is a thick slab of ice often fed by glaciers attached to the coastline. The shelf floats on the ocean surface, with seawater circulating underneath. Like most ice shelves, the Amery is very thick in the upstream area near the shore. It thins significantly as it stretches northward away from the continent. Water at depth is subject to much greater pressure than water at the surface, and one effect of this intense pressure is that it effectively lowers the freezing point. So water circulating at depth beneath the Amery Ice Shelf may be slightly below the temperature at which it would normally begin to freeze. As some that water wells up along the underbelly of the shelf, the pressure is reduced and the water begins to freeze even though the temperature may not change. As it freezes, this deep-ocean water forms needle-like crystals known as frazil. The crystals are only 3 to 4 millimeters (0.12 to 0.16 inches) wide, but a sufficient concentration of frazil can change the appearance of the water. A frazil-rich plume probably accounts for the blue-green waters off the Amery Ice Shelf in the image above. Modeling of ocean circulation beneath the shelf indicates just such a plume emerging in that location. Frazil-rich water explains the plume, and wind transport of the surface water explains the long streams extending northward. As the sub-iceshelf water mixes with surface water around the Antarctic coastline, the frazil is gradually melted and the streams disappear. The Advanced Land Imager (ALI) on NASA’s Earth Observing-1 (EO-1) satellite captured this natural-color image of Mackenzie Bay and the ice shelf on February 12, 2012. NASA Earth Observatory image created by Jesse Allen and Robert Simmon, using EO-1 ALI data provided courtesy of the NASA EO-1 team. Caption by Michon Scott with information from Helen A. Fricker, Scripps Institution of Oceanography; Robert Massom, Australian Antarctic Division; Ben Galton-Fenzi, University of Tasmania, Australia; and Florence Fetterer, Walt Meier, and Ted Scambos, National Snow and Ice Data Center. Credit: <b><a href="http://www.earthobservatory.nasa.gov/" rel="nofollow"> NASA Earth Observatory</a></b> <b><a href="http://www.nasa.gov/audience/formedia/features/MP_Photo_Guidelines.html" rel="nofollow">NASA image use policy.</a></b> <b><a href="http://www.nasa.gov/centers/goddard/home/index.html" rel="nofollow">NASA Goddard Space Flight Center</a></b> enables NASA’s mission through four scientific endeavors: Earth Science, Heliophysics, Solar System Exploration, and Astrophysics. Goddard plays a leading role in NASA’s accomplishments by contributing compelling scientific knowledge to advance the Agency’s mission. <b>Follow us on <a href="http://twitter.com/NASA_GoddardPix" rel="nofollow">Twitter</a></b> <b>Like us on <a href="http://www.facebook.com/pages/Greenbelt-MD/NASA-Goddard/395013845897?ref=tsd" rel="nofollow">Facebook</a></b> <b>Find us on <a href="http://instagrid.me/nasagoddard/?vm=grid" rel="nofollow">Instagram</a></b> Instrument: EO-1 - ALI
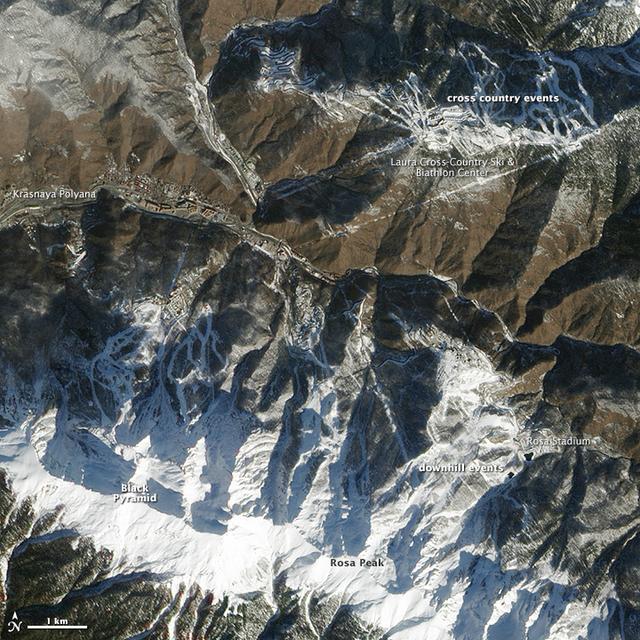
High res here: <a href="http://www.flickr.com/photos/gsfc/12640339235/in/photostream/">www.flickr.com/photos/gsfc/12640339235/in/photostream/</a> While Sochi is a coastal town on the Black Sea, the skiing events for the XXII Olympic Games are taking place about 40 kilometers (25 miles) inland. The venues are clustered around Krasnaya Polyana, a small town tucked between the Aibiga and Psekhako Ridges in the western Caucasus. This image—acquired by the Advanced Land Imager (ALI) on NASA’s Earth Observing-1 (EO-1) satellite on February 8, 2014—offers a view of the town and the ski facilities. The Rosa Khutor Alpine Center is the home to the downhill, snowboard, and freestyle events. The combined downhill skiing area measures about 20 kilometers (12 miles) in total, with the men’s downhill course stretching 3,500 meters (11,482 feet) and featuring a 1,075-meter (3,526 foot) change in elevation. The highest lift climbs to the summit of Rosa Peak, which rises 2,320 meters (7,612 feet). While not being used for the Olympics, the nearby Black Pyramid mountain has downhill skiing trails as well. The same steep slopes that make Rosa Peak good for skiing also elevate the risk of avalanches. To protect against falling snow, planners installed a series of gas pipes along the top of the ridge. The pipes emit bursts of oxygen and propane that create small, controlled avalanches. Event organizers also installed a series of earthen dams to steer snow away from infrastructure, and they have deployed two backhoes to the top of Aibiga Ridge to knock cornices away before they pose a risk. The Laura Cross-country Ski and Biathalon Center is located to the north on Psekhako Ridge. It includes two stadiums, each with their own start and finish zones, two track systems for skiing and biathlon, as well as shooting areas and warm-up zones. The center is named for the Laura River, a turbulent river that flows nearby. NASA Earth Observatory image by Jesse Allen and Robert Simmon, using EO-1 ALI data provided courtesy of the NASA EO-1 team. Caption by Adam Voiland. Instrument: EO-1 - ALI Read more: <a href="http://earthobservatory.nasa.gov/IOTD/view.php?id=83131&eocn=home&eoci=iotd_grid" rel="nofollow">earthobservatory.nasa.gov/IOTD/view.php?id=83131&eocn...</a> Credit: <b><a href="http://www.earthobservatory.nasa.gov/" rel="nofollow"> NASA Earth Observatory</a></b> <b><a href="http://www.nasa.gov/audience/formedia/features/MP_Photo_Guidelines.html" rel="nofollow">NASA image use policy.</a></b> <b><a href="http://www.nasa.gov/centers/goddard/home/index.html" rel="nofollow">NASA Goddard Space Flight Center</a></b> enables NASA’s mission through four scientific endeavors: Earth Science, Heliophysics, Solar System Exploration, and Astrophysics. Goddard plays a leading role in NASA’s accomplishments by contributing compelling scientific knowledge to advance the Agency’s mission. <b>Follow us on <a href="http://twitter.com/NASAGoddardPix" rel="nofollow">Twitter</a></b> <b>Like us on <a href="http://www.facebook.com/pages/Greenbelt-MD/NASA-Goddard/395013845897?ref=tsd" rel="nofollow">Facebook</a></b> <b>Find us on <a href="http://instagram.com/nasagoddard?vm=grid" rel="nofollow">Instagram</a></b>
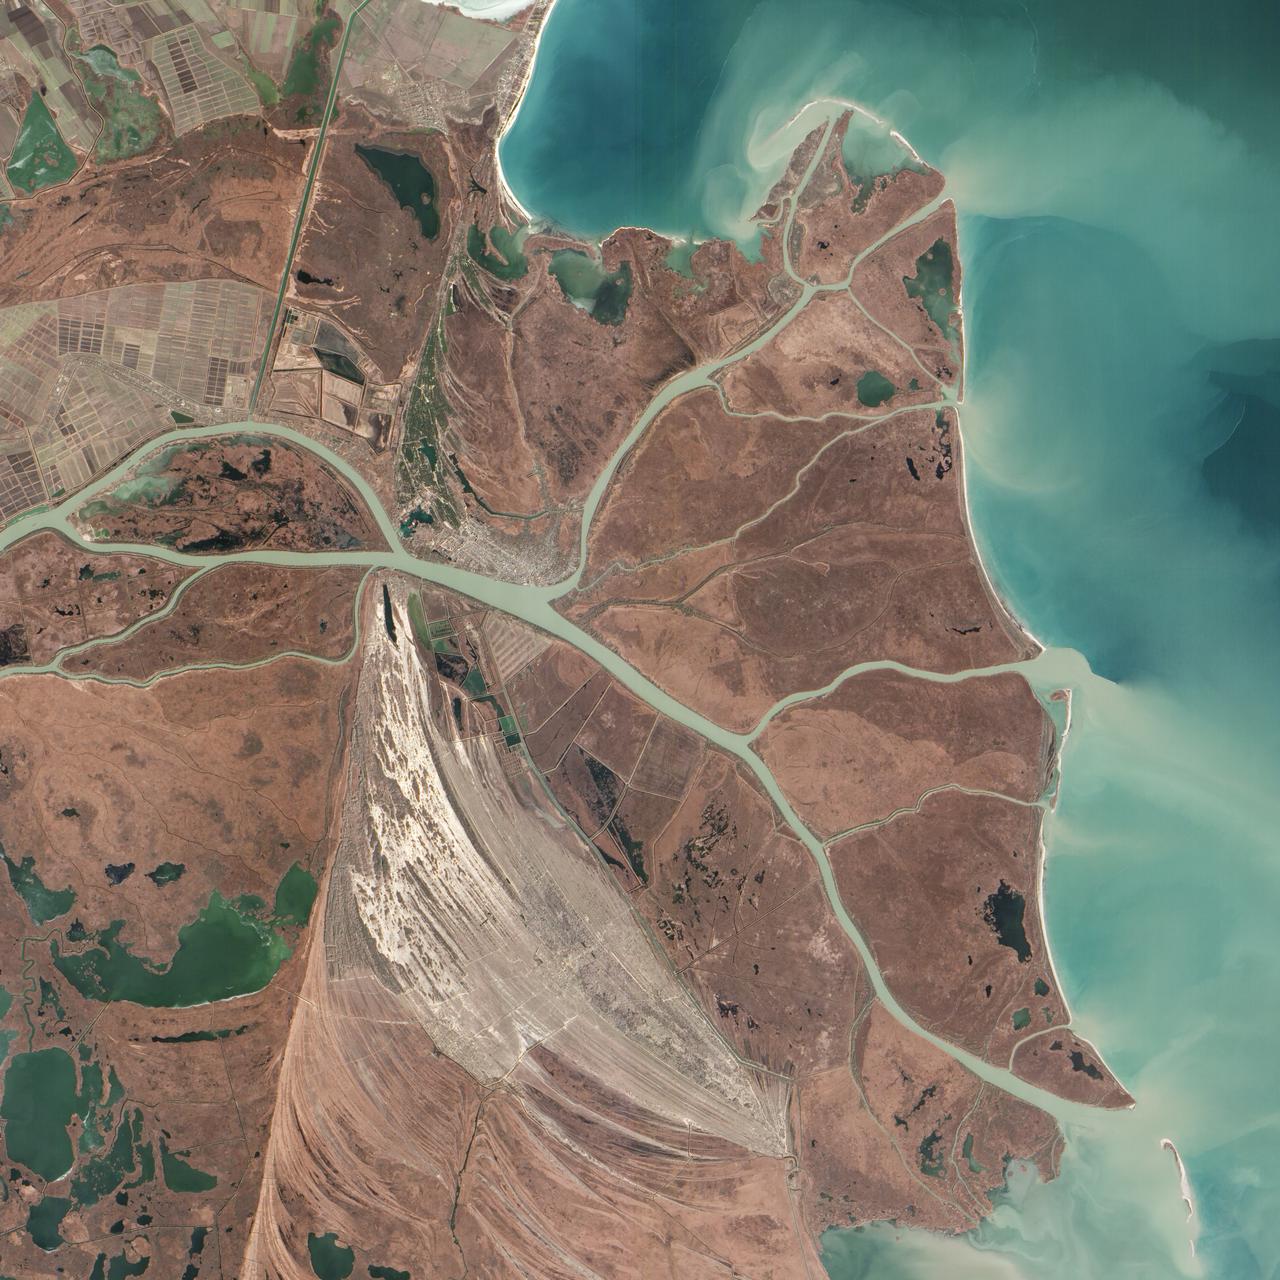
Acquired February 5, 2013 The Danube River is the largest in the European Union, its watershed draining 801,463 square kilometers (309,447 square miles) of land across 19 countries. Where that great river reaches the Black Sea, a remarkable delta has formed—the “Everglades” of Europe. The Danube Delta is home to more than 300 species of bird and 45 species of freshwater fish. The Danube Delta has been home to human settlements since the end of the Stone Age (the Neolithic Period), and the ancient Greeks, Romans, and Byzantines all built trading ports and military outposts along this coast. Today, the border between Romania and Ukraine cuts through the northern part of the delta. The area is a United Nations World Heritage Site, both for its natural and human history, and for the traditional maritime culture that persists in its marshes. All the while, the landscape has been shaped and re-shaped by nature and man. The image above was acquired on February 5, 2013, by the Advanced Land Imager (ALI) on NASA’s Earth Observing-1 (EO-1) satellite. The Danube Delta has a number of lobes formed over the past several thousand years, and this image is focused largely on the northernmost Chilia (or Kilia) lobe. It is the youngest section of the delta—somewhere between 300 to 400 years old—and lies mostly within Ukraine. Much of the land in the image above is officially considered part of the Danube Biosphere Reserve. Near the center of the image, the small city of Vylkove is known as the “Ukranian Venice,” due to its canals. To the lower left, the older Sulina lobe of the delta stretches to the south and further inland into Romania. White and brown curved lines reveal beach ridges and former shorelines, with the whiter ridges composed almost entirely of pure quartz sand in high dunes. To the east of the ridges, most of the landscape is flat marshland that is mostly brown in the barren days of winter. The Bystroye Canal through the center of the Chilia lobe has been the subject of heated debate over the past two decades. Over the centuries, damming and channeling of the Danube throughout Europe has reduced its water flow and sediment load to roughly 30 percent of what it once was, according to coastal geologist Liviu Giosan of the Woods Hole Oceanographic Institution. In recent years, the Ukrainian government has dredged some delta channels (including Bystroye) and proposed extensive dredging of others in order to provide navigational channels for large ships. Proponents argue for the economic needs of water transportation routes. Opponents note that deeper, faster channels mean less mud and sand is deposited in the delta; in some places, more is carried away by swifter currents. Both affect the sensitive ecosystems and the ability of the delta to restore itself and grow. In a 2012 report led by Giosan, scientists noted that the shape, water chemistry, and biology of Danube Delta was being altered long before the modern Industrial Era. Land use practices—particularly farming and forest clearing—added significant amounts of nutrients into the water and reduced salinity in the Black Sea, changing the dominant species of phytoplankton and sending a ripple of effects through the entire food web. NASA Earth Observatory image by Jesse Allen and Robert Simmon, using EO-1 ALI data provided courtesy of the NASA EO-1 team and the U.S. Geological Survey. Caption by Mike Carlowicz. Instrument: EO-1 - ALI More info: <a href="http://earthobservatory.nasa.gov/IOTD/view.php?id=80459" rel="nofollow">earthobservatory.nasa.gov/IOTD/view.php?id=80459</a> Credit: <b><a href="http://www.earthobservatory.nasa.gov/" rel="nofollow"> NASA Earth Observatory</a></b> <b><a href="http://www.nasa.gov/audience/formedia/features/MP_Photo_Guidelines.html" rel="nofollow">NASA image use policy.</a></b> <b><a href="http://www.nasa.gov/centers/goddard/home/index.html" rel="nofollow">NASA Goddard Space Flight Center</a></b> enables NASA’s mission through four scientific endeavors: Earth Science, Heliophysics, Solar System Exploration, and Astrophysics. Goddard plays a leading role in NASA’s accomplishments by contributing compelling scientific knowledge to advance the Agency’s mission. <b>Follow us on <a href="http://twitter.com/NASA_GoddardPix" rel="nofollow">Twitter</a></b> <b>Like us on <a href="http://www.facebook.com/pages/Greenbelt-MD/NASA-Goddard/395013845897?ref=tsd" rel="nofollow">Facebook</a></b> <b>Find us on <a href="http://instagram.com/nasagoddard?vm=grid" rel="nofollow">Instagram</a></b>
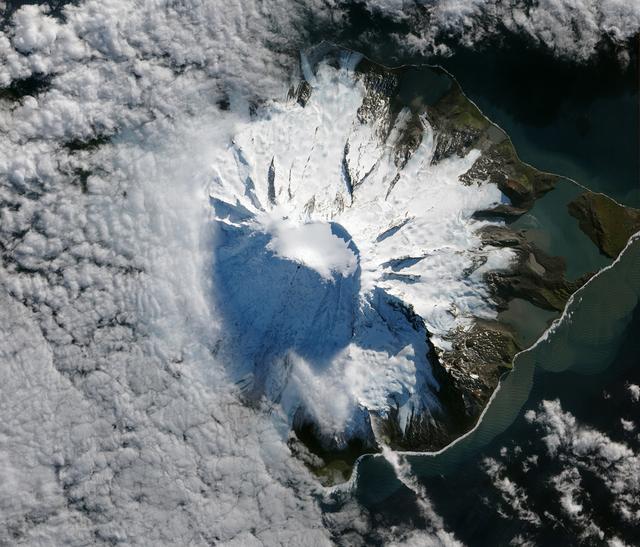
In October 2012, satellites measured subtle signals that suggested volcanic activity on remote Heard Island. These images, captured several months later, show proof of an eruption on Mawson Peak. By April 7, 2013, Mawson's steep-walled summit crater had filled, and a trickle of lava had spilled down the volcano’s southwestern flank. On April 20, the lava flow remained visible and had even widened slightly just below the summit. These natural-color images were collected by the Advanced Land Imager (ALI) on the Earth Observing-1 (EO-1) satellite. Image Credit: NASA Earth Observatory Read more: <a href="http://earthobservatory.nasa.gov/NaturalHazards/view.php?id=81024" rel="nofollow">earthobservatory.nasa.gov/NaturalHazards/view.php?id=81024</a> <b><a href="http://www.nasa.gov/audience/formedia/features/MP_Photo_Guidelines.html" rel="nofollow">NASA image use policy.</a></b> <b><a href="http://www.nasa.gov/centers/goddard/home/index.html" rel="nofollow">NASA Goddard Space Flight Center</a></b> enables NASA’s mission through four scientific endeavors: Earth Science, Heliophysics, Solar System Exploration, and Astrophysics. Goddard plays a leading role in NASA’s accomplishments by contributing compelling scientific knowledge to advance the Agency’s mission. <b>Follow us on <a href="http://twitter.com/NASA_GoddardPix" rel="nofollow">Twitter</a></b> <b>Like us on <a href="http://www.facebook.com/pages/Greenbelt-MD/NASA-Goddard/395013845897?ref=tsd" rel="nofollow">Facebook</a></b> <b>Find us on <a href="http://instagram.com/nasagoddard?vm=grid" rel="nofollow">Instagram</a></b>