
The cloud cover over the Southern Ocean occasionally parts as it did on January 1, 2015 just west of the Drake Passage where the VIIRS instrument on the Suomi NPP satellite glimpsed the above collection of ocean-color delineated eddies which have diameters ranging from a couple of kilometers to a couple of hundred kilometers. Recent studies indicate that eddy activity has been increasing in the Southern Ocean with possible implications for climate change. Credit: NASA's OceanColor/Suomi NPP/VIIRS <b><a href="http://www.nasa.gov/audience/formedia/features/MP_Photo_Guidelines.html" rel="nofollow">NASA image use policy.</a></b> <b><a href="http://www.nasa.gov/centers/goddard/home/index.html" rel="nofollow">NASA Goddard Space Flight Center</a></b> enables NASA’s mission through four scientific endeavors: Earth Science, Heliophysics, Solar System Exploration, and Astrophysics. Goddard plays a leading role in NASA’s accomplishments by contributing compelling scientific knowledge to advance the Agency’s mission. <b>Follow us on <a href="http://twitter.com/NASAGoddardPix" rel="nofollow">Twitter</a></b> <b>Like us on <a href="http://www.facebook.com/pages/Greenbelt-MD/NASA-Goddard/395013845897?ref=tsd" rel="nofollow">Facebook</a></b> <b>Find us on <a href="http://instagrid.me/nasagoddard/?vm=grid" rel="nofollow">Instagram</a></b>
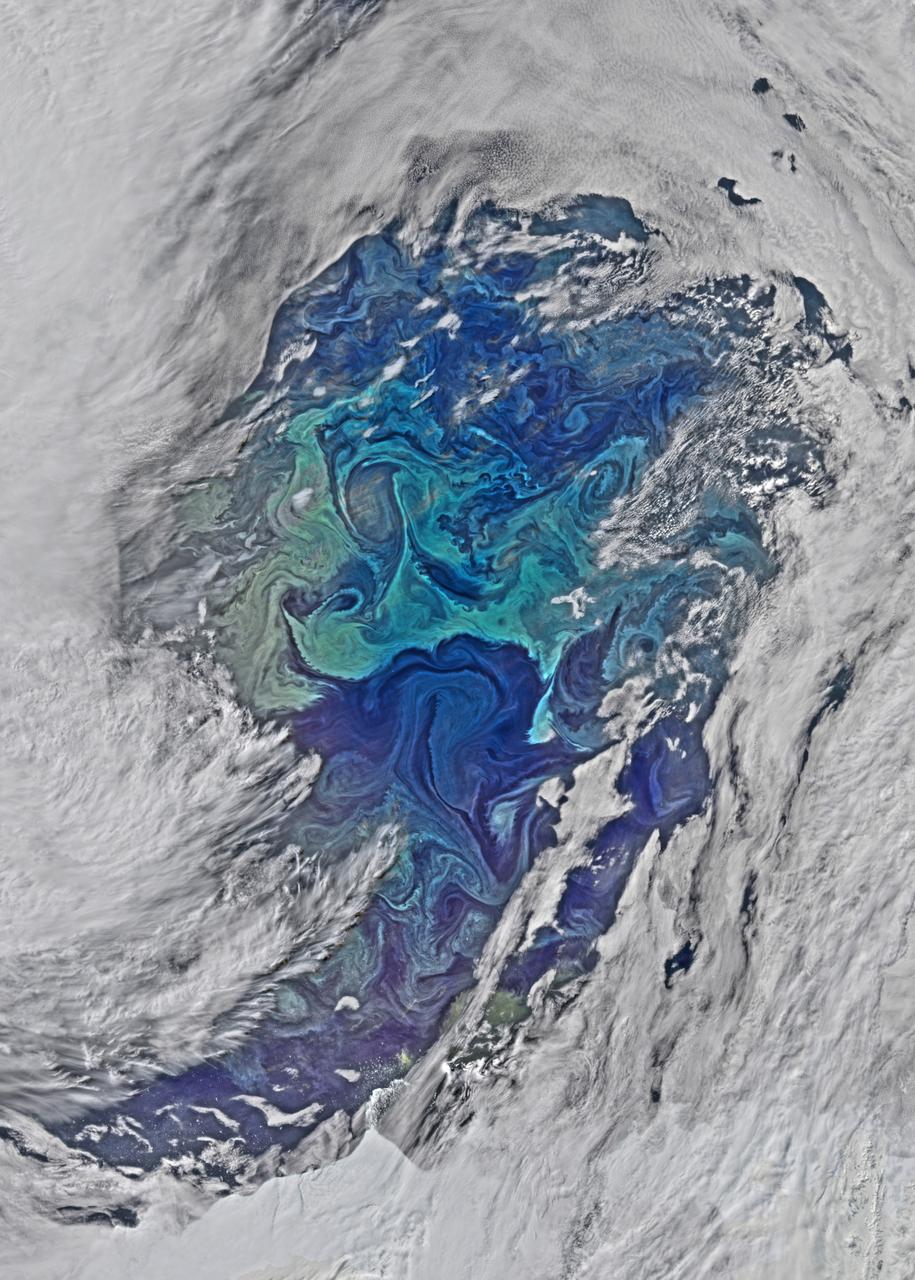
The cloud cover over the Southern Ocean occasionally parts as it did on January 1, 2015 just west of the Drake Passage where the VIIRS instrument on the Suomi NPP satellite glimpsed the above collection of ocean-color delineated eddies which have diameters ranging from a couple of kilometers to a couple of hundred kilometers. Recent studies indicate that eddy activity has been increasing in the Southern Ocean with possible implications for climate change. Credit: NASA's OceanColor/Suomi NPP/VIIRS
This morphing animation compares the eddies in Earth's oceans to the turbulent clouds in Jupiter's atmosphere. In the movie, a zoom occurs around a vortex dipole: a typical structure consisting of a cyclone and an anticyclone that is present both in Earth's ocean and Jupiter's atmosphere. The ocean image showing the spring phytoplankton bloom in the southern Gulf of Bothnia was generated from data collected by the MODIS instrument about NASA's Aqua satellite. The Jupiter image is from JunoCam. Scientist Lia Siegelman observed the similarities between the richness of turbulence around Joviancyclones and the filaments around smaller eddies seen in Earth's oceans. These similarities were especially evident in high-resolution satellite images of plankton blooms. Movie available at https://photojournal.jpl.nasa.gov/catalog/PIA25069
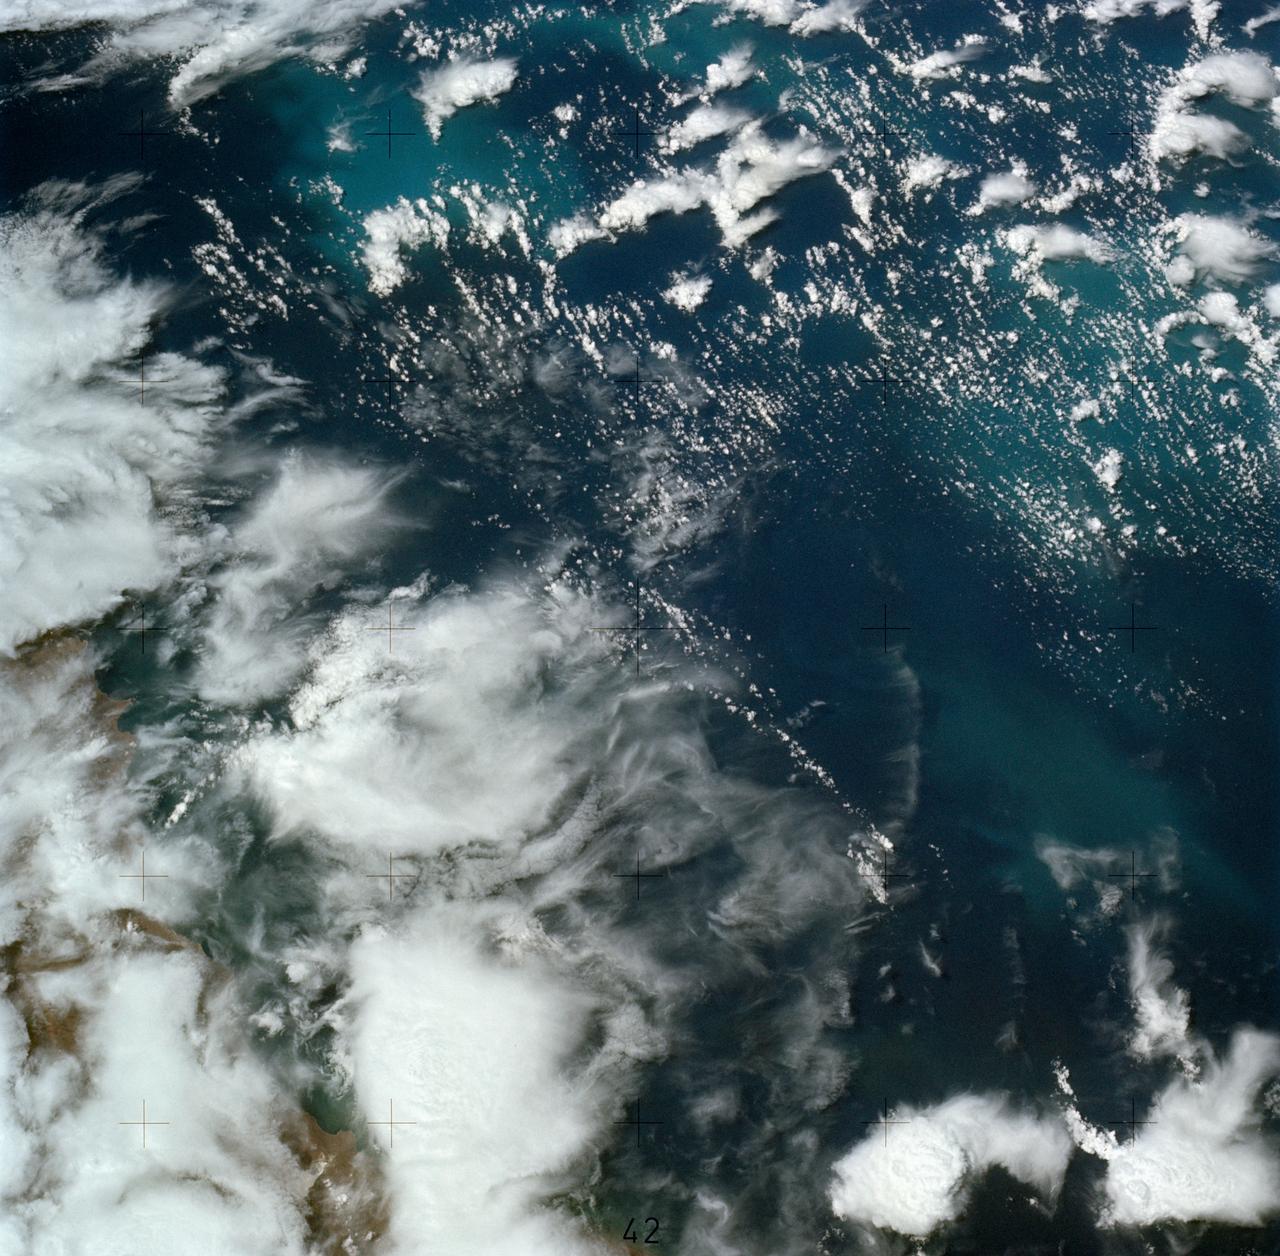
SL4-137-3608 (14 Dec. 1973) --- A view of cold water eddies in the Falkland Current off the South Atlantic coast of southern Argentina as seen from the Skylab space station in Earth orbit. This picture was taken by one of the Skylab 4 crewmen using a hand-held 70mm Hasselblad camera. This land area (left corner) extends south along the coast from Puerto Deseado (center left border) for about 50 miles. Within the ocean, several light blue areas are visible and represent the occurrence of plankton with the Falkland Current. Over the ocean, the cold water eddies are identified by the circular cloud-free areas within the cloud street pattern and bordered by cumulus cloud buildup (white). The cloud streets indicate the wind is from the southwest and do not form over eddies because energy form the atmosphere is absorbed by the cold ocean water. On the downwind side of the eddies, cumulus clouds tend to form as the cold moist air flows over the warmer water. Similar cloud and eddy features have been observed by the Skylab 4 crewmen in the Yucatan Current off Yucatan Peninsula and in some parts of the South Pacific. Studies are underway by Dr. George Maul, NOAA, and Dr. Robert Stevenson, ONR, to determine the significance of the cold water eddies to ocean dynamics. Photo credit: NASA
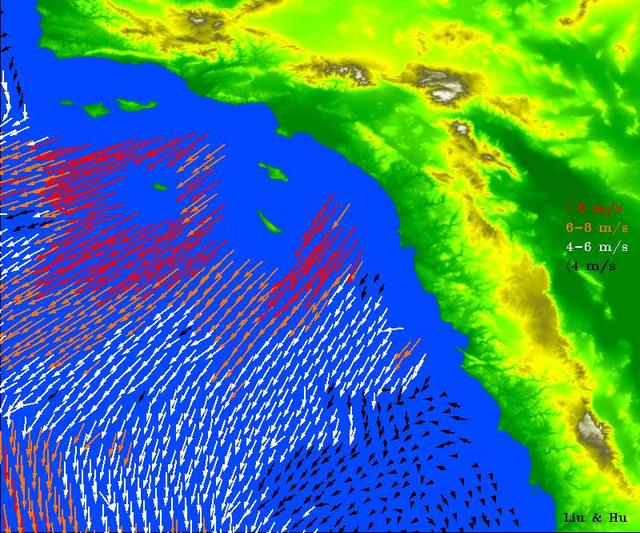
High-resolution ocean surface wind data from NASA's Quick Scatterometer (QuikScat) illustrate the strength of Santa Ana winds that pounded Southern California this week, causing damage and spreading brush fires. The colored arrows represent various ranges of wind speed, which were still well in excess of 30 knots (34 miles per hour), even after reaching the ocean and weakening. Santa Ana winds are offshore and down-slope winds unique to Southern California that are usually channeled through mountain gaps. These Santa Ana winds extend more than 500 kilometers (310 miles) offshore before changing direction to flow along the shore. The wind speeds and directions are retrieved from range-compressed backscatter data measured by QuikScat that has much higher spatial resolution than QuikScat's standard data products. Useful applications of high-resolution science-quality wind products derived from range-compressed backscatter have been demonstrated in two scientific papers: one on Hurricane Floyd and the other on Catalina Eddies. This is the first demonstration on near-real-time retrieval applications. http://photojournal.jpl.nasa.gov/catalog/PIA03892
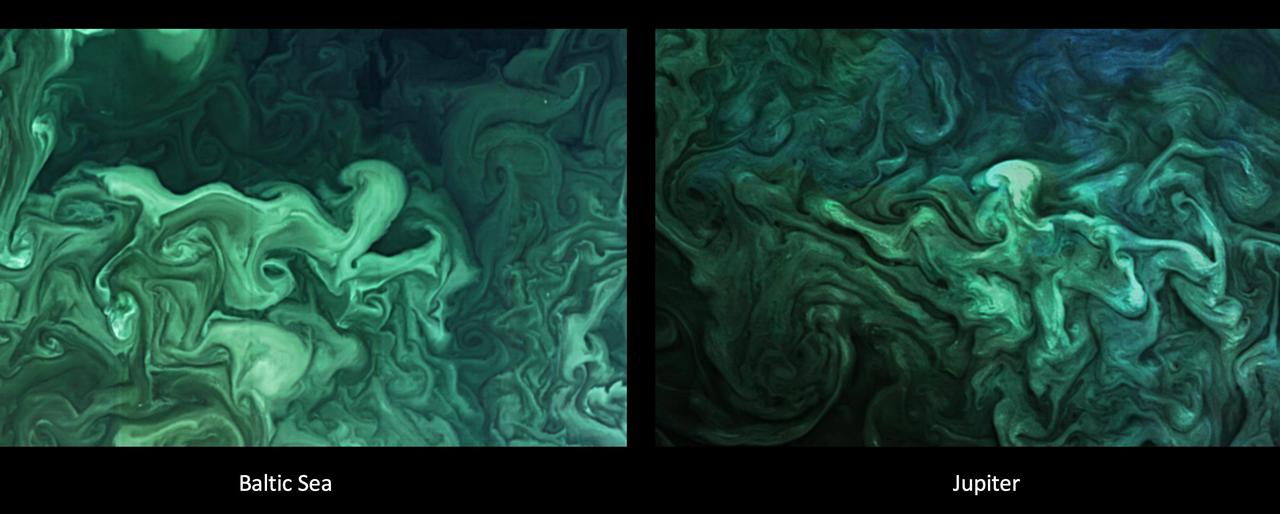
The left image shows a close-up of a phytoplankton blooming in the southern Gulf of Bothnia, in the Baltic Sea, between Sweden and Finland on April 14, 2019. The right image shows turbulent clouds in Jupiter's atmosphere. Jupiter's atmosphere is one of the most turbulent places in the solar system. Orbiting Jupiter and its 79 moons is NASA's Juno spacecraft, which sends images from the largest planet in our solar system back to researchers on Earth. These images from Juno have given oceanographers the raw materials to study the rich turbulence at Jupiter's poles and the physical forces that drive large cyclones on Jupiter. Lia Siegelman, a physical oceanographer and postdoctoral scholar at Scripps Institution of Oceanography at the University of California San Diego, observed similarities between the richness of turbulence around Jovian cyclones and the filaments around smaller eddies with turbulence seen in Earth's oceans. https://photojournal.jpl.nasa.gov/catalog/PIA25034
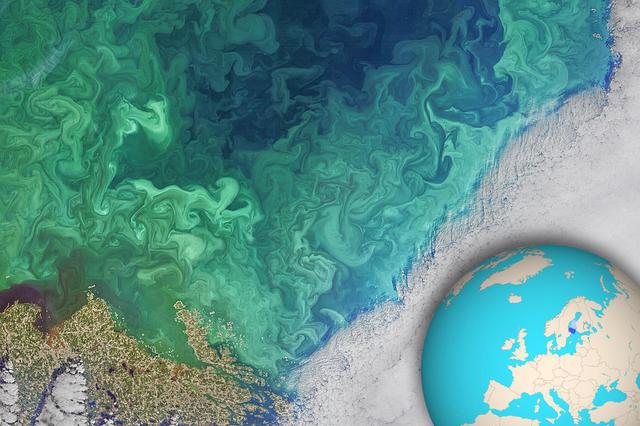
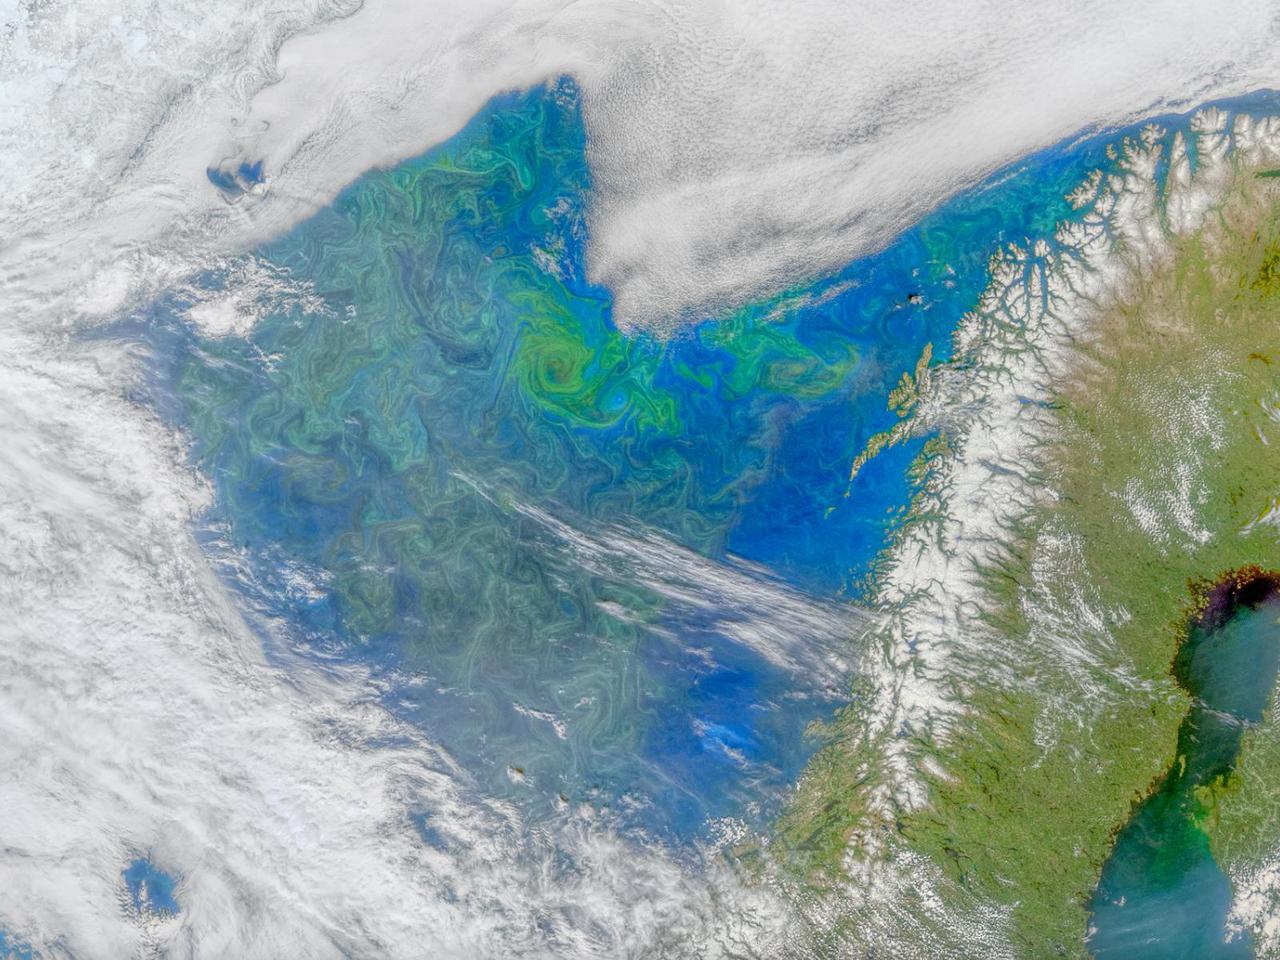
NASA's Landsat 8 satellite collected this view of phytoplankton blooming in the southern Gulf of Bothnia, in the Baltic Sea, between Sweden and Finland on April 14, 2019. Jupiter's atmosphere is one of the most turbulent places in the solar system. Orbiting Jupiter and its 79 moons is NASA's Juno spacecraft, which sends images from the largest planet in our solar system back to researchers on Earth. These images from Juno have given oceanographers the raw materials to study the rich turbulence at Jupiter's poles and the physical forces that drive large cyclones on the gas giant. Lia Siegelman, a physical oceanographer and postdoctoral scholar at Scripps Institution of Oceanography at the University of California, San Diego, observed similarities between the richness of turbulence around Jovian cyclones and the filaments around smaller eddies with turbulence seen in Earth's oceans. These similarities between the phenomena on Earth and Jupiter are especially evident on high-resolution images of plankton blooms, as seen above. https://photojournal.jpl.nasa.gov/catalog/PIA25033
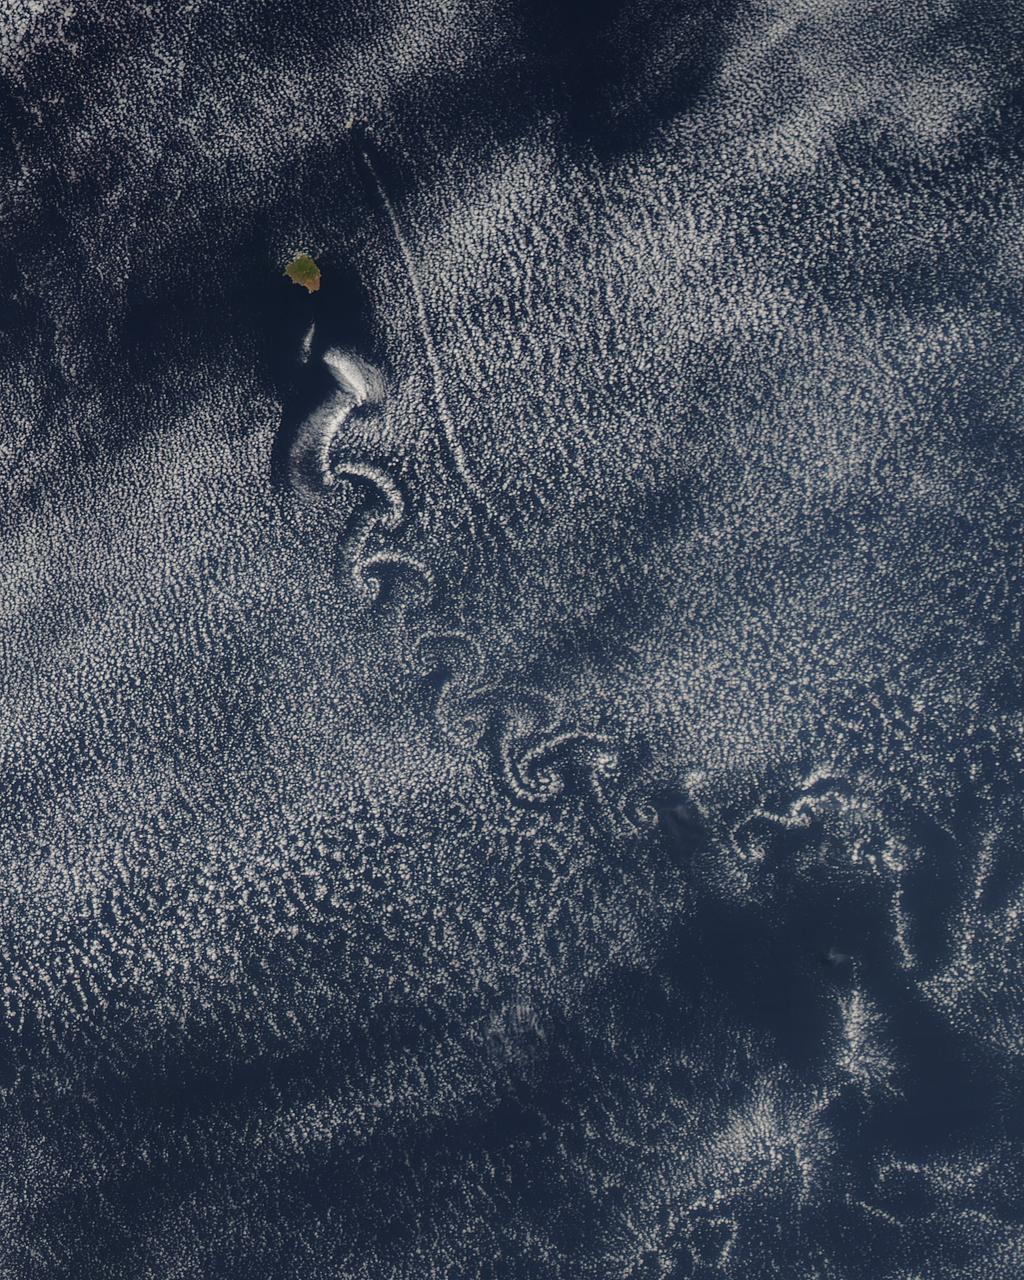
Theodore von Kármán, a Hungarian-American physicist, was the first to describe the physical processes that create long chains of spiral eddies like the one shown above. Known as von Kármán vortices the patterns can form nearly anywhere that fluid flow is disturbed by an object. Since the atmosphere behaves like a fluid, the wing of an airplane, a bridge, even an island can trigger the distinctive phenomenon. On May 22, 2013, the Moderate Resolution Imaging Spectroradiometer (MODIS) on NASA’s Terra satellite captured this natural-color image of cloud vortices behind Isla Socorro, a volcanic island located in the Pacific Ocean. The island, which is located a few hundred kilometers off the west coast of Mexico and the southern tip of Baja California, is part of the Revillagigedo Archipelago. Satellite sensors have spotted von Kármán vortices around the globe, including off of Guadalupe Island, near the coast of Chile, in the Greenland Sea, in the Arctic, and even next to a tropical storm. NASA image courtesy Jeff Schmaltz, LANCE/EOSDIS MODIS Rapid Response Team at NASA GSFC. Caption by Adam Voiland. Instrument: Terra - MODIS More info: <a href="http://1.usa.gov/14VSDQa" rel="nofollow">1.usa.gov/14VSDQa</a> Credit: <b><a href="http://www.earthobservatory.nasa.gov/" rel="nofollow"> NASA Earth Observatory</a></b> <b><a href="http://www.nasa.gov/audience/formedia/features/MP_Photo_Guidelines.html" rel="nofollow">NASA image use policy.</a></b> <b><a href="http://www.nasa.gov/centers/goddard/home/index.html" rel="nofollow">NASA Goddard Space Flight Center</a></b> enables NASA’s mission through four scientific endeavors: Earth Science, Heliophysics, Solar System Exploration, and Astrophysics. Goddard plays a leading role in NASA’s accomplishments by contributing compelling scientific knowledge to advance the Agency’s mission. <b>Follow us on <a href="http://twitter.com/NASA_GoddardPix" rel="nofollow">Twitter</a></b> <b>Like us on <a href="http://www.facebook.com/pages/Greenbelt-MD/NASA-Goddard/395013845897?ref=tsd" rel="nofollow">Facebook</a></b> <b>Find us on <a href="http://instagram.com/nasagoddard?vm=grid" rel="nofollow">Instagram</a></b>