
NASA Aura spacecraft sees El Niño effects on the atmosphere. An El Niño is characterized by an abnormal warming of sea surface temperatures in the equatorial central and eastern Pacific Ocean.
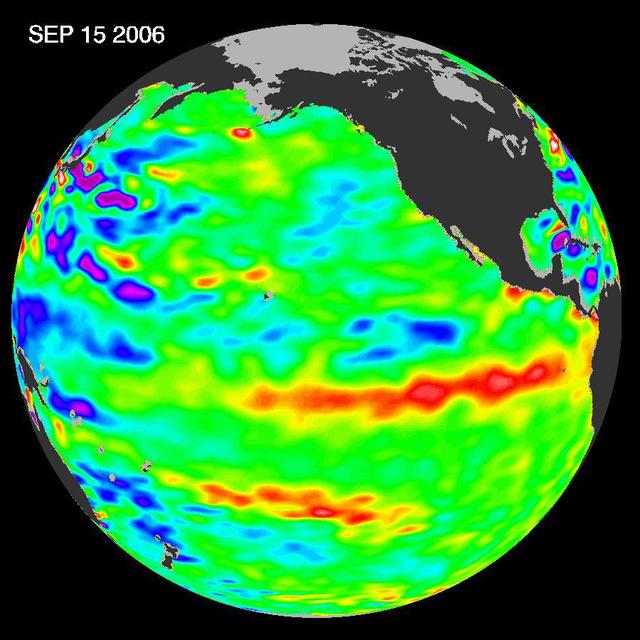
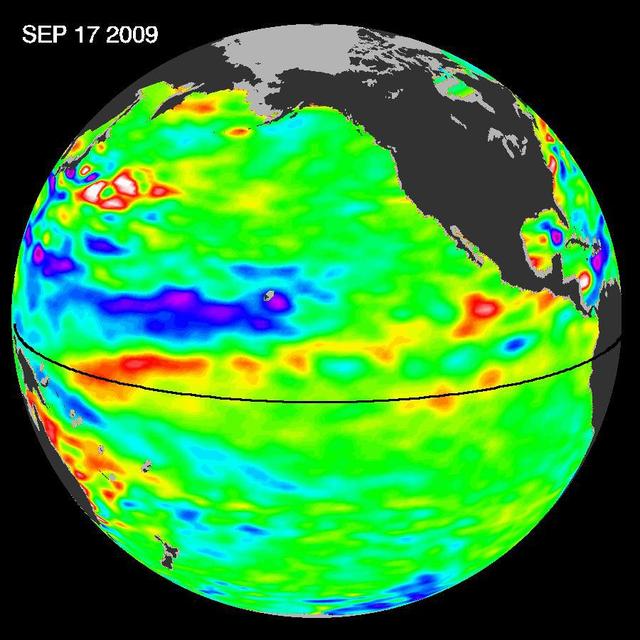
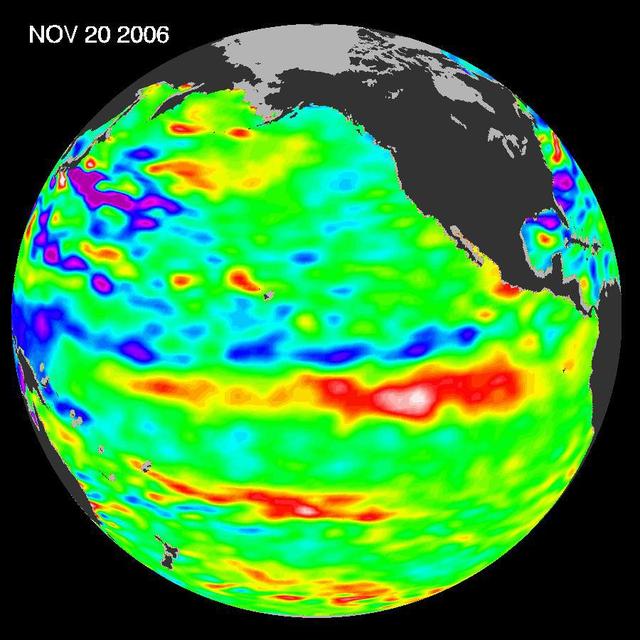
In September 2006, NASA satellite data indicated that El Niño had returned to the tropical Pacific Ocean, although it was relatively weak.
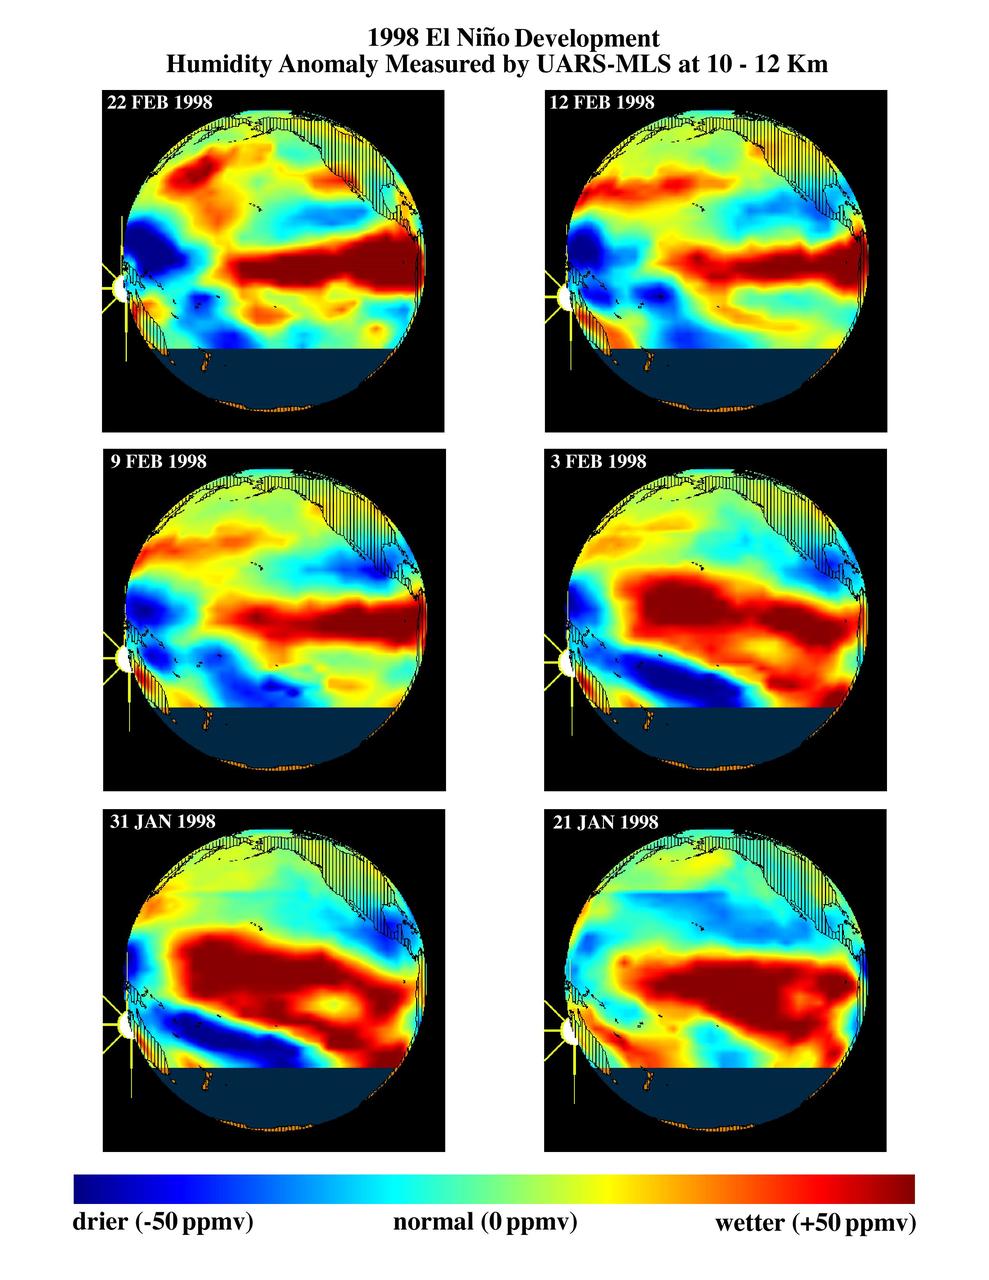
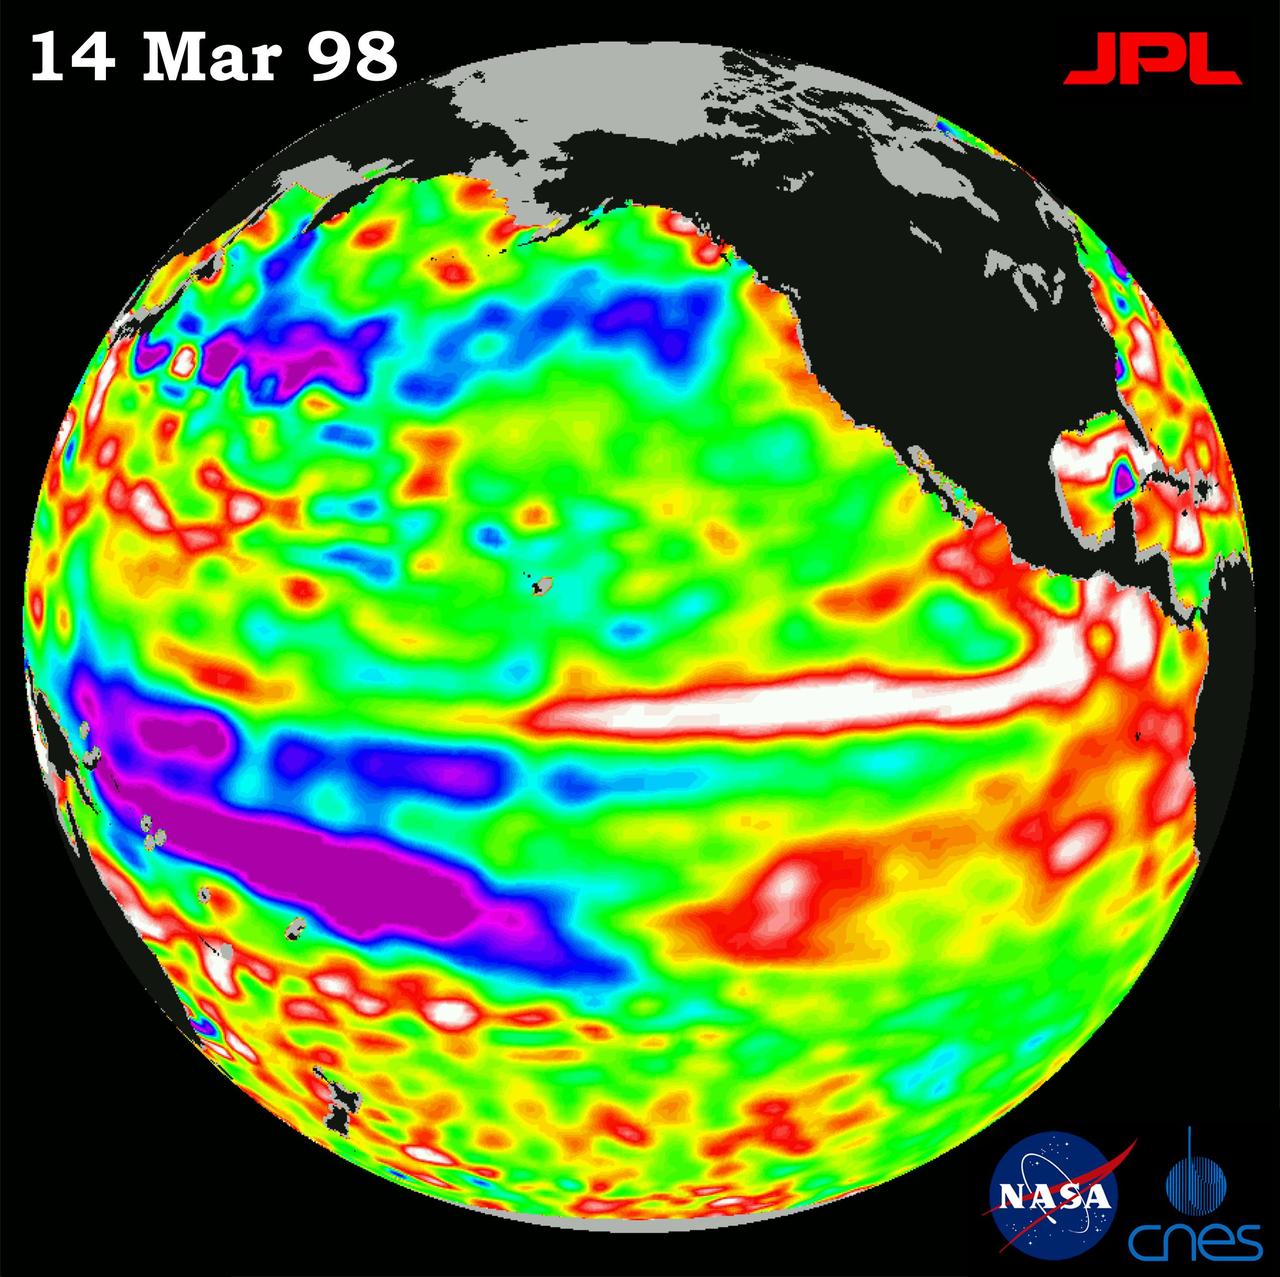
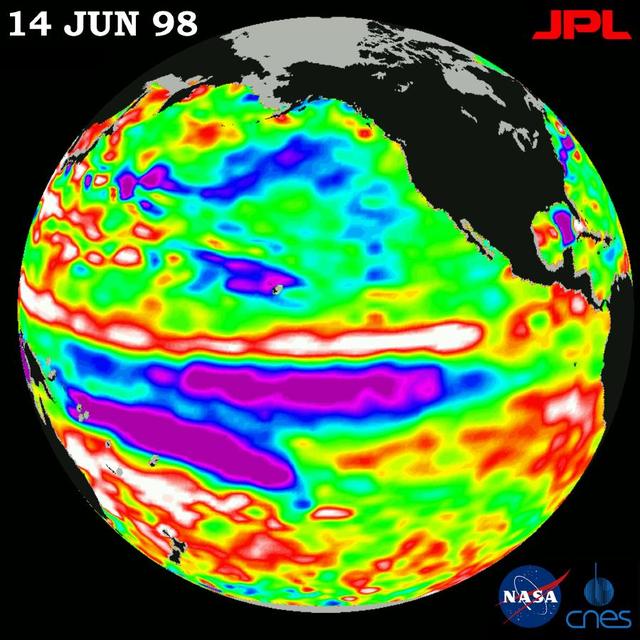
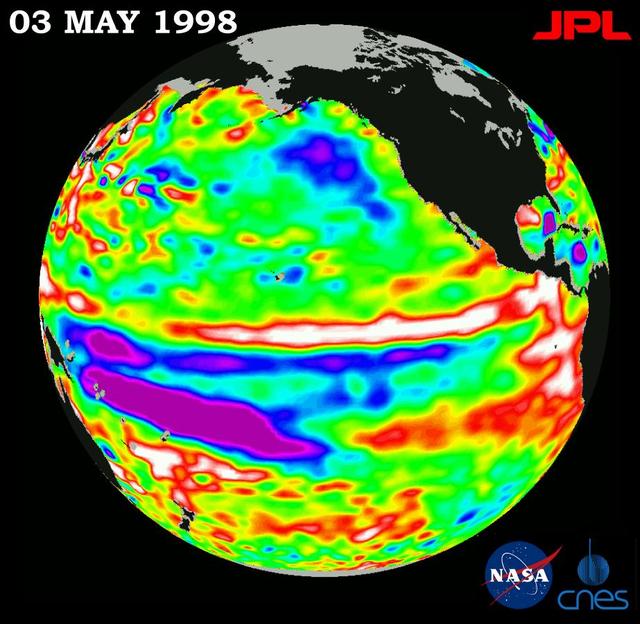
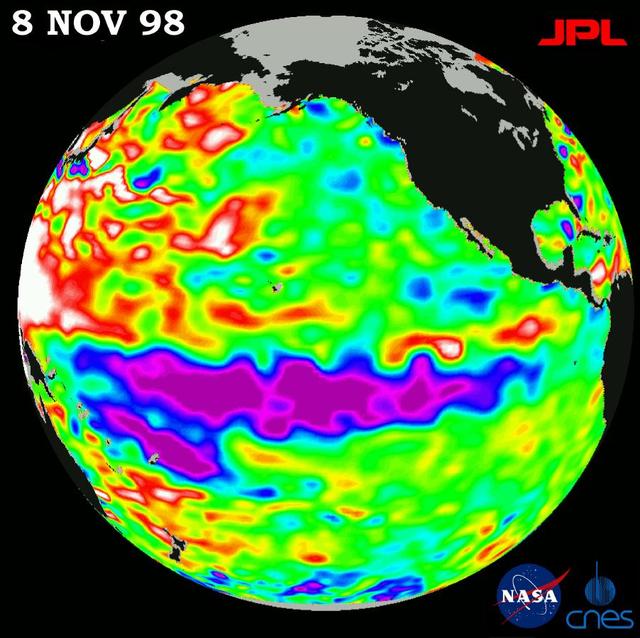
This series of six images shows the evolution of atmospheric water vapor over the Pacific Ocean during the 1998 El Niño condition.
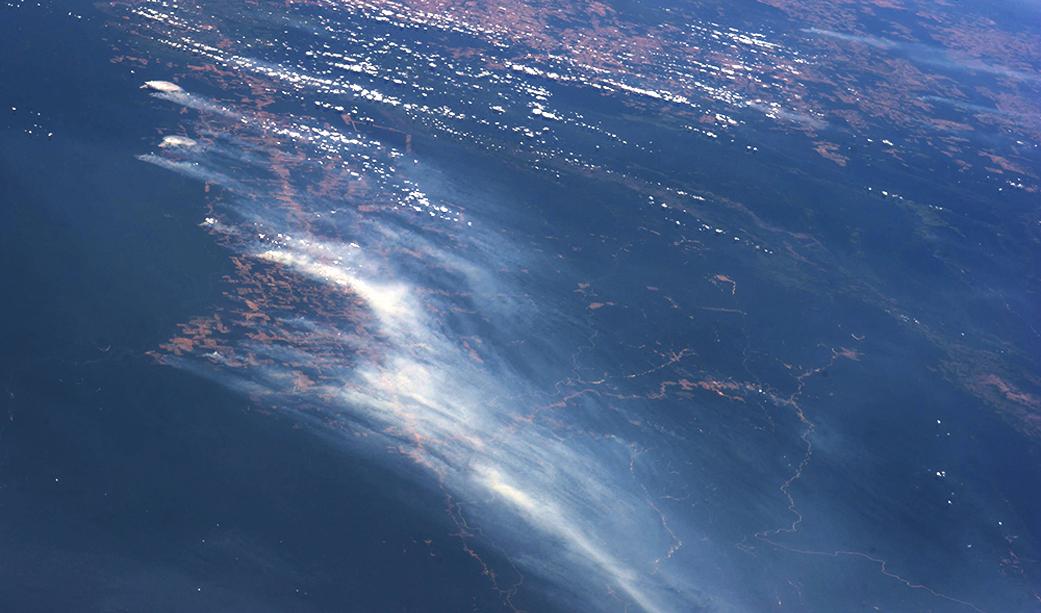
El Niño conditions in 2015 and early 2016 altered rainfall patterns around the world. In the Amazon, El Niño reduced rainfall during the wet season, leaving the region drier at the start of the 2016 dry season than any year since 2002, according to NASA satellite data. Wildfire risk for the dry season months of July to October this year now exceeds fire risk in 2005 and 2010, drought years when wildfires burned large areas of Amazon rainforest, said Doug Morton, an Earth scientist at NASA’s Goddard Space Flight Center who helped create the fire forecast. "Severe drought conditions at the start of the dry season set the stage for extreme fire risk in 2016 across the southern Amazon," Morton said. The Amazon fire forecast uses the relationship between climate and active fire detections from NASA satellites to predict fire season severity during the region’s dry season. Developed in 2011 by scientists at University of California, Irvine and NASA’s Goddard Space Flight Center, the forecast model is focused particularly on the link between sea surface temperatures and fire activity. Warmer sea surface temperatures in the tropical Pacific (El Niño) and Atlantic oceans shift rainfall away from the Amazon region, increasing the risk of fires during dry season months. Read more: <a href="http://go.nasa.gov/2937ADt" rel="nofollow">go.nasa.gov/2937ADt</a> <b><a href="http://www.nasa.gov/audience/formedia/features/MP_Photo_Guidelines.html" rel="nofollow">NASA image use policy.</a></b> <b><a href="http://www.nasa.gov/centers/goddard/home/index.html" rel="nofollow">NASA Goddard Space Flight Center</a></b> enables NASA’s mission through four scientific endeavors: Earth Science, Heliophysics, Solar System Exploration, and Astrophysics. Goddard plays a leading role in NASA’s accomplishments by contributing compelling scientific knowledge to advance the Agency’s mission. <b>Follow us on <a href="http://twitter.com/NASAGoddardPix" rel="nofollow">Twitter</a></b> <b>Like us on <a href="http://www.facebook.com/pages/Greenbelt-MD/NASA-Goddard/395013845897?ref=tsd" rel="nofollow">Facebook</a></b> <b>Find us on <a href="http://instagrid.me/nasagoddard/?vm=grid" rel="nofollow">Instagram</a></b>

A NASA remotely piloted Global Hawk aircraft completes a flight in February 2015 to support the National Oceanic and Atmospheric Administration’s El Niño Rapid Response field campaign. The mission, called the Sensing Hazards Operational Unmanned Technology, gathered El Niño storm data over the Pacific Ocean. The flight originated from NASA’s Armstrong Flight Research Center in Edwards, California.
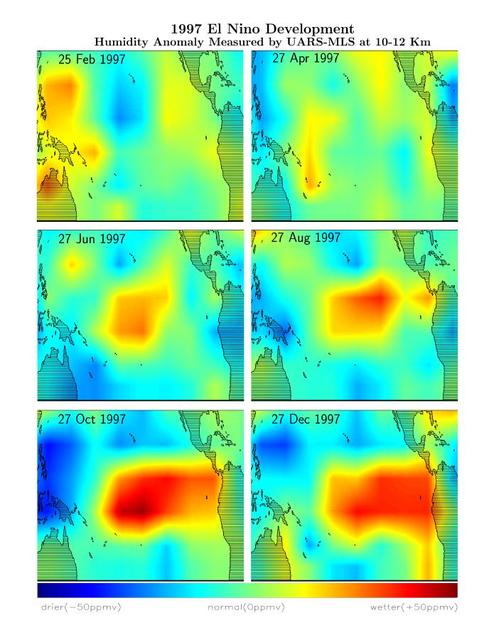
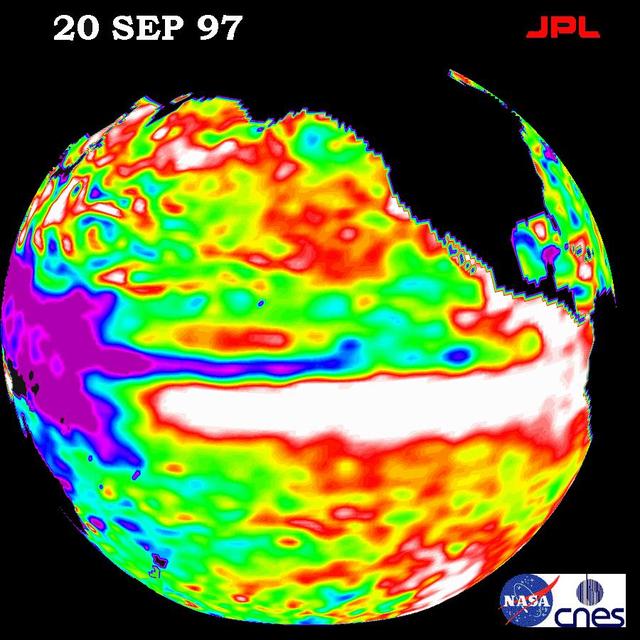
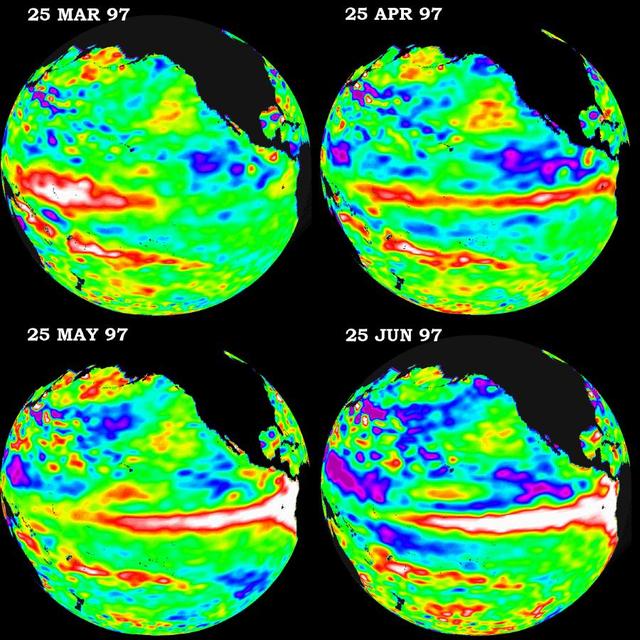
This series of six images shows the movement of atmospheric water vapor over the Pacific Ocean during the formation of the 1997 El Niño condition.
The Pacific Ocean doesnt show signs of anything that looks like the whopper El Niño of 1997-1998, according to the latest information from NASA U.S.-French ocean-observing satellite Topex/Poseidon.
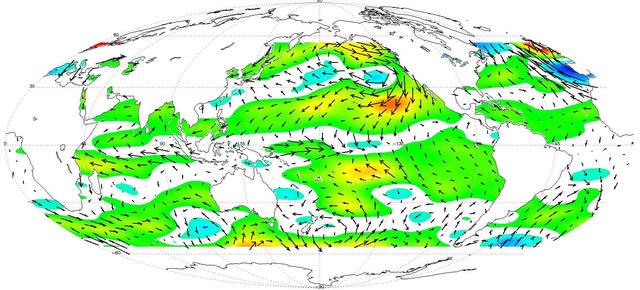
This image displays wind measurements taken by the satellite-borne NASA Scatterometer NSCAT during the last 10 days of May 1997, showing the relationship between the ocean and the atmosphere at the onset of the 1997-98 El Niño condition.
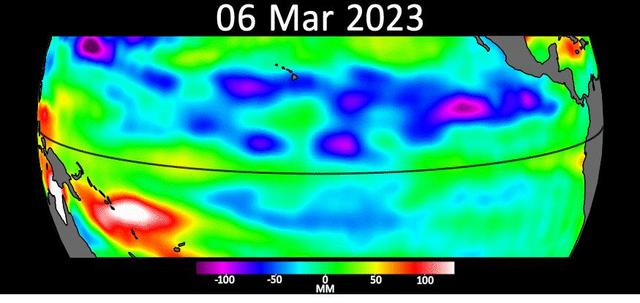
Sea level data from the U.S.-European satellite Sentinel-6 Michael Freilich shows early signs of a developing El Niño along the equatorial Pacific Ocean. The measurements show Kelvin waves, low waves that can be tens of miles (hundreds of kilometers) wide, moving from west to east at the equator towards the west coast of Ecuador. When they form at the equator, Kelvin waves can move warm water – associated with higher sea levels – from the western Pacific to the eastern Pacific. El Niño is a periodic climate phenomenon that can affect weather patterns around the world. The condition can bring cooler, wetter conditions to the U.S. Southwest and drought to countries in the western Pacific such as Indonesia and Australia. El Niño is characterized by higher sea levels and warmer-than-average ocean temperatures along the western coasts of North and South America. Water expands as it warms, so sea levels tend to be higher in places with warmer water. The climate phenomenon is also associated with a weakening of the trade winds. The Sentinel-6 Michael Freilich satellite data shown here covers a seven-week period between the beginning of March and the end of April 2023. By April 24, Figure A, Kelvin waves had piled up warmer water and higher sea levels (shown in red and white) off the coasts of Peru, Ecuador, and Columbia. A series of Kelvin waves starting in spring is a well-known precursor to an El Niño. The waves seen during March and April 2023 are similar to the ones that preceded the 1997-1998 El Niño, one of the most powerful in recorded history. Satellites like Sentinel-6 Michael Freilich can detect Kelvin waves with an instrument called an altimeter that uses radar signals to measure the height of the ocean's surface. Warmer areas show up as higher sea levels. The satellite, named after former NASA Earth Science Division Director Michael Freilich, is one of two that compose the Copernicus Sentinel-6/Jason-CS (Continuity of Service) mission. Animation available at https://photojournal.jpl.nasa.gov/catalog/PIA25776
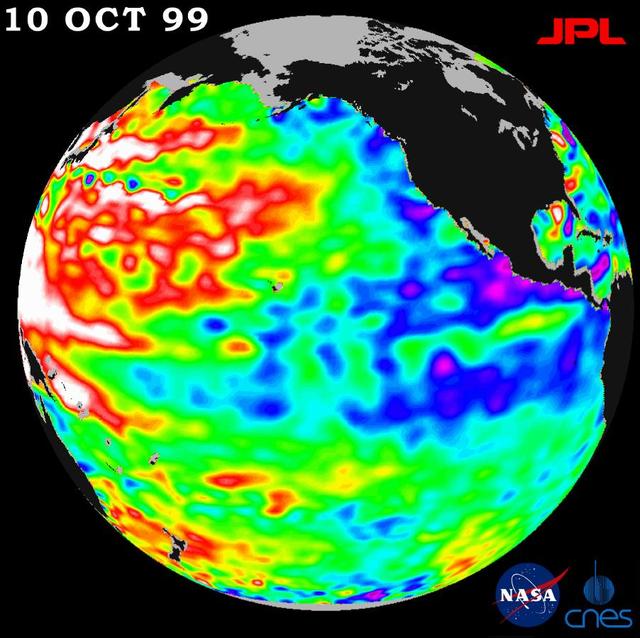
After three years of El Niño and La Niña, the Pacific is finally calming down in the tropics but still shows signs of being abnormal elsewhere, according to the satellite data from NASA U.S.-French TOPEX/Poseidon mission.
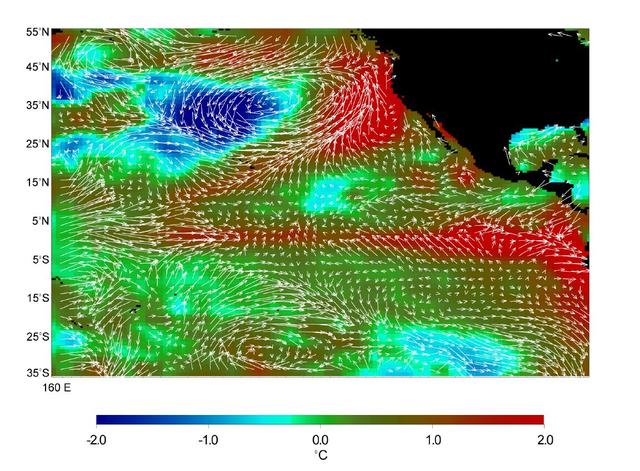
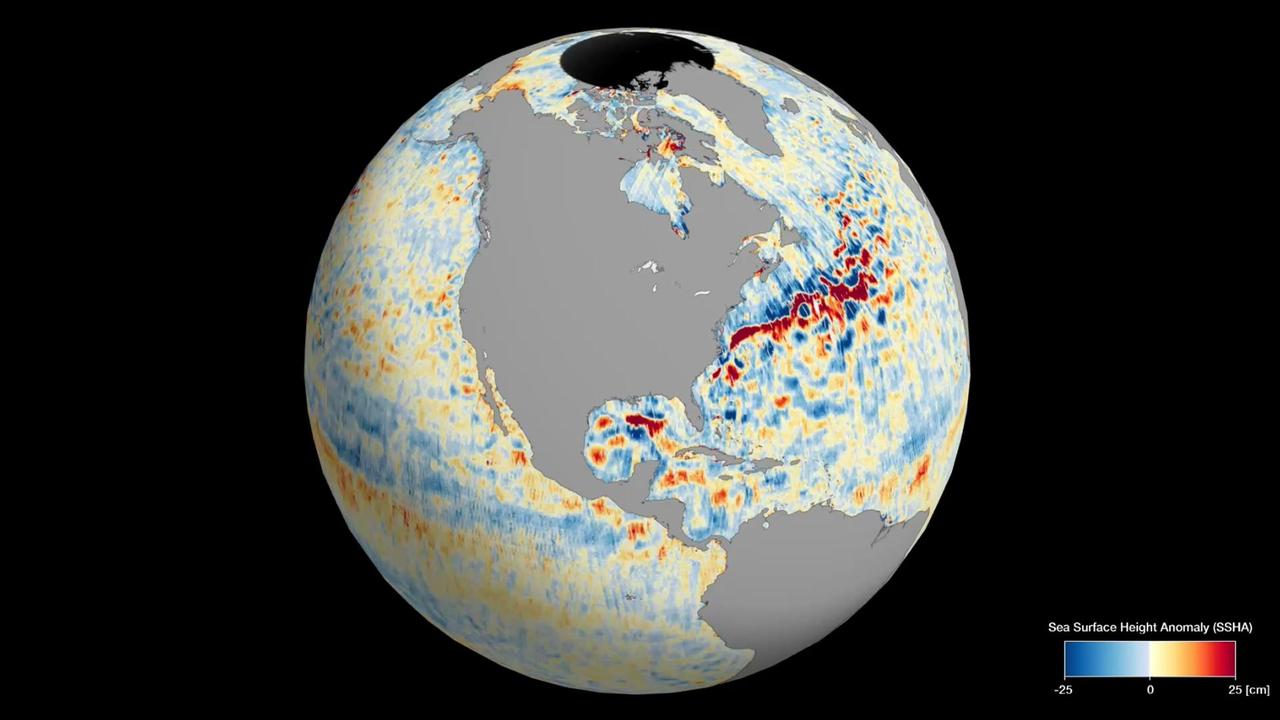
While El Niño events have a significant impact on the entire Earth System, they are most easily visible in measurements of sea surface temperature (SST), sea surface height (SSH) and ocean winds near the surface. In fact, the precursor and the main driver of El Niño events is manifested in the weakening of the normally westward blowing trade winds, or even their complete reversal to blow from west to east, in the Western and Central tropical Pacific. http://photojournal.jpl.nasa.gov/catalog/PIA20365
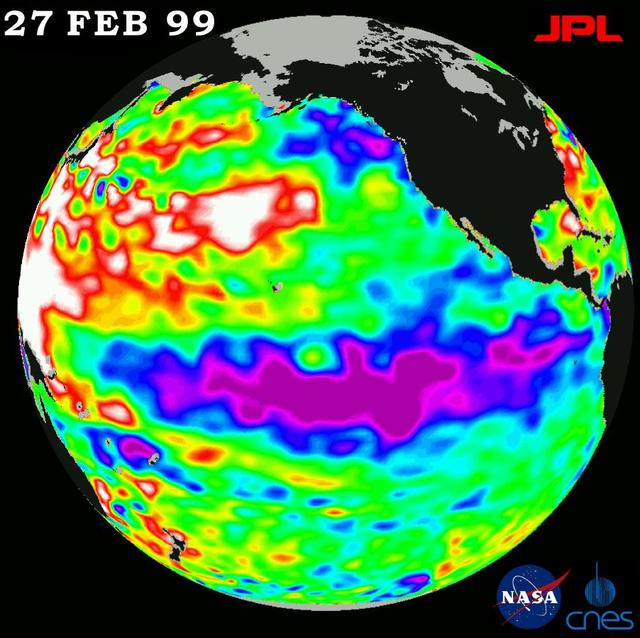
This image from NASA European Ocean Surface Topography Mission/Jason-2 shows that the moderate El Niño of the past year has officially bowed out, leaving his cool sibling, La Niña, poised to potentially take the equatorial stage.
These three maps based on satellite data show sea levels in the Pacific Ocean during developing El Niño events in early October of 1997, 2015, and 2023. Higher-than-average ocean heights are shown in red and white, while lower-than-average heights are blue and purple. The two earlier maps represent the two extreme El Niño events from the past 30 years – the first from 1997 to 1998 and the second from 2015 to 2016. Both caused shifts in global air and ocean temperatures, atmospheric wind and rainfall patterns, and sea level. El Niños are characterized by higher-than-normal sea levels and warmer-than-average ocean temperatures along the equatorial Pacific. Water expands as it warms, so sea levels tend to be higher in places with warmer water. These temperature and sea level conditions can then propagate poleward along the western coasts of the Americas. El Niños can bring wetter conditions to the U.S. Southwest and drought to regions in the western Pacific, including Indonesia. Not all El Niño events are created equal, however, and their impacts vary widely. Satellites like the U.S.-European Sentinel-6 Michael Freilich, which captured the 2023 data, help anticipate those impacts on a global scale by tracking changes in sea surface height in the Pacific Ocean. The TOPEX/Poseidon satellite collected the 1997 data while Jason-2 collected data for the 2015 event. This year's El Niño is still developing, but researchers are looking to the recent past for clues as to how it is shaping up. By October 1997 and 2015, large areas of the central and eastern Pacific had sea levels more than 7 inches (18 centimeters) higher than normal. This year, sea levels are about 2 or 3 inches (5 to 8 centimeters) higher than normal and are elevated over a smaller area compared to the 1997 and 2015 events. Both of the past El Niños reached peak strength in late November or early December, so this year's event may still intensify. Launched in November 2020, Sentinel-6 Michael Freilich is named after former NASA Earth Science Division Director Michael Freilich. The satellite is one of two that compose the Copernicus Sentinel-6/Jason-CS (Continuity of Service) mission. Animation available at https://photojournal.jpl.nasa.gov/catalog/PIA26099
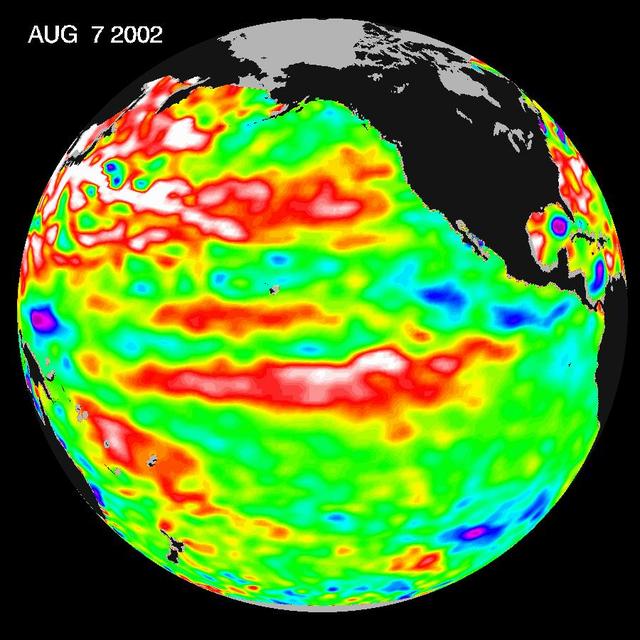
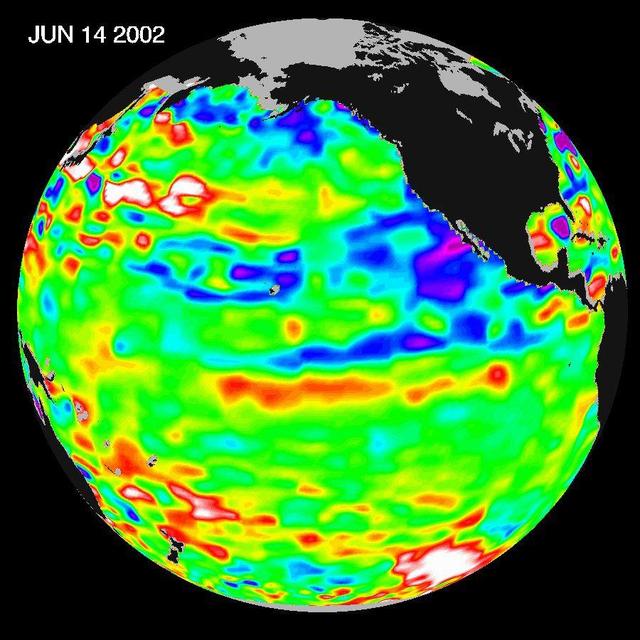
This Topex/Poseidon image of sea-surface heights was taken during a 10-day collection cycle ending August 7, 2002. Sea-surface heights are a measure of how much heat is stored in the ocean below to influence future planetary climate events. Since May 2001, there have been a series of warm Kelvin waves--eastward-moving ocean waves that cross the equatorial Pacific in about two months. A sizable one arrived at the South American coast last February, raising the ocean temperature by 2 degrees Celsius (3.6 degrees Fahrenheit) and triggering the National Oceanic and Atmospheric Administration's forecast for a mild El Niño in 2002. There was another wave in June, followed by the current large pool of warm water in the tropical Pacific that is now moving toward the coast of South America at a speed of 215 kilometers (134 miles) a day and will arrive there in three to four weeks, raising ocean temperatures. Scientists will continue to monitor the Pacific closely for further signs of El Niño formation and intensity. http://photojournal.jpl.nasa.gov/catalog/PIA03855
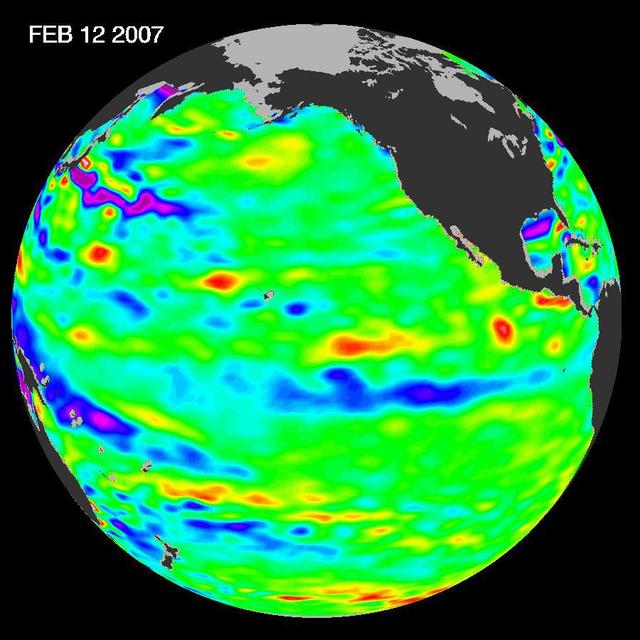
New data of sea-level heights from early February, 2007, by the Jason altimetric satellite show that the tropical Pacific Ocean has transitioned from a warm El Niño to a cool La Niña condition during the prior two months

Photo of NASA's Jet Propulsion Laboratory nestled in the Pasadena, Calif. hillside, taken in January, 2016.
Since the weak El Niño event of last winter, the equatorial Pacific has cooled and oceanographers have been on a La Niña watch. Thus far, equatorial waters have seesawed between cooling and the present slight warming.
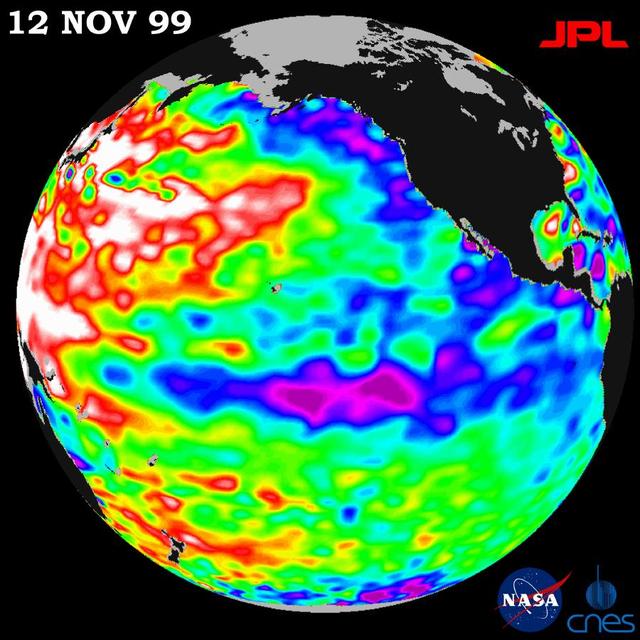
Like fall and winter of 2000, this year NASA Topex/Poseidon satellite data shows that the Pacific ocean continues to be dominated by the strong Pacific Decadal Oscillation, which is larger than the El Niño/La Niña pattern.
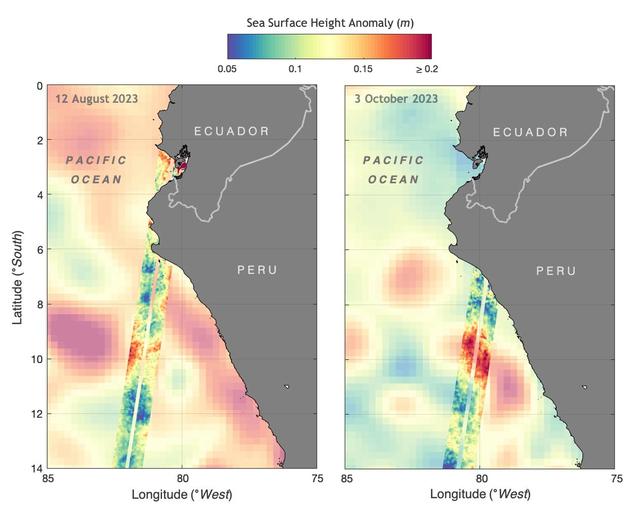
The illustration above shows sea levels off the coasts of Peru and Ecuador on Aug. 12, 2023, and Oct. 3, 2023. The Surface Water and Ocean Topography (SWOT) satellite collected the ocean data during its operational phase, which began in late July. The red and orange colors represent sea levels that are higher than average (units are in meters), while green and blue indicate sea levels that are lower than average. The SWOT data shows some of the development of an El Niño along the west coast of the Americas. The SWOT science team made the measurements using the spacecraft's Ka-band Radar Interferometer (KaRIn) instrument. With two antennas spread 33 feet (10 meters) apart on a boom, KaRIn produces a pair of data swaths (tracks visible in the animation) as it circles the globe, bouncing radar pulses off the water's surface to collect surface-height measurements. Launched on Dec. 16, 2022, from Vandenberg Space Force Base in central California, SWOT is now in its operations phase, measuring the height of nearly all water on Earth's surface. The satellite will provide one of the most detailed, comprehensive views yet of the planet's oceans and fresh water lakes and rivers, collecting data that will be used for research and other purposes. https://photojournal.jpl.nasa.gov/catalog/PIA26181

Associate Administrator for NASA's Science Mission Directorate and former astronaut John M. Grunsfeld talked to the attendees of the The American Geophysical Union (AGU) meet at the Moscone Center in San Francisco, California. New results presented at the meeting show atmospheric rivers, significant sources of rainfall, tend to intensify during Nino events, and this years strong El Nino likely will bring more precipitation to California and some relief for the drought.
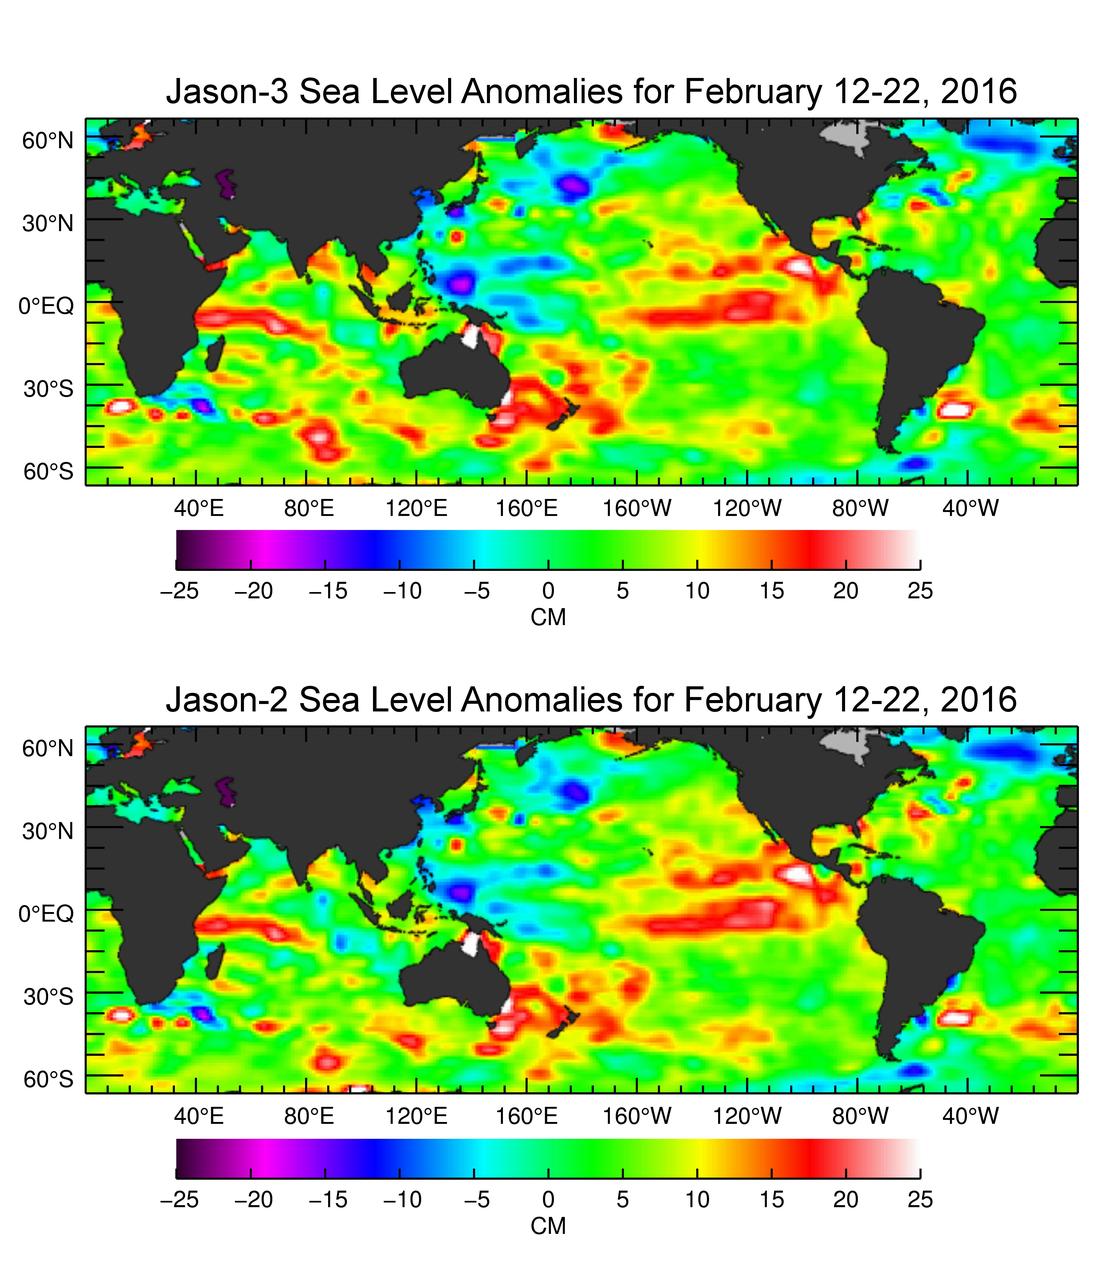
The U.S./European Jason-3 satellite has produced its first map of sea surface height, which corresponds well to data from its predecessor, Jason-2. Higher-than-normal sea levels are red; lower-than-normal sea levels are blue. El Niño is visible as the red blob in the eastern equatorial Pacific. Extending the timeline of ocean surface topography measurements begun by the Topex/Poseidon and Jason 1 and 2 satellites, Jason 3 will make highly detailed measurements of sea-level on Earth to gain insight into ocean circulation and climate change. http://photojournal.jpl.nasa.gov/catalog/PIA20532
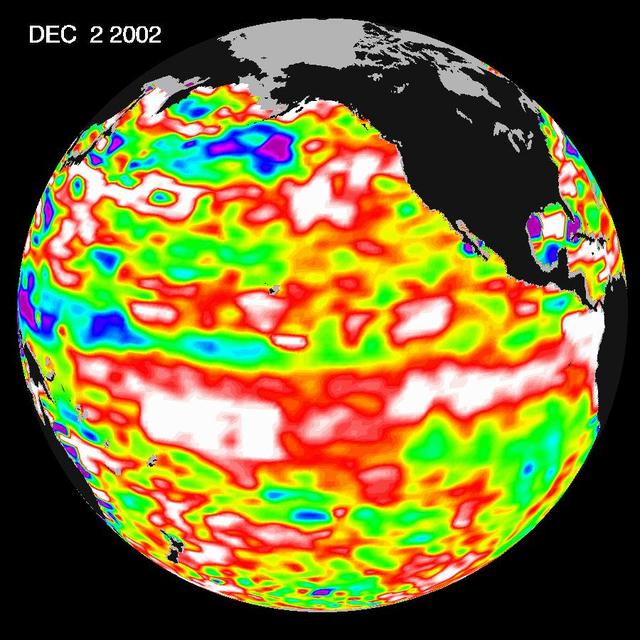
The latest image from NASA Jason oceanography satellite, taken during a 10-day collection cycle ending December 2, 2002, shows the Pacific dominated by two significant areas of higher-than-normal sealevel warmer ocean temperatures.
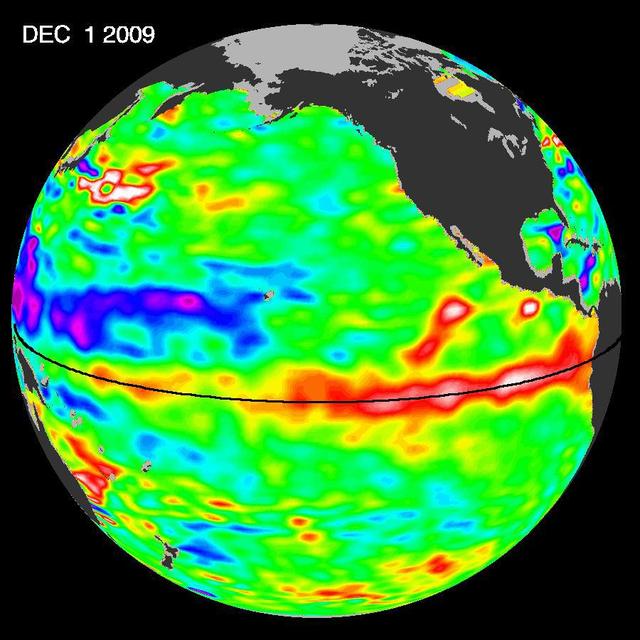
Pools of warm water known as Kelvin waves can be seen traveling eastward along the equator black line in this image from the NASA/French Space Agency Ocean Surface Topography Mission/Jason-2 satellite.
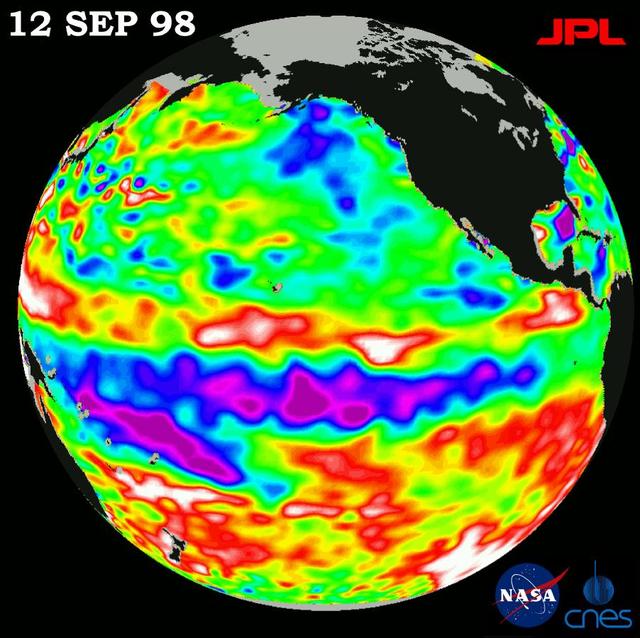
This image of the Pacific Ocean was produced using sea surface height measurements taken by NASA U.S.-French TOPEX/Poseidon satellite.
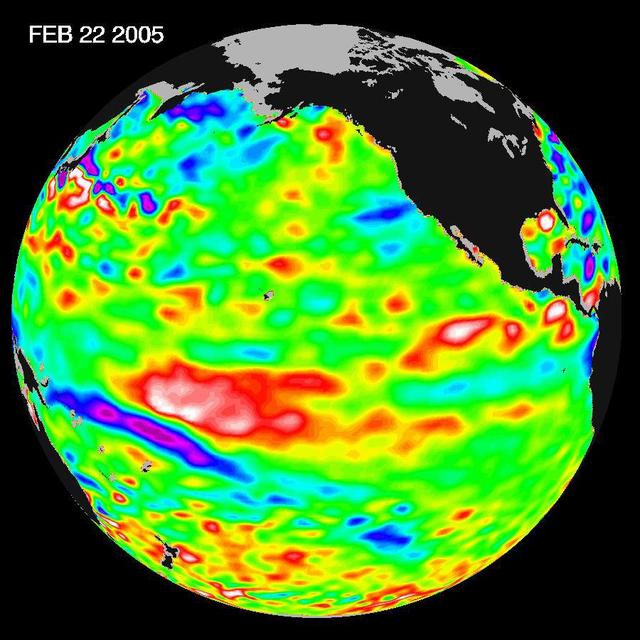
Recent sea-level height data from NASA U.S./France Jason altimetric satellite during a 10-day cycle ending February 22, 2005, show that the central equatorial Pacific continues to exhibit an area of higher-than-normal sea surface heights.
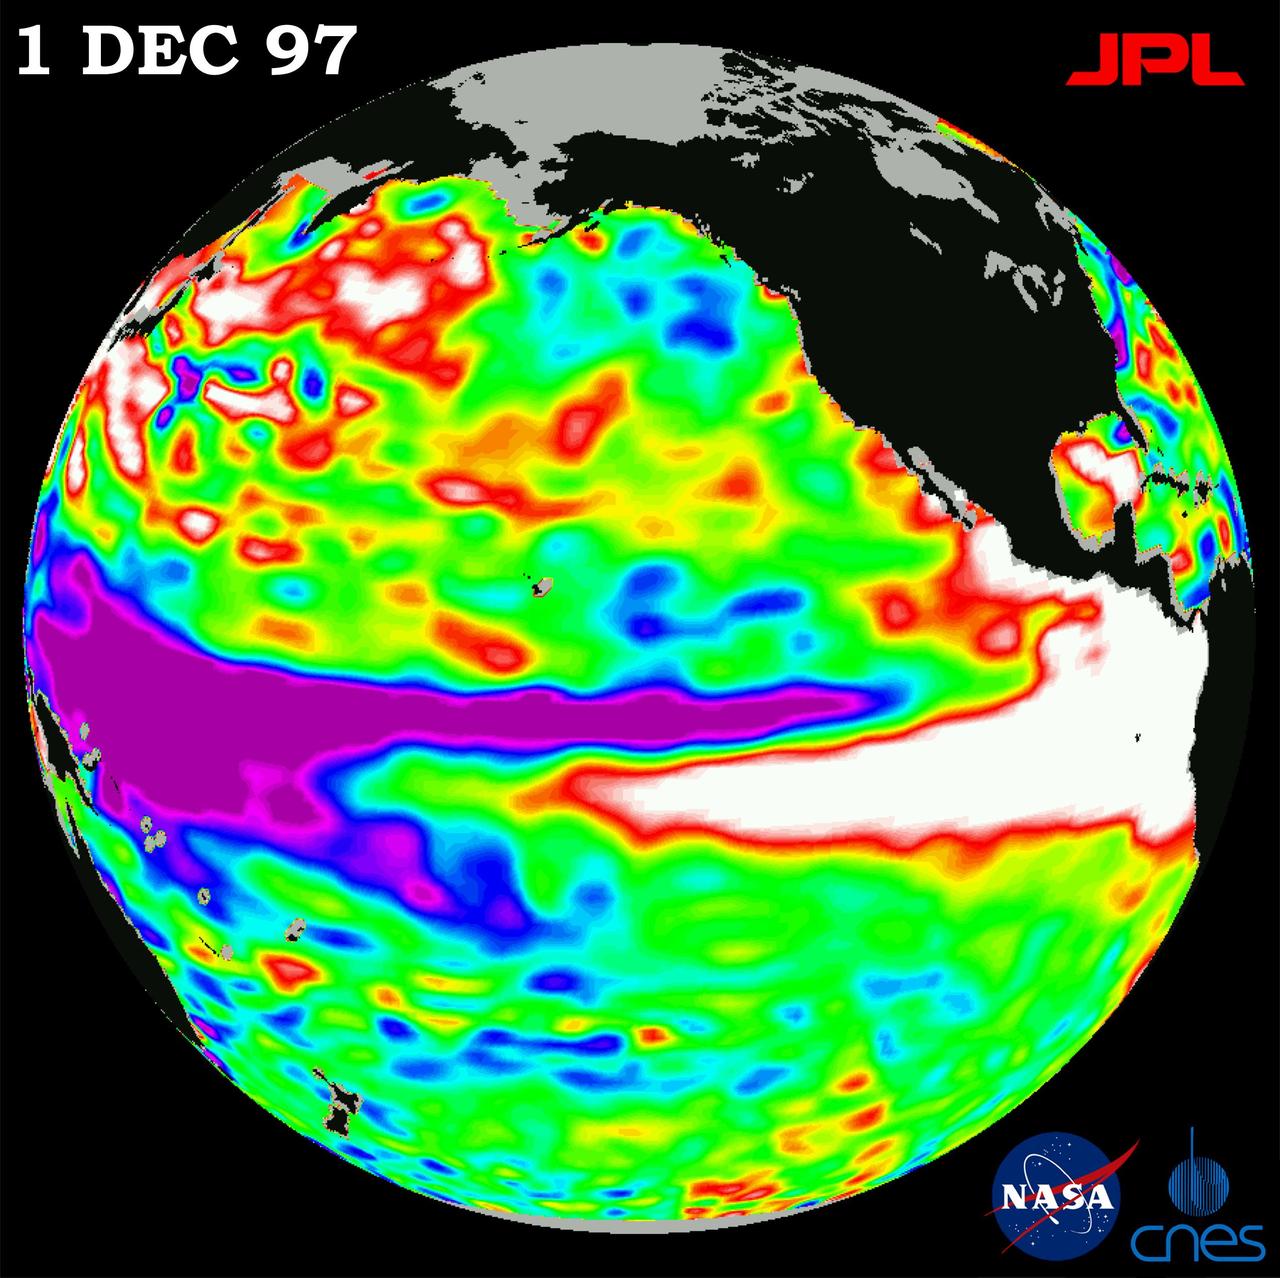
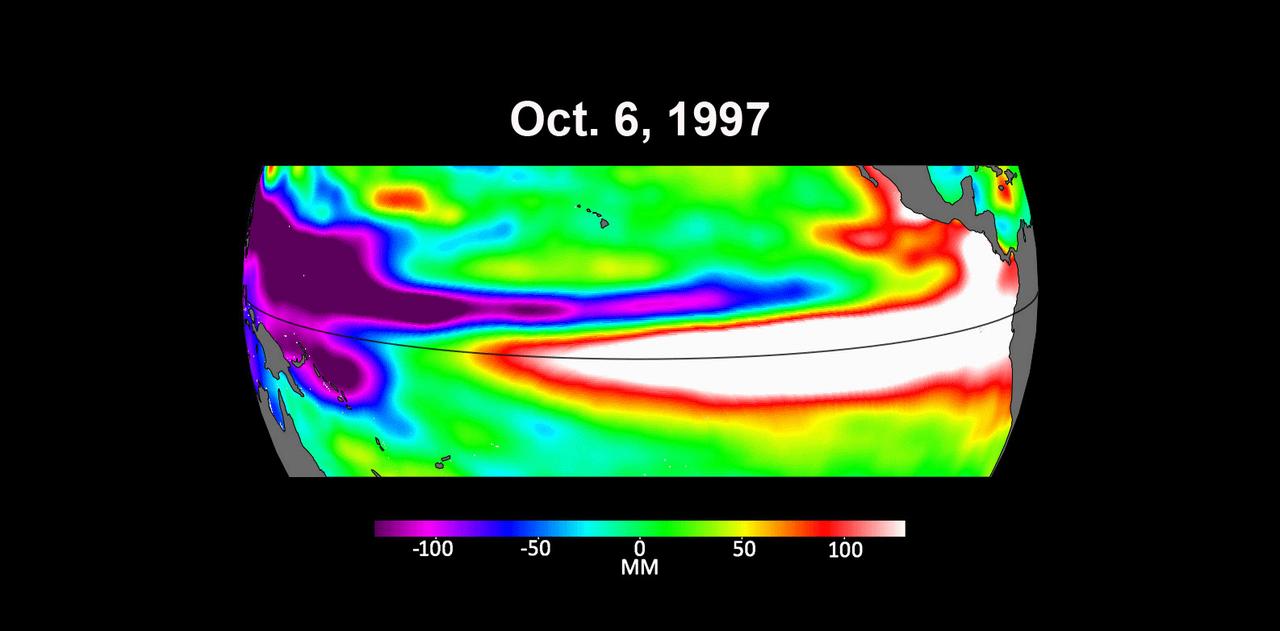
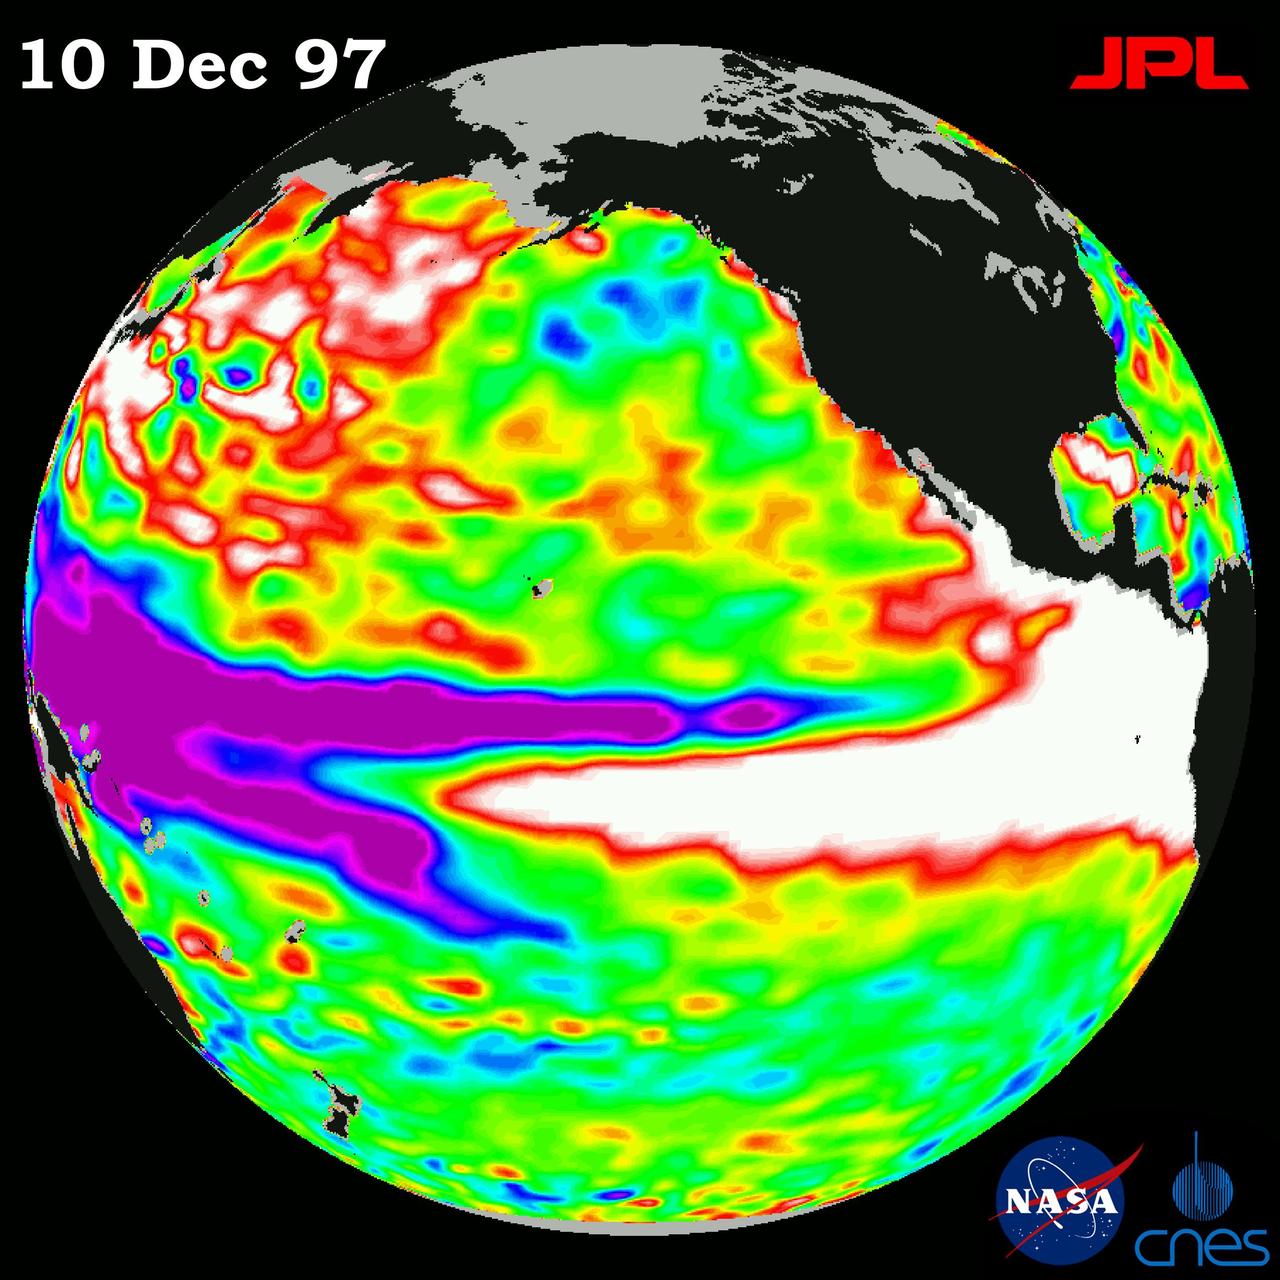
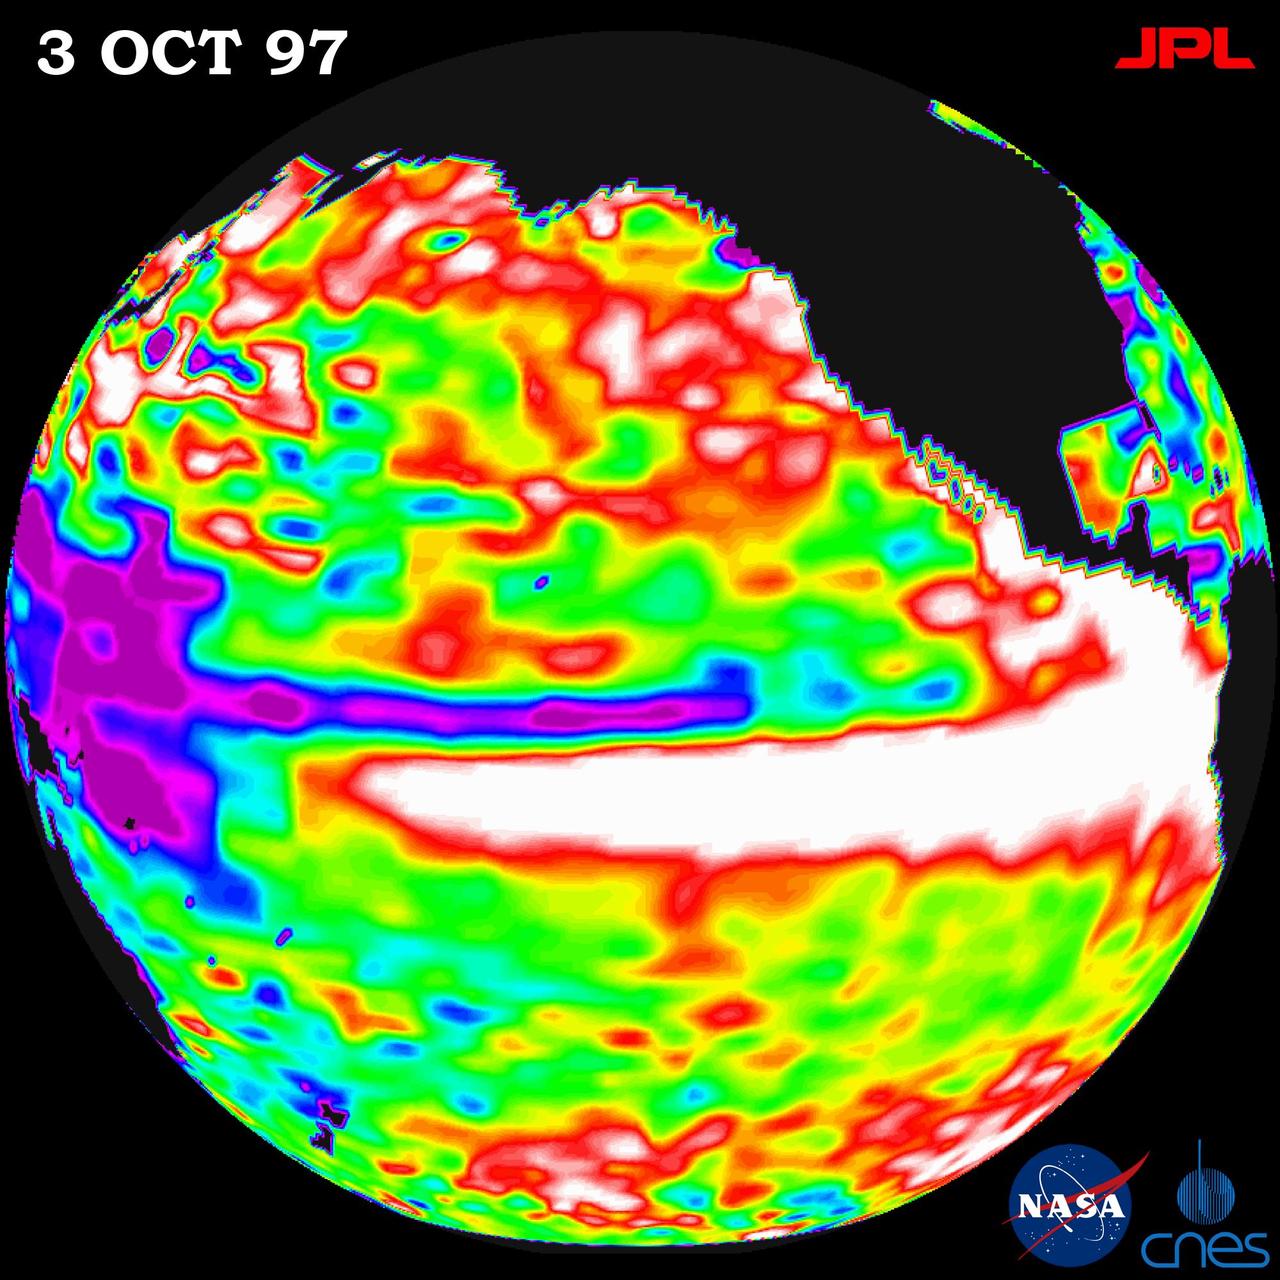
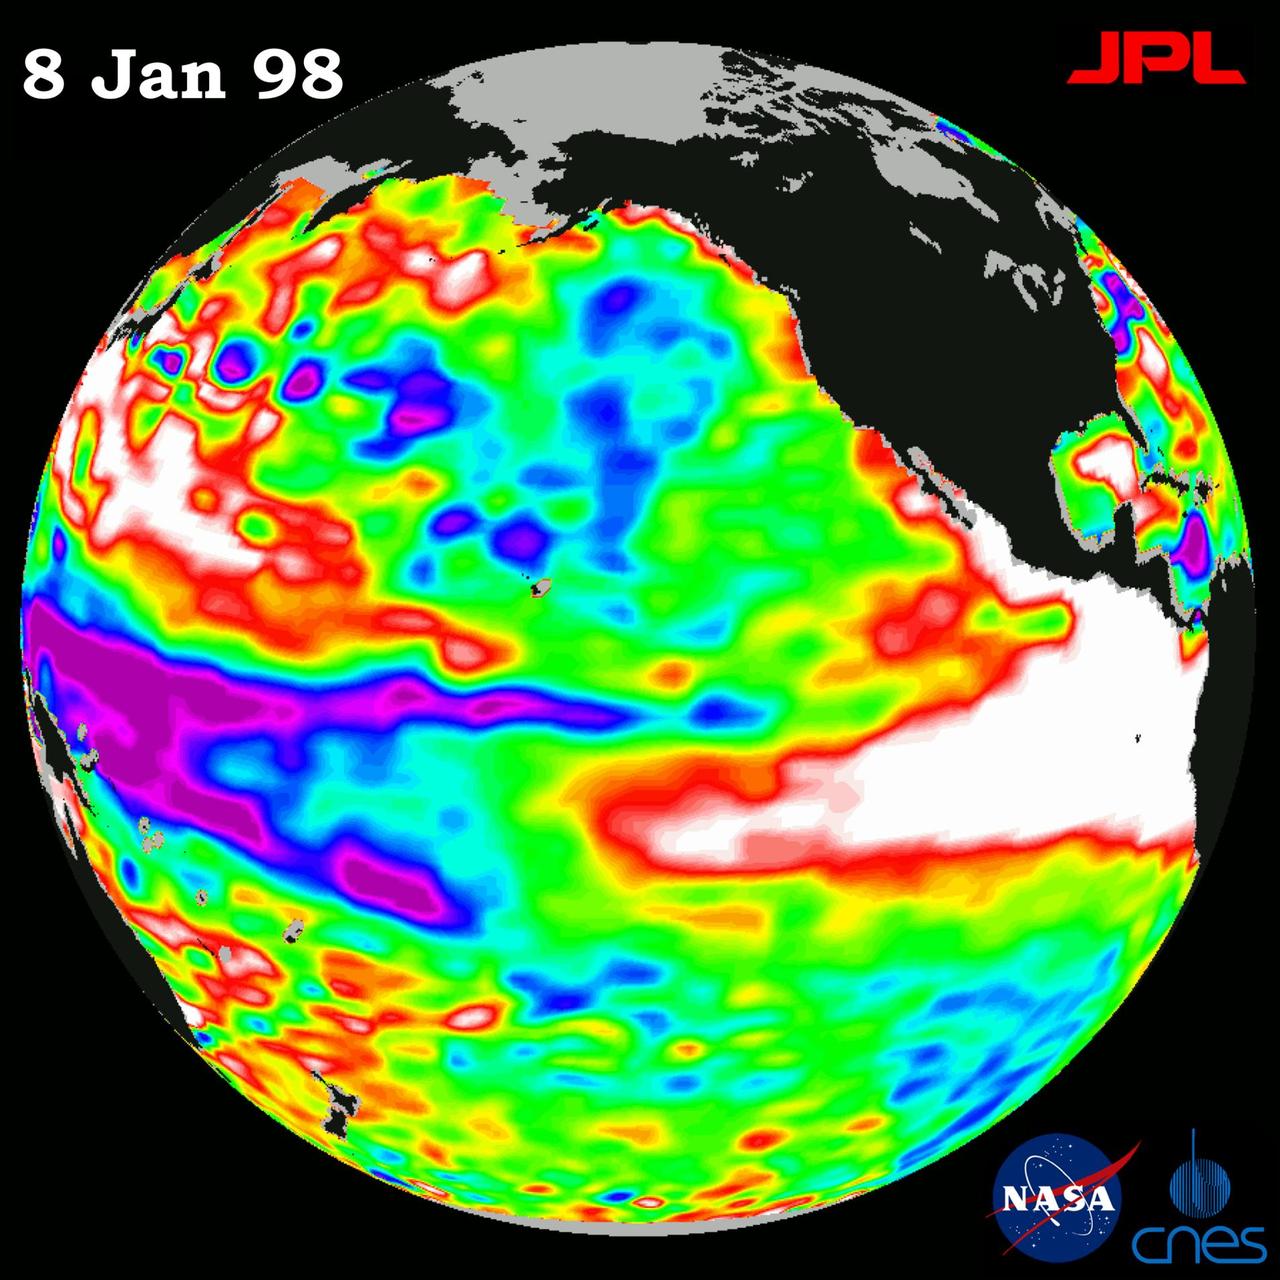
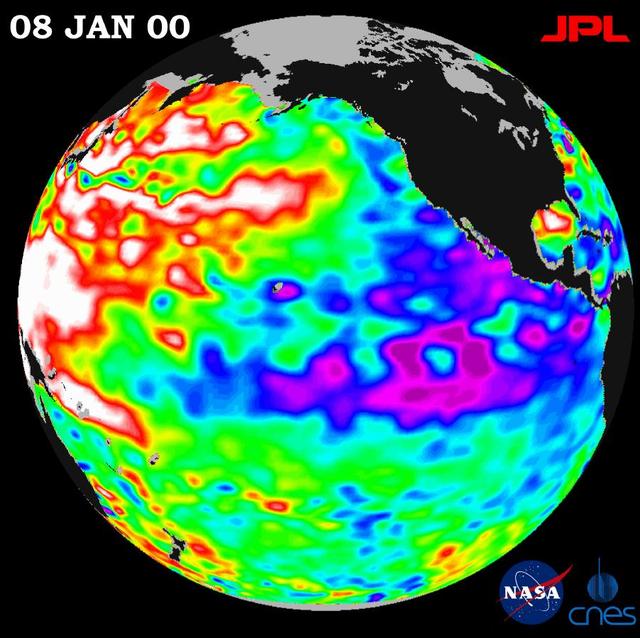
This image of the Pacific Ocean was produced using sea surface height measurements taken by NASA U.S./French TOPEX/Poseidon satellite. The image shows sea surface height relative to normal ocean conditions on Dec. 1, 1997.
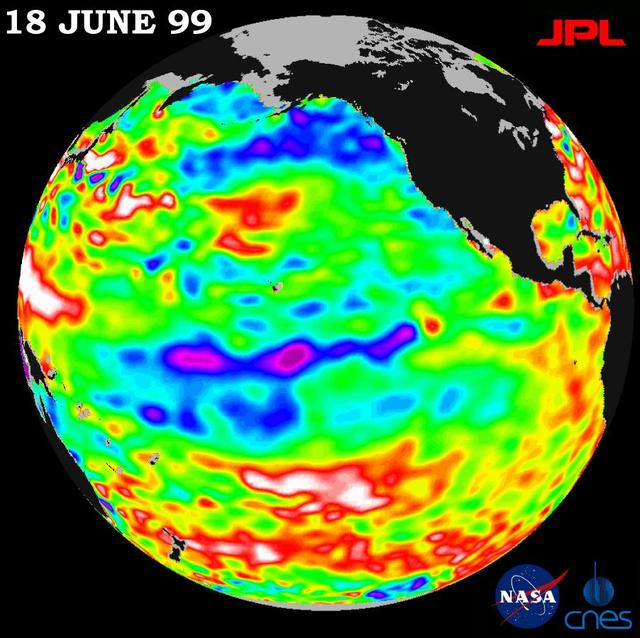
Lingering just a month ago in the eastern Pacific Ocean, the La Niña phenomenon, with its large volume of chilly water, barely has a pulse this month, according to new satellite data from NASA U.S.-French TOPEX/Poseidon mission. The data, taken during a 10-day cycle of data collection ending June 18, show that the equatorial Pacific Ocean is warming up and returning to normal (green) as La Niña all but vanishes. The warming trend is most apparent in the equatorial Pacific Ocean, where only a few patches of cooler, low sea levels (seen in blue and purple) remain. The blue areas are between 5 and 13 centimeters (2 and 5 inches) below normal, whereas the purple areas range from 14 to 18 centimeters (6 to 7 inches) below normal. Like its counterpart, El Niño, a La Niña condition will influence global climate and weather until it has completely subsided. As summer begins in the northern hemisphere, lower-than-normal sea surface levels and cool ocean temperatures persist in the northeastern Gulf of Alaska and along the western coast of North America. In contrast, the trend is the opposite over most of the Pacific, where above-normal sea surface heights and warmer ocean temperatures (indicated by the red and white areas) appear to be increasing and dominating the overall Pacific Ocean. Red areas are about 10 centimeters (4 inches) above normal; white areas show the sea surface height is between 14 and 32 centimeters (6 and 13 inches) above normal. Scientists are not ready to administer last rites to La Niña, though. In the last 12 months, the pool of unusually cold water in the Pacific has shrunk (warmed) several times before cooling (expanding) again. This summer's altimeter data will help them determine whether La Niña has truly dissipated or whether they will see another resurgence of cool water in the Pacific. http://photojournal.jpl.nasa.gov/catalog/PIA01586
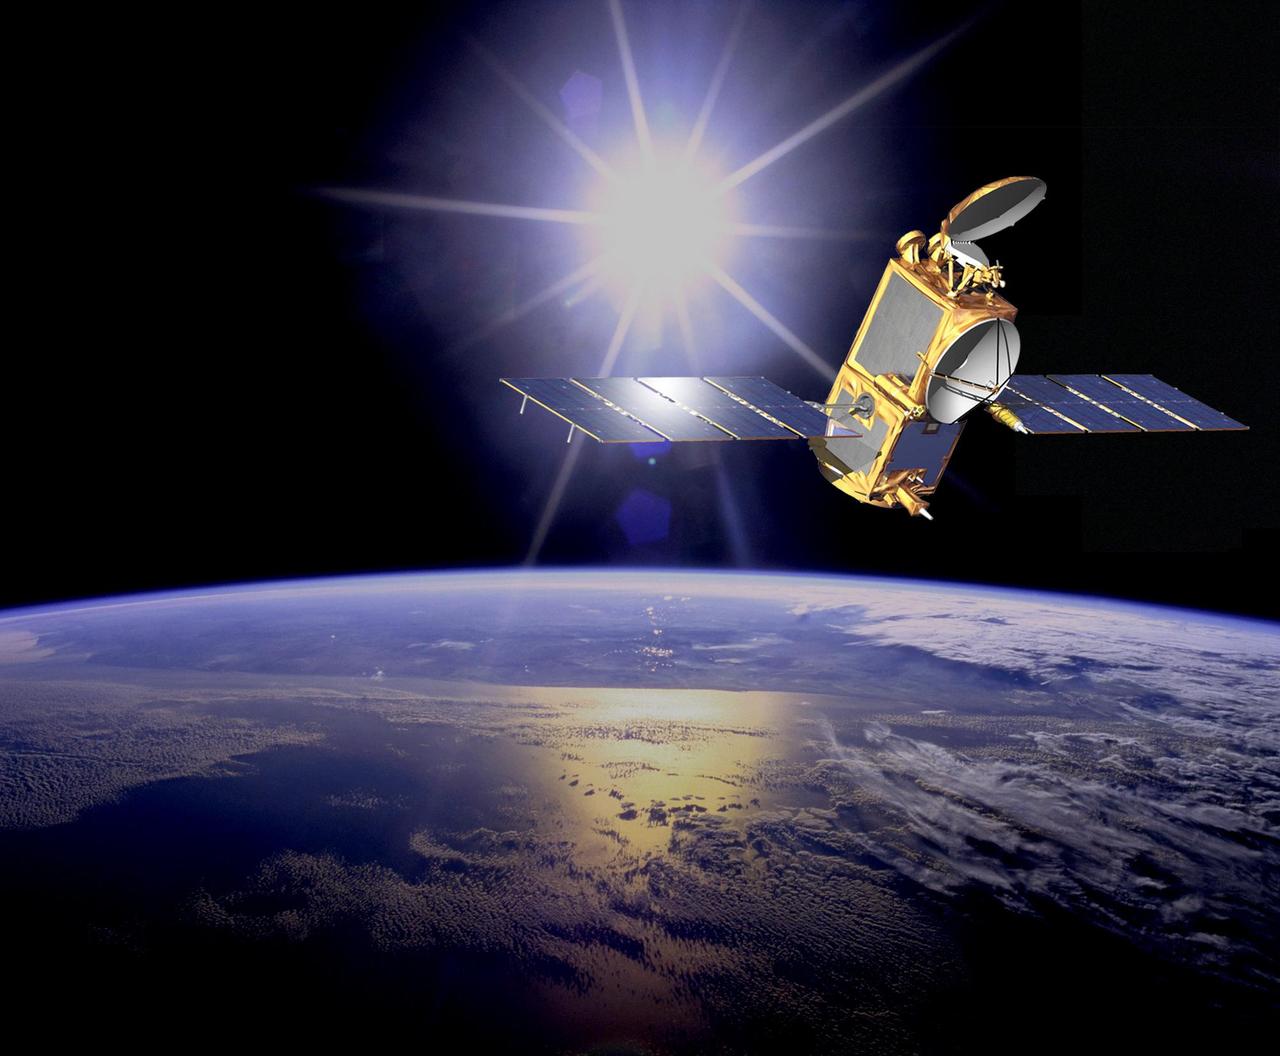
An artist concept of the Ocean Surface Topography Mission/Jason 2 Earth satellite. The Ocean Surface Topography Mission/Jason 2 is an Earth satellite designed to make observations of ocean topography for investigations into sea-level rise and the relationship between ocean circulation and climate change. The satellite also provides data on the forces behind such large-scale climate phenomena as El Niño and La Niña. The mission is a follow-on to the French-American Jason 1 mission, which began collecting data on sea-surface levels in 1992. http://photojournal.jpl.nasa.gov/catalog/PIA18158

iss041e047260 (9/29/2014) --- A view of the removal of the RapidScat Nadir Adapter from the SpaceX-4 Dragon trunk and installation of the adapter onto the Columbus Exposed Facility Unit (EFU). ISS-RapidScat is a space-based scatterometer that replaces the inoperable SeaWinds payload aboard the QuickSCAT satellite. Scatterometers are radar instruments that measure wind speed and direction over the ocean, and are useful for weather forecasting, hurricane monitoring, and observations of large-scale climate phenomena such as El Niño. The ISS RapidScat instrument enhances measurements from other international scatterometers by cross-checking their data, and demonstrates a unique way to replace an instrument aboard an aging satellite. External Caption
This image of the Pacific Ocean was produced using sea surface height measurements taken by NASA U.S./French TOPEX/Poseidon satellite.
This image of the Pacific Ocean was produced using sea surface height measurements taken by NASA U.S./French TOPEX/POSEIDON satellite.
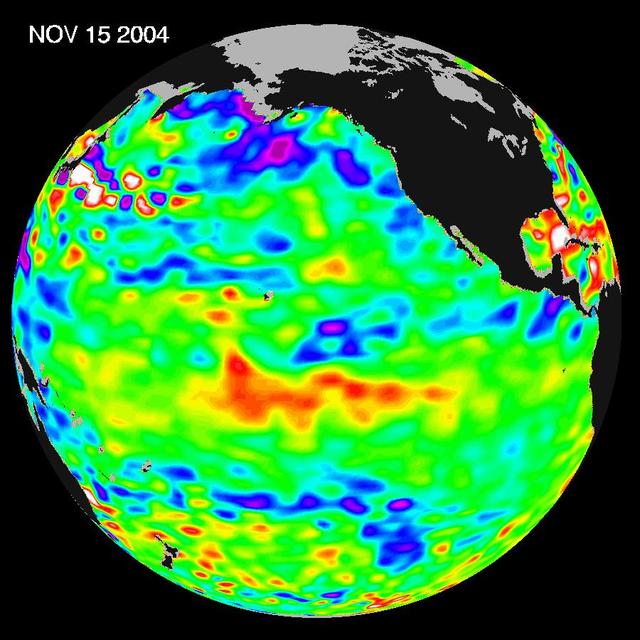
Recent sea-level height data from NASA U.S./France Jason altimetric satellite during a 10-day cycle ending November 15, 2004.
This image of the Pacific Ocean was produced using sea surface height measurements taken by NASA U.S./French TOPEX/POSEIDON satellite.
This image of the Pacific Ocean was produced using sea surface height measurements taken by NASA U.S./French TOPEX/POSEIDON satellite.
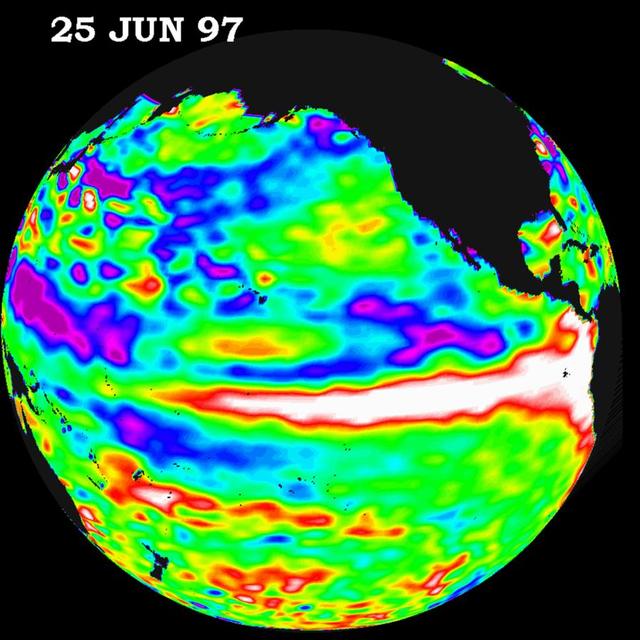
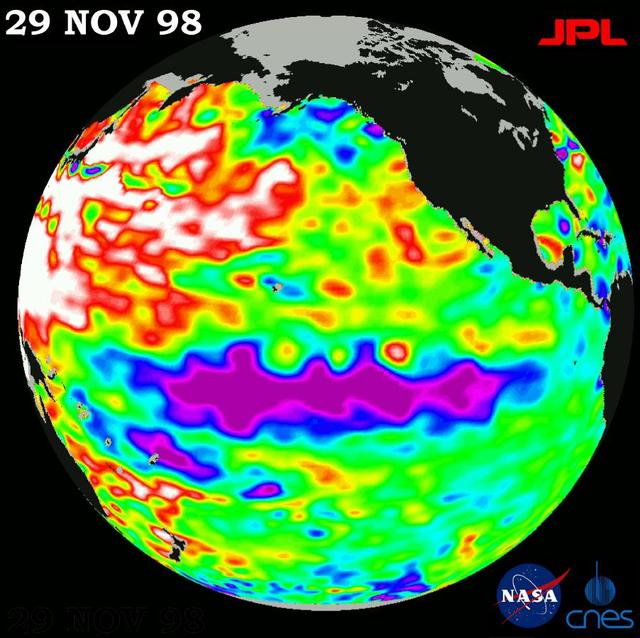
This image of the Pacific Ocean was produced using sea surface height measurements taken by NASA U.S.-French TOPEX/Poseidon satellite.

This image of the Pacific Ocean was produced using sea surface height measurements taken by NASA U.S.-French TOPEX/Poseidon satellite.
This image of the Pacific Ocean was produced using sea-surface height measurements taken by NASA U.S.-French TOPEX/Poseidon satellite.

This image shows differences in atmospheric water vapor relative to a normal average year in the Earth upper troposphere about 10 kilometers 6 miles above the surface.
This image of the Pacific Ocean was produced using sea-surface height measurements taken by NASA U.S.-French TOPEX/Poseidon satellite.
This image of the Pacific Ocean was produced using sea surface height measurements taken by NASA U.S.-French TOPEX/Poseidon satellite.
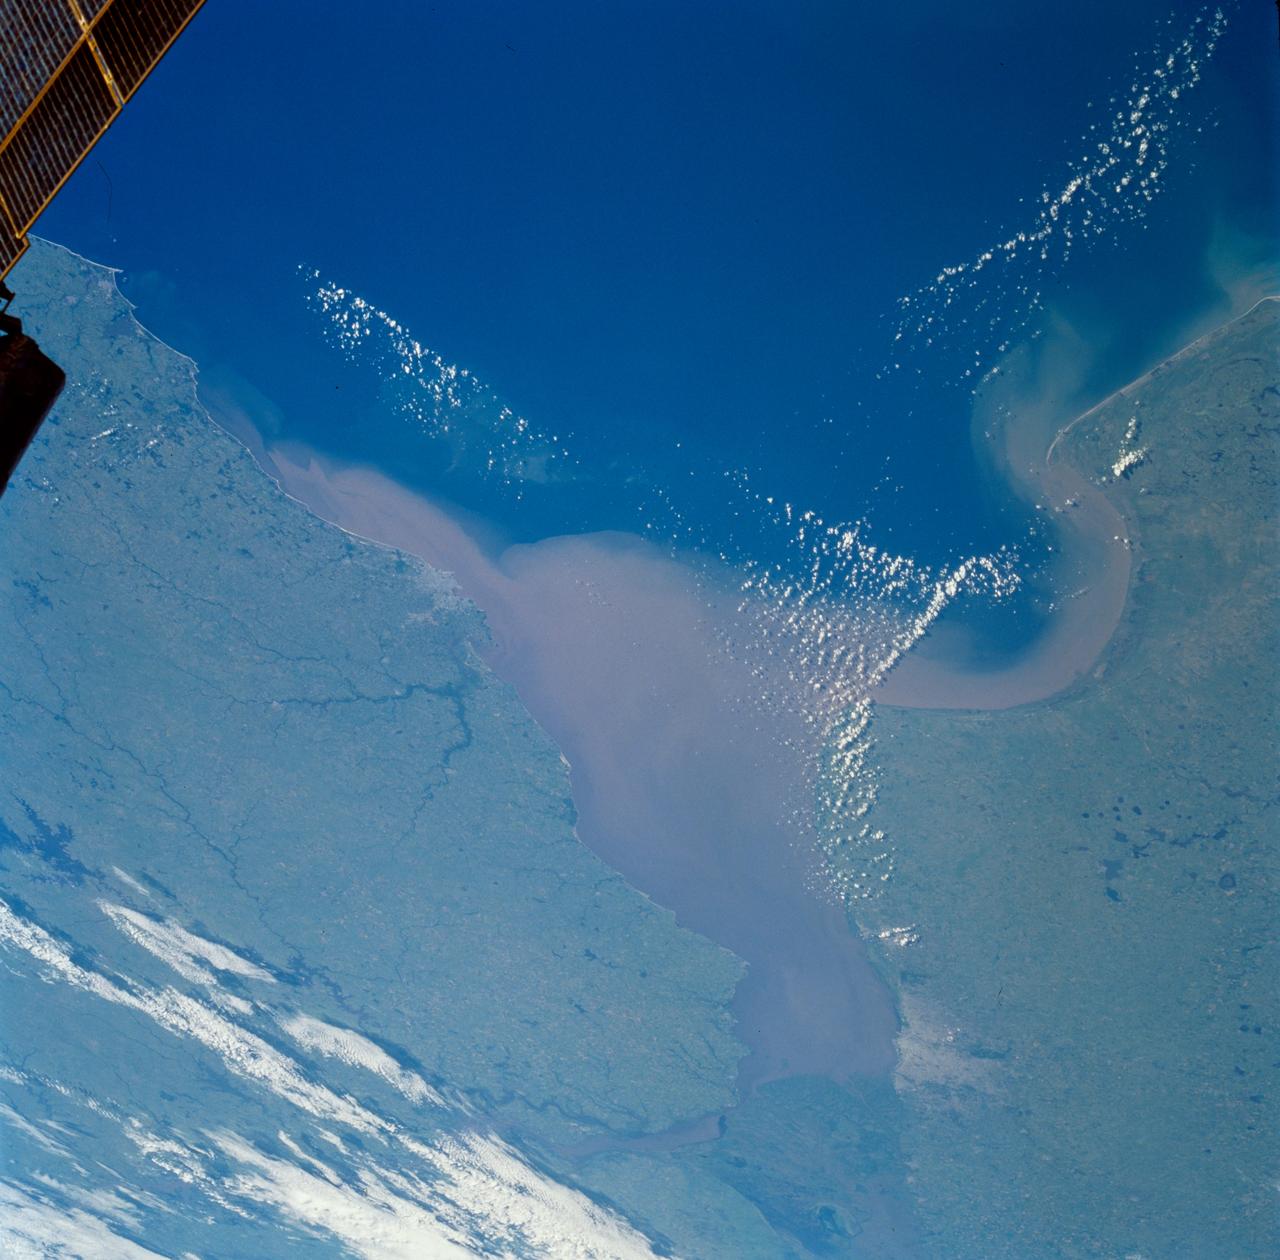
STS089-703-056 (22-31 Jan. 1998) --- This oblique picture of Argentina and other parts of South America was photographed with a 70mm handheld camera from the Earth-orbiting space shuttle Endeavour. Looking westward across the continent, north is toward the upper right corner and the Atlantic Ocean is in the foreground. Rio de la Plata in the center (the confluence of Rio Uruguay and Rio Parana) shows a sediment plume generated by drainage of El Niño rains upslope in the Andean foothills. The sediment plume is possibly more extensive than usual and extends down the coast and out of the bay to the left (south). The city of Buenos Aires, Argentina (population 13 million) is at upper left, and at right center is the city of Montevideo, Uruguay (population 1.2 million). Photo credit: NASA

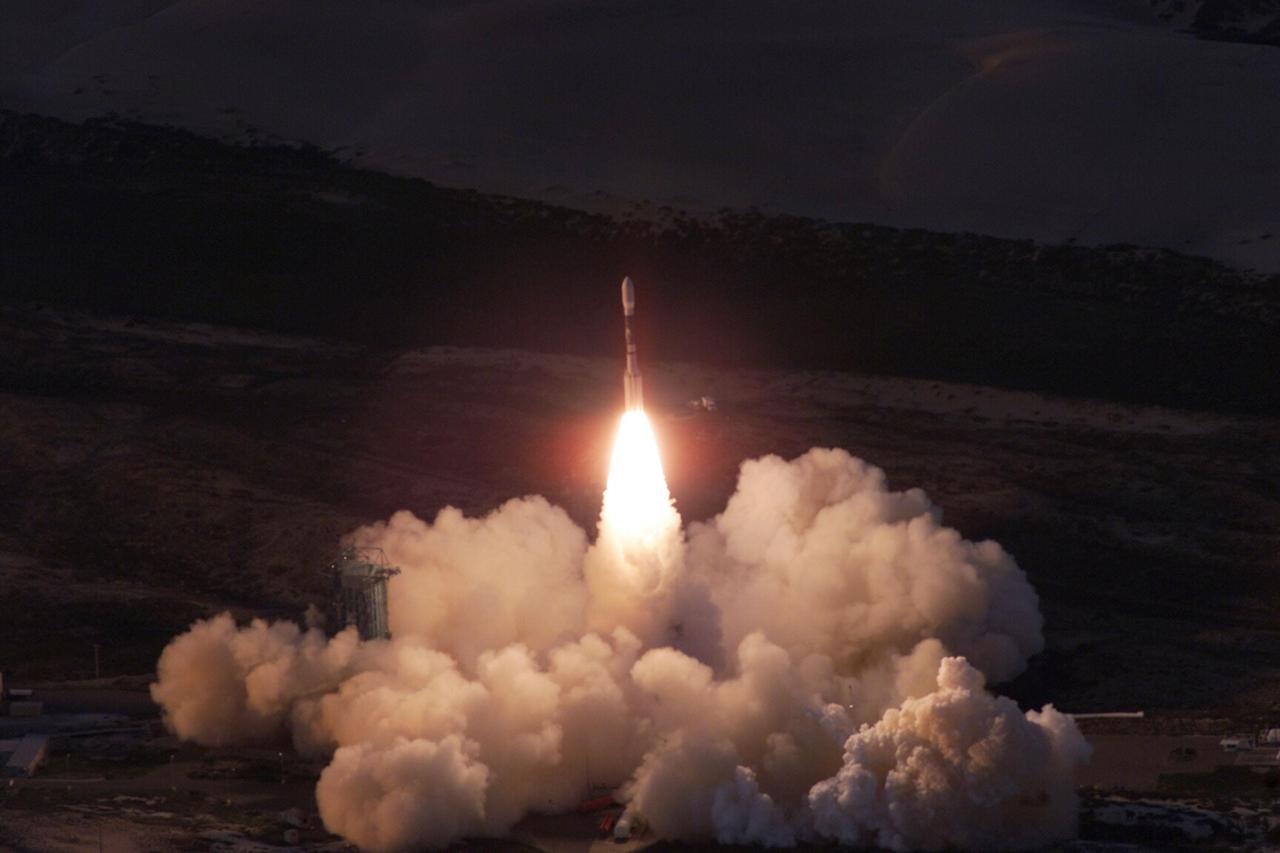
KENNEDY SPACE CENTER, FLA. - The National Oceanic and Atmospheric Administration’s spacecraft NOAA-N lifts off at 6:22 a.m. EDT from Vandenberg Air Force Base, Calif. It was launched by NASA on a Boeing Delta II 7320-10 expendable launch vehicle. Approximately 65 minutes later, the spacecraft separated from the Delta II second stage. Renamed NOAA-18 after achieving orbit, the spacecraft will collect data about the Earth’s surface and atmosphere. The data are input to NOAA’s long-range climate and seasonal outlooks, including forecasts for El Nino and La Nina. NOAA-18 is the fourth in a series of five Polar-orbiting Operational Environmental Satellites with instruments that provide improved imaging and sounding capabilities.

KENNEDY SPACE CENTER, FLA. - The National Oceanic and Atmospheric Administration’s spacecraft NOAA-N leaps away from the smoke and steam clouds as it lifts off at 6:22 a.m. EDT from Vandenberg Air Force Base, Calif. It was launched by NASA on a Boeing Delta II 7320-10 expendable launch vehicle. Approximately 65 minutes later, the spacecraft separated from the Delta II second stage. Renamed NOAA-18 after achieving orbit, the spacecraft will collect data about the Earth’s surface and atmosphere. The data are input to NOAA’s long-range climate and seasonal outlooks, including forecasts for El Nino and La Nina. NOAA-18 is the fourth in a series of five Polar-orbiting Operational Environmental Satellites with instruments that provide improved imaging and sounding capabilities.
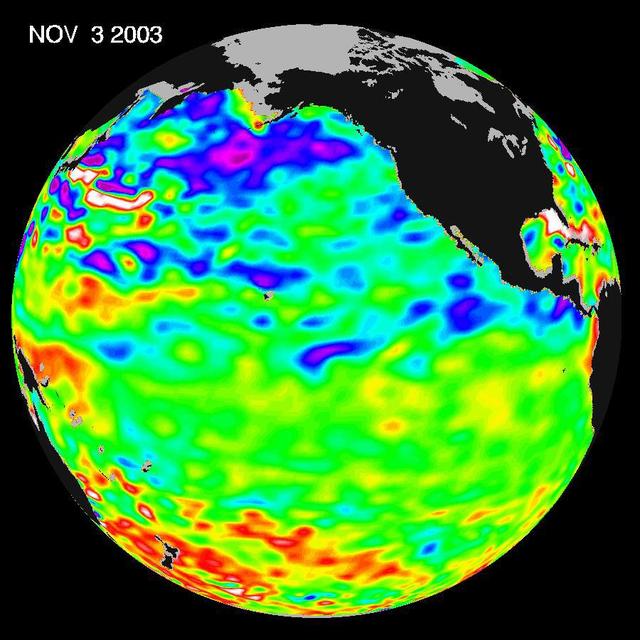
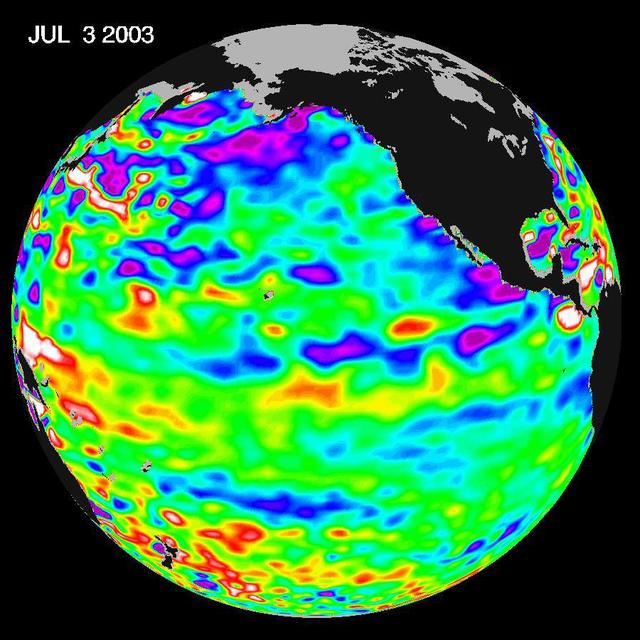
Some climate forecast models indicate there is an above average chance that there could be a weak to borderline El Niño by the end of November 2003. However, the trade winds, blowing from east to west across the equatorial Pacific Ocean, remain strong. Thus, there remains some uncertainty among climate scientists as to whether the warm temperature anomaly will form again this year. The latest remote sensing data from NASA's Jason satellite show near normal conditions across the equatorial Pacific. There are currently no visible signs in sea surface height of an impending El Niño. This equatorial quiet contrasts with the Bering Sea, Gulf of Alaska and U.S. West Coast where lower-than-normal sea surface levels and cool ocean temperatures continue (indicated by blue and purple areas). The image above is a global map of sea surface height, accurate to within 30 millimeters. The image represents data collected and composited over a 10-day period, ending on Nov. 3, 2003. The height of the water relates to the temperature of the water. As the ocean warms, its level rises; and as it cools, its level falls. Yellow and red areas indicate where the waters are relatively warmer and have expanded above sea level, green indicates near normal sea level, and blue and purple areas show where the waters are relatively colder and the surface is lower than sea level. The blue areas are between 5 and 13 centimeters (2 and 5 inches) below normal, whereas the purple areas range from 14 to 18 centimeters (6 to 7 inches) below normal. http://photojournal.jpl.nasa.gov/catalog/PIA04878
The most recent sea-level height data from the NASA/European Ocean Surface Topography Mission/Jason-2 oceanography satellite show the continued eastward progression of a strong wave of warm water, known as a Kelvin wave, now approaching South America.
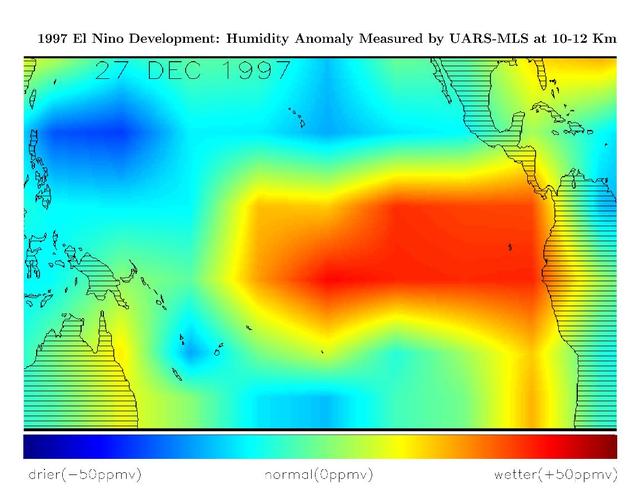
This image shows differences in atmospheric water vapor relative to a normal average year in the Earth upper troposphere about 10 kilometers 6 miles above the surface.
This image of the Pacific Ocean was produced using sea-surface height measurements taken by NASA U.S.-French TOPEX/Poseidon satellite.
This image of the Pacific Ocean was produced using sea-surface height measurements taken by NASA U.S.-French TOPEX/Poseidon satellite.
These images of the Pacific Ocean near Indonesia were produced using sea surface height measurements taken by NASA U.S.-French TOPEX/Poseidon satellite.
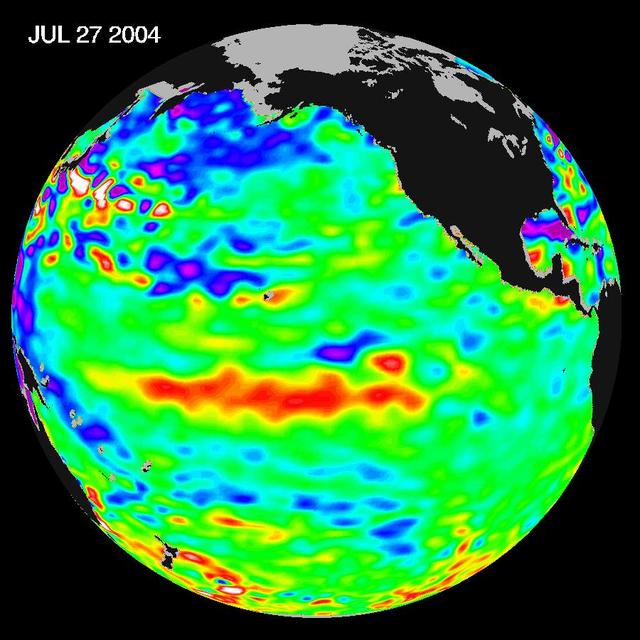
Sea-level height data from NASA U.S./France Jason altimetric satellite during a 10-day cycle ending July 27, 2004, show weaker than normal trade winds in the western and central equatorial Pacific have triggered an eastward moving, warm Kelvin wave.
The cold pool of water in the Pacific known as La Niña still persists, although it is slowly weakening, according to scientists studying new data from NASA U.S.-French TOPEX/Poseidon satellite.
These four views of the Pacific Ocean were produced using sea surface height measurements taken by NASA U.S./French TOPEX/POSEIDON satellite.
VANDENBERG AIR FORCE BASE, Calif. -- A Delta II rocket appears to erupt from the undulating clouds of smoke below as it launches with the joint NASA/French Space Agency oceanography satellite Jason 1 and Thermosphere Ionosphere Mesosphere Energetics and Dynamics satellite aboard. Liftoff from Launch Complex 2W occurred at 7:07 a.m. PST (10:07 a.m. EST or 15:07 GMT). Jason 1 joins the orbiting Topex/Poseidon satellite to continue observations of the global climate interaction occurring between the sea and the atmosphere as a result of stored solar energy. Instruments on Jason 1 will map variations in ocean surface topography to monitor world ocean circulation, study interactions of the oceans and atmosphere, improve climate predictions and observe events like El Nino. The mission is expected to last three years. The TIMED satellite will study a little-known region above the atmosphere, some 40 to 110 miles from the Earth's surface. Studying this region has been nearly impossible until now because conventional airplanes and balloons cannot reach this high altitude, and it is too low for direct satellite measurements

VANDENBERG AIR FORCE BASE, Calif. -- A Delta II rocket launches successfully with the joint NASA/French Space Agency oceanography satellite Jason 1 and Thermosphere Ionosphere Mesosphere Energetics and Dynamics satellite aboard. Liftoff from Launch Complex 2W occurred at 7:07 a.m. PST (10:07 a.m. EST or 15:07 GMT). Jason 1 joins the orbiting Topex/Poseidon satellite to continue observations of the global climate interaction occurring between the sea and the atmosphere as a result of stored solar energy. Instruments on Jason 1 will map variations in ocean surface topography to monitor world ocean circulation, study interactions of the oceans and atmosphere, improve climate predictions and observe events like El Nino. The mission is expected to last three years. The TIMED satellite will study a little-known region above the atmosphere, some 40 to 110 miles from the Earth's surface. Studying this region has been nearly impossible until now because conventional airplanes and balloons cannot reach this high altitude, and it is too low for direct satellite measurements
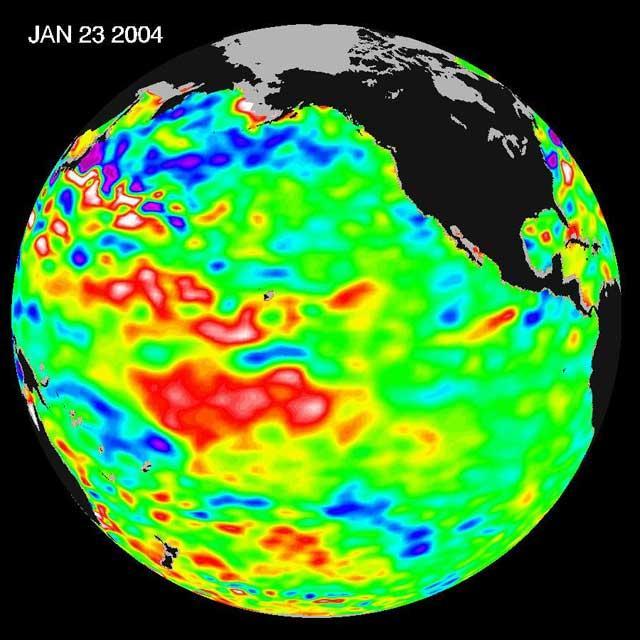
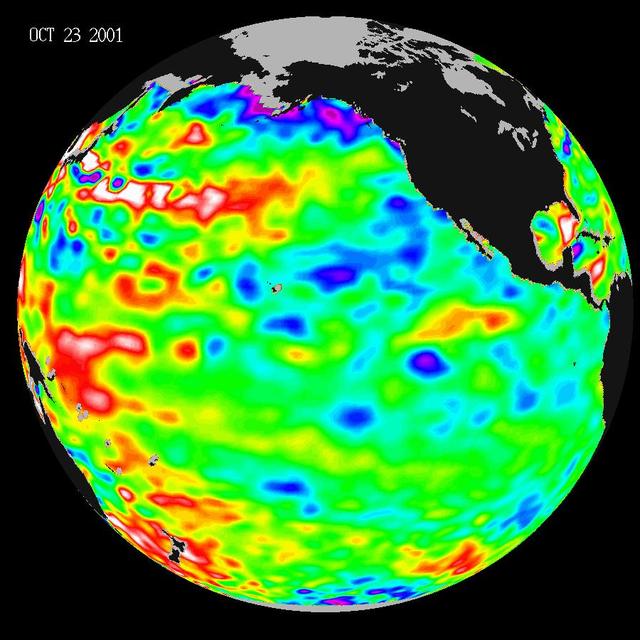
The latest remote sensing data from NASA's Jason satellite show that the equatorial Pacific sea surface levels are higher, indicating warmer sea surface temperatures in the central and west Pacific Ocean. This pattern has the appearance of La Niña rather than El Niño. This contrasts with the Bering Sea, Gulf of Alaska and U.S. West Coast where lower-than-normal sea surface levels and cool ocean temperatures continue (indicated by blue and purple areas). The image above is a global map of sea surface height, accurate to within 30 millimeters. The image represents data collected and composited over a 10-day period, ending on Jan 23, 2004. The height of the water relates to the temperature of the water. As the ocean warms, its level rises; and as it cools, its level falls. Yellow and red areas indicate where the waters are relatively warmer and have expanded above sea level, green indicates near normal sea level, and blue and purple areas show where the waters are relatively colder and the surface is lower than sea level. The blue areas are between 5 and 13 centimeters (2 and 5 inches) below normal, whereas the purple areas range from 14 to 18 centimeters (6 to 7 inches) below normal. http://photojournal.jpl.nasa.gov/catalog/PIA05071

STS058-76-041 (18 Oct-1 Nov 1993) --- Backdropped against the Peru-Bolivia border and part of the Amazon basin, the Spacelab Life Sciences (SLS-2) laboratory module was captured with a 70mm camera, by one of the seven crew members inside the Space Shuttle Columbia's cabin. Part of the tunnel-like passageway is visible in the foreground. Six NASA astronauts and a veterinarian from the private sector spent two weeks devoted to medical research in Earth-orbit. Lake Titicaca, the largest high-altitude lake in the world lies in the Altiplano of Bolivia and Peru. Space Shuttle photography has been used to document fluctuations of several meters of the level of Lake Titicaca during the past decade, as well as to document the eutrophication of the north end of the lake, which is primarily due to increased population in the Peruvian shoreline areas. This view shows the effect of abnormally heavy precipitation of the region for the third successive year. Meteorologists feel this precipitation increase, which may portend another increase of the lake level, is due to the third successive El Nino - Southern Oscillation phenomenon in the 1993 - 94 southern hemisphere summertime. This global phenomenon is now resulting in major weather disturbances in Indonesia, California, Texas and elsewhere.

This graph shows the rise in global mean sea level from 1993 to 2023 based on data from a series of five international satellites. The solid red line indicates the trajectory of this increase, which has more than doubled over the three decades. The dotted red line projects future sea level rise. The relatively large jump in sea level from 2022 to 2023, a rise of about 0.3 inches (0.76 centimeters), is due mostly to a warming climate and the development of a strong El Niño. The 2022-2023 rise is equivalent to draining a quarter of Lake Superior into the ocean over the course of a year. This NASA-led analysis is based on a sea level data set featuring more than 30 years of satellite observations, starting with the U.S.-French TOPEX/Poseidon mission, which launched in 1992. The Sentinel-6 Michael Freilich mission, which launched in November 2020, is the latest in the series of satellites that have contributed to this sea level record. https://photojournal.jpl.nasa.gov/catalog/PIA26183
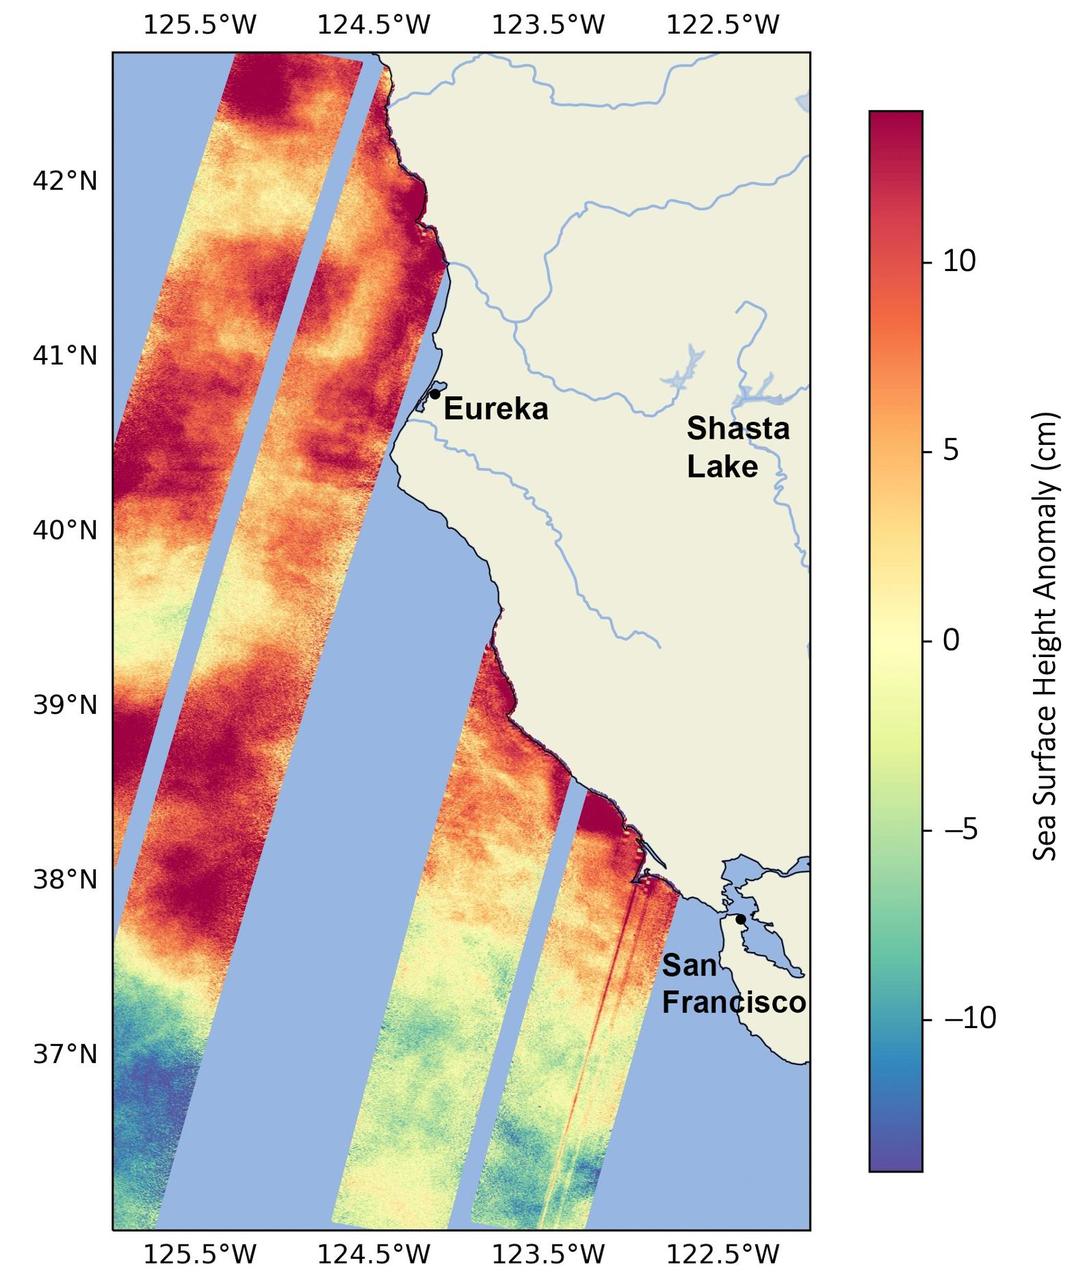
This data visualization image above shows sea surface heights off the northern California coast in August 2023 as measured by the Surface Water and Ocean Topography (SWOT) satellite. Red indicates higher-than-average ocean heights, while blue represents lower-than-average heights. Warm ocean waters from the developing El Niño are shifting north along coastlines in the eastern Pacific Ocean. Along the coast of California, these warm waters are interacting with a persistent marine heat wave that recently influenced the development of Hurricane Hilary. SWOT is able to spot the movement of these warm ocean waters in unprecedented detail. The SWOT science team made the measurements with the Ka-band Radar Interferometer (KaRIn) instrument. With two antennas spread 33 feet (10 meters) apart on a boom, KaRIn produces a pair of data swaths as it circles the globe, bouncing radar pulses off the water's surface to collect water-height measurements. The visualization combines data from two passes of the SWOT satellite. https://photojournal.jpl.nasa.gov/catalog/PIA26091
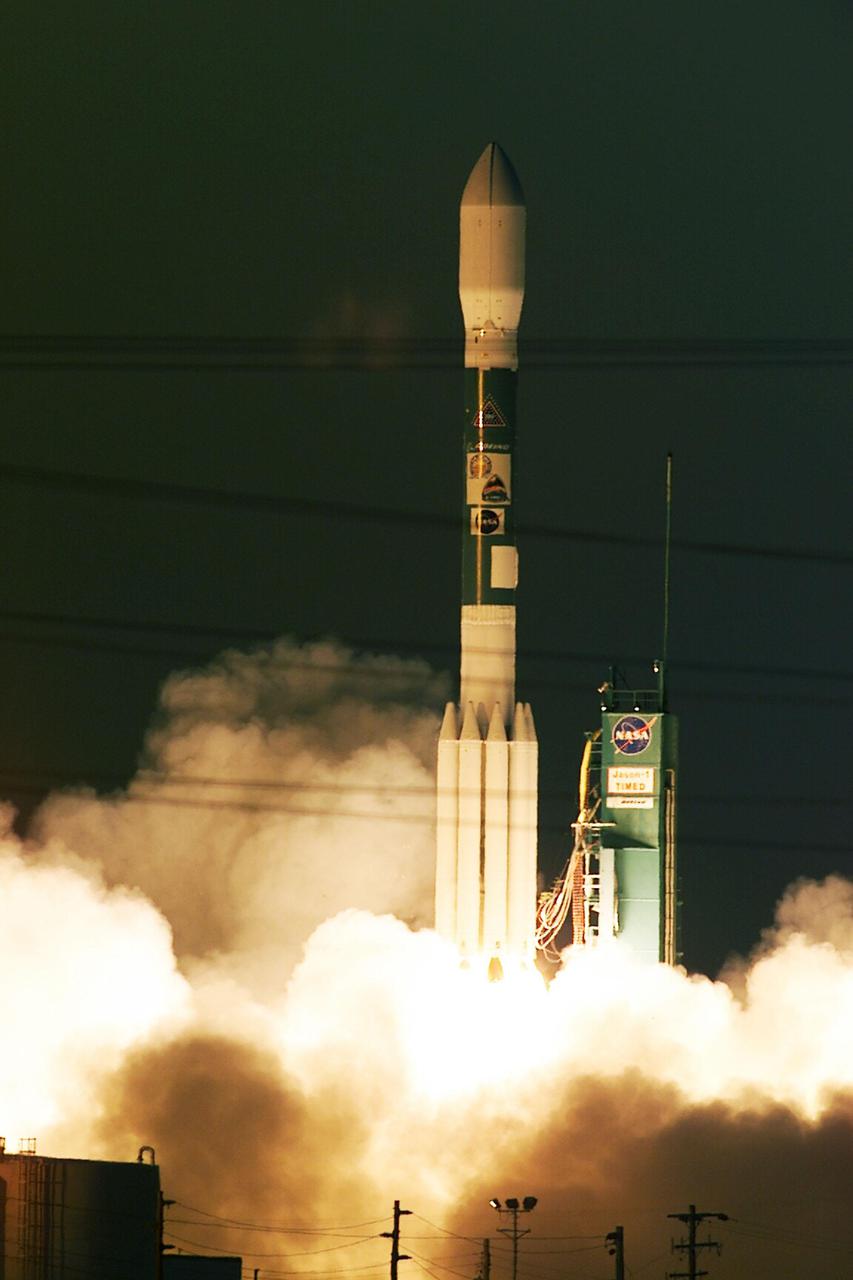
VANDENBERG AIR FORCE BASE, Calif. -- A Delta II rocket launches successfully with the joint NASA_French Space Agency oceanography satellite Jason 1 and Thermosphere Ionosphere Mesosphere Energetics and Dynamics satellite aboard. Liftoff from Launch Complex 2W occurred at 7:07 a.m. PST (10:07 a.m. EST or 15:07 GMT). Jason 1 joins the orbiting Topex_Poseidon satellite to continue observations of the global climate interaction occurring between the sea and the atmosphere as a result of stored solar energy. Instruments on Jason 1 will map variations in ocean surface topography to monitor world ocean circulation, study interactions of the oceans and atmosphere, improve climate predictions and observe events like El Nino. The mission is expected to last three years. The TIMED satellite will study a little-known region above the atmosphere, some 40 to 110 miles from the Earth's surface. Studying this region has been nearly impossible until now because conventional airplanes and balloons cannot reach this high altitude, and it is too low for direct satellite measurements
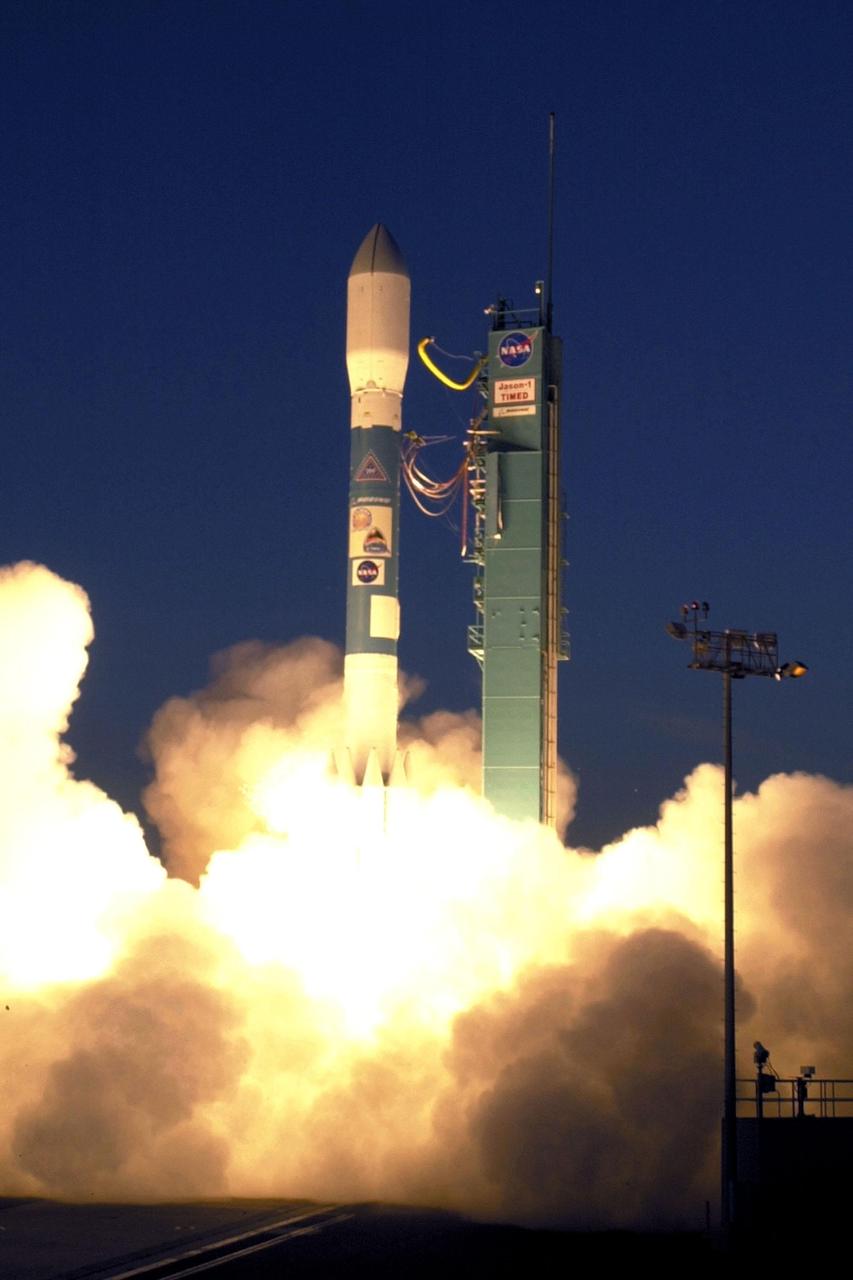
VANDENBERG AIR FORCE BASE, Calif.. -- A Delta rocket leaps off Launch Complex 2W carrying the joint NASA/French Space Agency oceanography satellite Jason 1 and Thermosphere Ionosphere Mesosphere Energetics and Dynamics satellite aboard. Liftoff occurred at 7:07 a.m. PST (10:07 a.m. EST or 15:07 GMT). Jason 1 joins the orbiting Topex/Poseidon satellite to continue observations of the global climate interaction occurring between the sea and the atmosphere as a result of stored solar energy. Instruments on Jason 1 will map variations in ocean surface topography to monitor world ocean circulation, study interactions of the oceans and atmosphere, improve climate predictions and observe events like El Nino. The mission is expected to last three years. The TIMED satellite will study a little-known region above the atmosphere, some 40 to 110 miles from the Earth's surface. Studying this region has been nearly impossible until now because conventional airplanes and balloons cannot reach this high altitude, and it is too low for direct satellite measurements

VANDENBERG AIR FORCE BASE, Calif.. -- A Delta rocket leaps off Launch Complex 2W carrying the joint NASA_French Space Agency oceanography satellite Jason 1 and Thermosphere Ionosphere Mesosphere Energetics and Dynamics satellite aboard. Liftoff occurred at 7:07 a.m. PST (10:07 a.m. EST or 15:07 GMT). Jason 1 joins the orbiting Topex_Poseidon satellite to continue observations of the global climate interaction occurring between the sea and the atmosphere as a result of stored solar energy. Instruments on Jason 1 will map variations in ocean surface topography to monitor world ocean circulation, study interactions of the oceans and atmosphere, improve climate predictions and observe events like El Nino. The mission is expected to last three years. The TIMED satellite will study a little-known region above the atmosphere, some 40 to 110 miles from the Earth's surface. Studying this region has been nearly impossible until now because conventional airplanes and balloons cannot reach this high altitude, and it is too low for direct satellite measurements

VANDENBERG AIR FORCE BASE, Calif. -- A Delta II rocket appears to erupt from the undulating clouds of smoke below as it launches with the joint NASA_French Space Agency oceanography satellite Jason 1 and Thermosphere Ionosphere Mesosphere Energetics and Dynamics satellite aboard. Liftoff from Launch Complex 2W occurred at 7:07 a.m. PST (10:07 a.m. EST or 15:07 GMT). Jason 1 joins the orbiting Topex_Poseidon satellite to continue observations of the global climate interaction occurring between the sea and the atmosphere as a result of stored solar energy. Instruments on Jason 1 will map variations in ocean surface topography to monitor world ocean circulation, study interactions of the oceans and atmosphere, improve climate predictions and observe events like El Nino. The mission is expected to last three years. The TIMED satellite will study a little-known region above the atmosphere, some 40 to 110 miles from the Earth's surface. Studying this region has been nearly impossible until now because conventional airplanes and balloons cannot reach this high altitude, and it is too low for direct satellite measurements
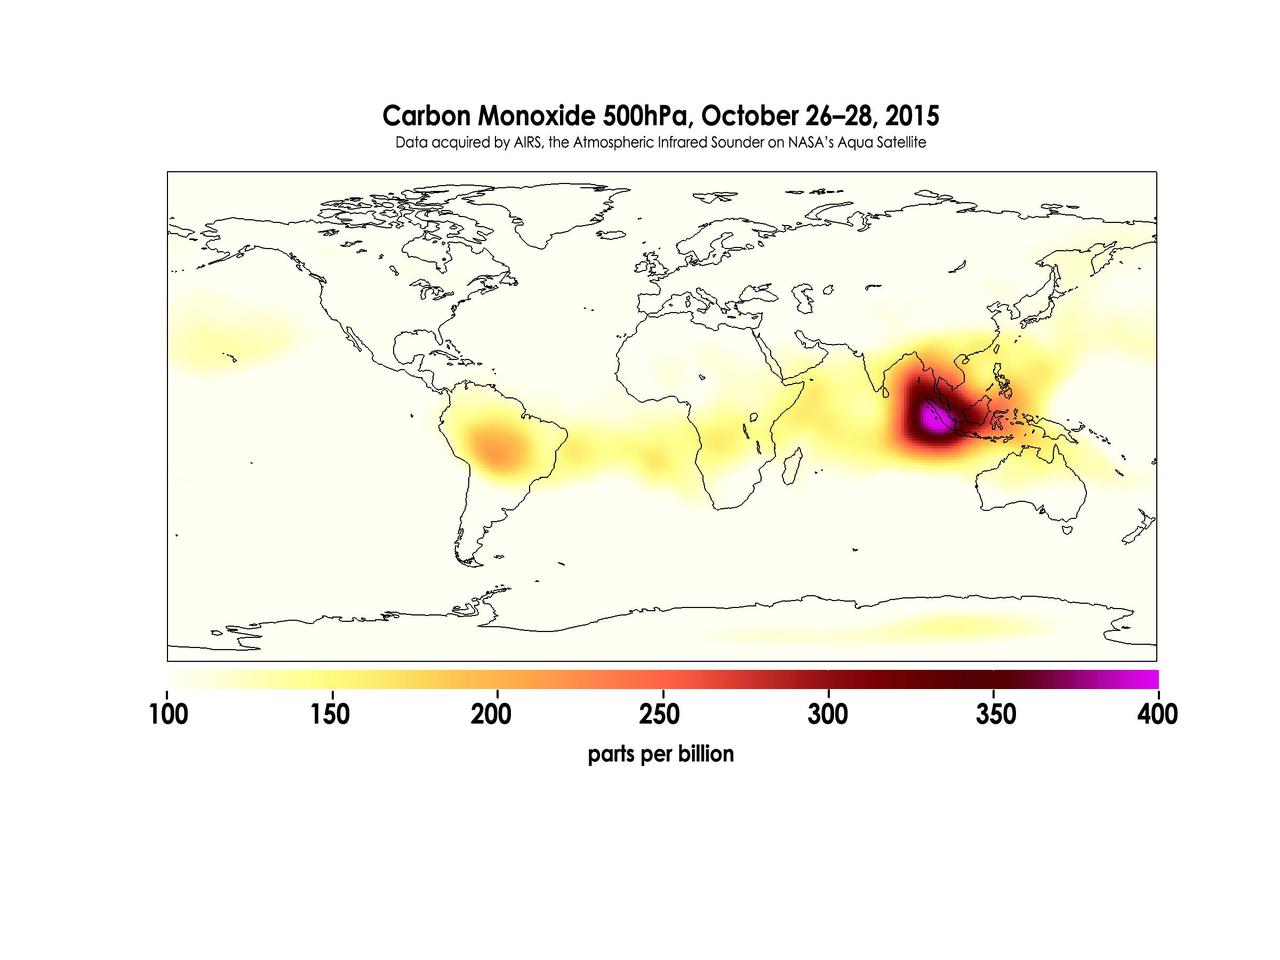
Widespread forest fires across Indonesia have burned tens of thousands of acres over three months, causing high levels of pollution, loss of life, and billions of dollars to the Indonesian government. It is estimated that more than 43 million people have been inhaling toxic fumes, and large parts of Indonesia have been placed in a state of emergency. Most of the fires are believed to have been set to clear farmland during the dry season, but a long term drought enhanced by El Niño conditions have contributed to the fires remaining unchecked due to lack of rain. These images made with data acquired by AIRS, the Atmospheric Infrared Sounder on NASA's Aqua Satellite, show the global concentration of carbon monoxide at the 500hPa pressure level, or approximately 18,000 feet (5,500 meters) altitude. The data are an average of measurements taken over three days, from October 14 through 16, and October 26 through 28, and the high concentration and large extent of the fires over Indonesia are quite apparent. While the scale for this image extends to 400 parts per billion, local values of carbon monoxide can be significantly higher. http://photojournal.jpl.nasa.gov/catalog/PIA20042
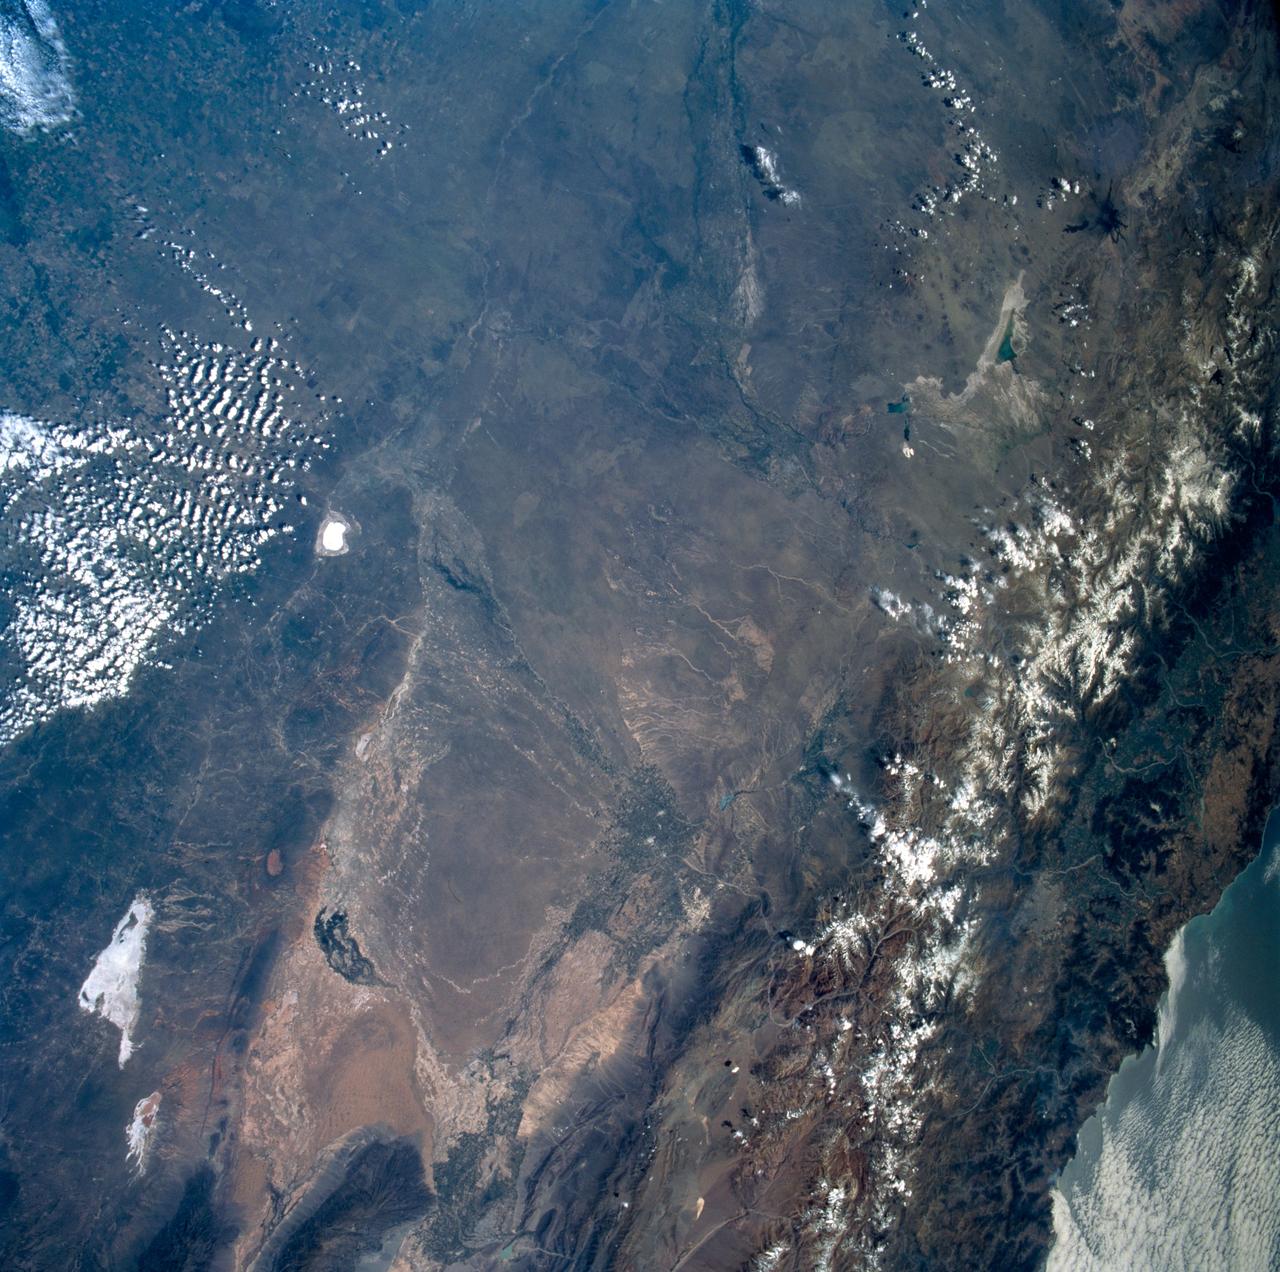
STS089-742-014 (22-31 Jan. 1998) --- This near-nadir picture of the central Andes, showing Santiago and other parts of Chile and Argentina, was photographed with a 70mm handheld camera from the Earth-orbiting space shuttle Endeavour. Santiago (population 4.7 million) is visible to the right of center, west of the snow-capped Andes Mountains. Mendoza, Argentina is the light spot in the upper center of the image in the eastern foothills of the Andes. Cerro Aconcagua, the highest peak in South America (22,834 feet) is due west of Mendoza. Note the sharp bend in the river valley to the junction with a straight north-trending valley. Aconcagua is the large, rounded mass with a bit of cloud just northwest of the valley junction. Bright white spots on the left of the image are salars, or dry lake beds of gypsum and/or salt. Usually dry, some contain water due to recent rains generated by the record El Nino this year. The Pacific Ocean is to the upper right. The continental shelf is very steep in this region and water depths drop (to almost 17,000 feet over a distance of about 60 miles) over the same distance inland from the coast, the Andes rise +17,000 to almost 23,000 feet. The reason for this is the very rapid plate motion between the Pacific Ocean plate and South America. According to NASA scientists, over the last 140 million years, South America has been overriding the Pacific plate resulting in the rapid rise in the Andes and the rapid subduction of the Pacific plate, along with any sediments that are shed into the ocean along the continental margin. The dark, linear mountain ranges east of the high Andes (right center) constitute the Precordillera block; rock strata there have been correlated with the Ordovician (approximately 470 million years old) rocks near El Paso, Texas. The rocks and the fossils within them are virtually identical in the two areas, which are now widely separated. This region would be considered a "remnant terrain" from the time when this portion of South America and Texas were once joined. Photo credit: NASA
The North Pacific Ocean continues to run hot and cold, with abnormally low sea levels and cool waters in the northeastern Pacific contrasting with unusually high sea levels and warm waters in the northwestern Pacific.

This image of the Pacific Ocean was produced using sea surface height measurements taken by NASA U.S.-French TOPEX/Poseidon satellite.
New sea surface height measurements from NASA TOPEX/Poseidon satellite show that the sea level and temperature of the entire Pacific is out of balance, including a large area of abnormally cool water along the west coast of North America.

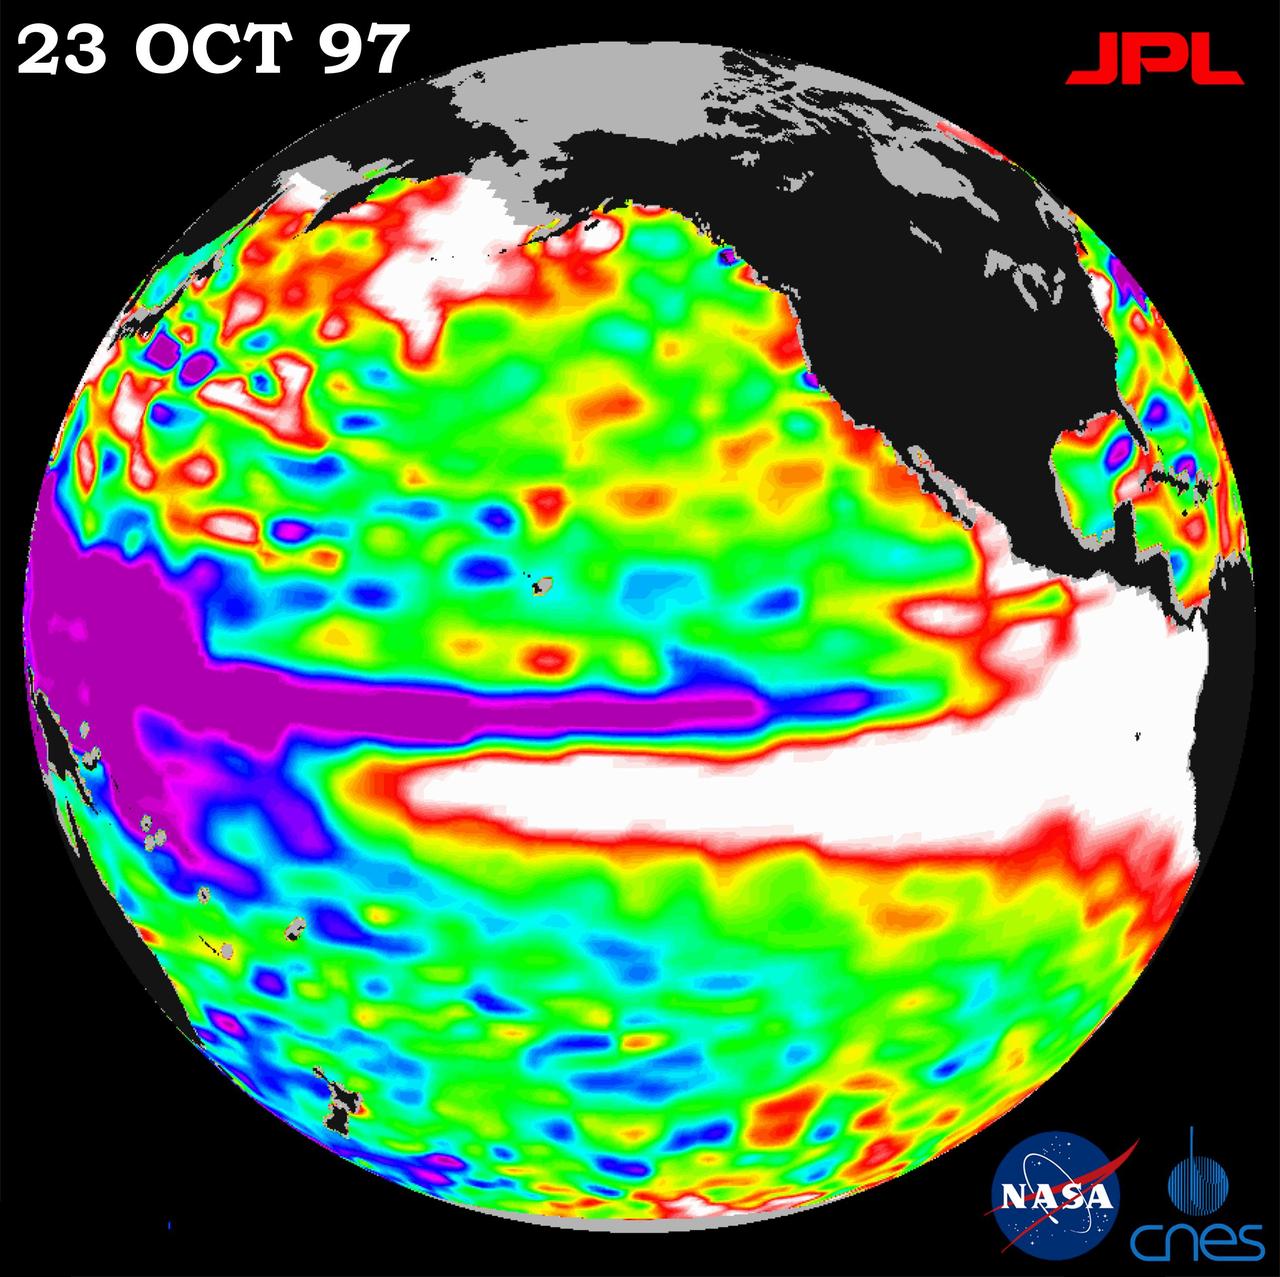
This image of the Pacific Ocean was produced using sea surface height measurements taken by the U.S./French TOPEX/Poseidon satellite. The image shows sea surface height relative to normal ocean conditions on Nov. 10, 1997.
This image of the Pacific Ocean was produced using sea-surface height measurements taken by NASA U.S.-French TOPEX/Poseidon satellite.
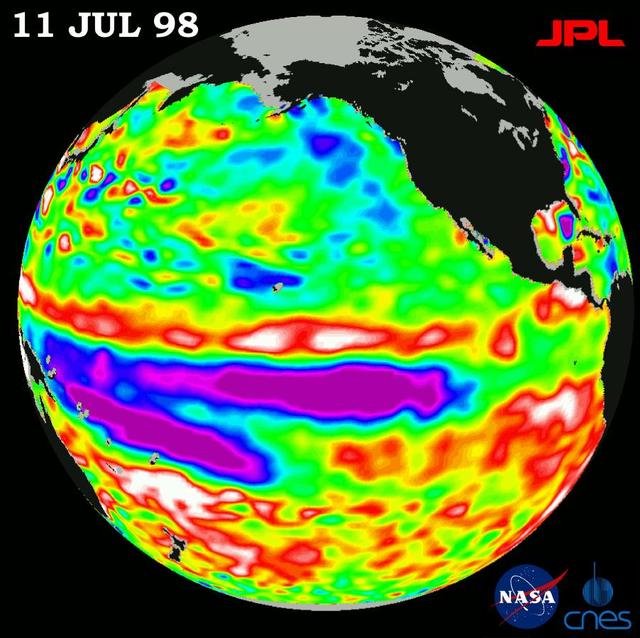
Height measurements taken by NASA U.S.-French TOPEX/Poseidon satellite. The image shows sea surface height relative to normal ocean conditions on July 11, 1998; sea surface height is an indicator of the heat content of the ocean.
The cold pool of water in the Pacific known as La Nina is beginning to fade, but ocean conditions have not returned to normal, according to scientists studying images from the U.S.-French TOPEX/Poseidon satellite. http://photojournal.jpl.nasa.gov/catalog/PIA00031
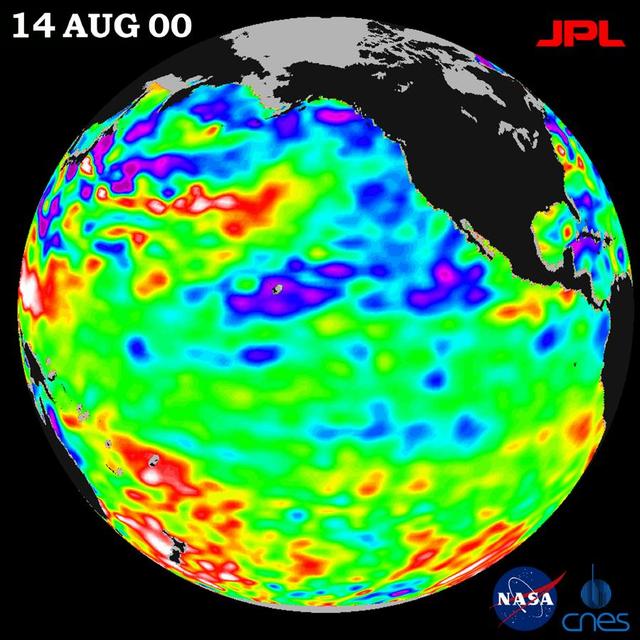
After dominating the tropical Pacific Ocean for more than two years, the 1998-2000 La Niña cool pool is continuing its slow fade and seems to be retiring from the climate stage, according to satellite data from NASA U.S.-French TOPEX/Poseidon mission.
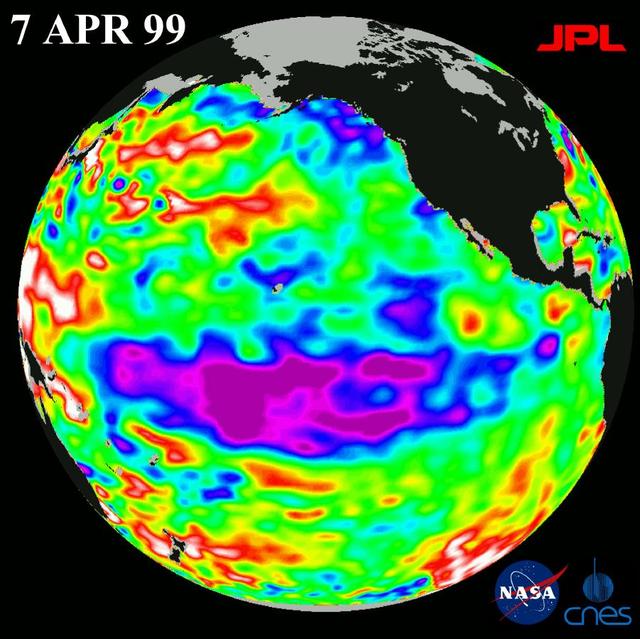
This image of the Pacific Ocean was produced using sea-surface height measurements taken by NASA U.S.-French TOPEX/Poseidon satellite.
Recent sea-level height data from NASA Jason-1 altimetric satellite show that continuing weaker-than-normal trade winds in the western and central equatorial Pacific have triggered another strong, eastward moving, warm Kelvin wave.
This image of the Pacific Ocean was produced using sea-surface height measurements taken by NASA U.S.-French TOPEX/Poseidon satellite.
A repeat of last year mild La Niña conditions -- with a stormy winter in the Pacific Northwest and a dry winter in the southwestern United States -- will be the likely outcome of sea-surface heights observed by NASA TOPEX/Poseidon satellite.
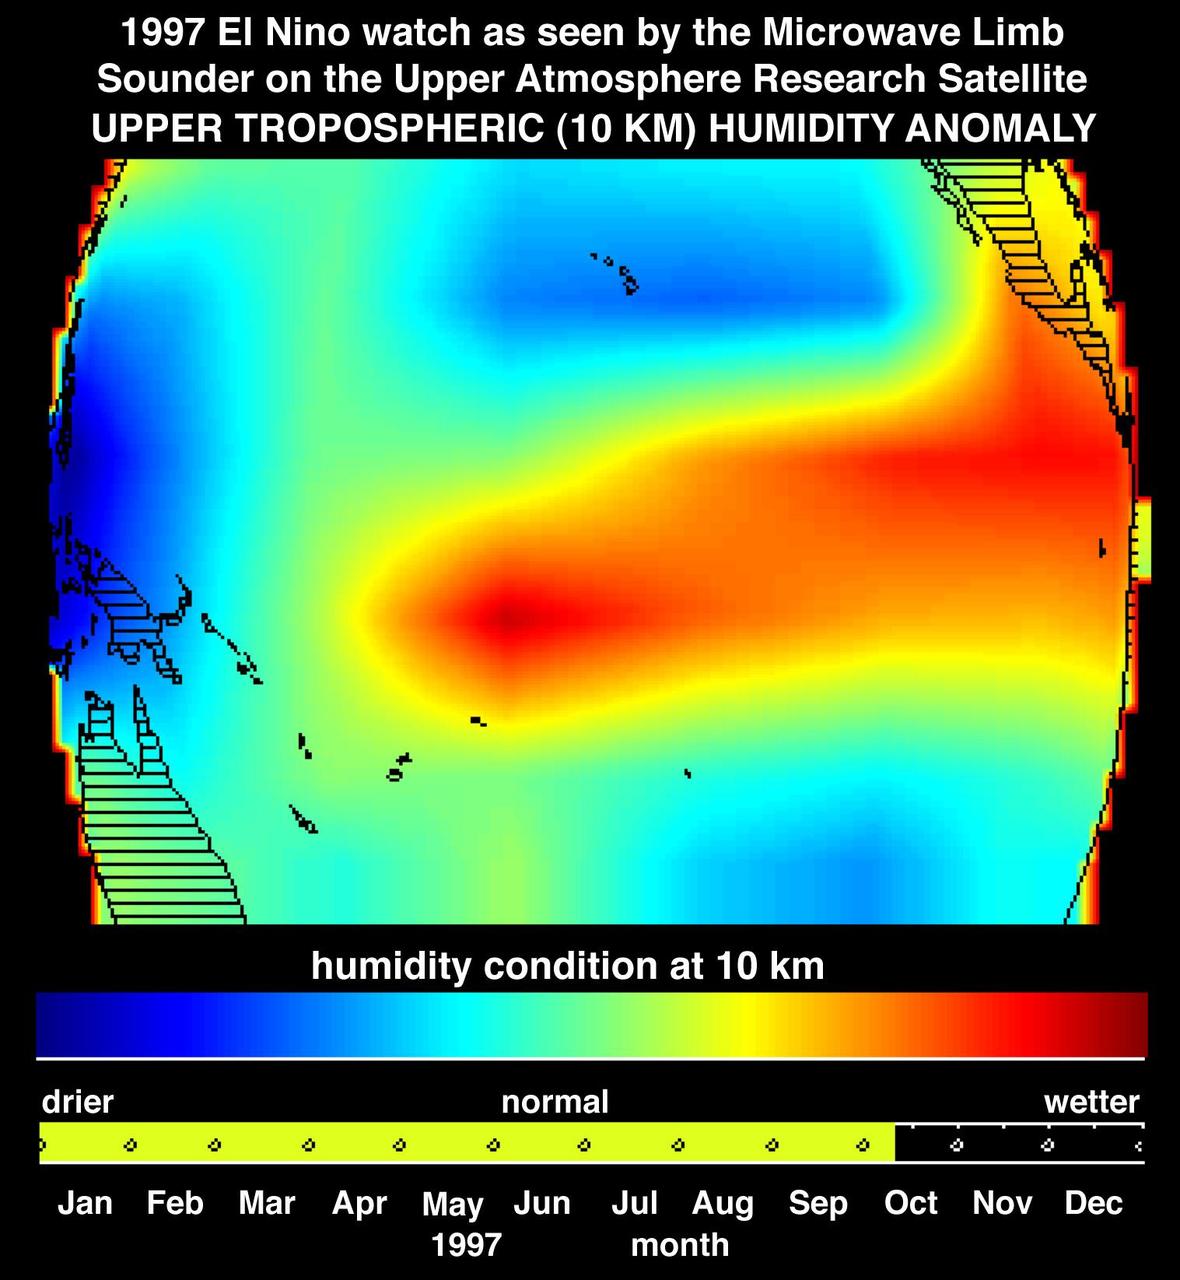
This image shows atmospheric water vapor in Earth upper troposphere, about 10 kilometers 6 miles above the surface, as measured by NASA Microwave Limb Sounder MLS instrument flying aboard the Upper Atmosphere Research Satellite.
A giant horseshoe pattern of higher than normal sea-surface heights developing over the last year is beginning to dominate the entire western Pacific and Asiatic oceans.
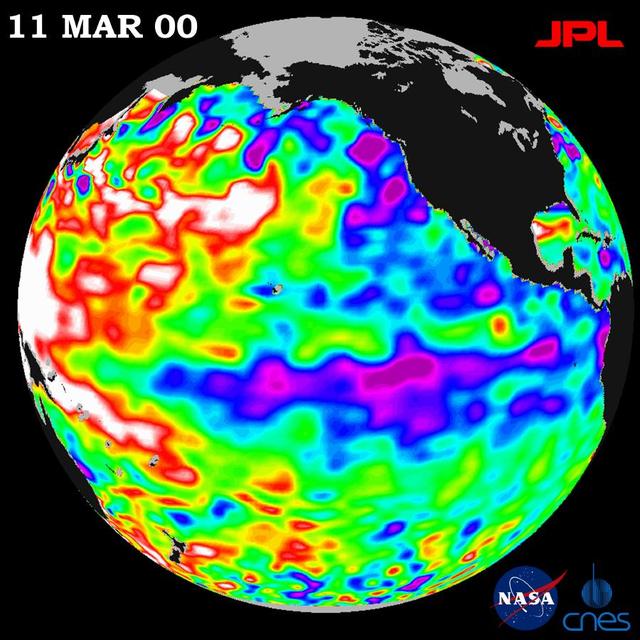
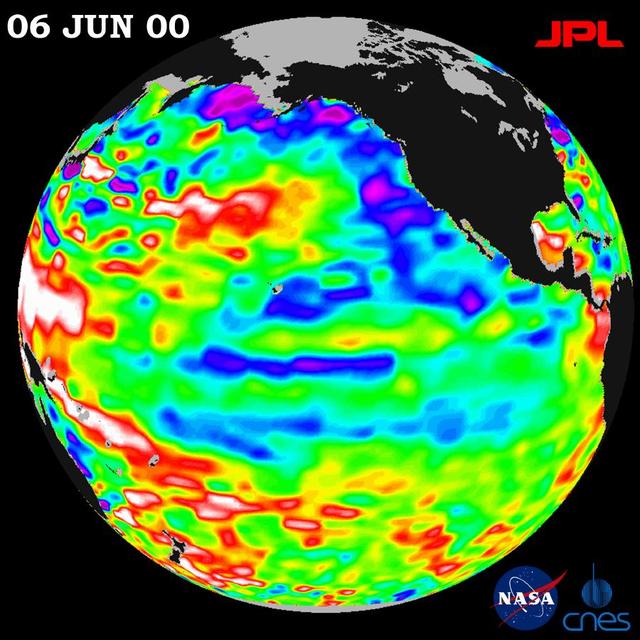
NASA TOPEX/Poseidon data, collected over a 10-day sampling cycle from March 1 to 11, 2000, showed a La Niña condition.
Unusually warm ocean temperatures off Asia and cool waters in the eastern and equatorial Pacific are signaling La Niña mild return, according to the latest sea-surface heights observed by the joint NASA-French space agency TOPEX/Poseidon satellite.
This animation shows global sea level data collected by the Surface Water and Ocean Topography (SWOT) satellite during its first 21-day science orbit, which it completed from July 26 to Aug. 16, 2023. Red and orange indicate ocean heights that were higher than the global mean sea surface height, while blue represents lower-than-the mean. Sea level differences can highlight ocean currents, like the Gulf Stream coming off the U.S. East Coast or the Kuroshio current off the east coast of Japan. Increased sea surface heights can also indicate regions of relatively warmer water – like the eastern part of the equatorial Pacific Ocean during an El Niño – because water expands as it warms. The SWOT science team made the measurements using the spacecraft's Ka-band Radar Interferometer (KaRIn) instrument. With two antennas spread 33 feet (10 meters) apart on a boom, KaRIn produces a pair of data swaths (tracks visible in the animation) as it circles the globe, bouncing radar pulses off the water's surface to collect surface-height measurements. Launched on Dec. 16, 2022, from Vandenberg Space Force Base in central California, SWOT is now in its operations phase, measuring the height of nearly all water on Earth's surface. The satellite will provide one of the most detailed, comprehensive views yet of the planet's oceans and fresh water lakes and rivers, collecting data that will be used for research and other purposes. Animation available at https://photojournal.jpl.nasa.gov/catalog/PIA26100
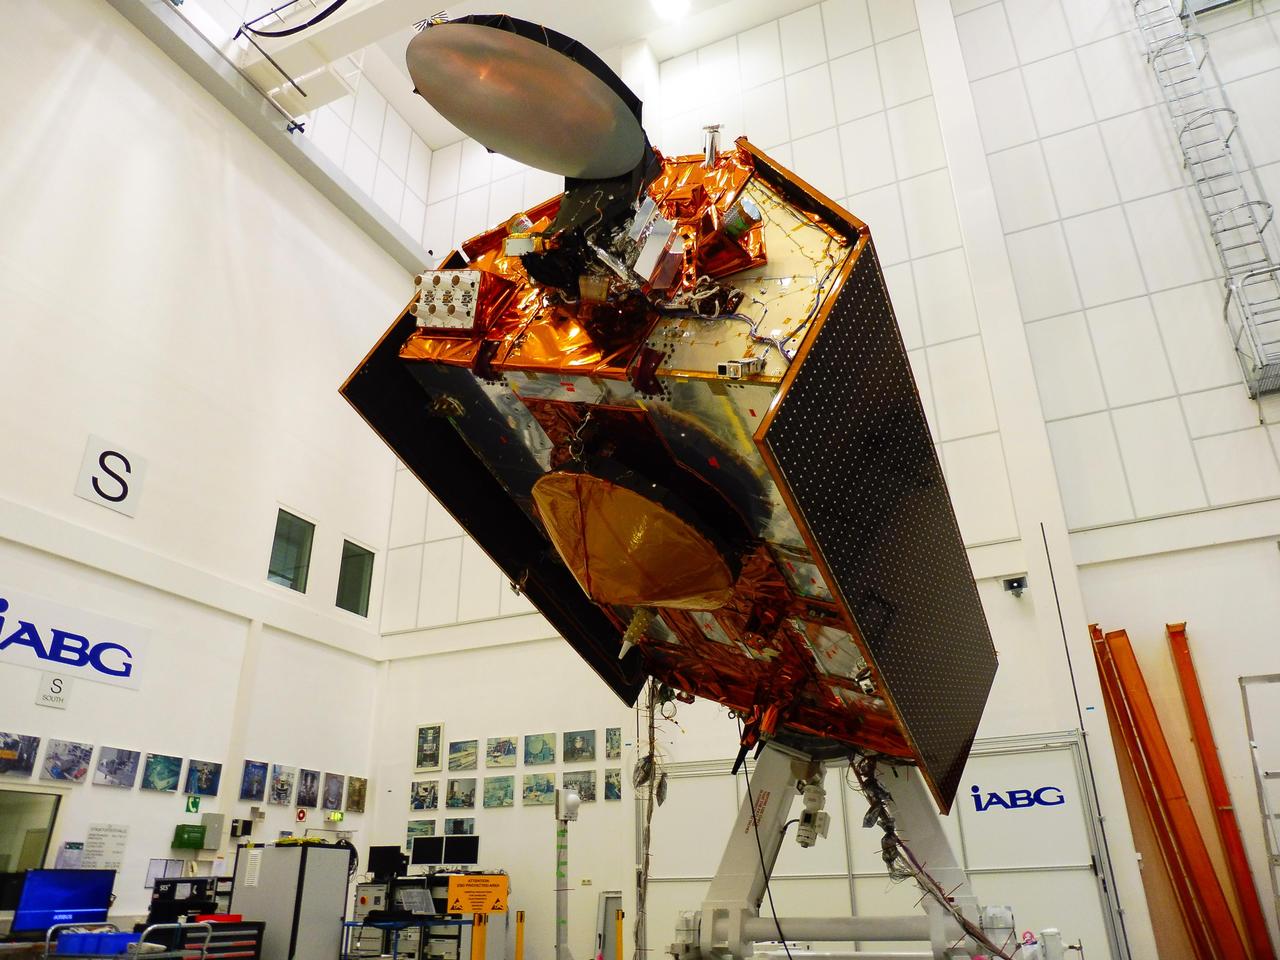
The Sentinel-6A spacecraft sits in its clean room in Germany's IABG space test center. The satellite is being prepared for a scheduled launch in November 2020 from Vandenberg Air Force Base in California. The spacecraft is part of Sentinel-6/Jason-CS, a 10-year mission by U.S and European agencies that will continue to study rising sea levels. The mission consists of two identical satellites, Sentinel-6A and Sentinel-6B, launching five years apart and follows in the footsteps of four other joint U.S.-European satellite missions — TOPEX/Poseidon and Jason-1, Ocean Surface Topography/Jason-2, and Jason-3 — that over the past three decades have documented Earth's oceans rising by an average of 0.1 inches (3 millimeters) per year. Sentinel-6/Jason-CS will study not just sea level change but also changes in ocean circulation, climate variability such as El Niño and La Niña, and weather patterns, including hurricanes and storms. It is being jointly developed by the European Space Agency (ESA), the European Organisation for the Exploitation of Meteorological Satellite (EUMETSAT), NASA and the National Oceanic and Atmospheric Administration (NOAA) with funding support from the European Commission and support from France's National Centre for Space Studies (CNES). NASA's contributions to the Sentinel-6 mission are science instrument payloads for the two Sentinel-6 satellites, launch services for those satellites, ground systems supporting the science instruments operations and support for the international Ocean Surface Topography Science Team. https://photojournal.jpl.nasa.gov/catalog/PIA23549
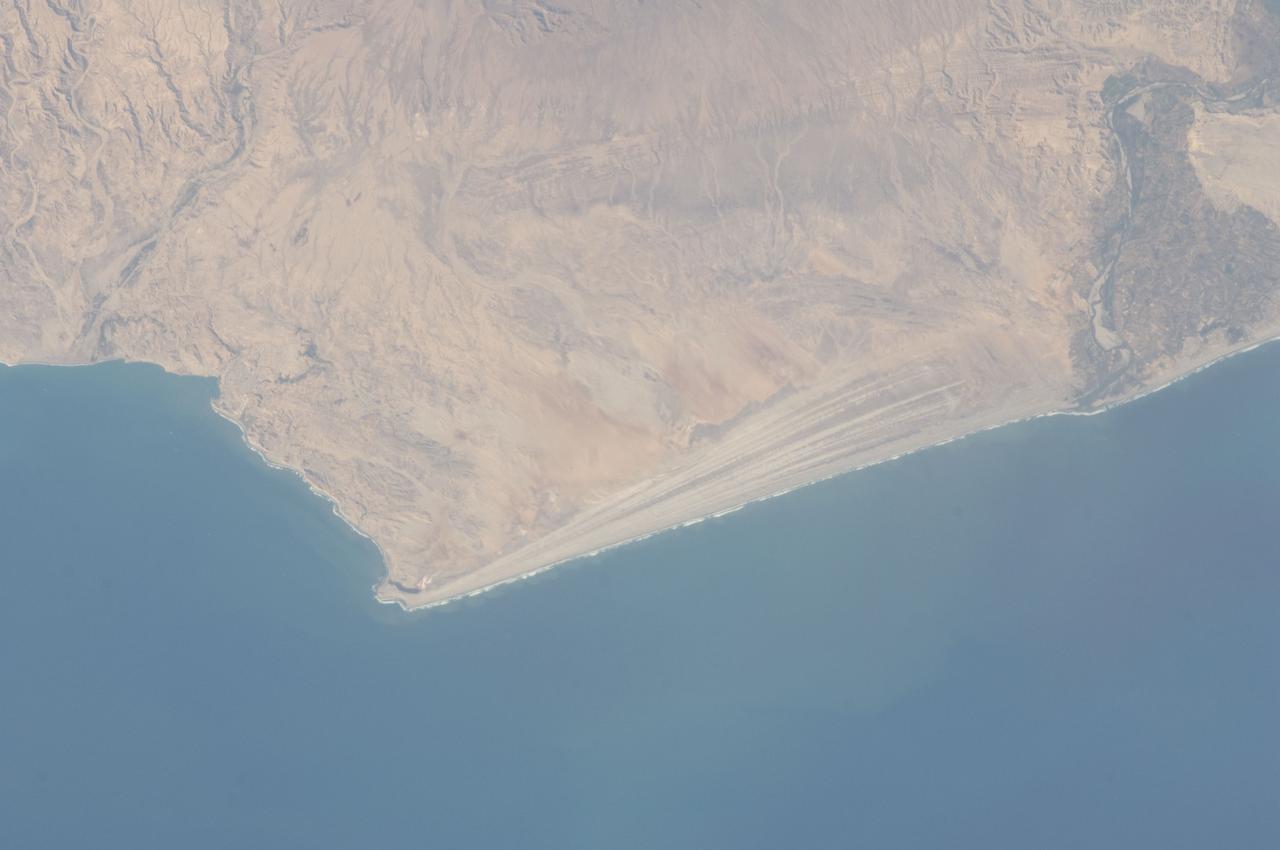
ISS032-E-016579 (11 Aug. 2012) --- A strandplain on coastal Peru is featured in this image photographed by an Expedition 32 crew member on the International Space Station. The scale and orientation of landscape features that are difficult to see on the ground often become readily visible from orbit. Numerous subparallel lines (center) along the arid, northern coast of Peru (about five degrees south of the Equator) are close-packed beach ridges, known collectively as a strandplain (for scale, the strandplain is 30 kilometers long). Each ridge shows the position of a prior shoreline. The Chira River delta appears at right, with dark green agricultural fields occupying the delta of the river. A smaller river reaches the sea, without forming a delta, at extreme left. The prominent cape at lower left is Punta Balcones, a region with many oil wells. Strandplains are built by successive additions of beach sand usually from some nearby source. Currents on this coast of South America come from the south, suggesting to scientists that the Chira River delta (right) is the source of the sand. The newest beach is being formed today by the waves?which appear as the thin ragged white line along the strandplain?supplied by the north-flowing current. The regularity of the spacing of the beaches suggests that some episodic influx of sediment controls beach formation. This influx may be determined by floods coming down the Chira River, possibly controlled by the heavy rains of El Nino events which occur irregularly every few years. Two other sets of faint parallel lines can be seen on higher ground inland (between arrows, center and top right), the upper set stretching all the way from the Chira river floodplain. Seen in many places along the coast of Peru, scientists believe these may also be strandplains (i.e. formed at sea level) generated when the land surface was at a lower altitude; both also may have been produced by sand from the Chira River. The land surface is known to be rising along this coast with the rise of the Andes Mts. (outside the top of the image), explaining why the upper shorelines now lie 120 meters above sea level.