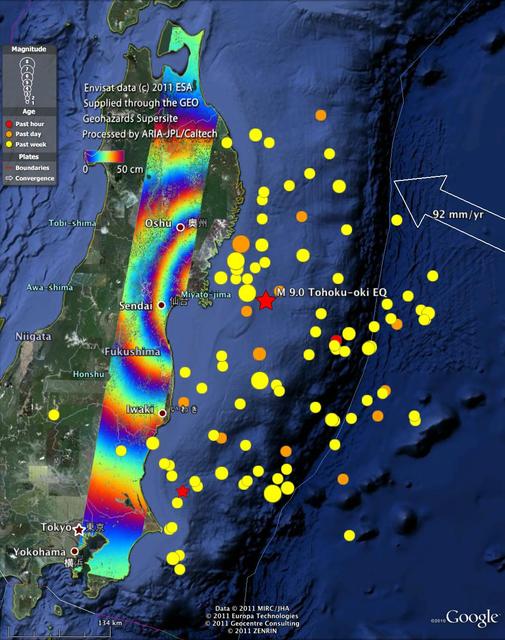
This radar image from ESA Envisat depicts ground displacements resulting from the March 11, 2011, magnitude 9.0 Tohoku earthquake in Japan.
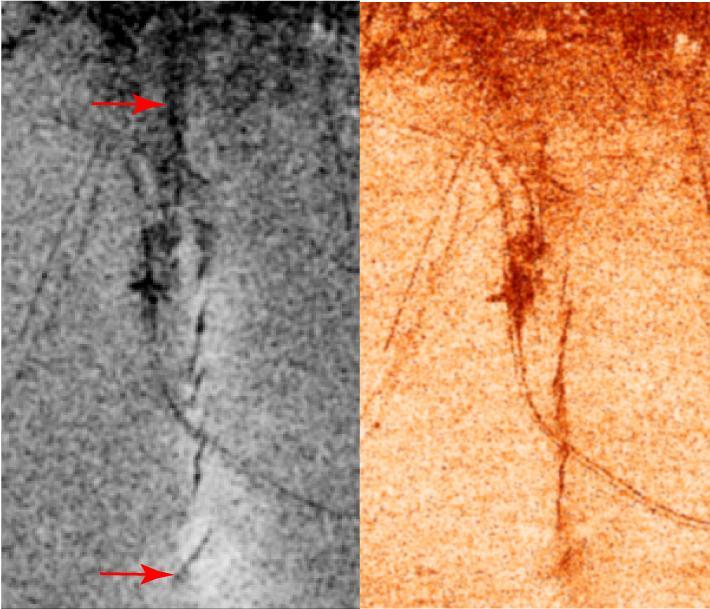
A magnitude 6.5 earthquake devastated the small city of Bam in southeast Iran on December 26, 2003. The two images from ESA Envisat show similar measures of the radar interferometric correlation in grayscale on the left and in false colors on the right.

This radar image, called a coseismic interferogram, using satellite data from the European Space Agency Envisat depicts ground displacements resulting from the March 11, 2011, magnitude 9.0 Tohoku earthquake in Japan.
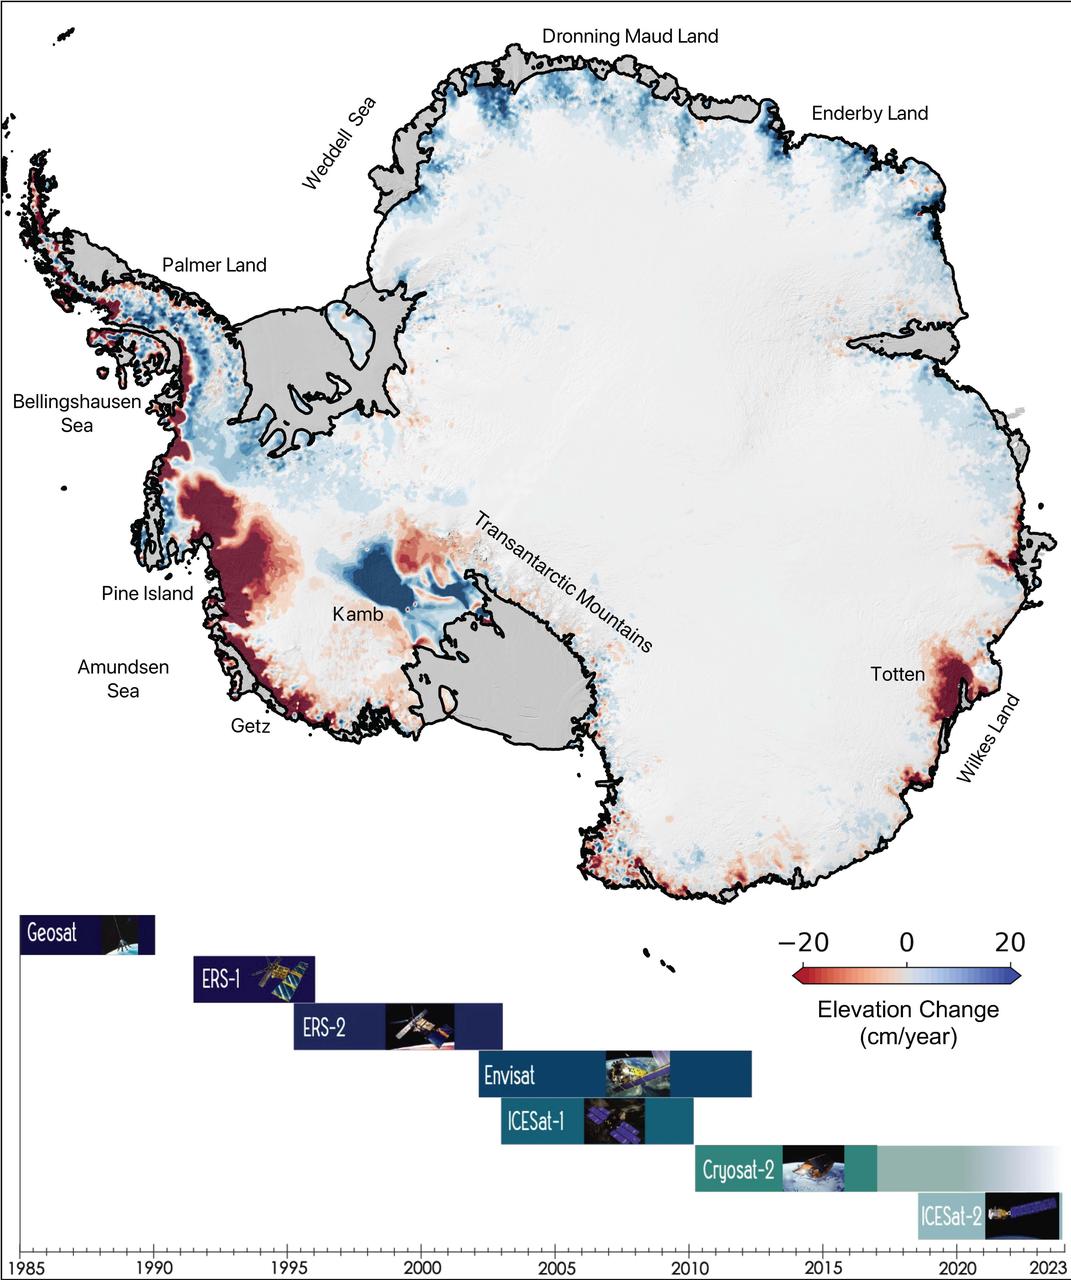
This map of Antarctica shows the changes in the elevation of the Antarctic ice sheet from 1985 through 2021. The map is part of a study, published in Earth System Science Data, conducted by researchers at NASA's Jet Propulsion Laboratory in Southern California. Ice height diminishes (shown in red) as the ice sheet melts by contact with ocean water; ice height rises (shown in blue) where accumulation exceeds ice loss. Ice shelves are shown in gray. The Pine Island and Thwaites glaciers in West Antarctica (the dark red spots on the left side of the map) are the largest areas of rapid ice loss. The stagnant Kamb Ice Stream (the dark blue area at middle-left) is the only major site of rapid accumulation as ice continues to push in from the interior but no longer flows out to an ice shelf. The image summarizes a new data set of monthly high-resolution "snapshots" of ice change. The satellite altimetry missions that supplied data for the study are listed in the timeline at the bottom of the image: Geosat (U.S. Navy), ERS-1 and ERS-2 (ESA, or European Space Agency), Envisat (ESA), ICESat-1 (NASA), Cryosat-2 (ESA), and ICESat-2 (NASA). https://photojournal.jpl.nasa.gov/catalog/PIA24990

This animation, created in 2012, shows the increasing clarity and detail of measurements of sea height made by successive satellite altimeters launched by NASA and other agencies over the past four decades, concluding with data at the resolution possible with the Surface Water and Ocean Topography (SWOT) satellite, expected to launch in December 2022. Each new spacecraft has been able to obtain higher-resolution observations than its predecessors. Sea height is key to understanding how much, and how fast, the oceans are rising in a warming climate. The animation starts with Seasat, launched in 1978 as one of the NASA's earliest Earth-observing satellites, then moves to Geosat, a U.S. Navy spacecraft launched in 1985, and on to ERS-1, TOPEX/Poseidon, ERS-2, Jason-1, Envisat, and Jason-2. Since the end of the time period shown in the animation, subsequent satellites have continued measuring sea height, creating an ongoing, decadeslong record. In March 2022, Sentinel-6 Michael Freilich, a joint U.S.-European mission, became the official reference satellite for global sea level measurements. SWOT will be latest spacecraft to observe ocean heights from Earth orbit. Its measurements will provide unprecedented insights into the activity of small-scale currents and their impact on climate change. Researchers believe small-scale currents, which are less than 60 miles (100 kilometers) in size, have a significant influence on the ocean's ability to absorb atmospheric heat and carbon and thereby moderate global temperature change. To measure these currents, SWOT will employ the Ka-band Radar Interferometer (KaRIn), a new technology developed at NASA's Jet Propulsion Laboratory in Southern California that will offer even greater spatial resolution than previous instruments that studied the ocean. SWOT will survey the water in Earth's lakes, rivers, reservoirs, and the ocean. The satellite will cover the planet's surface twice every 21 days and has a prime mission of three years. It was jointly developed by NASA and France's Centre National d'Études Spatiales (CNES), with contributions from the Canadian Space Agency (CSA) and the UK Space Agency. JPL, a division of Caltech in Southern California, manages the U.S. portion of the mission for NASA. Animation available at https://photojournal.jpl.nasa.gov/catalog/PIA25561