This frame from an animation depicts variations in surface elevation resulting from the discharge and recharge of groundwater basins in Southern California.
Southern California INSAR Time Series
This figure shows a comparison of interferograms from four different years mapping the rapid ground subsidence over the Lost Hills oil field in California.
Lost Hills, California Interferogram
This animation depicts a time-series of ground deformation at Mount Etna Volcano between 1992 and 2001. The deformation results from changes in the volume of a shallow chamber centered approximately 5 km 3 miles below sea level.
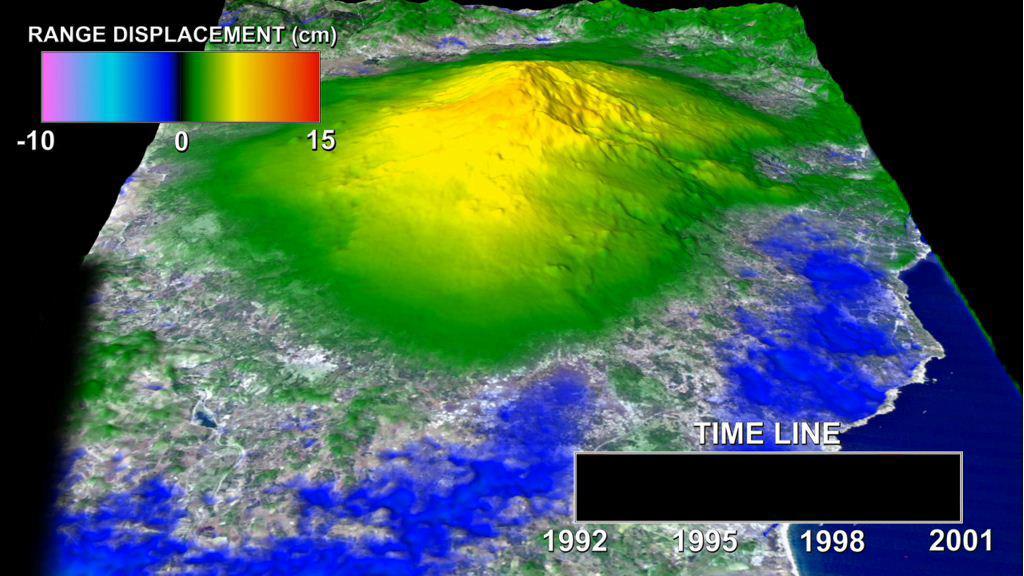
Mount Etna InSAR Time Series Animation
This image of California Hayward fault is an interferogram created using a pair of images taken by ESA ERS-1 and ERS-2 in June 1992 and September 1997 over the central San Francisco Bay in California.
Hayward Fault, California Interferogram
A magnitude 6.6 earthquake struck a sparsely inhabited area of southeast Iran on March 14, 1998, at 11:10 p.m. local time.
Shahdad, Southeast Iran, Radar Interferometry -- Silent Earthquake, Perspective View