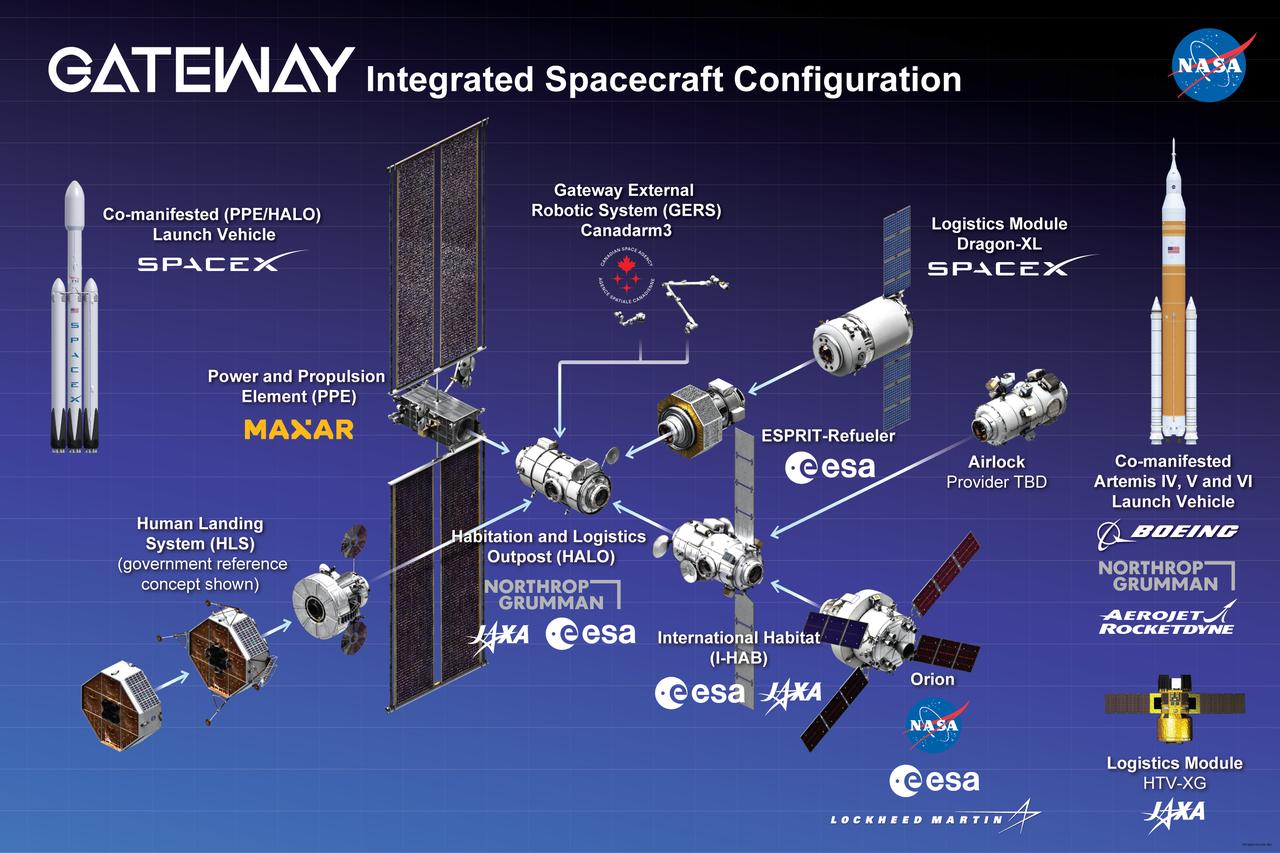
And expanded view of the Gateway space station showing each of its elements, international partner contributions, and visiting spacecraft including Orion and the Human Landing System, with prime contractors.
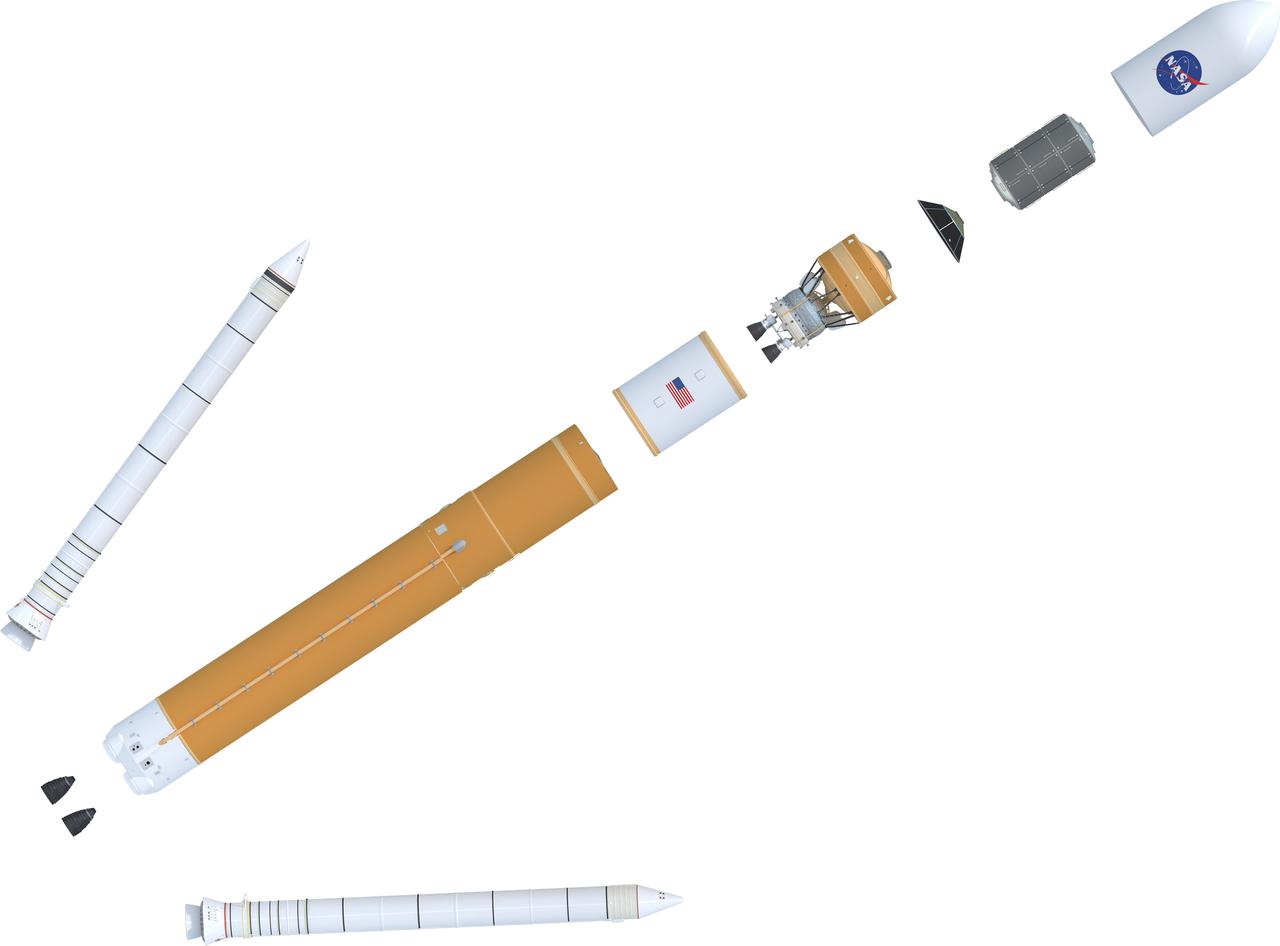
Expanded view illustration of elements of the evolved SLS Block 1B Crew variant. This configuration of the rocket, with the Exploration Upper Stage, will provide in-space propulsion to send astronauts in NASA’s Orion spacecraft and heavy cargo on a precise trajectory to the Moon. The evolution of the rocket to SLS Block 1B configuration with EUS enables SLS to launch 40% more cargo to the Moon along with the crew. Manufacturing both the core stage and Exploration Upper Stage is a collaborative effort between NASA and Boeing, the lead contractor for EUS and the SLS core stage. SLS is the only rocket that can send Orion, astronauts, and supplies to the Moon in a single mission. The SLS rocket, NASA’s Orion spacecraft, Gateway, and human landing system are part of NASA’s backbone for deep space exploration. Under the Artemis program, NASA is working to land the first woman and the next man on the Moon to pave the way for sustainable exploration at the Moon and future missions to Mars. (NASA)
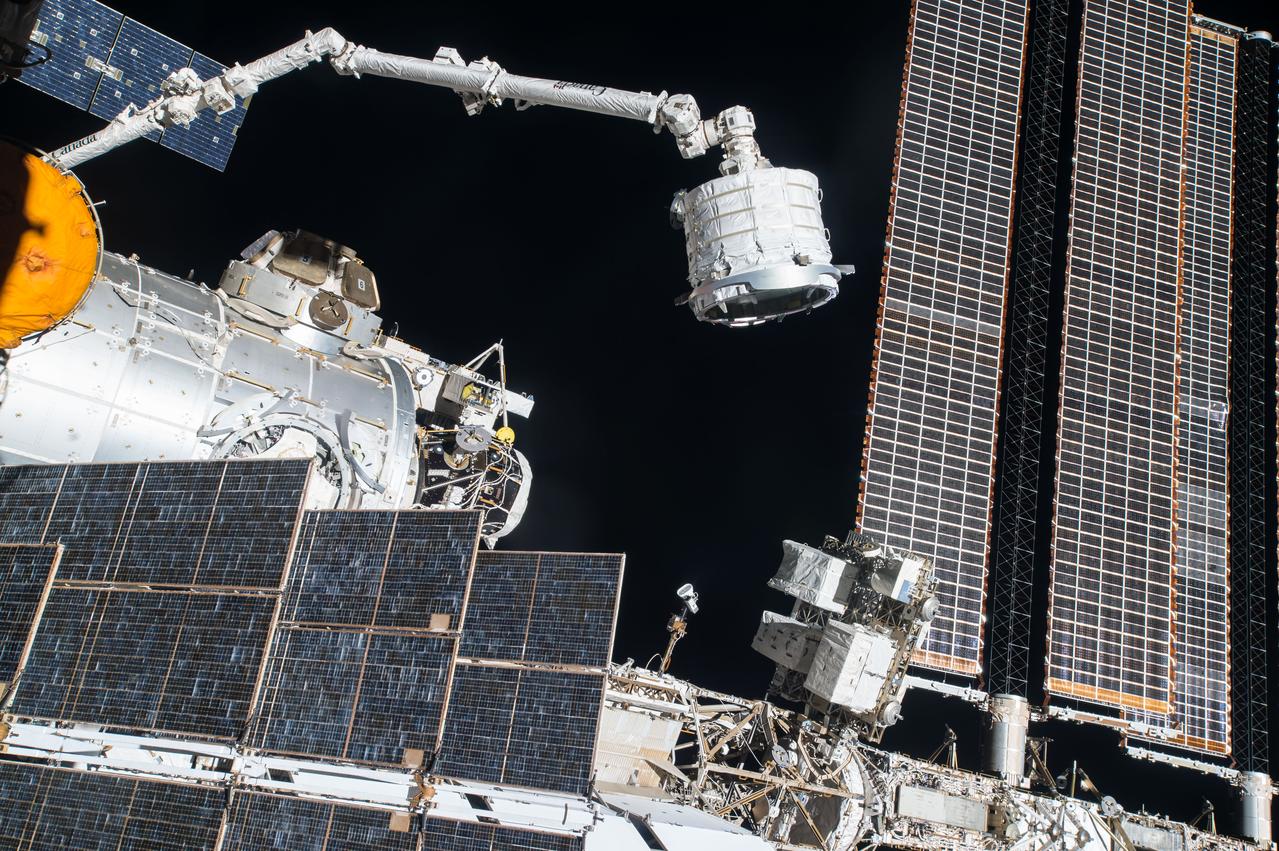
iss047e061107 (4/16/2016) --- View of Bigelow Expandable Activity Module (BEAM) attached to Canadarm2 Robotic Arm. The Bigelow Expandable Activity Module (BEAM) is an experimental expandable capsule that docks with the International Space Station (ISS). After docking, BEAM inflates to roughly 13 feet long and 10.5 feet in diameter to provide a habitable volume where a crew member can enter.
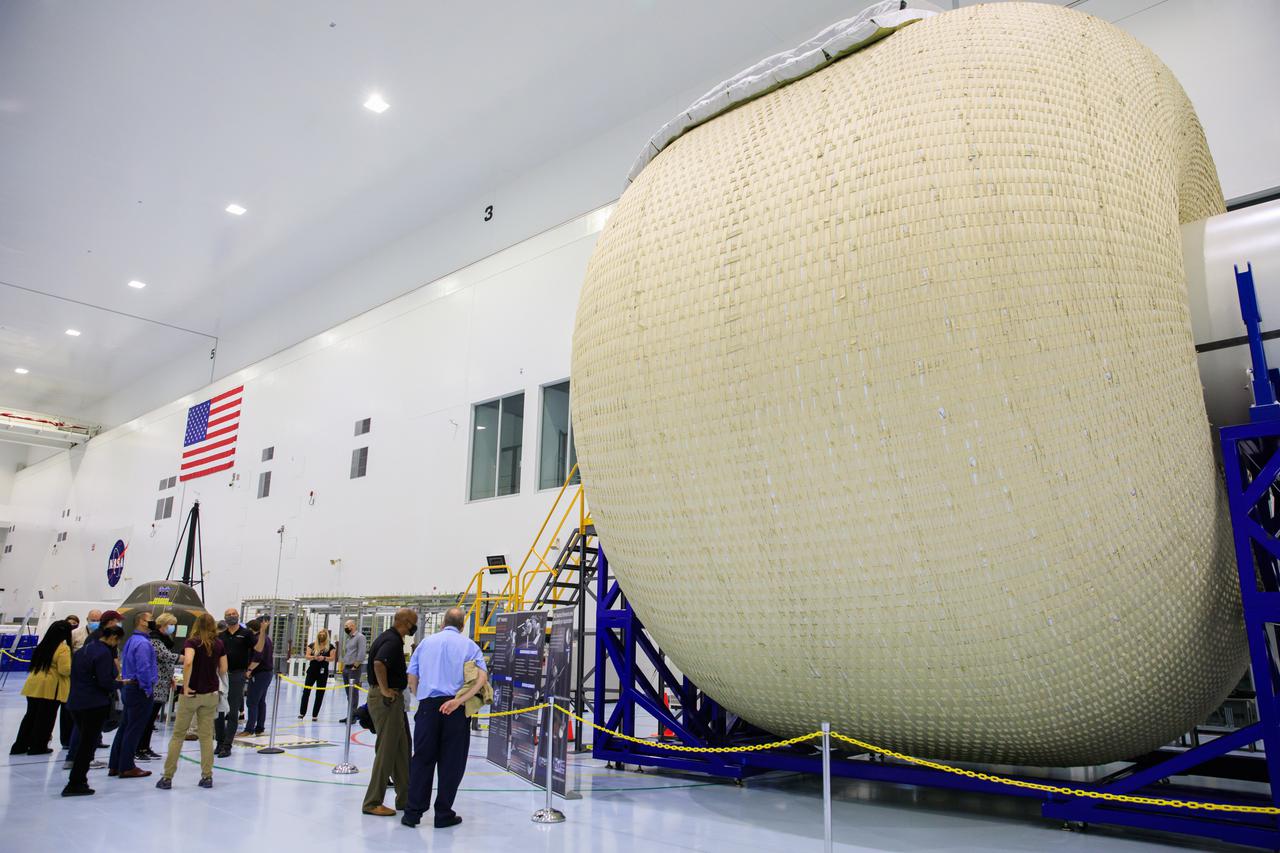
Senior leaders with Kennedy Space Center in Florida, familiarize newly appointed officials from NASA Headquarters with the center’s facilities during a tour on April 19, 2021. The group views Sierra Nevada’s Large Inflatable Fabric Environment (LIFE) habitat inside the Space Station Processing Facility high bay. The habitat is an expandable habitat. Expandable habitats have the benefit of greatly decreasing the amount of volume it takes to launch the habitat, which can then inflate once it is in space.
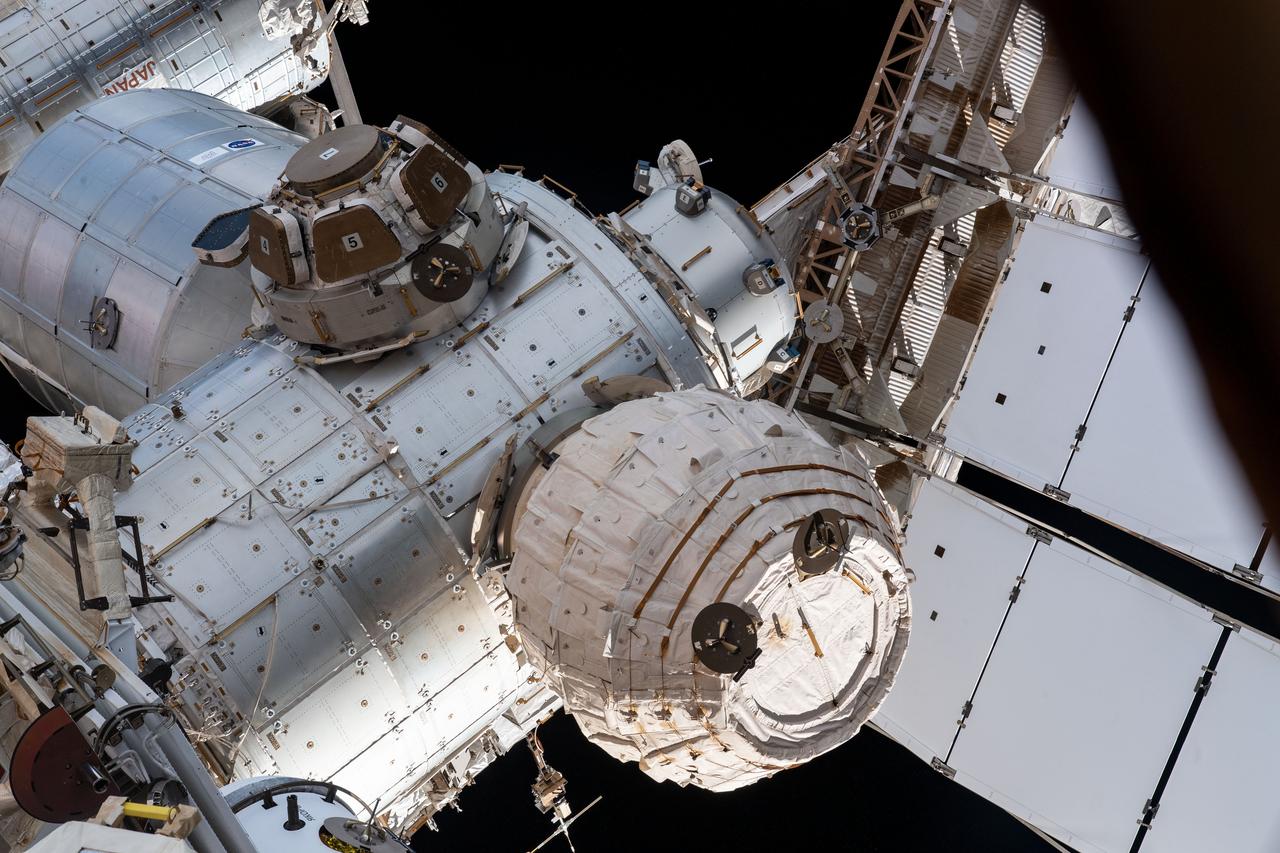
iss067e214089 (Aug. 2, 2022) --- This view from a window on the International Space Station's Russian segment shows the Bigelow Expandable Activity Module (BEAM), the cupola with its seven windows shuttered, and the NanoRacks Bishop airlock. Behind the cupola is the Leonardo permanment multipurpose module. All four components are attached to the Tranquility module.
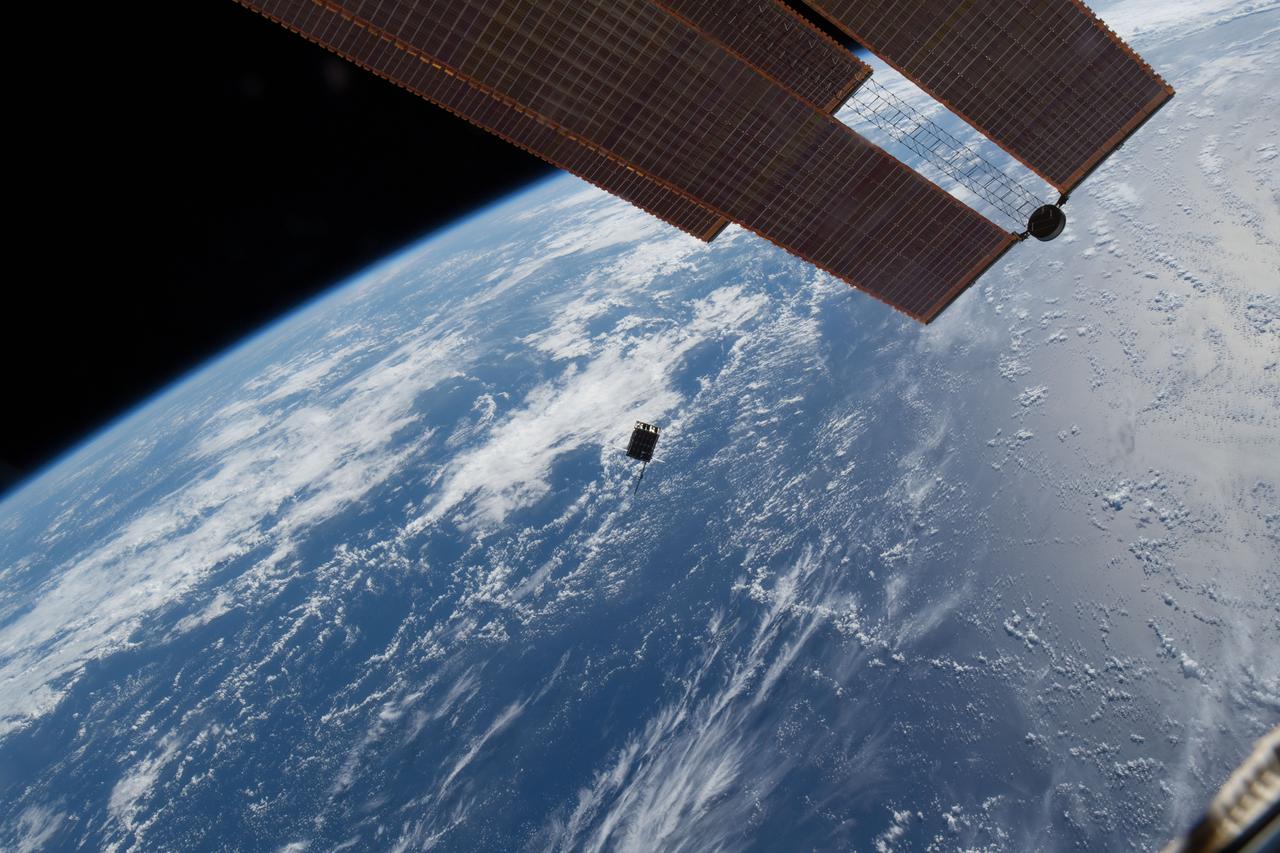
iss053e235256 (11/20/2017) --- A view of the Dellingr/RBLE Satellite deployment from the NanoRacks CubeSate Deployer Number 13 aboard the International Space Station (ISS). Dellingr/RBLE expands understanding of space weather risk by establishing baseline estimates of magnetic variation and particle fluxes in the exosphere. The instrument also observes cause and effect relationships between solar events and Earth’s atmosphere, which advances fundamental understanding of electromagnetic dynamics in the space environment.
iss053e235231 (11/20/2017) --- A view of the Dellingr/RBLE Satellite deployment from the NanoRacks CubeSate Deployer Number 13 aboard the International Space Station (ISS). Dellingr/RBLE expands understanding of space weather risk by establishing baseline estimates of magnetic variation and particle fluxes in the exosphere. The instrument also observes cause and effect relationships between solar events and Earth’s atmosphere, which advances fundamental understanding of electromagnetic dynamics in the space environment.
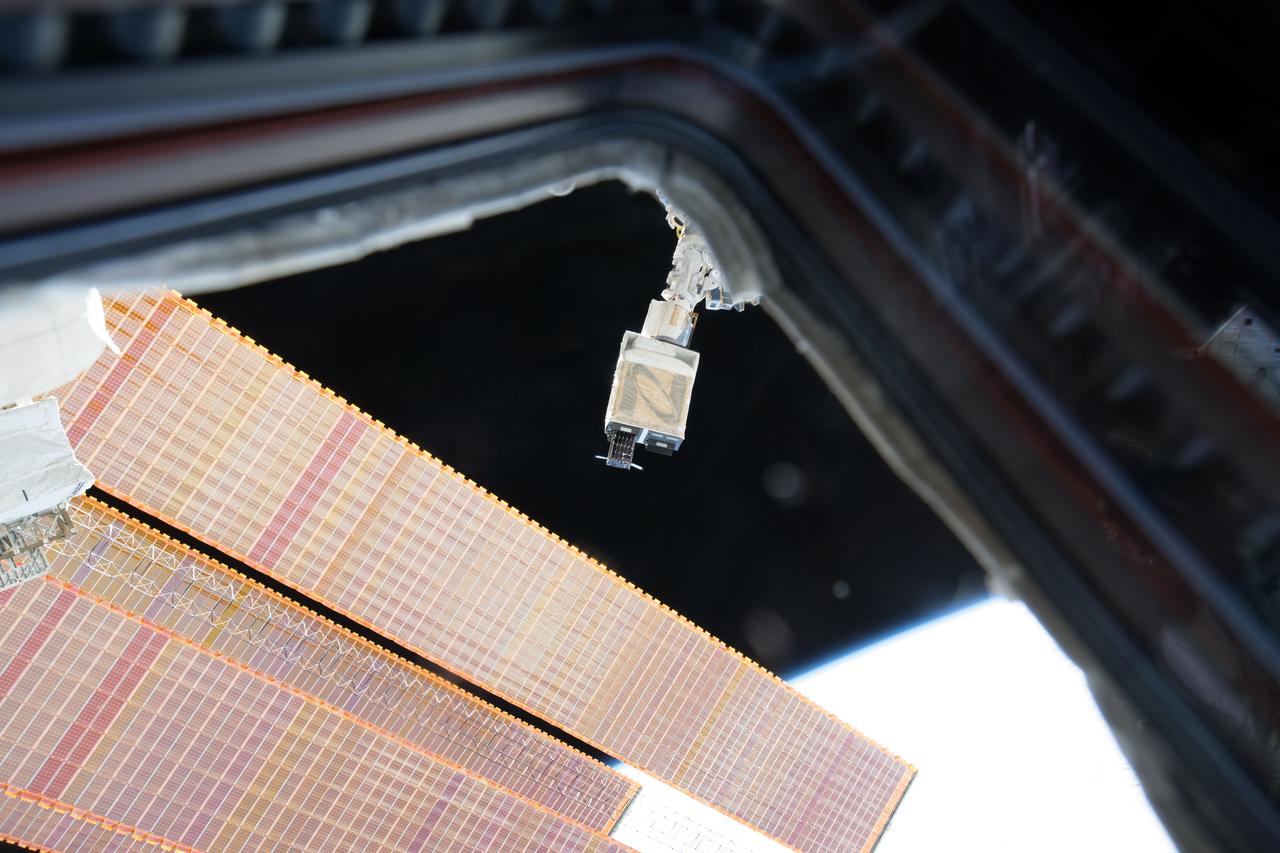
iss053e235238(11/20/2017) --- A view of the Dellingr/RBLE Satellite deployment from the NanoRacks CubeSate Deployer Number 13 aboard the International Space Station (ISS). Dellingr/RBLE expands understanding of space weather risk by establishing baseline estimates of magnetic variation and particle fluxes in the exosphere. The instrument also observes cause and effect relationships between solar events and Earth’s atmosphere, which advances fundamental understanding of electromagnetic dynamics in the space environment.
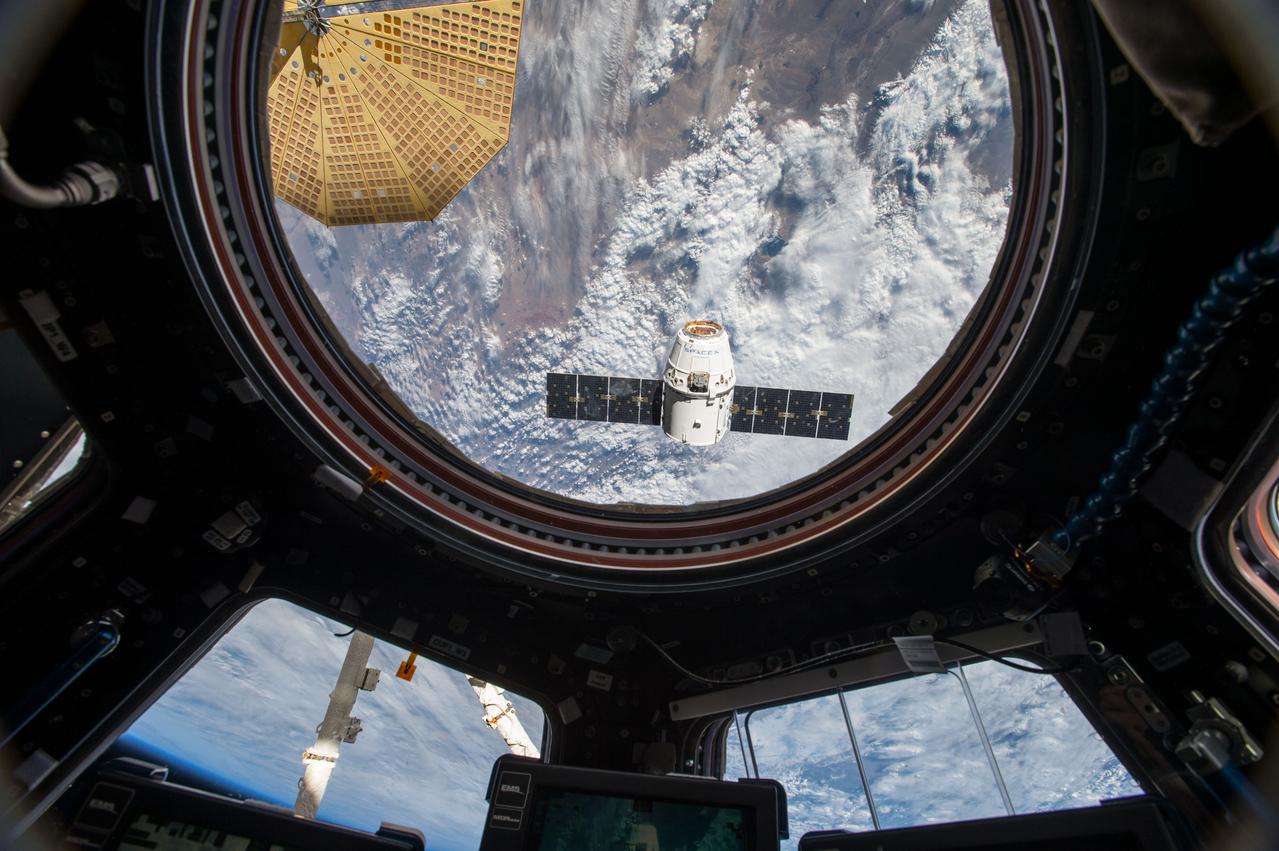
ISS047e050792 (04/10/2016) --- The SpaceX Dragon cargo craft approaches to be grappled by the International Space Station Expedition 47 crew. This view is from the Cupola where the primary controls of the Canadarm 2 are located. Crewmembers use the robotic arm to grapple the spaceship before berthing it to the Earth-facing port on the Harmony module. The spacecraft delivered about 7,000 pounds of science and research investigations, including the Bigelow Expandable Activity Module, known as BEAM.
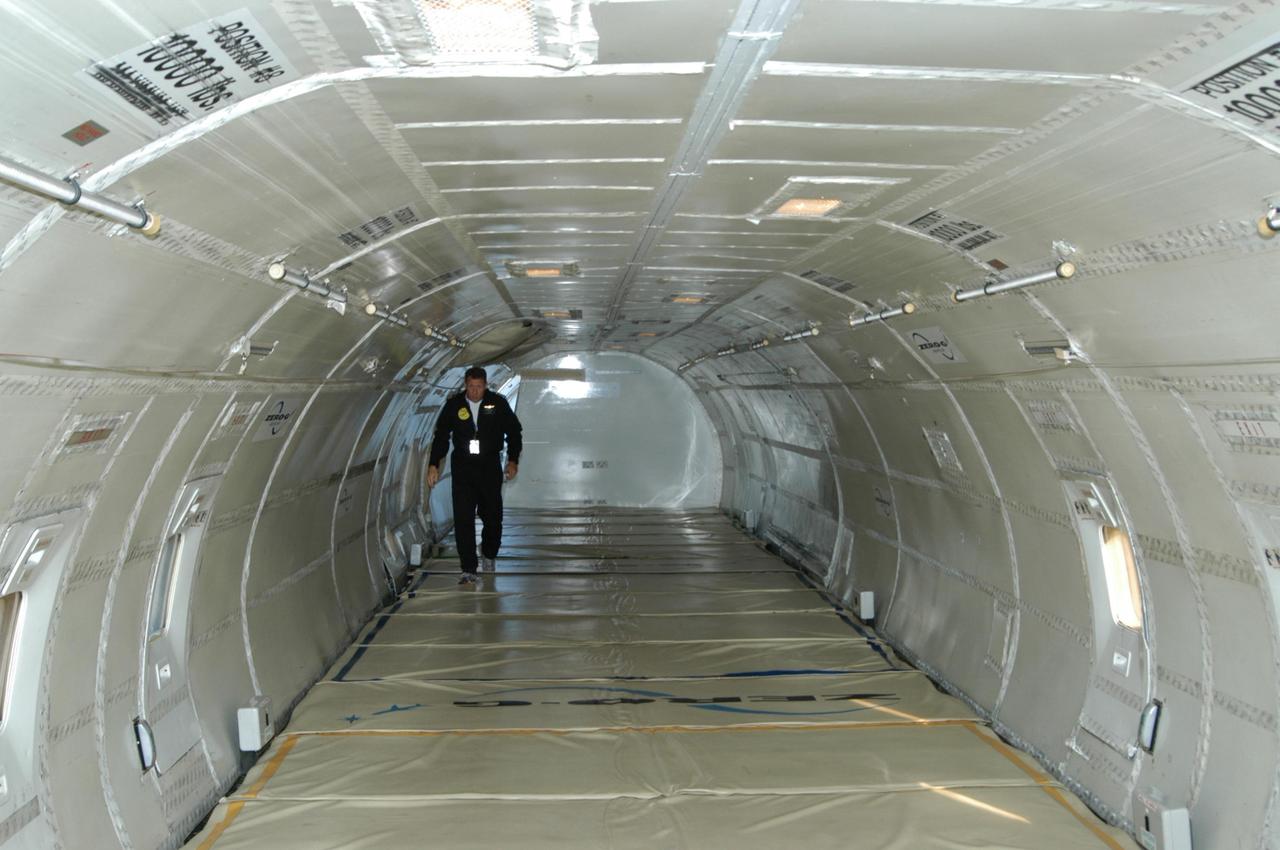
KENNEDY SPACE CENTER, FLA. - A view inside the Boeing 727-200 aircraft used for weightless flights by Zero Gravity Corporation, known as ZERO-G, of Fort Lauderdale, Fla. NASA and ZERO-G demonstrated Nov. 5 the expanded access to and use of the space shuttle's runway and landing facility at Kennedy Space Center for non-NASA activities. A group of passengers, called "Flyers," were predominantly teachers who performed simple microgravity experiments they can share with their students back in the classroom.
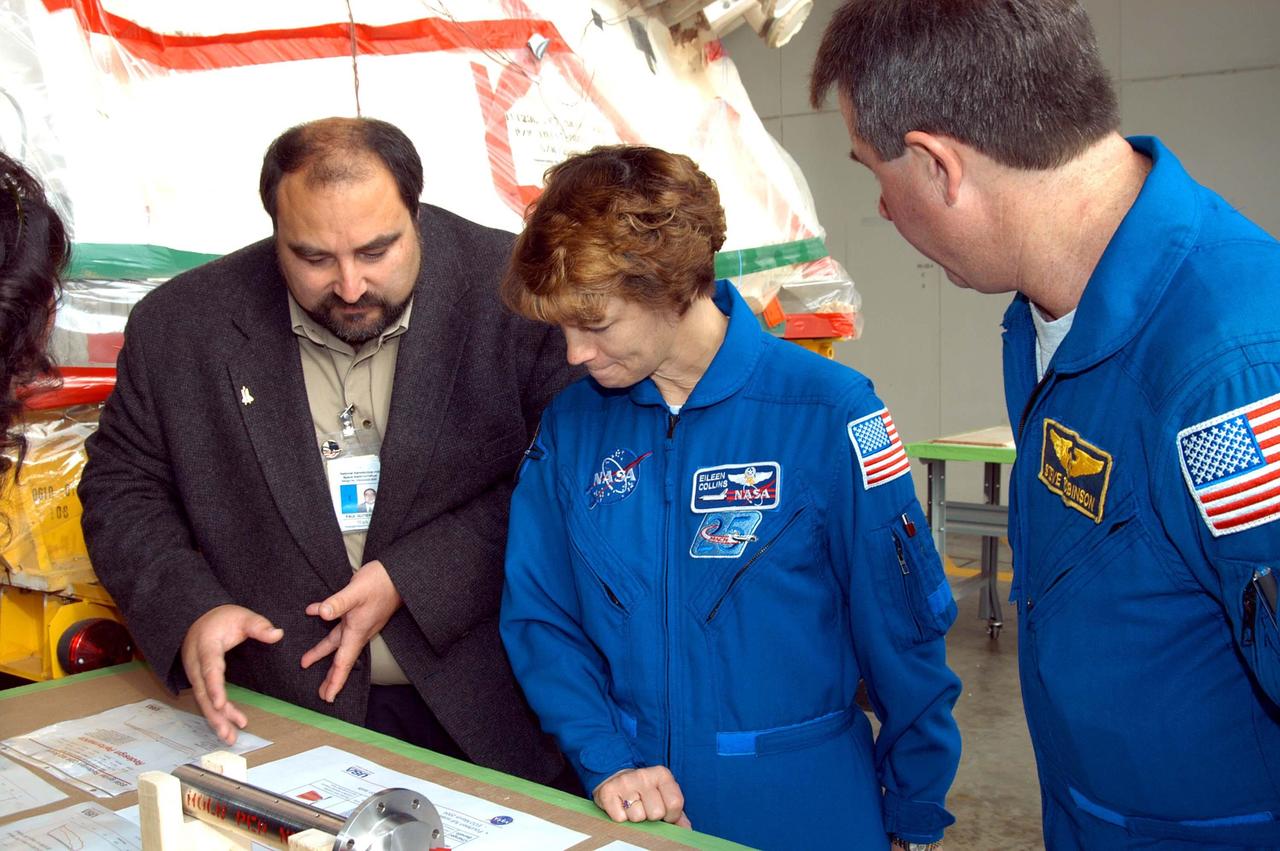
KENNEDY SPACE CENTER, FLA. - At the SRB Assembly and Refurbishment Facility, STS-114 Eileen Collins (center) and Mission Specialist Stephen Robinson look on the table at a mockup of a booster separation motor (BSM) igniter and expanded views of the BSM and igniter. At left is Paul Gutierrez, SRB associate program manager with United Space Alliance. The crew is at KSC for familiarization with Shuttle and mission equipment. The STS-114 mission is Logistics Flight 1, which is scheduled to deliver supplies and equipment, plus the external stowage platform, to the International Space Station.
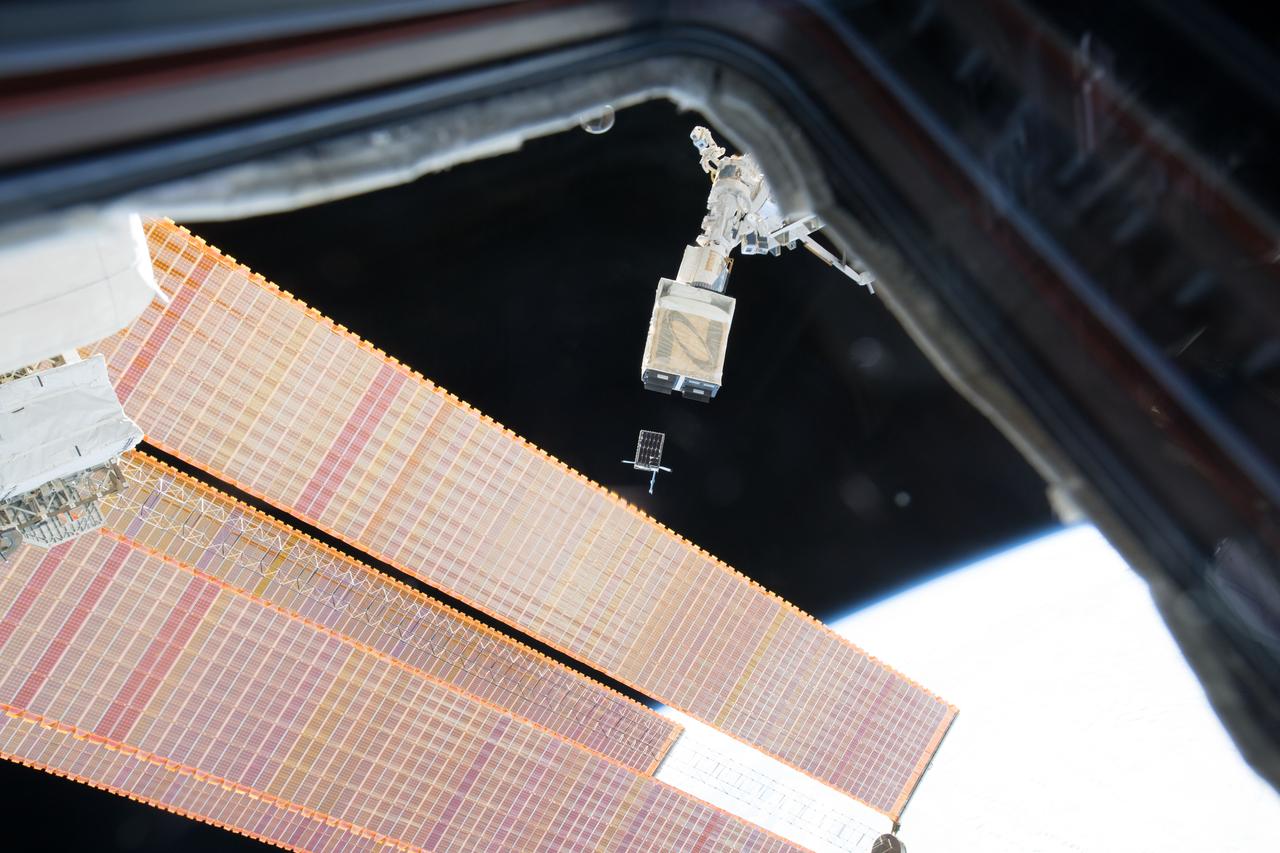
iss053e235232 (11/20/2017) --- A view of the Dellingr/RBLE Satellite deployment from the NanoRacks CubeSate Deployer Number 13 aboard the International Space Station (ISS). Dellingr/RBLE expands understanding of space weather risk by establishing baseline estimates of magnetic variation and particle fluxes in the exosphere. The instrument also observes cause and effect relationships between solar events and Earth’s atmosphere, which advances fundamental understanding of electromagnetic dynamics in the space environment.
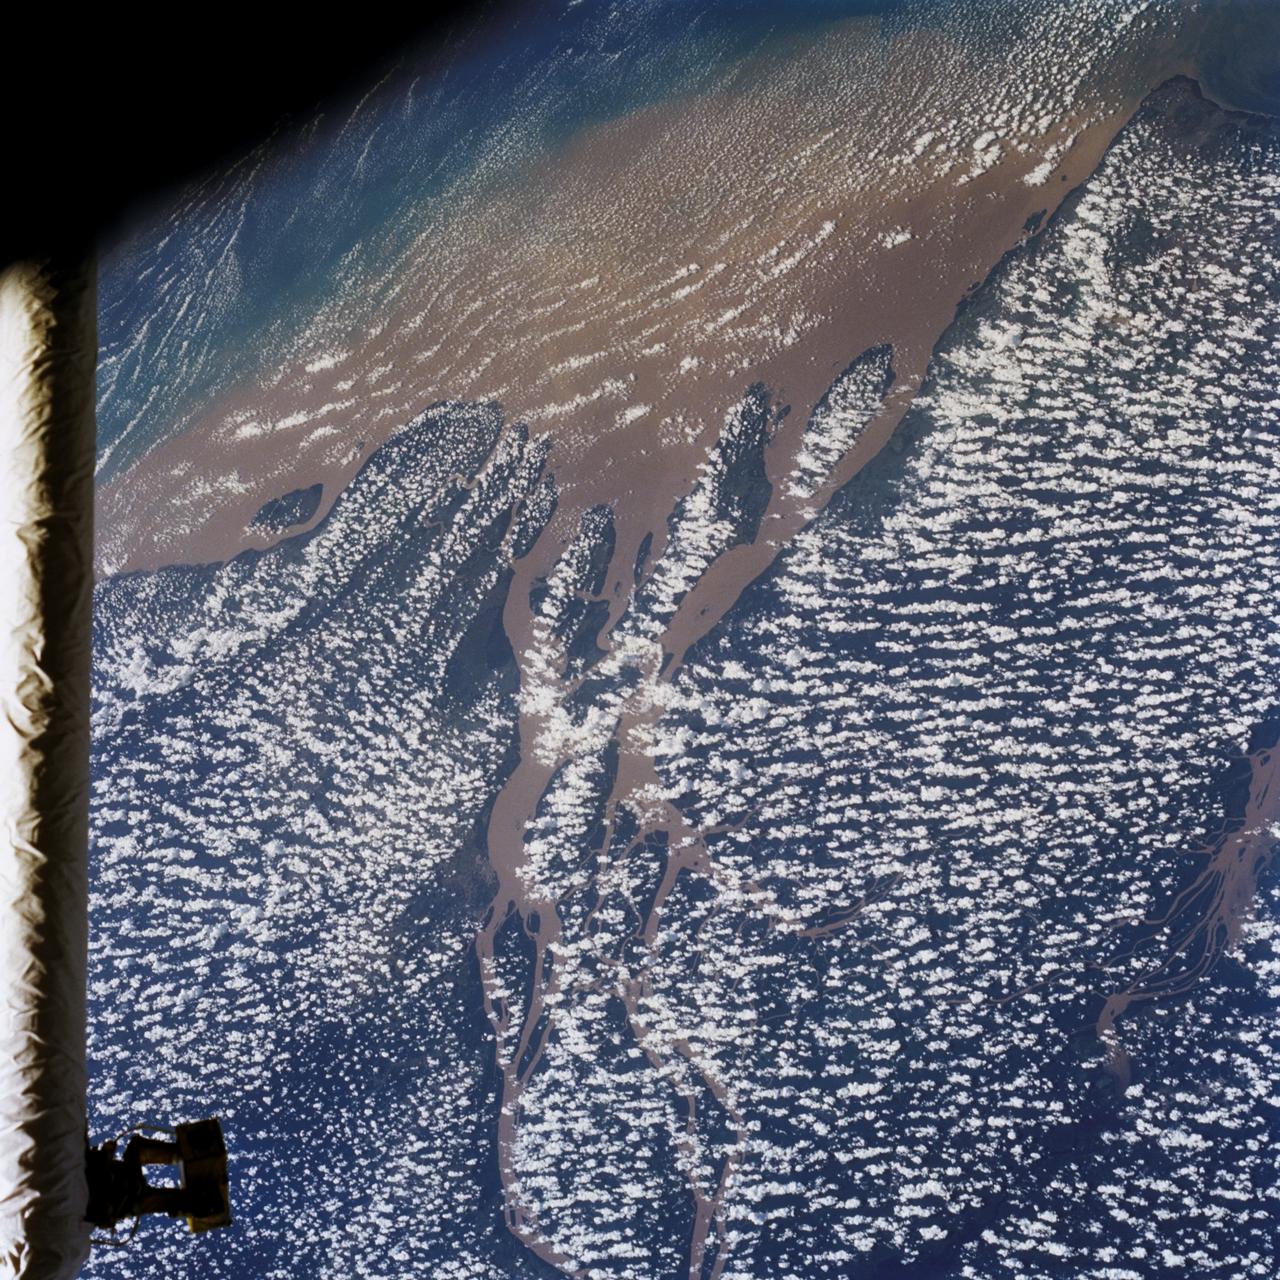
STS046-80-009 (31 July-8 Aug. 1992) --- A view of the mouth of the Amazon River and the Amazon Delta shows a large sediment plume expanding outward into the Atlantic Ocean. The sediment plume can be seen hugging the coast north of the Delta. This is caused by the west-northwest flowing Guyana Current. The large island of Marajo is partially visible through the clouds.

An expanded view of comet C/2006 W3 (Christensen) is shown here. The WISE spacecraft observed this comet on April 20th, 2010 as it traveled through the constellation Sagittarius. Comet Christensen was nearly 370 million miles (600 million kilometers) from Earth at the time. The extent of the dust, about a tenth of a degree across in this image, is about 2/3rds the diameter of the sun. The red contours show the signal from the gas emission observed by the WISE spacecraft in the 4.6 micron wavelength channel, which contains carbon monoxide (CO) and carbon dioxide (CO2) emission lines. The strength of the 4.6 micron signal indicates over half a metric ton per second of CO or CO2 was emitted from this comet at the time of the observations. The WISE spacecraft was put into hibernation in 2011 upon completing its goal of surveying the entire sky in infrared light. WISE cataloged three quarters of a billion objects, including asteroids, stars and galaxies. In August 2013, NASA decided to reinstate the spacecraft on a mission to find and characterize more asteroids. http://photojournal.jpl.nasa.gov/catalog/PIA20119
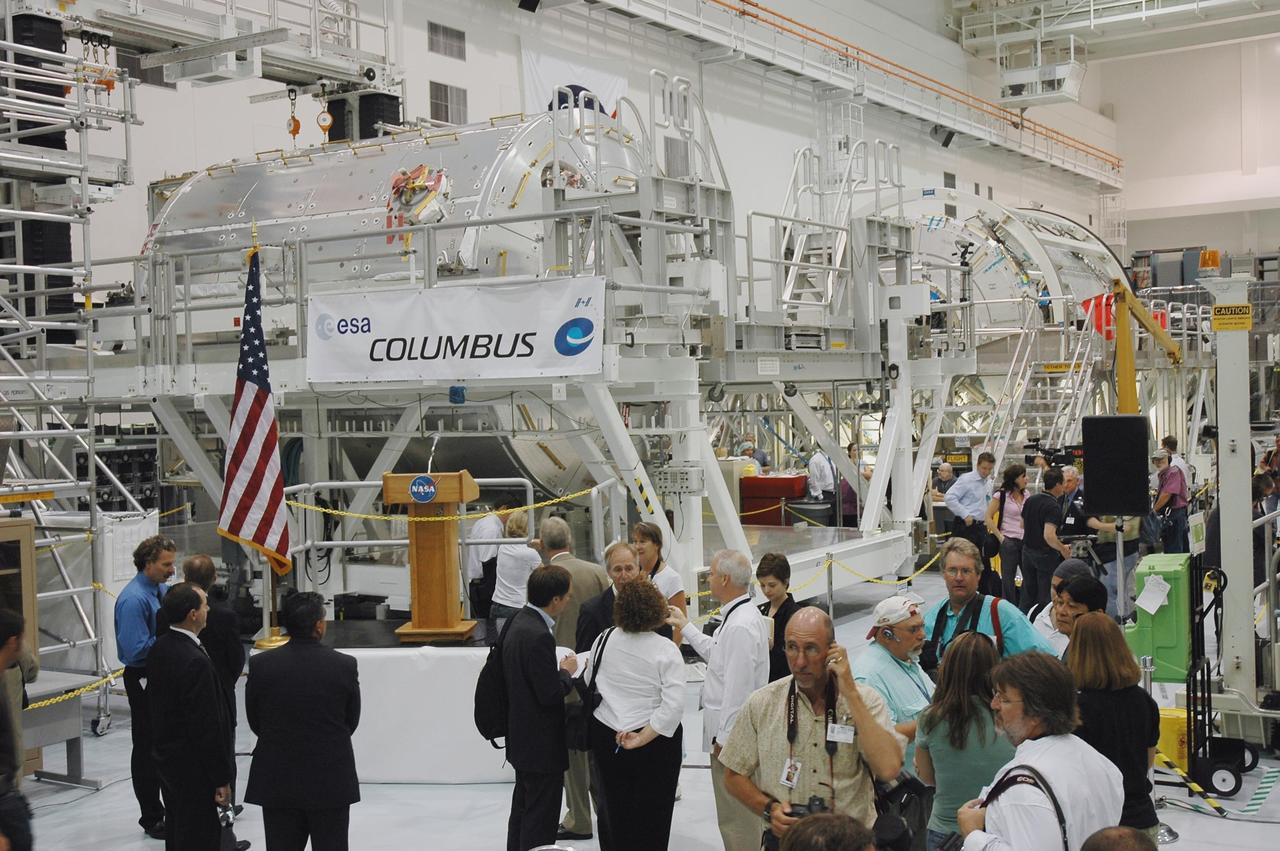
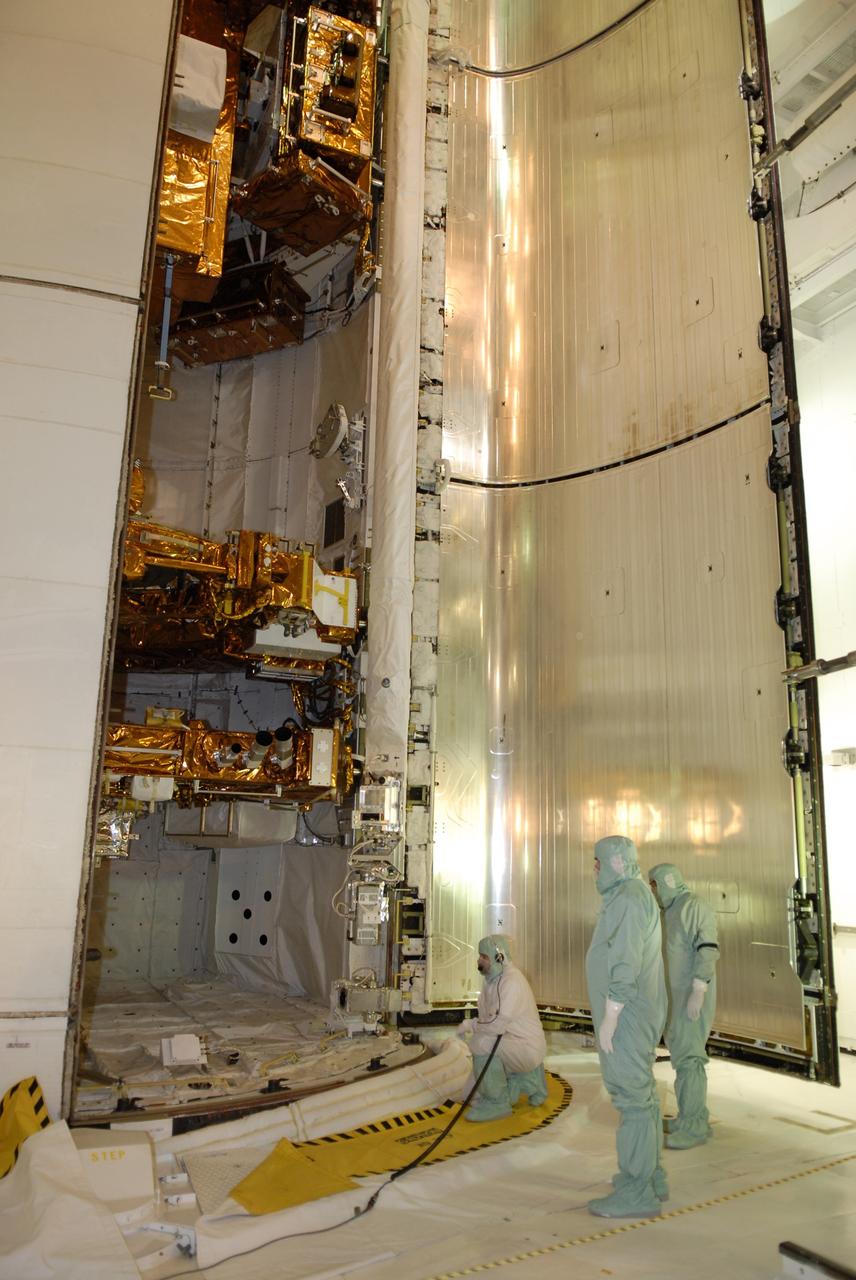
KENNEDY SPACE CENTER, FLA. - The European Space Agency's Columbus module rests on a work stand in view of media representatives and invited guests following a ceremony to welcome the module into the Space Station Processing Facility (SSPF). Columbus is the European Space Agency's research laboratory for the International Space Station. The module will be prepared in the SSPF for delivery to the space station on a future space shuttle mission. Columbus will expand the research facilities of the station and provide researchers with the ability to conduct numerous experiments in the life, physical and materials sciences. Photo credit: NASA/Amanda Diller
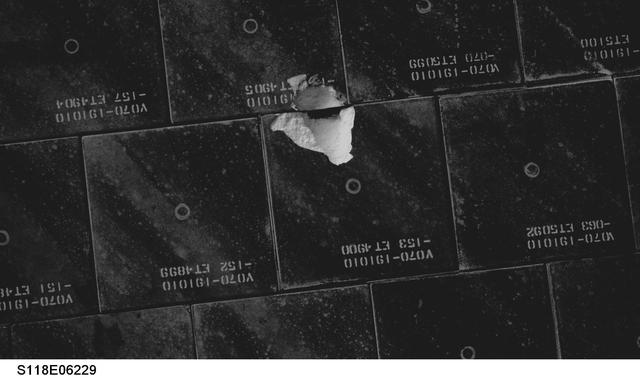
KENNEDY SPACE CENTER, FLA. -- This is a view taken by the astronauts during orbit of damaged tiles on the underside of Endeavour. The damage occurred from a piece of foam on the external tank during launch of Space Shuttle Endeavour on mission STS-118 on Aug. 8. After extensive engineering analysis of such images and testing on the ground, the Mission Management Team decided the tile did not pose a risk to the crew during re-entry. Endeavour landed safely at 12:32 p.m. EDT at NASA's Kennedy Space Center after a 13-day mission to the International Space Station. The STS-118 mission installed a new gyroscope, an external spare parts platform and another truss segment to the expanding station.
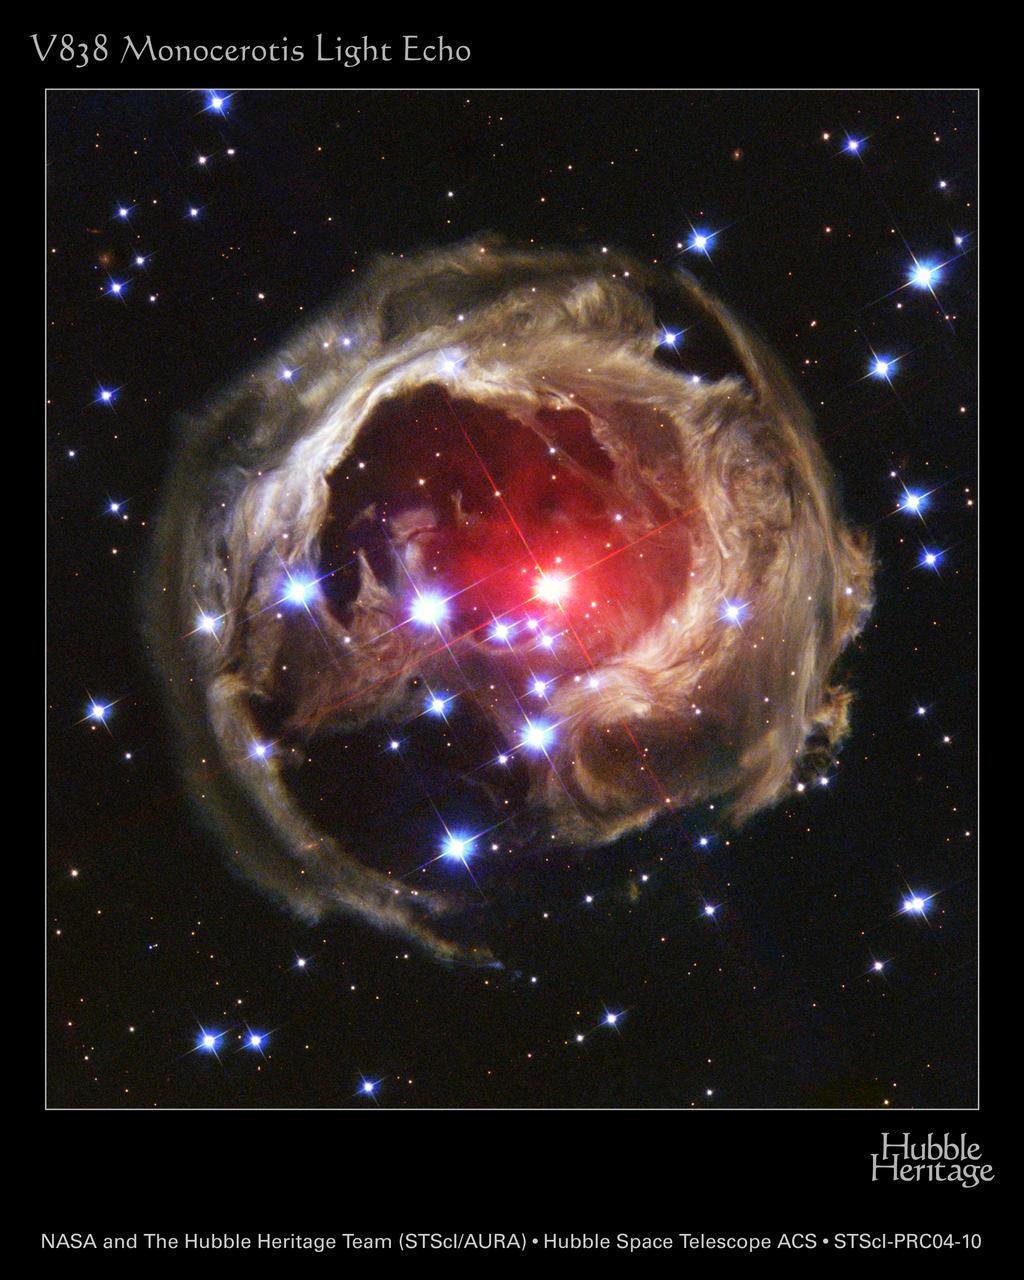
This photo, captured by the NASA Hubble Space Telescope's (HST) Advanced Camera for Surveys, is Hubble's latest view of an expanding halo of light around the distant star V838 Monocerotis, or V Mon, caused by an unusual stellar outburst that occurred back in January 2002. A burst of light from the bizarre star is spreading into space and reflecting off of surrounding circumstellar dust. As different parts are sequentially illuminated, the appearance of the dust changes. This effect is referred to as a "light echo". Located about 20,000 light-years away in the winter constellation Monoceros (the Unicorn), the star brightened to more than 600,000 times our Sun's luminosity. The light echo gives the illusion of contracting, until it finally disappears by the end of the decade.
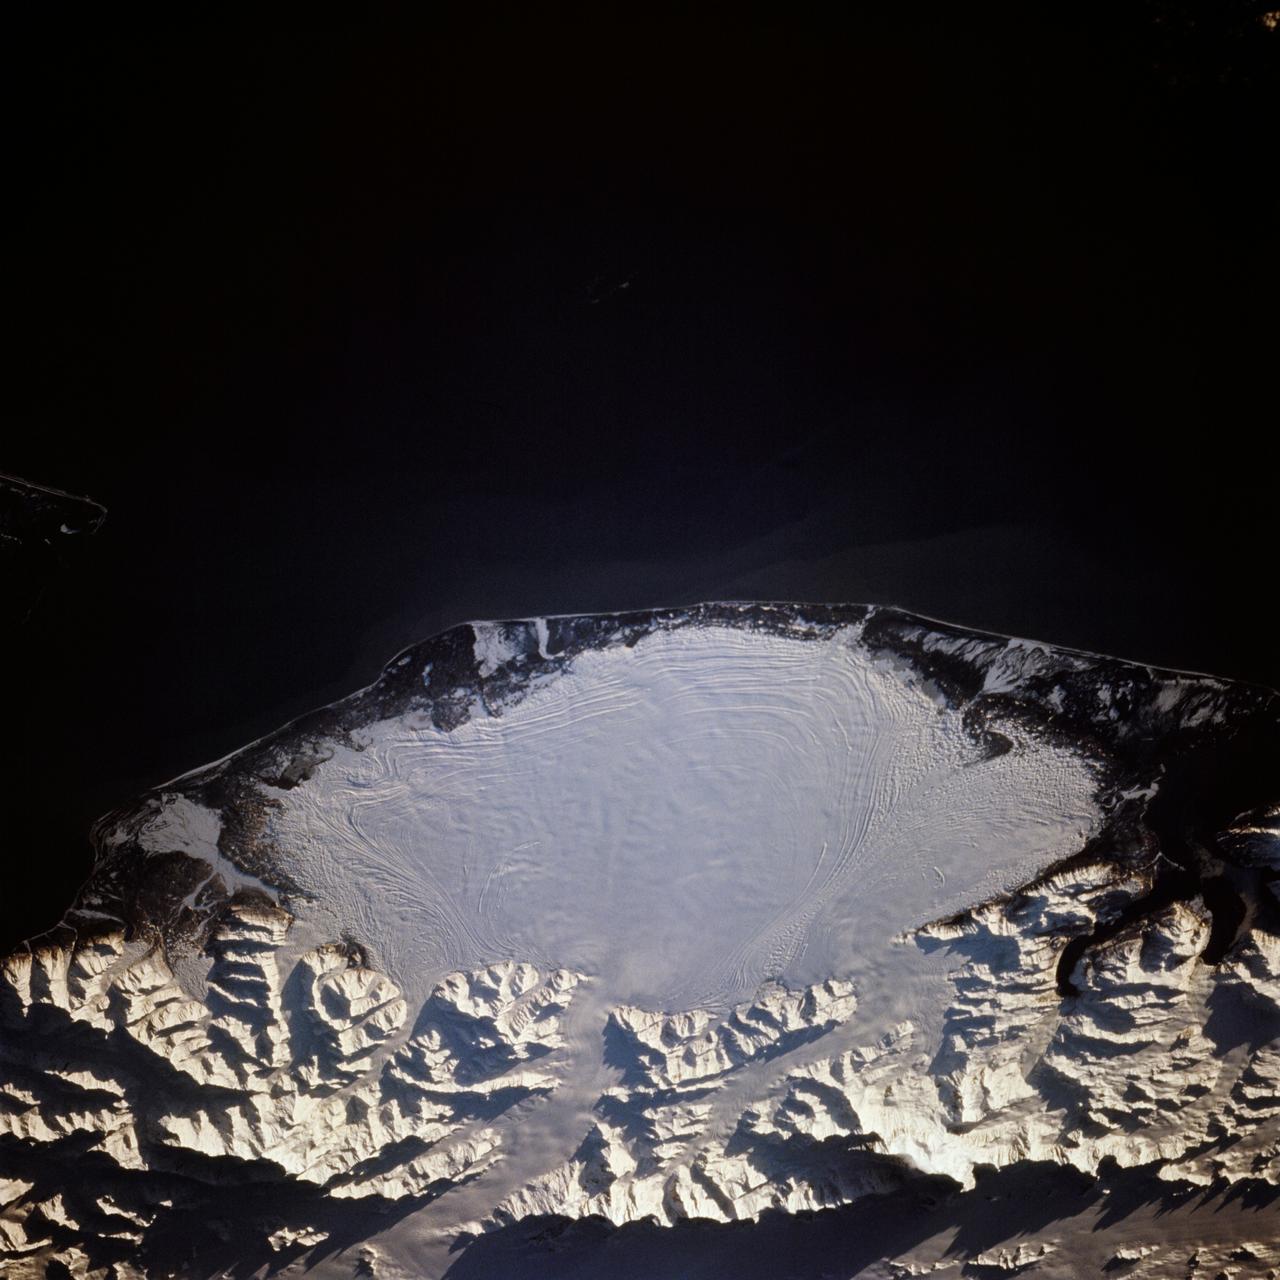
STS066-117-014 (3-14 Nov. 1994) --- Malaspina Glacier can be seen in this north-northeastern photograph taken in November, 1994. The glacier, located in the south shore of Alaska is a classic example of a piedmont glacier lying along the foot of a mountain range. The principal source of ice for the glacier is provided by the Seward Ice Field to the north (top portion of the view) which flows through three narrow outlets onto the coastal plain. The glacier moves in surges that rush earlier-formed moraines outward into the expanding concentric patterns along the flanks of the ice mass.
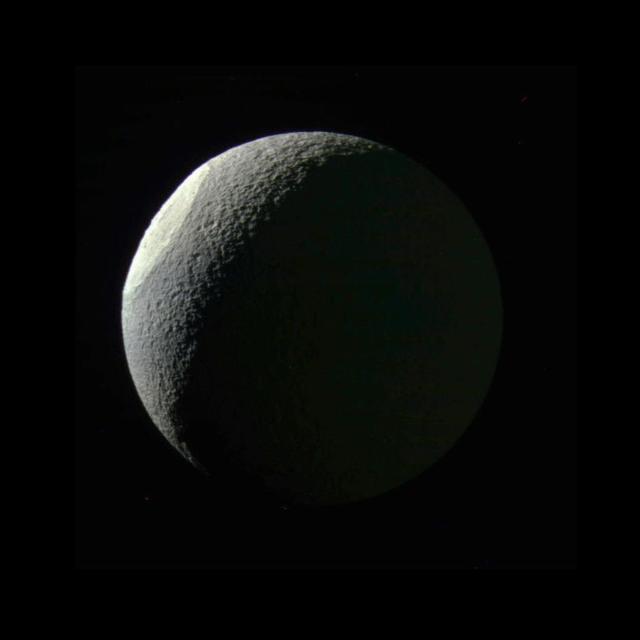
With the expanded range of colors visible to Cassini's cameras, differences in materials and their textures become apparent that are subtle or unseen in natural color views. Here, the giant impact basin Odysseus on Saturn's moon Tethys stands out brightly from the rest of the illuminated icy crescent. This distinct coloration may result from differences in either the composition or structure of the terrain exposed by the giant impact. Odysseus (280 miles, or 450 kilometers, across) is one of the largest impact craters on Saturn's icy moons, and may have significantly altered the geologic history of Tethys. Tethys' dark side (at right) is faintly illuminated by reflected light from Saturn. Images taken using ultraviolet, green and infrared spectral filters were combined to create this color view. North on Tethys (660 miles or 1,062 kilometers across) is up in this view. The view was acquired on May 9, 2015 at a distance of approximately 186,000 miles (300,000 kilometers) from Tethys. Image scale is 1.1 mile (1.8 kilometers) per pixel. http://photojournal.jpl.nasa.gov/catalog/PIA18329
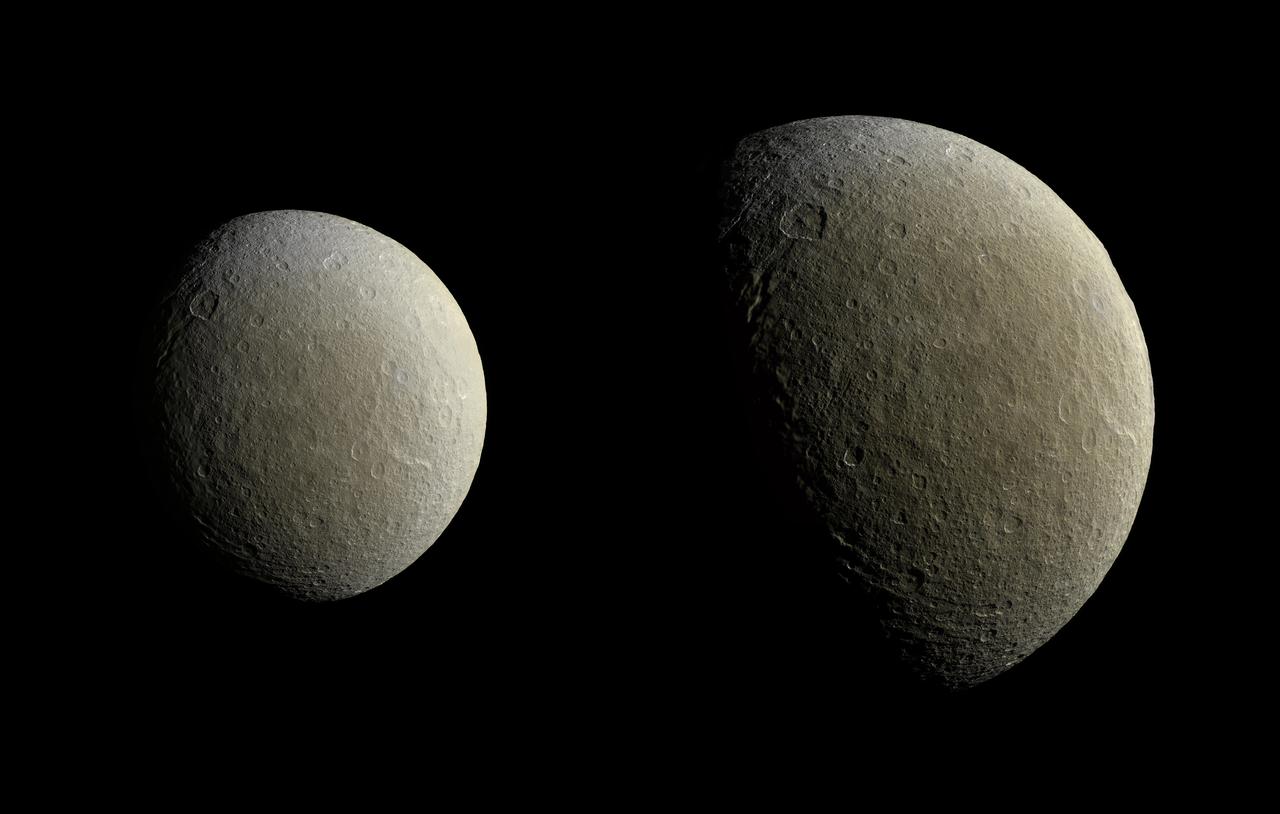
After a couple of years in high-inclination orbits that limited its ability to encounter Saturn's moons, NASA's Cassini spacecraft returned to Saturn's equatorial plane in March 2015. As a prelude to its return to the realm of the icy satellites, the spacecraft had its first relatively close flyby of an icy moon (apart from Titan) in almost two years on Feb. 9. During this encounter Cassini's cameras captured images of the icy moon Rhea, as shown in these in two image mosaics. The views were taken about an hour and a half apart as Cassini drew closer to Rhea. Images taken using clear, green, infrared and ultraviolet spectral filters were combined to create these enhanced color views, which offer an expanded range of the colors visible to human eyes in order to highlight subtle color differences across Rhea's surface. The moon's surface is fairly uniform in natural color. The image at right represents one of the highest resolution color views of Rhea released to date. A larger, monochrome mosaic is available in PIA07763. Both views are orthographic projections facing toward terrain on the trailing hemisphere of Rhea. An orthographic view is most like the view seen by a distant observer looking through a telescope. The views have been rotated so that north on Rhea is up. The smaller view at left is centered at 21 degrees north latitude, 229 degrees west longitude. Resolution in this mosaic is 450 meters (1,476 feet) per pixel. The images were acquired at a distance that ranged from about 51,200 to 46,600 miles (82,100 to 74,600 kilometers) from Rhea. The larger view at right is centered at 9 degrees north latitude, 254 degrees west longitude. Resolution in this mosaic is 300 meters (984 feet) per pixel. The images were acquired at a distance that ranged from about 36,000 to 32,100 miles (57,900 to 51,700 kilometers) from Rhea. The mosaics each consist of multiple narrow-angle camera (NAC) images with data from the wide-angle camera used to fill in areas where NAC data was not available. The image was produced by Heike Rosenberg and Tilmann Denk at Freie Universität in Berlin, Germany. http://photojournal.jpl.nasa.gov/catalog/PIA19057
CAPE CANAVERAL, Fla. – On Launch Pad 39A at NASA's Kennedy Space Center in Florida, workers begin to close the doors of space shuttle Atlantis' payload bay that is filled with hardware for the STS-125 mission to service NASA's Hubble Space Telescope. In view at the bottom of the bay are the Flight Support System with the Soft Capture mechanism and Multi-Use Lightweight Equipment Carrier with the Science Instrument Command and Data Handling Unit, or SIC&DH. Atlantis' crew will service NASA's Hubble Space Telescope for the fifth and final time. The flight will include five spacewalks during which astronauts will refurbish and upgrade the telescope with state-of-the-art science instruments. As a result, Hubble's capabilities will be expanded and its operational lifespan extended through at least 2014. Launch is scheduled for 2:01 p.m. EDT on May 11. Photo credit: NASA/Kim Shiflett
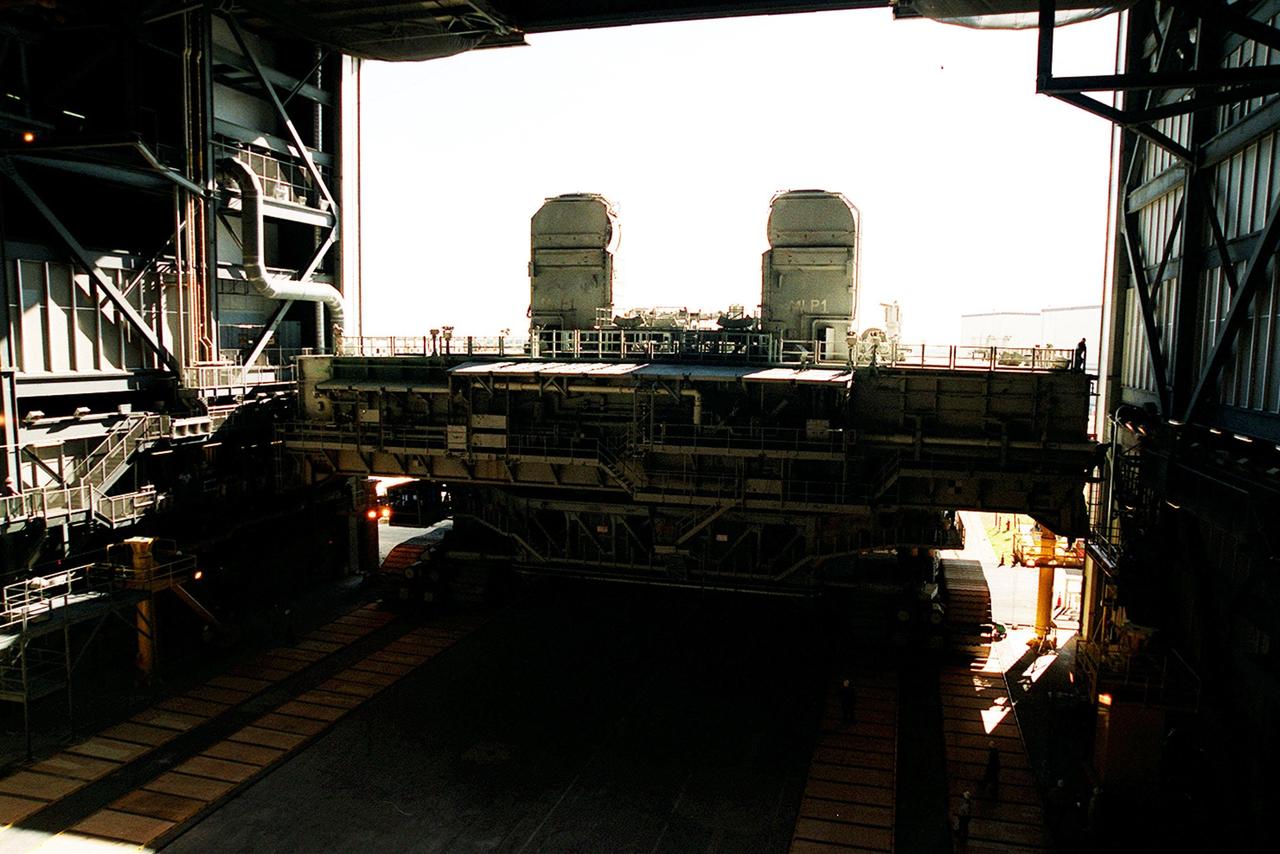
KENNEDY SPACE CENTER, FLA. -- From inside the VAB high bay 2, a mobile launcher platform atop a crawler transporter is viewed as it rolls through the doorway using the recently restored crawlerway. As part of the Safe Haven project, a once-buried portion of the crawlerway was restored to enable rollout of a Shuttle from high bay 2. The primary goal of the Safe Haven construction project was to strengthen readiness for hurricane season by expanding the VAB’s storage capacity. The new area, in high bay 2, will allow NASA to preassemble stacks and still have room in the VAB to pull a Shuttle back from the pad if severe weather threatens. Potential rollouts of the Space Shuttle to the launch pad from high bay 2 will involve making a turn around the north side of the VAB in contrast to the straight rollouts from high bays 1 and 3, on the east side of the VAB facing the launch pads
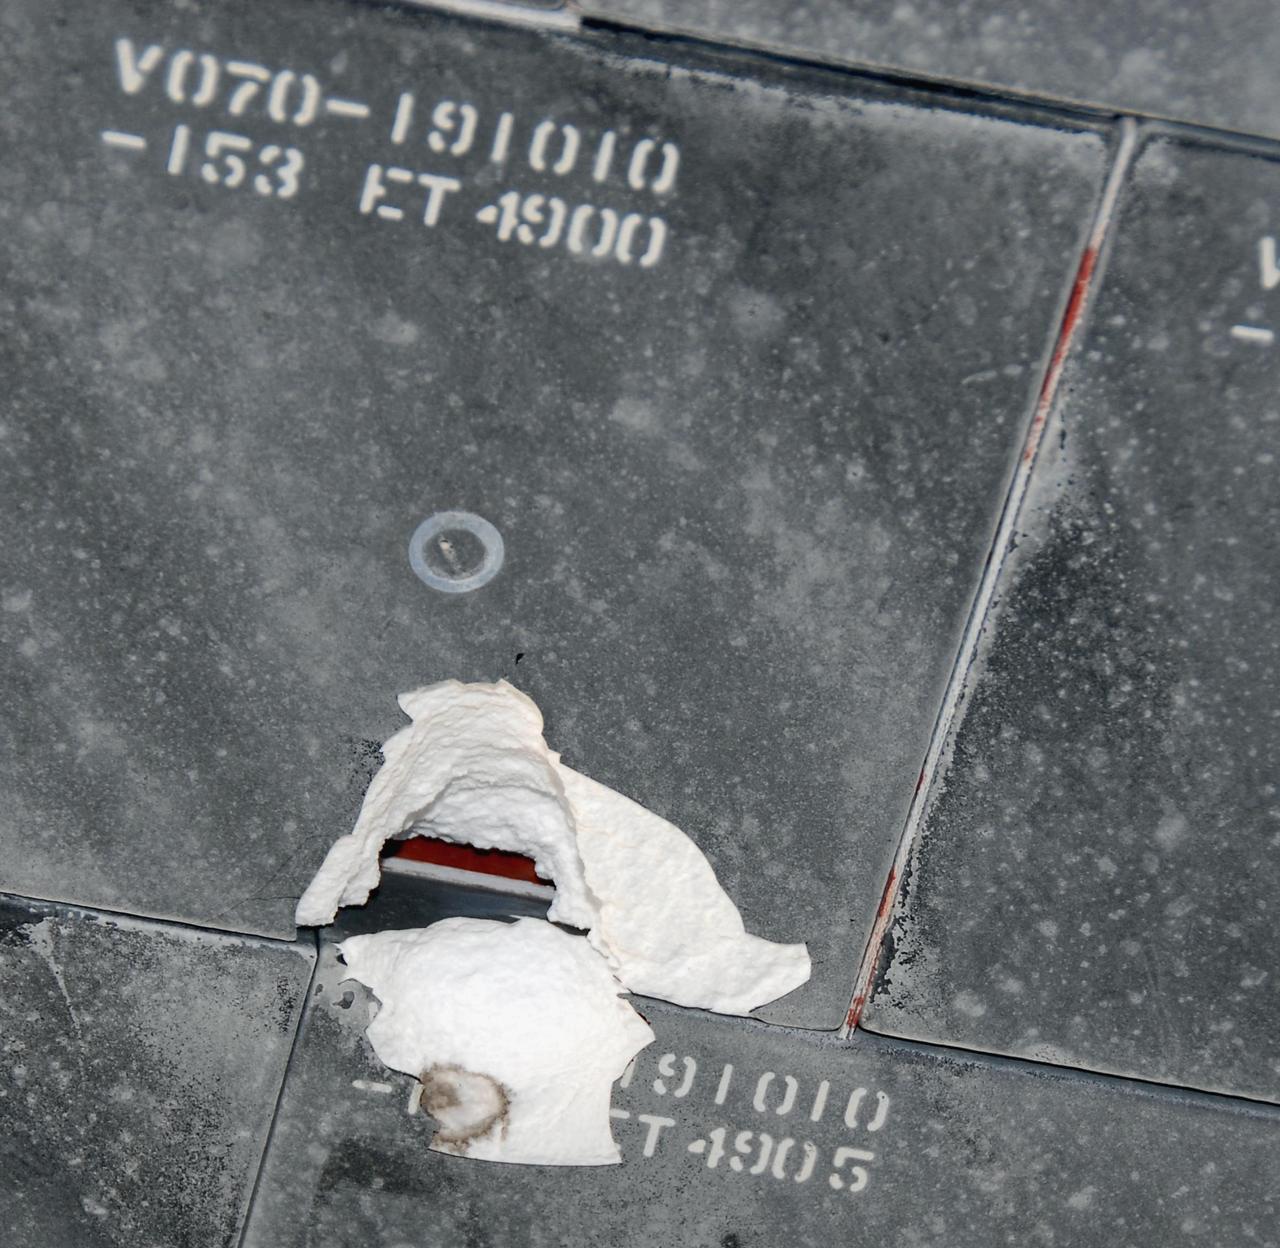
KENNEDY SPACE CENTER, FLA. -- This is a closer view of the underside of Endeavour taken after its landing on runway 15 at NASA's Kennedy Space Center. The damage to the tiles occurred from a piece of foam on the external tank during launch of Space Shuttle Endeavour on mission STS-118 on Aug. 8. After extensive engineering analysis of such images and testing on the ground, the Mission Management Team decided the tile did not pose a risk to the crew during re-entry. Endeavour landed safely at 12:32 p.m. EDT at NASA's Kennedy Space Center after a 13-day mission to the International Space Station. The STS-118 mission installed a new gyroscope, an external spare parts platform and another truss segment to the expanding station. Photo credit: NASA/Kim Shiflett
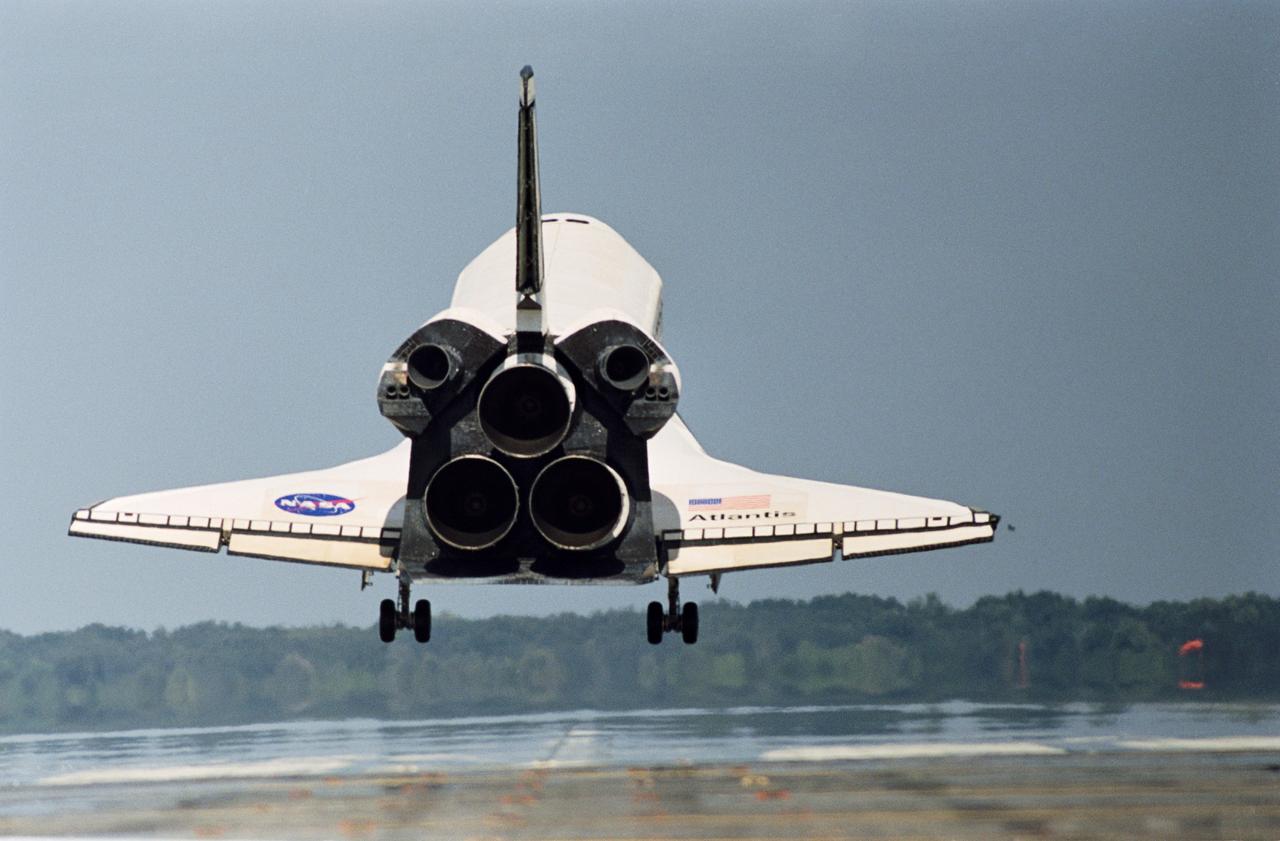
STS112-S-038 (18 October 2002) --- An aft view shows the Space Shuttle Atlantis just prior to touchdown of its main landing gear at the Shuttle Landing Facility. The touchdown completed the 4.5-million-mile STS-112 journey to the International Space Station. Main gear touchdown occurred at 11:43:40 a.m. EDT nose gear touchdown at 11:43:48 a.m.; and wheel stop at 11:44:35 a.m. Mission elapsed time was 10:19:58:44. Mission STS-112 expanded the size of the Station with the addition of the S1 truss segment. The returning crew of Atlantis are Jeffrey S. Ashby, commander; Pamela A. Melroy, pilot; and David A. Wolf, Piers J. Sellers, Sandra H. Magnus and Rosaviakosmos' Fyodor N. Yurchikhin, all mission specialists. This landing is the 60th at KSC in the 21-year history of the Shuttle program.
NASA's Space Optics Manufacturing Center has been working to expand our view of the universe via sophisticated new telescopes. The Optics Center's goal is to develop low-cost, advanced space optics technologies for the NASA program in the 21st century - including the long-term goal of imaging Earth-like planets in distant solar systems. To reduce the cost of mirror fabrication, Marshall Space Flight Center (MSFC) has developed replication techniques, the machinery and materials to replicate electro-formed nickel mirrors. The process allows fabricating precisely shaped mandrels to be used and reused as masters for replicating high-quality mirrors. This image shows a lightweight replicated x-ray mirror with gold coatings applied.
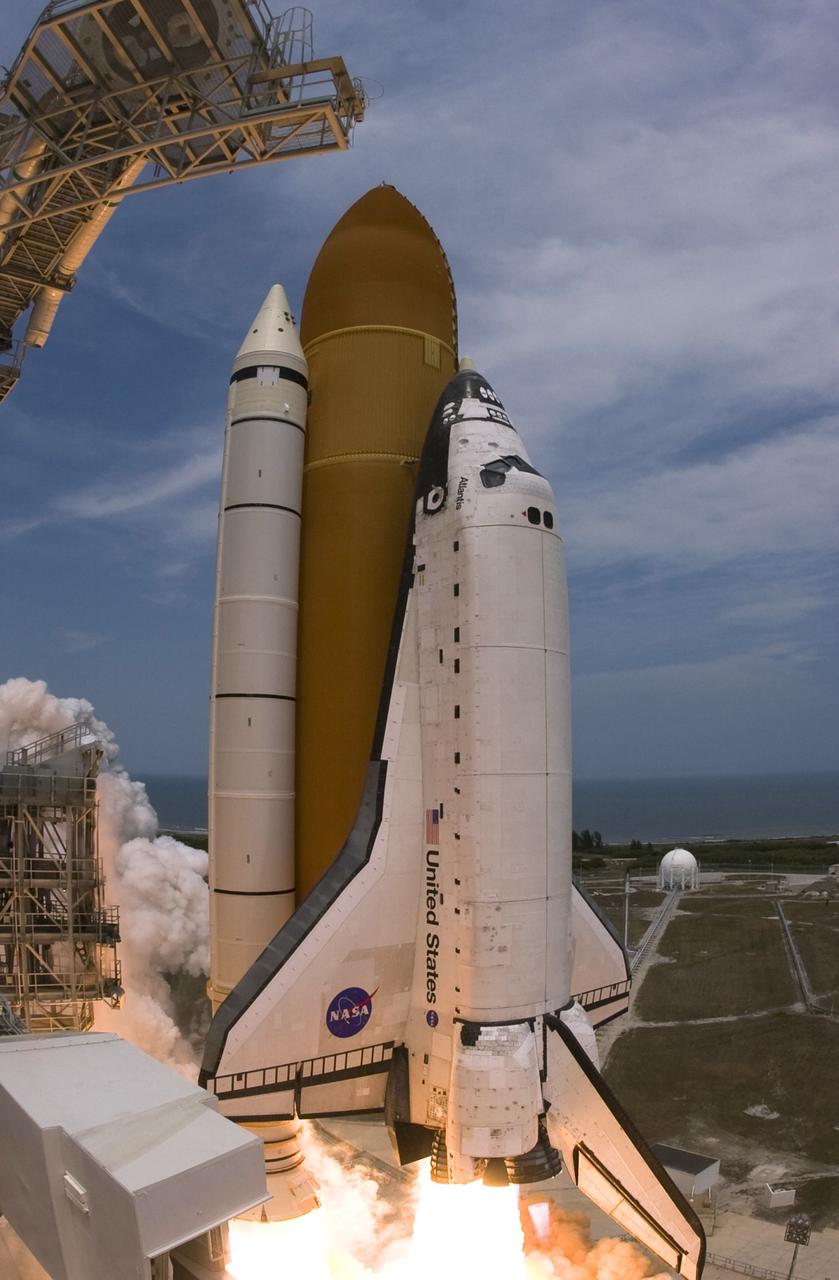
CAPE CANAVERAL, Fla. – The launch of space shuttle Atlantis from Launch Pad 39A at NASA's Kennedy Space Center in Florida is viewed from behind Launch Pad 39B. On pad 39B is space shuttle Endeavour, which can launch, if needed, for rescue of Atlantis’ crew during its STS-125 mission to service NASA’s Hubble Space Telescope. Liftoff of Atlantis was on time at 2:01 p.m. EDT. Atlantis' 11-day flight will include five spacewalks to refurbish and upgrade the telescope with state-of-the-art science instruments that will expand Hubble's capabilities and extend its operational lifespan through at least 2014. The payload includes a Wide Field Camera 3, Fine Guidance Sensor and the Cosmic Origins Spectrograph. Photo courtesy of Scott Andrews
CAPE CANAVERAL, Fla. – The launch of space shuttle Atlantis from Launch Pad 39A at NASA's Kennedy Space Center in Florida is viewed from behind Launch Pad 39B. On pad 39B is space shuttle Endeavour, which can launch, if needed, for rescue of Atlantis’ crew during its STS-125 mission to service NASA’s Hubble Space Telescope. Liftoff of Atlantis was on time at 2:01 p.m. EDT. Atlantis' 11-day flight will include five spacewalks to refurbish and upgrade the telescope with state-of-the-art science instruments that will expand Hubble's capabilities and extend its operational lifespan through at least 2014. The payload includes a Wide Field Camera 3, Fine Guidance Sensor and the Cosmic Origins Spectrograph. Photo courtesy of Scott Andrews

KENNEDY SPACE CENTER, FLA. -- From inside the VAB high bay 2, a mobile launcher platform atop a crawler transporter is viewed as it rolls through the doorway using the recently restored crawlerway. As part of the Safe Haven project, a once-buried portion of the crawlerway was restored to enable rollout of a Shuttle from high bay 2. The primary goal of the Safe Haven construction project was to strengthen readiness for hurricane season by expanding the VAB’s storage capacity. The new area, in high bay 2, will allow NASA to preassemble stacks and still have room in the VAB to pull a Shuttle back from the pad if severe weather threatens. Potential rollouts of the Space Shuttle to the launch pad from high bay 2 will involve making a turn around the north side of the VAB in contrast to the straight rollouts from high bays 1 and 3, on the east side of the VAB facing the launch pads

KENNEDY SPACE CENTER, FLA. - In the SRB Assembly and Refurbishment Facility, STS-114 crew members take a close look at a mock-up of a booster separation motor (BSM) igniter and expanded views of the BSM and igniter on the table. From left are Mission Specialists Soichi Noguchi, Stephen Robinson and Andrew Thomas (holding the igniter); Commander Eileen Collins; and Mission Specialist Charles Camarda. At far right is Paul Gutierrez, SRB associate program manager with United Space Alliance. Not pictured is Mission Specialist Wendy Lawrence. Noguchi is with the Japanese Aerospace and Exploration Agency. The crew is at KSC for familiarization with Shuttle and mission equipment. The STS-114 mission is Logistics Flight 1, which is scheduled to deliver supplies and equipment, plus the external stowage platform, to the International Space Station.
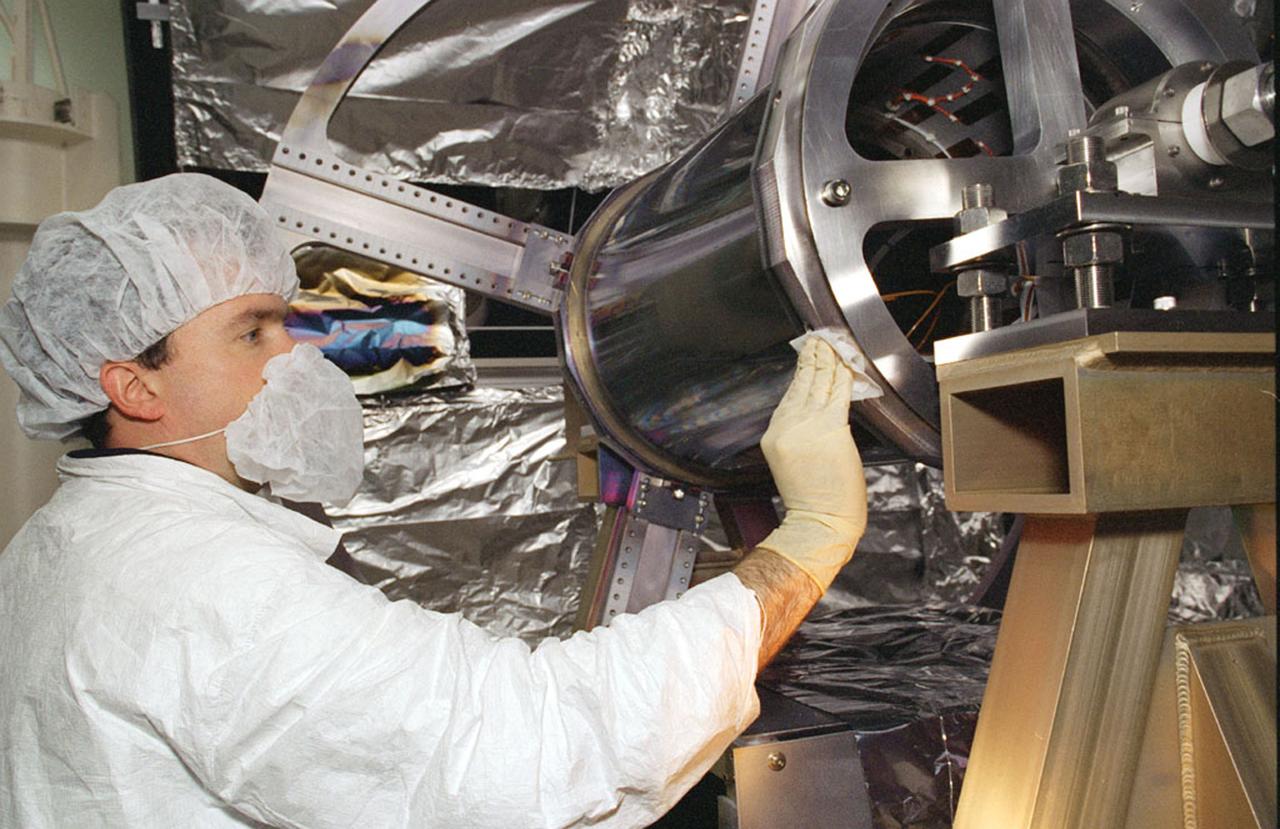
NASA's Space Optics Manufacturing Center has been working to expand our view of the universe via sophisticated new telescopes. The Optics Center's goal is to develop low-cost, advanced space optics technologies for the NASA program in the 21st century - including the long-term goal of imaging Earth-like planets in distant solar systems. To reduce the cost of mirror fabrication, Marshall Space Flight Center (MSFC) has developed replication techniques, the machinery, and materials to replicate electro-formed nickel mirrors. The process allows fabricating precisely shaped mandrels to be used and reused as masters for replicating high-quality mirrors. Image shows Dr. Alan Shapiro cleaning mirror mandrel to be applied with highly reflective and high-density coating in the Large Aperture Coating Chamber, MFSC Space Optics Manufacturing Technology Center (SOMTC).
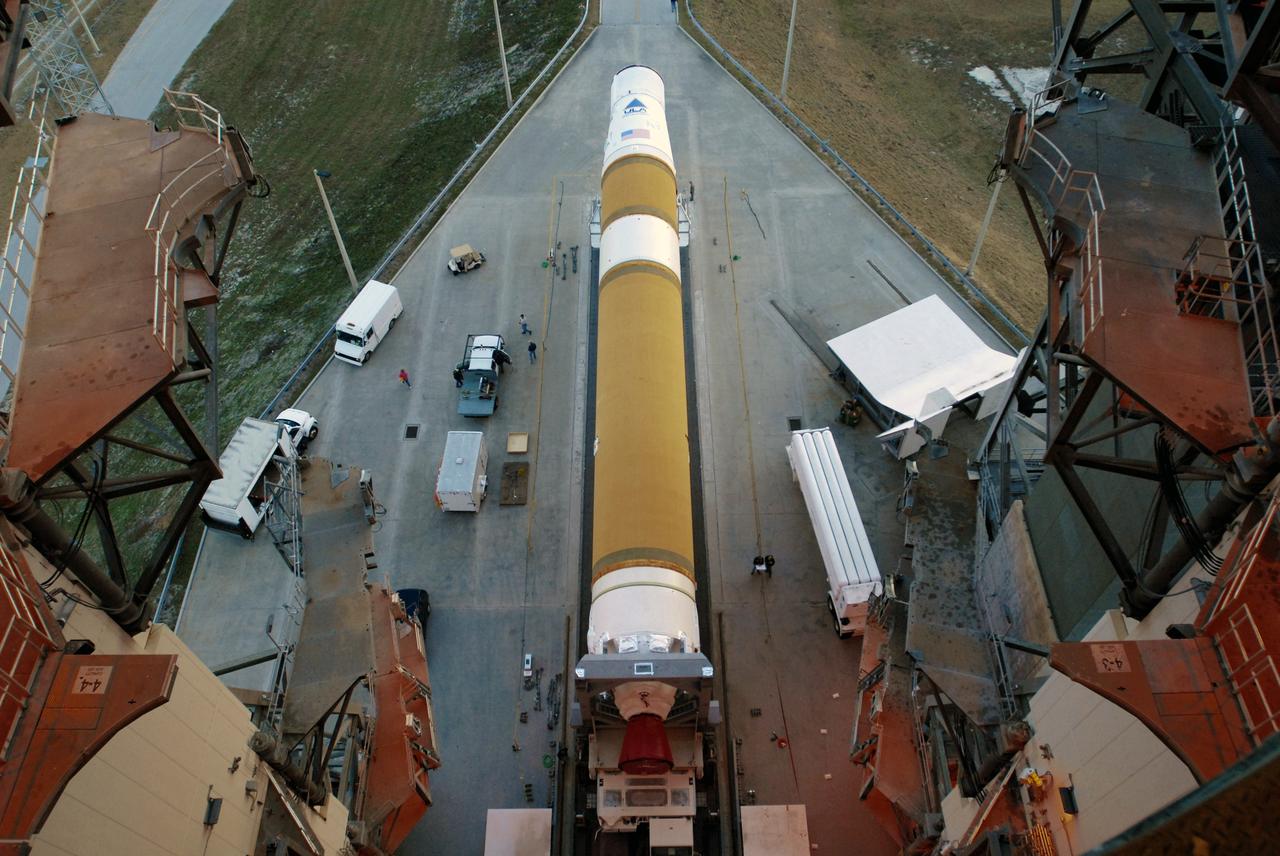
CAPE CANAVERAL, Fla. – Viewed from an upper level of the mobile service tower on Launch Pad 37 at Cape Canaveral Air Force Station in Florida, the GOES-O and Delta IV second stage is in position below. They will be raised to vertical and moved into the tower. GOES–O is one of a series of Geostationary Operational Environmental Satellites. The multi-mission GOES series N-P will be a vital contributor to weather, solar and space operations and science. NASA and the National Oceanic and Atmospheric Administration, or NOAA, are actively engaged in a cooperative program to expand the existing GOES system with the launch of the GOES N-P satellites. Launch of the GOES-O is targeted for no earlier than April 2009. Photo credit: NASA/Jim Grossmann

Kennedy Space Center Visitor Complex: Facilities on Merritt Island were sufficiently advanced by November 1964 to permit Sunday drive-through tours. The center set up a modest collection of model rockets and pictures in a warehouse for visitors to view. Based on a study by the U.S. National Park Service for a permanent facility, NASA selected the site on its own property and contracted with a commercial firm to operate the new center and bus tours. The Kennedy Space Center Visitor Complex has been expanded many times in the years since to better serve the increasing number of guests, provide new displays and tell the NASA story to the public. Poster designed by Kennedy Space Center Graphics Department/Greg Lee. Credit: NASA
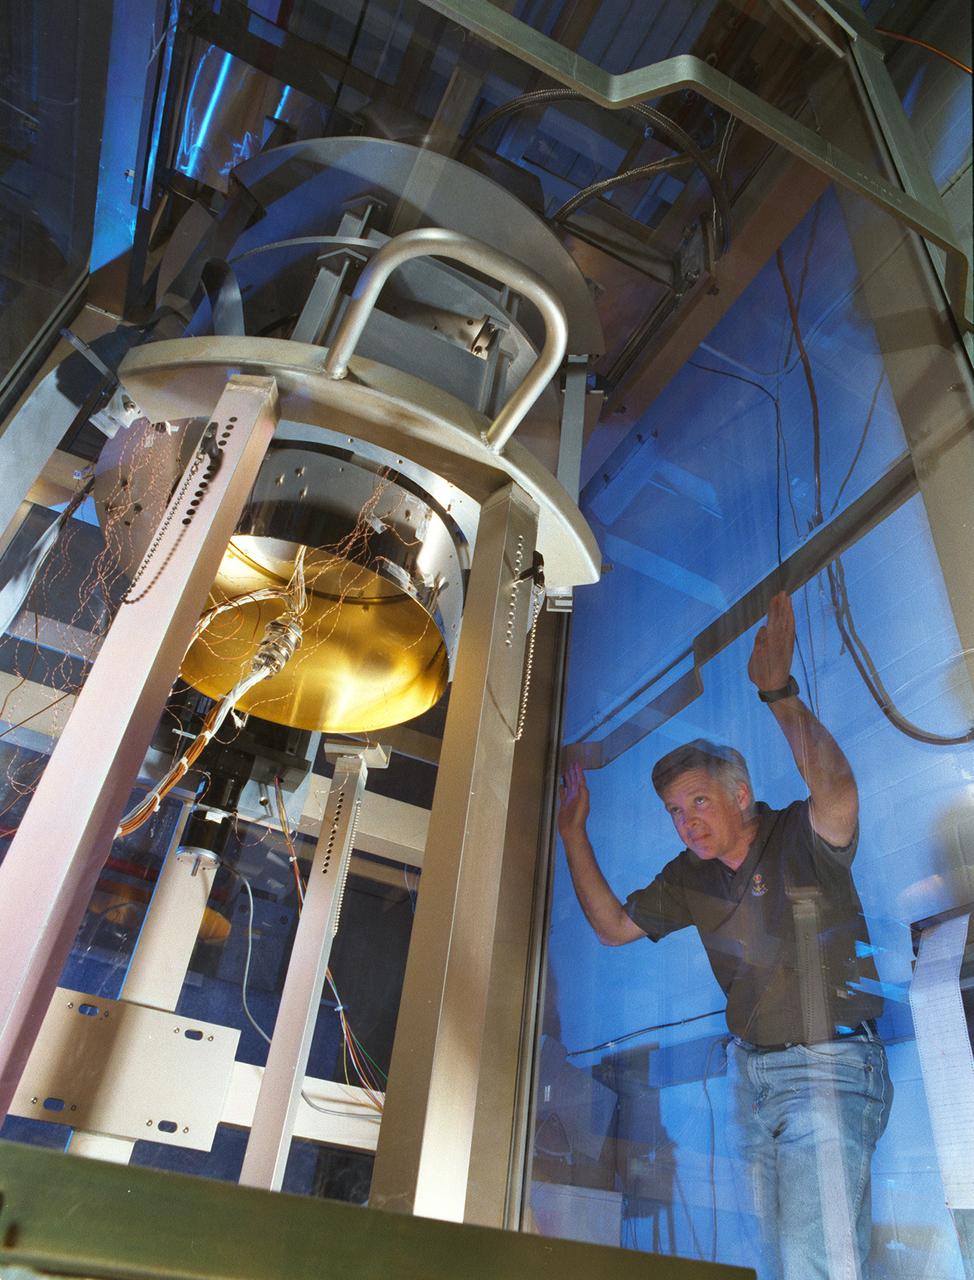
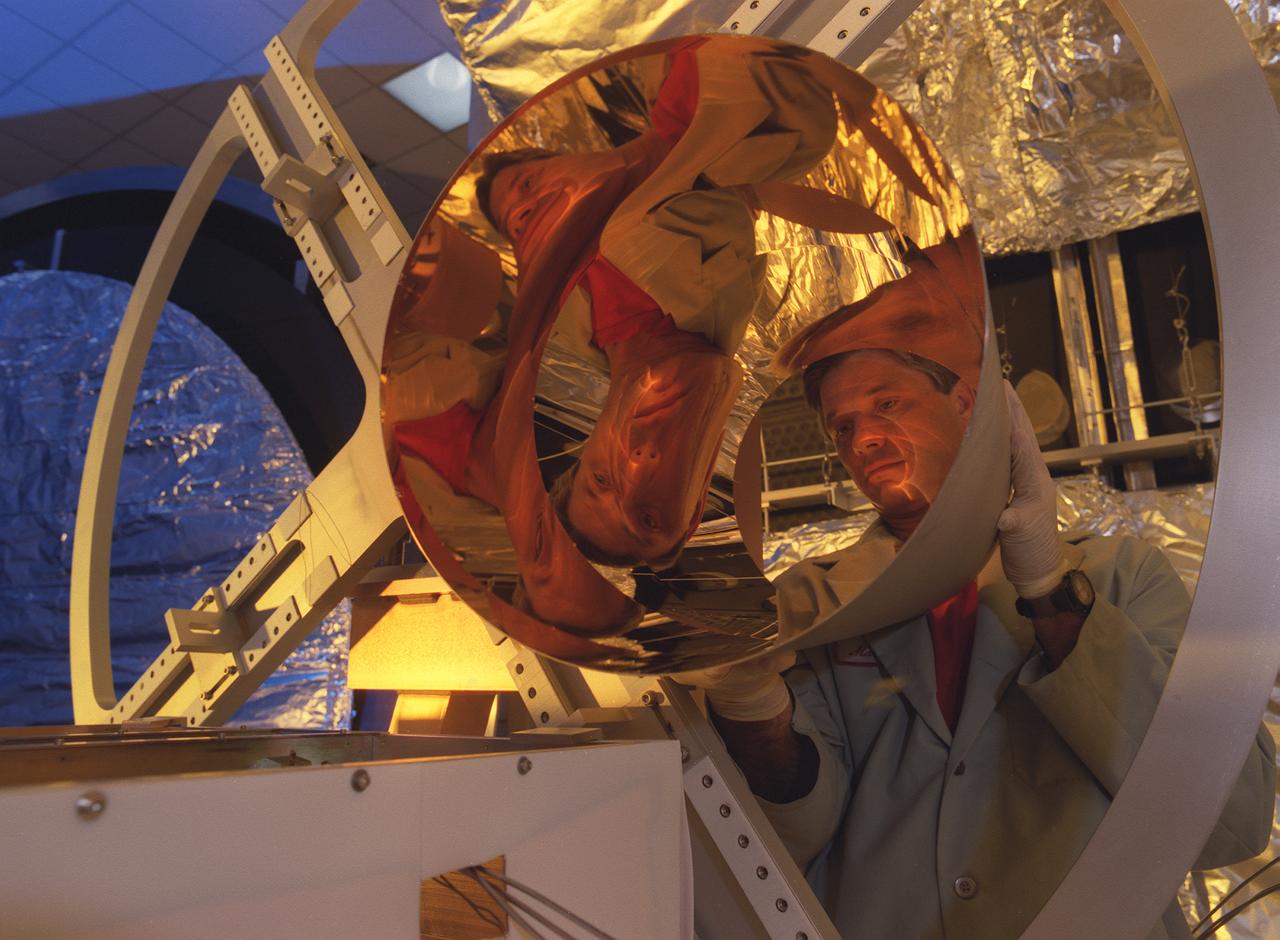
NASA's Space Optics Manufacturing Center has been working to expand our view of the universe via sophisticated new telescopes. The Optics Center's goal is to develop low-cost, advanced space optics technologies for the NASA program in the 21st century - including the long-term goal of imaging Earth-like planets in distant solar systems. To reduce the cost of mirror fabrication, Marshall Space Flight Center (MSFC) has developed replication techniques, the machinery, and materials to replicate electro-formed nickel mirrors. Optics replication uses reusable forms, called mandrels, to make telescope mirrors ready for final finishing. MSFC optical physicist Bill Jones monitors a device used to chill a mandrel, causing it to shrink and separate from the telescope mirror without deforming the mirror's precisely curved surface.
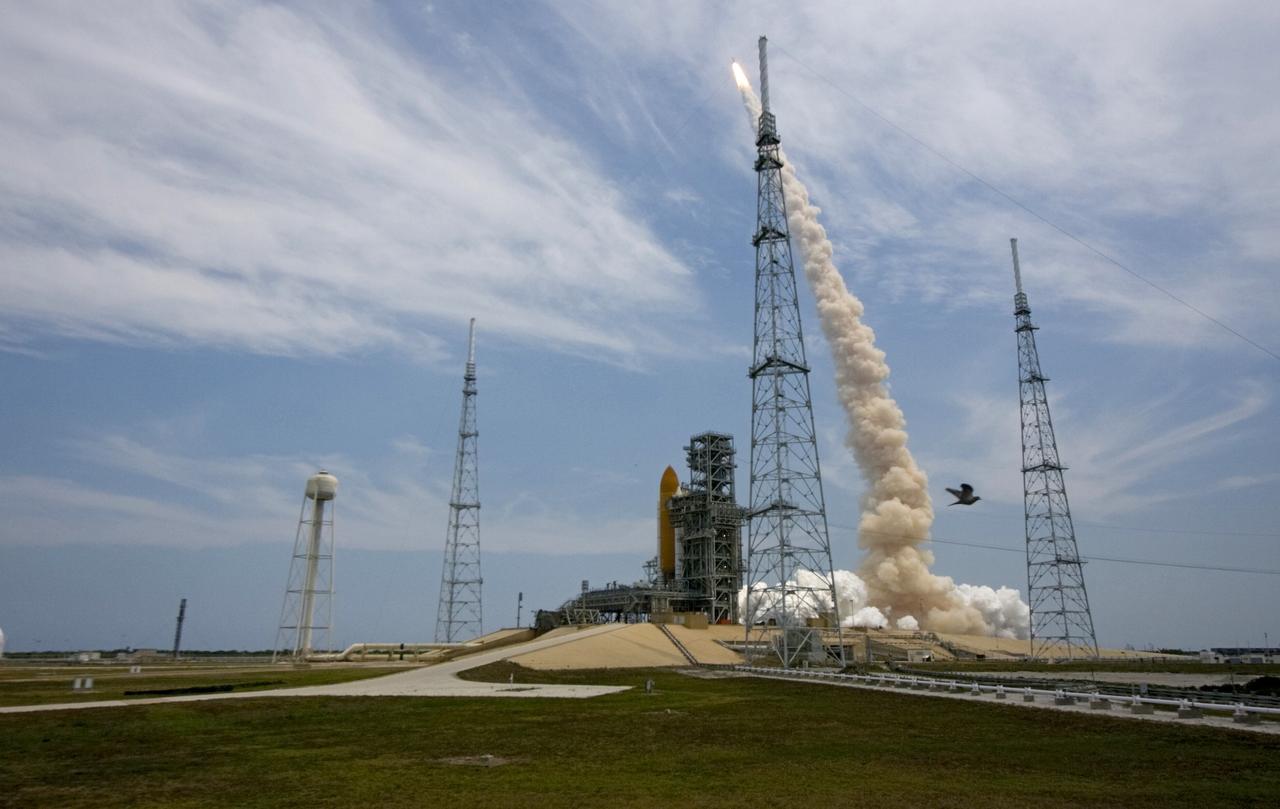
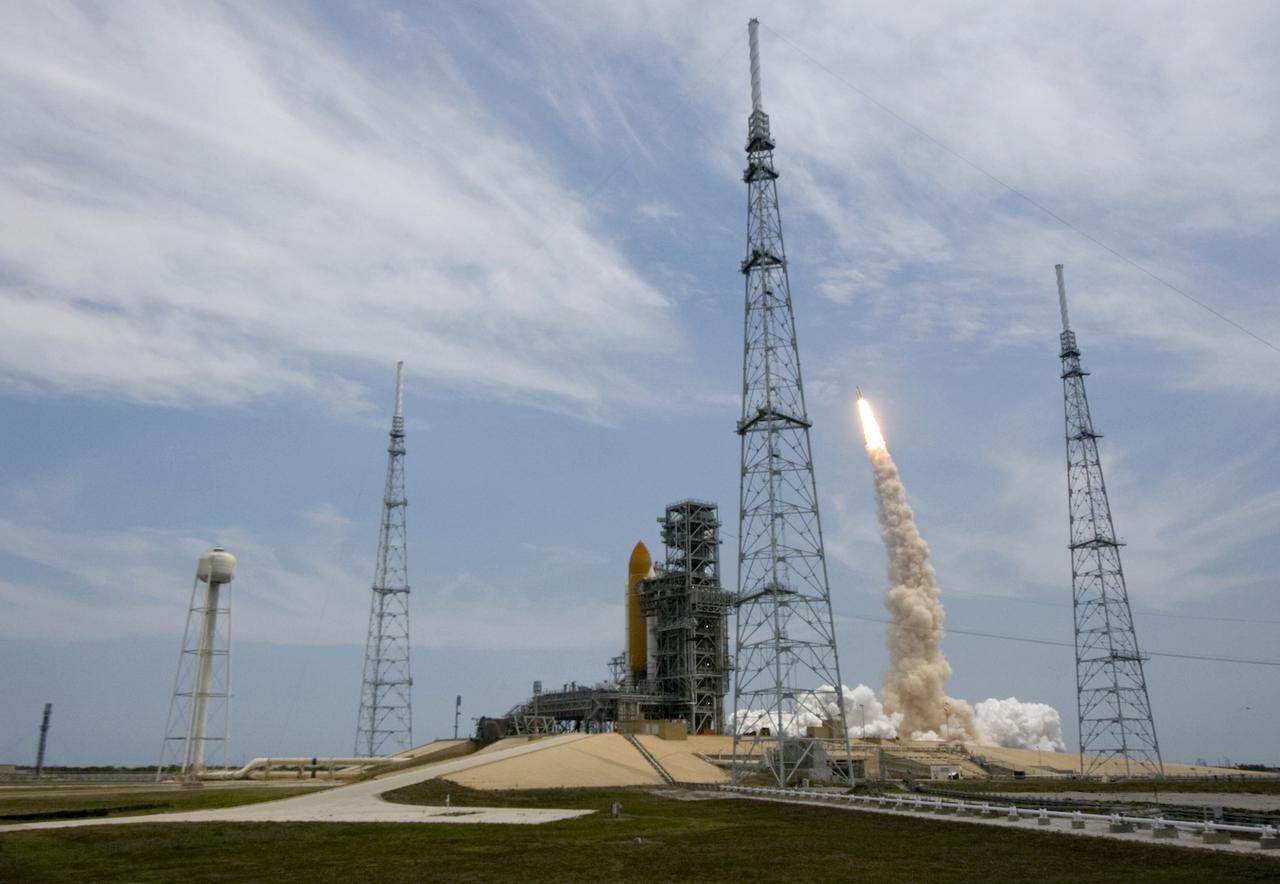
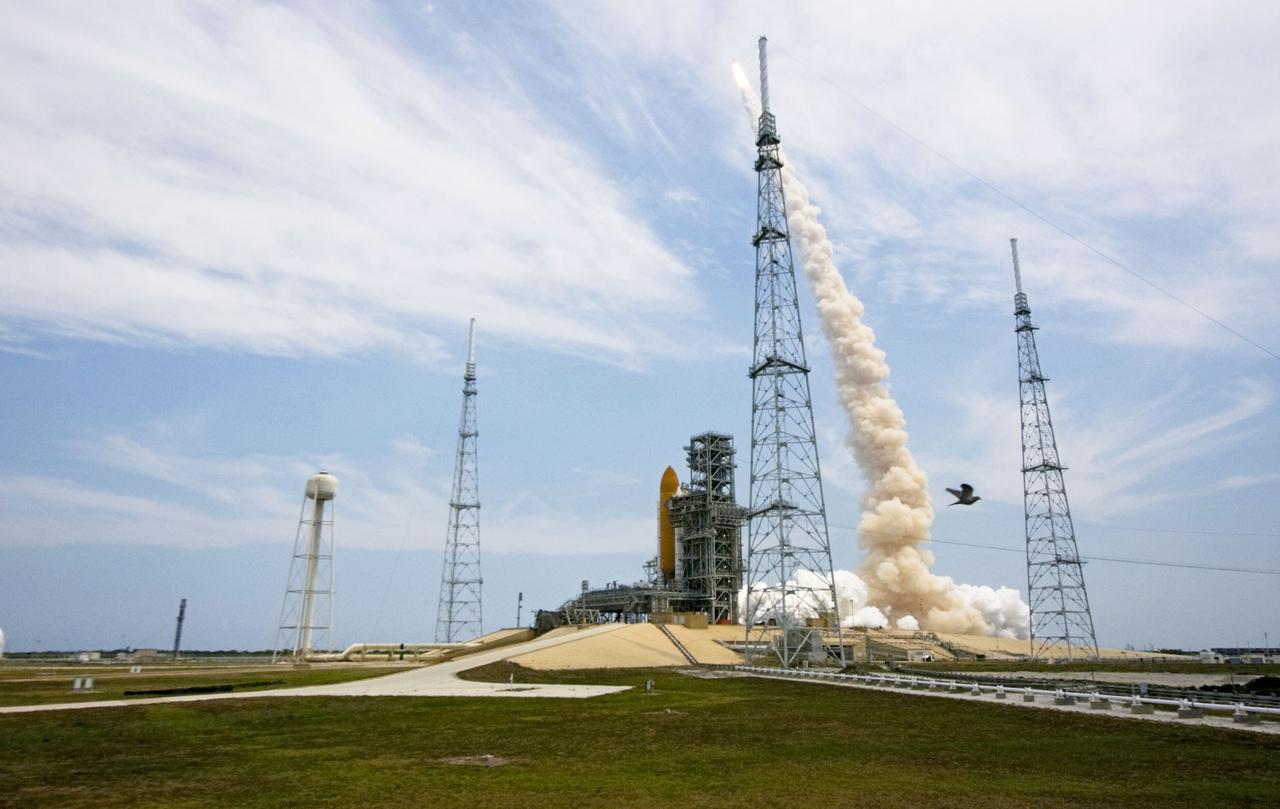
CAPE CANAVERAL, Fla. – A fish-eye view shows space shuttle Atlantis lifting off from Launch Pad 39A at NASA's Kennedy Space Center in Florida. At left in the foreground is the White Room, which provides access into the shuttle. On the horizon is the Atlantic Ocean. A blue mach diamond appears below the engine nozzle at right. The mach diamonds are a formation of shock waves in the exhaust plume of an aerospace propulsion system. Atlantis will rendezvous with NASA's Hubble Space Telescope on the STS-125 mission. Liftoff was on time at 2:01 p.m. EDT. Atlantis' 11-day flight will include five spacewalks to refurbish and upgrade the telescope with state-of-the-art science instruments that will expand Hubble's capabilities and extend its operational lifespan through at least 2014. The payload includes a Wide Field Camera 3, fine guidance sensor and the Cosmic Origins Spectrograph. Photo credit: NASA/Sandra Joseph-Kevin O'Connell
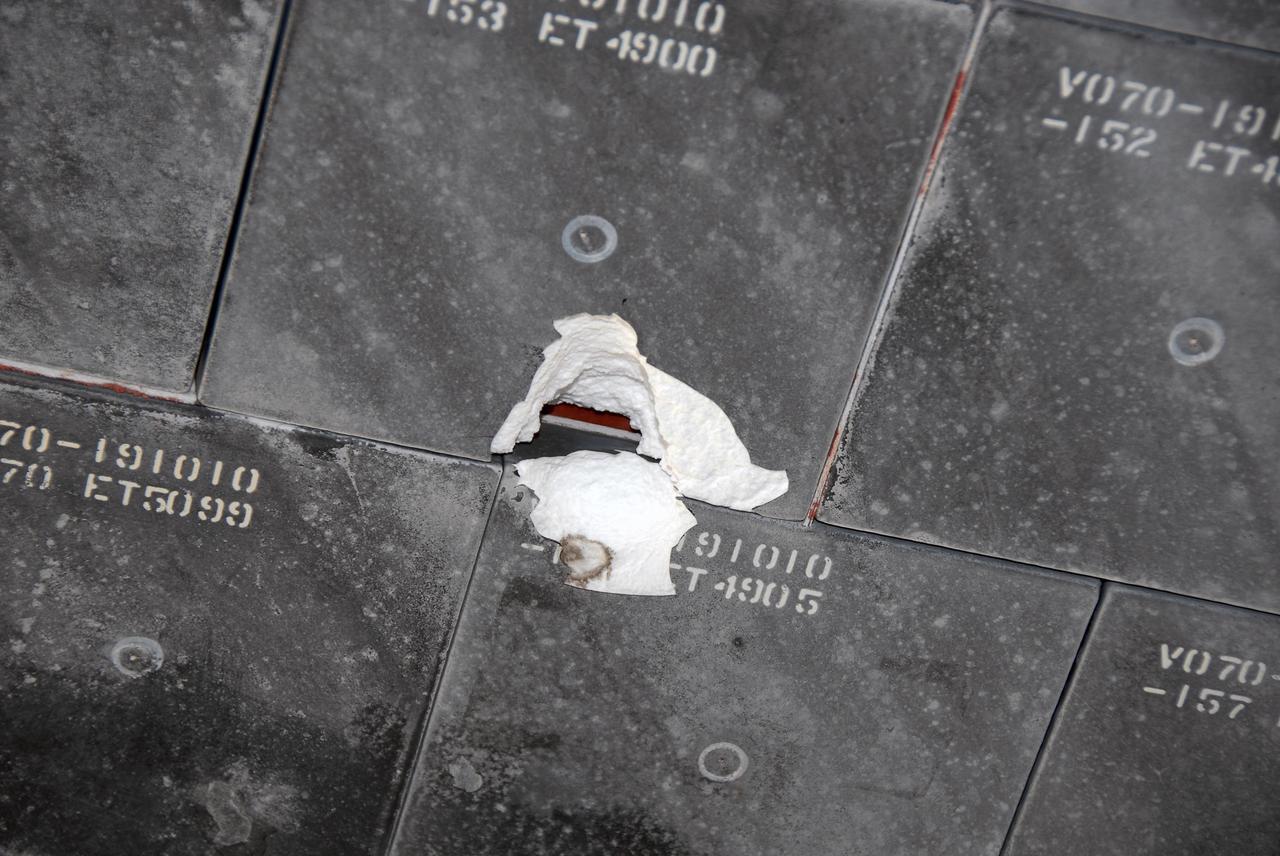
KENNEDY SPACE CENTER, FLA. -- This is a view of the underside of Endeavour taken after its landing on runway 15 at NASA's Kennedy Space Center. The damage to the tiles occurred from a piece of foam on the external tank during launch of Space Shuttle Endeavour on mission STS-118 on Aug. 8. After extensive engineering analysis of such images and testing on the ground, the Mission Management Team decided the tile did not pose a risk to the crew during re-entry. Endeavour landed safely at 12:32 p.m. EDT at NASA's Kennedy Space Center after a 13-day mission to the International Space Station. The STS-118 mission installed a new gyroscope, an external spare parts platform and another truss segment to the expanding station.
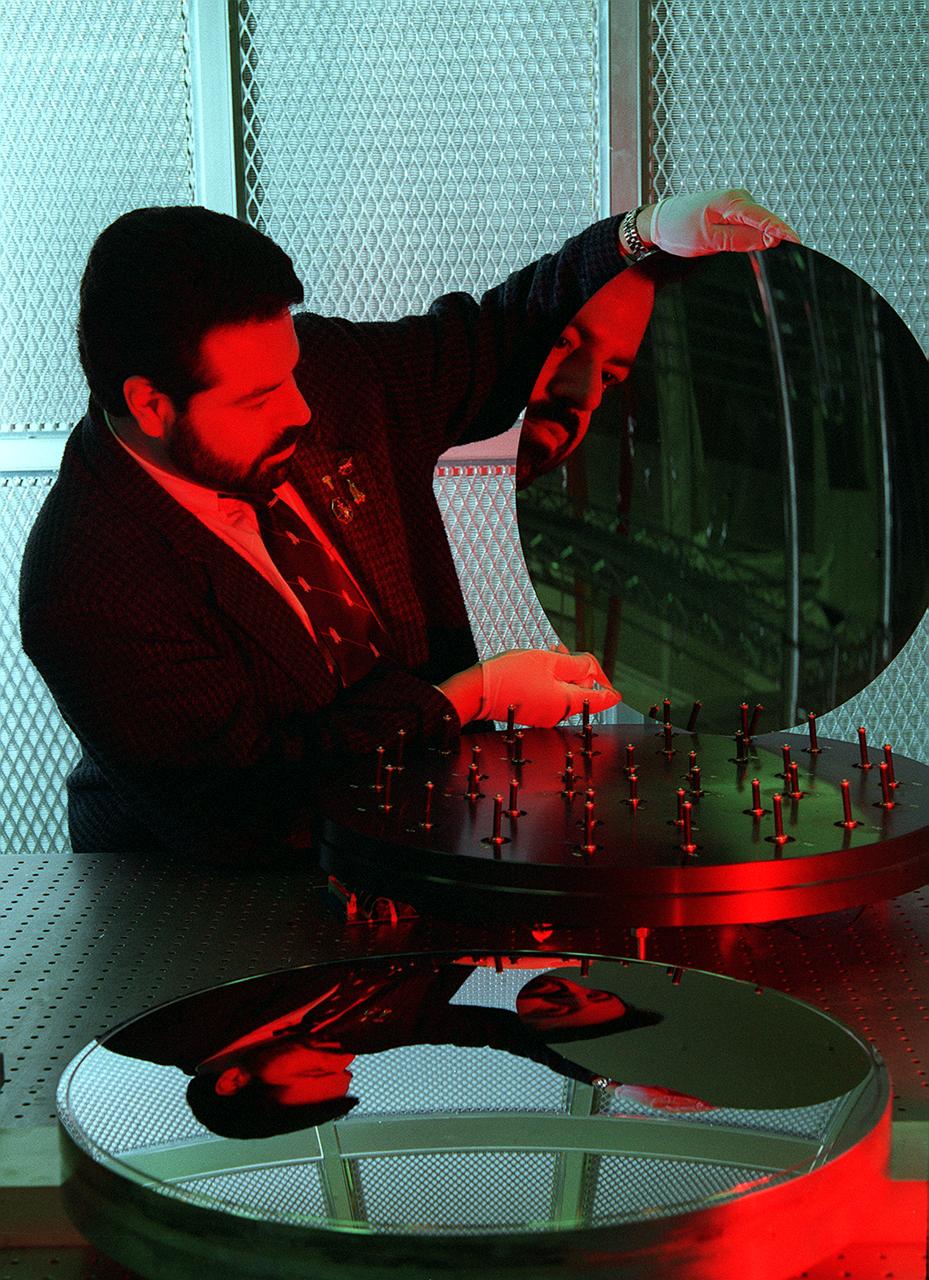
NASA's Space Optics Manufacturing Center has been working to expand our view of the universe via sophisticated new telescopes. The Optics Center's goal is to develop low-cost, advanced space optics technologies for the NASA program in the 21st century - including the long-term goal of imaging Earth-like planets in distant solar systems. To reduce the cost of mirror fabrication, Marshall Space Flight Center (MSFC) has developed replication techniques, the machinery, and materials to replicate electro-formed nickel mirrors. The process allows fabricating precisely shaped mandrels to be used and reused as masters for replicating high-quality mirrors. Dr. Joe Ritter examines a replicated electro-formed nickel-alloy mirror which exemplifies the improvements in mirror fabrication techniques, with benefits such as dramtic weight reduction that have been achieved at the Marshall Space Flight Center's Space Optics Manufacturing Technology Center (SOMTC).
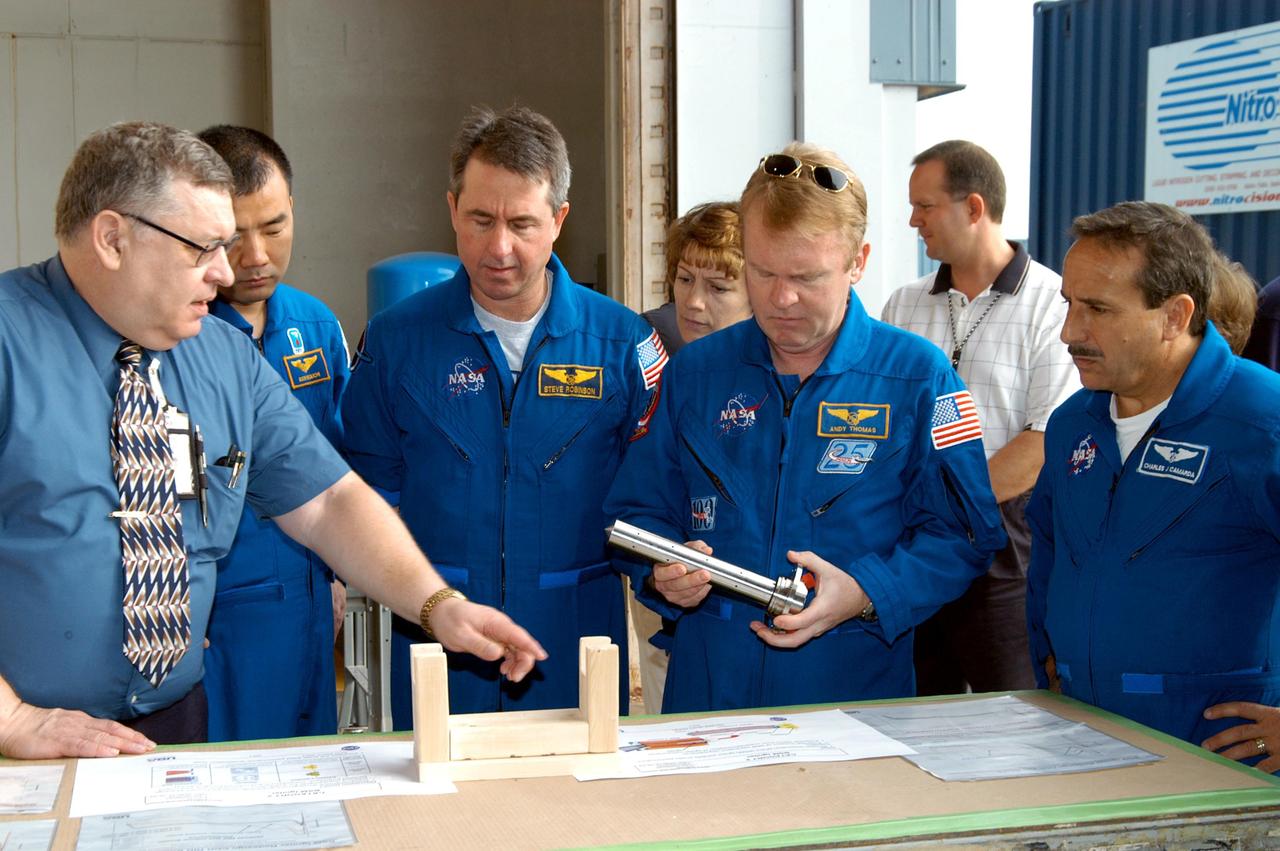
KENNEDY SPACE CENTER, FLA. - - In the SRB Assembly and Refurbishment Facility, some of the STS-114 crew listen to Mike Leppert, Manufacturing Operations project lead with United Space Alliance, talk about a booster separation motor (BSM) igniter. Pictures on the table give expanded views of the BSM and igniter. Next to Leppart, from left, are Mission Specialists Soichi Noguchi and Stephen Robinson; Commander Eileen Collins; and Mission Specialists Andrew Thomas (holding a mockup of an igniter) and Charles Camarda. Noguchi is with the Japanese Aerospace and Exploration Agency. The crew is at KSC for familiarization with Shuttle and mission equipment. The STS-114 mission is Logistics Flight 1, which is scheduled to deliver supplies and equipment, plus the external stowage platform, to the International Space Station.

NASA's Space Optics Manufacturing Center has been working to expand our view of the universe via sophisticated new telescopes. The Optics Center's goal is to develop low-cost, advanced space optics technologies to the NASA program in the 21st century - including the long-term goal of imaging Earth-like planets in distant solar systems. To reduce the cost of mirror fabrication, Marshall Space Flight Center (MSFC) has developed replication techniques, the machinery, and materials to replicate electro-formed nickel mirrors. The process allows fabricating precisely shaped mandrels to be used and reused as masters for replicating high-quality mirrors. Photograph shows J.R. Griffith inspecting a replicated x-ray mirror mandrel.
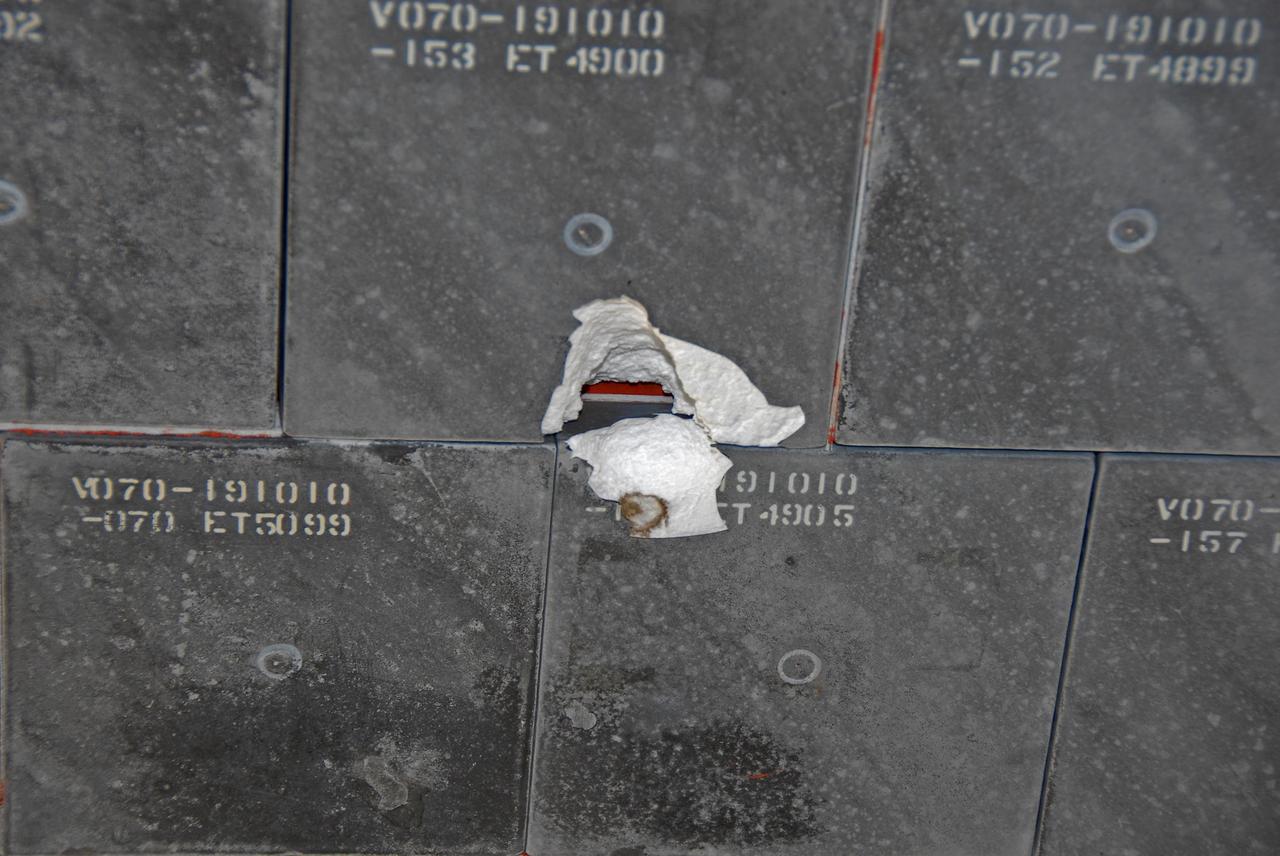
KENNEDY SPACE CENTER, FLA. -- This is a view of the underside of Endeavour taken after its landing on runway 15 at NASA's Kennedy Space Center. The damage to the tiles occurred from a piece of foam on the external tank during launch of Space Shuttle Endeavour on mission STS-118 on Aug. 8. After extensive engineering analysis of such images and testing on the ground, the Mission Management Team decided the tile did not pose a risk to the crew during re-entry. Endeavour landed safely at 12:32 p.m. EDT at NASA's Kennedy Space Center after a 13-day mission to the International Space Station. The STS-118 mission installed a new gyroscope, an external spare parts platform and another truss segment to the expanding station. Photo credit: NASA/Kim Shiflett

ISS038-E-047389 (14 Feb. 2014) --- This panoramic image, which shows parts of Chile and Argentina, and which was exposed with an 80mm lens from the International Space Station (ISS), captures Tierra del Fuego and Cape Horn. Represented here is the southernmost tip of South America (left), with the Atlantic Ocean in the foreground and the Pacific Ocean across the top of the image. Crews on the orbital outpost seldom see Cape Horn in such clear weather. Shortly after this image was taken, the cloud mass approaching from the Pacific Ocean completely obscured the landscape from the station’s view. In this stormy part of the world, ships avoid the heavy seas around exposed Cape Horn and use the protected Strait of Magellan (lower right) on the inshore end of Tierra del Fuego. A small white ice field on the highest parts of Tierra del Fuego (center right) includes Mount Darwin, situated within Chile’s Agostini National Park. The ice field can be imagined as greatly expanded during the geologically recent ice ages, covering an area greater than the land area shown in this view. The heavily indented shape of the fiord coastline and the lake depressions (center and lower right) were carved by the downhill movement of these vanished glaciers, according to NASA scientists.
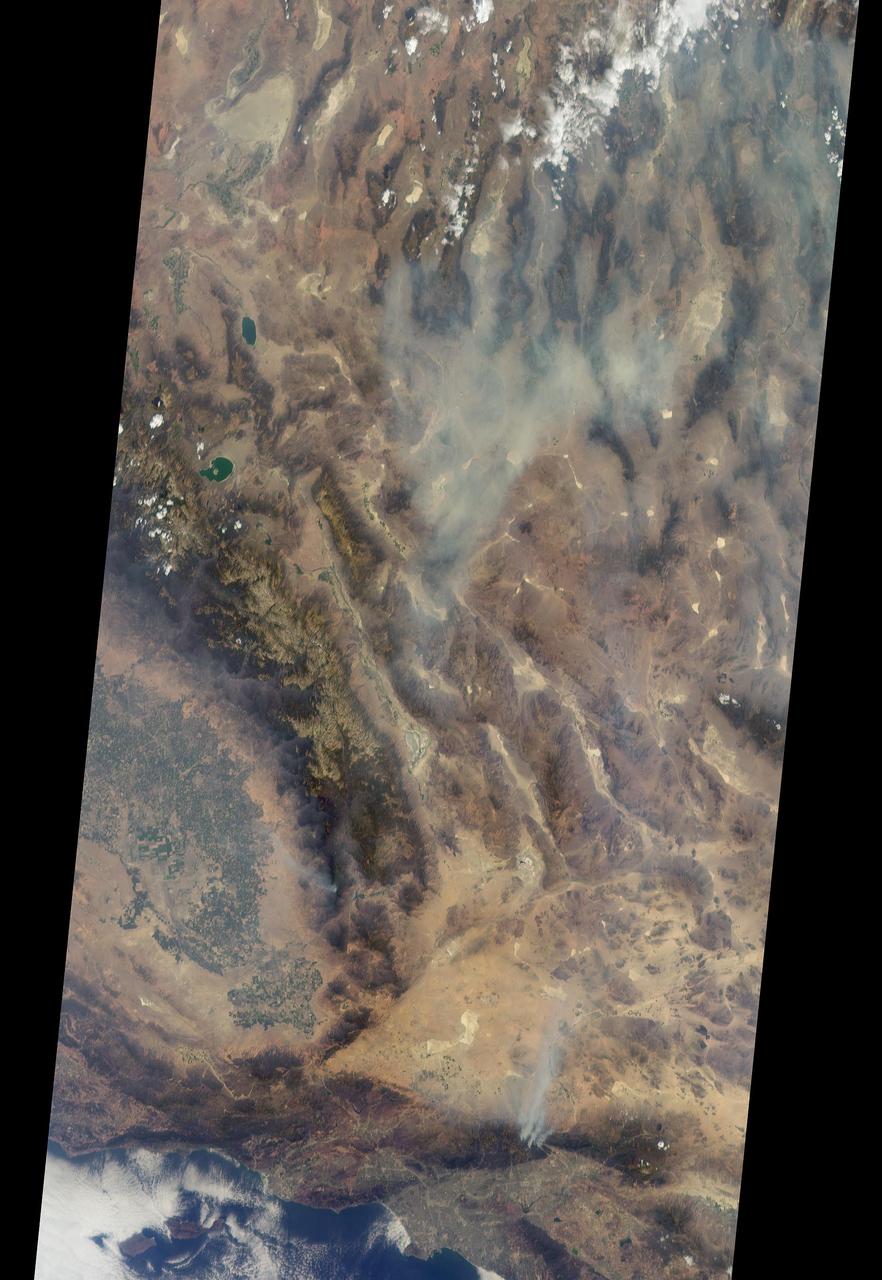
On Aug. 16, 2016, at around 10:30 a.m., a brush fire ignited in the Cajon Pass east of Los Angeles, just to the west of Interstate 15. Within a matter of hours, extreme temperatures, high winds and low humidity allowed the fire to spread rapidly, burning through brush left tinder-dry by years of drought. Firefighters quickly responded, ordering the evacuation of about 83,000 people in and around the Cajon Pass, Wrightwood, Lytle Creek, Oak Hills and surrounding areas. An as-yet uncounted number of homes and structures have burned, and Interstate 15 remains closed to downed power lines and barrier damage. By Aug. 17, the fire had expanded to more than 30,000 acres and remains zero percent contained as some 1,300 firefighters continue to battle to save homes and evacuate residents. The Multi-angle Imaging SpectroRadiometer (MISR) instrument aboard NASA's Terra satellite passed over the region on Aug. 17 around 11:50 a.m. PDT and captured this natural-color image from MISR's 70-degree forward-viewing camera, which covers an areas about 257 miles (414 kilometers) wide. The oblique view angle makes the smoke more apparent than it would be in a more conventional vertical view. The Los Angeles metropolitan area is the large gray area on the coast in the center of the image. Three plumes from the Blue Cut Fire are clearly visible in the mountains to the north. This oblique view also shows an enormous cloud of smoke spreading northeastward over a significant portion of eastern California and Nevada. This smoke probably originated from the fire as it consumed almost 20,000 acres on the evening of the 16th and traveled north overnight. Also visible from this oblique view is considerable haziness filling California's Central Valley, to the northwest of the Blue Cut Fire. This haziness is most likely due to smoke from several other fires burning in California, including the Soberanes Fire near Monterey, the Clayton Fire that has destroyed 175 structures north of San Francisco, the Chimney Fire and the Cedar Fire, which is visible in the image in the southern Sierra Nevada. The total number of acres burned in California this year has tripled in just the past week. The 3D stereo anaglyph is made by combining data from MISR's 60-degree and 70-degree forward-viewing cameras. You will need red-blue glasses to view the 3D effect (ensure the red lens is over your left eye). In order to enable stereo viewing, the image has been rotated so north is to the left. These data were acquired during Terra orbit 88648. http://photojournal.jpl.nasa.gov/catalog/PIA20888
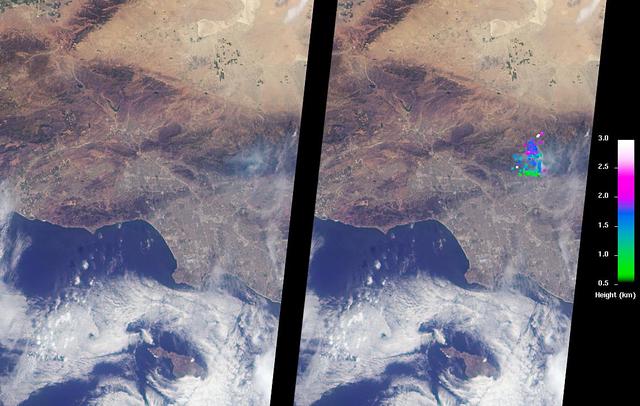
The Los Angeles area is currently suffering the effects of three major wildfires that are blanketing the area with smoke. Over the past few days, Southern California has experienced record-breaking temperatures, topping 110 degrees Fahrenheit in some cities. The heat, in combination with offshore winds, helped to stoke the Sherpa Fire west of Santa Barbara, which has been burning since June 15, 2016. Over the weekend of June 18-19, this fire rapidly expanded in size, forcing freeway closures and evacuations of campgrounds and state beaches. On Monday, June 20, two new fires ignited in the San Gabriel Mountains north of Azusa and Duarte, together dubbed the San Gabriel Complex Fire. They have burned more than 4,900 acres since June 20, sending up plumes of smoke visible to many in the Los Angeles basin and triggering air quality warnings. More than 1,400 personnel have been battling the blazes in the scorching heat, and evacuations were ordered for neighborhoods in the foothills. On June 21, the Multi-angle Imaging SpectroRadiometer (MISR) instrument aboard NASA's Terra satellite captured this view of the San Gabriel Mountains and Los Angeles Basin from its 46-degree forward-viewing camera, which enhances the visibility of the smoke compared to the more conventional nadir (vertical) view. The width of this image is about 75 miles (120 kilometers) across. Smoke from the San Gabriel Complex Fire is visible at the very right of the image. Stereoscopic analysis of MISR's multiple camera angles is used to compute the height of the smoke plume from the San Gabriel Complex Fire. In the right-hand image, these heights are superimposed on the underlying image. The color scale shows that the plume is not much higher than the surrounding mountains. As a result, much of the smoke is confined to the local area. http://photojournal.jpl.nasa.gov/catalog/PIA20718
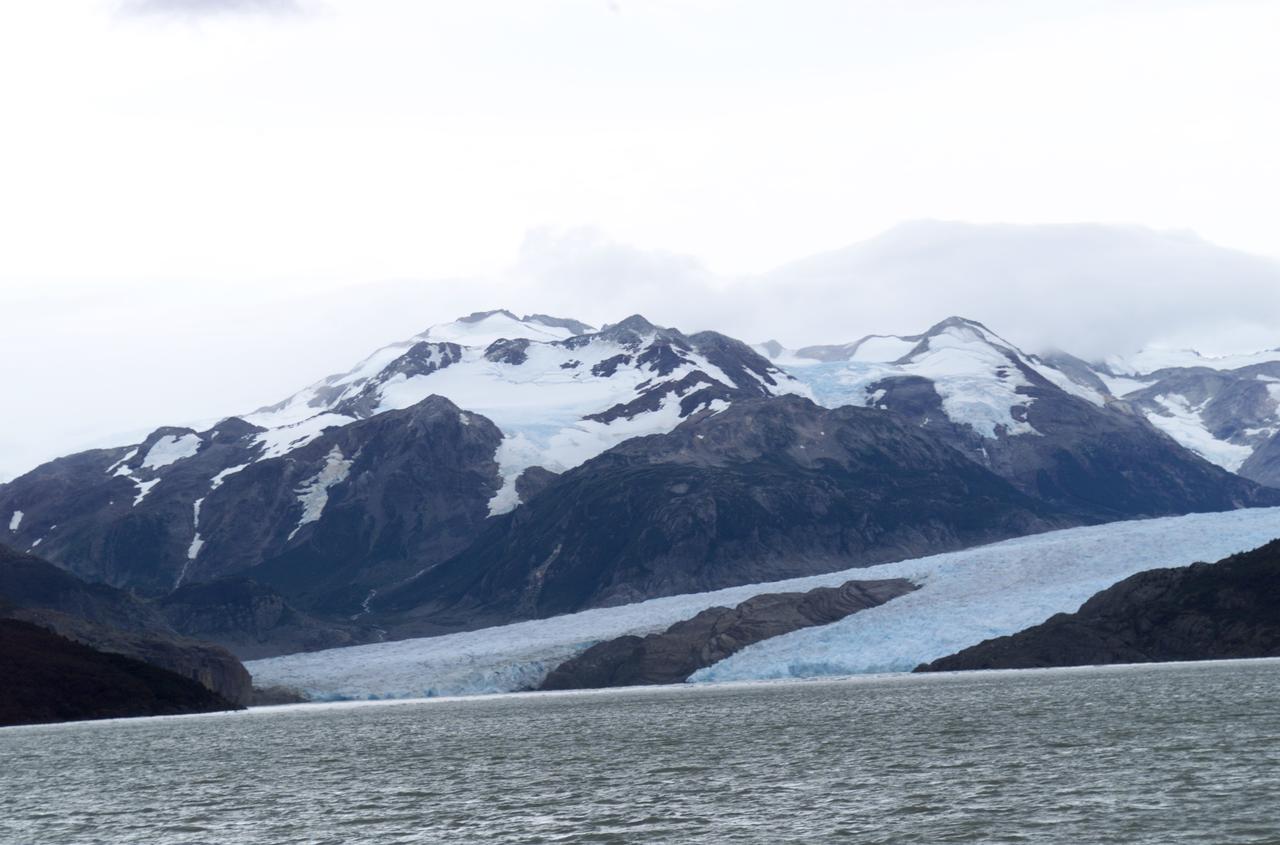
Glacier Grey view from Lago Grey (Grey Lake), photographed during NASA's AirSAR 2004 campaign in Chile. Land visible in this photo was covered by glacier just 6 years earlier. AirSAR 2004 is a three-week expedition in Central and South America by an international team of scientists that is using an all-weather imaging tool, called the Airborne Synthetic Aperture Radar (AirSAR), located onboard NASA's DC-8 airborne laboratory. Scientists from many parts of the world are combining ground research with NASA's AirSAR technology to improve and expand on the quality of research they are able to conduct. Founded in 1959, Torres del Paine National Park encompasses 450,000 acres in the Patagonia region of Chile. This region is being studied by NASA using a DC-8 equipped with an Airborne Synthetic Aperture Radar (AirSAR) developed by scientists from NASA’s Jet Propulsion Laboratory. This is a very sensitive region that is important to scientists because the temperature has been consistently rising causing a subsequent melting of the region’s glaciers. AirSAR will provide a baseline model and unprecedented mapping of the region. This data will make it possible to determine whether the warming trend is slowing, continuing or accelerating. AirSAR will also provide reliable information on ice shelf thickness to measure the contribution of the glaciers to sea level.
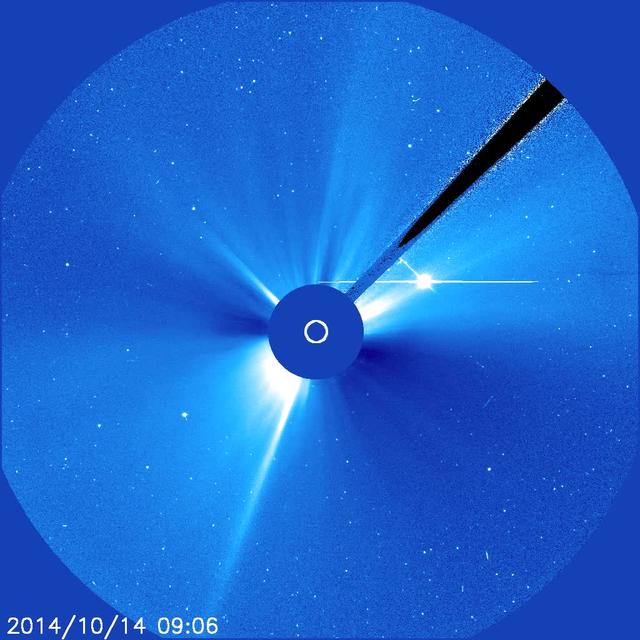
The Sun blew out a powerful coronal mass ejection (CME) from just around the edge of the Sun (Oct. 14, 2014). The particle cloud expanded around all the Sun in a rough circle, hence the name 'halo' CME. This event was also associated with a fairly strong flare. The active region that was the source of these events is just rotating into view. Then, we can better observe its size and structure. The bright object to the right and just above the Sun is Venus now on the far side of the Sun. Credit: NASA/ESA/SOHO <b><a href="http://www.nasa.gov/audience/formedia/features/MP_Photo_Guidelines.html" rel="nofollow">NASA image use policy.</a></b> <b><a href="http://www.nasa.gov/centers/goddard/home/index.html" rel="nofollow">NASA Goddard Space Flight Center</a></b> enables NASA’s mission through four scientific endeavors: Earth Science, Heliophysics, Solar System Exploration, and Astrophysics. Goddard plays a leading role in NASA’s accomplishments by contributing compelling scientific knowledge to advance the Agency’s mission. <b>Follow us on <a href="http://twitter.com/NASAGoddardPix" rel="nofollow">Twitter</a></b> <b>Like us on <a href="http://www.facebook.com/pages/Greenbelt-MD/NASA-Goddard/395013845897?ref=tsd" rel="nofollow">Facebook</a></b> <b>Find us on <a href="http://instagram.com/nasagoddard?vm=grid" rel="nofollow">Instagram</a></b>
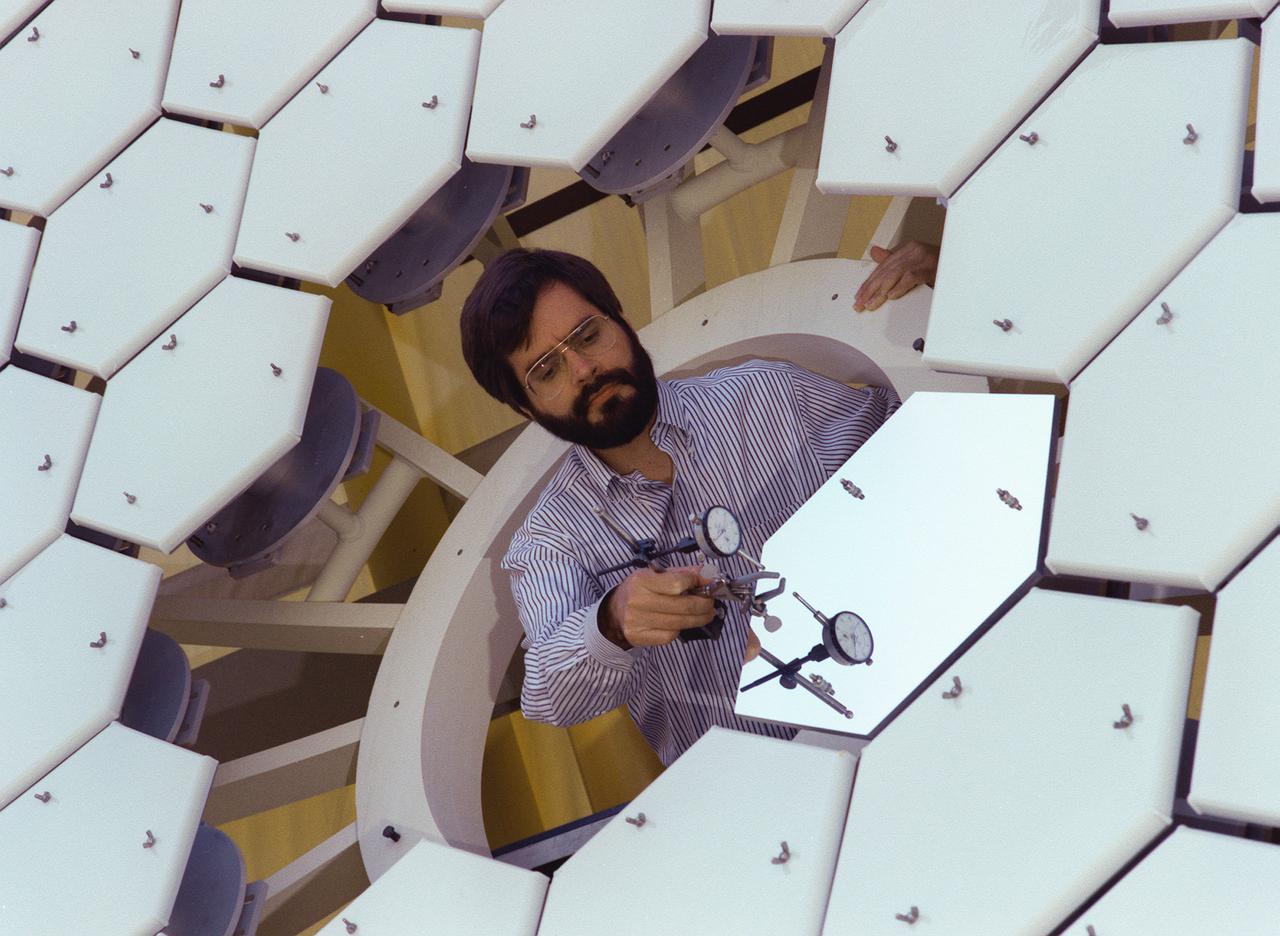
NASA's Space Optics Manufacturing Technology Center has been working to expand our view of the universe via sophisticated new telescopes. The Optics Center's goal is to develop low-cost, advanced space optics technologies for the NASA program in the 21st century, including the long-term goal of imaging Earth-like planets in distant solar systems. A segmented array of mirrors was designed by the Space Optics Manufacturing Technology Center for the solar concentrator test stand at the Marshall Space Flight Center (MSFC) for powering solar thermal propulsion engines. Each hexagon mirror has a spherical surface to approximate a parabolic concentrator when combined into the entire 18-foot diameter array. The aluminum mirrors were polished with a diamond turning machine that creates a glass-like reflective finish on metal. The precision fabrication machinery at the Space Optics Manufacturing Technology Center at MSFC can polish specialized optical elements to a world class quality of smoothness. This image shows optics physicist, Vince Huegele, examining one of the 144-segment hexagonal mirrors of the 18-foot diameter array at the MSFC solar concentrator test stand.

Close-up view of Grey Glacier from Lago Grey (Grey Lake), taken during NASA's AirSAR 2004 campaign in Chile. AirSAR 2004 is a three-week expedition in Central and South America by an international team of scientists that is using an all-weather imaging tool, called the Airborne Synthetic Aperture Radar (AirSAR), located onboard NASA's DC-8 airborne laboratory. Scientists from many parts of the world are combining ground research with NASA's AirSAR technology to improve and expand on the quality of research they are able to conduct. Founded in 1959, Torres del Paine National Park encompasses 450,000 acres in the Patagonia region of Chile. This region is being studied by NASA using a DC-8 equipped with an Airborne Synthetic Aperture Radar (AirSAR) developed by scientists from NASA’s Jet Propulsion Laboratory. This is a very sensitive region that is important to scientists because the temperature has been consistently rising causing a subsequent melting of the region’s glaciers. AirSAR will provide a baseline model and unprecedented mapping of the region. This data will make it possible to determine whether the warming trend is slowing, continuing or accelerating. AirSAR will also provide reliable information on ice shelf thickness to measure the contribution of the glaciers to sea level.
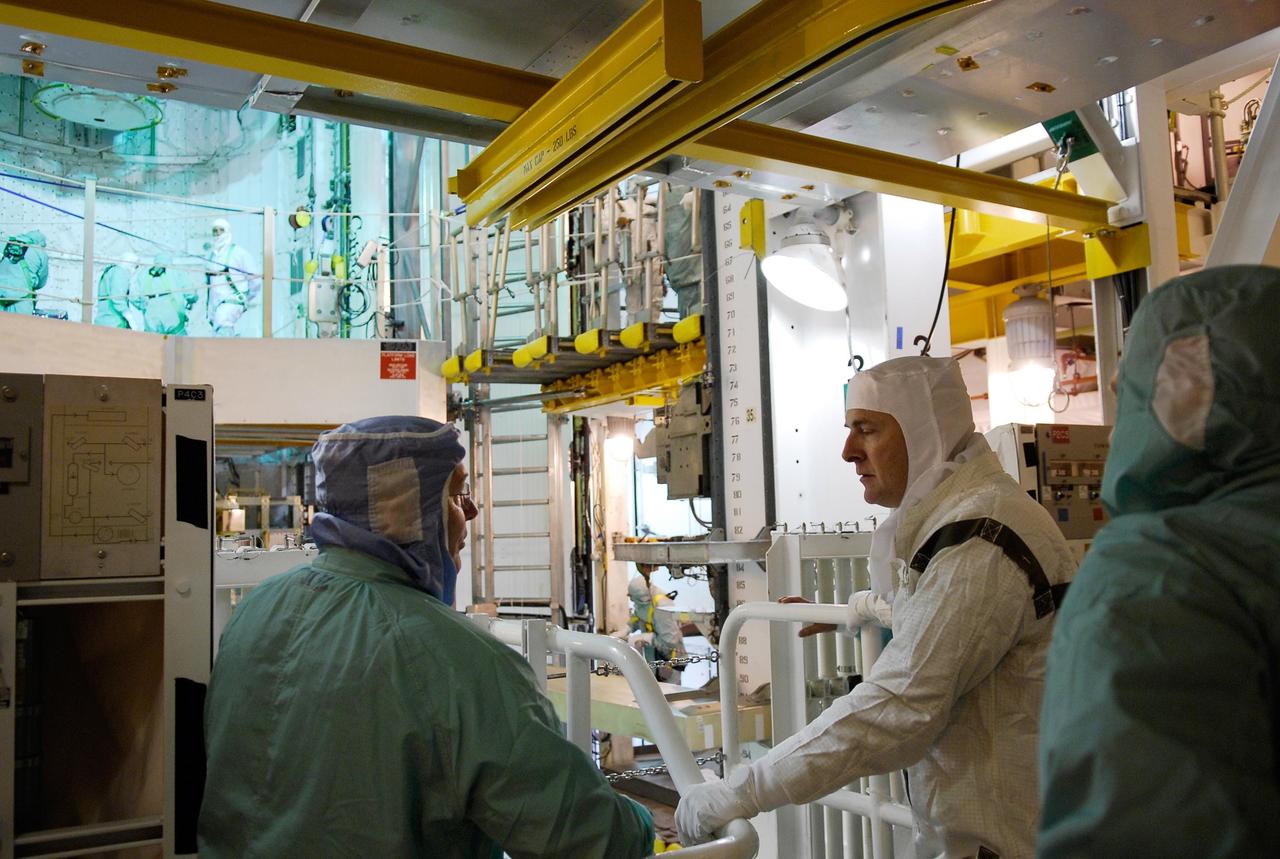
KENNEDY SPACE CENTER, FLA. -- At Launch Pad 39A, members of the space shuttle Atlantis STS-122 crew view the Columbus module during terminal countdown demonstration test, or TCDT, activities. Columbus was installed in the orbiter's payload bay on Nov. 11. From left, in clean room attire, are former astronaut Jerry Ross, chief of the Vehicle Integration Test Office at NASA Johnson Space Center, Pilot Alan Poindexter and Commander Steve Frick. The TCDT provides astronauts and ground crews with equipment familiarization, emergency egress training and a simulated launch countdown. On mission STS-122, Atlantis will deliver the Columbus module to the International Space Station. The European Space Agency's largest single contribution to the station, Columbus is a multifunctional, pressurized laboratory that will be permanently attached to U.S. Node 2, called Harmony. The module is approximately 23 feet long and 15 feet wide, allowing it to hold 10 large racks of experiments. The laboratory will expand the research facilities aboard the station, providing crew members and scientists from around the world the ability to conduct a variety of experiments in the physical, materials and life sciences. Launch is targeted for Dec. 6. Photo credit: NASA/Kim Shiflett
CAPE CANAVERAL, Fla. – On Launch Pad 39A at NASA's Kennedy Space Center in Florida, workers close one of space shuttle Atlantis' payload bay doors around the hardware for the STS-125 mission to service NASA's Hubble Space Telescope. Partially concealed from view at the bottom are the Flight Support System with the Soft Capture mechanism and Multi-Use Lightweight Equipment Carrier with the Science Instrument Command and Data Handling Unit, or SIC&DH. At center is the Orbital Replacement Unit Carrier with the Cosmic Origins Spectrograph, or COS, and an IMAX 3D camera. At top is the Super Lightweight Interchangeable Carrier with the Wide Field Camera 3. Atlantis' crew will service NASA's Hubble Space Telescope for the fifth and final time. The flight will include five spacewalks during which astronauts will refurbish and upgrade the telescope with state-of-the-art science instruments. As a result, Hubble's capabilities will be expanded and its operational lifespan extended through at least 2014. Launch is scheduled for 2:01 p.m. EDT on May 11. Photo credit: NASA/Kim Shiflett
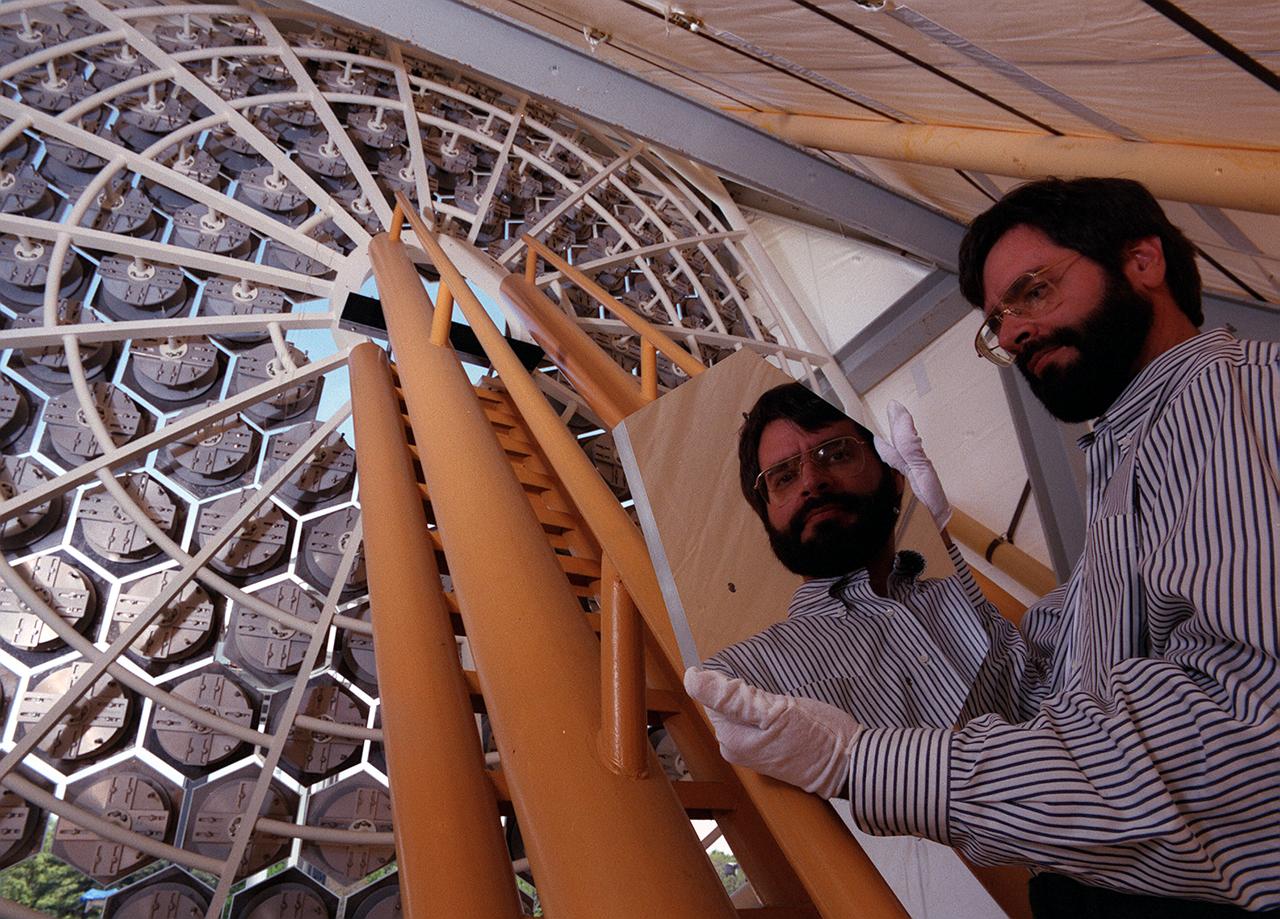
NASA's Space Optics Manufacturing Technology Center has been working to expand our view of the universe via sophisticated new telescopes. The Optics Center's goal is to develop low-cost, advanced space optics technologies for the NASA program in the 21st century, including the long-term goal of imaging Earth-like planets in distant solar systems. A segmented array of mirrors was designed by the Space Optics Manufacturing Technology Center for solar the concentrator test stand at the Marshall Space Flight Center (MSFC) for powering solar thermal propulsion engines. Each hexagon mirror has a spherical surface to approximate a parabolic concentrator when combined into the entire 18-foot diameter array. The aluminum mirrors were polished with a diamond turning machine, that creates a glass-like reflective finish on metal. The precision fabrication machinery at the Space Optics Manufacturing Technology Center at MSFC can polish specialized optical elements to a world class quality of smoothness. This image shows optics physicist, Vince Huegele, examining one of the 144-segment hexagonal mirrors of the 18-foot diameter array at the MSFC solar concentrator test stand.

NASA's Space Optics Manufacturing Center has been working to expand our view of the universe via sophisticated new telescopes. The Optics Center's goal is to develop low-cost, advanced space optics technologies for the NASA program in the 21st century - including the long-term goal of imaging Earth-like planets in distant solar systems. To reduce the cost of mirror fabrication, Marshall Space Flight Center (MSFC) has developed replication techniques, the machinery, and materials to replicate electro-formed nickel mirrors. The process allows fabricating precisely shaped mandrels to be used and reused as masters for replicating high-quality mirrors. MSFC's Space Optics Manufacturing Technology Center (SOMTC) has grinding and polishing equipment ranging from conventional spindles to custom-designed polishers. These capabilities allow us to grind precisely and polish a variety of optical devices, including x-ray mirror mandrels. This image shows Charlie Griffith polishing the half-meter mandrel at SOMTC.
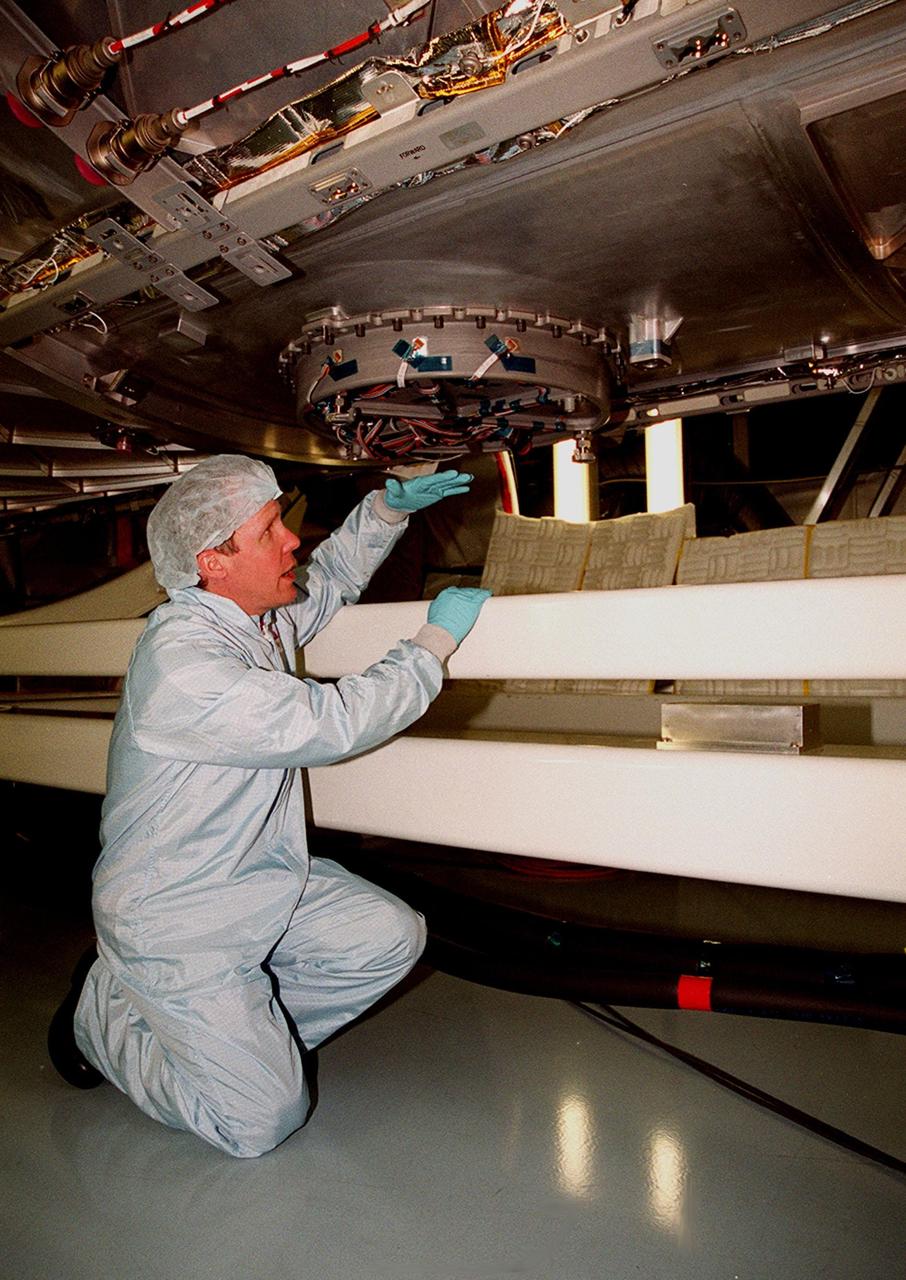
In the Space Station Processing Facility, STS-98 Mission Specialist Thomas D. Jones (Ph.D.) gets a closeup view of the cover on the window of the U.S. Lab Destiny. Along with Commander Kenneth D. Cockrell and Pilot Mark Polansky, Jones is taking part in a Multi-Equipment Interface Test (MEIT) on this significant element of the International Space Station. During the STS-98 mission, the crew will install the Lab on the station during a series of three space walks. The mission will provide the station with science research facilities and expand its power, life support and control capabilities. The U.S. Laboratory Module continues a long tradition of microgravity materials research, first conducted by Skylab and later Shuttle and Spacelab missions. Destiny is expected to be a major feature in future research, providing facilities for biotechnology, fluid physics, combustion, and life sciences research. The Lab is planned for launch aboard Space Shuttle Atlantis on the sixth ISS flight, currently targeted no earlier than Aug. 19, 2000
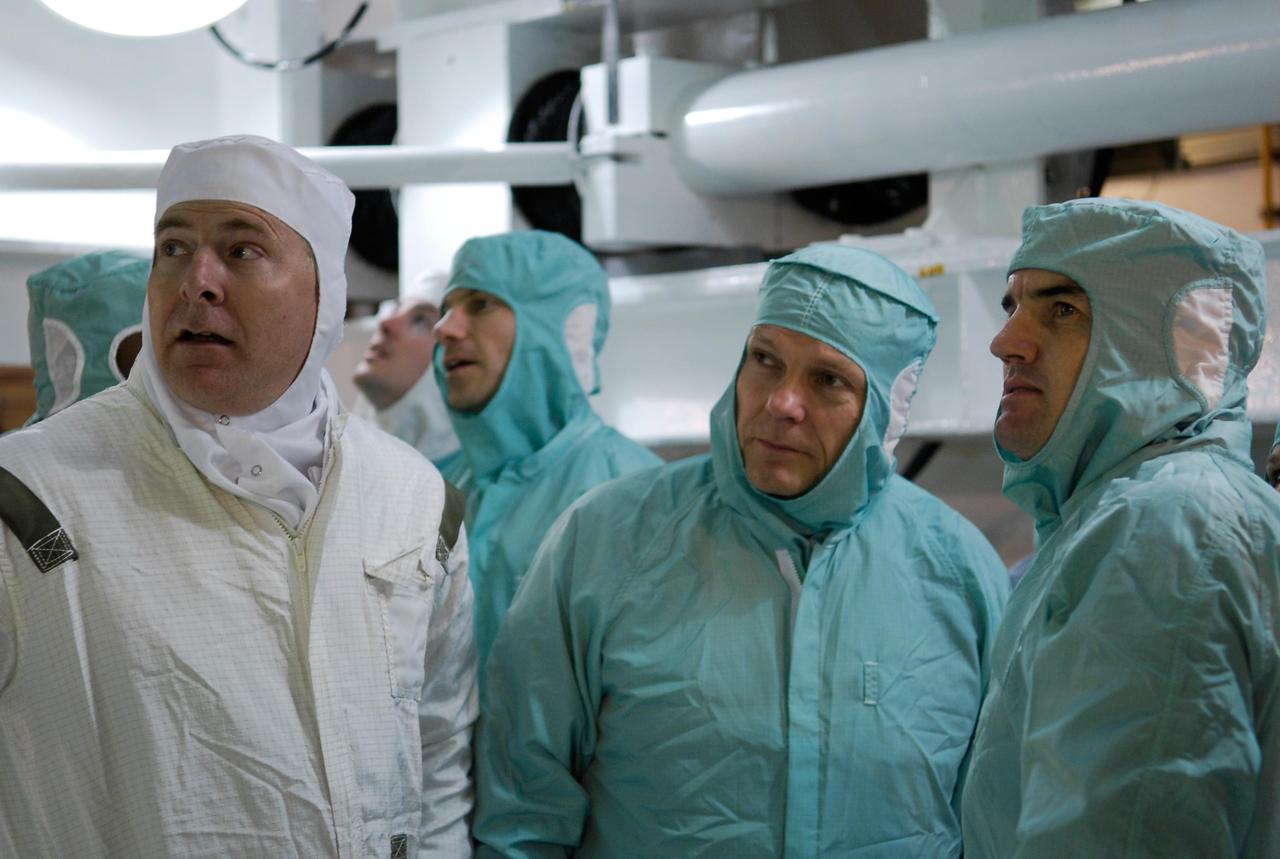
KENNEDY SPACE CENTER, FLA. -- At Launch Pad 39A, members of the space shuttle Atlantis STS-122 crew view the Columbus module during terminal countdown demonstration test, or TCDT, activities. Columbus was installed in the orbiter's payload bay on Nov. 11. From left, in clean room attire, are Pilot Alan Poindexter and Mission Specialists Stanley Love, Hans Schlegel of the European Space Agency and Rex Walheim. The TCDT provides astronauts and ground crews with equipment familiarization, emergency egress training and a simulated launch countdown. On mission STS-122, Atlantis will deliver the Columbus module to the International Space Station. The European Space Agency's largest single contribution to the station, Columbus is a multifunctional, pressurized laboratory that will be permanently attached to U.S. Node 2, called Harmony. The module is approximately 23 feet long and 15 feet wide, allowing it to hold 10 large racks of experiments. The laboratory will expand the research facilities aboard the station, providing crew members and scientists from around the world the ability to conduct a variety of experiments in the physical, materials and life sciences. Launch is targeted for Dec. 6. Photo credit: NASA/Kim Shiflett

View of Glacier Grey from Lago Grey (Grey Lake), with the Cuernos del Paine mountains in the background, seen during NASA's AirSAR 2004 campaign in Chile. AirSAR 2004 is a three-week expedition in Central and South America by an international team of scientists that is using an all-weather imaging tool, called the Airborne Synthetic Aperture Radar (AirSAR), located onboard NASA's DC-8 airborne laboratory. Scientists from many parts of the world are combining ground research with NASA's AirSAR technology to improve and expand on the quality of research they are able to conduct. Founded in 1959, Torres del Paine National Park encompasses 450,000 acres in the Patagonia region of Chile. This region is being studied by NASA using a DC-8 equipped with an Airborne Synthetic Aperture Radar (AirSAR) developed by scientists from NASA’s Jet Propulsion Laboratory. This is a very sensitive region that is important to scientists because the temperature has been consistently rising causing a subsequent melting of the region’s glaciers. AirSAR will provide a baseline model and unprecedented mapping of the region. This data will make it possible to determine whether the warming trend is slowing, continuing or accelerating. AirSAR will also provide reliable information on ice shelf thickness to measure the contribution of the glaciers to sea level.
STS125-S-050 (11 May 2009) --- The launch of Space Shuttle Atlantis from launch pad 39A at NASA's Kennedy Space Center in Florida is viewed from behind launch pad 39B. On pad 39B is Space Shuttle Endeavour, which can launch, if needed, for rescue of Atlantis? crew during its STS-125 mission to service NASA?s Hubble Space Telescope. Liftoff of Atlantis was on time at 2:01 p.m. (EDT) on May 11, 2009. Onboard are astronauts Scott Altman, commander; Gregory C. Johnson, pilot; Michael Good, Megan McArthur, John Grunsfeld, Mike Massimino and Andrew Feustel, all mission specialists. Atlantis' 11-day flight will include five spacewalks to refurbish and upgrade the telescope with state-of-the-art science instruments that will expand Hubble's capabilities and extend its operational lifespan through at least 2014. The payload includes a Wide Field Camera 3, Fine Guidance Sensor and the Cosmic Origins Spectrograph.
This illustration depicts a side view of the Hubble Space Telescope (HST). The HST is the product of a partnership between NASA, European Space Agency Contractors, and the international community of astronomers. It is named after Edwin P. Hubble, an American Astronomer who discovered the expanding nature of the universe and was the first to realize the true nature of galaxies. The purpose of the HST, the most complex and sensitive optical telescope ever made, is to study the cosmos from a low-Earth orbit. By placing the telescope in space, astronomers are able to collect data that is free of the Earth's atmosphere. The HST detects objects 25 times fainter than the dimmest objects seen from Earth and provides astronomers with an observable universe 250 times larger than visible from ground-based telescopes, perhaps as far away as 14 billion light-years. The HST views galaxies, stars, planets, comets, possibly other solar systems, and even unusual phenomena such as quasars, with 10 times the clarity of ground-based telescopes. The major elements of the HST are the Optical Telescope Assembly (OTA), the Support System Module (SSM), and the Scientific Instruments (SI). The HST is approximately the size of a railroad car, with two cylinders joined together and wrapped in a silvery reflective heat shield blanket. Wing-like solar arrays extend horizontally from each side of these cylinders, and dish-shaped anternas extend above and below the body of the telescope. The HST was deployed from the Space Shuttle Discovery (STS-31 mission) into Earth orbit in April 1990. The Marshall Space Flight Center had responsibility for design, development, and construction of the HST. The Perkin-Elmer Corporation, in Danbury, Connecticut, developed the optical system and guidance sensors. The Lockheed Missile and Space Company of Sunnyvale, California produced the protective outer shroud and spacecraft systems, and assembled and tested the finished telescope.
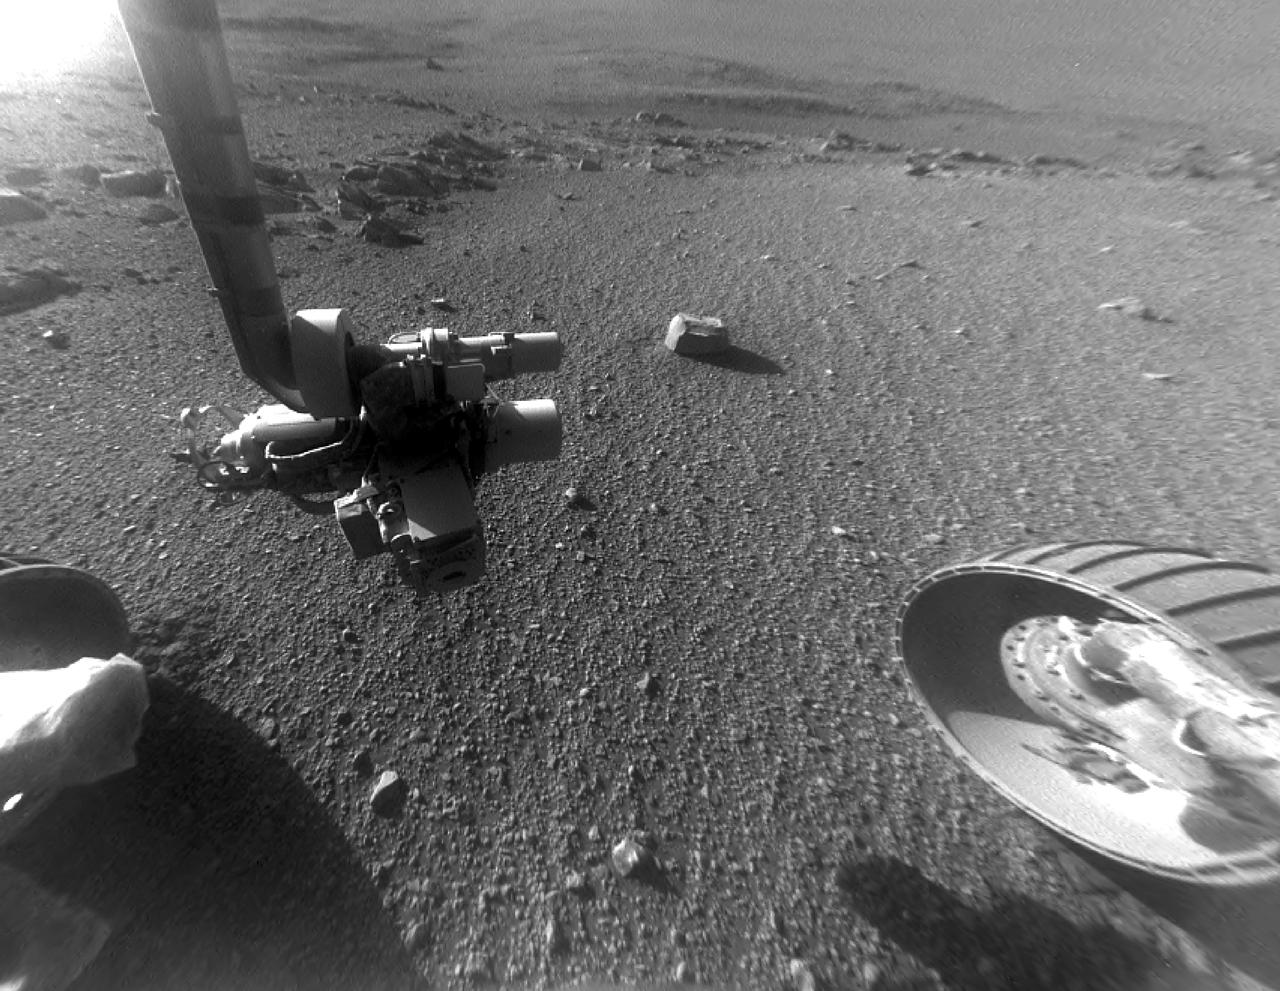
This late-afternoon view from the front Hazard Avoidance Camera on NASA's Mars Exploration Rover Opportunity shows a pattern of rock stripes on the ground, a surprise to scientists on the rover team. Approaching the 5,000th Martian day or sol, of what was planned as a 90-sol mission, Opportunity is still providing new discoveries. This image was taken inside "Perseverance Valley," on the inboard slope of the western rim of Endeavour Crater, on Sol 4958 (Jan. 4, 2018). Both this view and one taken the same sol by the rover's Navigation Camera look downhill toward the northeast from about one-third of the way down the valley, which extends about the length of two football fields from the crest of the rim toward the crater floor. The lighting, with the Sun at a low angle, emphasizes the ground texture, shaped into stripes defined by rock fragments. The stripes are aligned with the downhill direction. The rock to the upper right of the rover's robotic arm is about 2 inches (5 centimeters) wide and about 3 feet (1 meter) from the centerline of the rover's two front wheels. This striped pattern resembles features seen on Earth, including on Hawaii's Mauna Kea, that are formed by cycles of freezing and thawing of ground moistened by melting ice or snow. There, fine-grained fraction of the soil expands as it freezes, and this lifts the rock fragments up and to the sides. If such a process formed this pattern in Perseverance Valley, those conditions might have been present locally during a period within the past few million years when Mars' spin axis was at a greater tilt than it is now, and some of the water ice now at the poles was redistributed to lower latitudes. Other hypotheses for how these features formed are also under consideration, including high-velocity slope winds. https://photojournal.jpl.nasa.gov/catalog/PIA22218

These four panels show the Whirlpool galaxy — which is actually a pair of galaxies also known as Messier 51 and NGC 5194/5195 — and how different wavelengths of light can reveal different features of a cosmic object. Located approximately 23 million light-years away, it resides in the constellation Canes Venatici. The left image (a) shows the galaxy in visible light, from the Kitt Peak National Observatory 2.1-meter (6.8-foot) telescope and shows light at 0.4 microns (blue) and 0.7 microns (green). The next image (b) combines two visible-light wavelengths (in blue and green) and infrared light (in red). The infrared was captured by NASA's Spitzer Space Telescope and emphasizes how the dark dust veins that block our view in visible light begin to light up at these longer, infrared wavelengths. The right two panels are composed entirely of Spitzer data. In the middle-right panel (c), we see three wavelengths of infrared light: 3.6 microns (shown in blue), 4.5 microns (green) and 8 microns (red). The blended light from the billions of stars in the Whirlpool is brightest at the shorter infrared wavelengths and appear as as a blue haze. The individual blue dots across the image are mostly nearby stars and a few distant galaxies. Red features (at 8 microns) show us dust composed mostly of carbon that is illuminated by the stars in the galaxy. The far-right panel (d) expands our infrared view to include light at a wavelength of 24 microns (in red), which is particularly good for highlighting areas where the dust is especially hot. The bright reddish-white spots trace regions where new stars are forming and, in the process, heating their surroundings. All of the data shown here were released as part of the Spitzer Infrared Nearby Galaxies Survey (SINGS) project, captured during Spitzer's cryogenic and warm missions. https://photojournal.jpl.nasa.gov/catalog/PIA23128
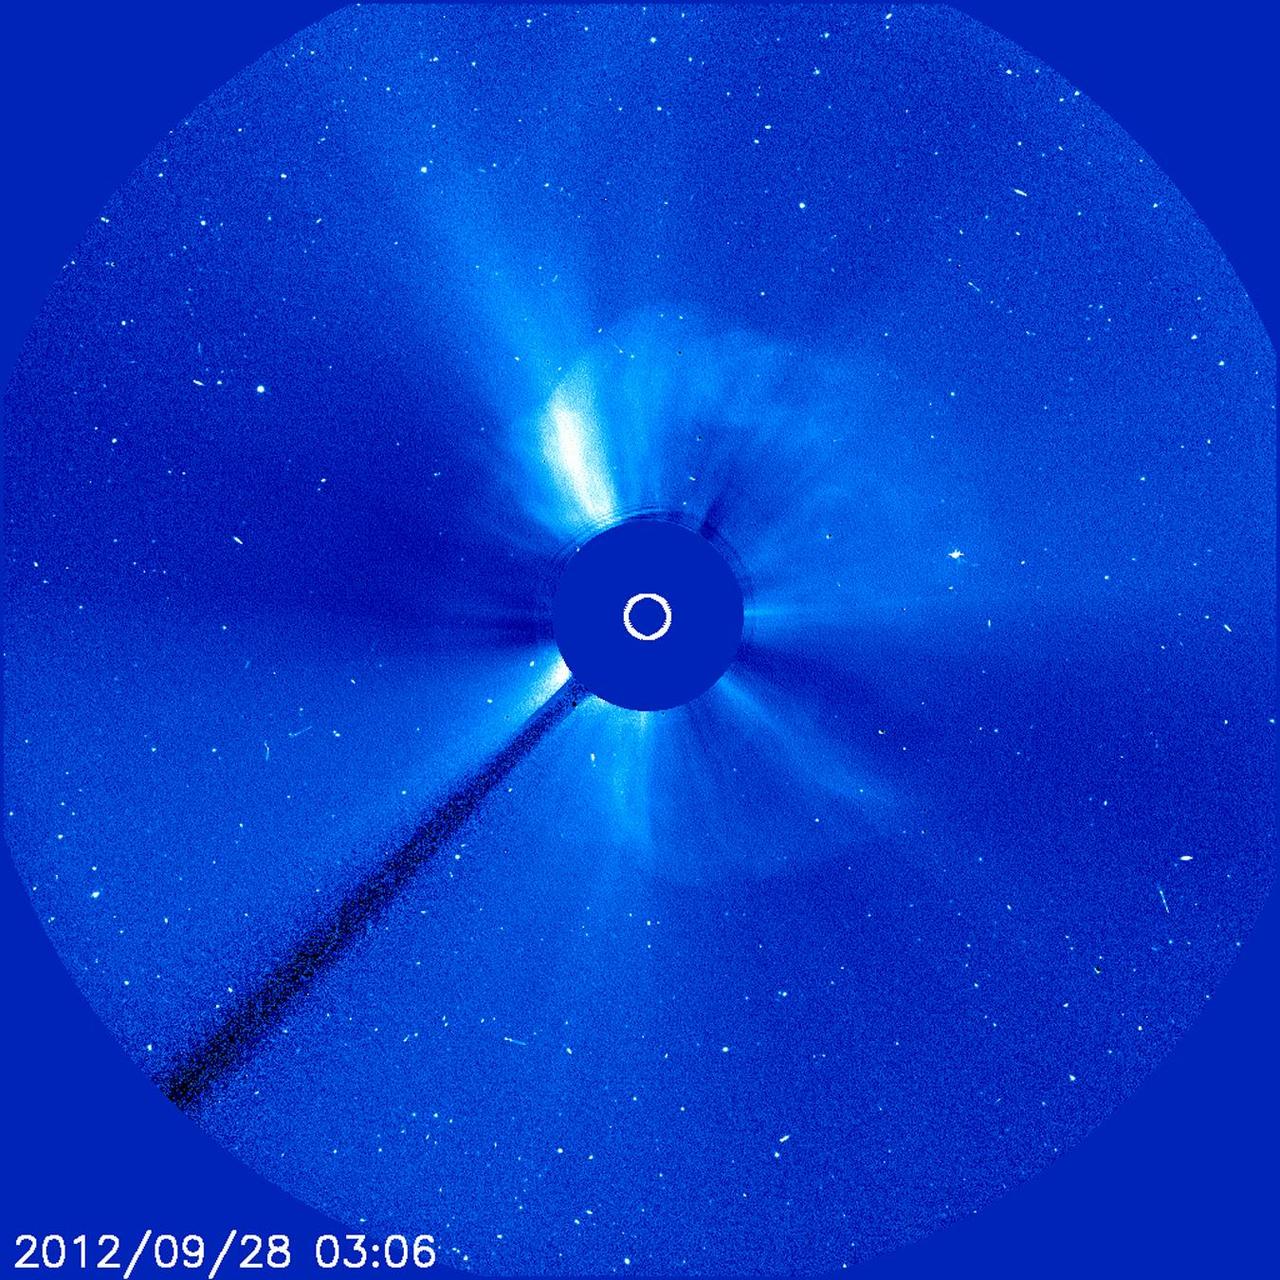
A giant cloud appears to expand outward from the sun in all directions in this image from Sept. 28, 2012, which is called a halo CME. This kind of image occurs when a CME moves toward Earth – as here – or directly away from it. Credit: ESA/NASA/SOHO CME WEEK: What To See in CME Images Two main types of explosions occur on the sun: solar flares and coronal mass ejections. Unlike the energy and x-rays produced in a solar flare – which can reach Earth at the speed of light in eight minutes – coronal mass ejections are giant, expanding clouds of solar material that take one to three days to reach Earth. Once at Earth, these ejections, also called CMEs, can impact satellites in space or interfere with radio communications. During CME WEEK from Sept. 22 to 26, 2014, we explore different aspects of these giant eruptions that surge out from the star we live with. When a coronal mass ejection blasts off the sun, scientists rely on instruments called coronagraphs to track their progress. Coronagraphs block out the bright light of the sun, so that the much fainter material in the solar atmosphere -- including CMEs -- can be seen in the surrounding space. CMEs appear in these images as expanding shells of material from the sun's atmosphere -- sometimes a core of colder, solar material (called a filament) from near the sun's surface moves in the center. But mapping out such three-dimensional components from a two-dimensional image isn't easy. Watch the slideshow to find out how scientists interpret what they see in CME pictures. The images in the slideshow are from the three sets of coronagraphs NASA currently has in space. One is on the joint European Space Agency and NASA Solar and Heliospheric Observatory, or SOHO. SOHO launched in 1995, and sits between Earth and the sun about a million miles away from Earth. The other two coronagraphs are on the two spacecraft of the NASA Solar Terrestrial Relations Observatory, or STEREO, mission, which launched in 2006. The two STEREO spacecraft are both currently viewing the far side of the sun. Together these instruments help scientists create a three-dimensional model of any CME as its journey unfolds through interplanetary space. Such information can show why a given characteristic of a CME close to the sun might lead to a given effect near Earth, or any other planet in the solar system...<b><a href="http://www.nasa.gov/audience/formedia/features/MP_Photo_Guidelines.html" rel="nofollow">NASA image use policy.</a></b> <b><a href="http://www.nasa.gov/centers/goddard/home/index.html" rel="nofollow">NASA Goddard Space Flight Center</a></b> enables NASA’s mission through four scientific endeavors: Earth Science, Heliophysics, Solar System Exploration, and Astrophysics. Goddard plays a leading role in NASA’s accomplishments by contributing compelling scientific knowledge to advance the Agency’s mission. <b>Follow us on <a href="http://twitter.com/NASAGoddardPix" rel="nofollow">Twitter</a></b> <b>Like us on <a href="http://www.facebook.com/pages/Greenbelt-MD/NASA-Goddard/395013845897?ref=tsd" rel="nofollow">Facebook</a></b> <b>Find us on <a href="http://instagram.com/nasagoddard?vm=grid" rel="nofollow">Instagram</a></b>
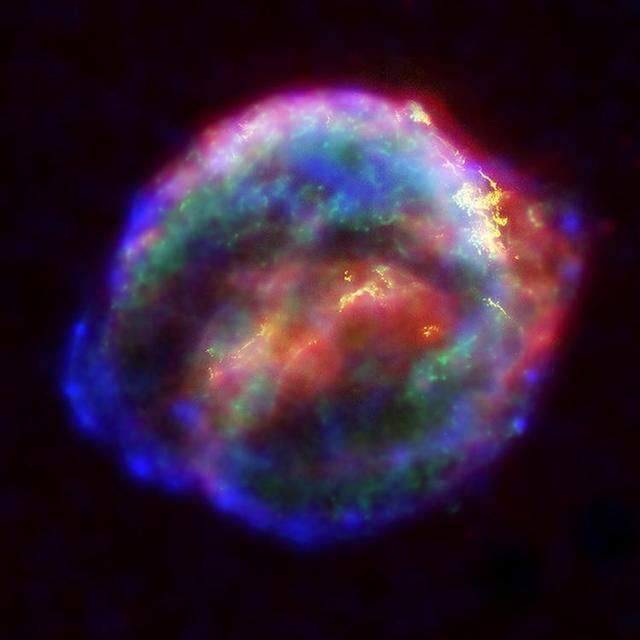
NASA's three Great Observatories -- the Hubble Space Telescope, the SpitzerSpace Telescope, and the Chandra X-ray Observatory -- joined forces to probe theexpanding remains of a supernova, called Kepler's supernova remnant, first seen 400 years ago by sky watchers, including astronomer Johannes Kepler. The combined image unveils a bubble-shaped shroud of gas and dust that is 14light-years wide and is expanding at 4 million miles per hour (2,000 kilometersper second). Observations from each telescope highlight distinct features of thesupernova remnant, a fast-moving shell of iron-rich material from the explodedstar, surrounded by an expanding shock wave that is sweeping up interstellar gasand dust. Each color in this image represents a different region of the electromagneticspectrum, from X-rays to infrared light. These diverse colors are shown in thepanel of photographs below the composite image. The X-ray and infrared datacannot be seen with the human eye. By color-coding those data and combining themwith Hubble's visible-light view, astronomers are presenting a more completepicture of the supernova remnant. Visible-light images from the Hubble telescope (colored yellow) reveal where the supernova shock wave is slamming into the densest regions of surrounding gas.The bright glowing knots are dense clumps from instabilities that form behindthe shock wave. The Hubble data also show thin filaments of gas that look likerippled sheets seen edge-on. These filaments reveal where the shock wave isencountering lower-density, more uniform interstellar material. The Spitzer telescope shows microscopic dust particles (colored red) that havebeen heated by the supernova shock wave. The dust re-radiates the shock wave'senergy as infrared light. The Spitzer data are brightest in the regionssurrounding those seen in detail by the Hubble telescope. The Chandra X-ray data show regions of very hot gas, and extremely high-energyparticles. The hottest gas (higher-energy X-rays, colored blue) is locatedprimarily in the regions directly behind the shock front. These regions alsoshow up in the Hubble observations, and also align with the faint rim of glowingmaterial seen in the Spitzer data. The X-rays from the region on the lower left(colored blue) may be dominated by extremely high-energy electrons that wereproduced by the shock wave and are radiating at radio through X-ray wavelengthsas they spiral in the intensified magnetic field behind the shock front. CoolerX-ray gas (lower-energy X-rays, colored green) resides in a thick interior shelland marks the location of heated material expelled from the exploded star. Kepler's supernova, the last such object seen to explode in our Milky Waygalaxy, resides about 13,000 light-years away in the constellation Ophiuchus. The Chandra observations were taken in June 2000, the Hubble in August 2003;and the Spitzer in August 2004. http://photojournal.jpl.nasa.gov/catalog/PIA06907
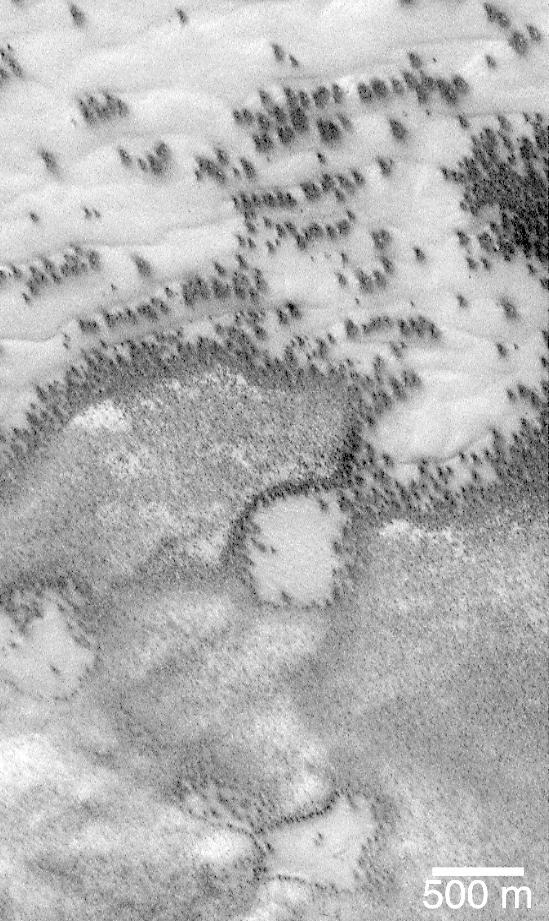
"They look like bushes!" That's what almost everyone says when they see the dark features found in pictures taken of sand dunes in the polar regions as they are beginning to defrost after a long, cold winter. It is hard to escape the fact that, at first glance, these images acquired by the Mars Global Surveyor (MGS) Mars Orbiter Camera (MOC) over both polar regions during the spring and summer seasons, do indeed resemble aerial photographs of sand dune fields on Earth -- complete with vegetation growing on and around them! Of course, this is not what the features are, as we describe below and in related picture captions. Still, don't they look like vegetation to you? Shown here are two views of the same MGS MOC image. On the left is the full scene, on the right is an expanded view of a portion of the scene on the left. The bright, smooth surfaces that are dotted with occasional, nearly triangular dark spots are sand dunes covered by winter frost. The MGS MOC has been used over the past several months (April-August 1999) to monitor dark spots as they form and evolve on polar dune surfaces. The dark spots typically appear first along the lower margins of a dune -- similar to the position of bushes and tufts of grass that occur in and among some sand dunes on Earth. Because the martian air pressure is very low -- 100 times lower than at Sea Level on Earth -- ice on Mars does not melt and become liquid when it warms up. Instead, ice sublimes -- that is, it changes directly from solid to gas, just as "dry ice" does on Earth. As polar dunes emerge from the months-long winter night, and first become exposed to sunlight, the bright winter frost and snow begins to sublime. This process is not uniform everywhere on a dune, but begins in small spots and then over several months it spreads until the entire dune is spotted like a leopard. The early stages of the defrosting process -- as in the picture shown here -- give the impression that something is "growing" on the dunes. The sand underneath the frost is dark, just like basalt beach sand in Hawaii. Once it is exposed to sunlight, the dark sand probably absorbs sunlight and helps speed the defrosting of each sand dune. This picture was taken by MGS MOC on July 21, 1999. The dunes are located in the south polar region and are expected to be completely defrosted by November or December 1999. North is approximately up, and sunlight illuminates the scene from the upper left. The 500 meter scale bar equals 547 yards; the 300 meter scale is also 328 yards. http://photojournal.jpl.nasa.gov/catalog/PIA02300
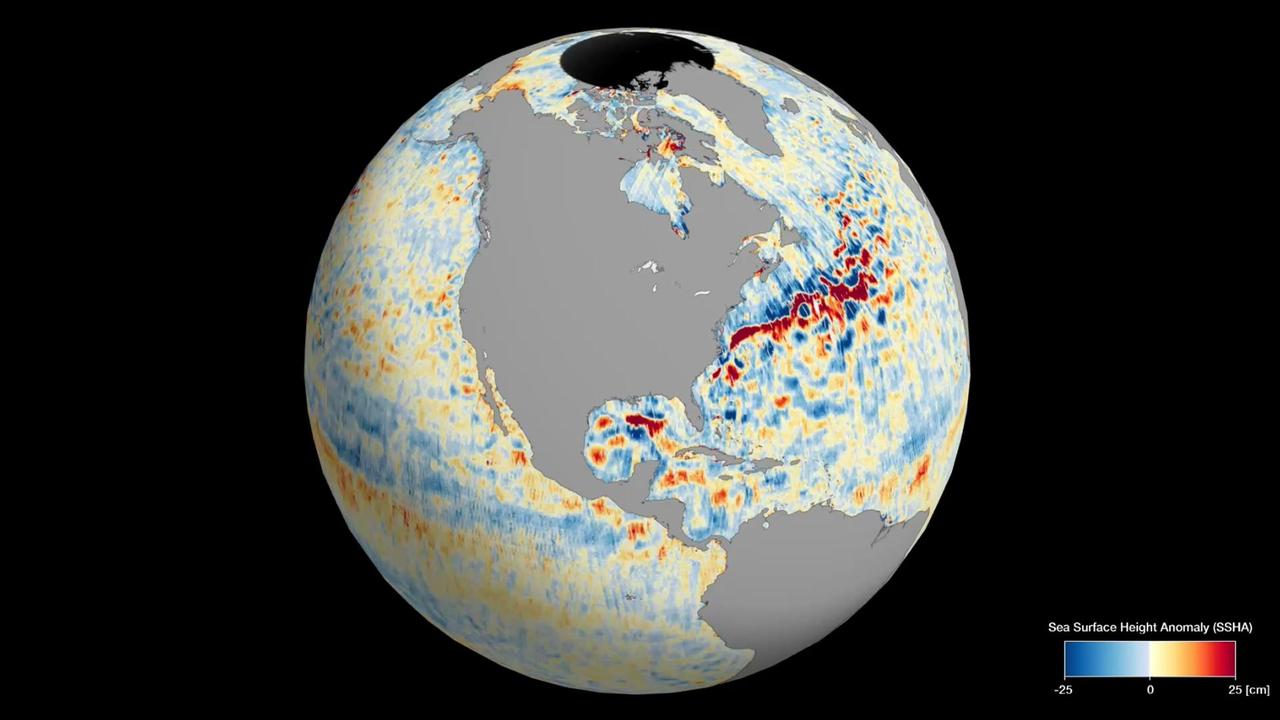
This animation shows global sea level data collected by the Surface Water and Ocean Topography (SWOT) satellite during its first 21-day science orbit, which it completed from July 26 to Aug. 16, 2023. Red and orange indicate ocean heights that were higher than the global mean sea surface height, while blue represents lower-than-the mean. Sea level differences can highlight ocean currents, like the Gulf Stream coming off the U.S. East Coast or the Kuroshio current off the east coast of Japan. Increased sea surface heights can also indicate regions of relatively warmer water – like the eastern part of the equatorial Pacific Ocean during an El Niño – because water expands as it warms. The SWOT science team made the measurements using the spacecraft's Ka-band Radar Interferometer (KaRIn) instrument. With two antennas spread 33 feet (10 meters) apart on a boom, KaRIn produces a pair of data swaths (tracks visible in the animation) as it circles the globe, bouncing radar pulses off the water's surface to collect surface-height measurements. Launched on Dec. 16, 2022, from Vandenberg Space Force Base in central California, SWOT is now in its operations phase, measuring the height of nearly all water on Earth's surface. The satellite will provide one of the most detailed, comprehensive views yet of the planet's oceans and fresh water lakes and rivers, collecting data that will be used for research and other purposes. Animation available at https://photojournal.jpl.nasa.gov/catalog/PIA26100
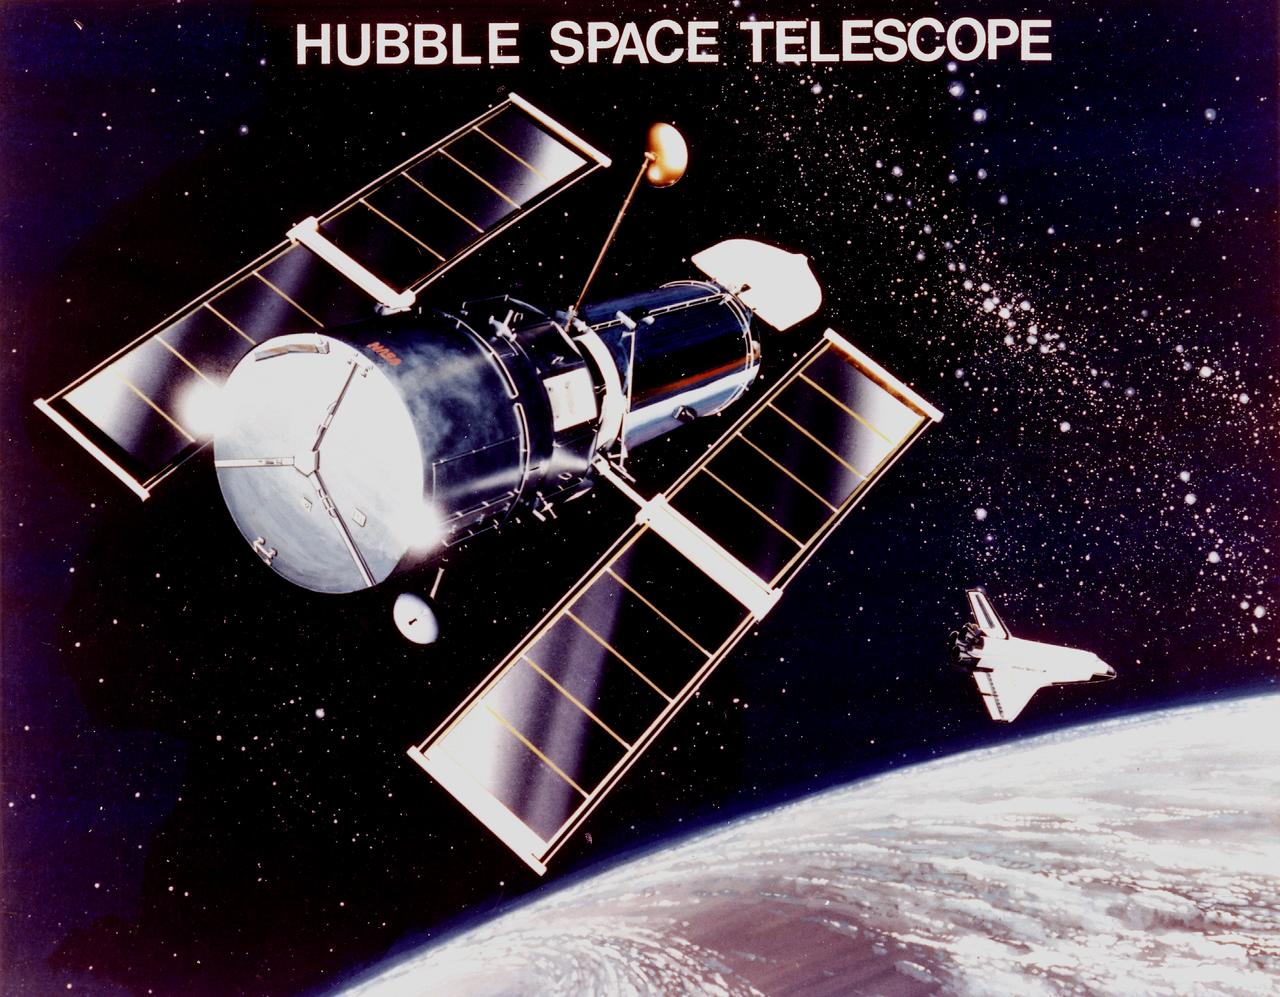
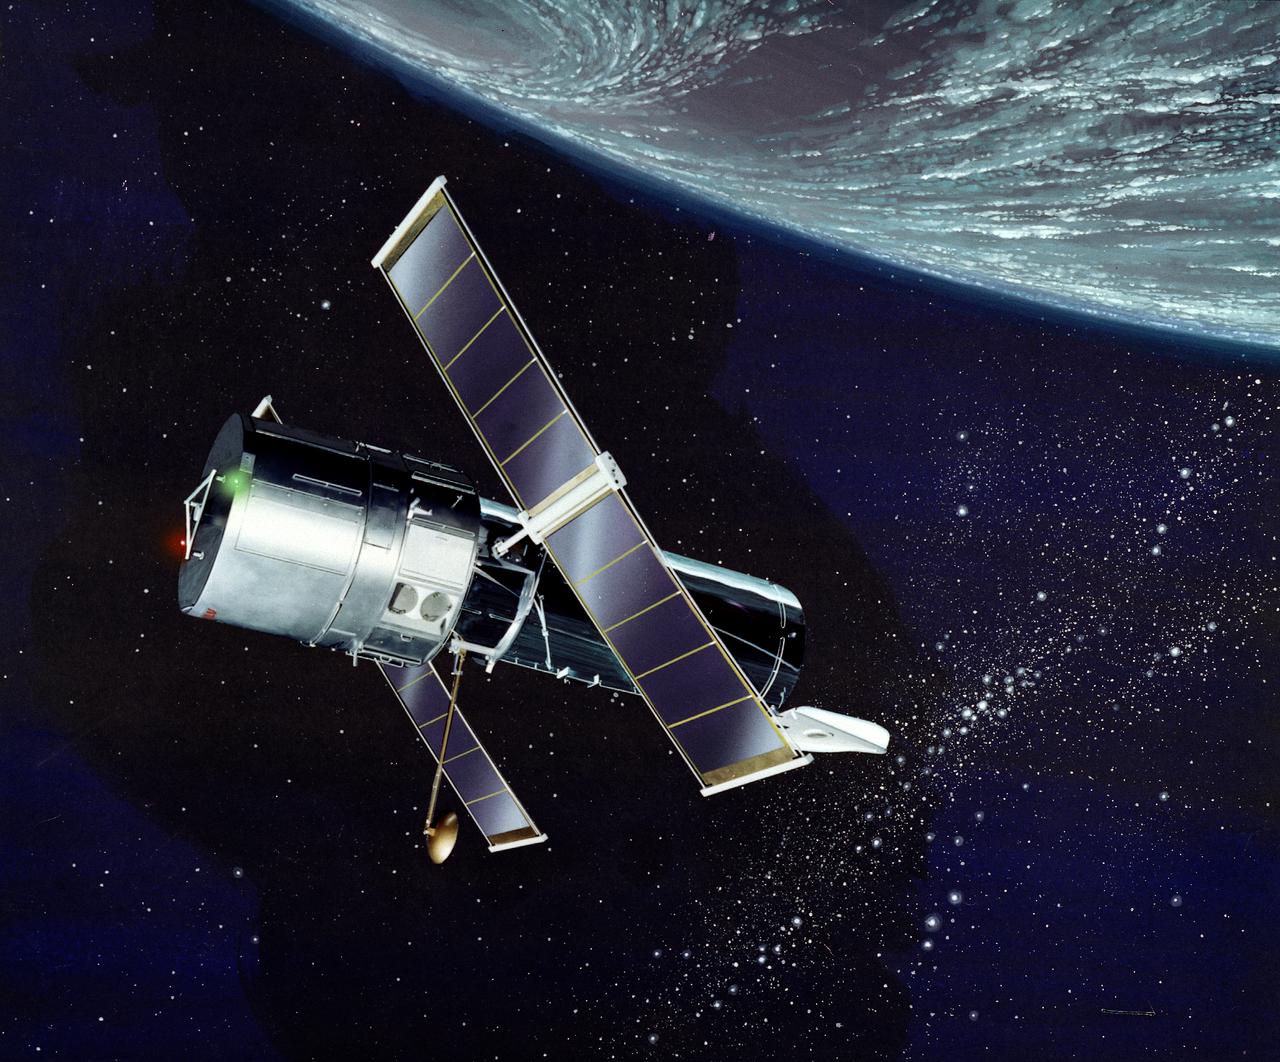
This is an artist's concept of the Hubble Space Telescope (HST). The HST is the product of a partnership between NASA, European Space Agency Contractors, and the international community of astronomers. It is named after Edwin P. Hubble, an American Astronomer who discovered the expanding nature of the universe and was the first to realize the true nature of galaxies. The purpose of the HST, the most complex and sensitive optical telescope ever made, is to study the cosmos from a low-Earth orbit. By placing the telescope in space, astronomers are able to collect data that is free of the Earth's atmosphere. The HST detects objects 25 times fainter than the dimmest objects seen from Earth and provides astronomers with an observable universe 250 times larger than is visible from ground-based telescopes, perhaps as far away as 14 billion light-years. The HST views galaxies, stars, planets, comets, possibly other solar systems, and even unusual phenomena such as quasars, with 10 times the clarity of ground-based telescopes. The major elements of the HST are the Optical Telescope Assembly (OTA), the Support System Module (SSM), and the Scientific Instruments (SI). The HST is approximately the size of a railroad car, with two cylinders joined together and wrapped in a silvery reflective heat shield blanket. Wing-like solar arrays extend horizontally from each side of these cylinders, and dish-shaped anternas extend above and below the body of the telescope. The HST was deployed from the Space Shuttle Discovery (STS-31 mission) into Earth orbit in April 1990. The Marshall Space Flight Center had responsibility for design, development, and construction of the HST. The Perkin-Elmer Corporation, in Danbury, Connecticut, developed the optical system and guidance sensors. The Lockheed Missile and Space Company of Sunnyvale, California produced the protective outer shroud and spacecraft systems, and assembled and tested the finished telescope.
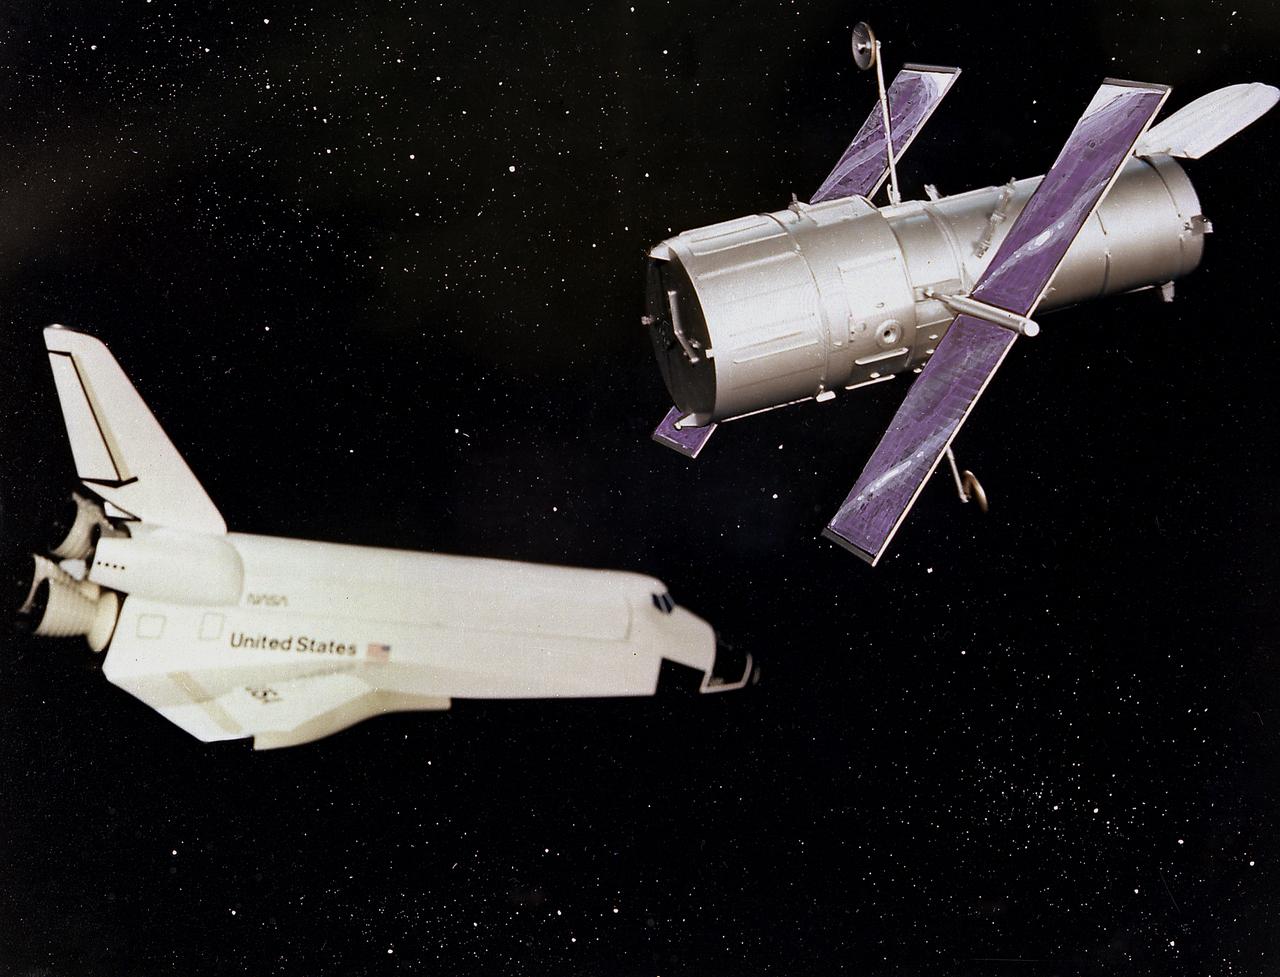
This artist's concept depicts the Hubble Space Telescope after being released into orbit, with the high gain anternas and solar arrays deployed and the aperture doors opened. The HST is the product of a partnership between NASA, European Space Agency Contractors, and the international community of astronomers. It is named after Edwin P. Hubble, an American Astronomer who discovered the expanding nature of the universe and was the first to realize the true nature of galaxies. The purpose of the HST, the most complex and sensitive optical telescope ever made, is to study the cosmos from a low-Earth orbit. By placing the telescope in space, astronomers are able to collect data that is free of the Earth's atmosphere. The HST detects objects 25 times fainter than the dimmest objects seen from Earth and provides astronomers with an observable universe 250 times larger than visible from ground-based telescopes, perhaps as far away as 14 billion light-years. The HST views galaxies, stars, planets, comets, possibly other solar systems, and even unusual phenomena such as quasars, with 10 times the clarity of ground-based telescopes. The major elements of the HST are the Optical Telescope Assembly (OTA), the Support System Module (SSM), and the Scientific Instruments (SI). The HST is 42.5-feet (13-meters) long and weighs about 25,000 pounds (11,600 kilograms). The HST was deployed from the Space Shuttle Discovery (STS-31 mission) into Earth orbit in April 1990. The Marshall Space Flight Center had responsibility for design, development, and construction of the HST. The Perkin-Elmer Corporation, in Danbury, Connecticut, developed the optical system and guidance sensors. The Lockheed Missile and Space Company of Sunnyvale, California produced the protective outer shroud and spacecraft systems, and assembled and tested the finished telescope.

The Larsen Ice Shelf in Antarctica viewed from NASA's DC-8 aircraft during the AirSAR 2004 campaign. AirSAR 2004 is a three-week expedition in Central and South America by an international team of scientists that is using an all-weather imaging tool, called the Airborne Synthetic Aperture Radar (AirSAR), located onboard NASA's DC-8 airborne laboratory. Scientists from many parts of the world are combining ground research with NASA's AirSAR technology to improve and expand on the quality of research they are able to conduct. These photos are from the DC-8 aircraft while flying an AirSAR mission over Antarctica. The Antarctic Peninsula is more similar to Alaska and Patagonia than to the rest of the Antarctic continent. It is drained by fast glaciers, receives abundant precipitation, and melts significantly in the summer months. In recent decades, the Peninsula has experienced significant atmospheric warming (about 2 degrees C since 1950), which has triggered a vast and spectacular retreat of its floating ice shelves, glacier reduction, a decrease in permanent snow cover and a lengthening of the melt season. As a result, the contribution to sea level from this region could be rapid and substantial. With an area of 120,000 km, or ten times the Patagonia ice fields, the Peninsula could contribute as much as 0.4mm/yr sea level rise, which would be the largest single contribution to sea level from anywhere in the world. This region is being studied by NASA using a DC-8 equipped with the Airborne Synthetic Aperture Radar developed by scientists from NASA’s Jet Propulsion Laboratory. AirSAR will provide a baseline model and unprecedented mapping of the region. This data will make it possible to determine whether the warming trend is slowing, continuing or accelerating. AirSAR will also provide reliable information on ice shelf thickness to measure the contribution of the glaciers to sea level.

ISS027-E-020129 (6 April 2011) --- A night time view of the Atlantic Seaboard Conurbation, United States of America, is featured in this image photographed by an Expedition 27 crew member on the International Space Station. As regional metropolitan areas expand in both physical area and population, they typically aggregate to form economically, politically, and to some extent socially linked entities known as conurbations – the term “megalopolis” has also been used. One of the largest conurbations in the world is located along the eastern coastline of the United States, and has been termed the Atlantic Seaboard Conurbation (ASC). The ASC extends over 1,000 kilometers and includes the major economic, governmental, and cultural centers of Boston, Mass.; New York, N.Y.; Philadelphia, Pa.; Baltimore, Md.; and Washington, D.C. This photograph includes every metropolitan area in the ASC except for Boston, Mass. (located off the image to the northeast of New York, N.Y.). The image was taken during “local night”, which highlights the position and extent of each metropolitan area along the eastern seaboard by their urban lighting patterns. The establishment and growth of the conurbation was facilitated by transportation networks (railroads, highways, and air travel routes) for transfer of goods, materials, and population between the metropolitan areas. Two other large metropolitan areas are visible in the image – Norfolk, Va. and Richmond, Va. at upper right – but these are not considered to be part of the ASC. In contrast to the city lights that mark metropolitan areas and smaller communities along the sea coast and interior, the Atlantic Ocean appears as a featureless dark region occupying the upper left quarter of the image.

ISS026-E-010155 (14 Dec. 2010) --- Cities at night in northern China are featured in this image photographed by an Expedition 26 crew member on the International Space Station. This striking photograph features two of China’s most populous cities—Beijing and Tianjin—both located in the northern part of the country near the Bohai Gulf. The United Nations estimated 2010 population for the Beijing metropolitan area is approximately 12 million, with the population of the Tianjin metropolitan area estimated to be over 7 million. Taken at night time, the image dramatically indicates the developed extent of both metropolitan areas. The smaller city of Langfang, located midway between Beijing and Tianjin, also is clearly visible as are several other smaller developed areas to the northeast. The dark regions surrounding the well-lit urban areas are mainly agricultural fields, with wheat and corn being the major crops. Beijing (also known as Peking) is one of the recognized ancient capital cities—and the current capital—of the People’s Republic of China. The regular grid pattern of the city is clearly visible at lower upper right; concentric rings of major roadways around the city center have been added as the metropolitan area has expanded. Tianjin is a major trade center with connection to seaports on the Bohai Gulf. The city was established following the integration of the Grand Canal of China, a major artificial waterway extending from Beijing southwards to Hangzhou over a distance of 1,176 kilometers. This image was acquired by astronauts onboard the space station when it was located approximately 630 kilometers away (ground distance) over the Yellow Sea near the western coastline of North Korea. The flattened perspective of the urban areas is a result of the viewing angle and distance from the ISS. The city light patterns are very clear, indicating that there was little cloud cover or haze in the region at the time the image was taken.
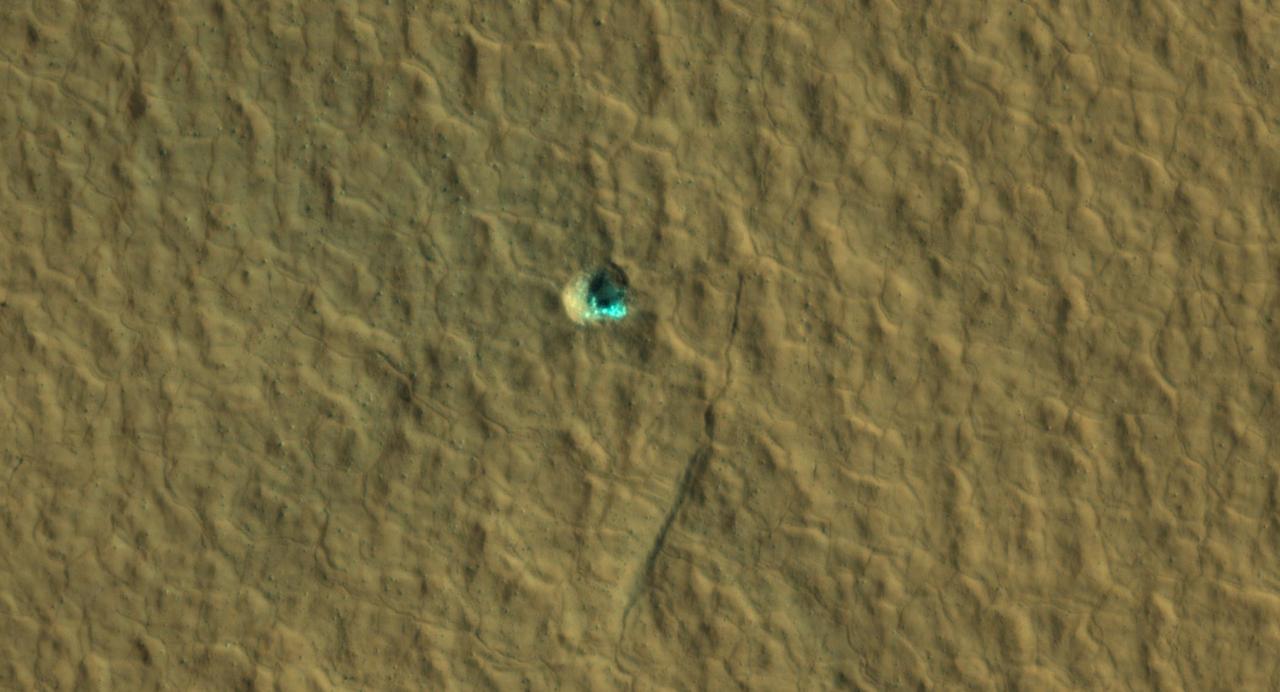
The ice-exposing impact crater at the center of this image is an example of what scientists look for when mapping places where future astronauts should land on Mars. NASA's Mars Reconnaissance Orbiter captured this view using its High-Resolution Imaging Science Experiment (HiRISE) camera on July 17, 2016. The color in this image has been enhanced for effect; water ice would not actually look this blue on Mars. The crater is estimated to be about 59 feet wide (18 meters wide). Surrounding the impact is a rough kind of surface known as "polygon terrain," which on Earth is known to form when subsurface ice expands and contracts repeatedly over time. Seeing this terrain surrounding an ice-exposing crater suggests much more ice could be found there. This impact is one of many included in a NASA-funded mapping project called Subsurface Water Ice Mapping, or SWIM. Mars has both water ice and carbon dioxide ice (dry ice); water ice would be a critical resource for the first astronauts to step foot on Mars, who can use it for drinking, rocket fuel, and other purposes. The more water ice these astronauts land next to, the less they need to bring with them. Because the Martian atmosphere is so thin – less than 1% the pressure experienced at sea level on Earth – liquid water is unstable on the Red Planet and will vaporize unless it's frozen. But water ice on the planet's surface is only stable at high latitudes that are far too cold for astronauts and robots to survive. So SWIM attempts to locate water ice preserved within the subsurface in the mid-latitudes, where landing would be feasible. Such regions are far enough toward the poles for water ice to be plentiful, but close enough to the equator to avoid the coldest temperatures seen on Mars. https://photojournal.jpl.nasa.gov/catalog/PIA26044

An AirSAR 2004 view from the DC-8 as it approaches the Larsen Ice Shelf, which is part of the Antarctic Peninsula. AirSAR 2004 is a three-week expedition in Central and South America by an international team of scientists that is using an all-weather imaging tool, called the Airborne Synthetic Aperture Radar (AirSAR), located onboard NASA's DC-8 airborne laboratory. Scientists from many parts of the world are combining ground research with NASA's AirSAR technology to improve and expand on the quality of research they are able to conduct. These photos are from the DC-8 aircraft while flying an AirSAR mission over Antarctica. The Antarctic Peninsula is more similar to Alaska and Patagonia than to the rest of the Antarctic continent. It is drained by fast glaciers, receives abundant precipitation, and melts significantly in the summer months. In recent decades, the Peninsula has experienced significant atmospheric warming (about 2 degrees C since 1950), which has triggered a vast and spectacular retreat of its floating ice shelves, glacier reduction, a decrease in permanent snow cover and a lengthening of the melt season. As a result, the contribution to sea level from this region could be rapid and substantial. With an area of 120,000 km, or ten times the Patagonia ice fields, the Peninsula could contribute as much as 0.4mm/yr sea level rise, which would be the largest single contribution to sea level from anywhere in the world. This region is being studied by NASA using a DC-8 equipped with the Airborne Synthetic Aperture Radar developed by scientists from NASA’s Jet Propulsion Laboratory. AirSAR will provide a baseline model and unprecedented mapping of the region. This data will make it possible to determine whether the warming trend is slowing, continuing or accelerating. AirSAR will also provide reliable information on ice shelf thickness to measure the contribution of the glaciers to sea level.

In the 19th century, astronomer V. M. Slipher first discovered a hat-like object that appeared to be rushing away from us at 700 miles per second. This enormous velocity offered some of the earliest clues that it was really another galaxy, and that the universe was expanding in all directions. The trained razor sharp eye of the Hubble Space Telescope (HST) easily resolves this Sombrero galaxy, Messier 104 (M104). The galaxy is 50,000 light-years across and is located 28 million light-years from Earth at the southern edge of the rich Virgo cluster of galaxies. Equivalent to 800 billion suns, Sombrero is one of the most massive objects in that group. The hallmark of Sombrero is a brilliant white, bulbous core encircled by the thick dust lanes comprising the spiral structure of the galaxy. As seen from Earth, the galaxy is tilted nearly edge-on. We view it from just six degrees north of its equatorial plane. At a relatively bright magnitude of +8, M104 is just beyond the limit of naked-eye visibility and is easily seen through small telescopes. This rich system of globular clusters are estimated to be nearly 2,000 in number which is 10 times as many as in our Milky Way galaxy. The ages of the clusters are similar to the clusters in the Milky Way, ranging from 10-13 billion years old. Embedded in the bright core of M104 is a smaller disk, which is tilted relative to the large disk. X-ray emission suggests that there is material falling into the compact core, where a 1-billion-solar-mass black hole resides. The Marshall Space Flight Center (MSFC) had responsibility for design, development, and construction of the HST.

The Larsen Ice Shelf in Antarctica viewed from NASA's DC-8 aircraft during the AirSAR 2004 campaign. AirSAR 2004 is a three-week expedition in Central and South America by an international team of scientists that is using an all-weather imaging tool, called the Airborne Synthetic Aperture Radar (AirSAR), located onboard NASA's DC-8 airborne laboratory. Scientists from many parts of the world are combining ground research with NASA's AirSAR technology to improve and expand on the quality of research they are able to conduct. These photos are from the DC-8 aircraft while flying an AirSAR mission over Antarctica. The Antarctic Peninsula is more similar to Alaska and Patagonia than to the rest of the Antarctic continent. It is drained by fast glaciers, receives abundant precipitation, and melts significantly in the summer months. In recent decades, the Peninsula has experienced significant atmospheric warming (about 2 degrees C since 1950), which has triggered a vast and spectacular retreat of its floating ice shelves, glacier reduction, a decrease in permanent snow cover and a lengthening of the melt season. As a result, the contribution to sea level from this region could be rapid and substantial. With an area of 120,000 km, or ten times the Patagonia ice fields, the Peninsula could contribute as much as 0.4mm/yr sea level rise, which would be the largest single contribution to sea level from anywhere in the world. This region is being studied by NASA using a DC-8 equipped with an Airborne Synthetic Aperture Radar (AirSAR) developed by scientists from NASA’s Jet Propulsion Laboratory. AirSAR will provide a baseline model and unprecedented mapping of the region. This data will make it possible to determine whether the warming trend is slowing, continuing or accelerating. AirSAR will also provide reliable information on ice shelf thickness to measure the contribution of the glaciers to sea level.
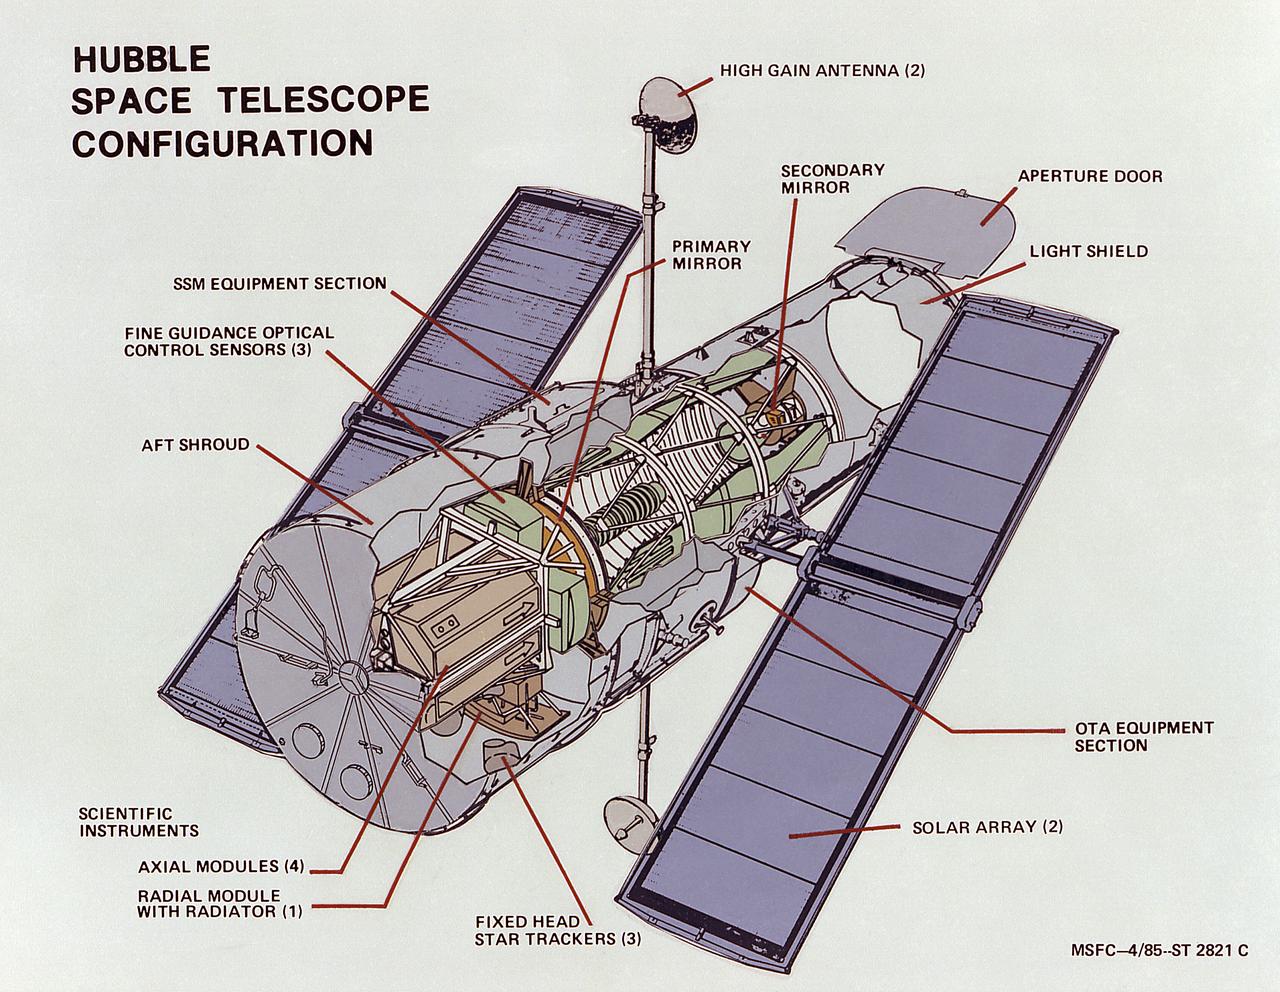
This image illustrates the overall Hubble Space Telescope (HST) configuration. The HST is the product of a partnership between NASA, European Space Agency Contractors, and the international community of astronomers. It is named after Edwin P. Hubble, an American Astronomer who discovered the expanding nature of the universe and was the first to realize the true nature of galaxies. The purpose of the HST, the most complex and sensitive optical telescope ever made, is to study the cosmos from a low-Earth orbit. By placing the telescope in space, astronomers are able to collect data that is free of the Earth's atmosphere. The HST detects objects 25 times fainter than the dimmest objects seen from Earth and provides astronomers with an observable universe 250 times larger than visible from ground-based telescopes, perhaps as far away as 14 billion light-years. The HST views galaxies, stars, planets, comets, possibly other solar systems, and even unusual phenomena such as quasars, with 10 times the clarity of ground-based telescopes. The major elements of the HST are the Optical Telescope Assembly (OTA), the Support System Module (SSM), and the Scientific Instruments (SI). The HST is approximately the size of a railroad car, with two cylinders joined together and wrapped in a silvery reflective heat shield blanket. Wing-like solar arrays extend horizontally from each side of these cylinders, and dish-shaped anternas extend above and below the body of the telescope. The HST was deployed from the Space Shuttle Discovery (STS-31 mission) into Earth orbit in April 1990. The Marshall Space Flight Center had responsibility for design, development, and construction of the HST. The Perkin-Elmer Corporation, in Danbury, Connecticut, developed the optical system and guidance sensors. The Lockheed Missile and Space Company of Sunnyvale, California produced the protective outer shroud and spacecraft systems, and assembled and tested the finished telescope.

The Larsen Ice Shelf in Antarctica viewed from NASA's DC-8 aircraft during the AirSAR 2004 campaign. AirSAR 2004 is a three-week expedition in Central and South America by an international team of scientists that is using an all-weather imaging tool, called the Airborne Synthetic Aperture Radar (AirSAR), located onboard NASA's DC-8 airborne laboratory. Scientists from many parts of the world are combining ground research with NASA's AirSAR technology to improve and expand on the quality of research they are able to conduct. These photos are from the DC-8 aircraft while flying an AirSAR mission over Antarctica. The Antarctic Peninsula is more similar to Alaska and Patagonia than to the rest of the Antarctic continent. It is drained by fast glaciers, receives abundant precipitation, and melts significantly in the summer months. In recent decades, the Peninsula has experienced significant atmospheric warming (about 2 degrees C since 1950), which has triggered a vast and spectacular retreat of its floating ice shelves, glacier reduction, a decrease in permanent snow cover and a lengthening of the melt season. As a result, the contribution to sea level from this region could be rapid and substantial. With an area of 120,000 km, or ten times the Patagonia ice fields, the Peninsula could contribute as much as 0.4mm/yr sea level rise, which would be the largest single contribution to sea level from anywhere in the world. This region is being studied by NASA using a DC-8 equipped with the Airborne Synthetic Aperture Radar developed by scientists from NASA’s Jet Propulsion Laboratory. AirSAR will provide a baseline model and unprecedented mapping of the region. This data will make it possible to determine whether the warming trend is slowing, continuing or accelerating. AirSAR will also provide reliable information on ice shelf thickness to measure the contribution of the glaciers to sea level.
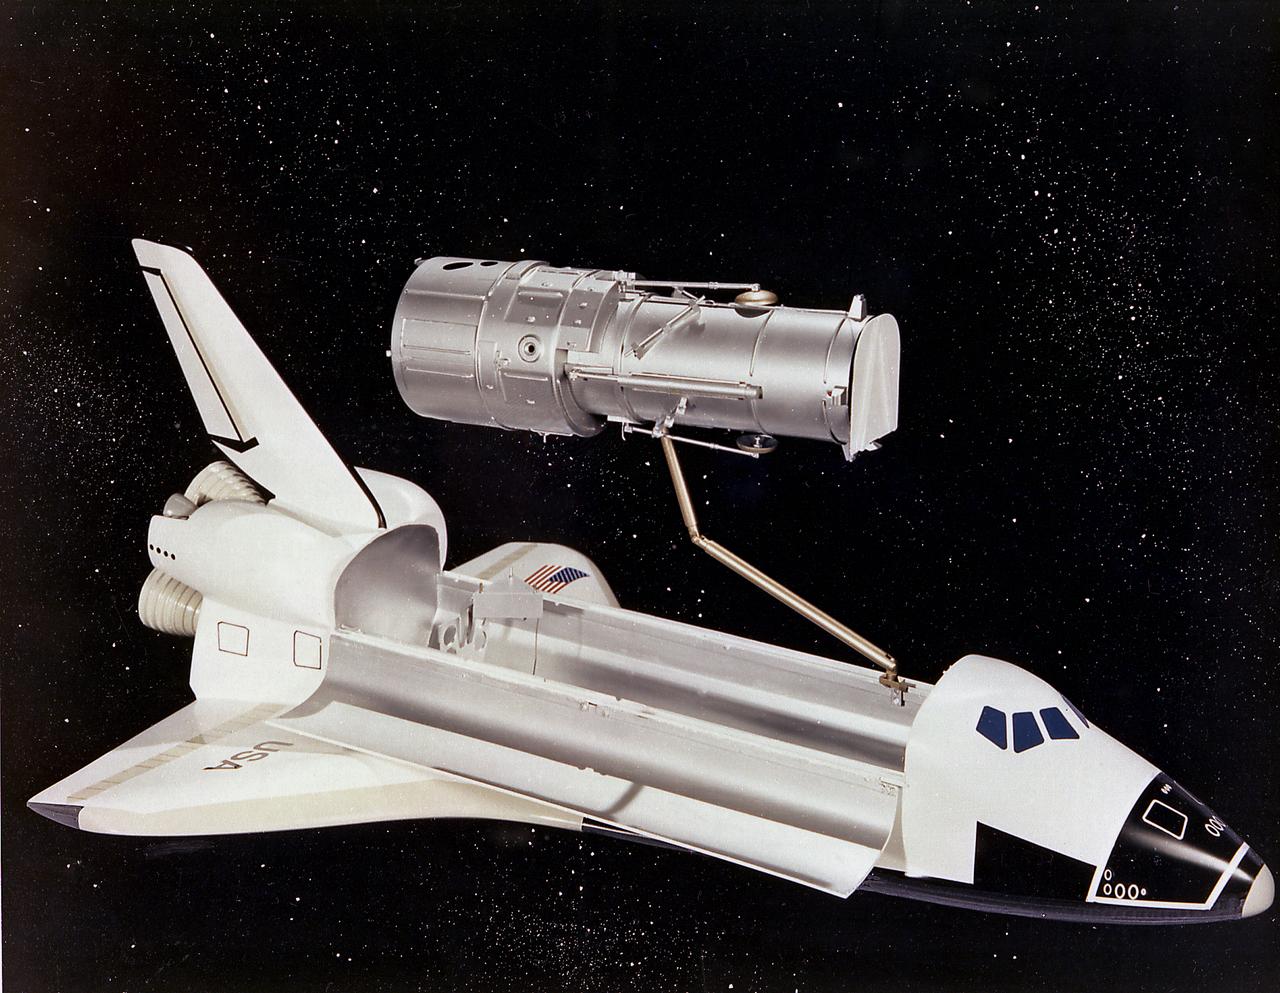
This artist's concept depicts the Hubble Space Telescope (HST) being positioned for release from the Space Shuttle orbiter by the Remote Manipulator System (RMS). The HST is the product of a partnership between NASA, European Space Agency Contractors, and the international community of astronomers. It is named after Edwin P. Hubble, an American Astronomer who discovered the expanding nature of the universe and was the first to realize the true nature of galaxies. The purpose of the HST, the most complex and sensitive optical telescope ever made, is to study the cosmos from a low-Earth orbit. By placing the telescope in space, astronomers are able to collect data that is free of the Earth's atmosphere. The HST detects objects 25 times fainter than the dimmest objects seen from Earth and provides astronomers with an observable universe 250 times larger than visible from ground-based telescopes, perhaps as far away as 14 billion light-years. The HST views galaxies, stars, planets, comets, possibly other solar systems, and even unusual phenomena such as quasars, with 10 times the clarity of ground-based telescopes. The major elements of the HST are the Optical Telescope Assembly (OTA), the Support System Module (SSM), and the Scientific Instruments (SI). The HST is 42.5-feet (13- meters) long and weighs about 25,000 pounds (11,600 kilograms). The HST was deployed from the Space Shuttle Discovery (STS-31 mission) into Earth orbit in April 1990. The Marshall Space Flight Center had responsibility for design, development, and construction of the HST. The Perkin-Elmer Corporation, in Danbury, Cornecticut, developed the optical system and guidance sensors. The Lockheed Missile and Space Company of Sunnyvale, California produced the protective outer shroud and spacecraft systems, and assembled and tested the finished telescope.
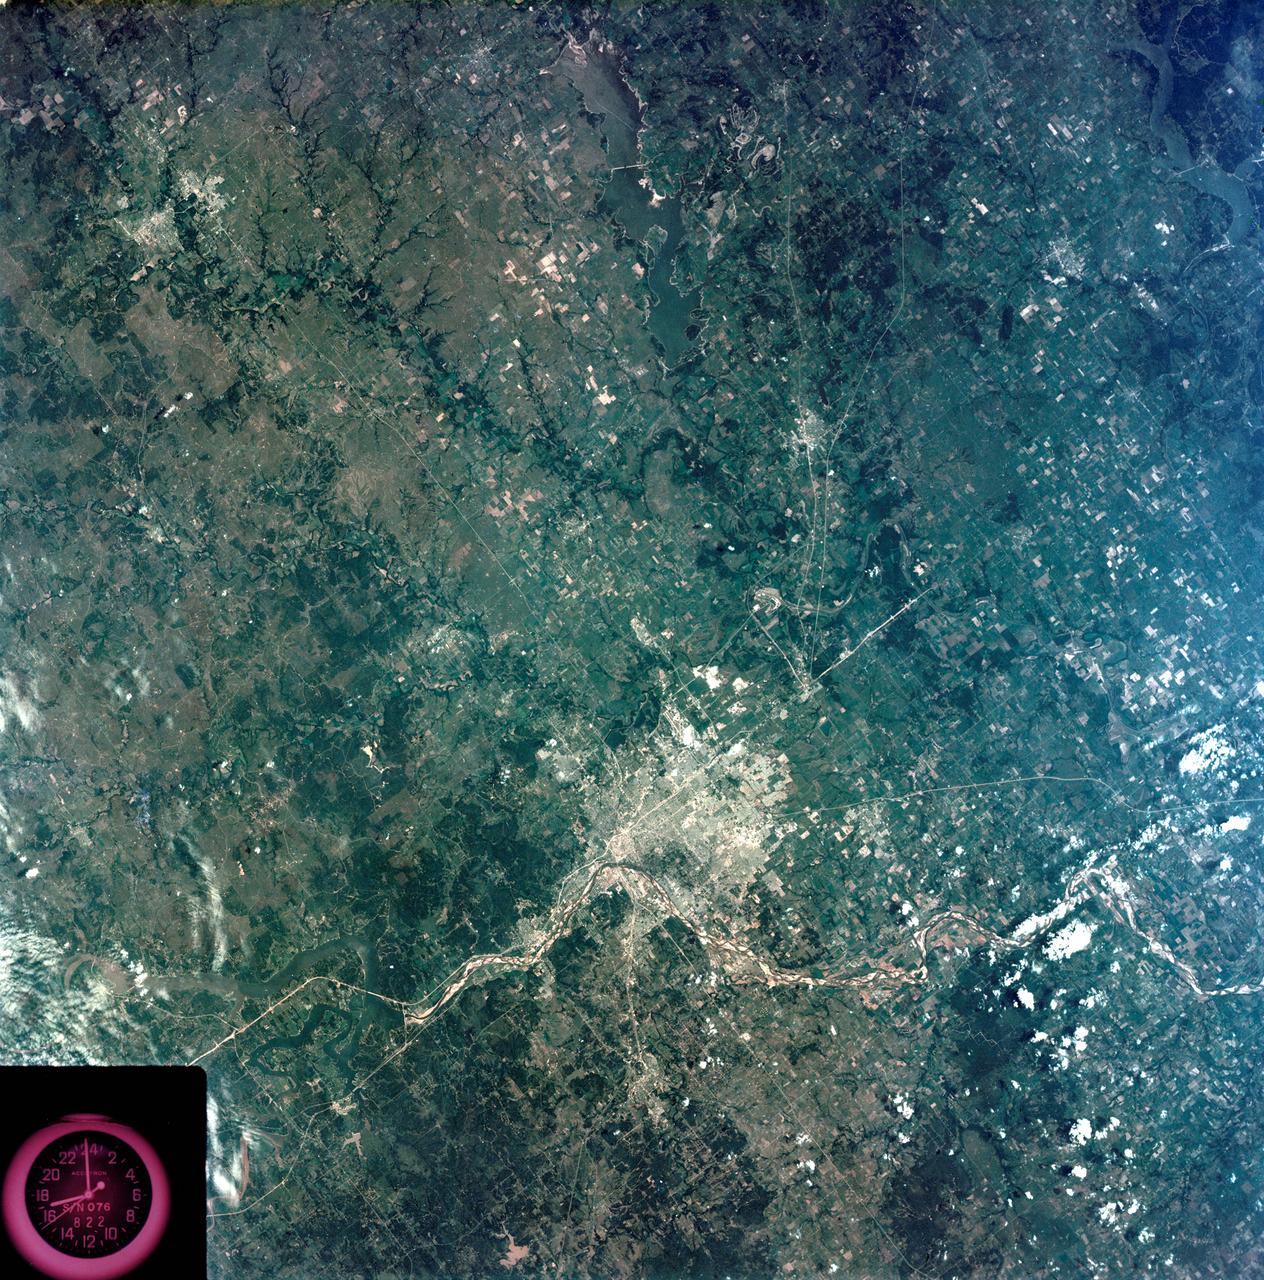
S73-35080 (July-September 1973) --- A vertical view of northeast Oklahoma and the metropolitan Tulsa area is seen in this Skylab 3 Earth Resources Experiments Package S190-B (five-inch Earth terrain camera) photograph taken from the Skylab space station in Earth orbit. THE PICTURE SHOULD BE HELD WITH THE CLOCK ON THE LEFT AND THE LAKE IN THE CORNER ON THE RIGHT. THE LONG STRETCH OF HIGHWAY (U.S. 75) RUNS STRAIGHT NORTH FROM TULSA. Tulsa, a rapidly expanding city in the heart of the mid-continent oil field, has a population of approximately 330,000. The Arkansas River meanders across the southern (lower) portion of the photograph passing through Tulsa as it flows southeastward. Oologah Reservoir, the long body of water, is located northeast of Tulsa. Lake Hudson is the body of water in the right corner of the picture. Keystone Reservoir is to the west and upstream from Tulsa. Westward from Tulsa U.S. 64 makes a 45 degree bend as it turns northwest to cross the Keystone Reservoir. The thin white line over the Oologah Reservoir is a highway bridge. Bartlesville is on U.S. 75 near the north (top) corner of the picture. The Tulsa International Airport is immediately northeast of downtown Tulsa. Several smaller airfields are visible in the surrounding area. The toll roads and other major highways are clearly visible in the picture. Claremore is northeast of Tulsa on U.S. 66 with the Will Rogers Turnpike passing nearby. Sapulpa is southwest of Tulsa on the Turner Turnpike which leads toward Oklahoma City. The detailed information contained in this photograph can be extracted by direct observation and applied to updating land use and cultural maps of Tulsa and to numerous surrounding satellite cities. All EREP photography is available to the public through the Department of Interior?s Earth Resources Observations Systems Data Center, Sioux Falls, South Dakota, 57198. (Alternate number SL3-83-206) Photo credit: NASA
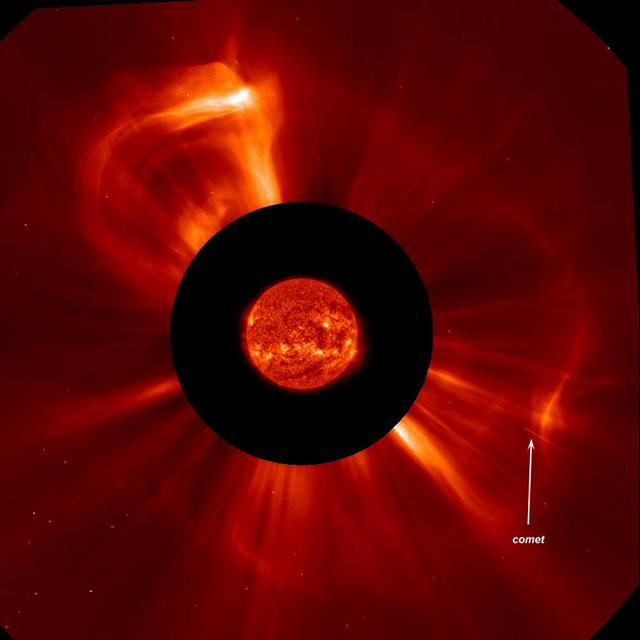
A small comet was streaking towards the Sun when the Sun blew out a "halo" coronal mass ejection (CME) Aug. 19-20, 2013). The CME originated from the far side of the Sun and did not have any interaction with the comet. The comet, only perhaps 30 meters across, was not seen after it went out of view, likely disintegrated by the heat and radiation from the Sun. We call this a "full halo" CME since the front edge of the CME is expanding in all directions around the Sun like a halo. The images were taken by SOHO's coronagraphs in which a disk (red) blocks the Sun and some of the area around it so we can see faint structures beyond that. Here we superimposed the Sun from NASA's SDO. The movie covers about five hours of activity and can be seen here: <a href="http://www.flickr.com/photos/gsfc/9601034896/">www.flickr.com/photos/gsfc/9601034896/</a> Credit: NASA/Goddard/SOHO <b><a href="http://www.nasa.gov/audience/formedia/features/MP_Photo_Guidelines.html" rel="nofollow">NASA image use policy.</a></b> <b><a href="http://www.nasa.gov/centers/goddard/home/index.html" rel="nofollow">NASA Goddard Space Flight Center</a></b> enables NASA’s mission through four scientific endeavors: Earth Science, Heliophysics, Solar System Exploration, and Astrophysics. Goddard plays a leading role in NASA’s accomplishments by contributing compelling scientific knowledge to advance the Agency’s mission. <b>Follow us on <a href="http://twitter.com/NASA_GoddardPix" rel="nofollow">Twitter</a></b> <b>Like us on <a href="http://www.facebook.com/pages/Greenbelt-MD/NASA-Goddard/395013845897?ref=tsd" rel="nofollow">Facebook</a></b> <b>Find us on <a href="http://instagram.com/nasagoddard?vm=grid" rel="nofollow">Instagram</a></b>

The Larsen Ice Shelf in Antarctica viewed from NASA's DC-8 aircraft during the AirSAR 2004 campaign. AirSAR 2004 is a three-week expedition in Central and South America by an international team of scientists that is using an all-weather imaging tool, called the Airborne Synthetic Aperture Radar (AirSAR), located onboard NASA's DC-8 airborne laboratory. Scientists from many parts of the world are combining ground research with NASA's AirSAR technology to improve and expand on the quality of research they are able to conduct. These photos are from the DC-8 aircraft while flying an AirSAR mission over Antarctica. The Antarctic Peninsula is more similar to Alaska and Patagonia than to the rest of the Antarctic continent. It is drained by fast glaciers, receives abundant precipitation, and melts significantly in the summer months. In recent decades, the Peninsula has experienced significant atmospheric warming (about 2 degrees C since 1950), which has triggered a vast and spectacular retreat of its floating ice shelves, glacier reduction, a decrease in permanent snow cover and a lengthening of the melt season. As a result, the contribution to sea level from this region could be rapid and substantial. With an area of 120,000 km, or ten times the Patagonia ice fields, the Peninsula could contribute as much as 0.4mm/yr sea level rise, which would be the largest single contribution to sea level from anywhere in the world. This region is being studied by NASA using a DC-8 equipped with the Airborne Synthetic Aperture Radar developed by scientists from NASA’s Jet Propulsion Laboratory. AirSAR will provide a baseline model and unprecedented mapping of the region. This data will make it possible to determine whether the warming trend is slowing, continuing or accelerating. AirSAR will also provide reliable information on ice shelf thickness to measure the contribution of the glaciers to sea level.

The Larsen Ice Shelf in Antarctica viewed from NASA's DC-8 aircraft during the AirSAR 2004 campaign. AirSAR 2004 is a three-week expedition in Central and South America by an international team of scientists that is using an all-weather imaging tool, called the Airborne Synthetic Aperture Radar (AirSAR), located onboard NASA's DC-8 airborne laboratory. Scientists from many parts of the world are combining ground research with NASA's AirSAR technology to improve and expand on the quality of research they are able to conduct. These photos are from the DC-8 aircraft while flying an AirSAR mission over Antarctica. The Antarctic Peninsula is more similar to Alaska and Patagonia than to the rest of the Antarctic continent. It is drained by fast glaciers, receives abundant precipitation, and melts significantly in the summer months. In recent decades, the Peninsula has experienced significant atmospheric warming (about 2 degrees C since 1950), which has triggered a vast and spectacular retreat of its floating ice shelves, glacier reduction, a decrease in permanent snow cover and a lengthening of the melt season. As a result, the contribution to sea level from this region could be rapid and substantial. With an area of 120,000 km, or ten times the Patagonia ice fields, the Peninsula could contribute as much as 0.4mm/yr sea level rise, which would be the largest single contribution to sea level from anywhere in the world. This region is being studied by NASA using a DC-8 equipped with the Airborne Synthetic Aperture Radar developed by scientists from NASA’s Jet Propulsion Laboratory. AirSAR will provide a baseline model and unprecedented mapping of the region. This data will make it possible to determine whether the warming trend is slowing, continuing or accelerating. AirSAR will also provide reliable information on ice shelf thickness to measure the contribution of the glaciers to sea level.

For the past eight years, Operation IceBridge, a NASA mission that conducts aerial surveys of polar ice, has produced unprecedented three-dimensional views of Arctic and Antarctic ice sheets, providing scientists with valuable data on how polar ice is changing in a warming world. Now, for the first time, the campaign will expand its reach to explore the Arctic’s Eurasian Basin through two research flights based out of Svalbard, a Norwegian archipelago in the northern Atlantic Ocean. More: <a href="http://go.nasa.gov/2ngAxX2" rel="nofollow">go.nasa.gov/2ngAxX2</a> Caption: Ellesmere Island mountain tops bathed in light as the sun began to peak over the horizon during Operation IceBridge’s first flight of its 2017 Arctic campaign, on March 9, 2017. Credits: NASA/Nathan Kurtz <b><a href="http://www.nasa.gov/audience/formedia/features/MP_Photo_Guidelines.html" rel="nofollow">NASA image use policy.</a></b> <b><a href="http://www.nasa.gov/centers/goddard/home/index.html" rel="nofollow">NASA Goddard Space Flight Center</a></b> enables NASA’s mission through four scientific endeavors: Earth Science, Heliophysics, Solar System Exploration, and Astrophysics. Goddard plays a leading role in NASA’s accomplishments by contributing compelling scientific knowledge to advance the Agency’s mission. <b>Follow us on <a href="http://twitter.com/NASAGoddardPix" rel="nofollow">Twitter</a></b> <b>Like us on <a href="http://www.facebook.com/pages/Greenbelt-MD/NASA-Goddard/395013845897?ref=tsd" rel="nofollow">Facebook</a></b> <b>Find us on <a href="http://instagrid.me/nasagoddard/?vm=grid" rel="nofollow">Instagram</a></b>
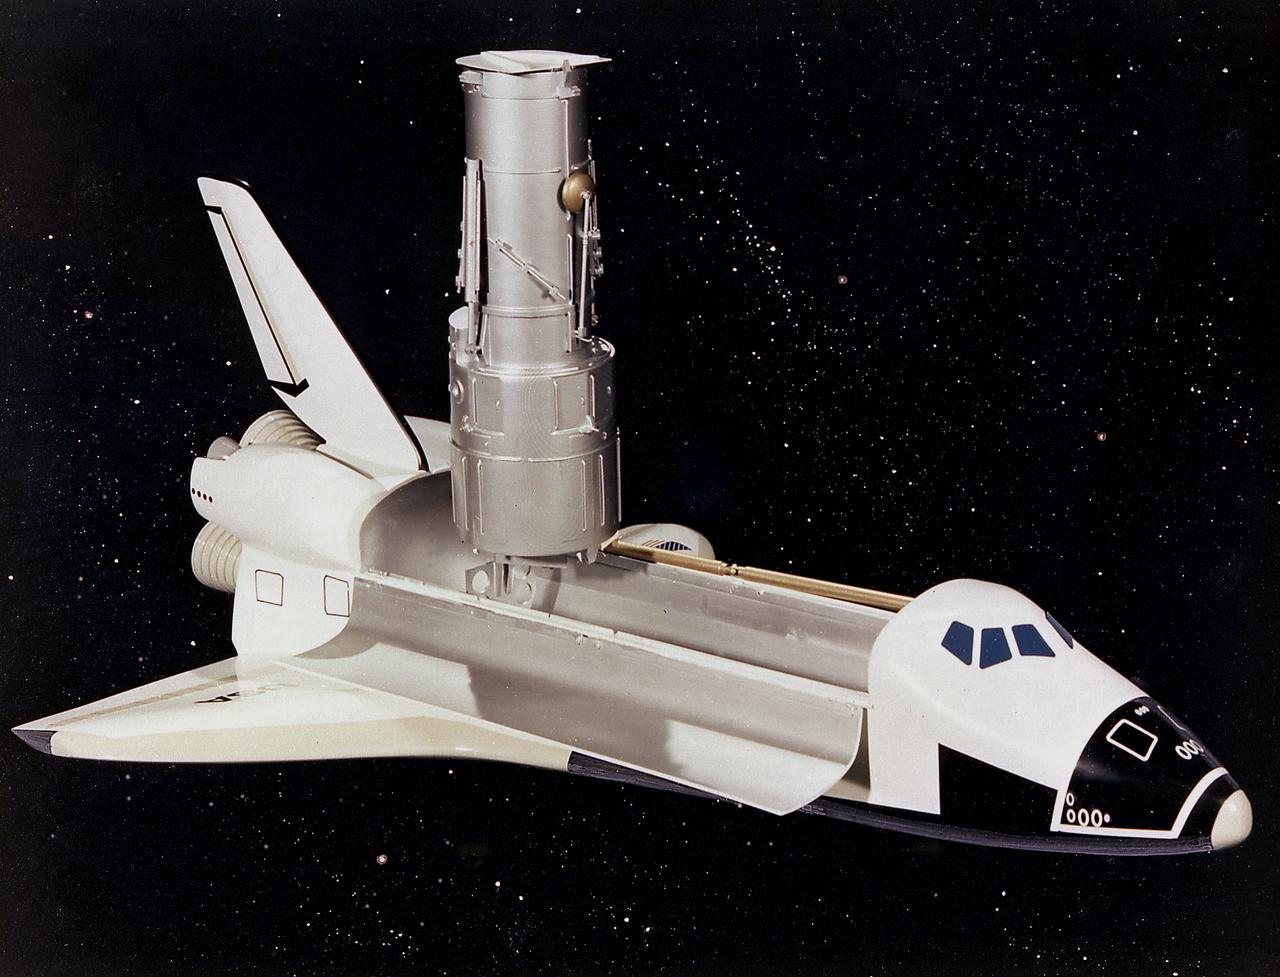
This artist's concept depicts the Hubble Space Telescope (HST) being raised to a vertical position in the cargo bay of the Space Shuttle orbiter. The HST is the product of a partnership between NASA, European Space Agency Contractors, and the international community of astronomers. It is named after Edwin P. Hubble, an American Astronomer who discovered the expanding nature of the universe and was the first to realize the true nature of galaxies. The purpose of the HST, the most complex and sensitive optical telescope ever made, is to study the cosmos from a low-Earth orbit. By placing the telescope in space, astronomers are able to collect data that is free of the Earth's atmosphere. The HST detects objects 25 times fainter than the dimmest objects seen from Earth and provides astronomers with an observable universe 250 times larger than visible from ground-based telescopes, perhaps as far away as 14 billion light-years. The HST views galaxies, stars, planets, comets, possibly other solar systems, and even unusual phenomena such as quasars, with 10 times the clarity of ground-based telescopes. The major elements of the HST are the Optical Telescope Assembly (OTA), the Support System Module (SSM), and the Scientific Instruments (SI). The HST is 42.5-feet (13-meters) long and weighs about 25,000 pounds (11,600 kilograms). The HST was deployed from the Space Shuttle Discovery (STS-31 mission) into Earth orbit in April 1990. The Marshall Space Flight Center had responsibility for design, development, and construction of the HST. The Perkin-Elmer Corporation, in Danbury, Cornecticut, developed the optical system and guidance sensors. The Lockheed Missile and Space Company of Sunnyvale, California produced the protective outer shroud and spacecraft systems, and assembled and tested the finished telescope.
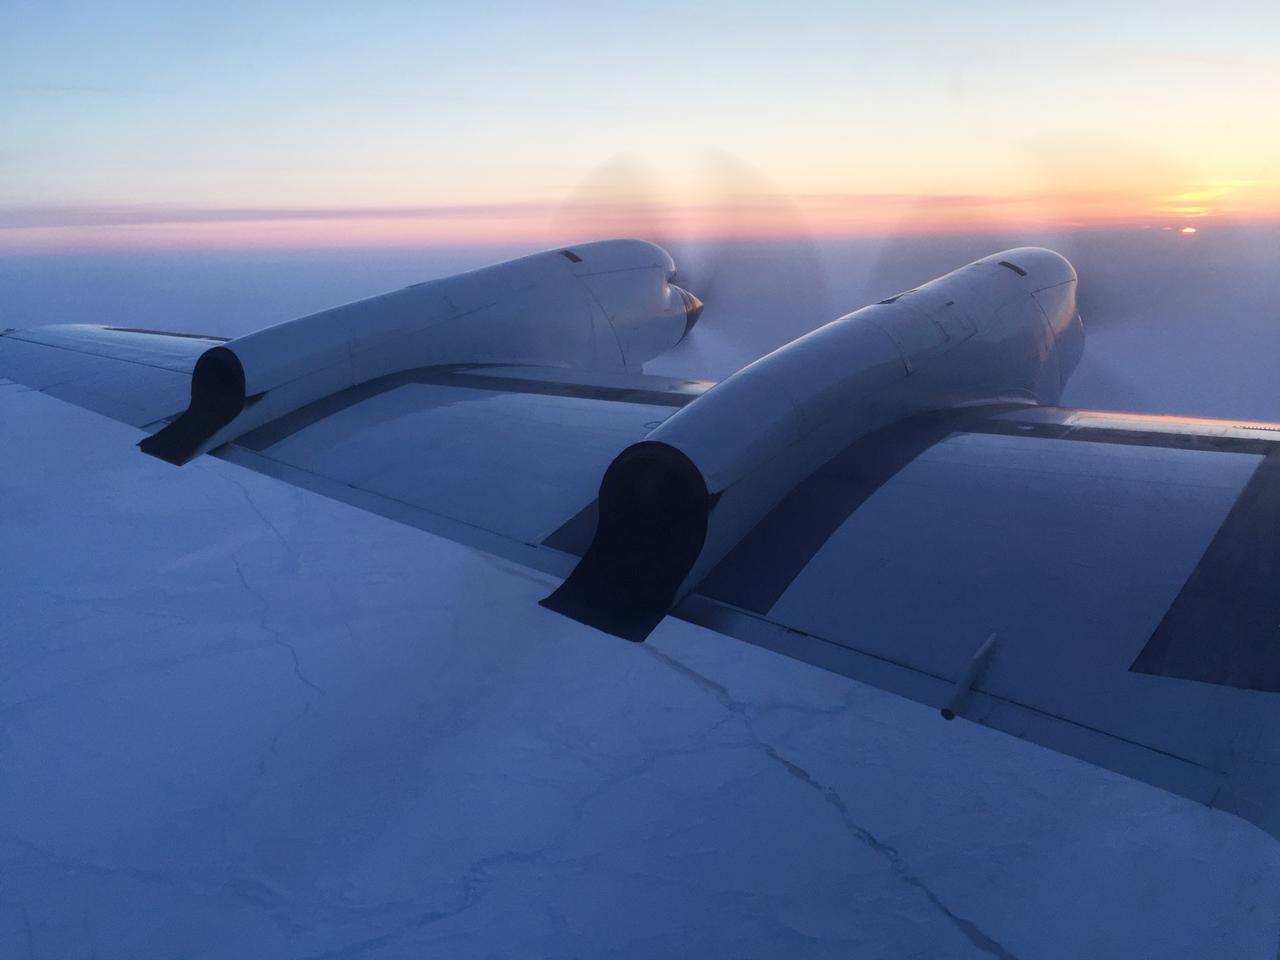
For the past eight years, Operation IceBridge, a NASA mission that conducts aerial surveys of polar ice, has produced unprecedented three-dimensional views of Arctic and Antarctic ice sheets, providing scientists with valuable data on how polar ice is changing in a warming world. Now, for the first time, the campaign will expand its reach to explore the Arctic’s Eurasian Basin through two research flights based out of Svalbard, a Norwegian archipelago in the northern Atlantic Ocean. More: <a href="http://go.nasa.gov/2ngAxX2" rel="nofollow">go.nasa.gov/2ngAxX2</a> Credits: NASA/Nathan Kurtz <b><a href="http://www.nasa.gov/audience/formedia/features/MP_Photo_Guidelines.html" rel="nofollow">NASA image use policy.</a></b> <b><a href="http://www.nasa.gov/centers/goddard/home/index.html" rel="nofollow">NASA Goddard Space Flight Center</a></b> enables NASA’s mission through four scientific endeavors: Earth Science, Heliophysics, Solar System Exploration, and Astrophysics. Goddard plays a leading role in NASA’s accomplishments by contributing compelling scientific knowledge to advance the Agency’s mission. <b>Follow us on <a href="http://twitter.com/NASAGoddardPix" rel="nofollow">Twitter</a></b> <b>Like us on <a href="http://www.facebook.com/pages/Greenbelt-MD/NASA-Goddard/395013845897?ref=tsd" rel="nofollow">Facebook</a></b> <b>Find us on <a href="http://instagrid.me/nasagoddard/?vm=grid" rel="nofollow">Instagram</a></b>
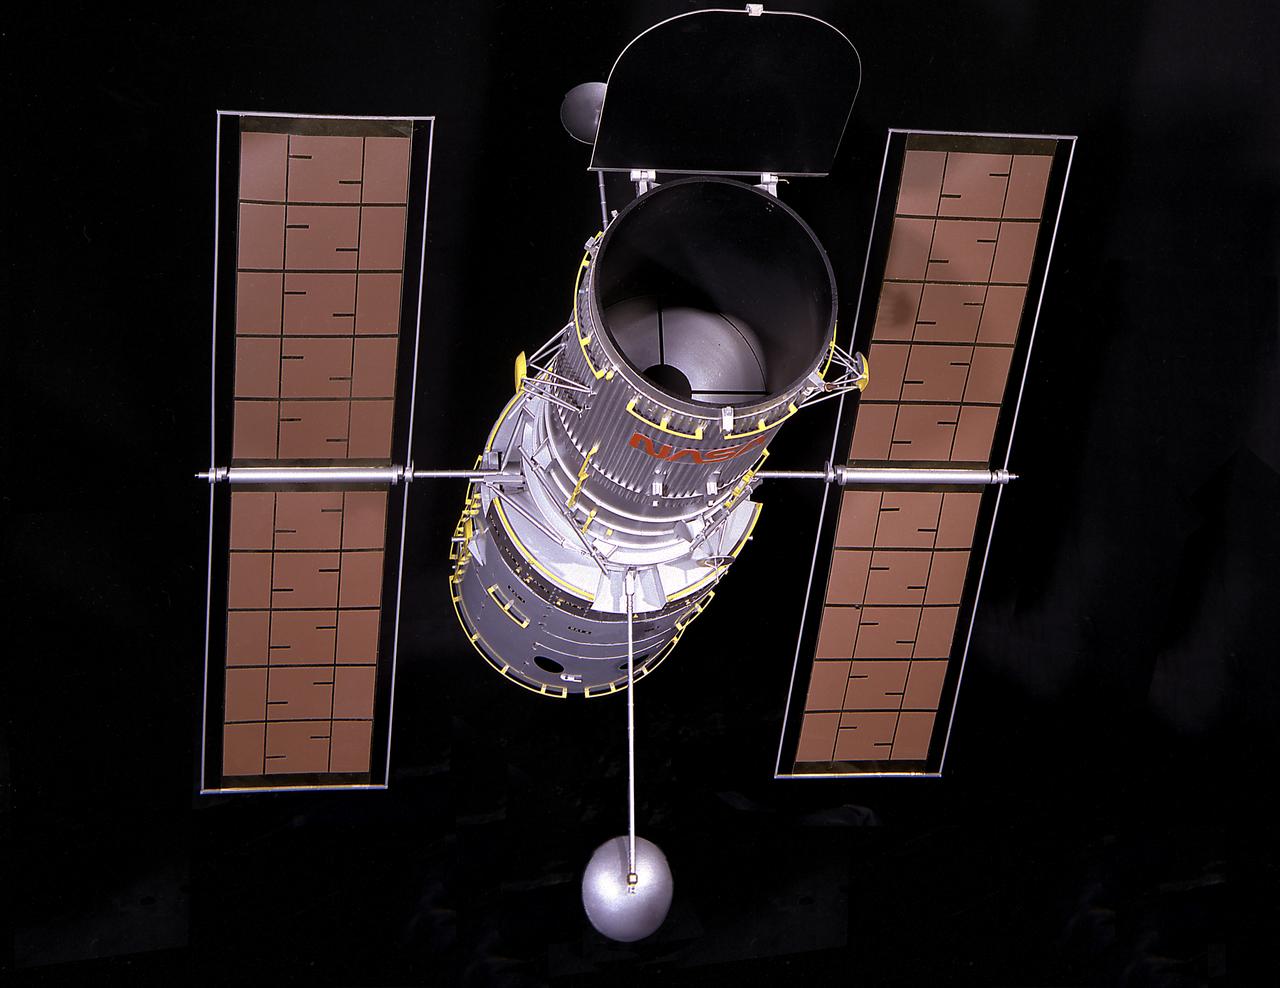
This is a photograph of a 1/15 scale model of the Hubble Space Telescope (HST). The HST is the product of a partnership between NASA, European Space Agency Contractors, and the international community of astronomers. It is named after Edwin P. Hubble, an American Astronomer who discovered the expanding nature of the universe and was the first to realize the true nature of galaxies. The purpose of the HST, the most complex and sensitive optical telescope ever made, is to study the cosmos from a low-Earth orbit. By placing the telescope in space, astronomers are able to collect data that is free of the Earth's atmosphere. The HST detects objects 25 times fainter than the dimmest objects seen from Earth and provides astronomers with an observable universe 250 times larger than visible from ground-based telescopes, perhaps as far away as 14 billion light-years. The HST views galaxies, stars, planets, comets, possibly other solar systems, and even unusual phenomena such as quasars, with 10 times the clarity of ground-based telescopes. The major elements of the HST are the Optical Telescope Assembly (OTA), the Support System Module (SSM), and the Scientific Instruments (SI). The HST is 42.5-feet (13- meters) long and weighs about 25,000 pounds (11,600 kilograms). The HST was deployed from the Space Shuttle Discovery (STS-31 mission) into Earth orbit in April 1990. The Marshall Space Flight Center had responsibility for design, development, and construction of the HST. The Perkin-Elmer Corporation, in Danbury, Cornecticut, developed the optical system and guidance sensors. The Lockheed Missile and Space Company of Sunnyvale, California produced the protective outer shroud and spacecraft systems, and assembled and tested the finished telescope.
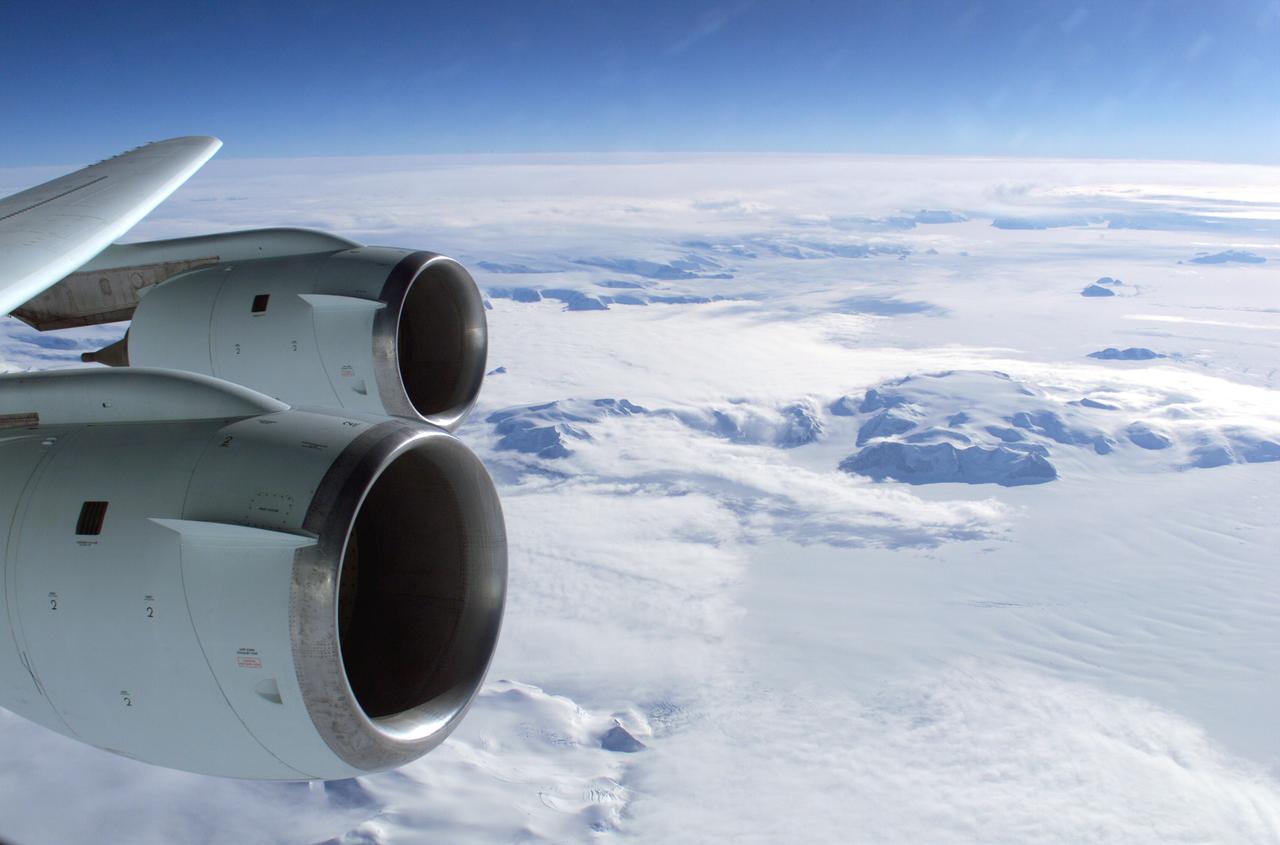
The Larsen Ice Shelf in Antarctica viewed from NASA's DC-8 aircraft during the AirSAR 2004 campaign. AirSAR 2004 is a three-week expedition in Central and South America by an international team of scientists that is using an all-weather imaging tool, called the Airborne Synthetic Aperture Radar (AirSAR), located onboard NASA's DC-8 airborne laboratory. Scientists from many parts of the world are combining ground research with NASA's AirSAR technology to improve and expand on the quality of research they are able to conduct. These photos are from the DC-8 aircraft while flying an AirSAR mission over Antarctica. The Antarctic Peninsula is more similar to Alaska and Patagonia than to the rest of the Antarctic continent. It is drained by fast glaciers, receives abundant precipitation, and melts significantly in the summer months. In recent decades, the Peninsula has experienced significant atmospheric warming (about 2 degrees C since 1950), which has triggered a vast and spectacular retreat of its floating ice shelves, glacier reduction, a decrease in permanent snow cover and a lengthening of the melt season. As a result, the contribution to sea level from this region could be rapid and substantial. With an area of 120,000 km, or ten times the Patagonia ice fields, the Peninsula could contribute as much as 0.4mm/yr sea level rise, which would be the largest single contribution to sea level from anywhere in the world. This region is being studied by NASA using a DC-8 equipped with the Airborne Synthetic Aperture Radar developed by scientists from NASA’s Jet Propulsion Laboratory. AirSAR will provide a baseline model and unprecedented mapping of the region. This data will make it possible to determine whether the warming trend is slowing, continuing or accelerating. AirSAR will also provide reliable information on ice shelf thickness to measure the contribution of the glaciers to sea level.

ISS016-E-027426 (5 Feb. 2008) --- Cumulonimbus Cloud over Africa is featured in this image photographed by an Expedition 16 crewmember on the International Space Station. Deemed by many meteorologists as one of the most impressive of cloud formations, cumulonimbus (from the Latin for "puffy" and "dark") clouds form due to vigorous convection of warm and moist unstable air. Surface air warmed by the Sun-heated ground surface rises, and if sufficient atmospheric moisture is present, water droplets will condense as the air mass encounters cooler air at higher altitudes. The air mass itself also expands and cools as it rises due to decreasing atmospheric pressure, a process known as adiabatic cooling. This type of convection is common in tropical latitudes year-round and during the summer season at higher latitudes. As water in the rising air mass condenses and changes from a gaseous to a liquid state, it releases energy to its surroundings, further heating the surrounding air and leading to more convection and rising of the cloud mass to higher altitudes. This leads to the characteristic vertical "towers" associated with cumulonimbus clouds, an excellent example of which is visible in this image (right). If enough moisture is present to condense and continue heating the cloud mass through several convective cycles, a tower can rise to altitudes of approximately 10 kilometers at high latitudes to 20 kilometers in the tropics -- before encountering a region of the atmosphere known as the tropopause. The tropopause is characterized by a strong temperature inversion where the atmosphere is dryer and no longer cools with altitude. This halts further vertical motion of the cloud mass, and causes flattening and spreading of the cloud tops into an anvil-shaped cloud as illustrated by this oblique photograph. The view direction is at an angle from the vertical, rather than straight "down" towards the Earth's surface. The image, photographed while the International Space Station was passing over western Africa near the Senegal-Mali border, shows a fully-formed anvil cloud with numerous smaller cumulonimbus towers rising near it. The high energetics of these storm systems typically make them hazardous due to associated heavy precipitation, lightning, high wind speeds and possible tornadoes.

The Larsen Ice Shelf in Antarctica viewed from NASA's DC-8 aircraft during the AirSAR 2004 campaign. AirSAR 2004 is a three-week expedition in Central and South America by an international team of scientists that is using an all-weather imaging tool, called the Airborne Synthetic Aperture Radar (AirSAR), located onboard NASA's DC-8 airborne laboratory. Scientists from many parts of the world are combining ground research with NASA's AirSAR technology to improve and expand on the quality of research they are able to conduct. These photos are from the DC-8 aircraft while flying an AirSAR mission over Antarctica. The Antarctic Peninsula is more similar to Alaska and Patagonia than to the rest of the Antarctic continent. It is drained by fast glaciers, receives abundant precipitation, and melts significantly in the summer months. In recent decades, the Peninsula has experienced significant atmospheric warming (about 2 degrees C since 1950), which has triggered a vast and spectacular retreat of its floating ice shelves, glacier reduction, a decrease in permanent snow cover and a lengthening of the melt season. As a result, the contribution to sea level from this region could be rapid and substantial. With an area of 120,000 km, or ten times the Patagonia ice fields, the Peninsula could contribute as much as 0.4mm/yr sea level rise, which would be the largest single contribution to sea level from anywhere in the world. This region is being studied by NASA using a DC-8 equipped with the Airborne Synthetic Aperture Radar developed by scientists from NASA’s Jet Propulsion Laboratory. AirSAR will provide a baseline model and unprecedented mapping of the region. This data will make it possible to determine whether the warming trend is slowing, continuing or accelerating. AirSAR will also provide reliable information on ice shelf thickness to measure the contribution of the glaciers to sea level.

The Larsen Ice Shelf in Antarctica viewed from NASA's DC-8 aircraft during the AirSAR 2004 campaign. AirSAR 2004 is a three-week expedition in Central and South America by an international team of scientists that is using an all-weather imaging tool, called the Airborne Synthetic Aperture Radar (AirSAR), located onboard NASA's DC-8 airborne laboratory. Scientists from many parts of the world are combining ground research with NASA's AirSAR technology to improve and expand on the quality of research they are able to conduct. These photos are from the DC-8 aircraft while flying an AirSAR mission over Antarctica. The Antarctic Peninsula is more similar to Alaska and Patagonia than to the rest of the Antarctic continent. It is drained by fast glaciers, receives abundant precipitation, and melts significantly in the summer months. In recent decades, the Peninsula has experienced significant atmospheric warming (about 2 degrees C since 1950), which has triggered a vast and spectacular retreat of its floating ice shelves, glacier reduction, a decrease in permanent snow cover and a lengthening of the melt season. As a result, the contribution to sea level from this region could be rapid and substantial. With an area of 120,000 km, or ten times the Patagonia ice fields, the Peninsula could contribute as much as 0.4mm/yr sea level rise, which would be the largest single contribution to sea level from anywhere in the world. This region is being studied by NASA using a DC-8 equipped with the Airborne Synthetic Aperture Radar developed by scientists from NASA’s Jet Propulsion Laboratory. AirSAR will provide a baseline model and unprecedented mapping of the region. This data will make it possible to determine whether the warming trend is slowing, continuing or accelerating. AirSAR will also provide reliable information on ice shelf thickness to measure the contribution of the glaciers to sea level.
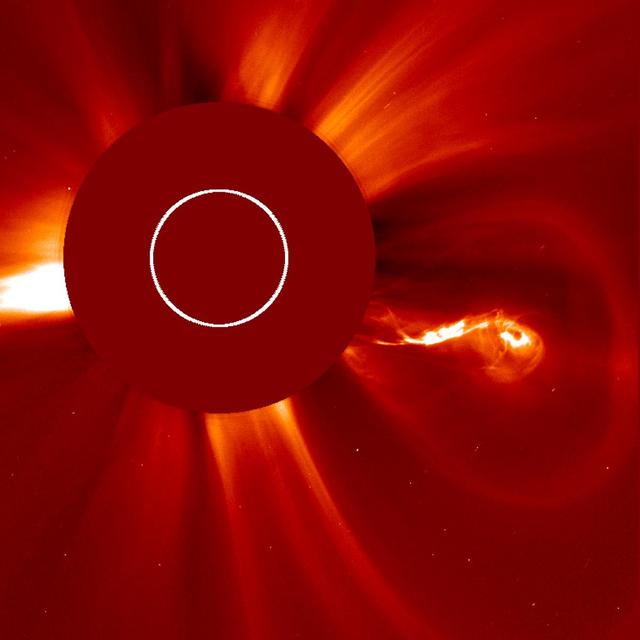
The Sun blasted out five coronal mass ejections (CMEs) over about two days (Feb. 26-28, 2013) and each one had quite a different shape and structure, seen here in a video <a href="http://bit.ly/Za8Aso" rel="nofollow">bit.ly/Za8Aso</a>. The most interesting one (seen above) blew out to the right with a bright, elongated center, likely part of a solar filament, that maintained its curly-Q shape as it expanded out of view. The images were taken by SOHO LASCO C2 coronagraph. The Sun is represented by the white circle and the red disk blocks out the Sun and part of the corona. Credit: NASA/Goddard/SOHO <b><a href="http://www.nasa.gov/audience/formedia/features/MP_Photo_Guidelines.html" rel="nofollow">NASA image use policy.</a></b> <b><a href="http://www.nasa.gov/centers/goddard/home/index.html" rel="nofollow">NASA Goddard Space Flight Center</a></b> enables NASA’s mission through four scientific endeavors: Earth Science, Heliophysics, Solar System Exploration, and Astrophysics. Goddard plays a leading role in NASA’s accomplishments by contributing compelling scientific knowledge to advance the Agency’s mission. <b>Follow us on <a href="http://twitter.com/NASA_GoddardPix" rel="nofollow">Twitter</a></b> <b>Like us on <a href="http://www.facebook.com/pages/Greenbelt-MD/NASA-Goddard/395013845897?ref=tsd" rel="nofollow">Facebook</a></b> <b>Find us on <a href="http://instagram.com/nasagoddard?vm=grid" rel="nofollow">Instagram</a></b>
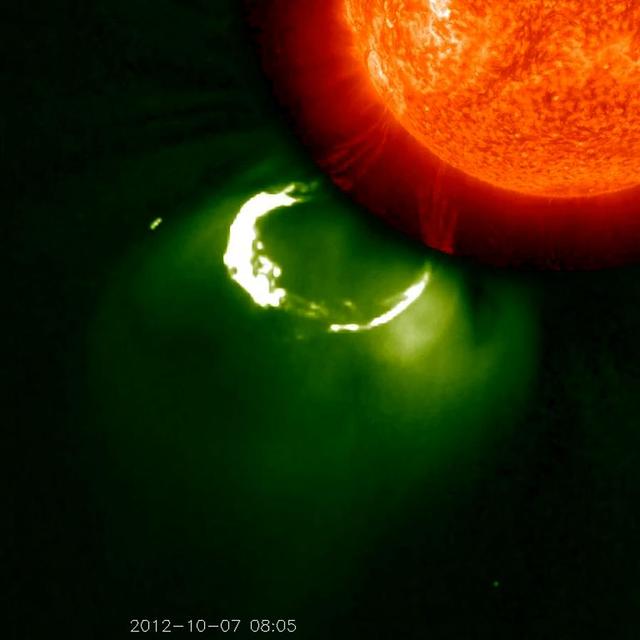
This CME image from Oct. 7, 2012, captured by two instruments on STEREO, shows the eruption from its base out into space. The base of the CME near the sun is seen in extreme ultraviolet light emitted directly from the solar material; the growing loop is seen in visible light. Credit: NASA/STEREO CME WEEK: What To See in CME Images Two main types of explosions occur on the sun: solar flares and coronal mass ejections. Unlike the energy and x-rays produced in a solar flare – which can reach Earth at the speed of light in eight minutes – coronal mass ejections are giant, expanding clouds of solar material that take one to three days to reach Earth. Once at Earth, these ejections, also called CMEs, can impact satellites in space or interfere with radio communications. During CME WEEK from Sept. 22 to 26, 2014, we explore different aspects of these giant eruptions that surge out from the star we live with. When a coronal mass ejection blasts off the sun, scientists rely on instruments called coronagraphs to track their progress. Coronagraphs block out the bright light of the sun, so that the much fainter material in the solar atmosphere -- including CMEs -- can be seen in the surrounding space. CMEs appear in these images as expanding shells of material from the sun's atmosphere -- sometimes a core of colder, solar material (called a filament) from near the sun's surface moves in the center. But mapping out such three-dimensional components from a two-dimensional image isn't easy. Watch the slideshow to find out how scientists interpret what they see in CME pictures. The images in the slideshow are from the three sets of coronagraphs NASA currently has in space. One is on the joint European Space Agency and NASA Solar and Heliospheric Observatory, or SOHO. SOHO launched in 1995, and sits between Earth and the sun about a million miles away from Earth. The other two coronagraphs are on the two spacecraft of the NASA Solar Terrestrial Relations Observatory, or STEREO, mission, which launched in 2006. The two STEREO spacecraft are both currently viewing the far side of the sun. Together these instruments help scientists create a three-dimensional model of any CME as its journey unfolds through interplanetary space. Such information can show why a given characteristic of a CME close to the sun might lead to a given effect near Earth, or any other planet in the solar system...<b><a href="http://www.nasa.gov/audience/formedia/features/MP_Photo_Guidelines.html" rel="nofollow">NASA image use policy.</a></b> <b><a href="http://www.nasa.gov/centers/goddard/home/index.html" rel="nofollow">NASA Goddard Space Flight Center</a></b> enables NASA’s mission through four scientific endeavors: Earth Science, Heliophysics, Solar System Exploration, and Astrophysics. Goddard plays a leading role in NASA’s accomplishments by contributing compelling scientific knowledge to advance the Agency’s mission. <b>Follow us on <a href="http://twitter.com/NASAGoddardPix" rel="nofollow">Twitter</a></b> <b>Like us on <a href="http://www.facebook.com/pages/Greenbelt-MD/NASA-Goddard/395013845897?ref=tsd" rel="nofollow">Facebook</a></b> <b>Find us on <a href="http://instagram.com/nasagoddard?vm=grid" rel="nofollow">Instagram</a></b>

Peering deep into the core of the Crab Nebula, this close-up image reveals the beating heart of one of the most historic and intensively studied remnants of a supernova, an exploding star. The inner region sends out clock-like pulses of radiation and tsunamis of charged particles embedded in magnetic fields. The neutron star at the very center of the Crab Nebula has about the same mass as the sun but compressed into an incredibly dense sphere that is only a few miles across. Spinning 30 times a second, the neutron star shoots out detectable beams of energy that make it look like it's pulsating. The NASA Hubble Space Telescope snapshot is centered on the region around the neutron star (the rightmost of the two bright stars near the center of this image) and the expanding, tattered, filamentary debris surrounding it. Hubble's sharp view captures the intricate details of glowing gas, shown in red, that forms a swirling medley of cavities and filaments. Inside this shell is a ghostly blue glow that is radiation given off by electrons spiraling at nearly the speed of light in the powerful magnetic field around the crushed stellar core. The neutron star is a showcase for extreme physical processes and unimaginable cosmic violence. Bright wisps are moving outward from the neutron star at half the speed of light to form an expanding ring. It is thought that these wisps originate from a shock wave that turns the high-speed wind from the neutron star into extremely energetic particles. When this "heartbeat" radiation signature was first discovered in 1968, astronomers realized they had discovered a new type of astronomical object. Now astronomers know it's the archetype of a class of supernova remnants called pulsars - or rapidly spinning neutron stars. These interstellar "lighthouse beacons" are invaluable for doing observational experiments on a variety of astronomical phenomena, including measuring gravity waves. Observations of the Crab supernova were recorded by Chinese astronomers in 1054 A.D. The nebula, bright enough to be visible in amateur telescopes, is located 6,500 light-years away in the constellation Taurus. Credits: NASA and ESA, Acknowledgment: J. Hester (ASU) and M. Weisskopf (NASA/MSFC) <b><a href="http://www.nasa.gov/audience/formedia/features/MP_Photo_Guidelines.html" rel="nofollow">NASA image use policy.</a></b> <b><a href="http://www.nasa.gov/centers/goddard/home/index.html" rel="nofollow">NASA Goddard Space Flight Center</a></b> enables NASA’s mission through four scientific endeavors: Earth Science, Heliophysics, Solar System Exploration, and Astrophysics. Goddard plays a leading role in NASA’s accomplishments by contributing compelling scientific knowledge to advance the Agency’s mission. <b>Follow us on <a href="http://twitter.com/NASAGoddardPix" rel="nofollow">Twitter</a></b> <b>Like us on <a href="http://www.facebook.com/pages/Greenbelt-MD/NASA-Goddard/395013845897?ref=tsd" rel="nofollow">Facebook</a></b> <b>Find us on <a href="http://instagrid.me/nasagoddard/?vm=grid" rel="nofollow">Instagram</a></b>

STEREO witnessed the March 5, 2013, CME from the side of the sun – Earth is far to the left of this picture. While the SOHO images show a halo CME, STEREO shows the CME clearly moving away from Earth. Credit: NASA/STEREO --- CME WEEK: What To See in CME Images Two main types of explosions occur on the sun: solar flares and coronal mass ejections. Unlike the energy and x-rays produced in a solar flare – which can reach Earth at the speed of light in eight minutes – coronal mass ejections are giant, expanding clouds of solar material that take one to three days to reach Earth. Once at Earth, these ejections, also called CMEs, can impact satellites in space or interfere with radio communications. During CME WEEK from Sept. 22 to 26, 2014, we explore different aspects of these giant eruptions that surge out from the star we live with. When a coronal mass ejection blasts off the sun, scientists rely on instruments called coronagraphs to track their progress. Coronagraphs block out the bright light of the sun, so that the much fainter material in the solar atmosphere -- including CMEs -- can be seen in the surrounding space. CMEs appear in these images as expanding shells of material from the sun's atmosphere -- sometimes a core of colder, solar material (called a filament) from near the sun's surface moves in the center. But mapping out such three-dimensional components from a two-dimensional image isn't easy. Watch the slideshow to find out how scientists interpret what they see in CME pictures. The images in the slideshow are from the three sets of coronagraphs NASA currently has in space. One is on the joint European Space Agency and NASA Solar and Heliospheric Observatory, or SOHO. SOHO launched in 1995, and sits between Earth and the sun about a million miles away from Earth. The other two coronagraphs are on the two spacecraft of the NASA Solar Terrestrial Relations Observatory, or STEREO, mission, which launched in 2006. The two STEREO spacecraft are both currently viewing the far side of the sun. Together these instruments help scientists create a three-dimensional model of any CME as its journey unfolds through interplanetary space. Such information can show why a given characteristic of a CME close to the sun might lead to a given effect near Earth, or any other planet in the solar system. <b><a href="http://www.nasa.gov/audience/formedia/features/MP_Photo_Guidelines.html" rel="nofollow">NASA image use policy.</a></b> <b><a href="http://www.nasa.gov/centers/goddard/home/index.html" rel="nofollow">NASA Goddard Space Flight Center</a></b> enables NASA’s mission through four scientific endeavors: Earth Science, Heliophysics, Solar System Exploration, and Astrophysics. Goddard plays a leading role in NASA’s accomplishments by contributing compelling scientific knowledge to advance the Agency’s mission. <b>Follow us on <a href="http://twitter.com/NASAGoddardPix" rel="nofollow">Twitter</a></b> <b>Like us on <a href="http://www.facebook.com/pages/Greenbelt-MD/NASA-Goddard/395013845897?ref=tsd" rel="nofollow">Facebook</a></b> <b>Find us on <a href="http://instagram.com/nasagoddard?vm=grid" rel="nofollow">Instagram</a></b>
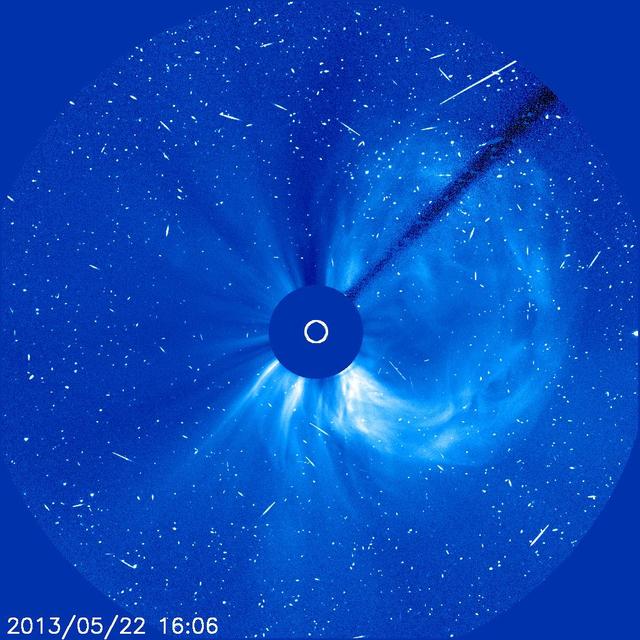
A solar flare associated with the coronal mass ejection seen in this image generated a flurry of fast-moving solar protons. As each one hits the CCD camera on SOHO, it produces a brief snow-like speckle in the image. Credit: NASA/SOHO CME WEEK: What To See in CME Images Two main types of explosions occur on the sun: solar flares and coronal mass ejections. Unlike the energy and x-rays produced in a solar flare – which can reach Earth at the speed of light in eight minutes – coronal mass ejections are giant, expanding clouds of solar material that take one to three days to reach Earth. Once at Earth, these ejections, also called CMEs, can impact satellites in space or interfere with radio communications. During CME WEEK from Sept. 22 to 26, 2014, we explore different aspects of these giant eruptions that surge out from the star we live with. When a coronal mass ejection blasts off the sun, scientists rely on instruments called coronagraphs to track their progress. Coronagraphs block out the bright light of the sun, so that the much fainter material in the solar atmosphere -- including CMEs -- can be seen in the surrounding space. CMEs appear in these images as expanding shells of material from the sun's atmosphere -- sometimes a core of colder, solar material (called a filament) from near the sun's surface moves in the center. But mapping out such three-dimensional components from a two-dimensional image isn't easy. Watch the slideshow to find out how scientists interpret what they see in CME pictures. The images in the slideshow are from the three sets of coronagraphs NASA currently has in space. One is on the joint European Space Agency and NASA Solar and Heliospheric Observatory, or SOHO. SOHO launched in 1995, and sits between Earth and the sun about a million miles away from Earth. The other two coronagraphs are on the two spacecraft of the NASA Solar Terrestrial Relations Observatory, or STEREO, mission, which launched in 2006. The two STEREO spacecraft are both currently viewing the far side of the sun. Together these instruments help scientists create a three-dimensional model of any CME as its journey unfolds through interplanetary space. Such information can show why a given characteristic of a CME close to the sun might lead to a given effect near Earth, or any other planet in the solar system...<b><a href="http://www.nasa.gov/audience/formedia/features/MP_Photo_Guidelines.html" rel="nofollow">NASA image use policy.</a></b> <b><a href="http://www.nasa.gov/centers/goddard/home/index.html" rel="nofollow">NASA Goddard Space Flight Center</a></b> enables NASA’s mission through four scientific endeavors: Earth Science, Heliophysics, Solar System Exploration, and Astrophysics. Goddard plays a leading role in NASA’s accomplishments by contributing compelling scientific knowledge to advance the Agency’s mission. <b>Follow us on <a href="http://twitter.com/NASAGoddardPix" rel="nofollow">Twitter</a></b> <b>Like us on <a href="http://www.facebook.com/pages/Greenbelt-MD/NASA-Goddard/395013845897?ref=tsd" rel="nofollow">Facebook</a></b> <b>Find us on <a href="http://instagram.com/nasagoddard?vm=grid" rel="nofollow">Instagram</a></b>
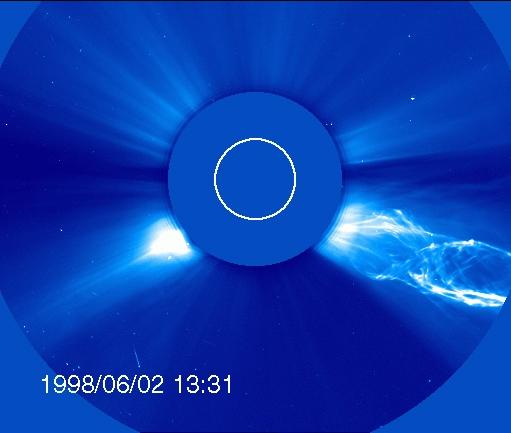
OHO captured this image of a CME from the side – but the structure looks much different from the classic light bulb CME. The filament of material bursting off the sun has a helical magnetic structure, which is unraveling like a piece of yarn during the eruption. Credit: ESA/NASA/SOHO..---..CME WEEK: What To See in CME Images Two main types of explosions occur on the sun: solar flares and coronal mass ejections. Unlike the energy and x-rays produced in a solar flare – which can reach Earth at the speed of light in eight minutes – coronal mass ejections are giant, expanding clouds of solar material that take one to three days to reach Earth. Once at Earth, these ejections, also called CMEs, can impact satellites in space or interfere with radio communications. During CME WEEK from Sept. 22 to 26, 2014, we explore different aspects of these giant eruptions that surge out from the star we live with. When a coronal mass ejection blasts off the sun, scientists rely on instruments called coronagraphs to track their progress. Coronagraphs block out the bright light of the sun, so that the much fainter material in the solar atmosphere -- including CMEs -- can be seen in the surrounding space. CMEs appear in these images as expanding shells of material from the sun's atmosphere -- sometimes a core of colder, solar material (called a filament) from near the sun's surface moves in the center. But mapping out such three-dimensional components from a two-dimensional image isn't easy. Watch the slideshow to find out how scientists interpret what they see in CME pictures. The images in the slideshow are from the three sets of coronagraphs NASA currently has in space. One is on the joint European Space Agency and NASA Solar and Heliospheric Observatory, or SOHO. SOHO launched in 1995, and sits between Earth and the sun about a million miles away from Earth. The other two coronagraphs are on the two spacecraft of the NASA Solar Terrestrial Relations Observatory, or STEREO, mission, which launched in 2006. The two STEREO spacecraft are both currently viewing the far side of the sun. Together these instruments help scientists create a three-dimensional model of any CME as its journey unfolds through interplanetary space. Such information can show why a given characteristic of a CME close to the sun might lead to a given effect near Earth, or any other planet in the solar system...<b><a href="http://www.nasa.gov/audience/formedia/features/MP_Photo_Guidelines.html" rel="nofollow">NASA image use policy.</a></b> <b><a href="http://www.nasa.gov/centers/goddard/home/index.html" rel="nofollow">NASA Goddard Space Flight Center</a></b> enables NASA’s mission through four scientific endeavors: Earth Science, Heliophysics, Solar System Exploration, and Astrophysics. Goddard plays a leading role in NASA’s accomplishments by contributing compelling scientific knowledge to advance the Agency’s mission. <b>Follow us on <a href="http://twitter.com/NASAGoddardPix" rel="nofollow">Twitter</a></b> <b>Like us on <a href="http://www.facebook.com/pages/Greenbelt-MD/NASA-Goddard/395013845897?ref=tsd" rel="nofollow">Facebook</a></b> <b>Find us on <a href="http://instagram.com/nasagoddard?vm=grid" rel="nofollow">Instagram</a></b>
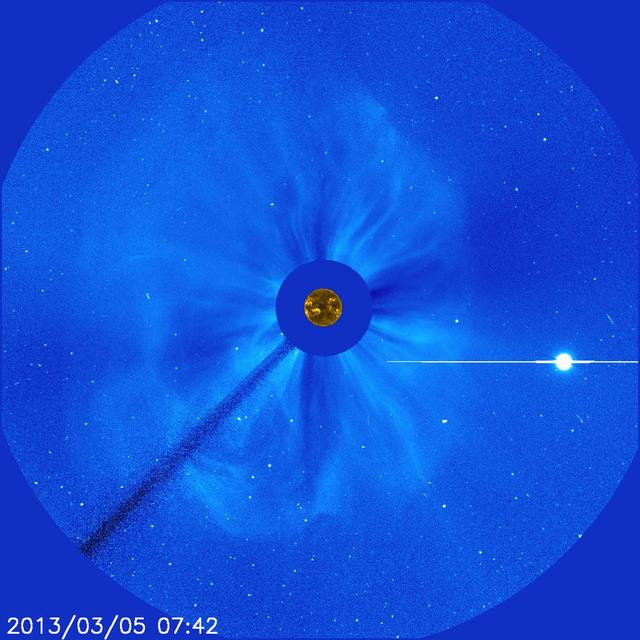
There's no way to tell from this SOHO image whether the halo CME on March 5, 2013, originated from the front or far of the sun. But the STEREO spacecraft were watching the sun from the sides and showed it was from the far side. The bright planet is Venus. Credit: NASA/SOHO CME WEEK: What To See in CME Images Two main types of explosions occur on the sun: solar flares and coronal mass ejections. Unlike the energy and x-rays produced in a solar flare – which can reach Earth at the speed of light in eight minutes – coronal mass ejections are giant, expanding clouds of solar material that take one to three days to reach Earth. Once at Earth, these ejections, also called CMEs, can impact satellites in space or interfere with radio communications. During CME WEEK from Sept. 22 to 26, 2014, we explore different aspects of these giant eruptions that surge out from the star we live with. When a coronal mass ejection blasts off the sun, scientists rely on instruments called coronagraphs to track their progress. Coronagraphs block out the bright light of the sun, so that the much fainter material in the solar atmosphere -- including CMEs -- can be seen in the surrounding space. CMEs appear in these images as expanding shells of material from the sun's atmosphere -- sometimes a core of colder, solar material (called a filament) from near the sun's surface moves in the center. But mapping out such three-dimensional components from a two-dimensional image isn't easy. Watch the slideshow to find out how scientists interpret what they see in CME pictures. The images in the slideshow are from the three sets of coronagraphs NASA currently has in space. One is on the joint European Space Agency and NASA Solar and Heliospheric Observatory, or SOHO. SOHO launched in 1995, and sits between Earth and the sun about a million miles away from Earth. The other two coronagraphs are on the two spacecraft of the NASA Solar Terrestrial Relations Observatory, or STEREO, mission, which launched in 2006. The two STEREO spacecraft are both currently viewing the far side of the sun. Together these instruments help scientists create a three-dimensional model of any CME as its journey unfolds through interplanetary space. Such information can show why a given characteristic of a CME close to the sun might lead to a given effect near Earth, or any other planet in the solar system...<b><a href="http://www.nasa.gov/audience/formedia/features/MP_Photo_Guidelines.html" rel="nofollow">NASA image use policy.</a></b> <b><a href="http://www.nasa.gov/centers/goddard/home/index.html" rel="nofollow">NASA Goddard Space Flight Center</a></b> enables NASA’s mission through four scientific endeavors: Earth Science, Heliophysics, Solar System Exploration, and Astrophysics. Goddard plays a leading role in NASA’s accomplishments by contributing compelling scientific knowledge to advance the Agency’s mission. <b>Follow us on <a href="http://twitter.com/NASAGoddardPix" rel="nofollow">Twitter</a></b> <b>Like us on <a href="http://www.facebook.com/pages/Greenbelt-MD/NASA-Goddard/395013845897?ref=tsd" rel="nofollow">Facebook</a></b> <b>Find us on <a href="http://instagram.com/nasagoddard?vm=grid" rel="nofollow">Instagram</a></b>
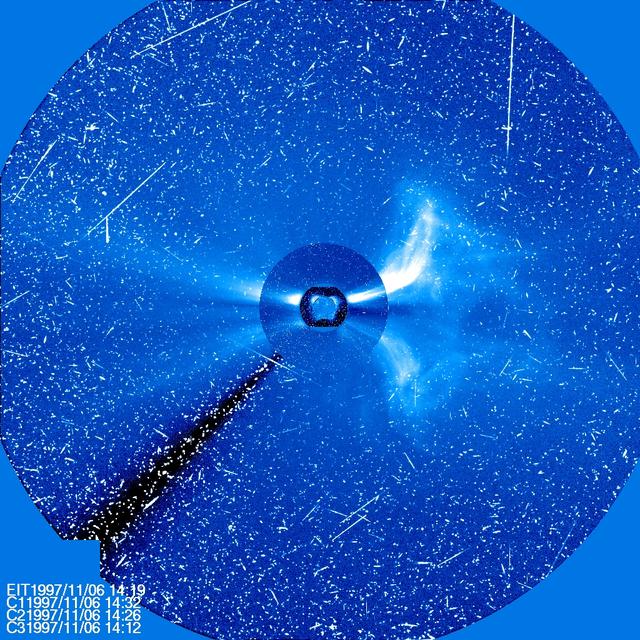
Four different instruments on SOHO show a large CME on Nov. 6, 1997. The sun is at the center, with three coronagraph images of different sizes around it. The streaks of white light are from protons hitting the SOHO cameras producing a snowy effect typical of a significant flare. ..Credit: NASA/SOHO..---..CME WEEK: What To See in CME Images Two main types of explosions occur on the sun: solar flares and coronal mass ejections. Unlike the energy and x-rays produced in a solar flare – which can reach Earth at the speed of light in eight minutes – coronal mass ejections are giant, expanding clouds of solar material that take one to three days to reach Earth. Once at Earth, these ejections, also called CMEs, can impact satellites in space or interfere with radio communications. During CME WEEK from Sept. 22 to 26, 2014, we explore different aspects of these giant eruptions that surge out from the star we live with. When a coronal mass ejection blasts off the sun, scientists rely on instruments called coronagraphs to track their progress. Coronagraphs block out the bright light of the sun, so that the much fainter material in the solar atmosphere -- including CMEs -- can be seen in the surrounding space. CMEs appear in these images as expanding shells of material from the sun's atmosphere -- sometimes a core of colder, solar material (called a filament) from near the sun's surface moves in the center. But mapping out such three-dimensional components from a two-dimensional image isn't easy. Watch the slideshow to find out how scientists interpret what they see in CME pictures. The images in the slideshow are from the three sets of coronagraphs NASA currently has in space. One is on the joint European Space Agency and NASA Solar and Heliospheric Observatory, or SOHO. SOHO launched in 1995, and sits between Earth and the sun about a million miles away from Earth. The other two coronagraphs are on the two spacecraft of the NASA Solar Terrestrial Relations Observatory, or STEREO, mission, which launched in 2006. The two STEREO spacecraft are both currently viewing the far side of the sun. Together these instruments help scientists create a three-dimensional model of any CME as its journey unfolds through interplanetary space. Such information can show why a given characteristic of a CME close to the sun might lead to a given effect near Earth, or any other planet in the solar system...<b><a href="http://www.nasa.gov/audience/formedia/features/MP_Photo_Guidelines.html" rel="nofollow">NASA image use policy.</a></b> <b><a href="http://www.nasa.gov/centers/goddard/home/index.html" rel="nofollow">NASA Goddard Space Flight Center</a></b> enables NASA’s mission through four scientific endeavors: Earth Science, Heliophysics, Solar System Exploration, and Astrophysics. Goddard plays a leading role in NASA’s accomplishments by contributing compelling scientific knowledge to advance the Agency’s mission. <b>Follow us on <a href="http://twitter.com/NASAGoddardPix" rel="nofollow">Twitter</a></b> <b>Like us on <a href="http://www.facebook.com/pages/Greenbelt-MD/NASA-Goddard/395013845897?ref=tsd" rel="nofollow">Facebook</a></b> <b>Find us on <a href="http://instagram.com/nasagoddard?vm=grid" rel="nofollow">Instagram</a></b>

This is a Hubble Space Telescope composite image of a supernova explosion designated SN 2014J in the galaxy M82. At a distance of approximately 11.5 million light-years from Earth it is the closest supernova of its type discovered in the past few decades. The explosion is categorized as a Type Ia supernova, which is theorized to be triggered in binary systems consisting of a white dwarf and another star — which could be a second white dwarf, a star like our sun, or a giant star. Astronomers using a ground-based telescope discovered the explosion on January 21, 2014. This Hubble photograph was taken on January 31, as the supernova approached its peak brightness. The Hubble data are expected to help astronomers refine distance measurements to Type Ia supernovae. In addition, the observations could yield insights into what kind of stars were involved in the explosion. Hubble’s ultraviolet-light sensitivity will allow astronomers to probe the environment around the site of the supernova explosion and in the interstellar medium of the host galaxy. Because of their consistent peak brightness, Type Ia supernovae are among the best tools to measure distances in the universe. They were fundamental to the 1998 discovery of the mysterious acceleration of the expanding universe. A hypothesized repulsive force, called dark energy, is thought to cause the acceleration. Among the other major NASA space-based observatories used in the M82 viewing campaign are Spitzer Space Telescope, Chandra X-ray Observatory, Nuclear Spectroscopic Telescope Array (NuSTAR), Fermi Gamma-ray Space Telescope, Swift Gamma Ray Burst Explorer, and the Stratospheric Observatory for Infrared Astronomy (SOFIA). Image Credit: NASA, ESA, A. Goobar (Stockholm University), and the Hubble Heritage Team (STScI/AURA) <b><a href="http://www.nasa.gov/audience/formedia/features/MP_Photo_Guidelines.html" rel="nofollow">NASA image use policy.</a></b> <b><a href="http://www.nasa.gov/centers/goddard/home/index.html" rel="nofollow">NASA Goddard Space Flight Center</a></b> enables NASA’s mission through four scientific endeavors: Earth Science, Heliophysics, Solar System Exploration, and Astrophysics. Goddard plays a leading role in NASA’s accomplishments by contributing compelling scientific knowledge to advance the Agency’s mission. <b>Follow us on <a href="http://twitter.com/NASAGoddardPix" rel="nofollow">Twitter</a></b> <b>Like us on <a href="http://www.facebook.com/pages/Greenbelt-MD/NASA-Goddard/395013845897?ref=tsd" rel="nofollow">Facebook</a></b> <b>Find us on <a href="http://instagram.com/nasagoddard?vm=grid" rel="nofollow">Instagram</a></b>

For the 26th birthday of NASA’s Hubble Space Telescope, astronomers are highlighting a Hubble image of an enormous bubble being blown into space by a super-hot, massive star. The Hubble image of the Bubble Nebula, or NGC 7635, was chosen to mark the 26th anniversary of the launch of Hubble into Earth orbit by the STS-31 space shuttle crew on April 24, 1990 “As Hubble makes its 26th revolution around our home star, the sun, we celebrate the event with a spectacular image of a dynamic and exciting interaction of a young star with its environment. The view of the Bubble Nebula, crafted from WFC-3 images, reminds us that Hubble gives us a front row seat to the awe inspiring universe we live in,” said John Grunsfeld, Hubble astronaut and associate administrator of NASA’s Science Mission Directorate at NASA Headquarters, in Washington, D.C. The Bubble Nebula is seven light-years across—about one-and-a-half times the distance from our sun to its nearest stellar neighbor, Alpha Centauri, and resides 7,100 light-years from Earth in the constellation Cassiopeia. The seething star forming this nebula is 45 times more massive than our sun. Gas on the star gets so hot that it escapes away into space as a “stellar wind” moving at over four million miles per hour. This outflow sweeps up the cold, interstellar gas in front of it, forming the outer edge of the bubble much like a snowplow piles up snow in front of it as it moves forward. As the surface of the bubble's shell expands outward, it slams into dense regions of cold gas on one side of the bubble. This asymmetry makes the star appear dramatically off-center from the bubble, with its location in the 10 o’clock position in the Hubble view. Dense pillars of cool hydrogen gas laced with dust appear at the upper left of the picture, and more “fingers” can be seen nearly face-on, behind the translucent bubble. The gases heated to varying temperatures emit different colors: oxygen is hot enough to emit blue light in the bubble near the star, while the cooler pillars are yellow from the combined light of hydrogen and nitrogen. The pillars are similar to the iconic columns in the “Pillars of Creation” Eagle Nebula. As seen with the structures in the Eagle Nebula, the Bubble Nebula pillars are being illuminated by the strong ultraviolet radiation from the brilliant star inside the bubble. The Bubble Nebula was discovered in 1787 by William Herschel, a prominent British astronomer. It is being formed by a proto-typical Wolf-Rayet star, BD +60º2522, an extremely bright, massive, and short-lived star that has lost most of its outer hydrogen and is now fusing helium into heavier elements. The star is about four million years old, and in 10 million to 20 million years, it will likely detonate as a supernova. Hubble’s Wide Field Camera-3 imaged the nebula in visible light with unprecedented clarity in February 2016. The colors correspond to blue for oxygen, green for hydrogen, and red for nitrogen. This information will help astronomers understand the geometry and dynamics of this complex system. The Bubble Nebula is one of only a handful of astronomical objects that have been observed with several different instruments onboard Hubble. Hubble also imaged it with the Wide Field Planetary Camera (WFPC) in September 1992, and with Wide Field Planetary Camera-2 (WFPC2) in April 1999. The Hubble Space Telescope is a project of international cooperation between NASA and the European Space Agency. NASA's Goddard Space Flight Center in Greenbelt, Maryland, manages the telescope. The Space Telescope Science Institute (STScI) in Baltimore, Maryland, conducts Hubble science operations. STScI is operated for NASA by the Association of Universities for Research in Astronomy in Washington, D.C. Credit: NASA, ESA, and the Hubble Heritage Team (STScI/AURA)

For the 26th birthday of NASA’s Hubble Space Telescope, astronomers are highlighting a Hubble image of an enormous bubble being blown into space by a super-hot, massive star. The Hubble image of the Bubble Nebula, or NGC 7635, was chosen to mark the 26th anniversary of the launch of Hubble into Earth orbit by the STS-31 space shuttle crew on April 24, 1990 “As Hubble makes its 26th revolution around our home star, the sun, we celebrate the event with a spectacular image of a dynamic and exciting interaction of a young star with its environment. The view of the Bubble Nebula, crafted from WFC-3 images, reminds us that Hubble gives us a front row seat to the awe inspiring universe we live in,” said John Grunsfeld, Hubble astronaut and associate administrator of NASA’s Science Mission Directorate at NASA Headquarters, in Washington, D.C. The Bubble Nebula is seven light-years across—about one-and-a-half times the distance from our sun to its nearest stellar neighbor, Alpha Centauri, and resides 7,100 light-years from Earth in the constellation Cassiopeia. The seething star forming this nebula is 45 times more massive than our sun. Gas on the star gets so hot that it escapes away into space as a “stellar wind” moving at over four million miles per hour. This outflow sweeps up the cold, interstellar gas in front of it, forming the outer edge of the bubble much like a snowplow piles up snow in front of it as it moves forward. As the surface of the bubble's shell expands outward, it slams into dense regions of cold gas on one side of the bubble. This asymmetry makes the star appear dramatically off-center from the bubble, with its location in the 10 o’clock position in the Hubble view. Dense pillars of cool hydrogen gas laced with dust appear at the upper left of the picture, and more “fingers” can be seen nearly face-on, behind the translucent bubble. The gases heated to varying temperatures emit different colors: oxygen is hot enough to emit blue light in the bubble near the star, while the cooler pillars are yellow from the combined light of hydrogen and nitrogen. The pillars are similar to the iconic columns in the “Pillars of Creation” Eagle Nebula. As seen with the structures in the Eagle Nebula, the Bubble Nebula pillars are being illuminated by the strong ultraviolet radiation from the brilliant star inside the bubble. The Bubble Nebula was discovered in 1787 by William Herschel, a prominent British astronomer. It is being formed by a proto-typical Wolf-Rayet star, BD +60º2522, an extremely bright, massive, and short-lived star that has lost most of its outer hydrogen and is now fusing helium into heavier elements. The star is about four million years old, and in 10 million to 20 million years, it will likely detonate as a supernova. Hubble’s Wide Field Camera-3 imaged the nebula in visible light with unprecedented clarity in February 2016. The colors correspond to blue for oxygen, green for hydrogen, and red for nitrogen. This information will help astronomers understand the geometry and dynamics of this complex system. The Bubble Nebula is one of only a handful of astronomical objects that have been observed with several different instruments onboard Hubble. Hubble also imaged it with the Wide Field Planetary Camera (WFPC) in September 1992, and with Wide Field Planetary Camera-2 (WFPC2) in April 1999. The Hubble Space Telescope is a project of international cooperation between NASA and the European Space Agency. NASA's Goddard Space Flight Center in Greenbelt, Maryland, manages the telescope. The Space Telescope Science Institute (STScI) in Baltimore, Maryland, conducts Hubble science operations. STScI is operated for NASA by the Association of Universities for Research in Astronomy in Washington, D.C. Credit: NASA, ESA, and the Hubble Heritage Team (STScI/AURA)
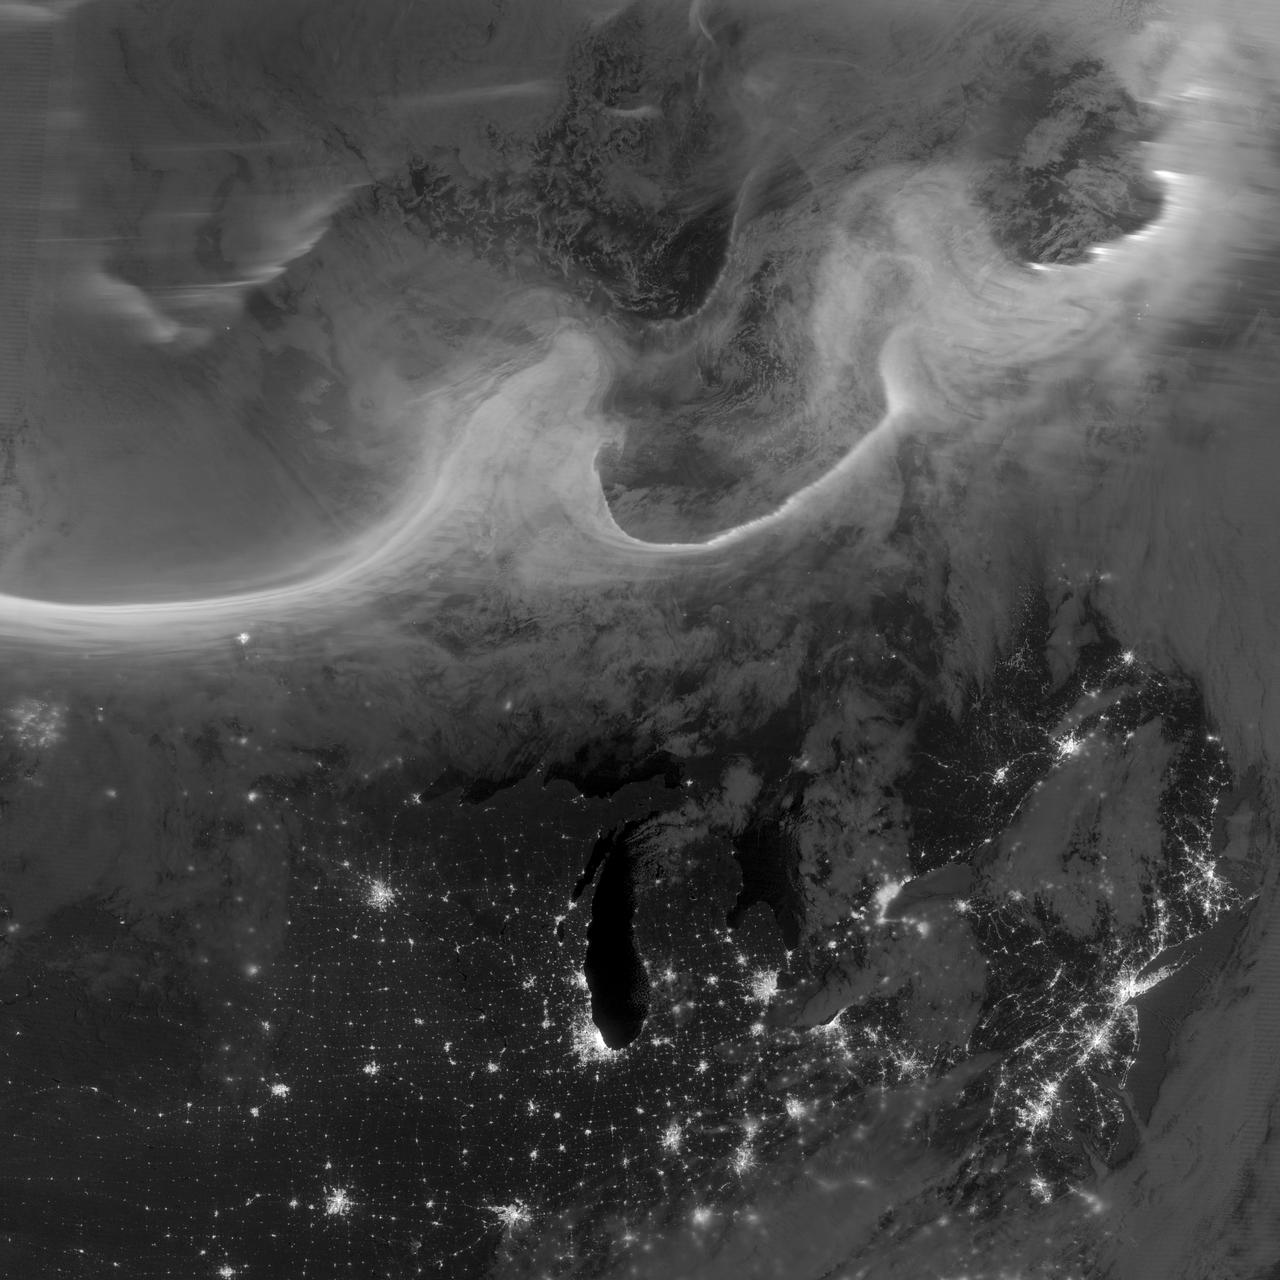
Overnight on October 4-5, 2012, a mass of energetic particles from the atmosphere of the Sun were flung out into space, a phenomenon known as a coronal mass ejection. Three days later, the storm from the Sun stirred up the magnetic field around Earth and produced gorgeous displays of northern lights. NASA satellites track such storms from their origin to their crossing of interplanetary space to their arrival in the atmosphere of Earth. Using the “day-night band” (DNB) of the Visible Infrared Imaging Radiometer Suite (VIIRS), the Suomi National Polar-orbiting Partnership (Suomi NPP) satellite acquired this view of the aurora borealis early on the morning of October 8, 2012. The northern lights stretch across Canada’s Quebec and Ontario provinces in the image, and are part of the auroral oval that expanded to middle latitudes because of a geomagnetic storm. The DNB sensor detects dim light signals such as auroras, airglow, gas flares, city lights, and reflected moonlight. In the case of the image above, the sensor detected the visible light emissions as energetic particles rained down from Earth’s magnetosphere and into the gases of the upper atmosphere. The images are similar to those collected by the Operational Linescan System flown on U.S. Defense Meteorological Satellite Program (DMSP) satellites for the past three decades. “When I first saw images like this as a graduate student, I was immediately struck by the fluid dynamic characteristics of the aurora,” said Tom Moore, a space physicist at NASA's Goddard Space Flight Center. “Viewing the aurora in this way makes it immediately clear that space weather is an interaction of fluids from the Sun with those of the Earth's upper atmosphere. The electrodynamics make for important differences between plasmas and ordinary fluids, but familiar behaviors (for example, waves and vortices) are still very apparent. It makes me wonder at the ability of apparently empty space to behave like a fluid.” Auroras typically occur when solar flares and coronal mass ejections—or even an active solar wind stream—disturb and distort the magnetosphere, the cocoon of space protected by Earth’s magnetic field. The collision of solar particles and pressure into our planet’s magnetosphere accelerates particles trapped in the space around Earth (such as in the radiation belts). Those particles are sent crashing down into Earth’s upper atmosphere—at altitudes of 100 to 400 kilometers (60 to 250 miles)—where they excite oxygen and nitrogen molecules and release photons of light. The results are rays, sheets, and curtains of dancing light in the sky. Auroras are a beautiful expression of the connection between Sun and Earth, but not all of the connections are benign. Auroras are connected to geomagnetic storms, which can distort radio communications (particularly high frequencies), disrupt electric power systems on the ground, and give slight but detectable doses of radiation to flight crews and passengers on high-latitude airplane flights and on spacecraft. The advantage of images like those from VIIRS and DMSP is resolution, according to space physicist Patrick Newell of the Johns Hopkins University Applied Physics Laboratory. “You can see very fine detail in the aurora because of the low altitude and the high resolution of the camera,” he said. Most aurora scientists prefer to use images from missions dedicated to aurora studies (such as Polar, IMAGE, and ground-based imagers), which can offer many more images of a storm (rather than one per orbit) and can allow researchers to calculate the energy moving through the atmosphere. There are no science satellites flying right now that provide such a view, though astronauts regularly photograph and film auroras from the International Space Station. NASA Earth Observatory image by Jesse Allen and Robert Simmon, using VIIRS Day-Night Band data from the Suomi National Polar-orbiting Partnership (Suomi NPP) and the University of Wisconsin's Community Satellite Processing Package. Suomi NPP is the result of a partnership between NASA, the National Oceanic and Atmospheric Administration, and the Department of Defense. Caption by Mike Carlowicz. Instrument: Suomi NPP - VIIRS Credit: <b><a href="http://www.earthobservatory.nasa.gov/" rel="nofollow"> NASA Earth Observatory</a></b> <b><a href="http://www.nasa.gov/audience/formedia/features/MP_Photo_Guidelines.html" rel="nofollow">NASA image use policy.</a></b> <b><a href="http://www.nasa.gov/centers/goddard/home/index.html" rel="nofollow">NASA Goddard Space Flight Center</a></b> enables NASA’s mission through four scientific endeavors: Earth Science, Heliophysics, Solar System Exploration, and Astrophysics. Goddard plays a leading role in NASA’s accomplishments by contributing compelling scientific knowledge to advance the Agency’s mission. <b>Follow us on <a href="http://twitter.com/NASA_GoddardPix" rel="nofollow">Twitter</a></b> <b>Like us on <a href="http://www.facebook.com/pages/Greenbelt-MD/NASA-Goddard/395013845897?ref=tsd" rel="nofollow">Facebook</a></b> <b>Find us on <a href="http://instagrid.me/nasagoddard/?vm=grid" rel="nofollow">Instagram</a></b>

Globular star cluster NGC 362, in a false-color image from NASA's Galaxy Evolution Explorer. Image credit: NASA/JPL-Caltech/Univ. of Virginia The Galaxy Evolution Explorer's ultraviolet eyes have captured a globular star cluster, called NGC 362, in our own Milky Way galaxy. In this new image, the cluster appears next to stars from a more distant neighboring galaxy, known as the Small Magellanic Cloud. "This image is so interesting because it allows a study of the final stages of evolution of low-mass stars in NGC 362, as well as the history of star formation in the Small Magellanic Cloud," said Ricardo Schiavon of the University of Virginia, Charlottesville, Va. Globular clusters are densely packed bunches of old stars scattered in galaxies throughout the universe. NGC 362, located 30,000 light-years away, can be spotted as the dense collection of mostly yellow-tinted stars surrounding a large white-yellow spot toward the top-right of this image. The white spot is actually the core of the cluster, which is made up of stars so closely packed together that the Galaxy Evolution Explorer cannot see them individually. The light blue dots surrounding the cluster core are called extreme horizontal branch stars. These stars used to be very similar to our sun and are nearing the end of their lives. They are very hot, with temperatures reaching up to about four times that of the surface of our sun (25,000 Kelvin or 45,500 degrees Fahrenheit). A star like our sun spends most of its life fusing hydrogen atoms in its core into helium. When the star runs out of hydrogen in its core, its outer envelope will expand. The star then becomes a red giant, which burns hydrogen in a shell surrounding its inner core. Throughout its life as a red giant, the star loses a lot of mass, then begins to burn helium at its core. Some stars will have lost so much mass at the end of this process, up to 85 percent of their envelopes, that most of the envelope is gone. What is left is a very hot ultraviolet-bright core, or extreme horizontal branch star. Blue dots scattered throughout the image are hot, young stars in the Small Magellanic Cloud, a satellite galaxy of the Milky Way located approximately 200,000 light-years away. The stars in this galaxy are much brighter intrinsically than extreme horizontal branch stars, but they appear just as bright because they are farther away. The blue stars in the Small Magellanic Cloud are only about a few tens of millions of years old, much younger than the approximately 10-million-year-old stars in NGC 362. Because NGC 362 sits on the northern edge of the Small Magellanic Cloud galaxy, the blue stars are denser toward the south, or bottom, of the image. Some of the yellow spots in this image are stars in the Milky Way galaxy that are along this line of sight. Astronomers believe that some of the other spots, particularly those closer to NGC 362, might actually be a relatively ultraviolet-dim family of stars called "blue stragglers." These stars are formed from collisions or close encounters between two closely orbiting stars in a globular cluster. "This observation could only be done with the Galaxy Evolution Explorer because it is the only ultraviolet imager available to the astronomical community with such a large field of view," said Schiavon. This image is a false-color composite, where light detected by the Galaxy Evolution Explorer's far-ultraviolet detector is colored blue, and light from the telescope's near-ultraviolet detector is red. Written by Linda Vu, Spitzer Science Center Media contact: Whitney Clavin/JPL (818) 354-4673

Using the “day-night band” (DNB) of the Visible Infrared Imaging Radiometer Suite (VIIRS), the Suomi National Polar-orbiting Partnership (Suomi NPP) satellite acquired this view of the aurora borealis on March 18, 2015. The northern lights stretch across Canada’s Quebec, Ontario, Manitoba, Nunavut, and Newfoundland provinces in the image, and are part of the auroral oval that expanded to middle latitudes because of a geomagnetic storm on March 17, 2015. The DNB sensor detects dim light signals such as auroras, airglow, gas flares, city lights, and reflected moonlight. In the case of the image above, the sensor detected the visible light emissions as energetic particles rained down from Earth’s magnetosphere and into the gases of the upper atmosphere. The images are similar to those collected by the Operational Linescan System flown on U.S. Defense Meteorological Satellite Program (DMSP) satellites for the past three decades. Auroras typically occur when solar flares and coronal mass ejections—or even an active solar wind stream—disturb and distort the magnetosphere, the cocoon of space protected by Earth’s magnetic field. The collision of solar particles and pressure into our planet’s magnetosphere accelerates particles trapped in the space around Earth (such as in the radiation belts). Those particles are sent crashing down into Earth’s upper atmosphere—at altitudes of 100 to 400 kilometers (60 to 250 miles)—where they excite oxygen and nitrogen molecules and release photons of light. The results are rays, sheets, and curtains of dancing light in the sky. Read more: <a href="http://earthobservatory.nasa.gov/NaturalHazards/view.php?id=85556&eocn=home&eoci=nh" rel="nofollow">earthobservatory.nasa.gov/NaturalHazards/view.php?id=8555...</a> NASA Earth Observatory image by Jesse Allen, using VIIRS day-night band data from the Suomi National Polar-orbiting Partnership. Suomi NPP is the result of a partnership between NASA, the National Oceanic and Atmospheric Administration, and the Department of Defense. Caption by Mike Carlowicz and Adam Voiland. Credit: <b><a href="http://www.earthobservatory.nasa.gov/" rel="nofollow"> NASA Earth Observatory</a></b> <b><a href="http://www.nasa.gov/audience/formedia/features/MP_Photo_Guidelines.html" rel="nofollow">NASA image use policy.</a></b> <b><a href="http://www.nasa.gov/centers/goddard/home/index.html" rel="nofollow">NASA Goddard Space Flight Center</a></b> enables NASA’s mission through four scientific endeavors: Earth Science, Heliophysics, Solar System Exploration, and Astrophysics. Goddard plays a leading role in NASA’s accomplishments by contributing compelling scientific knowledge to advance the Agency’s mission. <b>Follow us on <a href="http://twitter.com/NASAGoddardPix" rel="nofollow">Twitter</a></b> <b>Like us on <a href="http://www.facebook.com/pages/Greenbelt-MD/NASA-Goddard/395013845897?ref=tsd" rel="nofollow">Facebook</a></b> <b>Find us on <a href="http://instagrid.me/nasagoddard/?vm=grid" rel="nofollow">Instagram</a></b>

NASA image acquired April 18 - October 23, 2012 This image of the United States of America at night is a composite assembled from data acquired by the Suomi NPP satellite in April and October 2012. The image was made possible by the new satellite’s “day-night band” of the Visible Infrared Imaging Radiometer Suite (VIIRS), which detects light in a range of wavelengths from green to near-infrared and uses filtering techniques to observe dim signals such as city lights, gas flares, auroras, wildfires, and reflected moonlight. “Nighttime light is the most interesting data that I’ve had a chance to work with,” says Chris Elvidge, who leads the Earth Observation Group at NOAA’s National Geophysical Data Center. “I’m always amazed at what city light images show us about human activity.” His research group has been approached by scientists seeking to model the distribution of carbon dioxide emissions from fossil fuels and to monitor the activity of commercial fishing fleets. Biologists have examined how urban growth has fragmented animal habitat. Elvidge even learned once of a study of dictatorships in various parts of the world and how nighttime lights had a tendency to expand in the dictator’s hometown or province. Named for satellite meteorology pioneer Verner Suomi, NPP flies over any given point on Earth's surface twice each day at roughly 1:30 a.m. and p.m. The polar-orbiting satellite flies 824 kilometers (512 miles) above the surface, sending its data once per orbit to a ground station in Svalbard, Norway, and continuously to local direct broadcast users distributed around the world. Suomi NPP is managed by NASA with operational support from NOAA and its Joint Polar Satellite System, which manages the satellite's ground system. NASA Earth Observatory image by Robert Simmon, using Suomi NPP VIIRS data provided courtesy of Chris Elvidge (NOAA National Geophysical Data Center). Suomi NPP is the result of a partnership between NASA, NOAA, and the Department of Defense. Caption by Mike Carlowicz. Instrument: Suomi NPP - VIIRS Credit: <b><a href="http://www.earthobservatory.nasa.gov/" rel="nofollow"> NASA Earth Observatory</a></b> <b>Click here to view all of the <a href="http://earthobservatory.nasa.gov/Features/NightLights/" rel="nofollow"> Earth at Night 2012 images </a></b> <b>Click here to <a href="http://earthobservatory.nasa.gov/NaturalHazards/view.php?id=79800" rel="nofollow"> read more </a> about this image </b> <b><a href="http://www.nasa.gov/audience/formedia/features/MP_Photo_Guidelines.html" rel="nofollow">NASA image use policy.</a></b> <b><a href="http://www.nasa.gov/centers/goddard/home/index.html" rel="nofollow">NASA Goddard Space Flight Center</a></b> enables NASA’s mission through four scientific endeavors: Earth Science, Heliophysics, Solar System Exploration, and Astrophysics. Goddard plays a leading role in NASA’s accomplishments by contributing compelling scientific knowledge to advance the Agency’s mission. <b>Follow us on <a href="http://twitter.com/NASA_GoddardPix" rel="nofollow">Twitter</a></b> <b>Like us on <a href="http://www.facebook.com/pages/Greenbelt-MD/NASA-Goddard/395013845897?ref=tsd" rel="nofollow">Facebook</a></b> <b>Find us on <a href="http://instagram.com/nasagoddard?vm=grid" rel="nofollow">Instagram</a></b>