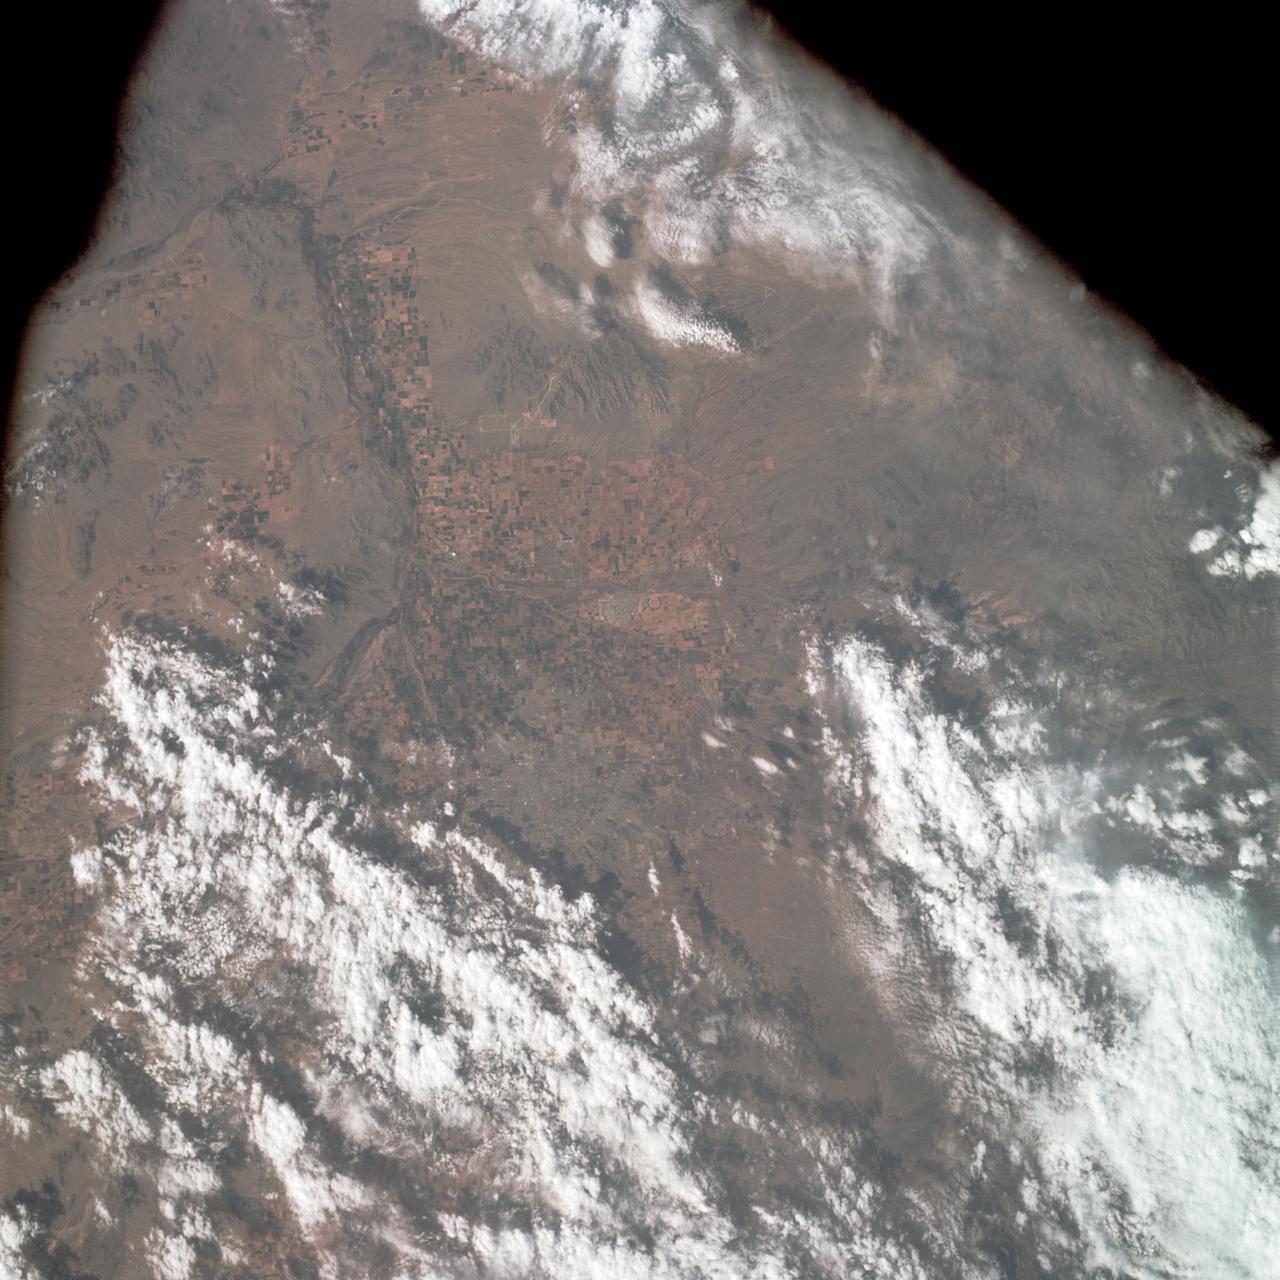
AS09-22-3441 (March 1969) --- Near vertical view of the Phoenix, Arizona area as photographed from the Apollo 9 spacecraft during its Earth-orbital mission. Farmland patterns checkerboard the area along the Gila River. Phoenix is located right of center near the clouds.
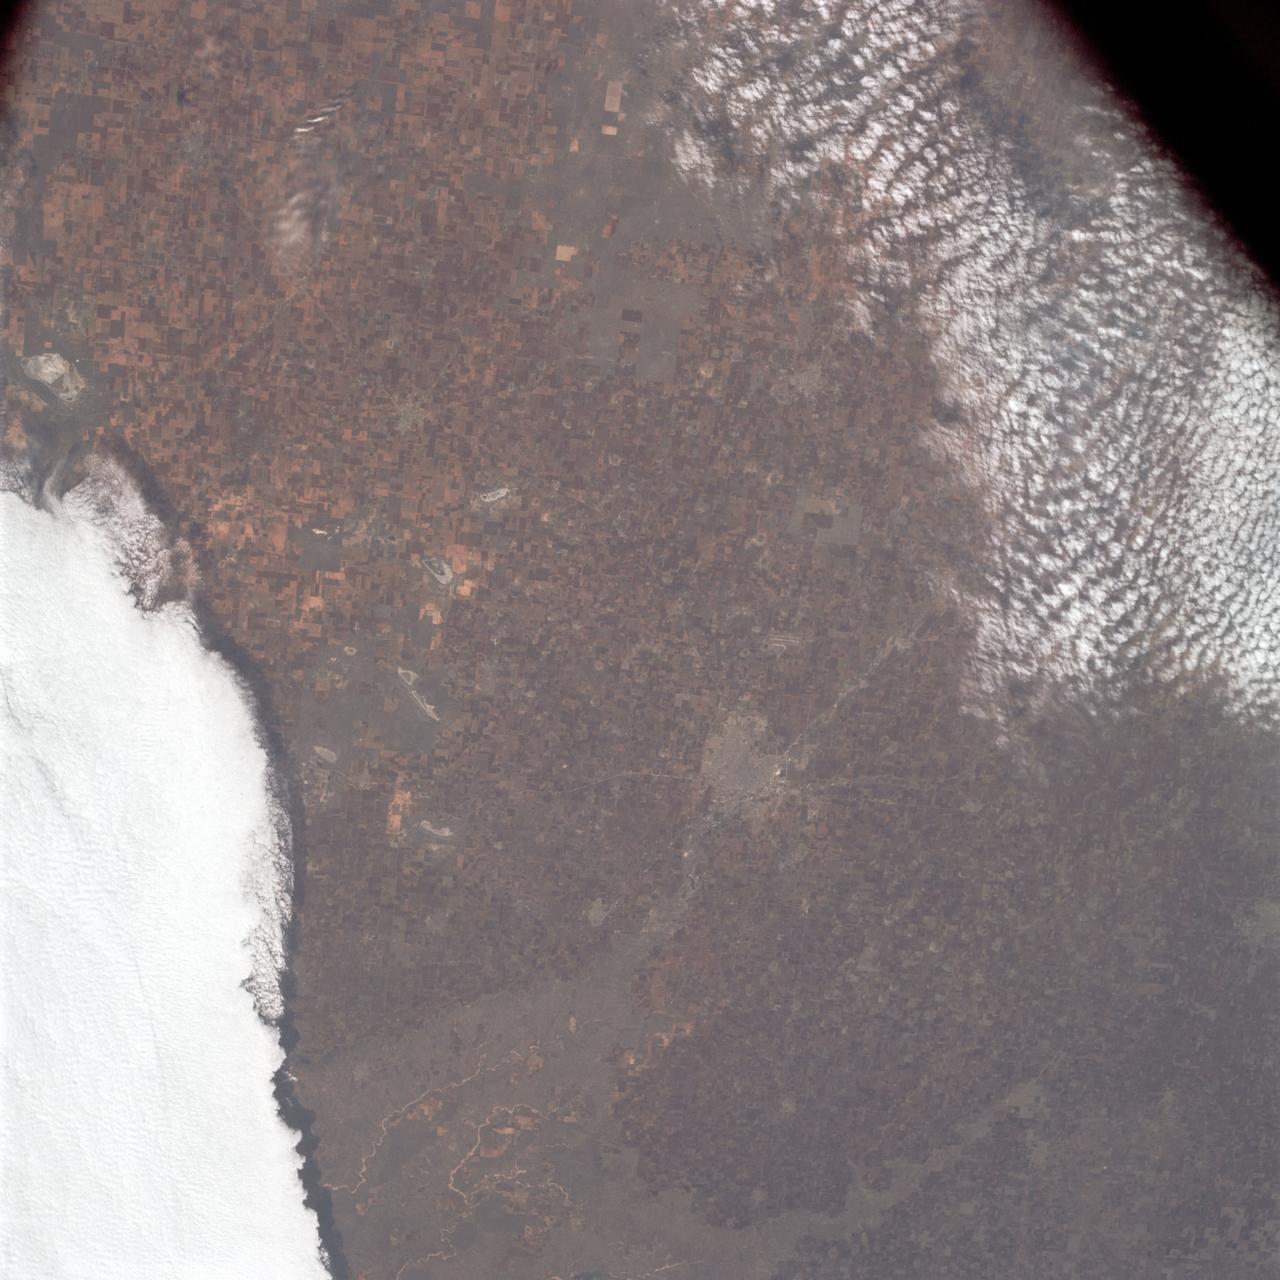
AS09-23-3561 (3-13 March 1969) --- Near vertical view of the Lubbock area in west Texas as photographed from the Apollo 9 spacecraft during its Earth-orbital mission. Conspicuous patterns of farmland surround the city and extend eastward (up) to the Caprock Escarpment. The Double Mountain fork of the Brazos River drains east (toward upper center); Leeland is at lower center; Brownfield at lower right. The sharp edge of a cloud disk cuts across the upper right corner.
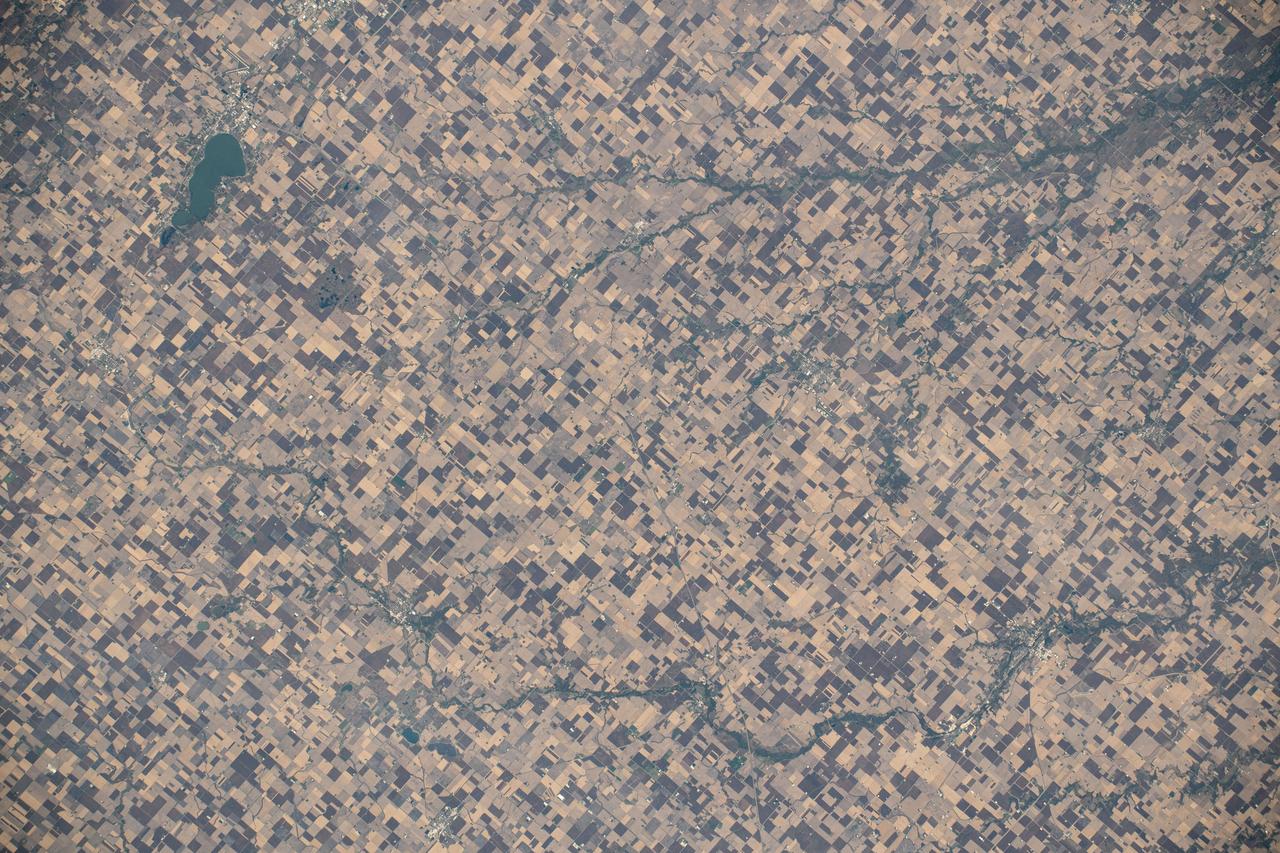
Surface brightness contrasts accentuated by a thin layer of snow enable a network of rivers, roads, and farmland boundaries to stand out clearly in these images from NASA Terra satellite of southeastern Saskatchewan and southwestern Manitoba.
NASA Terra spacecraft shows the resultant flooding of farmland west of the Mississippi 20 miles south of the Mississippi River levee breach. U.S. Army Corps of Engineers detonated explosives at the Birds Point levee near Wyatt, Missouri, on May 2, 2011.
iss070e005396 (Oct. 17, 2023) --- Clear Lake, Iowa, and its namesake lake (upper left) are surrounded by farmland in this photograph from the International Space Station as it orbited 259 miles above the Hawkeye State.
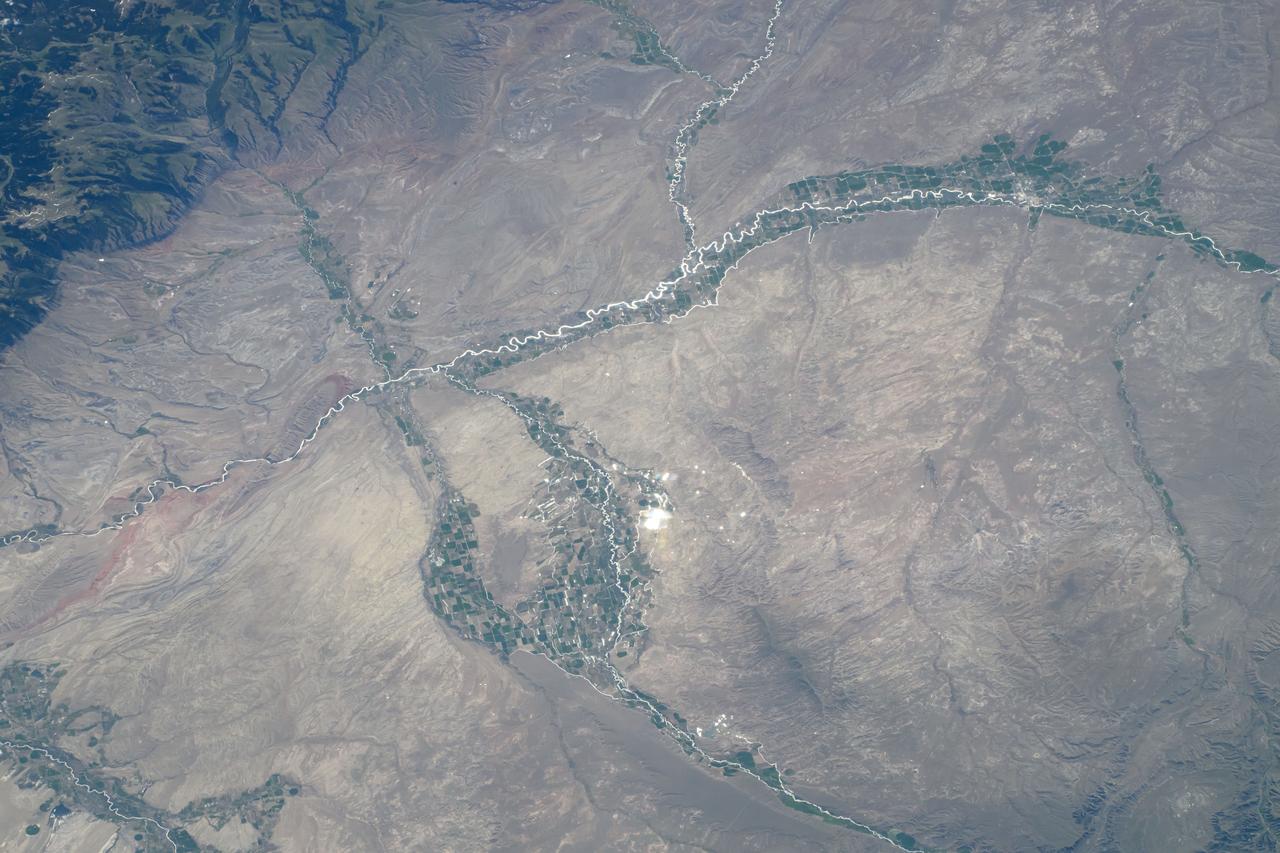
iss071e216801 (June 25, 2024) --- Towns and farmland along the Bighorn River and near the Bighorn National Forest (upper left) in Wyoming are pictured from the International Space Station as it orbited 264 miles above.
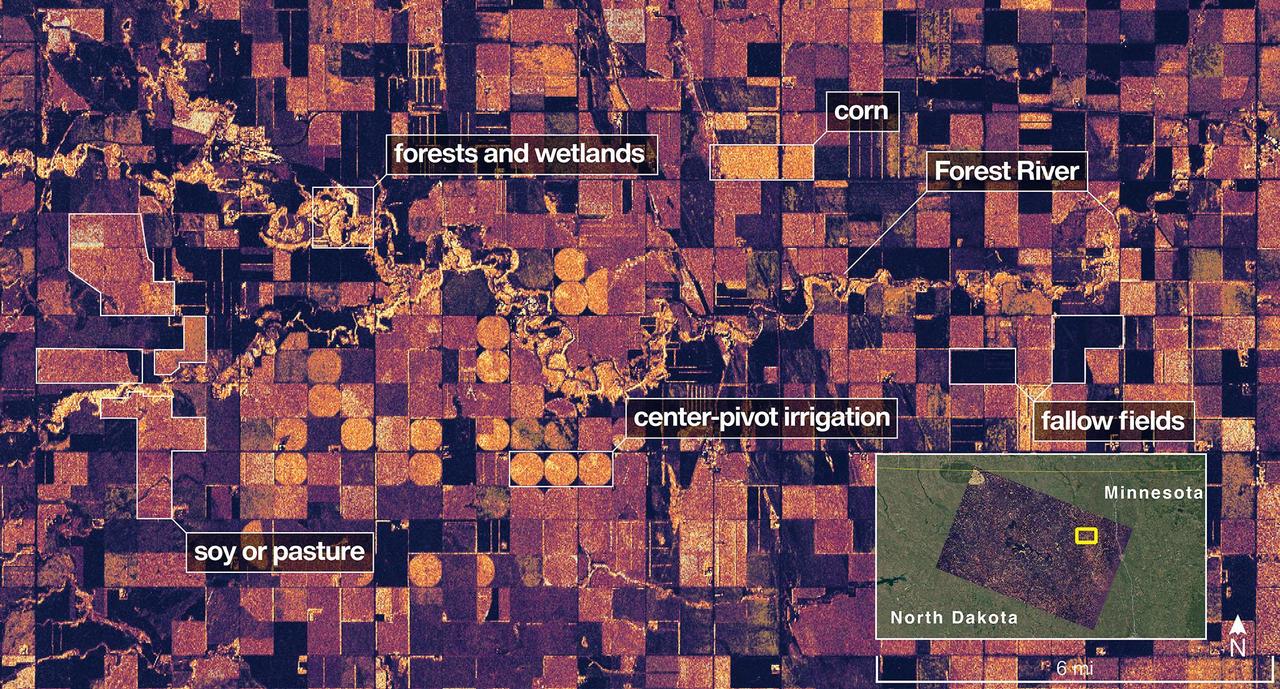
The NISAR (NASA-ISRO Synthetic Aperture Radar) Earth-observing radar satellite's L-band synthetic aperture radar (SAR) system captured an image of a portion of northeastern North Dakota straddling Grand Forks and Walsh counties on Aug. 23, 2025. Produced by scientists on the NISAR science team, the image shows forests and wetlands on the banks of the Forest River meandering through the middle of the frame from west to east and farmland to the north and south. The darker agricultural plots are fallow fields, while the lighter colors represent the presence of pasture or crops, such as soybean and corn. Circular patterns indicate the use of center-pivot irrigation. The satellite is a joint effort between NASA and the Indian Space Research Organisation (ISRO) and is the first satellite to combine L-band and S-band radar systems. The satellite's L-band system, provided by NASA's Jet Propulsion Laboratory in Southern California, uses a 10-inch (25-centimeter) wavelength that enables its signal to penetrate forest canopies and measure soil moisture as well as motion of ice surfaces and land down to fractions of an inch – a key measurement in understanding how the land surface moves before, during, and after earthquakes, volcanic eruptions, and landslides. The NISAR S-band radar, provided by ISRO's Space Applications Centre, uses a 4-inch (10-centimeter) microwave signal that's more sensitive to small vegetation, which makes it effective at monitoring certain types of agriculture and grassland ecosystems. Data used to create the image was collected during NISAR's commissioning phase, when the spacecraft's systems and instruments are powered on and tested. The NISAR mission will begin science operations in November, roughly 90 days after its July 30, 2025, launch from Satish Dhawan Space Centre on India's southeastern coast. Observations from NISAR will benefit humanity by helping researchers around the world better understand changes in our planet's surface, including its ice sheets, glaciers, and sea ice. It also will capture changes in forest and wetland ecosystems and track movement and deformation of our planet's crust by phenomena such as earthquakes, landslides, and volcanic activity. The global and rapid coverage from NISAR will provide unprecedented support for disaster response, producing data to assist in mitigating and assessing damage, with observations before and after catastrophic events available in short time frames. https://photojournal.jpl.nasa.gov/catalog/PIA26615

SL2-05-390 (22 June 1973) --- Greater Detroit (42.0N, 82.5W) is located at the southeastern border of Michigan on the Detroit River across from Windsor, Ontario, Canada and Lake Huron to the north. The river connecting Lake Erie is a channel left over from the Ice Age Glaciers. The land use pattern in this scene is typical of this part of the upper Midwest. The once extensive forests have been cleared for farmland and pasture, but narrow rows of trees still line farm boundaries. Photo credit: NASA

ISS019-E-007253 (16 April 2009) --- Astronaut Michael Barratt, Expedition 19/20 flight engineer, performs Agricultural Camera (AgCam) setup and activation in the Destiny laboratory of the International Space Station. AgCam takes frequent images, in visible and infrared light, of vegetated areas on Earth, such as farmland, rangeland, grasslands, forests and wetlands in the northern Great Plains and Rocky Mountain regions of the United States. Images will be delivered directly to requesting farmers, ranchers, foresters, natural resource managers and tribal officials to help improve environmental stewardship.
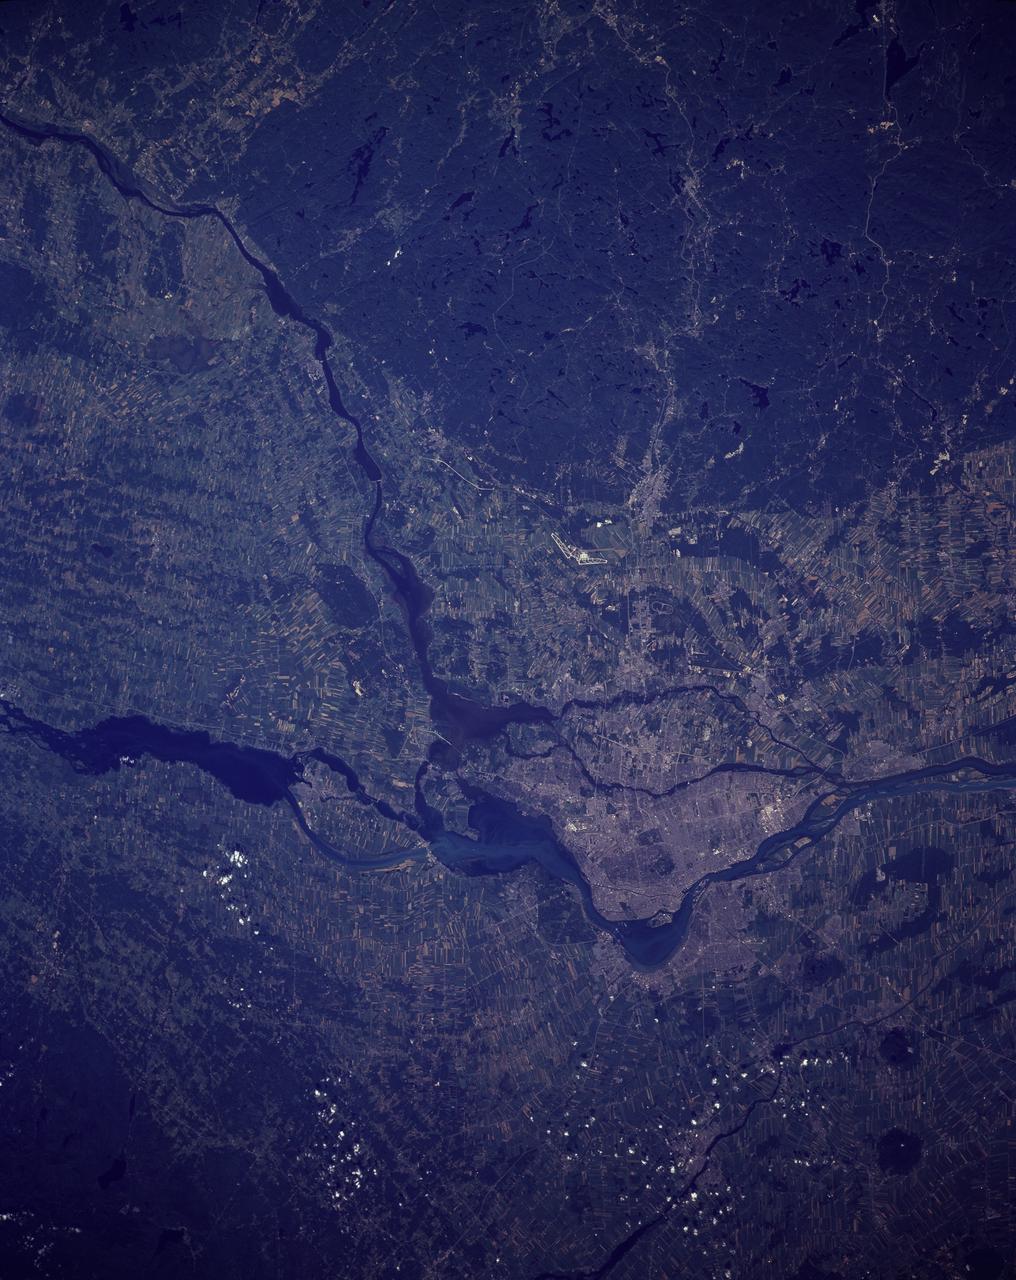
STS085-506-081 (7-19 August 1997) --- Montreal is a city on an island that grew up around the mountain -- in 1535 Jacques Cartier landed on an island in the St. Lawrence River and named a 233 meter-high mountain Mount Royal. It was not until 1642 that Ville Marie, founded by missionaries, would officially become the city of Montreal. The cityscape contrasts well with the farmland and natural forests in this summer view. Today Montreal is the largest city in the province of Quebec, and is the second most populous metropolitan area in Canada -- in 1991 the population was just more than one million in the city and 3,127,242 in the metropolitan area. While owing its early growth to the fur trade, the city is a leading producer of aircraft, chemical and pharmaceutical products, and is a major petroleum production center. Nearly half of Canada's .8 billion aerospace industry is located in the Montreal area. In the image captured by the astronauts, the lighter blue, wide river is the St. Lawrence. The city of Montreal is located on the Ile de Montreal to the northwest of the St. Lawrence river. The Ottawa River enters the St. Lawrence near the center of the view. Mirabel International Airport stands out well, on the north side of the city. The long, narrow strips of land in the image are indicative of French agricultural land use. The narrow ends of farmlands are oriented perpendicular to rivers so that more farmers will have access to water resources.
Lake Enriquillo is a hypersaline lake in the Dominican Republic. In 2004, the lake covered an area of 164 square kilometers; by 2011, it had doubled in size and grown to 350 km2, inundating farmland and homes. Various reasons for the flooding include increases in rainfall; increase of sediments going into the lake, raising the lakebed; and milder temperatures, reducing surface evaporation. The lake is home to the largest population of American crocodiles in the Caribbean. The images were acquired October 26, 2003 and June 10, 2017, cover an area of 22.7 by 45.4 km, and are located at 18.5 degrees north, 71.6 degrees west. An image of Lake Enriquillo taken in 2003 is available at https://photojournal.jpl.nasa.gov/catalog/PIA21815
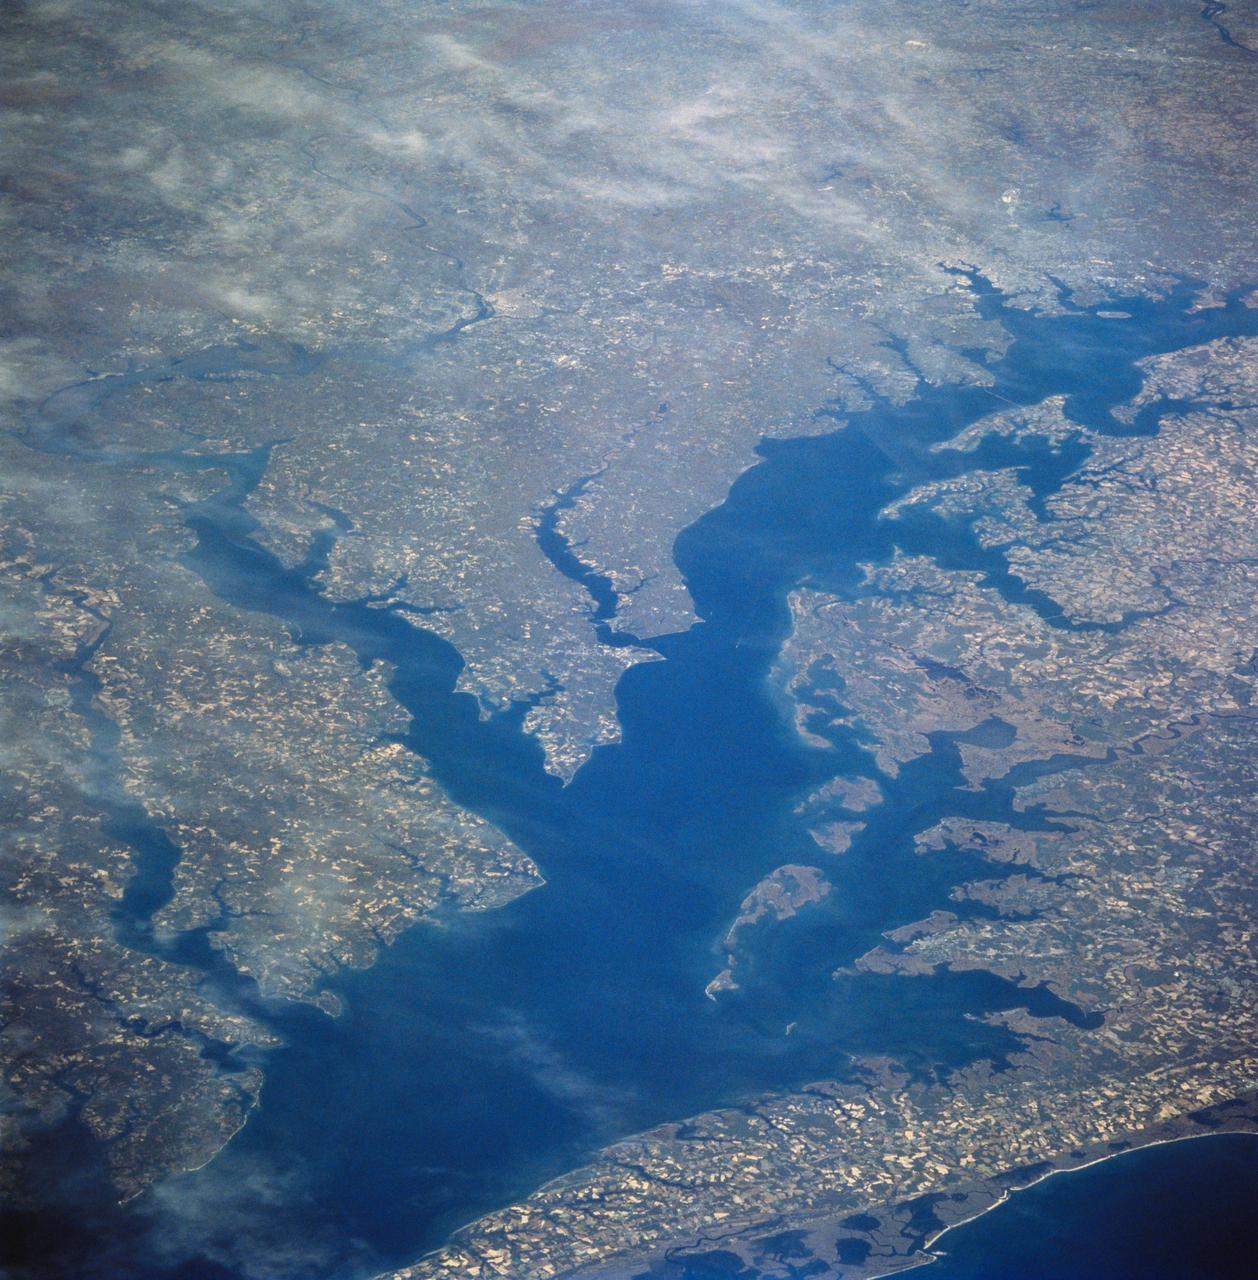
STS058-81-049 (18 Oct-1 Nov 1993) --- This view encompasses most of the large estuarine system of the Chesapeake Bay. The farmland and marshes of eastern shores of the Chesapeake (eastern Maryland and Virginia) are the foreground. The largest tributary flowing into the Bay is the Potomac River; Washington, D.C. is visible where the river bends to the northwest. The urban-suburban corridor between Washington, D.C. and Baltimore to the north (toward the right on this view) shows well as the gray zone which extends from left (D.C. on the Potomac) to right (Baltimore on the Patapsco River embayment on the Chesapeake, near the upper right).
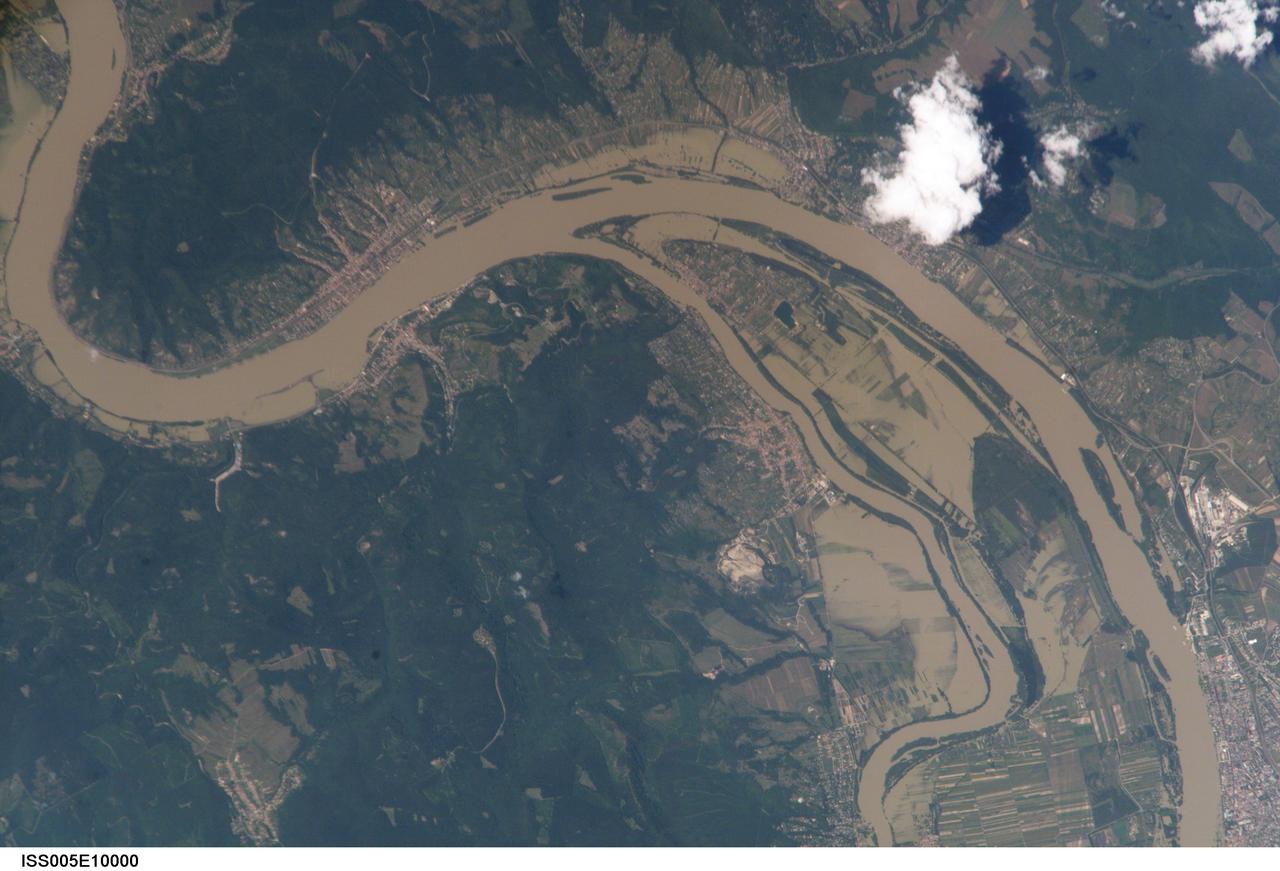
ISS005-E-10000 (18 August 2002) --- This is the first of two images recently released by the Earth Sciences and Image Analysis Laboratory at Johnson Space Center, showing the devastating European flooding in August. The images were captured by astronauts using a digital still camera onboard the International Space Station (ISS). The photographs show flooding around the Danube Bend area just north of Budapest near the city of Vác, Hungary. The flood peaked in Budapest the day after this photo was made, on August 19, at about 8.5 meters (28 feet), exceeding the previous 1965 flood record. This image shows the waters inundating farmland in the flood plain. Image no. ISS005-E-10926 shows the area four days later.
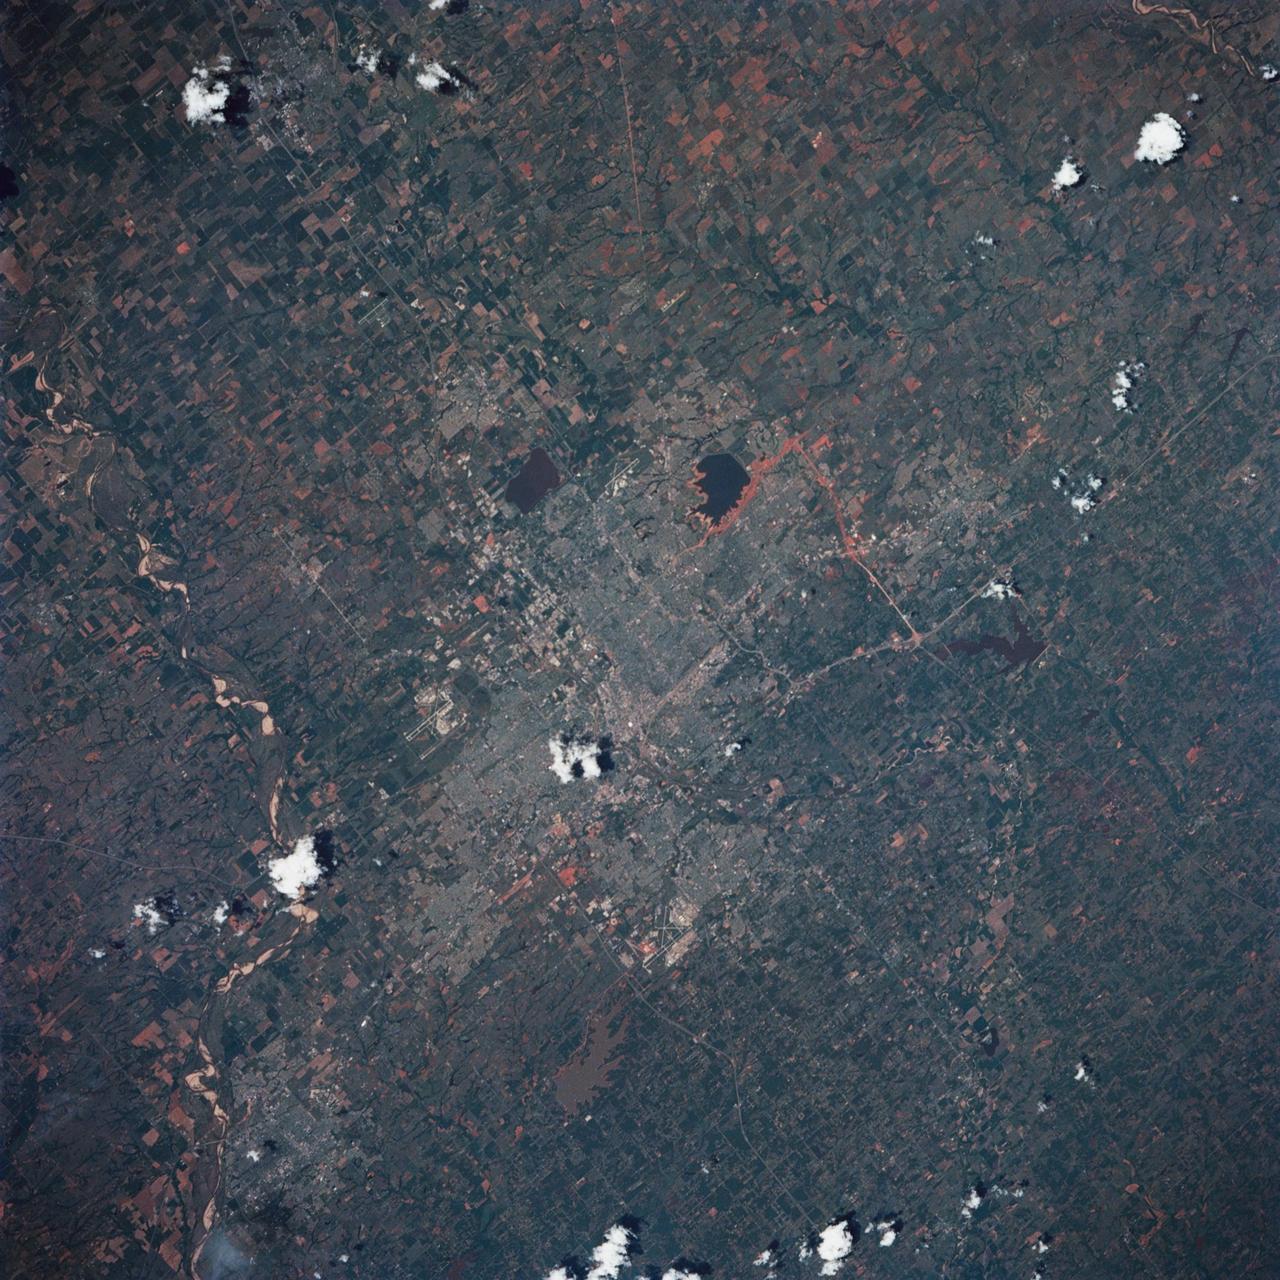
STS039-85-029 (28 April-6 May 1991) --- This 70mm frame is one of the best pictures of the Oklahoma City area from the manned space program, according to NASA photo experts studying STS-39 onboard photography. The central business district is near the center. Several municipalities are visible, along with thousands of acres of farmland. The towns of Norman and Moore and the South Canadian River are in the bottom (south). El Reno and Wiley Post Field off I-40W are just below center in lower left quadrant. Edmond is seen at the top (north). Tinker Field can be seen north of I-40E at right center. Lake Overholser shows recent spring rainfall northwest of the central business district.
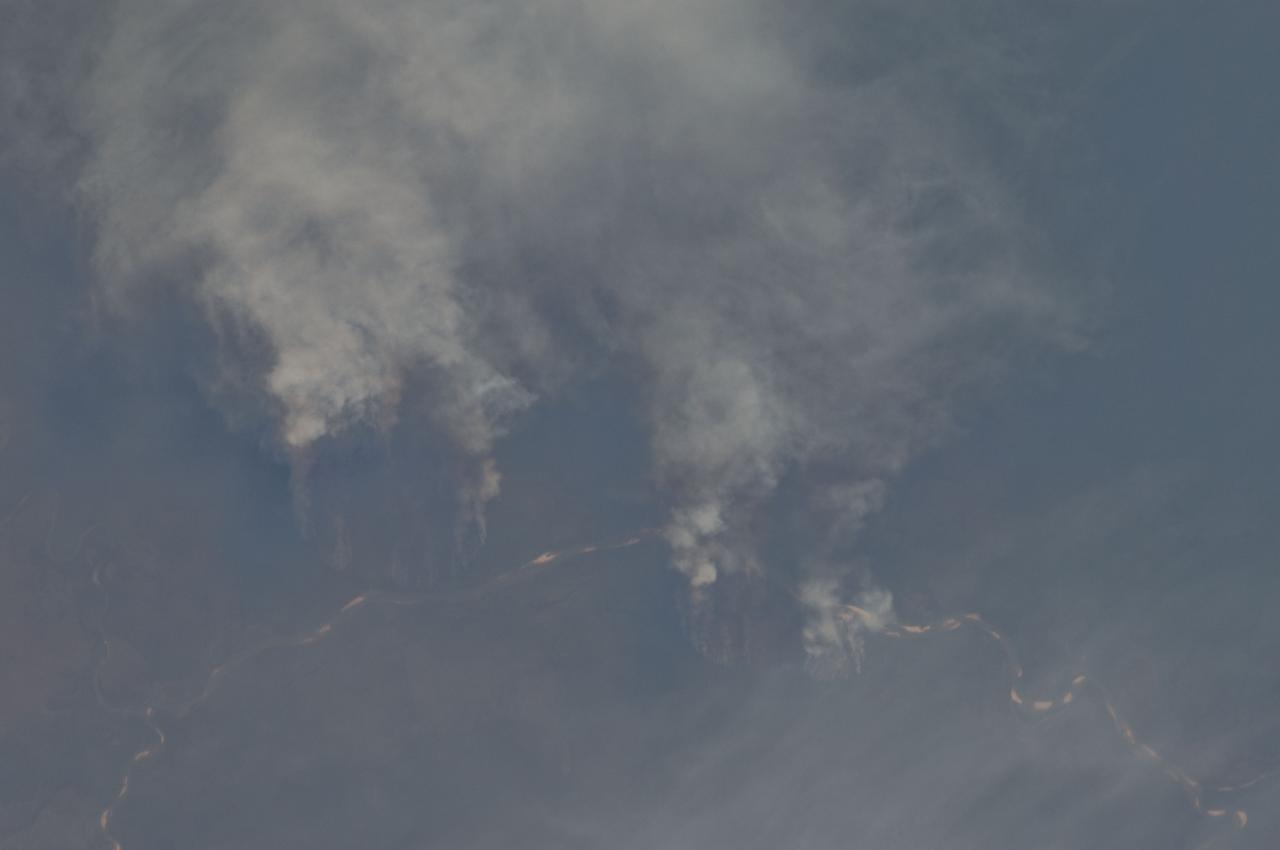
ISS029-E-008032 (17 Sept. 2011) --- Fires along the Rio Xingu, Brazil are featured in this image photographed by an Expedition 29 crew member on the International Space Station. The rain forest of South America, also known as ?Amazonia??the largest such forest on Earth?has been undergoing a continual and accelerated land use conversion process into farmlands (including pasture for livestock) since the early 1960s. This process has typically been achieved by clearing of the forest using fire ? ?slash and burn? ? followed by planting of crops. The generally infertile soils of the region make sustainable farming difficult; this drives more forest conversion into new farmland. The area of clearing can be considerable, and as the deforested regions are easily identifiable and measurable from space the rate of deforestation is likewise easy to track. This detailed photograph illustrates slash-and-burn forest clearing along the Xingu River (Rio) in the northeast of the state of Matto Grasso, Brazil. The perspective of this image allows for a striking visualization of both the horizontal position and extent of the fire lines next to the river, as well as providing a sense of the vertical structure of the smoke plumes due to the viewing angle and shadowing. Light colored areas within the river channel are sand bars, which show that the river is in its annual low-flow/ low water stage. For a sense of scale, the Xingu River channel within the view is approximately 63 kilometers long. Rivers in Amazonia are its natural highways, which may explain why the burning is occurring right next to the Xingu River, one of Amazonia?s largest. In recent years, preservation has gained traction in the region as a result of such considerations as new valuation of the ecosystem services provided by the forest, concerns about the impact of widespread burning on global climate change, and greater sensitivity to the ethnic and biological heritage of Amazonia.
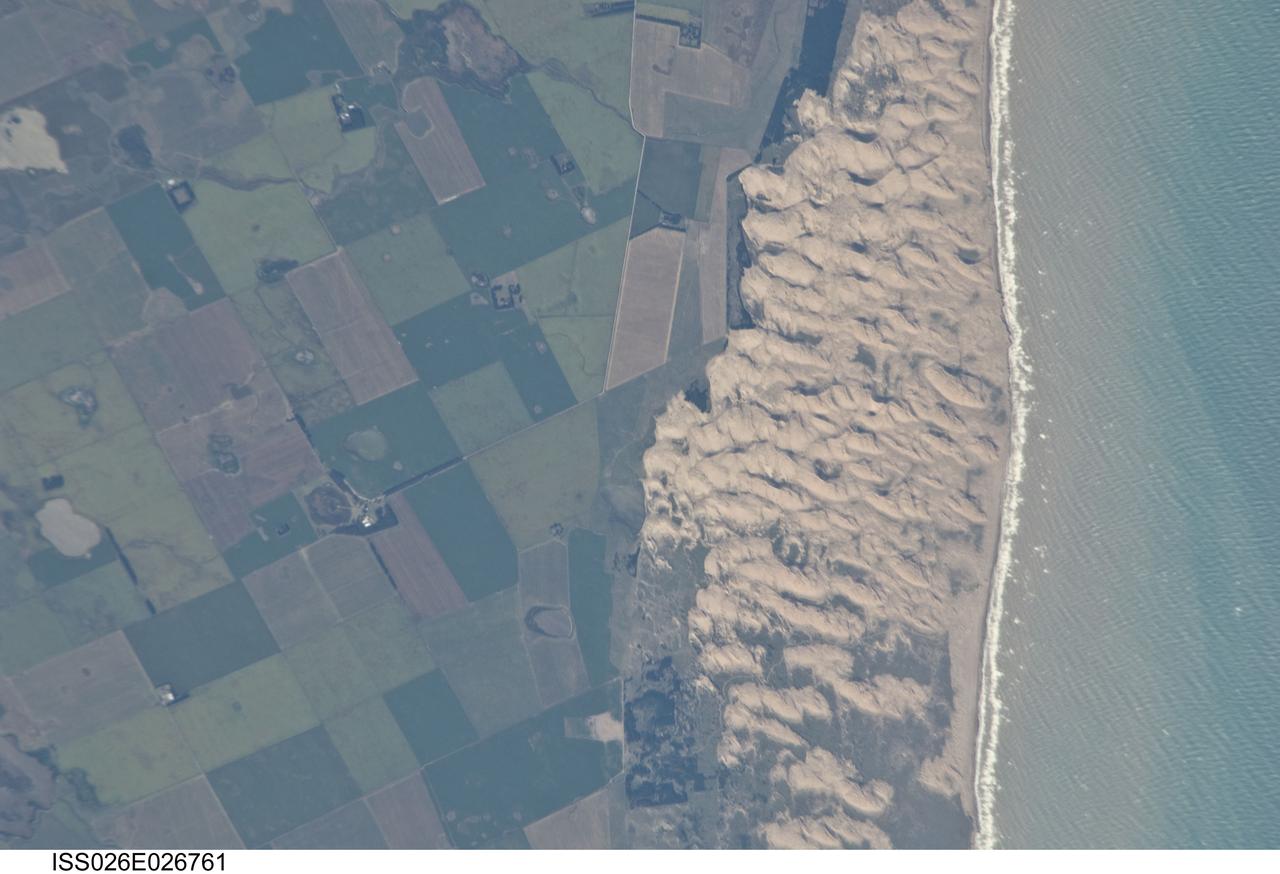
ISS026-E-026761 (13 Feb. 2011) --- Medano Blanco coastal dunes in Buenos Aires Province, Argentina are featured in this image photographed by an Expedition 26 crew member on the International Space Station. The Medano Blanco (White Dunes) are a well known recreational area 35 kilometers west of the twin cities of Nicochea-Quequen, one of the biggest ports in the province of Buenos Aires, central Argentina. The Medano Blanco dunes separate the Atlantic Ocean from intensive sunflower agricultural cropland, visible as the angular pattern of green and brown fields at left. The dune field extends 3.5 kilometers at its widest part. Narrow cordons of coastal dunes stretch along this part of Argentina’s coastline for hundreds of kilometers. Small streams, oriented towards the coast, cross the farmland at upper left. Water from these is dammed behind the dunes, and even within the dunes, where wetlands flourish. This is the drier southern part of Buenos Aires province near the more arid and windier border with Patagonia—one of the windiest places on Earth. The effect of strong westerly winds (blowing bottom to top in this slightly oblique image) can be seen everywhere in this detailed photograph. The dune sand is blown from local beaches onshore where it forms the dunes. The prominent dune ridge crests are oriented at right angles to the prevailing wind. Geologists suspect that erosion by wind has excavated numerous hollows which now dot the farmland as small shallow lakes. A stand of dark green trees has been planted on the upwind side of a health spa—located at the white dot (center left) which is the roof of a stately building—as a protective barrier against the wind. The white fringe along the seashore is formed from lines of breaking waves. Crossing swell trains can be seen offshore in the Atlantic Ocean. The curvature of the swell pattern offshore also shows the effect of the westerly wind, and indeed drives the local sea current in this area—slightly more prominent onshore swells approach the coast from the southeast. The light brown tint of seawater nearer the shore is the fine muddy fraction of the coastal sediment being washed seaward (after being stirred up by wave action) and then east by the current.
51J-143-126 (5 Oct. 1985) --- The vertical stabilizer of the Earth-orbiting Space Shuttle Atlantis serves to partially frame this scene of Metropolitan Houston. Hold photo with vertical tail at top so that north will be at top. America's fourth largest city, with its radiating highway network, lies at the junction between the East Texas piney woods, containing lakes Conroe and Livingston (near top center and top right, respectively), and the coastal prairie, now largely farmland (left side of frame). The coast stretches from the left at Freeport and the mouth of the Brazos River, past Galveston and Texas City, and the circle of the High Island Salt Dome (clearly seen at lower right near the Bolivar Peninsula), to Port Arthur on the Neches River (far right). Patterns of muddy and clear water are particularly well-displayed in Galveston and Trinity Bays, as well as in the Gulf of Mexico. With a close look, the Harris County Domed Stadium (Astrodome) can be recognized on Houston's south side. The NASA Johnson Space Center (JSC) and the Clear Lake City area are easily delineated some 25 miles southeast of downtown Houston. The scene was recorded on film by one of the STS-51J crewmembers using a handheld Hasselblad camera and 70mm film.
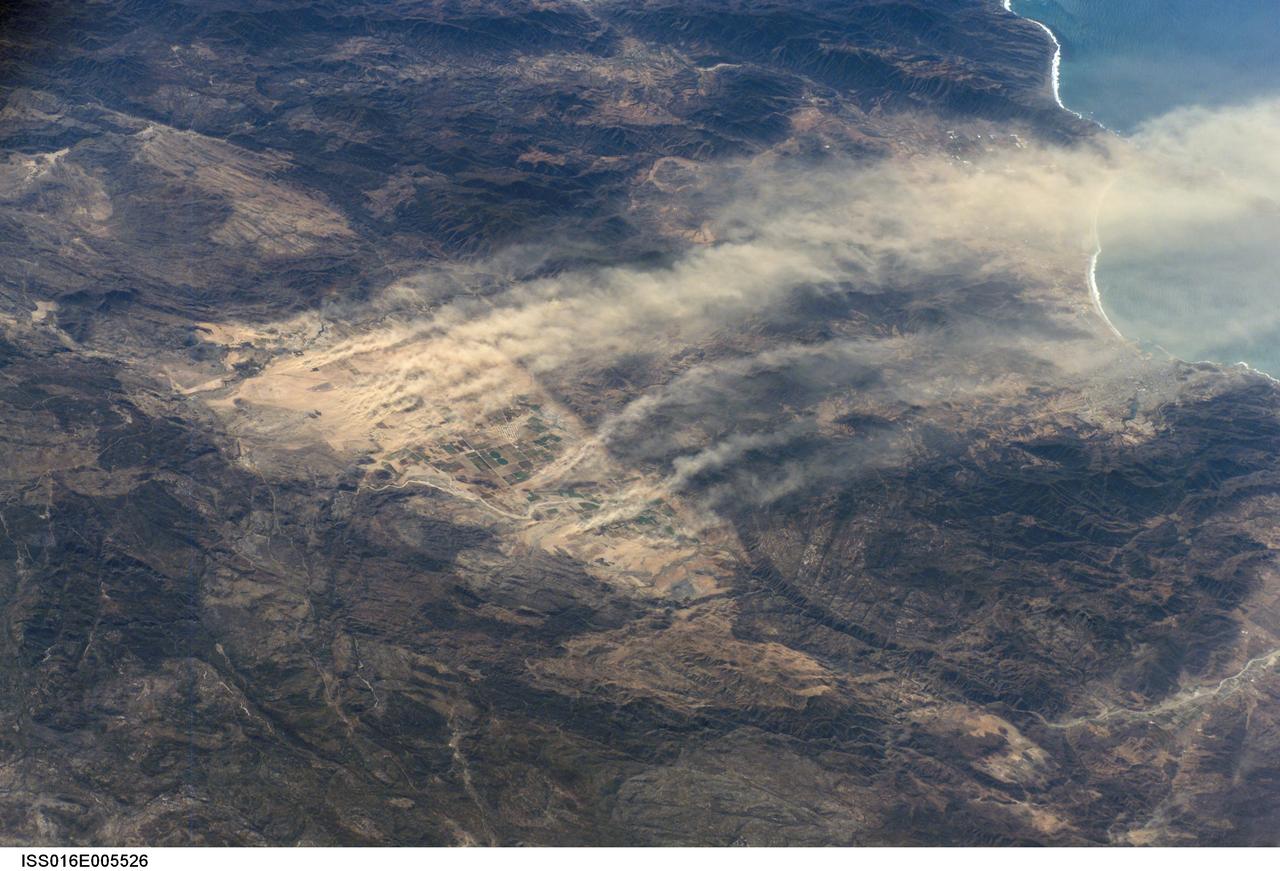
ISS016-E-005526 (21 Oct. 2007) --- Dust plumes, Baja California, Mexico are featured in this image photographed by an Expedition 16 crewmember on the International Space Station. A major dust plume and several minor plumes were raised during the strong, dry Santa Ana winds of October 2007. The light brown dust was transported west out to the Pacific Ocean (top right). According to meteorologists, Santa Ana winds, because they are warm, dry and strong, reduce soil moisture and generate frequent dust storms such as this. On this occasion, the Santa Anas supported the outbreak of fires in southern California resulting in significant damage to homes in hilly, wooded country. Dust plumes are known to start from relatively small, dust-prone areas. Here the plumes rise from the Real del Castillo agricultural valley--25 miles long, and part of Mexico's wine-producing region--surrounded by rocky hills in northern Baja California. Specifically, the dust is rising from spreads of loose sediment known as alluvial fans. Small streams from the local hills carry sediment with every rainstorm and deposit it at the foot of small canyons on the east side of the valley. It is notable that the vegetated farmland itself--the small rectangular pattern on the valley floor--protects the soil from the wind and is not producing dust plumes.
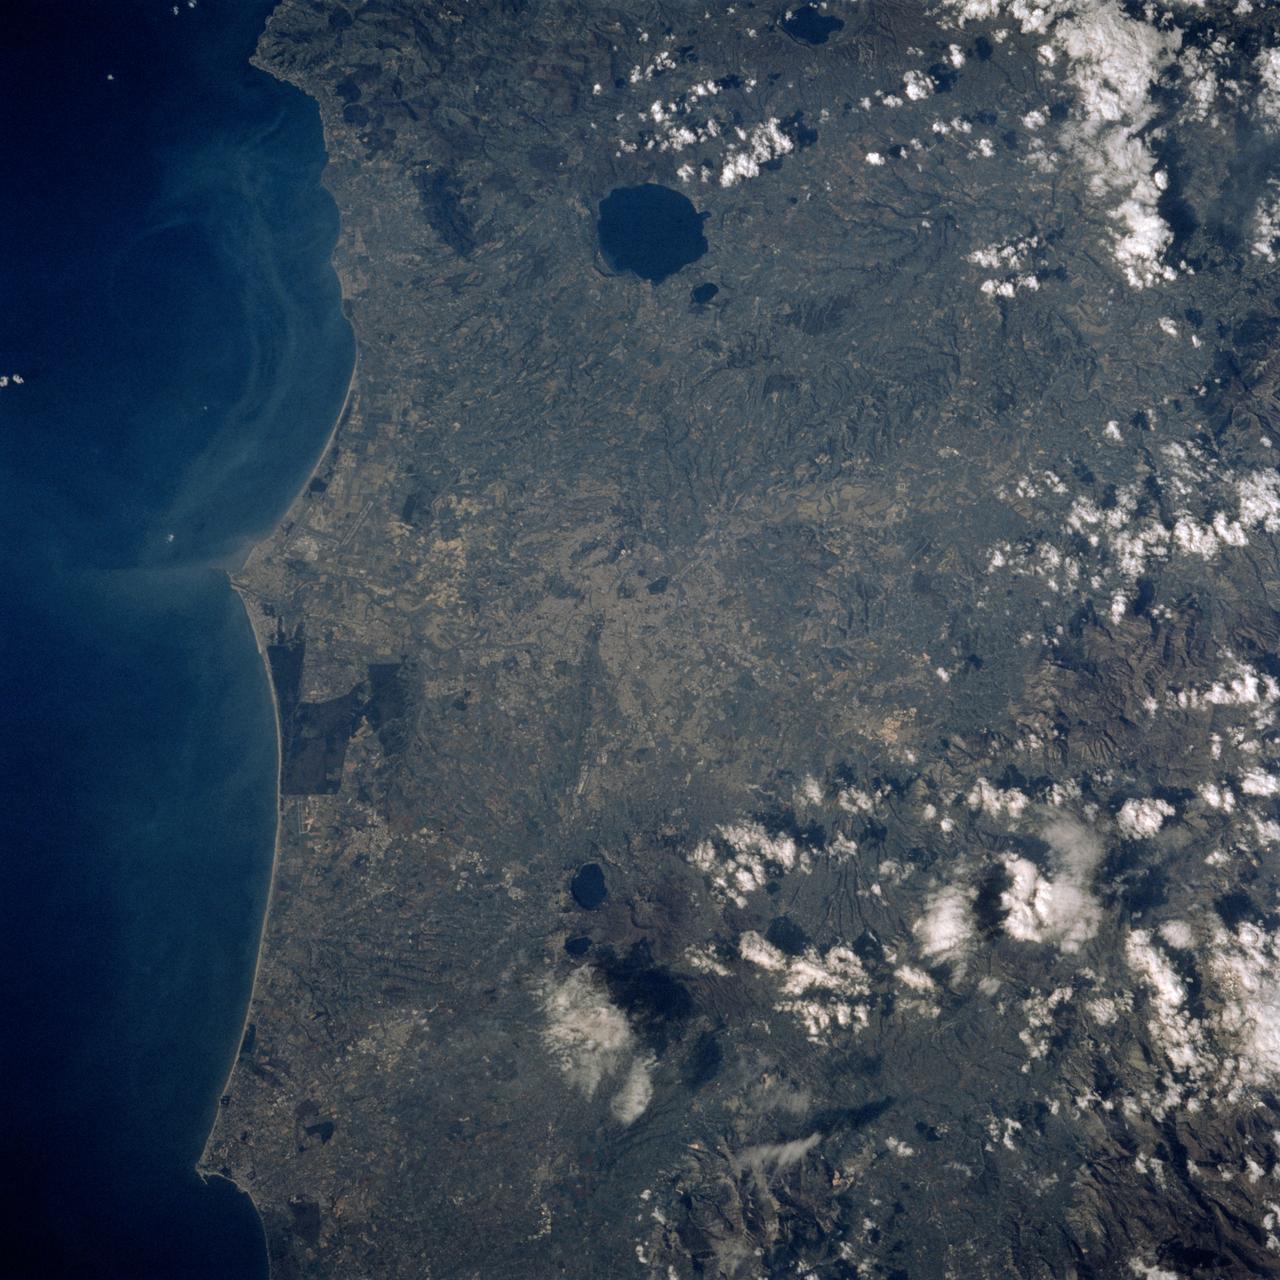
STS060-90-028 (3-11 Feb 1994) --- This view is centered over Rome and covers approximately 3,600 square miles. Anzio, the site of the January 22, 1944, Allied landing in Central Italy, is on the coast at the lower left. The coastal protuberance near the center is Ostia. This Roman Empire port on the Tiber River silted in and was covered over. It is now an archeological site and a tourist attraction. Southeast of the mouth of the Tiber is the Pontine Marsh. These marshlands were drained in the 1930's and have been converted to farmland. Volcanism formed the land in the region. It is evidenced in the circular caldera lakes visible. Castel Gandolfo, part of the Papal State, is on Lake Albano toward the bottom of the frame. Rome was founded during the Bronze Age on a river crossing. The road from the coast along the river was the main route for the early salt trade. The city became the capital of modern Italy in 1861. It has undergone explosive growth since World War II and now has a population of over three million people. Leonardo da Vinci (Fiumicino) Airport, the main international airport, is visible near the coast north of the Tiber River.
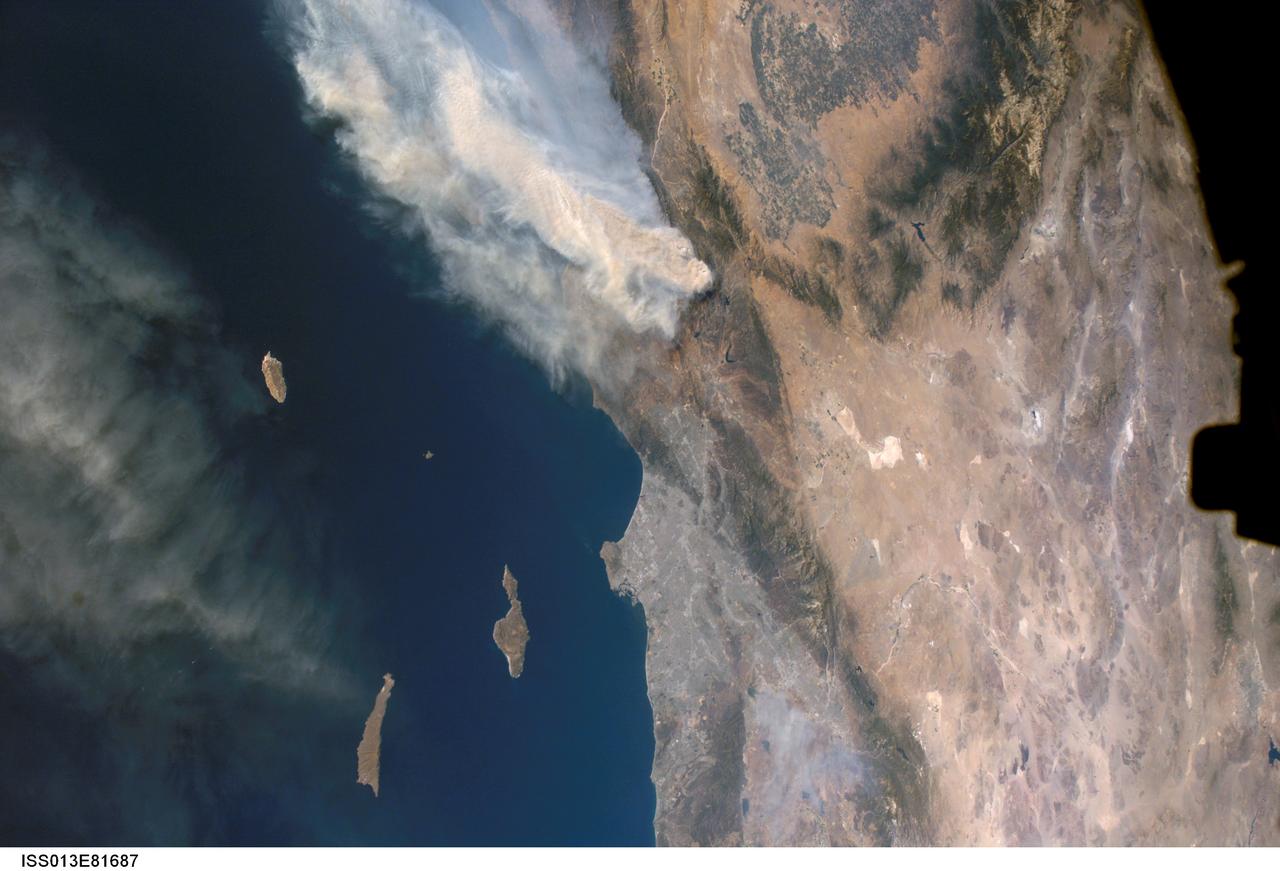
ISS013-E-81687 (17 Sept. 2006) --- A forest fire in southern California is featured in this image photographed by an Expedition 13 crewmember on the International Space Station. The day fire started in Los Padres National Forest north of Los Angeles on Sept. 4, 2006. Easterly winds on Sept. 17 blew the smoke west out to sea, and this wind shift was observed by station crewmembers. The forested mountains north of Los Angeles appear dark green, the smoke a dusky gray. Dense farmland at the south end of California's central valley is framed by the forested Sierra Nevada mountain range. White patches near the center of the view are dry lakes of the Mojave Desert, one of which acts as a landing site for the space shuttle. The dark irregular shape at image right is part of the space station. Death Valley and Las Vegas are visible at image right. The extent of the day fire smoke plume can be gauged from the gray urban region of greater Los Angeles (center) which stretches along 50 miles of coastline. The plume obscures the northern Channel Islands, but the southern Channel Islands are silhouetted against the ocean.
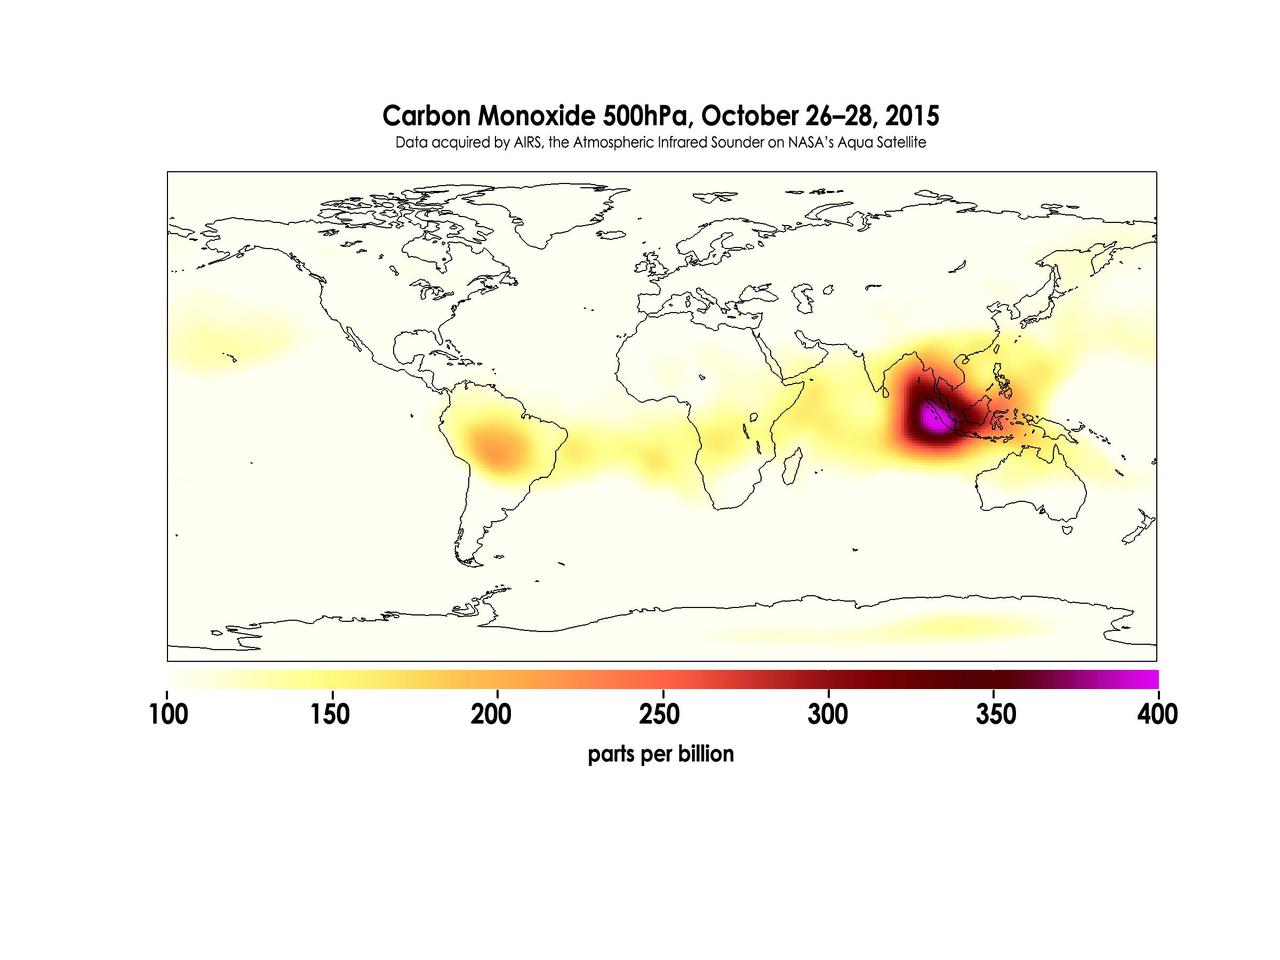
Widespread forest fires across Indonesia have burned tens of thousands of acres over three months, causing high levels of pollution, loss of life, and billions of dollars to the Indonesian government. It is estimated that more than 43 million people have been inhaling toxic fumes, and large parts of Indonesia have been placed in a state of emergency. Most of the fires are believed to have been set to clear farmland during the dry season, but a long term drought enhanced by El Niño conditions have contributed to the fires remaining unchecked due to lack of rain. These images made with data acquired by AIRS, the Atmospheric Infrared Sounder on NASA's Aqua Satellite, show the global concentration of carbon monoxide at the 500hPa pressure level, or approximately 18,000 feet (5,500 meters) altitude. The data are an average of measurements taken over three days, from October 14 through 16, and October 26 through 28, and the high concentration and large extent of the fires over Indonesia are quite apparent. While the scale for this image extends to 400 parts per billion, local values of carbon monoxide can be significantly higher. http://photojournal.jpl.nasa.gov/catalog/PIA20042
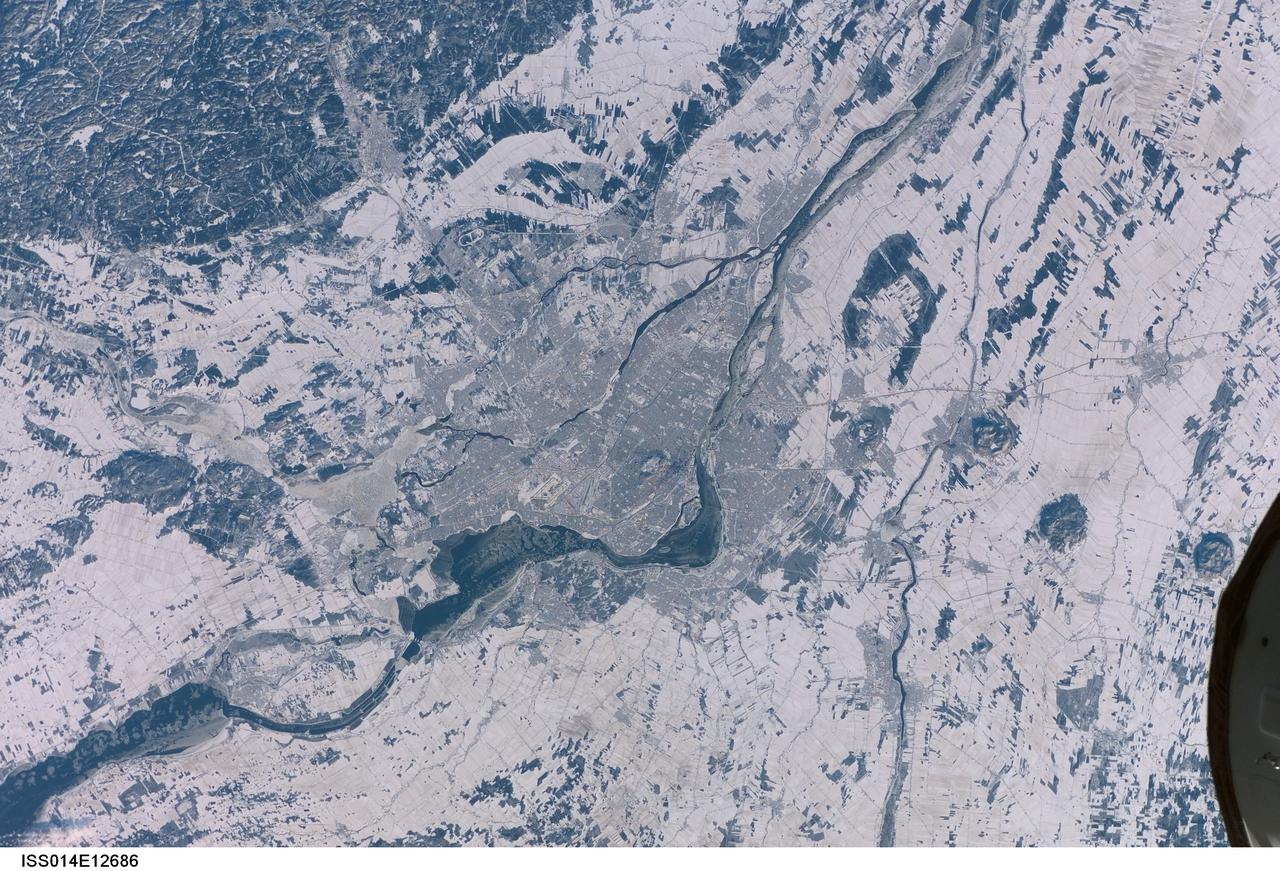
ISS014-E-12686 (21 Jan. 2007) --- This wintry scene of Quebec Province in Canada was photographed by one of the Expedition 14 crew members aboard the Earth-orbiting International Space Station. In 1535 Jacques Cartier landed on an island in the St. Lawrence River and named a 233 meter-high mountain Mount Royal. Montreal is a city on that island that grew up around the mountain. The city of Montreal (near center frame) is located on the Ile de Montreal to the northwest of the St. Lawrence river (the wider body of water). It was not until 1642 that Ville Marie, founded by missionaries, would officially become the city of Montreal. The cityscape contrasts well with the farmland and natural forests in this summer view. Today Montreal is the largest city in the province of Quebec, and is the second most populous metropolitan area in Canada -- in 1991 the population was just more than one million in the city and 3,127,242 in the metropolitan area. While owing its early growth to the fur trade, the city is a leading producer of aircraft, chemical and pharmaceutical products, and is a major petroleum production center. Nearly half of Canada's .8 billion aerospace industry is located in the Montreal area.
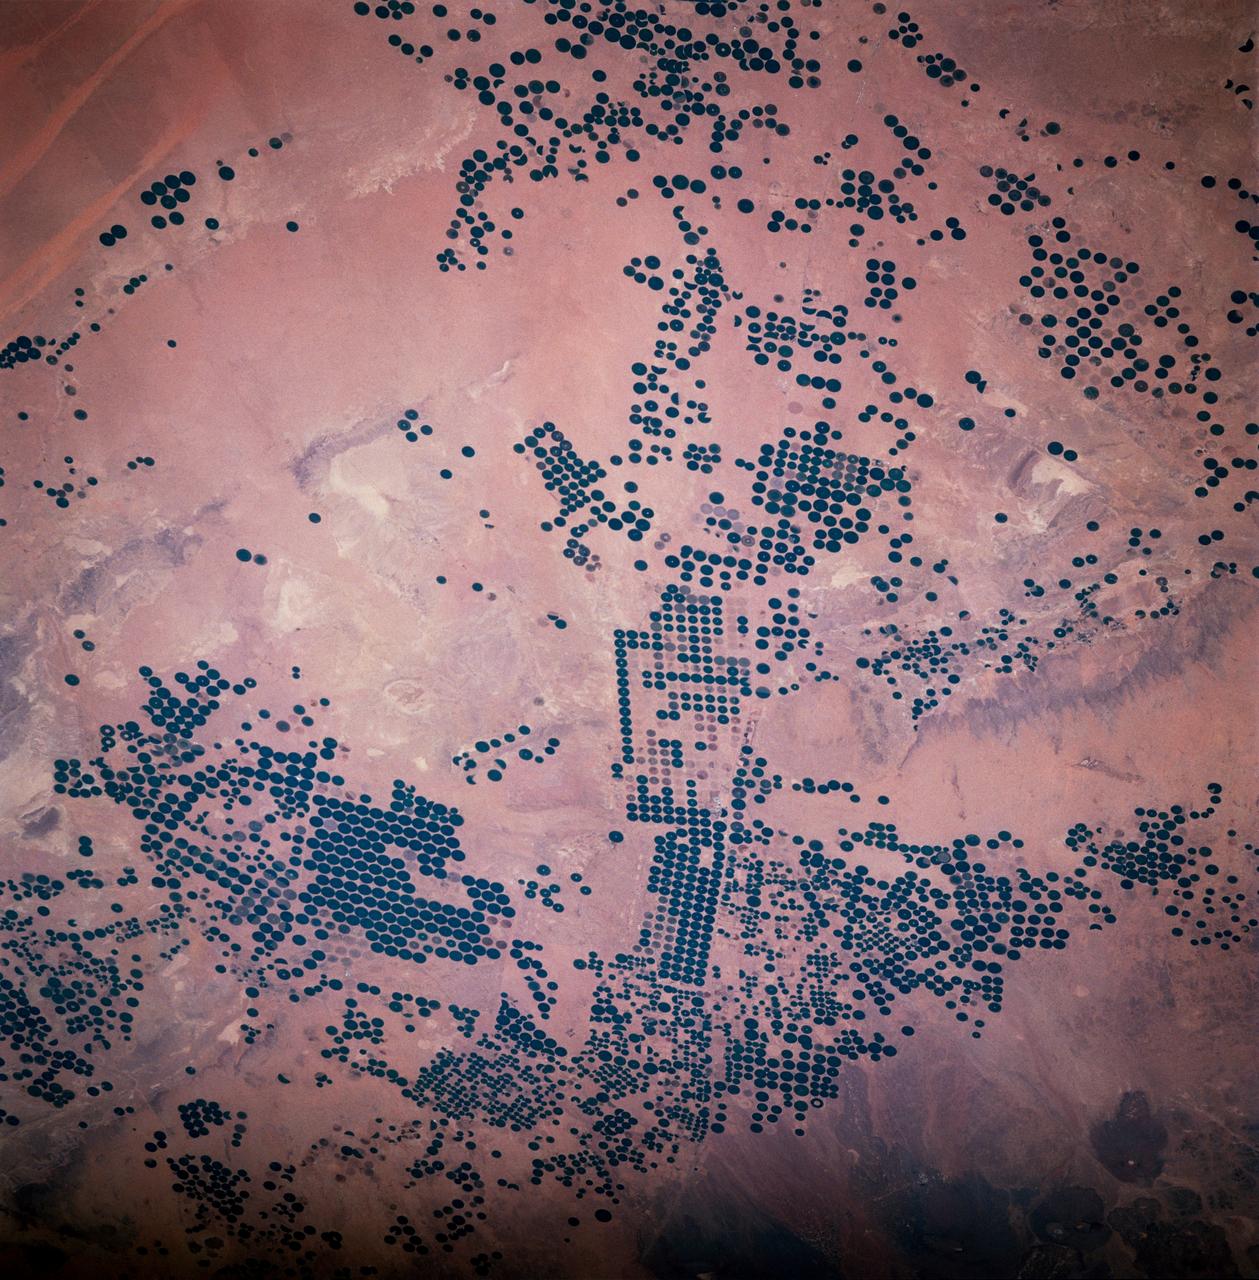
STS083-747-033 (4-8 April 1997) --- Center Pivot Irrigation, in Saudi Arabia. This irrigation project in Saudi Arabia is typical of many isolated irrigation projects scattered throughout the arid and hyper-arid regions of the Earth. Fossil water is mined from depths as great as 3,000 feet, pumped to the surface, and distributed via large center pivot irrigation feeds. The circles of green irrigated vegetation may comprise a variety of agricultural commodities from alfalfa to wheat. Diameters of the normally circular fields range from a few hundred meters to as much as 2 miles. The projects often trace out a narrow, sinuous, and seemingly random path. Actually, engineers generally seek ancient river channels now buried by the sand seas. The fossil waters mined in these projects accumulated during periods of wetter climate in the Pleistocene glacial epochs, between 10,000 to 2 million years ago, and are not being replenished under current climatic conditions. The projects, therefore, will have limited production as the reservoirs are drained. Water, of course, is the key to agriculture in Saudi Arabia. The Kingdom has implemented a multifaceted program to provide the vast supplies of water necessary to achieve the spectacular growth of the agricultural sector. A network of dams has been built to trap and utilize precious seasonal floods. Vast underground water reservoirs have been tapped through deep wells. Desalination plants have been built to produce fresh water from the sea for urban and industrial use, thereby freeing other sources for agriculture. Facilities have also been put into place to treat urban and industrial run-off for agricultural irrigation. These efforts collectively have helped transform vast tracts of the desert into fertile farmland. Land under cultivation has grown from under 400,000 acres in 1976 to more than 8 million acres in 1993.
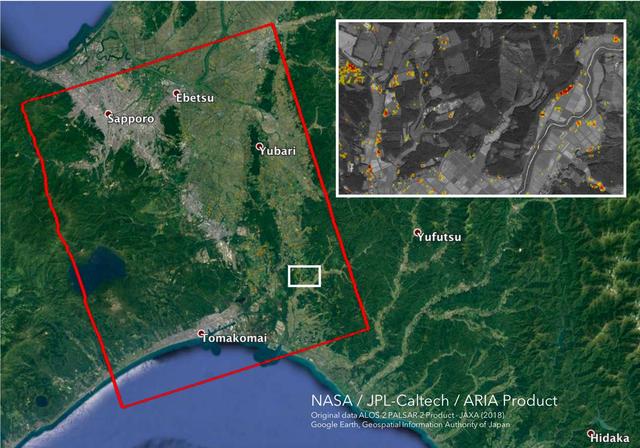
The Advanced Rapid Imaging and Analysis (ARIA) team at NASA's Jet Propulsion Laboratory in Pasadena, California, and Caltech, also in Pasadena, created this Damage Proxy Map (DPM) depicting areas in the southwestern part of Hokkaido, Japan, that are likely damaged as a result of the M6.6 September 5 earthquake in 2018 (shown by red and yellow pixels). The map is derived from synthetic aperture radar (SAR) images from the ALOS-2 satellites, operated by Japan Aerospace Exploration Agency (JAXA). The images were taken before and after the earthquake -- August 23 and September 6, respectively. The map covers an area of 70 by 57 kilometers, shown by the large red polygon. Each pixel measures about 30 meters across. The color variation from yellow to red indicates increasingly more significant ground surface change. Preliminary validation was done by comparing with the high-resolution airborne optical imagery provided by the Geospatial Information Authority of Japan. This damage proxy map should be used as guidance to identify damaged areas, and may be less reliable over vegetated areas. For example, pixels over vegetated areas and farmlands may be false positives, and the lack of colored pixels over vegetated areas does not necessarily mean no damage. The DPM was created by the NASA-JPL/Caltech ARIA team, and the ALOS-2 data were provided by JAXA. The algorithm development was carried out at JPL under a contract with NASA. https://photojournal.jpl.nasa.gov/catalog/PIA22696
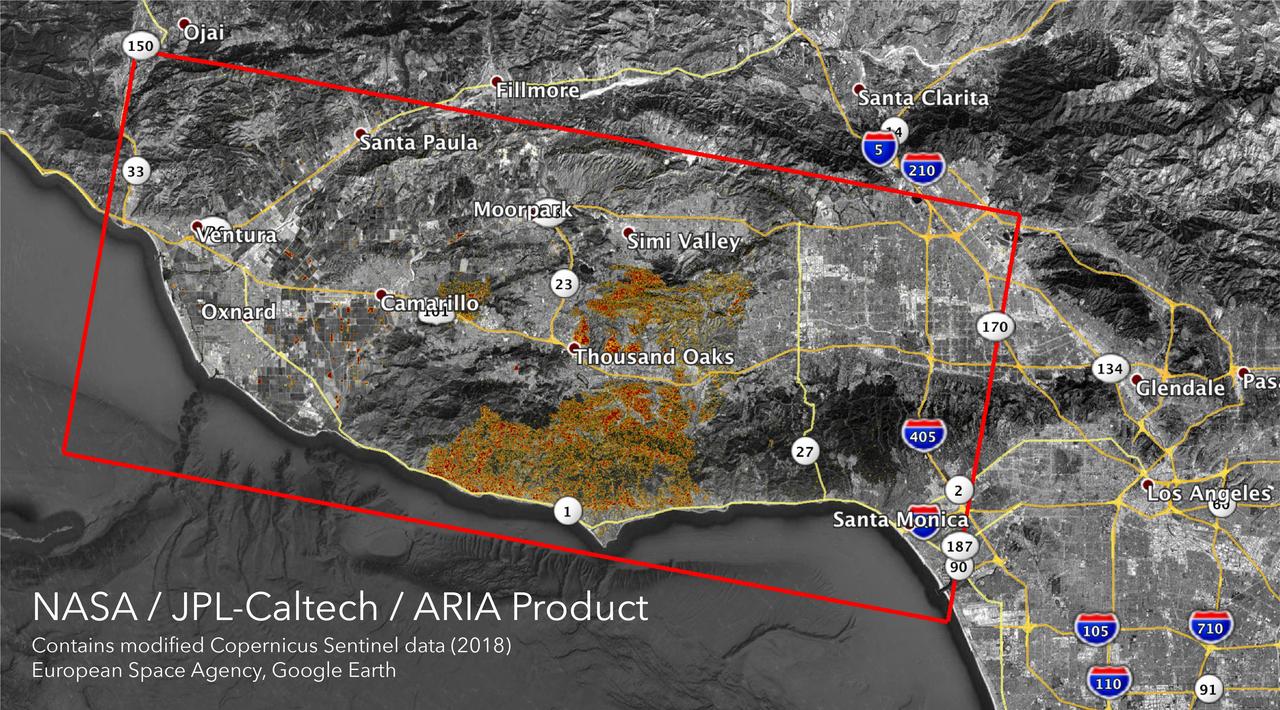
The Advanced Rapid Imaging and Analysis (ARIA) team at NASA's Jet Propulsion Laboratory in Pasadena, California, created these Damage Proxy Maps (DPMs) depicting areas in California likely damaged by the Woolsey and Camp Fires. They are derived from synthetic aperture radar (SAR) images from the Copernicus Sentinel-1 satellites, operated by the European Space Agency (ESA). The pre-event images for the Woolsey Fire in Southern California were taken before the fire on Oct. 30, 2018 and the post-event image was acquired during the fire on Nov. 11, 2018. The map covers an area of 50 miles x 25 miles (80 km x 40 km), indicated with the big red polygon. Each pixel measures about 33 yards x 33 yards (30 m x 30 m). The color variation from yellow to red indicates increasingly more significant ground surface change. The pre-event images for the Camp Fire in Northern California were taken on Nov. 4, 2018 and the post-event images were acquired during the fire on Nov. 10, 2018. The map covers an area of 55 miles x 48 miles (88 km x 77 km). As in the previous image, each pixel measures about 33 yards x 33 yards (30 m x 30 m). The color variation from yellow to red indicates increasingly more significant ground surface change. Preliminary validation for both maps was done by comparing approximate location data to Google's Crisismap. These damage proxy maps can be used as guidance to identify damaged areas with the understanding that they may be less reliable over vegetated areas including farmlands. For example, the scattered single colored pixels over vegetated areas may be false positives, and the lack of colored pixels over vegetated areas does not necessarily mean no damage. https://photojournal.jpl.nasa.gov/catalog/PIA22816
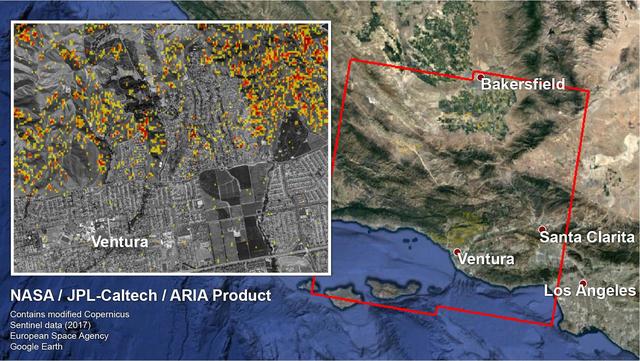
The Advanced Rapid Imaging and Analysis (ARIA) team at NASA's Jet Propulsion Laboratory in Pasadena, California, and Caltech, also in Pasadena, created a Damage Proxy Map (DPM) depicting areas in Southern California that are likely damaged (shown by red and yellow pixels) as a result of recent wildfires, including the Thomas Fire in Ventura and Santa Barbara Counties, highlighted in the attached image taken from the DPM. The map is derived from synthetic aperture radar (SAR) images from the Copernicus Sentinel-1 satellites, operated by the European Space Agency (ESA). The images were taken before (Nov. 28, 2017, 6 a.m. PST) and after (Dec. 10, 2017, 6 a.m. PST) the onset of the fires. The map covers an area of 107 by 107 miles (172 by 172 kilometers), shown by the large red polygon. Each pixel measures about 33 yards (30 meters) across. The color variation from yellow to red indicates increasingly more significant ground surface change. Preliminary validation was done by comparing the map to optical satellite imagery from DigitalGlobe. This damage proxy map should be used as guidance to identify damaged areas, and may be less reliable over vegetated areas. For example, the colored pixels seen over mountainous areas may seem a little scattered even though the reality could be that the contiguous areas were burned. Patches of farmland can also appear as signals due to plowing or irrigation. The full map is available to download from https://aria-share.jpl.nasa.gov/events/20171210-SoCal_Fire/. https://photojournal.jpl.nasa.gov/catalog/PIA22191
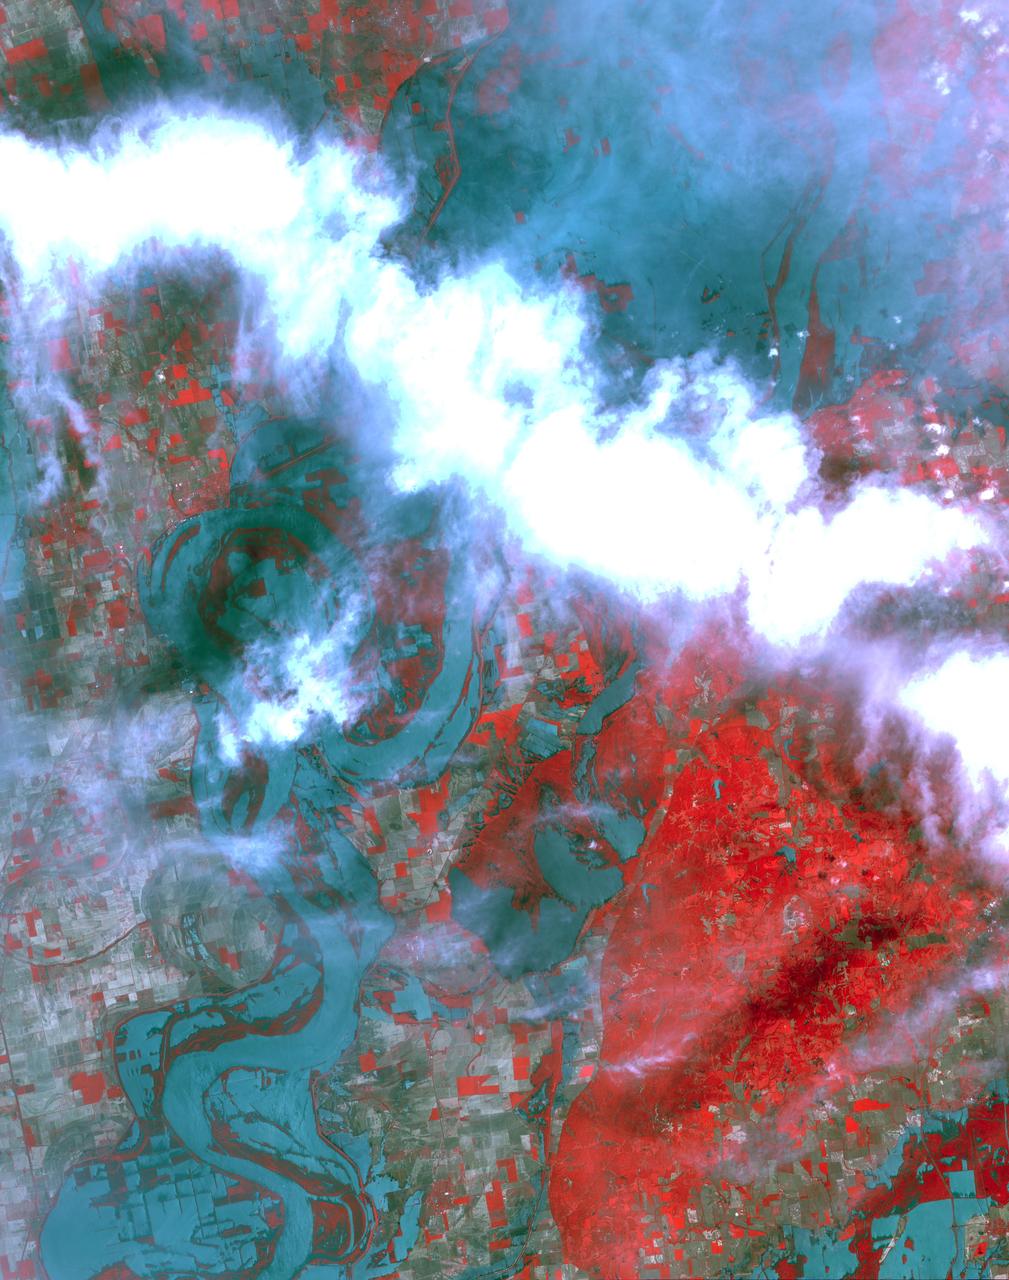
This is a false-color L-band image of an area near Glasgow, Missouri, centered at about 39.2 degrees north latitude and 92.8 degrees west longitude. The image was acquired by the Spaceborne Imaging Radar-C and X-band Synthetic Aperture Radar (SIR-C/X-SAR) aboard the space shuttle Endeavour on its 50th orbit on October 3, 1994. The false-color composite was made by displaying the L-band (horizontally transmitted and received) return in red; the L-band (horizontally transmitted and vertically received) return in green; and the sum of the two channels in blue. The area shown is approximately 37 kilometers by 25 kilometers (23 miles by 16 miles). The radar data, coupled with pre-flood aerial photography and satellite data and post-flood topographic and field data, are being used to evaluate changes associated with levee breaks in landforms, where deposits formed during the widespread flooding in 1993 along the Missouri and Mississippi Rivers. The distinct radar scattering properties of farmland, sand fields and scoured areas will be used to inventory floodplains along the Missouri River and determine the processes by which these areas return to preflood conditions. The image shows one such levee break near Glasgow, Missouri. In the upper center of the radar image is a region covered by several meters of sand, shown as blue regions below the bend in the river. West (left) of this dark area, a blue gap in the levee tree canopy can be seen, showing the area where the levee failed. Radar data such as these can help scientists more accurately assess the potential for future flooding in this region and how that might impact surrounding communities. http://photojournal.jpl.nasa.gov/catalog/PIA01744
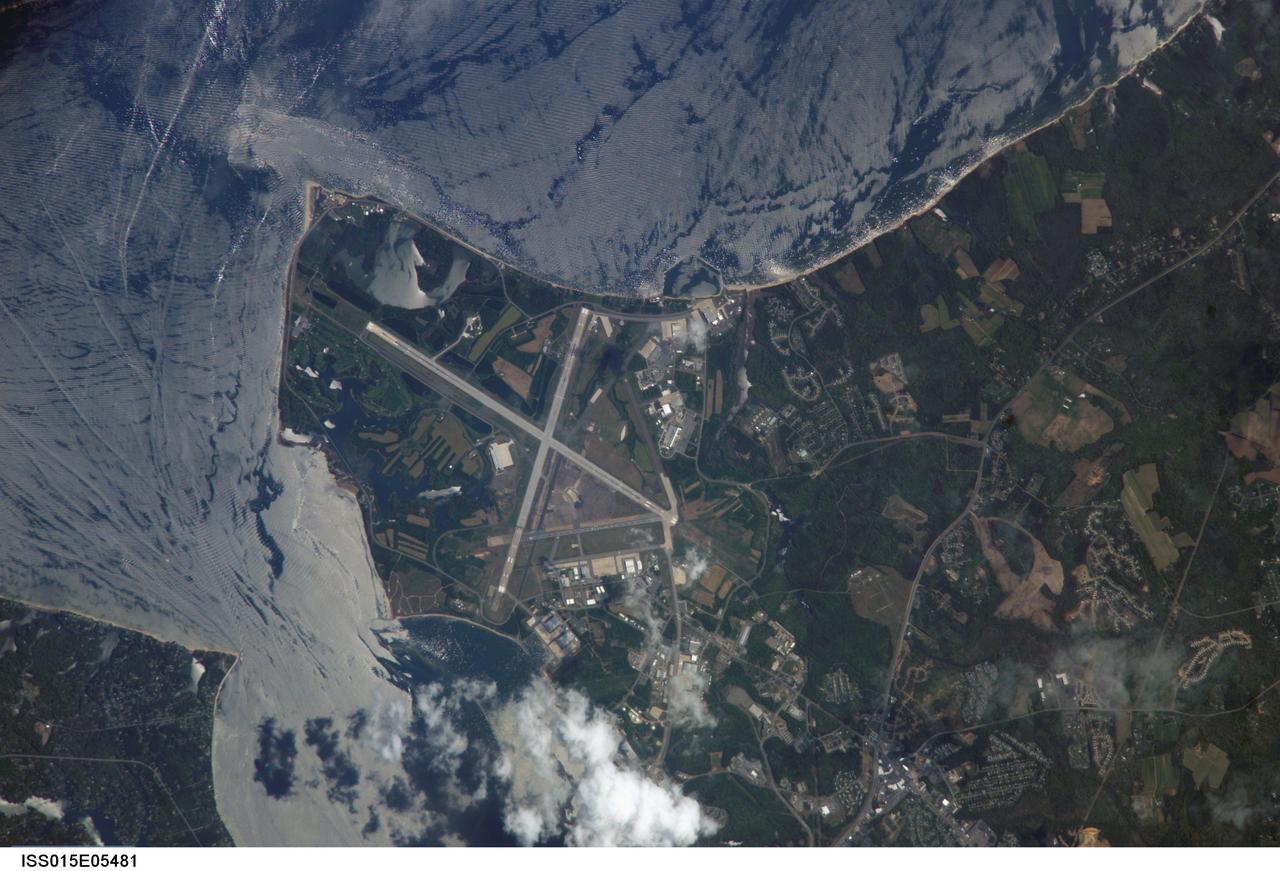
ISS015-E-05481 (28 April 2007) --- Patuxent River Naval Air Station, Maryland is featured in this image photographed by an Expedition 15 crewmember on the International Space Station. The Patuxent River Naval Air Station - or NAS Patuxent River -- is located on a small peninsula, bordered by the Patuxent River to the north-northeast and Chesapeake Bay to the east and southeast. The air station was commissioned in 1943, replacing farmlands that had occupied the peninsula less than a year earlier. The primary purpose of "Pax River" (as the site is known by the US Navy) was to consolidate geographically-dispersed air testing facilities that existed in the US prior to World War II into a central location. The NAS Patuxent River is now the primary center for naval air technology research, development, testing, and support, as well as being the location of the Navy Test Pilot School. The NAS Patuxent River is used frequently as a geographic reference point and training target by station crews. This view illustrates why --the distinctive pattern of the airfield runways and the station's location in Chesapeake Bay make it easy to spot from orbit, and provides sharp land cover boundaries for camera focusing practice. This particular image also captures surface water current patterns around the peninsula. Wind and wave-roughened water surfaces appear silver-gray due to increased reflectance of light back towards the camera (sunglint), whereas dark blue water patches indicate water smoothed by the presence of oils and surfactants. A zone of mixing from converging shoreline currents extends northeast into the bay from Cedar Point.
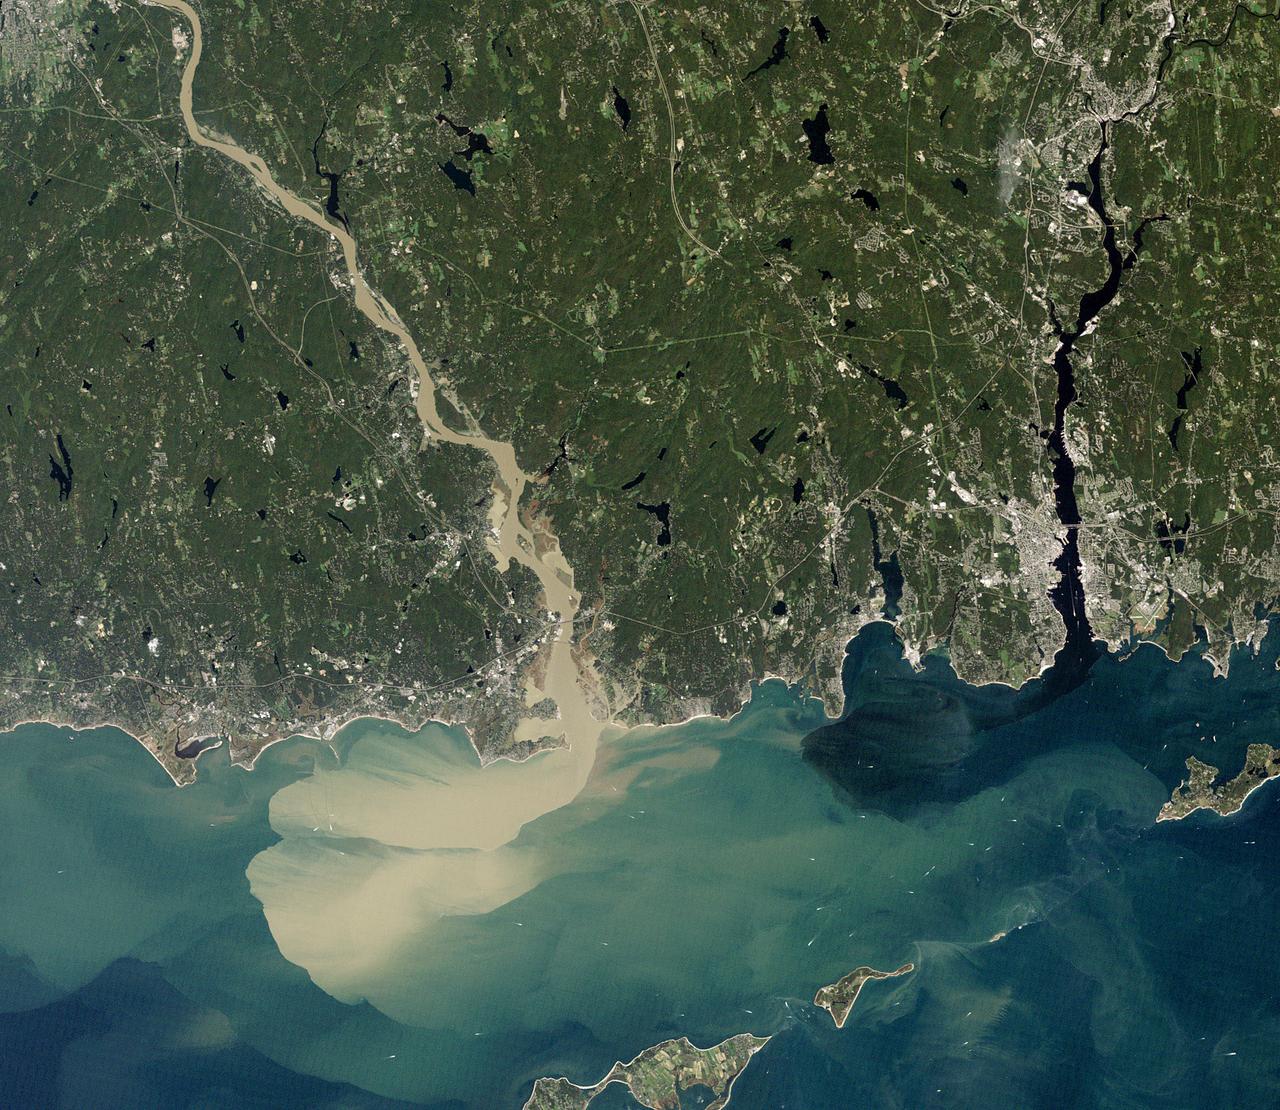
NASA image acquired September 2, 2011 To download the full high res go to: <a href="http://earthobservatory.nasa.gov/IOTD/view.php?id=52059" rel="nofollow">earthobservatory.nasa.gov/IOTD/view.php?id=52059</a> Nearly a week after Hurricane Irene drenched New England with rainfall in late August 2011, the Connecticut River was spewing muddy sediment into Long Island Sound and wrecking the region's farmland just before harvest. The Thematic Mapper on the Landsat 5 satellite acquired this true-color satellite image on September 2, 2011. With its headwaters near the Canadian border, the Connecticut River drains nearly 11,000 square miles (28,500 square kilometers) and receives water from at least 33 tributaries in Vermont, New Hampshire, Massachusetts, and Connecticut. The 410-mile river—New England's longest—enters Long Island Sound near Old Lyme, Connecticut, and is estimated to provide 70 percent of the fresh water entering the Sound. When Irene blew through the region on August 27-28, substantial portions of the Connecticut River watershed received more than 6 to 8 inches (15-20 centimeters) of rainfall, and several locations received more than 10 inches (25 centimeters). Whole towns were cut off from overland transportation—particularly upstream in Vermont, which suffered its worst flooding in 80 years. Thousands of people saw their homes flooded, if not washed off their foundations, at a time of year when rivers are usually at their lowest. Preliminary estimates of river flow at Thompsonville, Connecticut, (not shown in this image) reached 128,000 cubic feet per second (cfs) on August 30, nearly 64 times the usual flow (2,000 cfs) for early fall and the highest flow rate since May 1984. At the mouth of the river—where flow is tidal, and therefore not gauged—the peak water height reached 6.9 feet (2.1 meters) above sea level, almost a foot higher than at any time in the past 10 years. According to Suzanne O'Connell, an environmental scientist working along the Connecticut River at Wesleyan University, the torrent of water coursing through New England picked up silt and clay from the river valleys, giving it the tan color shown in the image above. At Essex, Connecticut, the turbidity (muddiness) of the water was 50 times higher than pre-Irene values. To the east, the Thames River appears to be carrying very little sediment at all on September 2. According to O'Connell, the Thames "drains glaciated terrain, so fine sediment was removed long ago." Most of the land surface in the Thames basin is "just bedrock, till, and glacial erratics." Unlike the Connecticut, areas within the Thames watershed only received 2 to 4 inches of rain in most locations. The flooding that occurred in the aftermath of Hurricane Irene inundated farmland in Massachusetts and Connecticut just before harvest time, the Associated Press noted. Crops were drowned under inches to feet of water. The substantial amounts of soil, sediment, and water deposited on land during the flood could also pose trouble for farmers in coming seasons. "It's notable that whole segments of river bank are just gone," said Andrew Fisk of the Connecticut River Watershed Council. "That's not just loss of sediment. That's land disappearing down river." <b>NASA Earth Observatory image by Robert Simmon, using Landsat 5 data from the U.S. Geological Survey Global Visualization Viewer. Caption by Michael Carlowicz, with interpretation help from Suzanne O'Connell, Wesleyan University, and Andrew Fisk, Connecticut River Watershed Council.</b> Instrument: Landsat 5 - TM Credit: <b><a href="http://www.earthobservatory.nasa.gov/" rel="nofollow"> NASA Earth Observatory</a></b> <b><a href="http://www.nasa.gov/centers/goddard/home/index.html" rel="nofollow">NASA Goddard Space Flight Center</a></b> enables NASA’s mission through four scientific endeavors: Earth Science, Heliophysics, Solar System Exploration, and Astrophysics. Goddard plays a leading role in NASA’s accomplishments by contributing compelling scientific knowledge to advance the Agency’s mission. <b>Follow us on <a href="http://twitter.com/NASA_GoddardPix" rel="nofollow">Twitter</a></b> <b>Like us on <a href="http://www.facebook.com/pages/Greenbelt-MD/NASA-Goddard/395013845897?ref=tsd" rel="nofollow">Facebook</a></b> <b>Find us on <a href="http://web.stagram.com/n/nasagoddard/?vm=grid" rel="nofollow">Instagram</a></b>
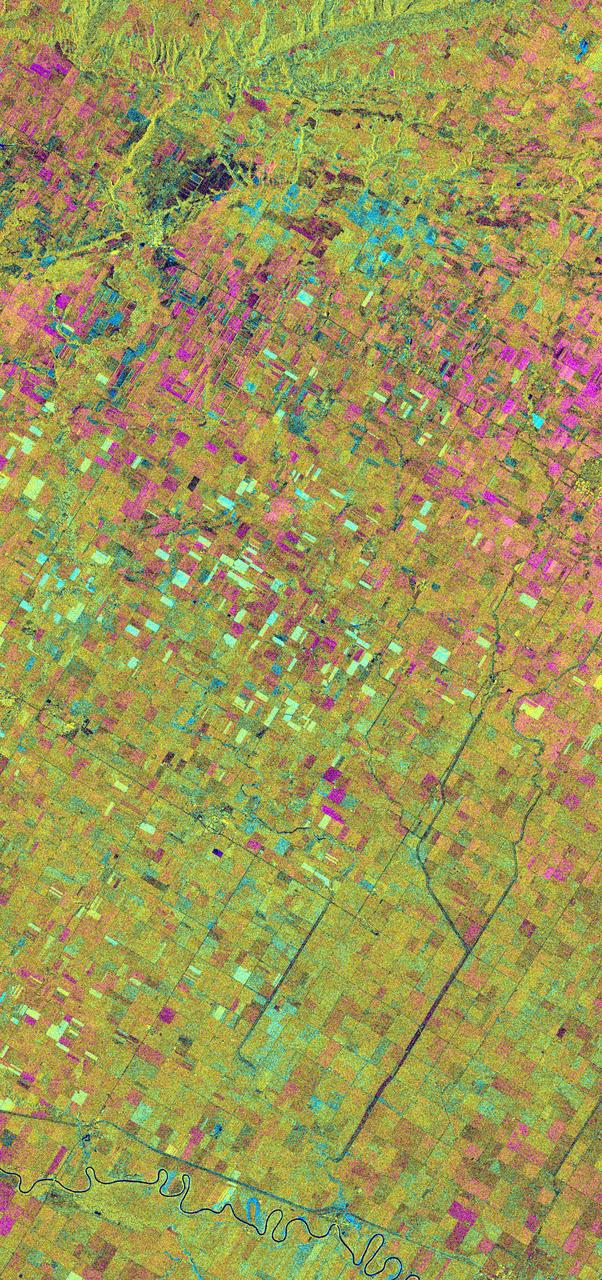
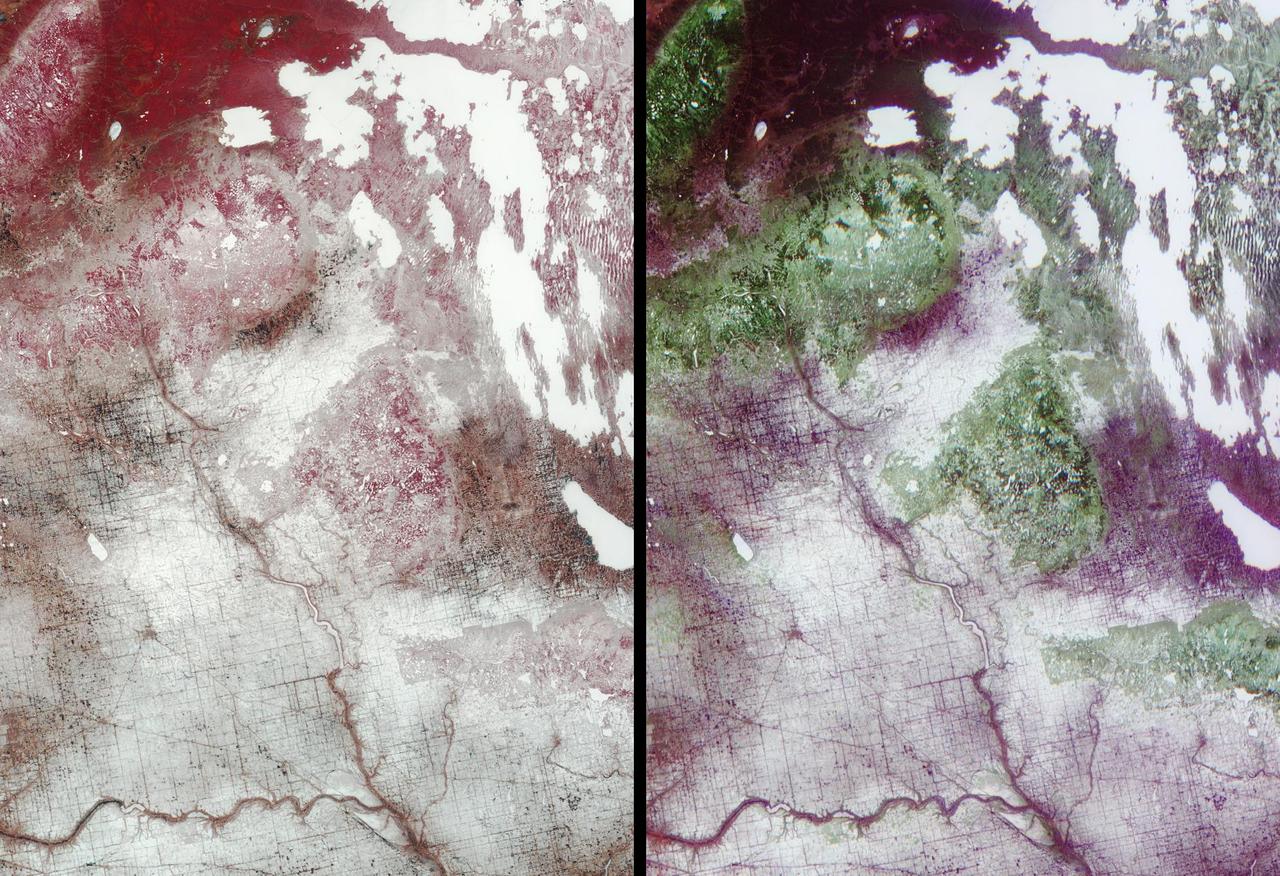
This is an X-band seasonal image of the Altona test site in Manitoba, Canada, about 80 kilometers (50 miles) south of Winnipeg. The image is centered at approximately 49 degrees north latitude and 97.5 degrees west longitude. This image was acquired by the Spaceborne Imaging Radar-C and X-band Synthetic Aperture Radar (SIR-C/X-SAR) aboard the space shuttle Endeavour on April 11, 1994, during the first flight of the radar system, and on October 2, 1994, during the second flight of SIR-C/X-SAR. The image channels have the following color assignments: red represents data acquired on April 11, 1994; green represents data acquired on October 2, 1994; blue represents the ratio of the two data sets. The test site is located in the Red River Basin and is characterized by rich farmland where a variety of crops are grown, including wheat, barley, canola, corn, sunflowers and sugar beets. This SIR-C/X-SAR research site is applying radar remote sensing to study the characteristics of vegetation and soil moisture. The seasonal comparison between the April and October 1994 data show the dramatic differences between surface conditions on the two dates. At the time of the April acquisition, almost all agricultural fields were bare and soil moisture levels were high. In October, however, soils were drier and while most crops had been harvested, some standing vegetation was still present. The areas which are cyan in color are dark in April and bright in October. These represent fields of standing biomass (amount of vegetation in a specified area) and the differences in brightness within these cyan fields represent differences in vegetation type. The very bright fields in October represent standing broadleaf crops such as corn, which had not yet been harvested. Other standing vegetation which has less biomass, such as hay and grain fields, are less bright. The magenta indicates bare soil surfaces which were wetter (brighter) in April than in October. The variations in brightness of the magenta indicate differences in the degree of soil moisture change and differences in surface roughness. This seasonal composite demonstrates the sensitivity of radar to changes in agricultural surface conditions such as soil moisture, tillage, cropping and harvesting. http://photojournal.jpl.nasa.gov/catalog/PIA01742
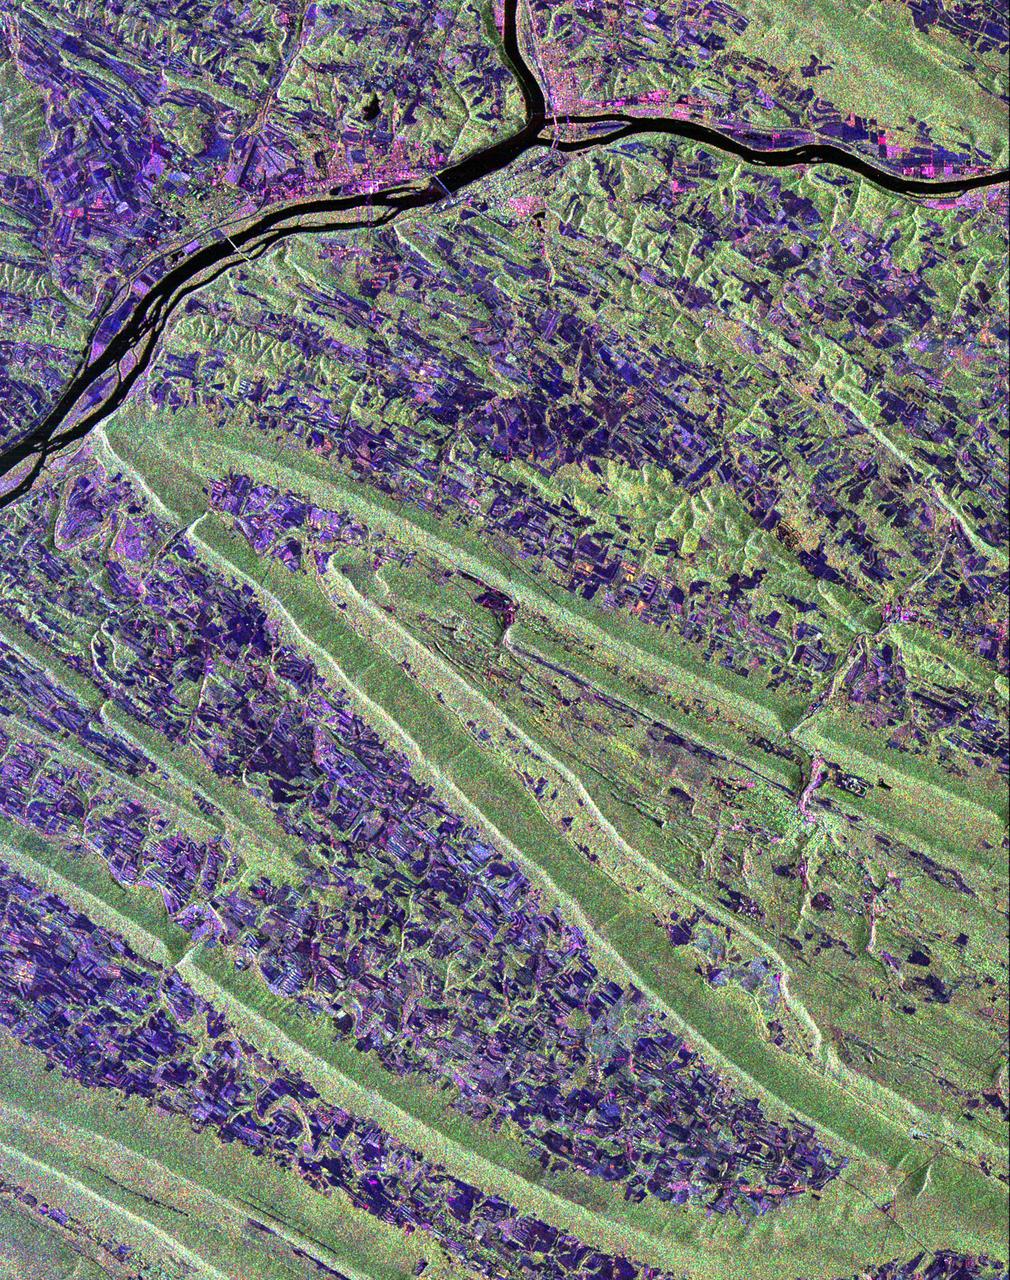
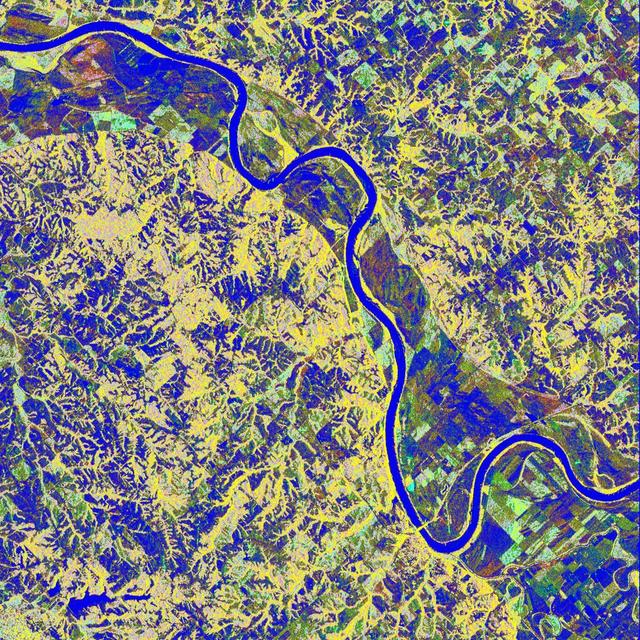
Scientists are using this radar image of the area surrounding Sunbury, Pennsylvania to study the geologic structure and land use patterns in the Appalachian Valley and Ridge province. This image was collected on October 6, 1994 by the Spaceborne Imaging Radar-C/ X-Band Synthetic Aperture Radar (SIR-C/X-SAR) on orbit 102 of the space shuttle Endeavour. The image is centered on latitude 40.85 degrees North latitude and 76.79 degrees West longitude. The area shown is approximately 30.5 km by 38 km. (19 miles by 24 miles). North is towards the upper right of the image. The Valley and Ridge province occurs in the north-central Appalachians, primarily in Pennsylvania, Maryland, and Virginia. It is an area of adjacent valleys and ridges that formed when the Appalachian mountain were created some 370 to 390 million years ago. During the continental collision that formed the Appalachians, the rocks in this area were pushed from the side and buckled much like a rug when pushed from one end. Subsequent erosion has produced the landscape we see in this image. The more resistant rocks, such as sandstone, form the tops of the ridges which appear as forested greenish areas on this image. The less resistant rocks, such as limestone, form the lower valleys which are cleared land and farm fields and are purple in this image. Smaller rivers and streams in the area flow along the valleys and in places cut across the ridges in "water gaps." In addition to defining the geography of this region, the Valley and Ridge province also provides this area with natural resources. The valleys provide fertile farmland and the folded mountains form natural traps for oil and gas accumulation; coal deposits are also found in the mountains. The colors in the image are assigned to different frequencies and polarizations of the SIR-C radar as follows: red is L-band horizontally transmitted, horizontally received; green is L-band horizontally transmitted, vertically received; blue is C-band horizontally transmitted, horizontally received. The river junction near the top of the image is where the West Branch River flows into the Susquehanna River, which then flows to the south-southwest past the state capitol of Harrisburg, 70 km (43 miles) to the south and not visible in this image. The town of Sunbury is shown along the Susquehanna on the east just to the southeast of the junction with West Branch. Three structures that cross the Susquehanna; the northern and southern of these structures are bridges and middle structure is the Shamokin Dam which confines the Susquehanna just south of the junction with West Branch. The prominent S-shaped mountain ridge in the center of the image is, from north to south, Little Mountain (the top of the S), Line Mountain (the middle of the S), and Mahantango Mountain (the bottom of the S). http://photojournal.jpl.nasa.gov/catalog/PIA01306
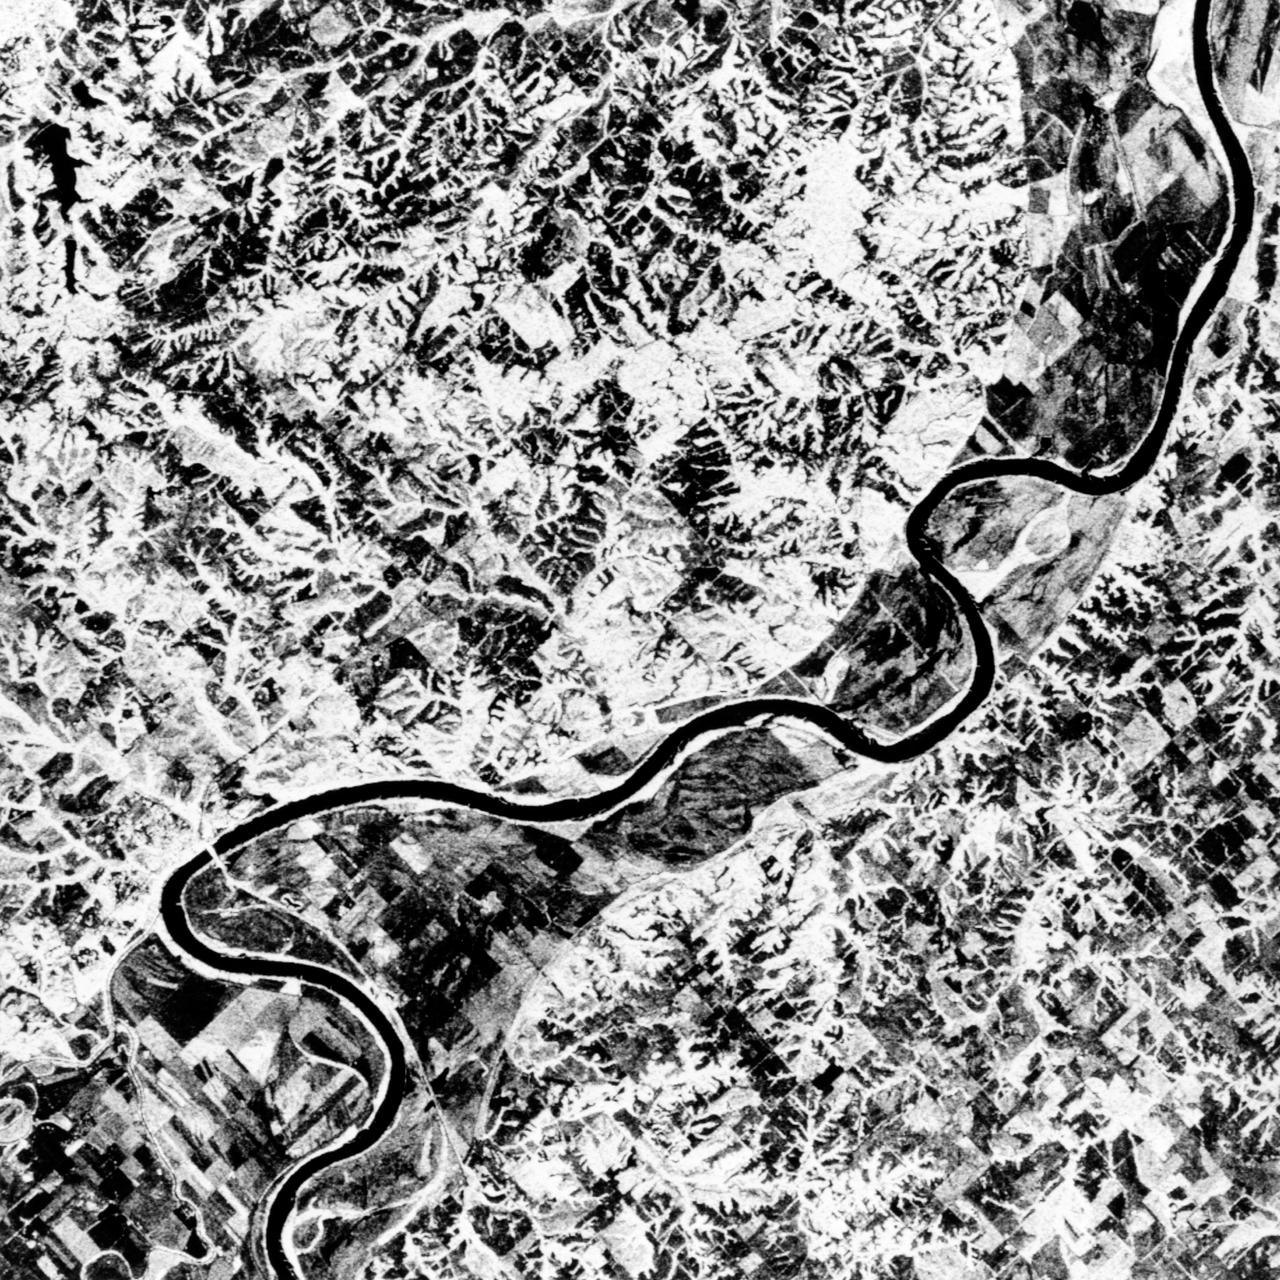
STS068-S-055 (7 October 1994) --- This is a false-color L-Band image of an area near Glasgow, Missouri, centered at about 39.2 degrees north latitude and 92.8 degrees west longitude. The image was acquired using the L-Band radar channel (horizontally transmitted and received and horizontally transmitted and vertically received) polarization's combined. The data were acquired by the Spaceborne Imaging Radar-C/X-Band Synthetic Aperture Radar (SIR-C/X-SAR) aboard the Space Shuttle Endeavour on orbit 50 on October 3, 1994. The area shown is approximately 37 by 25 kilometers (23 by 16 miles). The radar data, coupled with pre-flood aerial photography and satellite data and post-flood topographic and field data, are being used to evaluate changes associated with levee breaks in land forms, where deposits formed during the widespread flooding in 1993 along the Missouri and Mississippi Rivers. The distinct radar scattering properties of farmland, sand fields and scoured areas will be used to inventory flood plains along the Missouri River and determine the processes by which these areas return to preflood conditions. The image shows one such levee break near Glasgow, Missouri. In the upper center of the radar image, below the bend of the river, is a region covered by several meters of sand, shown as dark regions. West (left) of the dark areas, a gap in the levee tree canopy shows the area where the levee failed. Radar data such as these can help scientists more accurately assess the potential for future flooding in this region and how that might impact surrounding communities. Spaceborne Imaging Radar-C/X-Band Synthetic Aperture Radar (SIR-C/X-SAR) is part of NASA's Mission to Planet Earth. The radars illuminate Earth with microwaves, allowing detailed observations at any time, regardless of weather or sunlight conditions. SIR-C/X-SAR uses the three microwave wavelengths: the L-Band (24 centimeters), C-Band (6 centimeters) and X-Band (3 centimeters). The multi-frequency data will be used by the international scientific community to better understand the global environment and how it is changing. The SIR-C/X-SAR data, complemented by aircraft and ground studies, will give scientists clearer insights into those environmental changes which are caused by nature and those changes which are induced by human activity. SIR-C was developed by NASA's Jet Propulsion Laboratory (JPL). X-SAR was developed by the Dornier and Alenia Spazio companies for the German space agency, Deutsche Agentur fuer Raumfahrtangelegenheiten (DARA), and the Italian space agency, Agenzia Spaziale Italiana (ASI), with the Deutsche Forschungsanstalt fuer Luft und Raumfahrt e.v. (DLR), the major partner in science, operations and data processing of X-SAR. (P-44734)
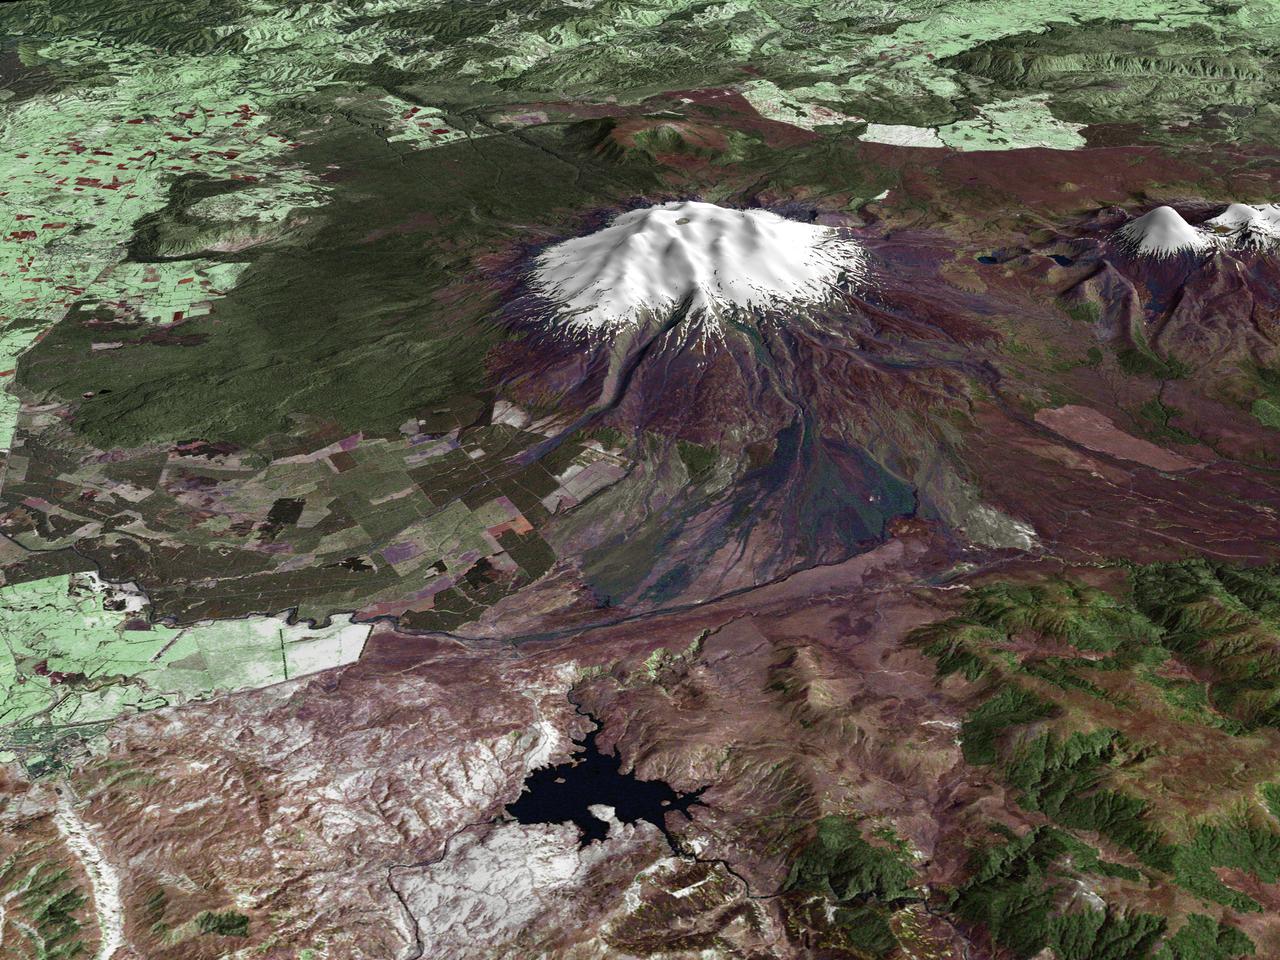
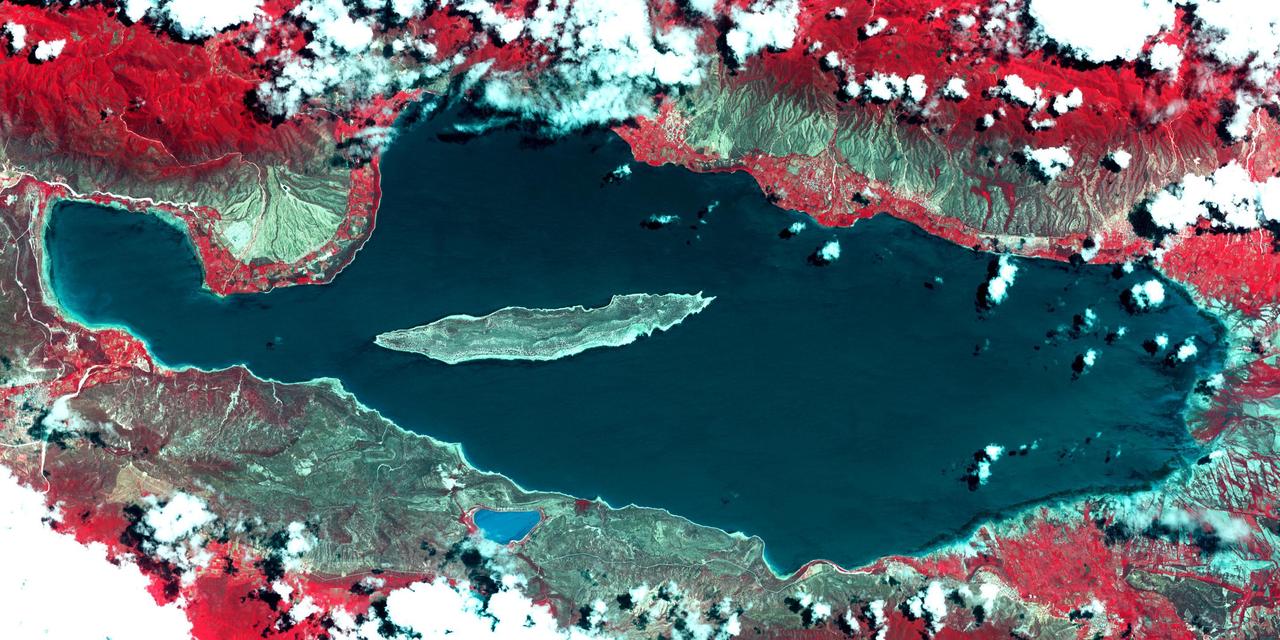
All around the world, people live in places where the threat of natural disaster is high. On the North Island of New Zealand, the Mount Ruapehu volcano is just such a threat. A towering, active stratovolcano (the classic cone-shaped volcano), snow-capped Ruapehu Volcano is pictured in this enhanced-color image. The image is made from topography data collected by the Shuttle Radar Topography Mission aboard the Space Shuttle Endeavour, launched on February 11, 2000, and imagery collected by the Landsat satellite on October 23, 2002. Ruapehu is one of New Zealand’s most active volcanoes, with ten eruptions since 1861. The eruptions aren’t the only threat from the volcano, however. Among the most serious threats is a volcanic mudflow called a lahar. In between eruptions, a lake forms in the volcano’s caldera from melting snow. If a previous eruption has deposited a dam of ash, rocks and mud in the lake’s natural overflow point, then the lake becomes dangerously full, held back only by the temporary dam. In this scene, the lake is nestled among the ridges at the top of the volcano. Eventually, the dam gives way and a massive flow of mud and debris churns down the mountain toward farmland and towns below. Scientists estimate that Ruapehu has experienced 60 lahars in the last 150 years. A devastating lahar in 1953 killed more than 150 people, who died when a passenger train plunged into a ravine when a railroad bridge was taken out by the lahar. The flank of the volcano below the lake is deeply carved by the path of previous lahars; the gouge can be seen just left of image center. Currently scientists in the region are predicting that the lake will overflow in a lahar sometime in the next year. There is great controversy about how to deal with the threat. News reports from the region indicate that the government is planning to invest in a high-tech warning system that will alert those who might be affected well in advance of any catastrophic release. Others feel that the government should combat the threat through engineering at the top of the mountain, for example, by undertaking a controlled release of the lake. Credit Landsat data provided courtesy of the University of Maryland Global Land Cover Facility Landsat processing by Laura Rocchio, Landsat Project Science Office SRTM 3-arcsecond elevation data courtesy of SRTM Team NASA/JPL/NIMA Visualization created by Earth Observatory staff. <b><a href="http://www.nasa.gov/centers/goddard/home/index.html" rel="nofollow">NASA Goddard Space Flight Center</a></b> enables NASA’s mission through four scientific endeavors: Earth Science, Heliophysics, Solar System Exploration, and Astrophysics. Goddard plays a leading role in NASA’s accomplishments by contributing compelling scientific knowledge to advance the Agency’s mission. <b>Follow us on <a href="http://twitter.com/NASA_GoddardPix" rel="nofollow">Twitter</a></b> <b>Join us on <a href="http://www.facebook.com/pages/Greenbelt-MD/NASA-Goddard/395013845897?ref=tsd" rel="nofollow">Facebook</a></b>