Faulting
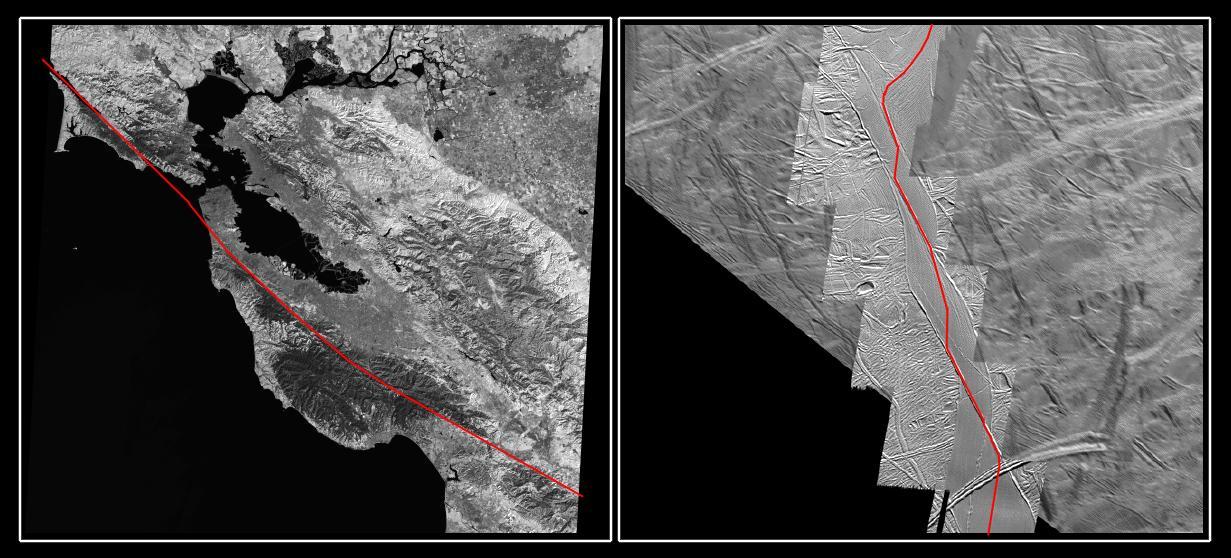
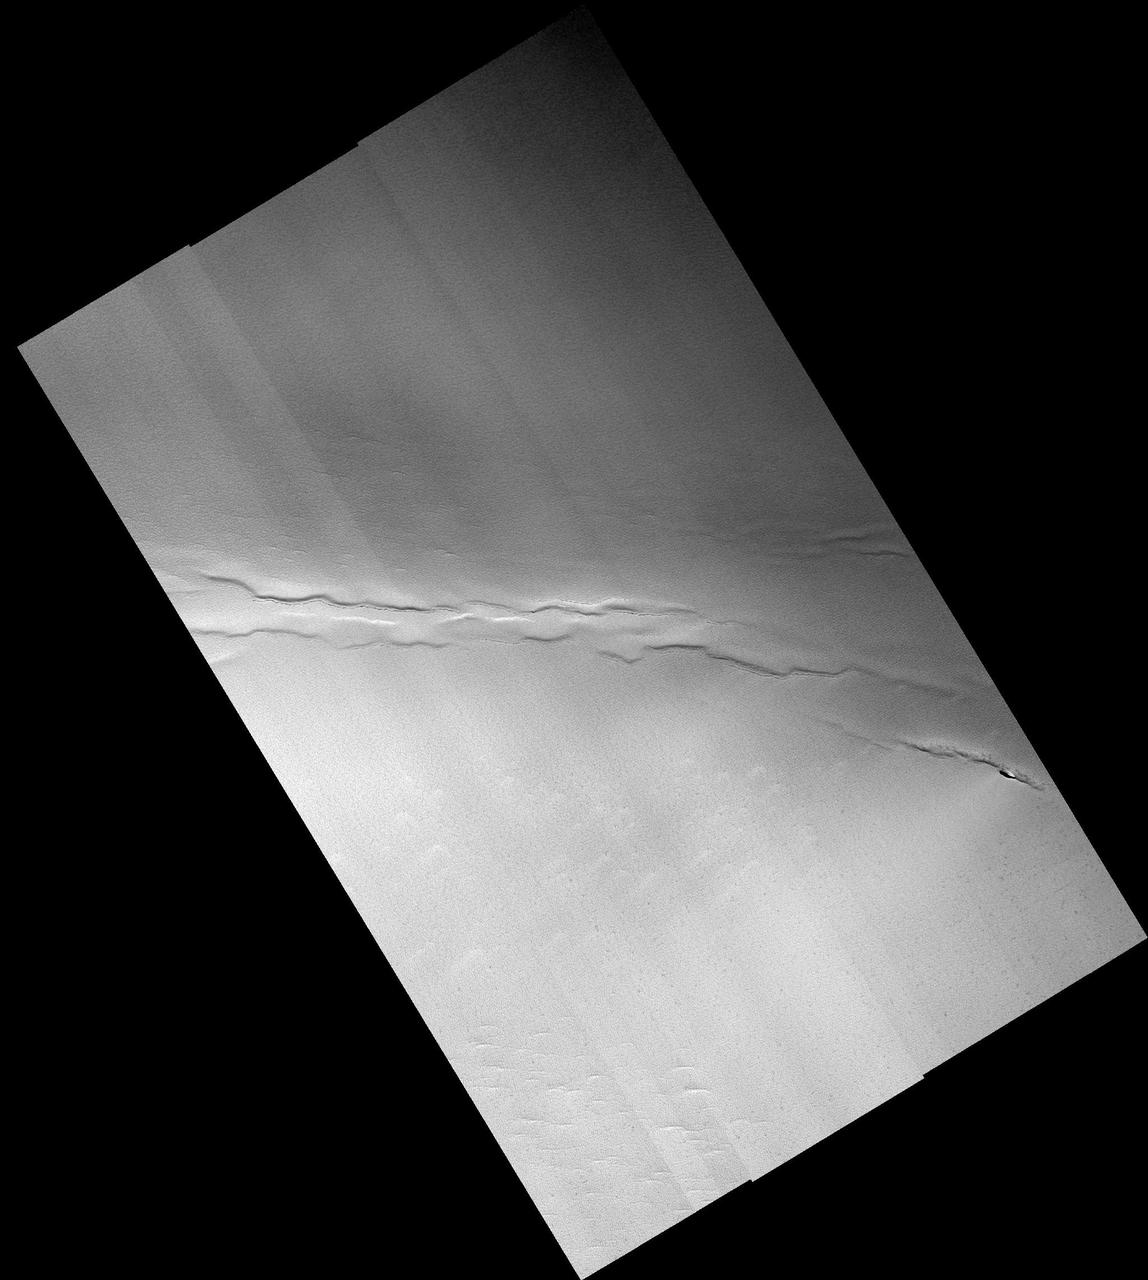
The San Andreas Fault and a Strike-slip Fault on Europa
It Not My Fault
Follow the Fault
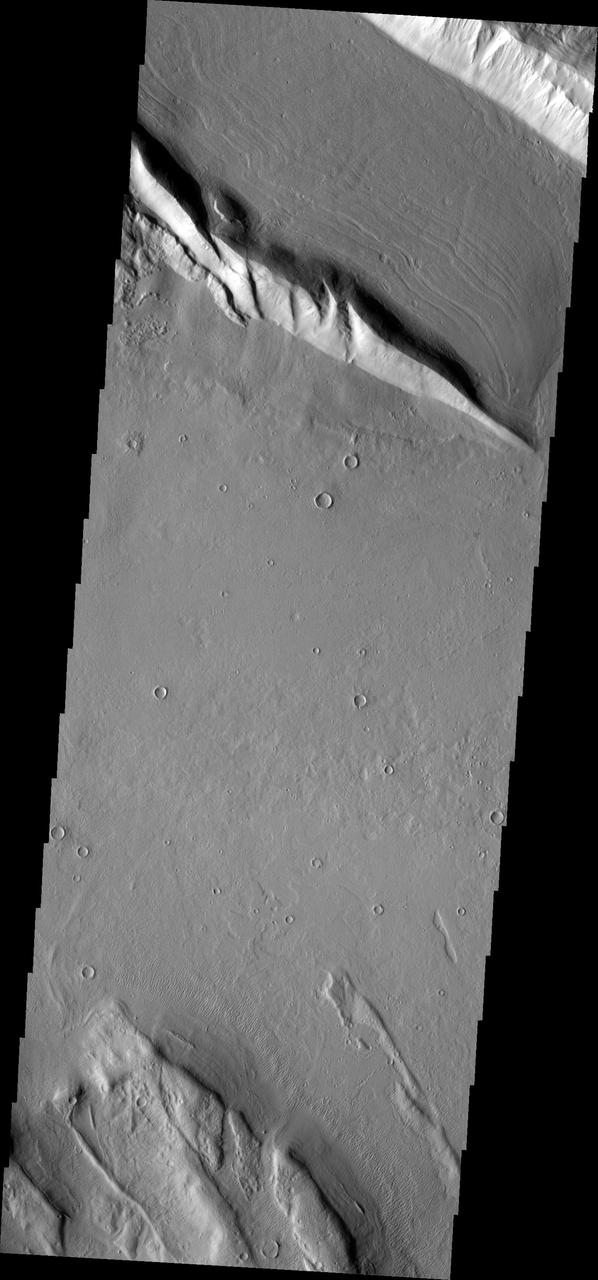
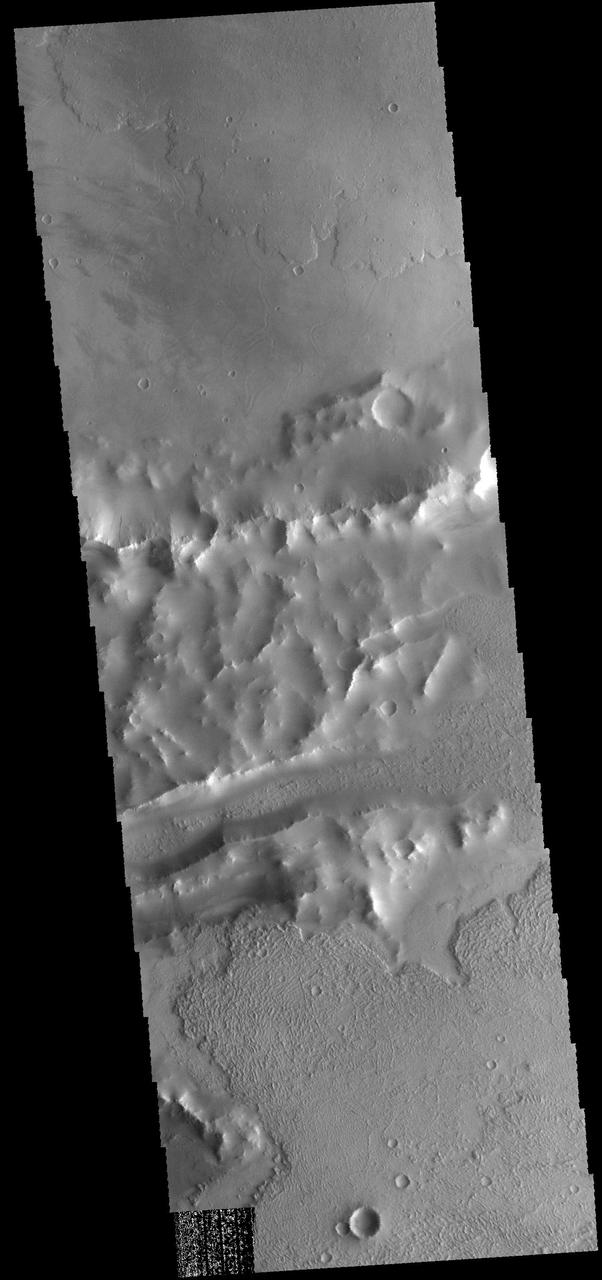
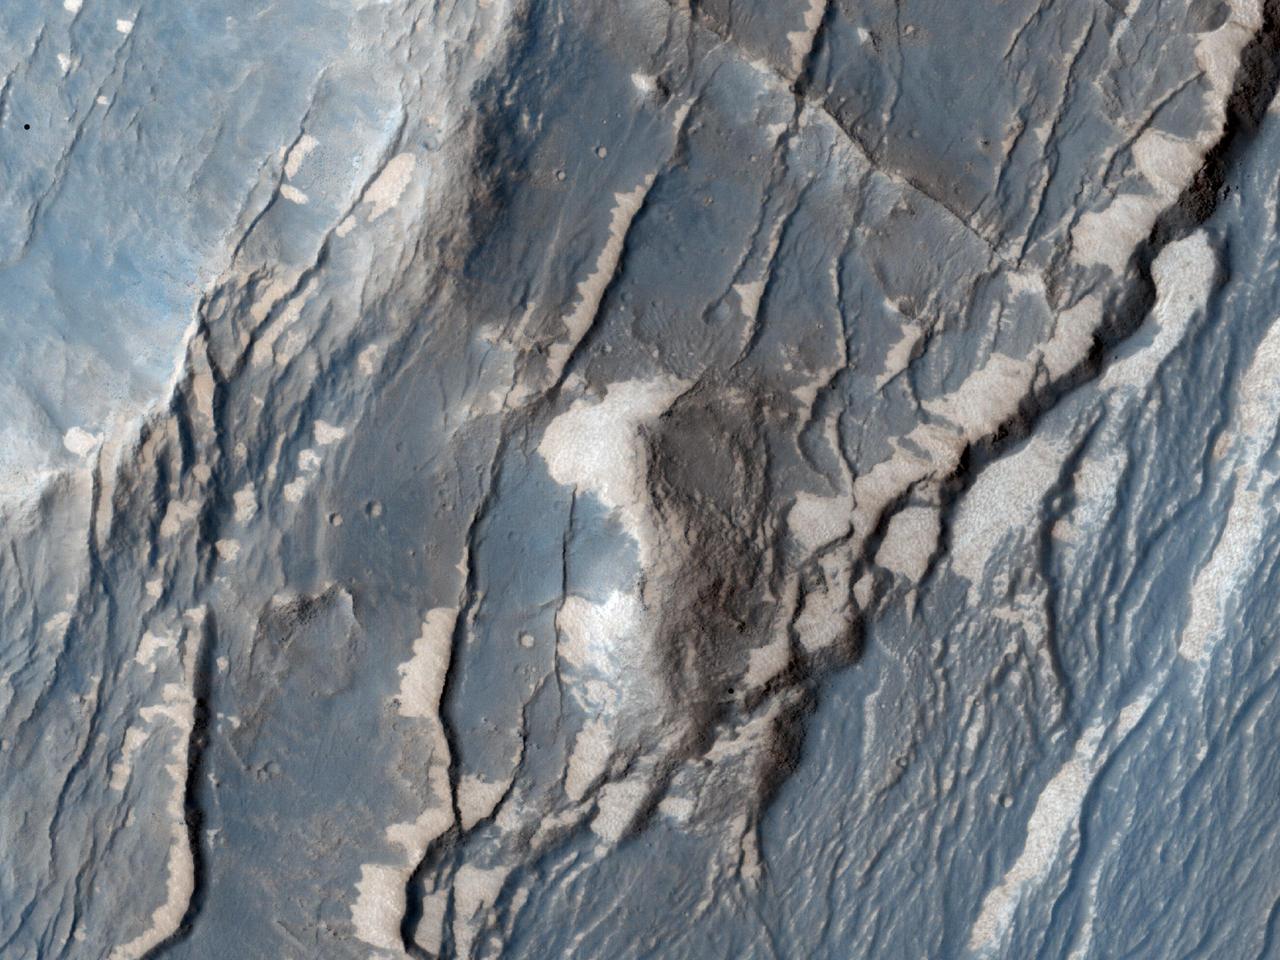
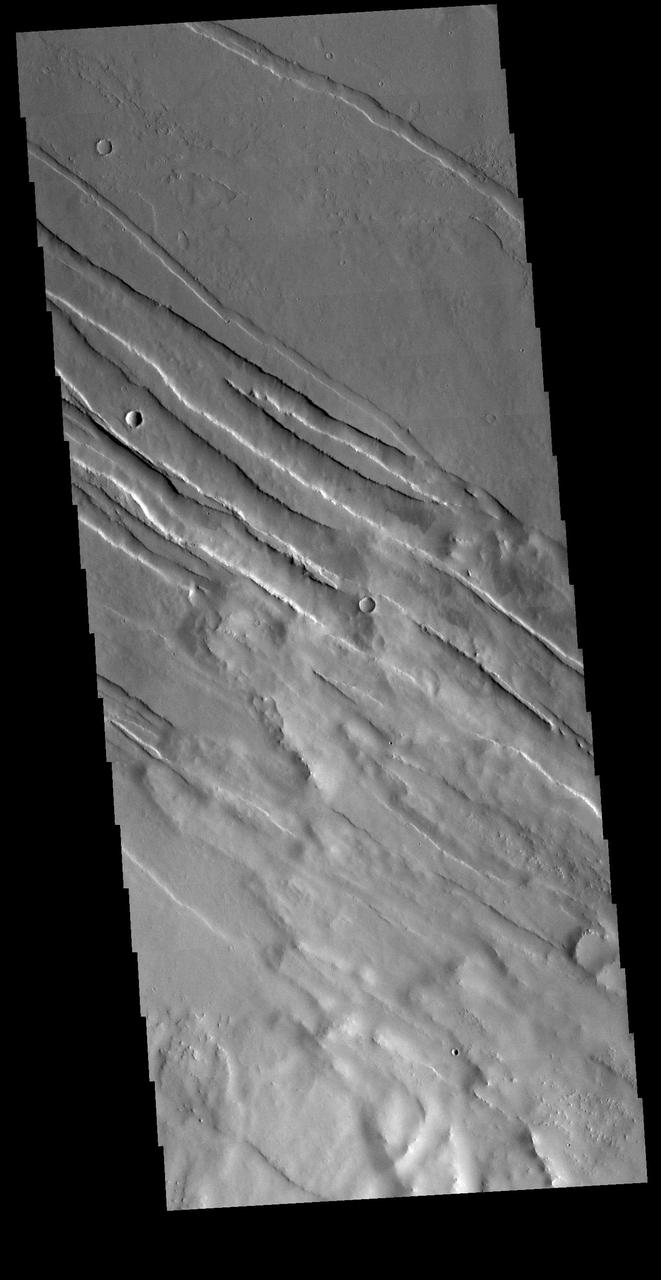
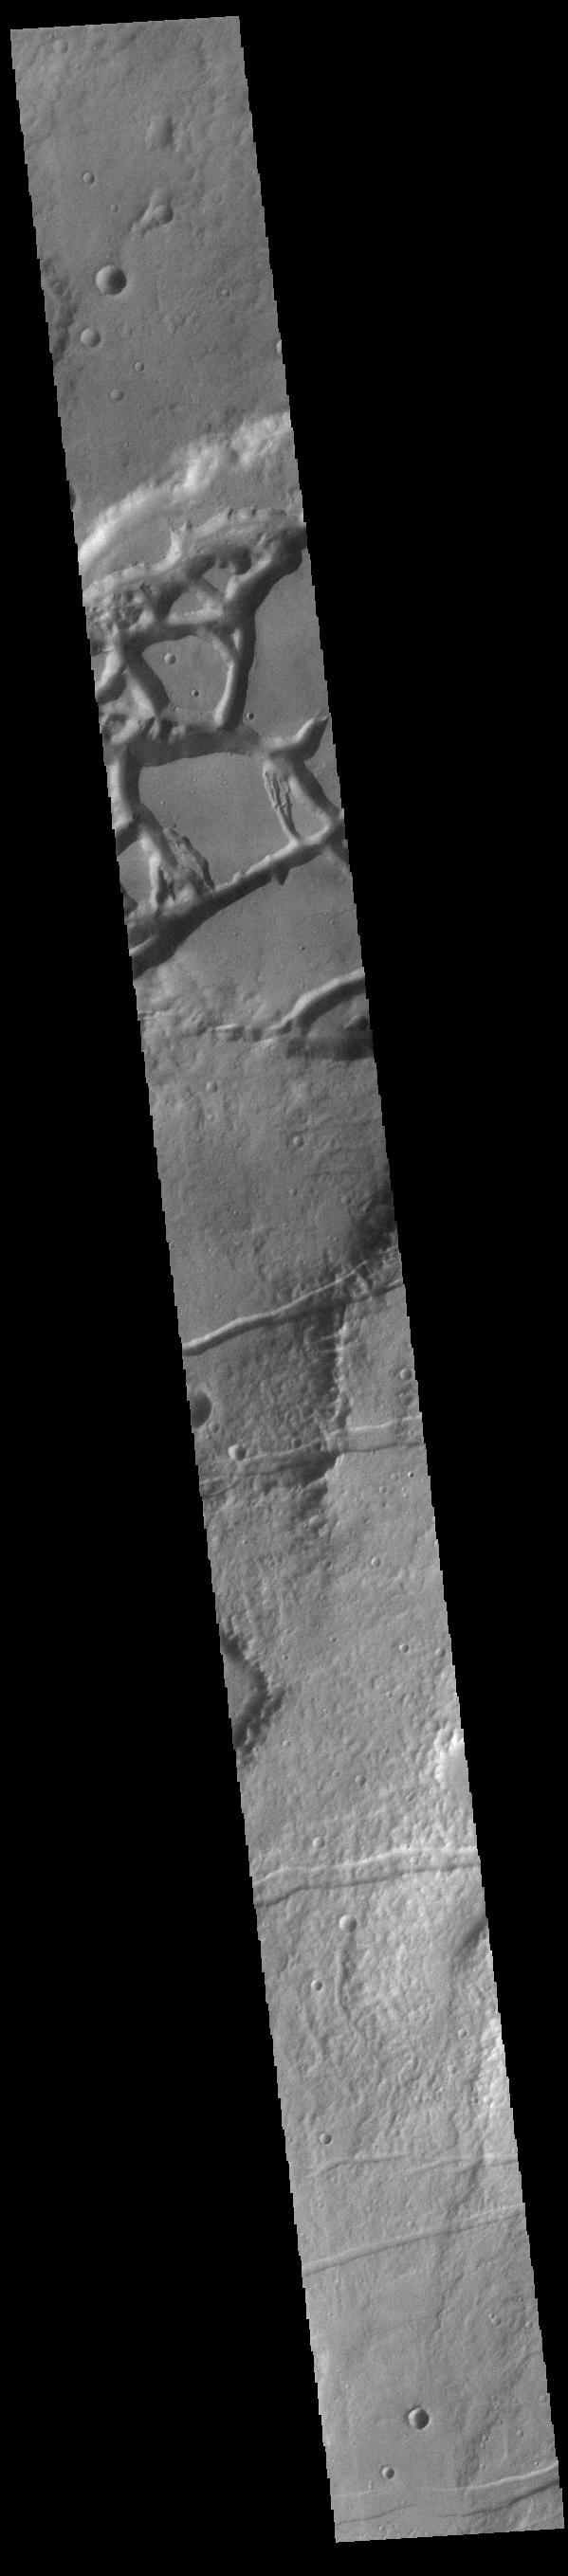
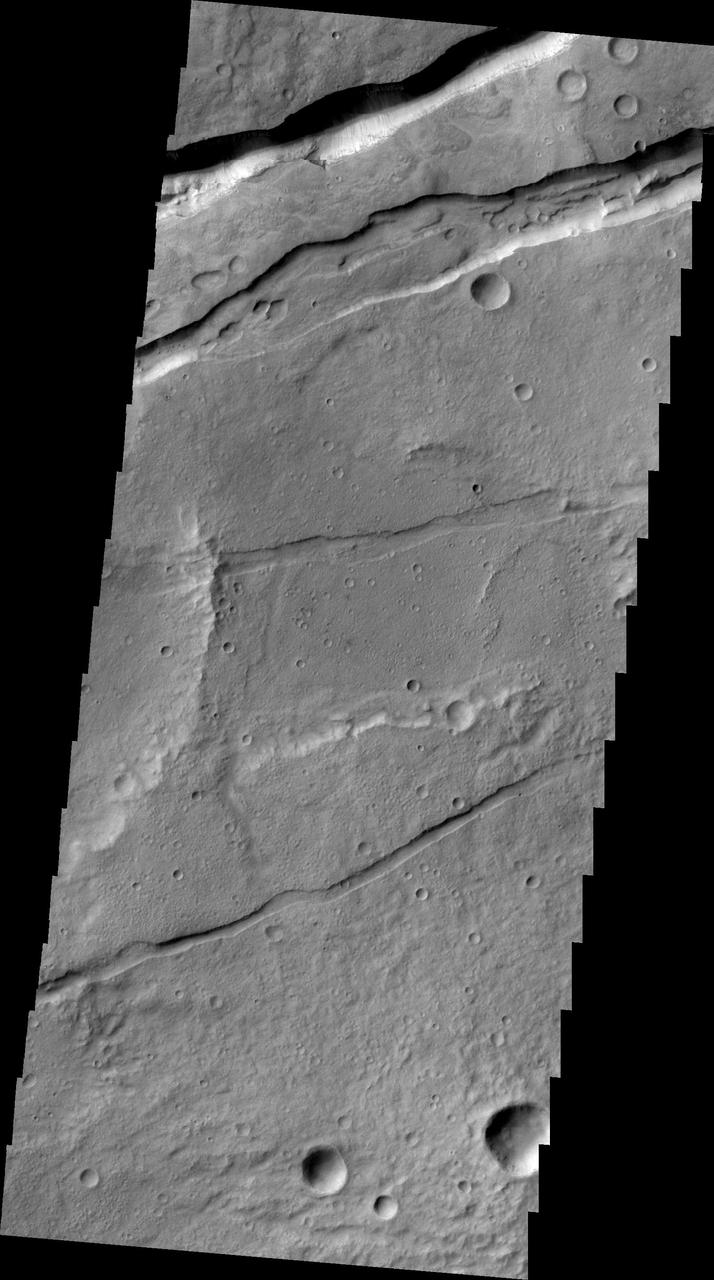
This region of Xanthe Terra has mostly been contracted due to thrust faulting, but this local region shows evidence of extensional faulting, also called normal faulting. When two normal faults face each other, they create a bathtub-like depression called a "graben." http://photojournal.jpl.nasa.gov/catalog/PIA20813
Faulted Sedimentary Rocks
Ius Chasma Fault
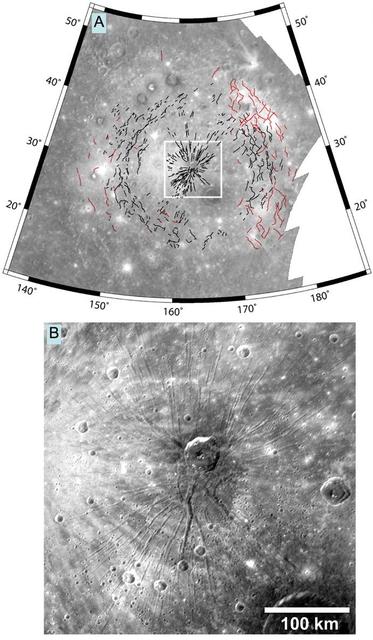
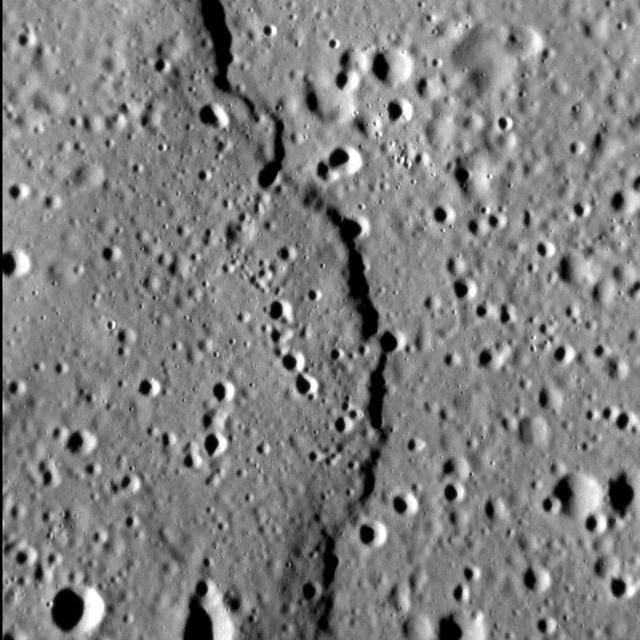
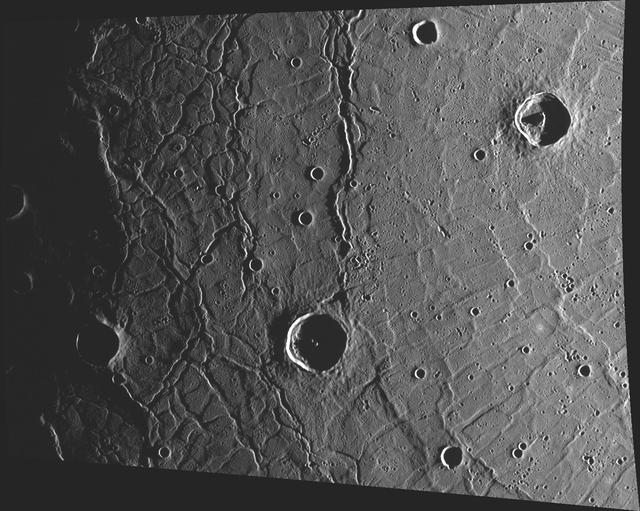
Faults in the Caloris Basin
Fuzzy Faulted Plains
Cross-Cutting Faults
Faulting in Amazonis Planitia
It All Mercury Fault
Lava Flows and Fault In IR
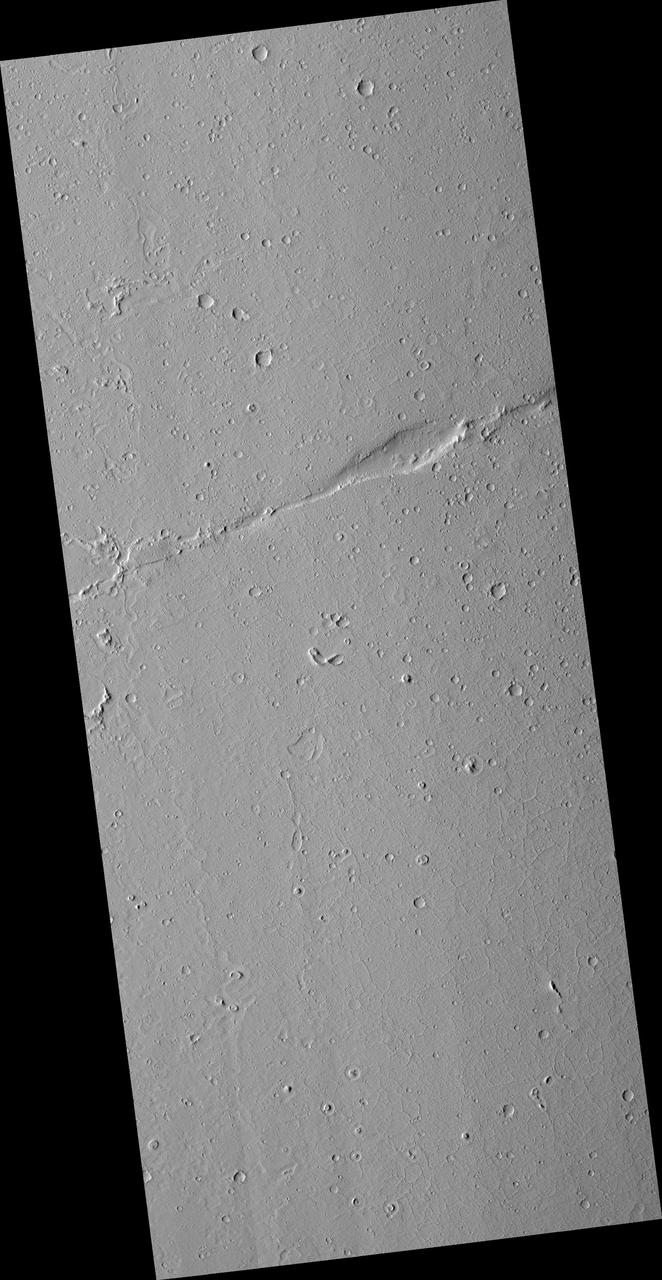
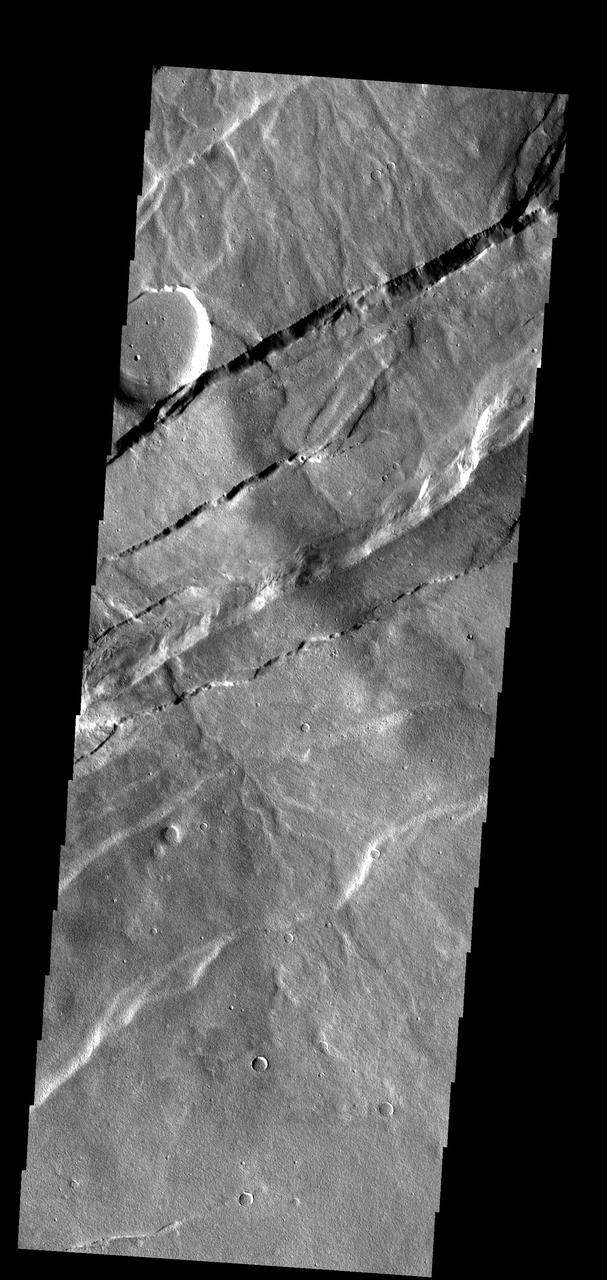
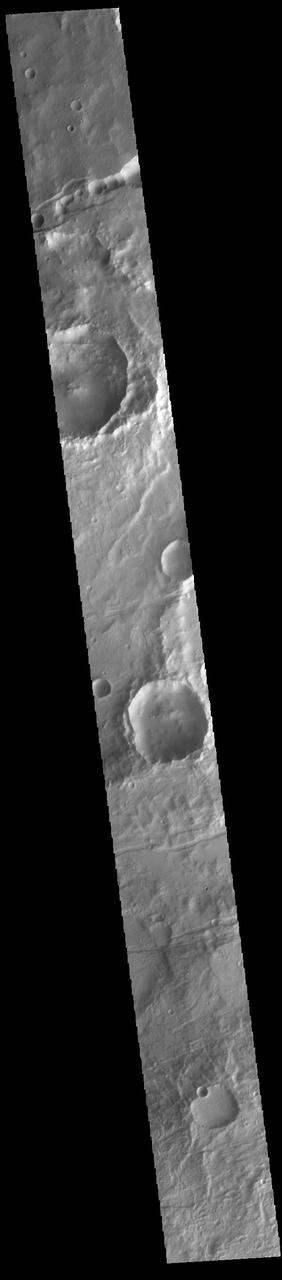
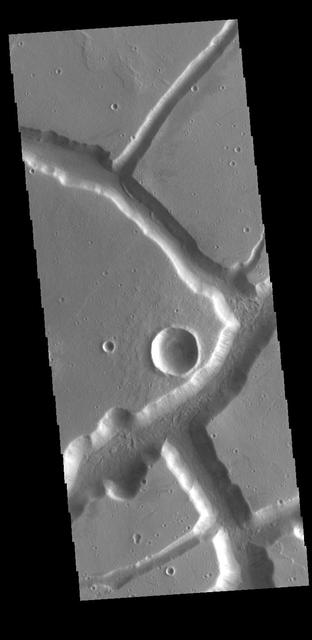
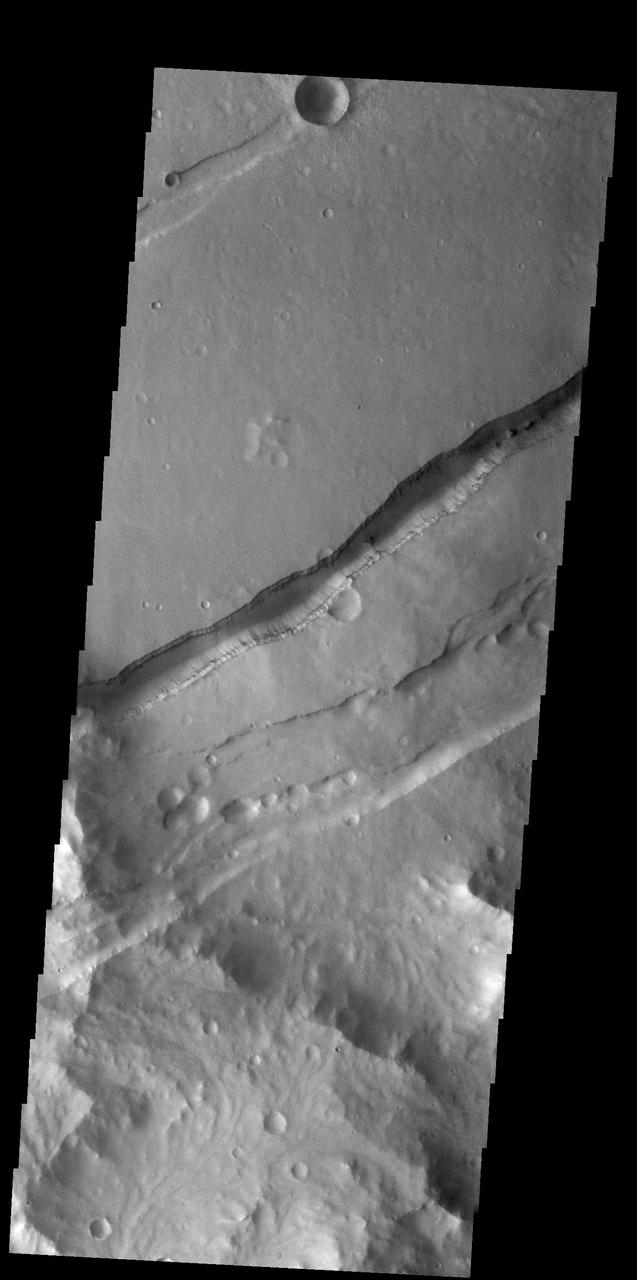
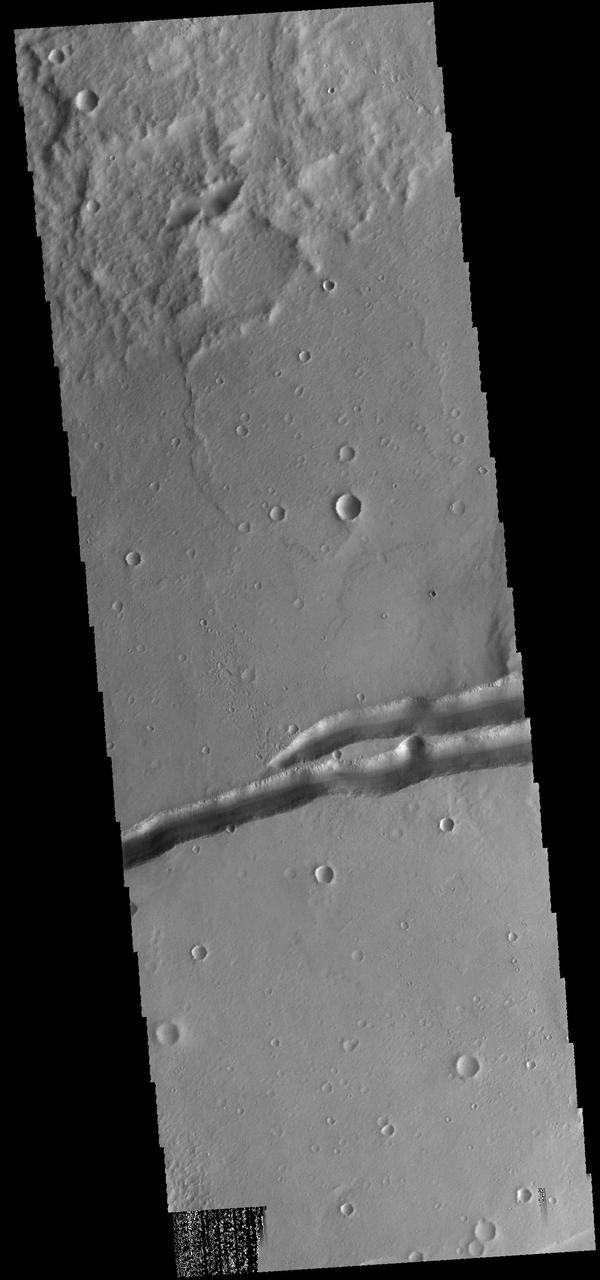
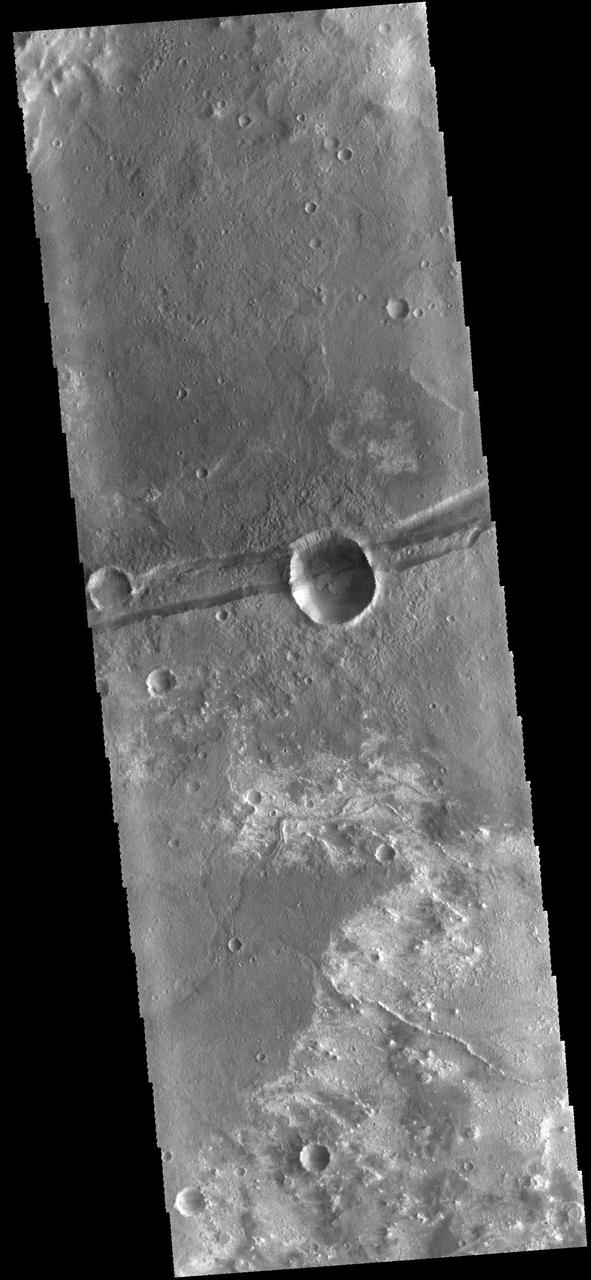
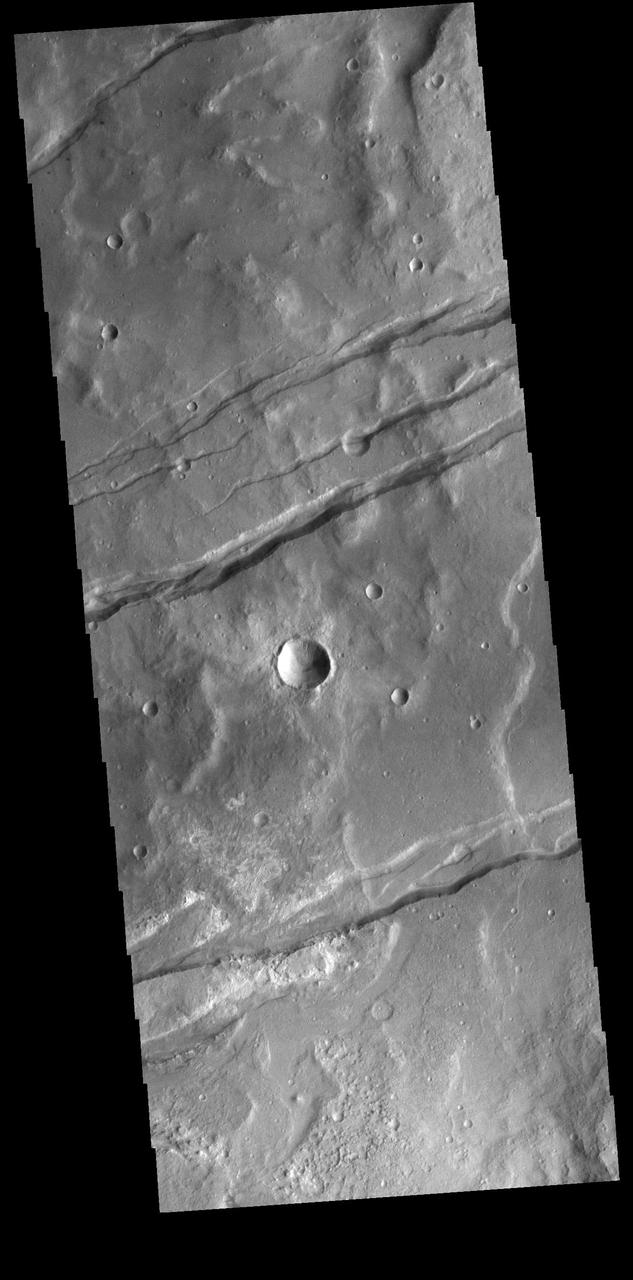
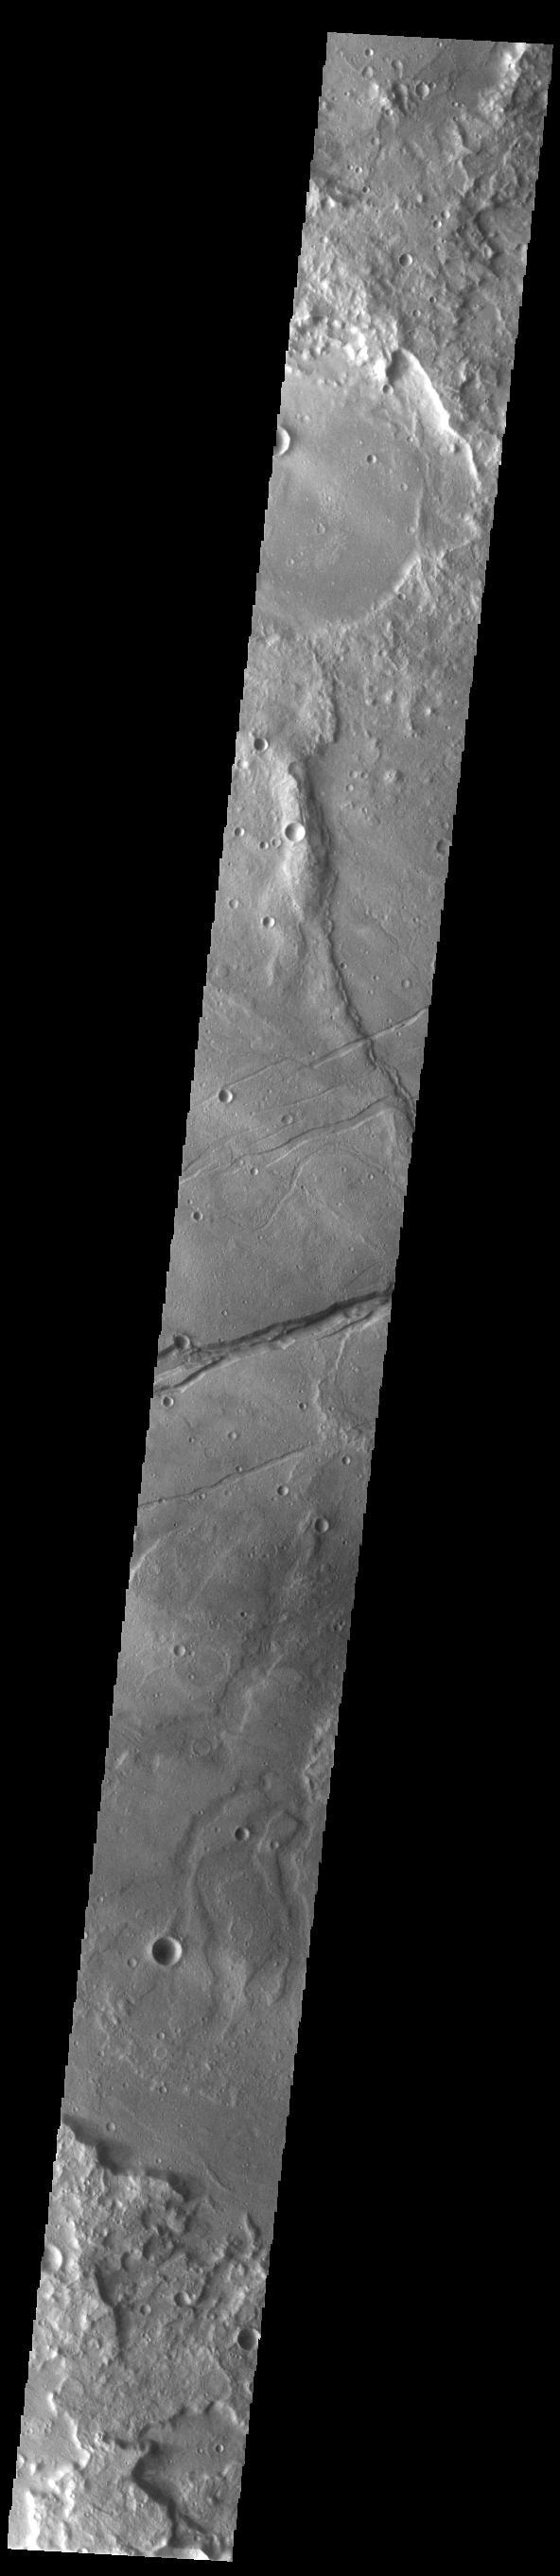
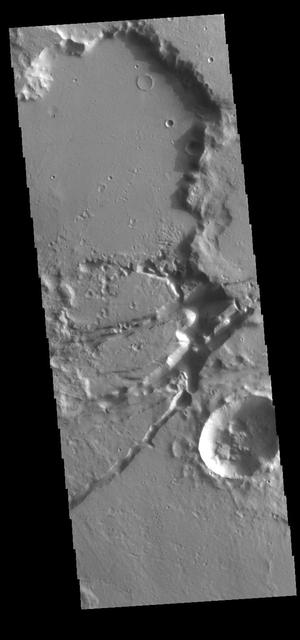
The depressions and offset ridge in this image captured by NASA Mars Odyssey spacecraft are evidence of faulting in this region of Sinai Dorsa.
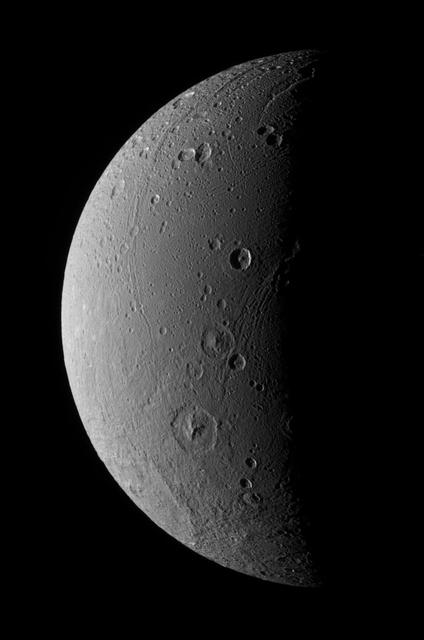
Dione Has Her Faults Monochrome
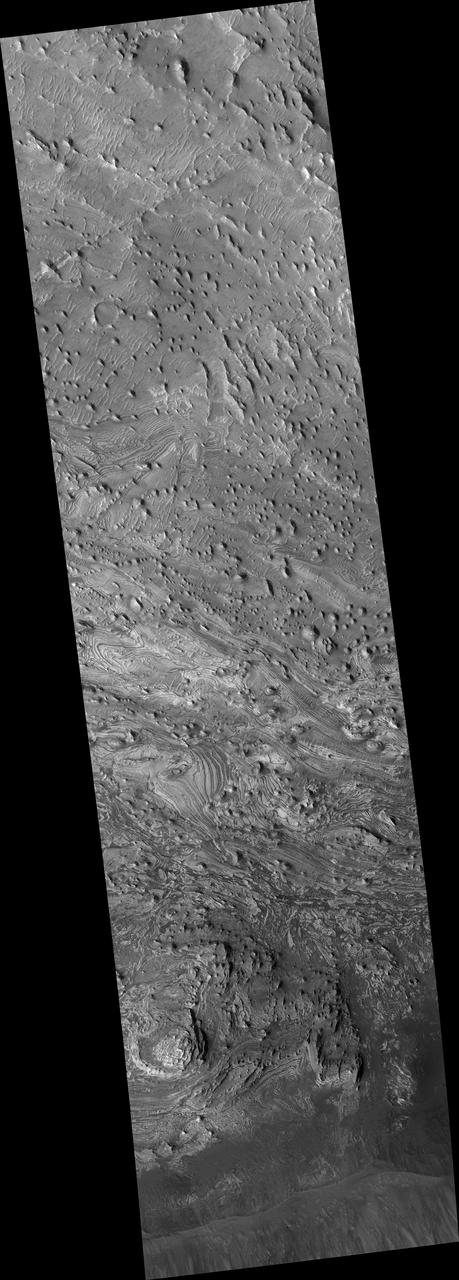
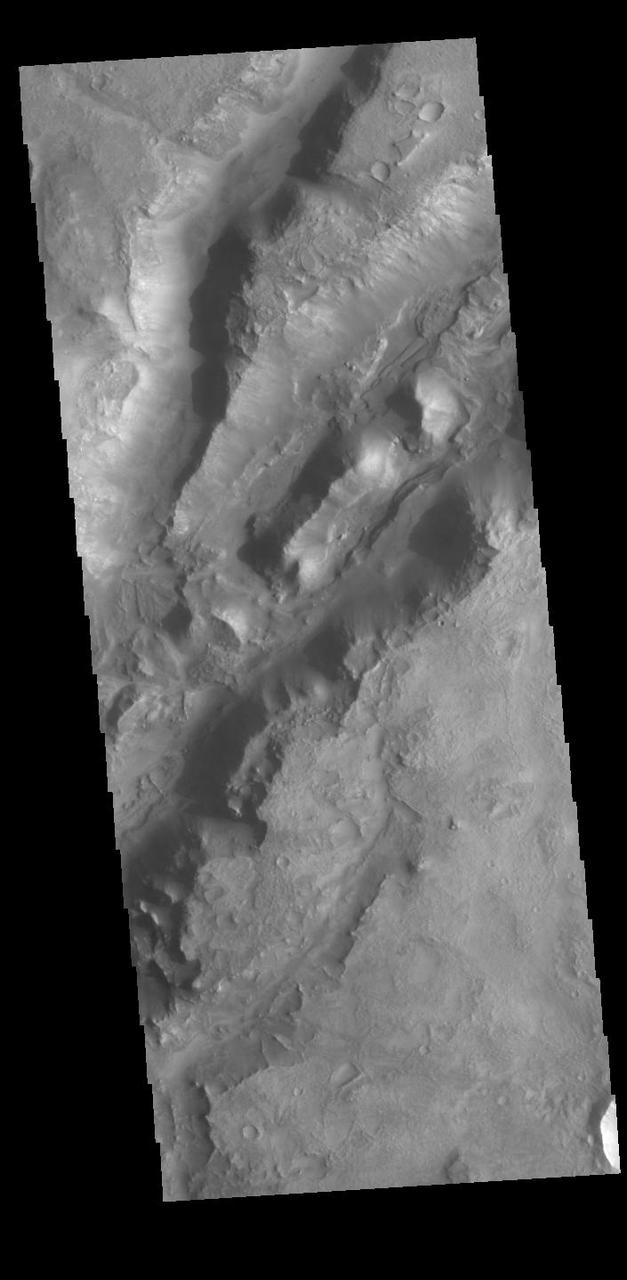
Faults and Folds in Western Candor Chasma
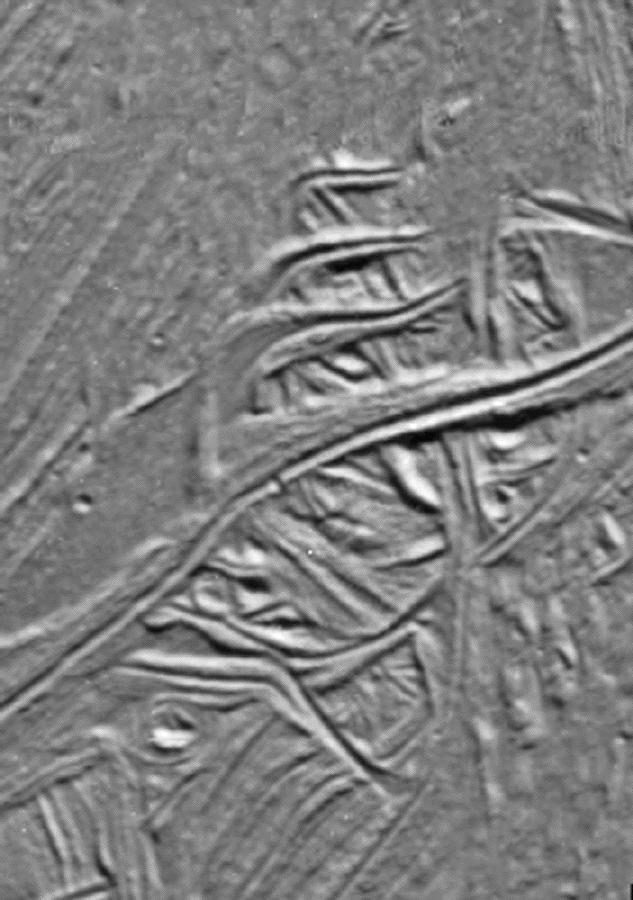
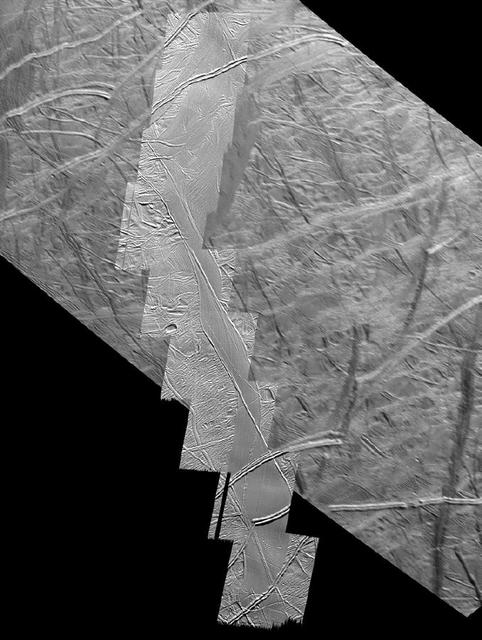
Cracks and Ridges Distorted by Europan Fault Motion
Faults and Pits in the North Polar Residual Ice Cap
San Andreas-sized Strike-slip Fault on Europa
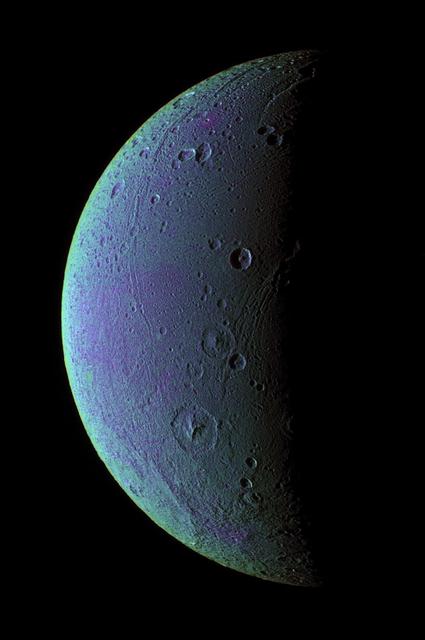
Dione Has Her Faults False Color
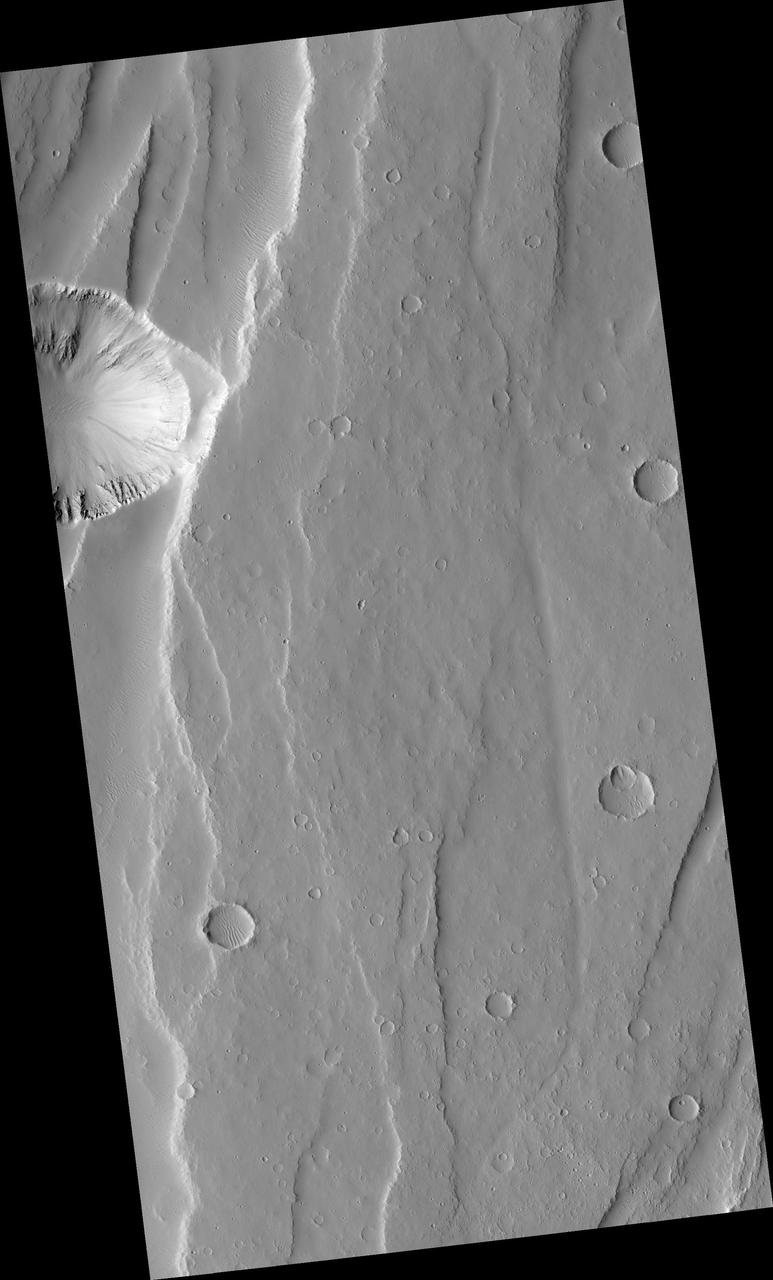
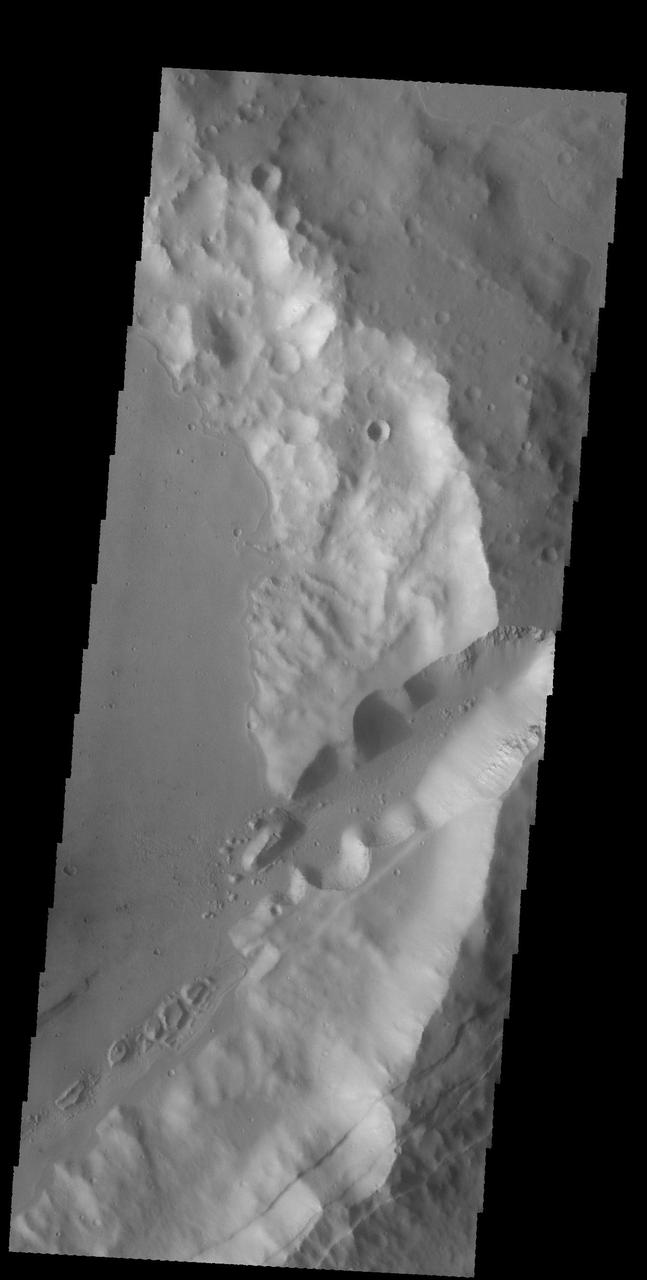
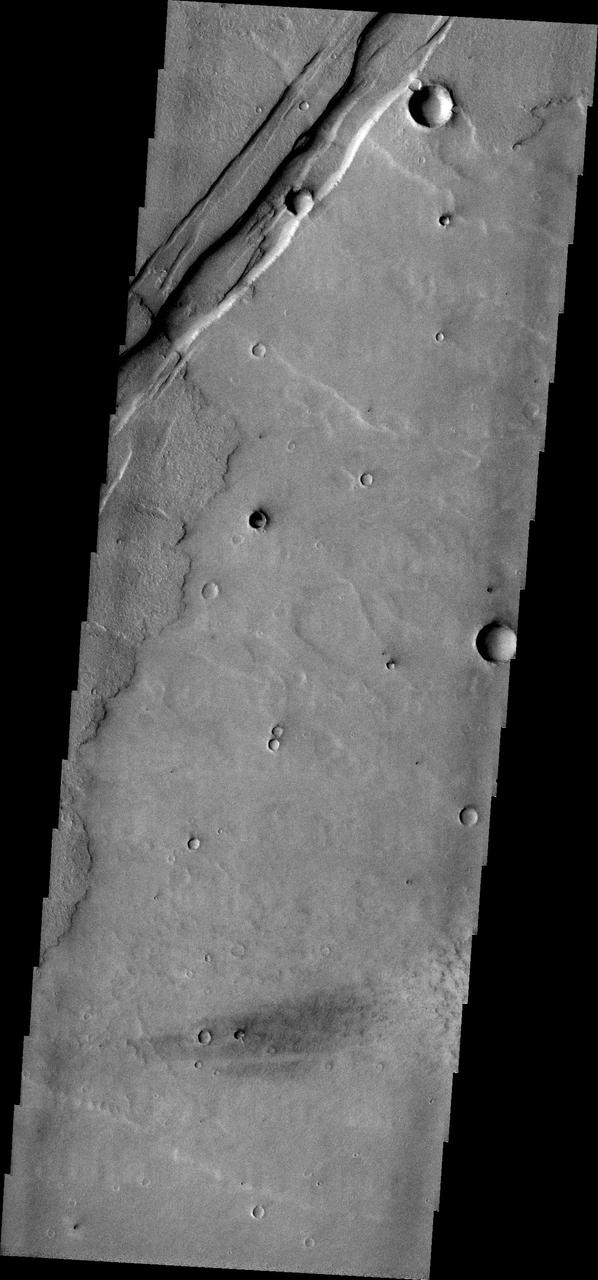
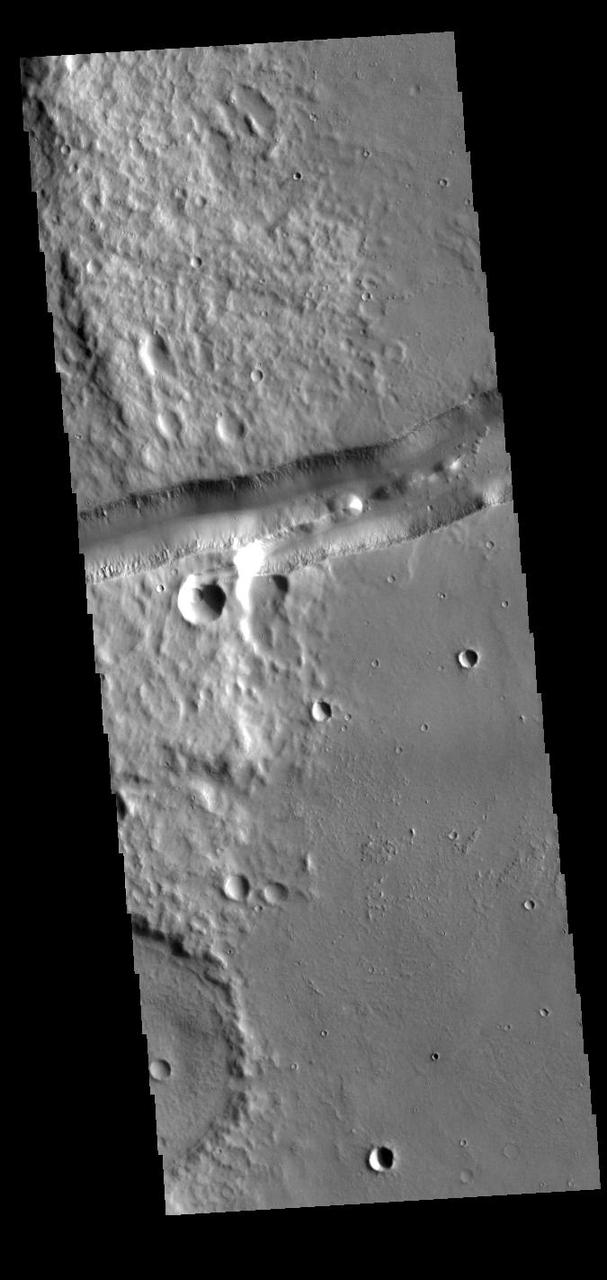
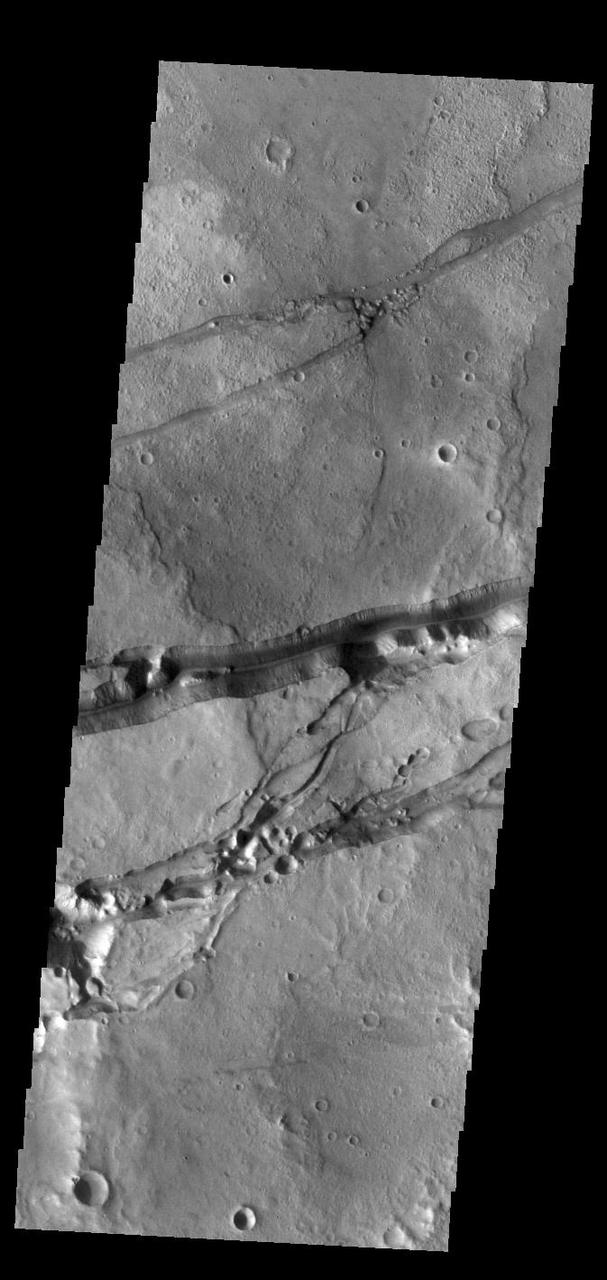
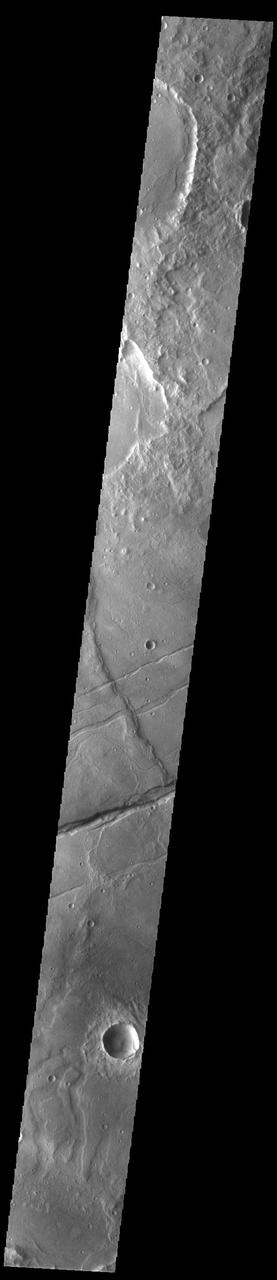
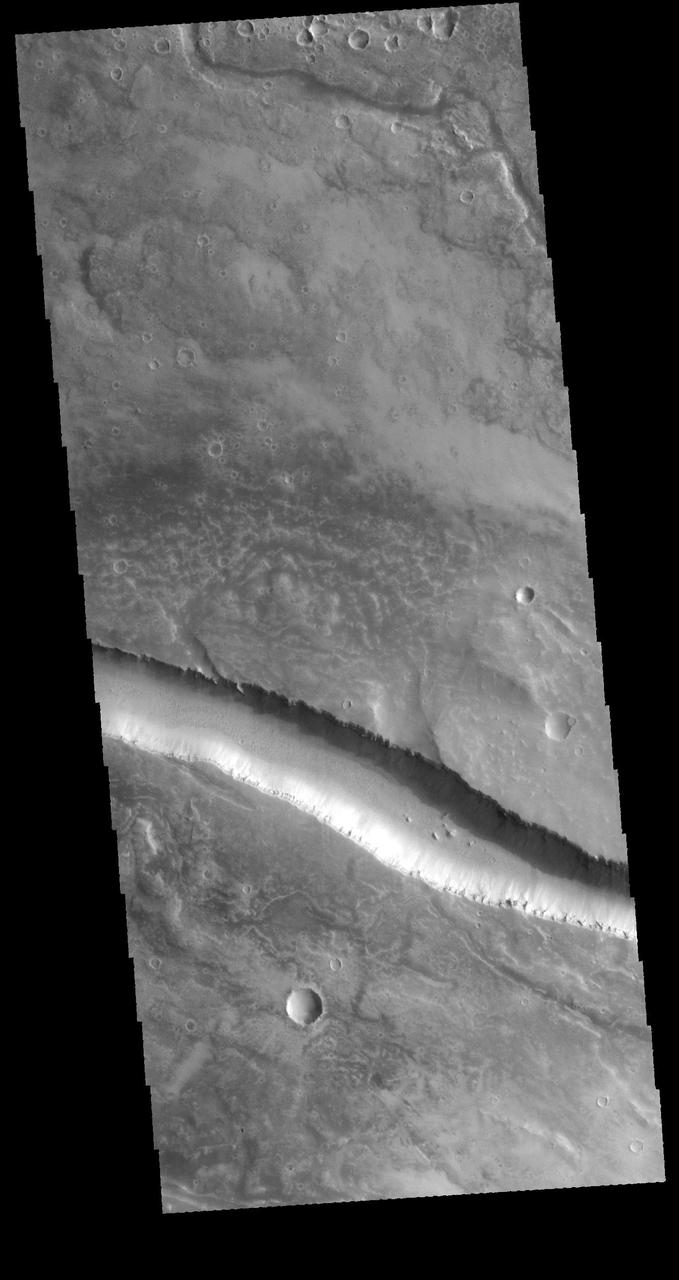
Lava flows of Daedalia Planum can be seen at the top and bottom portions of this image from NASA 2001 Mars Odyssey spacecraft. The ridge and linear depression in the central part of the image are part of Mangala Fossa, a fault bounded graben.
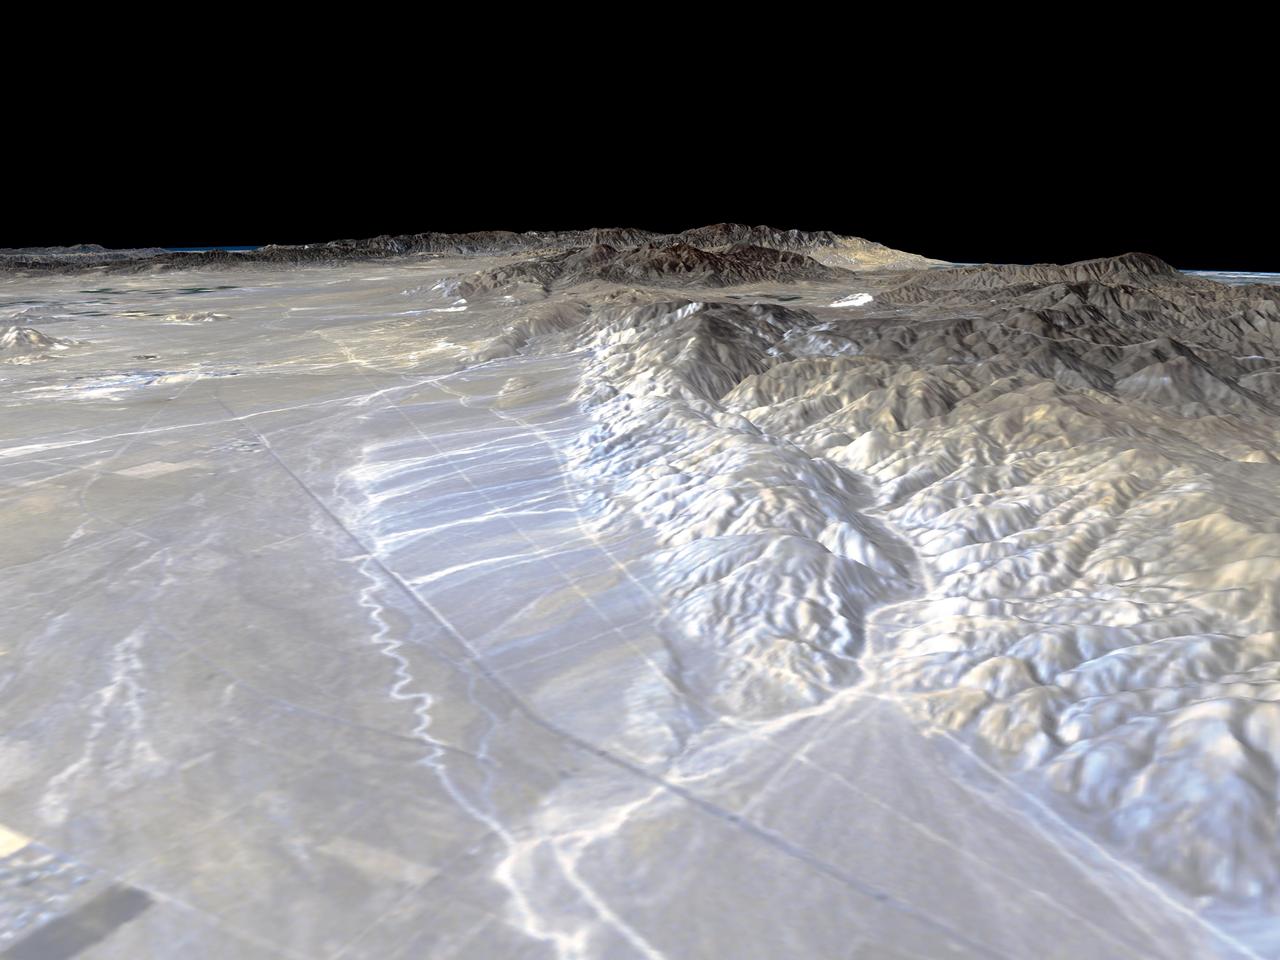
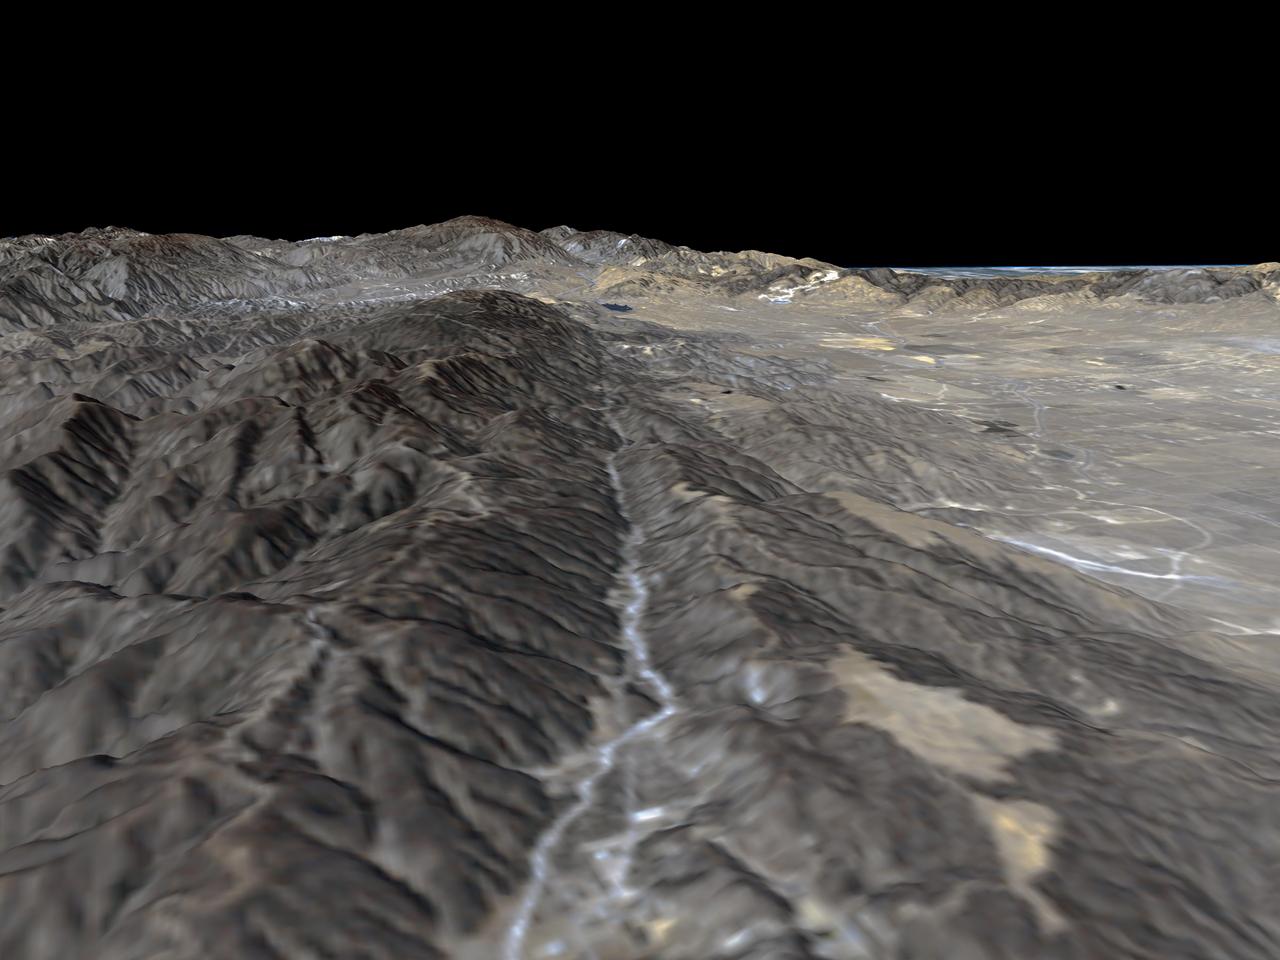
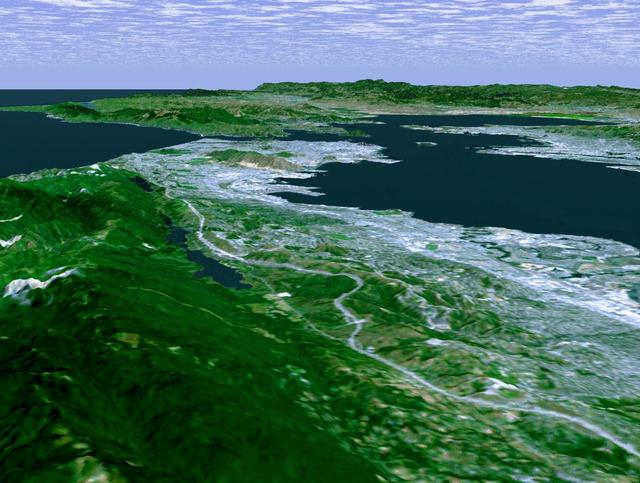
California Garlock Fault, marking the northwestern boundary of the Mojave Desert, lies at the foot of the mountains, running from the lower right to the top center of this image, which was created with data from NASA shuttle Radar Topography Mission.
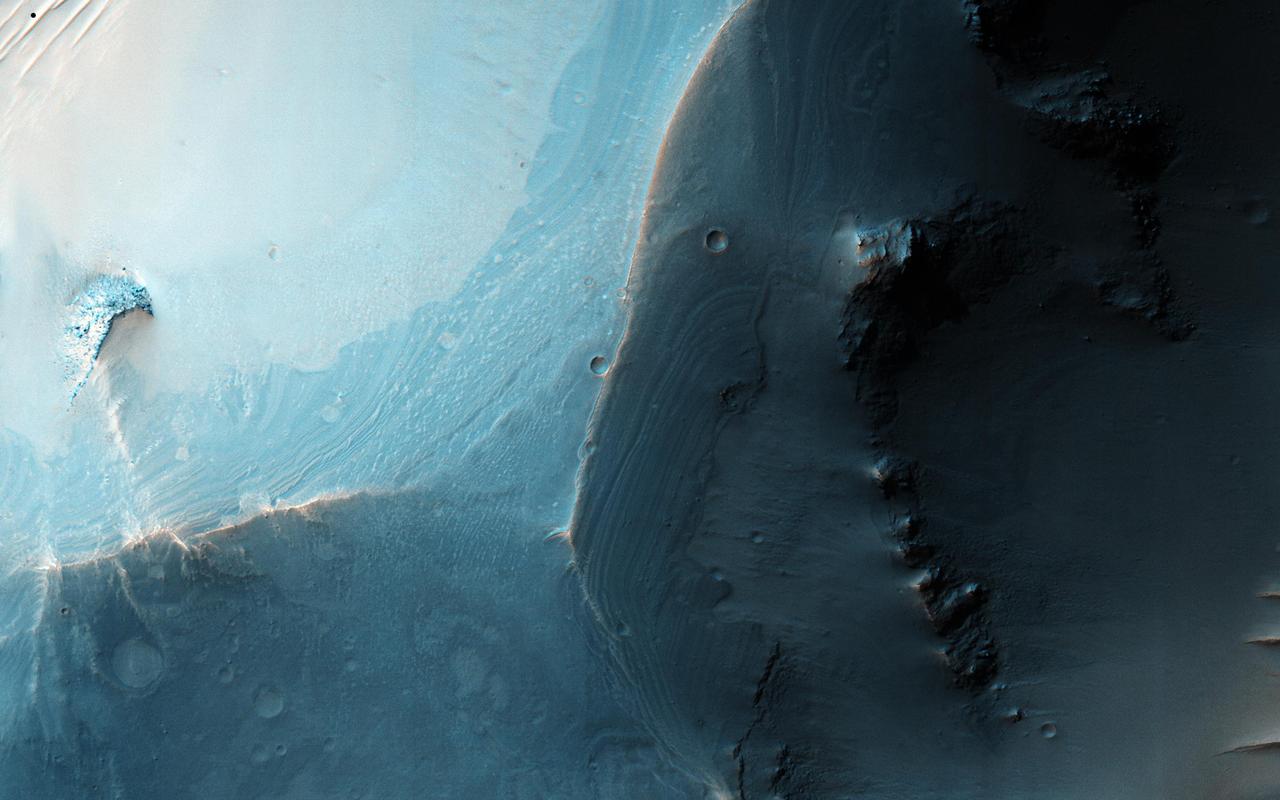
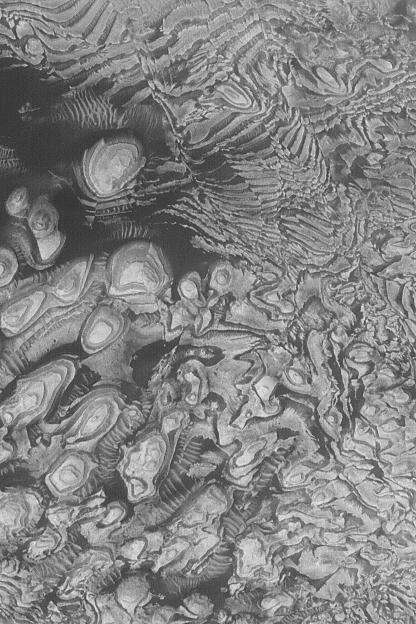
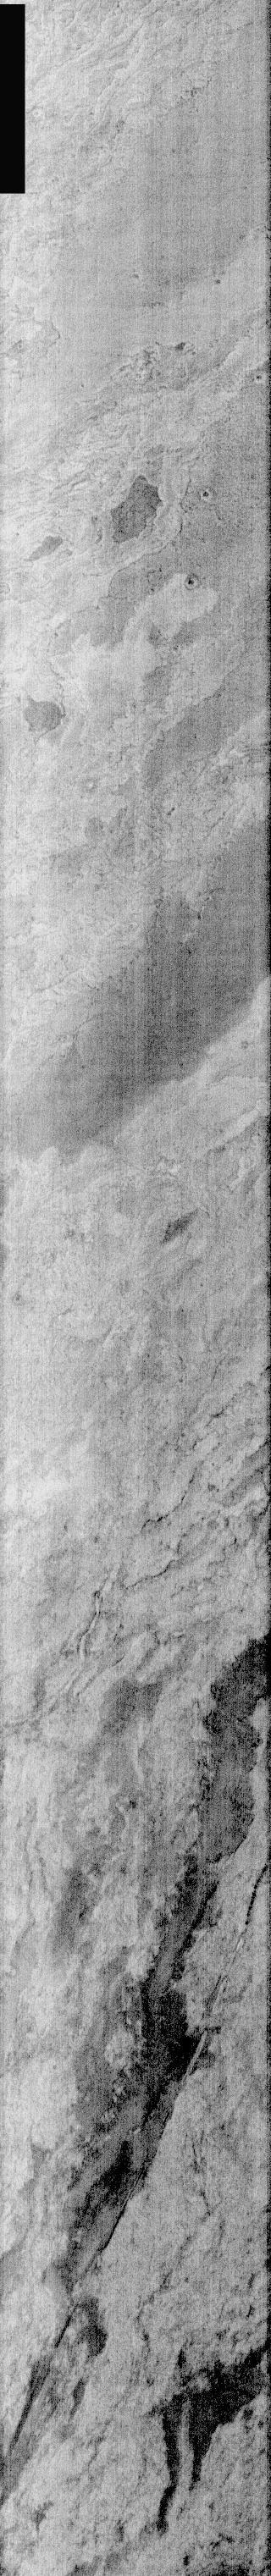
This image shows a set of coalesced collapse pits in western Valles Marineris as seen by NASA Mars Reconnaissance Orbiter. Fine layers are exposed in the walls of the pits, and in some places those layers are displaced by faults.
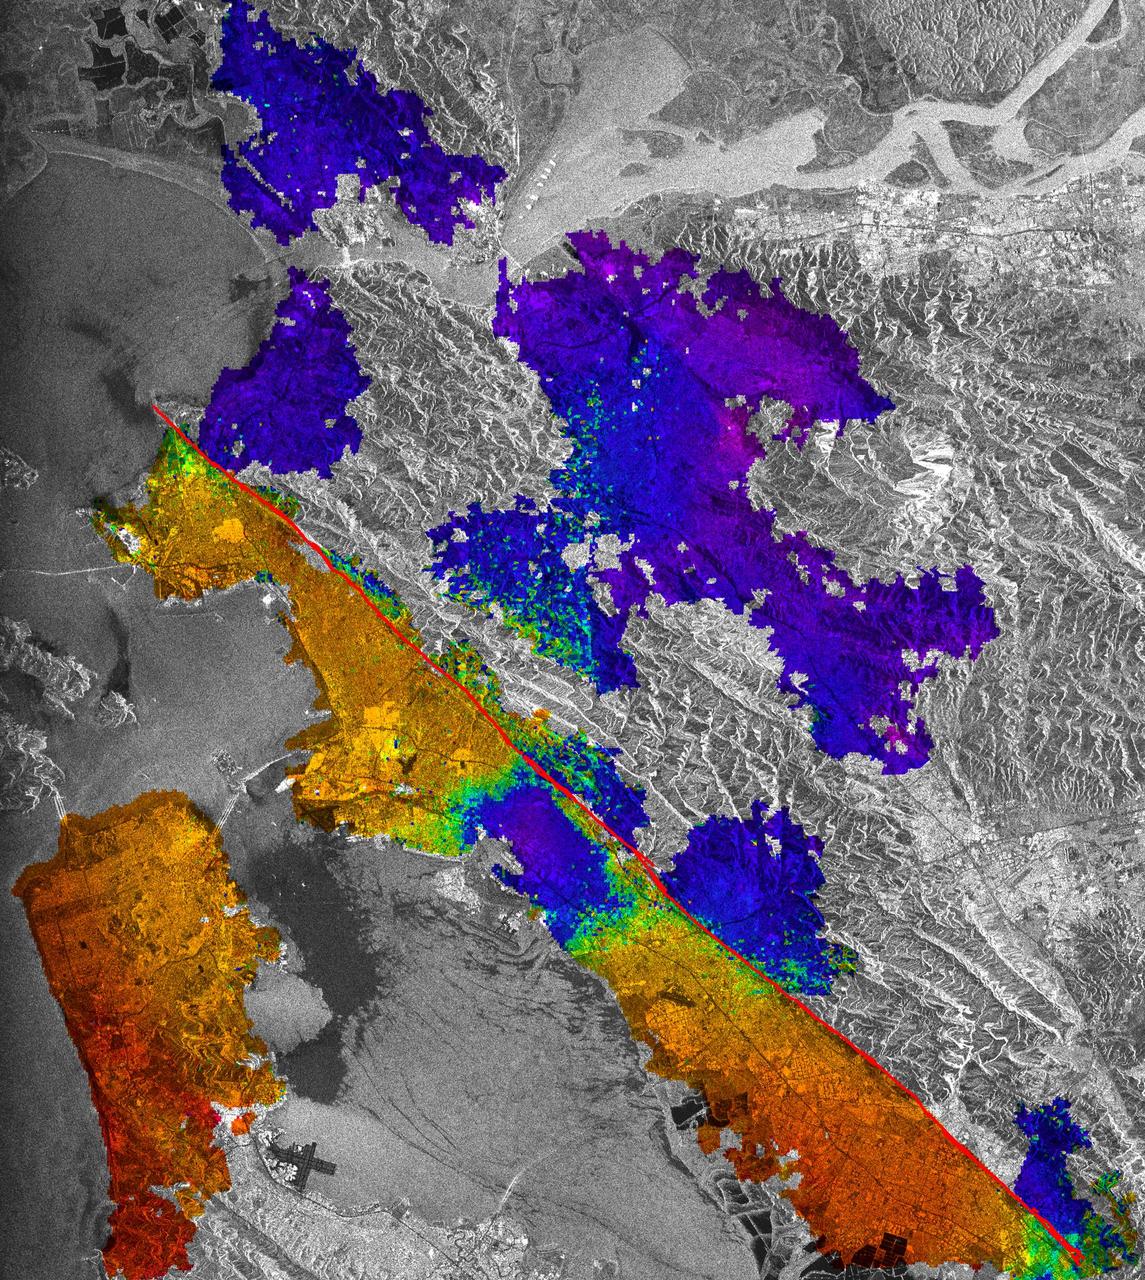
This image of California Hayward fault is an interferogram created using a pair of images taken by ESA ERS-1 and ERS-2 in June 1992 and September 1997 over the central San Francisco Bay in California.
The prominent linear feature straight down the center of this perspective view is California famous San Andreas Fault. The image was created with data from NASA Shuttle Radar Topography Mission SRTM.
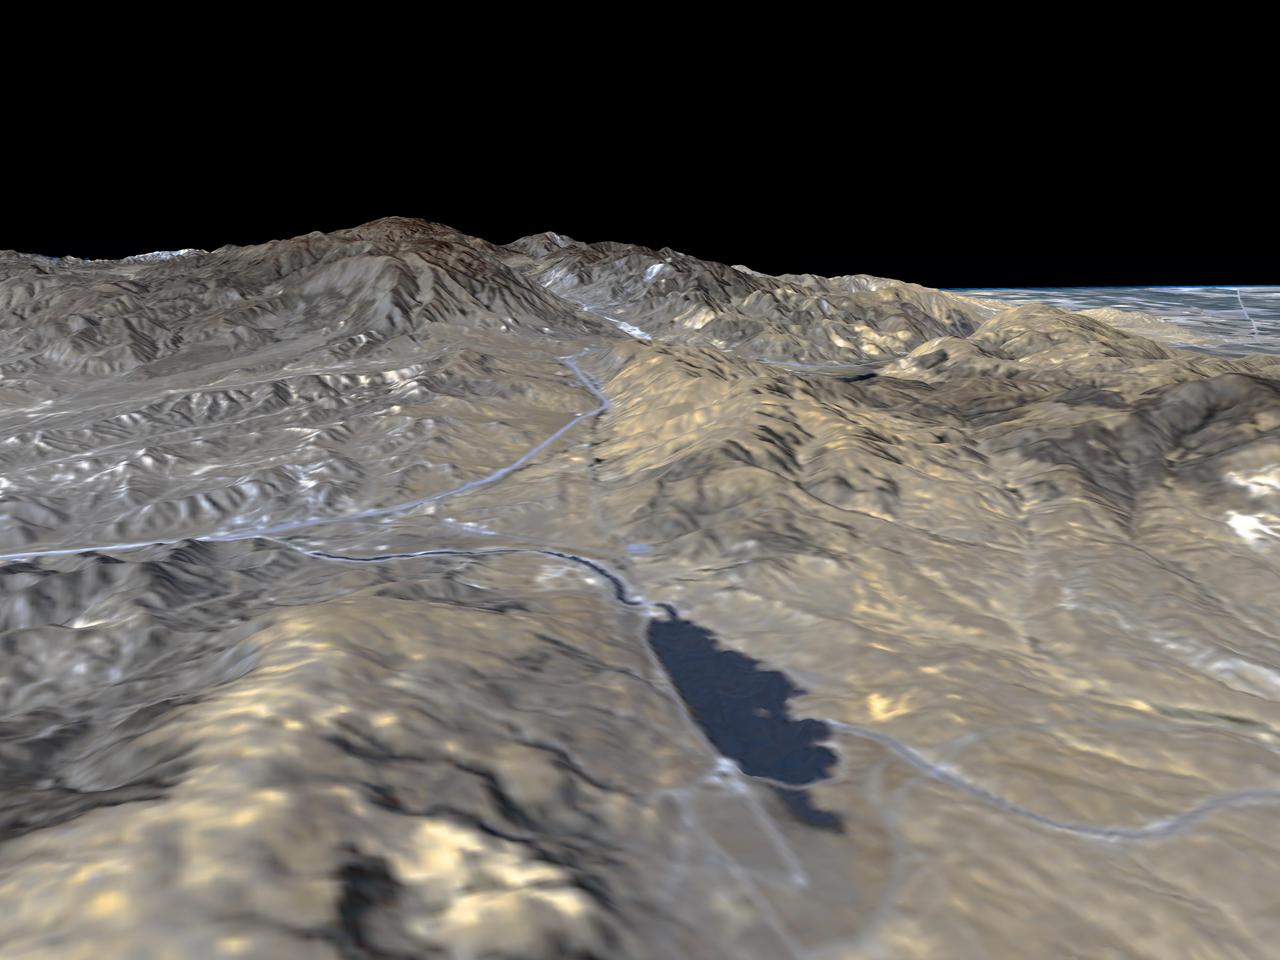
The prominent linear feature straight down the center of this perspective view is the San Andreas Fault in an image created with data from NASA shuttle Radar Topography Mission SRTM.
The 1,200-kilometer 800-mile San Andreas is the longest fault in California and one of the longest in North America as seen by NASA Shuttle Radar Topography Mission SRTM on February 16, 2000.
The prominent linear feature straight down the center of this perspective view is the San Andreas Fault. This segment of the fault lies near the city of Palmdale, CA the flat area in the right half of the image about 60 kilometers north of Los Angeles.
NASA Mars Reconnaissance Orbiter captured this image of the Claritas Fossae region, characterized by systems of graben. A graben forms when a block of the planet crust drops down between two faults, due to extension, or pulling, of the crust.
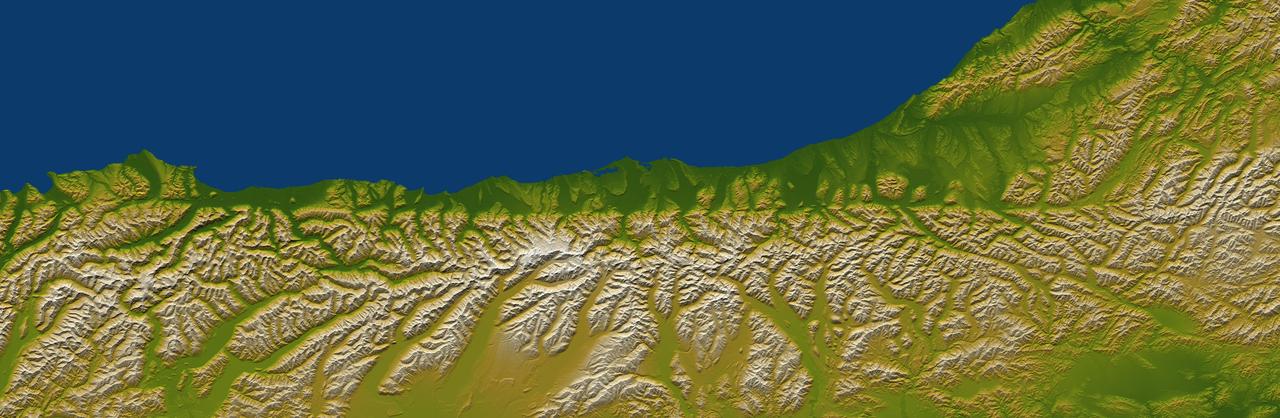
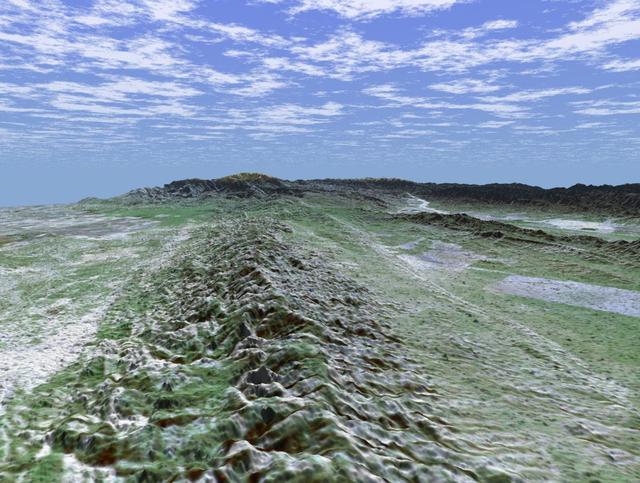
The Alpine fault runs parallel to, and just inland of, much of the west coast of New Zealand South Island. This view was created from the near-global digital elevation model produced by NASA Shuttle Radar Topography Mission SRTM.
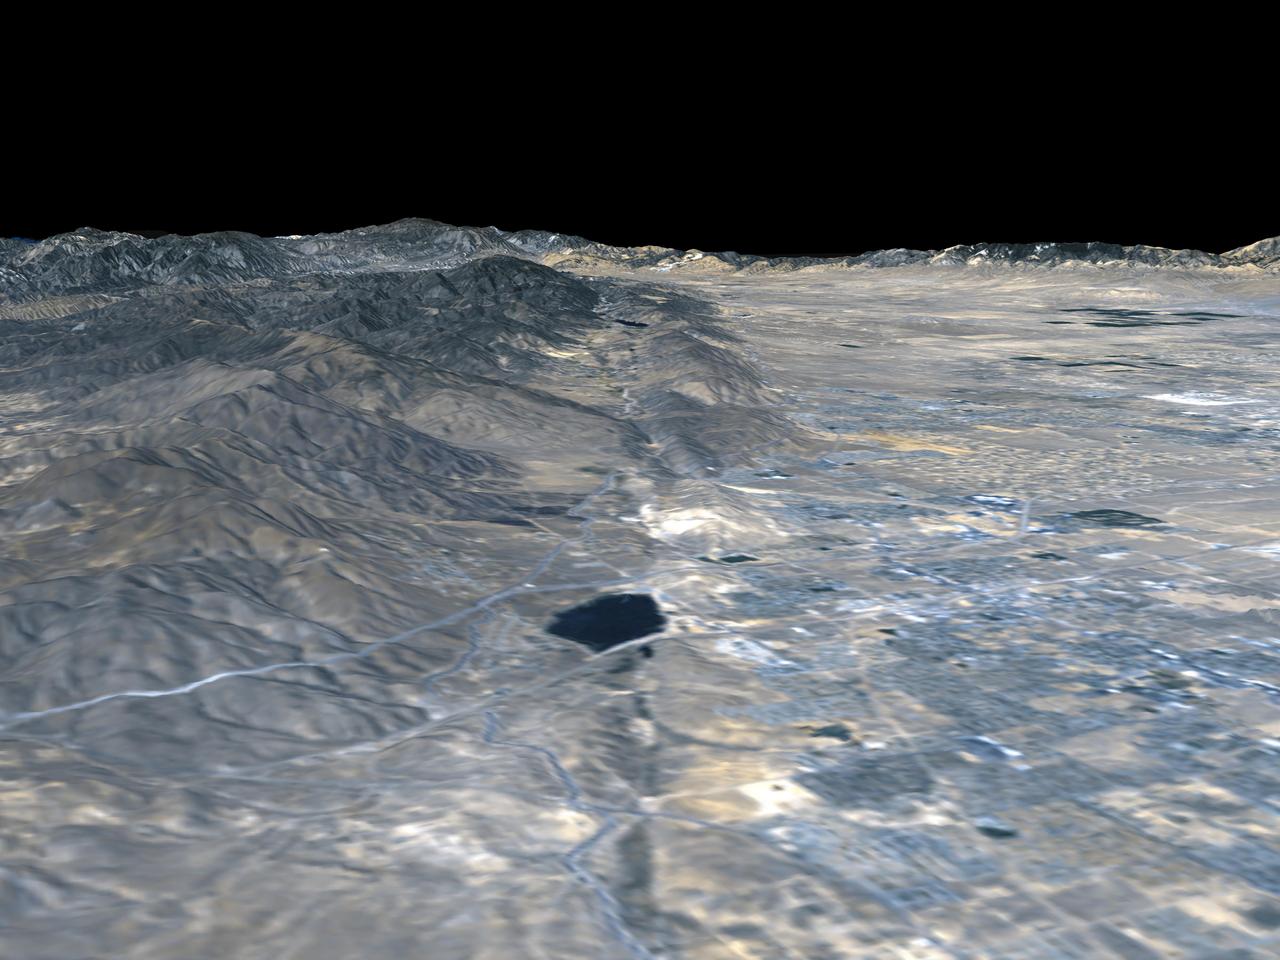
This topographic map acquired by NASA Shuttle Radar Topography Mission SRTM from data collected on February 16, 2000 vividly displays California famous San Andreas Fault along the southwestern edge of the Mojave Desert, Calif.
This topographic map acquired by NASA Shuttle Radar Topography Mission SRTM from data collected on February 16, 2000 vividly displays California famous San Andreas Fault along the southwestern edge of the Mojave Desert, Calif.
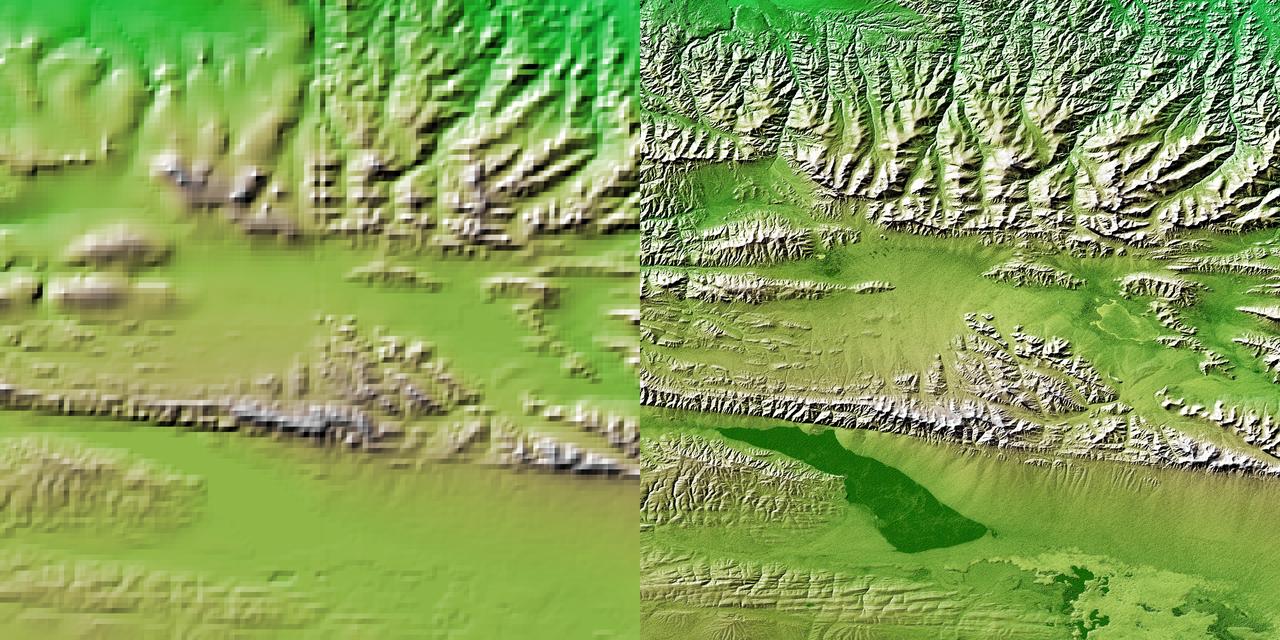
These two images show exactly the same area, part of the Kunlun fault in northern Tibet. The image on the left was created using the best global topographic data set previously available, the U.S. Geological Survey GTOPO30.
The linear features in this VIS image are faults. Where depressions are formed bounded by faulting the feature is called a graben. These faults and graben are part of a large region of faulting called Sirenum Fossae. Orbit Number: 59353 Latitude: -24.4596 Longitude: 220.937 Instrument: VIS Captured: 2015-05-01 20:03 http://photojournal.jpl.nasa.gov/catalog/PIA19503
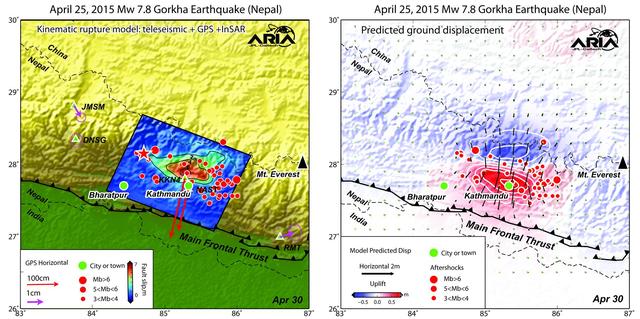
Using a combination of GPS-measured ground motion data, satellite radar data, and seismic observations from instruments distributed around the world, scientists have constructed preliminary estimates of how much the fault responsible for the April 25, 2015, magnitude 7.8 Gorkha earthquake in Nepal moved below Earth's surface (Figure 1). This information is useful for understanding not only what happened in the earthquake but also the potential for future events. It can also be used to infer a map of how Earth's surface moved due to the earthquake over a broader region (Figure 2). The maps created from these data can be viewed at PIA19384. In the first figure, the modeled slip on the fault is shown as viewed from above and indicated by the colors and contours within the rectangle. The peak slip in the fault exceeds 19.7 feet (6 meters). The ground motion measured with GPS is shown by the red and purple arrows and was used to develop the fault slip model. In the second figure, color represents vertical movement and the scaled arrows indicate direction and magnitude of horizontal movement. In both figures, aftershocks are indicated by red dots. Background color and shaded relief reflect regional variations in topography. The barbed lines show where the main fault reaches Earth's surface. The main fault dives northward into the Earth below the Himalaya. http://photojournal.jpl.nasa.gov/catalog/PIA19384
This region of Alba Patera is characterized by faulting with the down-dropped block on the southeast side of the fault
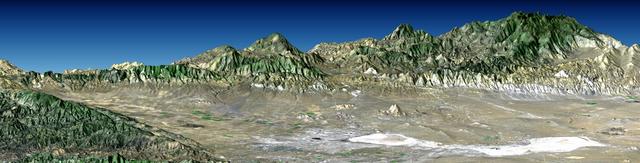
Antelope Valley is bounded by two of the most active faults in California: the Garlock fault, which fronts the distant mountains in this view, and the San Andreas fault, part of which is seen bounding the mountains in the left foreground.
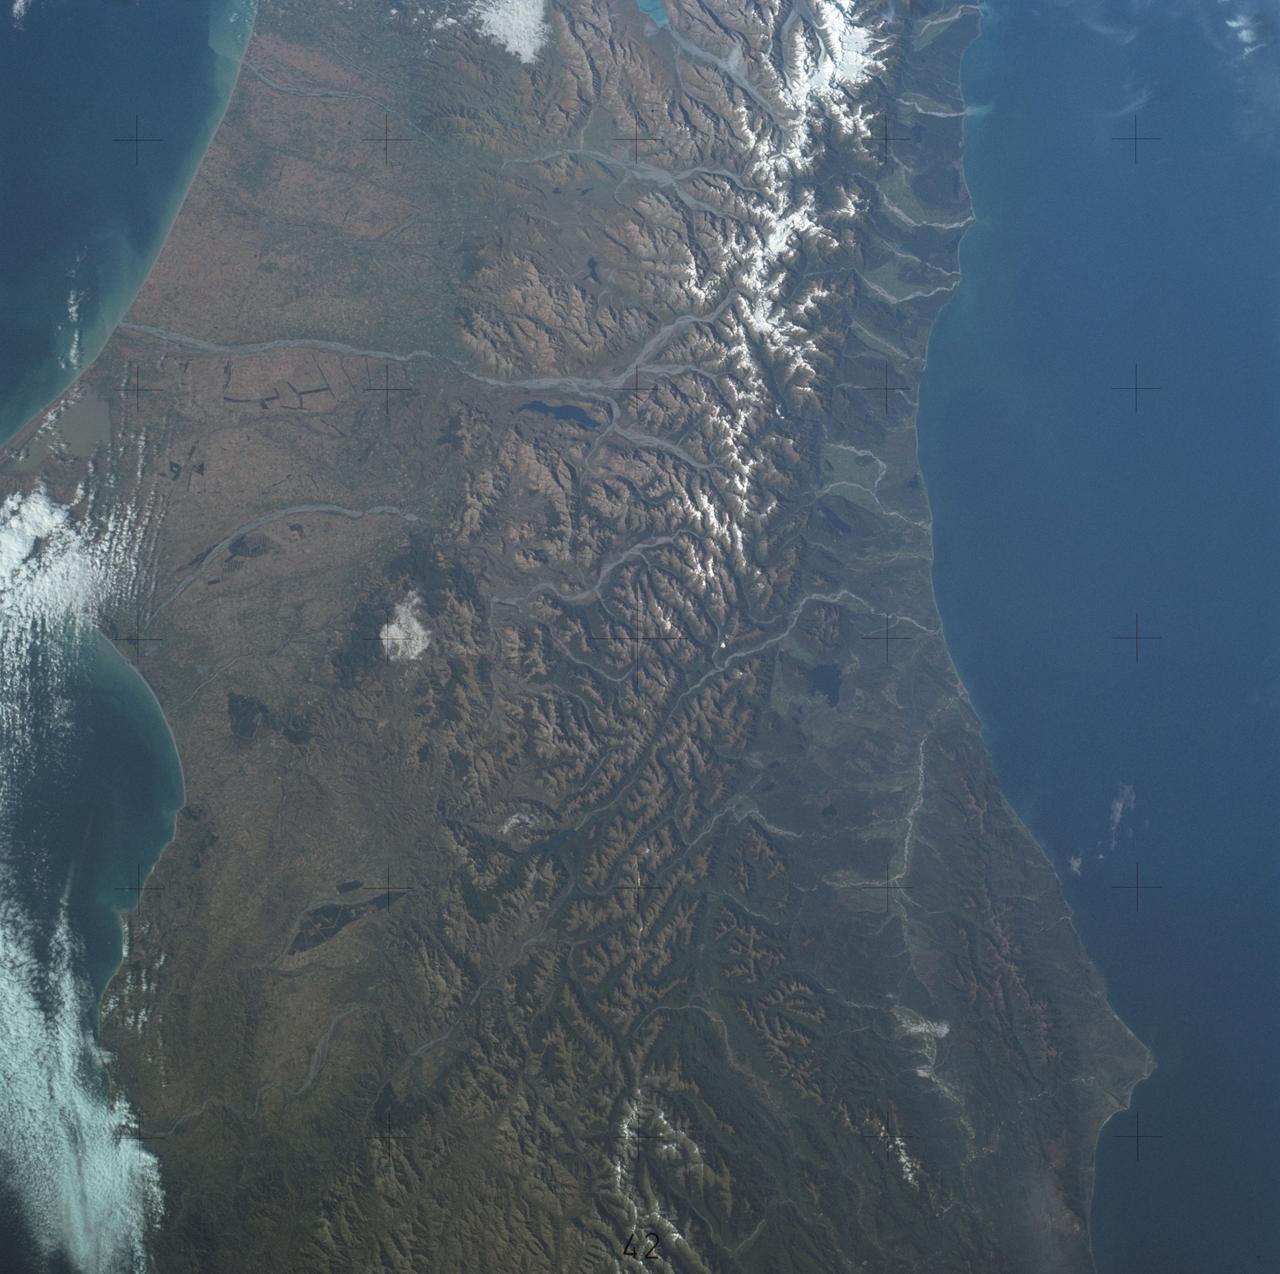
SL4-137-3700 (22 Dec. 1973) --- A near vertical view of a portion of South Island, New Zealand, as see from the Skylab space station in Earth orbit. This picture was taken by one of the Skylab 4 crew members with a handheld 70mm Hasselblad camera using a 100mm lens. The picture should be held with the largest body of water (Tasman Sea) on the left. Cape Foulwind is at the upper left. The City of Christchurch is under clouds at the center right margin. Note the movement of sediment by alongshore currents, especially on the east (right) side of the island. The Alpine Fault, which is part of the circum-Pacific volcanic-tectonic belt, is clearly visible on the left (west) side of the island. The fault line is marked by a scarp, which appears very distinct from orbital altitude. Differences in topography and vegetation on either side of the fault are also sharp. Streams change direction at the fault line, and the change in slope at the fault line is evident in the widening of stream channels. The left side of the fault has moved northeast (upward) relative to the right side; some stream offsets indicate the direction of relative movement, but others are controlled by local topography. The Alpine Fault, which also transects New Zealand's North Island, was photographed and described more than a dozen times by the Skylab 4 crewmen. The circum-Pacific volcanic-tectonic belt is a feature of the Earth's crust which is related to sea floor spreading and continental drift. Though the Alpine Fault is sharply delineated in this photograph, other major crustal features are subtle that their existence was unknown before their observation from orbit. The distance from top to bottom is about 290 kilometers (175 miles). Photo credit: NASA
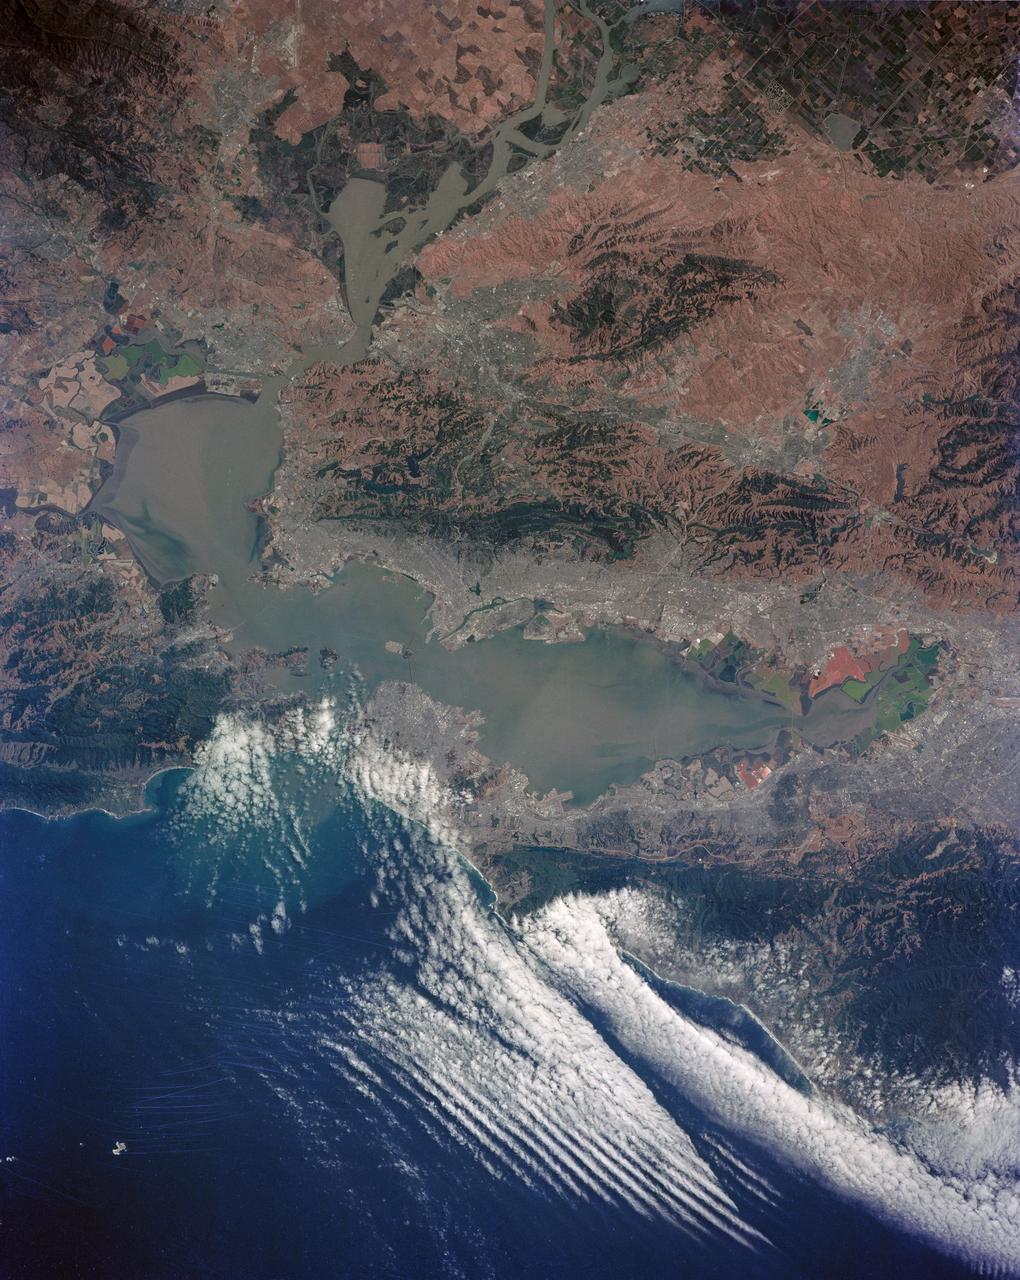
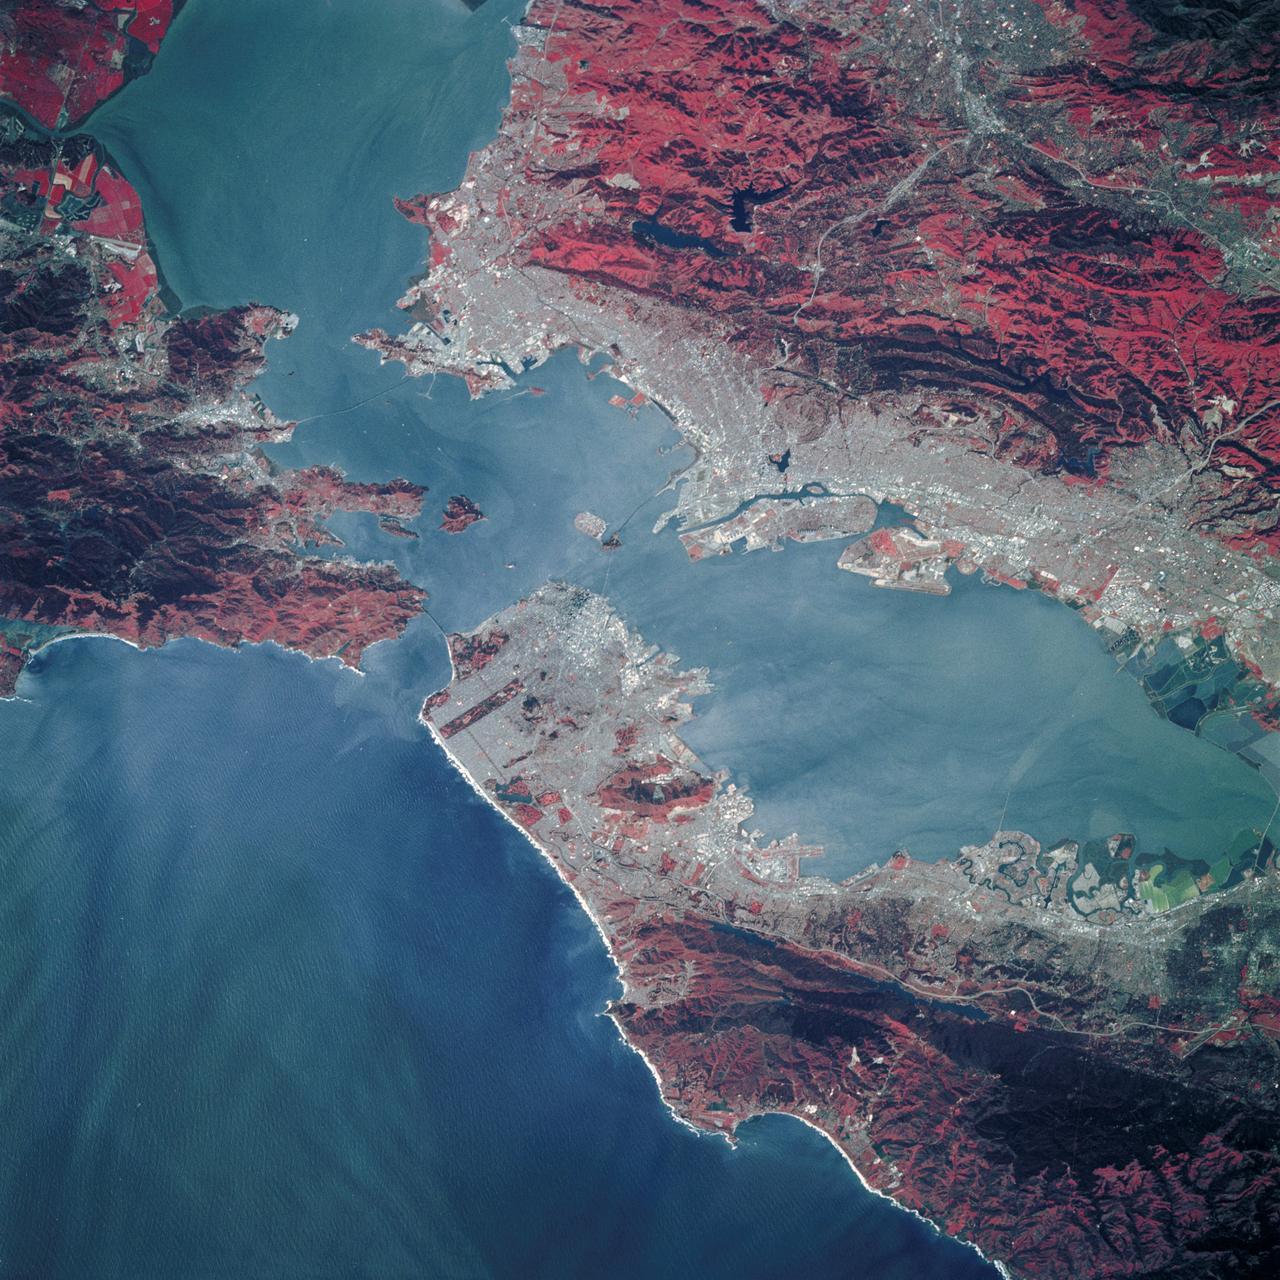
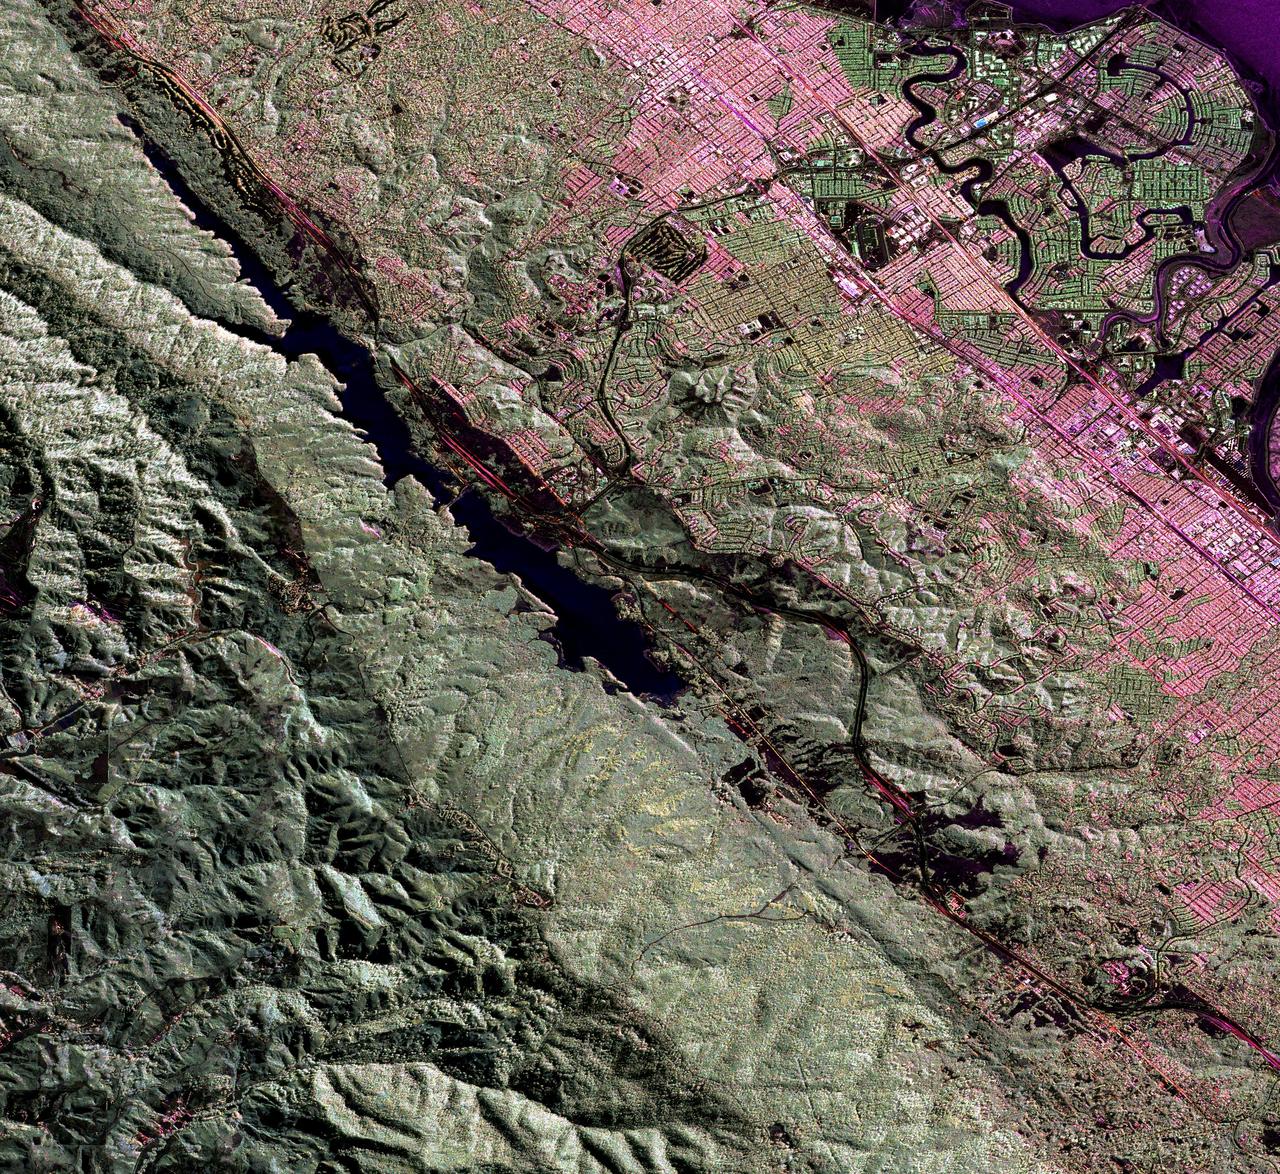
STS040-152-100 (5-14 June 1991) --- Although clouds obscure part of the city of San Francisco and the mouth of San Francisco Bay, development and physiographic features in the immediate vicinity of the bay are well displayed. The photograph clearly shows the eastern part of the city, including the Embarcadero, the Bay Bridge, which was damaged in the 1989 earthquake, and Candlestick Park, San Mateo, and Dumbarton Bridges, cross the southern portion of the bay. Vari-colored salt ponds also rim the southern Bay near Moffett Field. Highway 280 runs along the San Andreas fault south of the city. On the eastern margin of the bay are Berkeley the Sacramento River and the Haywood and Calaveras faults.
This faulted and eroded surface is part of Acheron Fossae
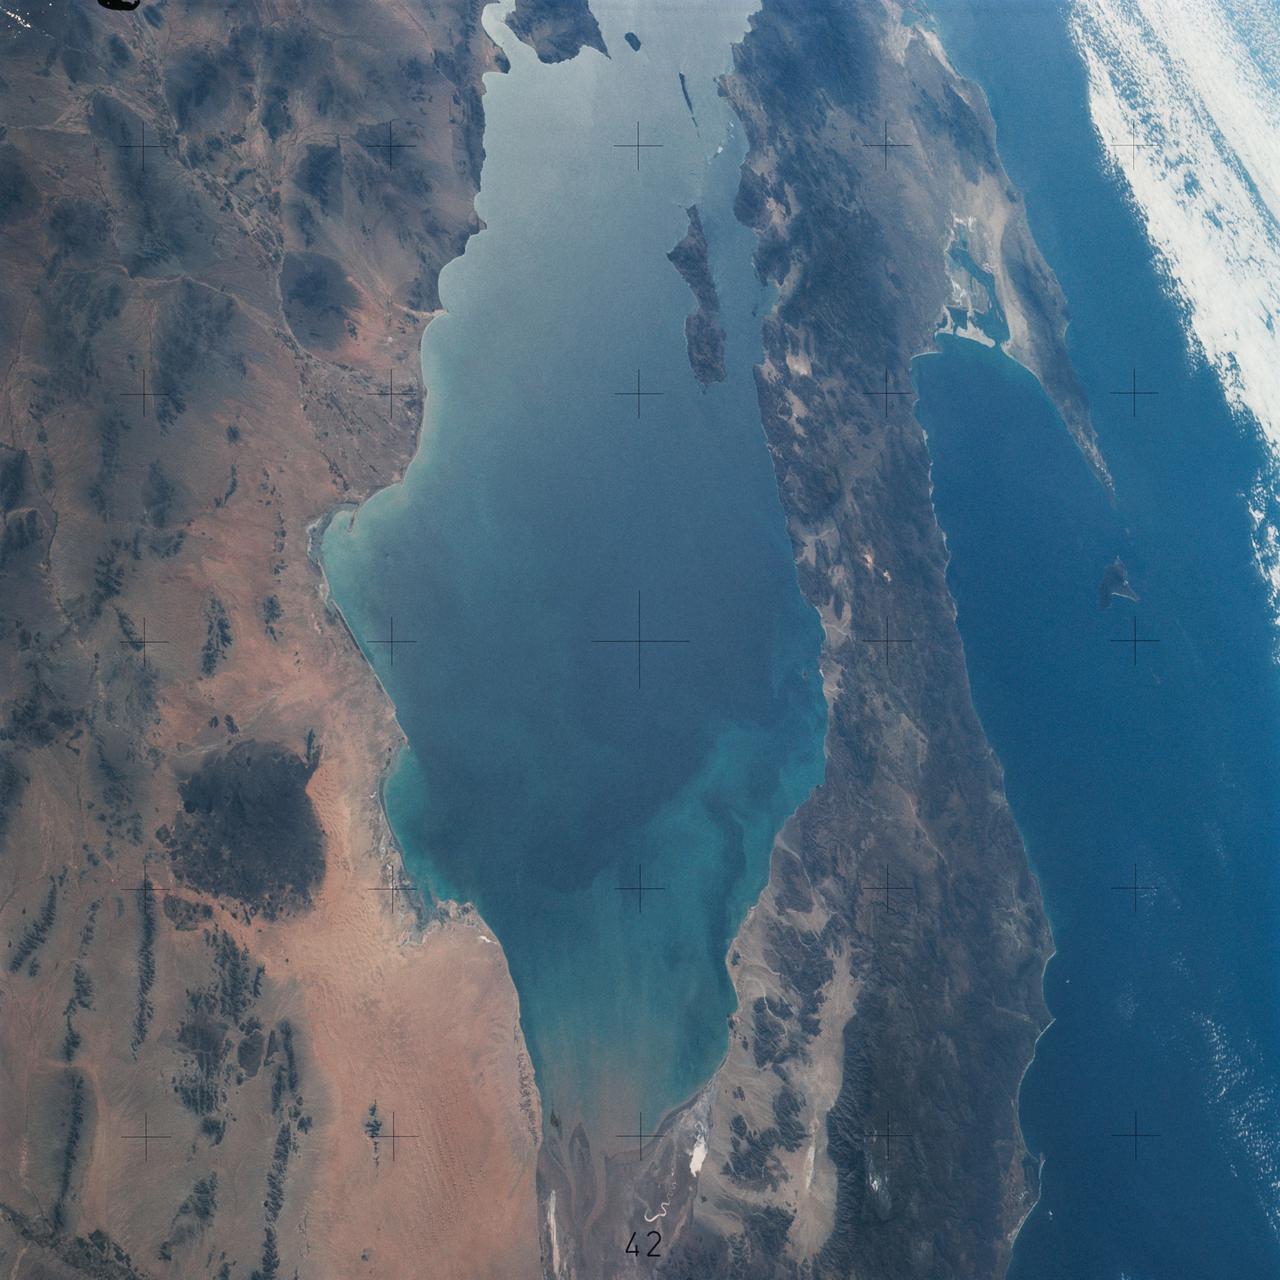
SL4-142-4548 (27 Jan. 1974) --- An oblique view of northwestern Mexico, as photographed from the Skylab space station in Earth orbit by one of the Skylab 4 crewmen. The camera used was a hand-held 70mm Hasselblad, with SO-368 medium-speed Ektachrome film. This photograph was taken on a sweep down the coast to document the fault patterns of southern California and northwest Mexico. SL4-142-4532 gives an excellent overview of the entire region. The specific reason for this picture was an attempt to see if the Agua Blanca Fault in Baja California extends to the east toward the Gulf of California. Several attempts were made by the Skylab 4 crew to visually detect such an extension, but none was found. The report was that the fault disappeared into an area of sand and heavily eroded material that obscured any feature that might be present deeper. This area of sand and loose material is the light-colored area in the center of Baja at the extreme north part of the photograph. In addition to this geology the Pinacate volcanic field in Sonora, the sand dunes in Sonora, and the sediment flow patterns of the Colorado River entering the Gulf are additional areas of study utilizing this photograph. Photo credit: NASA
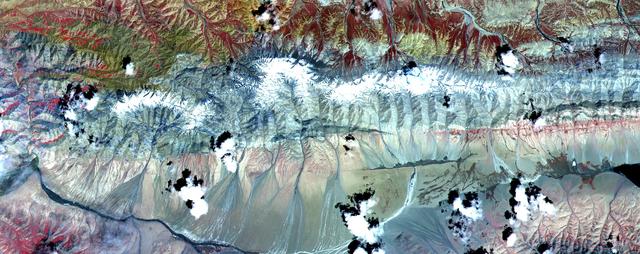
The Kunlun fault is one of the gigantic strike-slip faults that bound the north side of Tibet. Left-lateral motion along the 1,500-kilometer (932-mile) length of the Kunlun has occurred uniformly for the last 40,000 years at a rate of 1.1 centimeter per year, creating a cumulative offset of more than 400 meters (1300 feet). In this image, two splays of the fault are clearly seen crossing from east to west. The northern fault juxtaposes sedimentary rocks of the mountains against alluvial fans. Its trace is also marked by lines of vegetation, which appear red in the image. The southern, younger fault cuts through the alluvium. A dark linear area in the center of the image is wet ground where groundwater has pounded against the fault. Measurements from the image of displacements of young streams that cross the fault show 15 to 75 meters (16 to 82 yards) of left-lateral offset. This image of Tibet covers an area 40 kilometers (25 miles) wide and 15 kilometers (10 miles) long in three bands of the reflected visible and infrared wavelength region. ASTER acquired the scene on July 20, 2000. The image is located at 35.8 degrees north latitude and 93.6 degrees east longitude. http://photojournal.jpl.nasa.gov/catalog/PIA02658

The linear depressions in this image from NASA 2001 Mars Odyssey spacecraft are called graben. Graben are bounded on both sides by faults, and the central material has shifted downward between the faults.
The parallel sides and low interior seen in this image from NASA 2001 Mars Odyssey spacecraft are faults and down-dropped material between the faults. This tectonic feature is called a graben. The graben in this image is located in Daedalia Planum.
This VIS image shows part of Cerunius Fossae. The linear depressions are fault bounded features called graben. Graben are formed by extension of the crust and faulting. When large amounts of pressure or tension are applied to rocks on timescales that are fast enough that the rock cannot respond by deforming, the rock breaks along faults. In the case of a graben, two parallel faults are formed by extension of the crust and the rock in between the faults drops downward into the space created by the extension. The largest graben in this THEMIS image trends from almost north/south. Because the faults defining the graben are formed perpendicular to the direction of the applied stress, we know that extensional forces were pulling the crust apart in the east/west direction. Ceraunius Fossae is located on the southern part of Alba Mons and is 1166km (724 miles) long. Orbit Number: 94210 Latitude: 32.086 Longitude: 247.58 Instrument: VIS Captured: 2023-03-11 14:09 https://photojournal.jpl.nasa.gov/catalog/PIA25991
This VIS image shows part of Cerunius Fossae. The linear depressions are fault bounded features called graben. Graben are formed by extension of the crust and faulting. When large amounts of pressure or tension are applied to rocks on timescales that are fast enough that the rock cannot respond by deforming, the rock breaks along faults. In the case of a graben, two parallel faults are formed by extension of the crust and the rock in between the faults drops downward into the space created by the extension. Numerous sets of graben are visible in this THEMIS image, trending from north-northeast to south-southwest. Because the faults defining the graben are formed perpendicular to the direction of the applied stress, we know that extensional forces were pulling the crust apart in the north-northeast/south-southwest direction. Orbit Number: 93611 Latitude: 29.5294 Longitude: 247.628 Instrument: VIS Captured: 2023-01-21 06:29 https://photojournal.jpl.nasa.gov/catalog/PIA25854
The linear features in this VIS image are graben called Sirenum Fossae. Graben are formed when blocks of material move downward between parallel faults. The faults were created by tectonic stresses in this region. The ground is pulling apart and breaks into faults, continued stress moves the sides of the faults further apart and form the graben. Orbit Number: 75220 Latitude: -31.3869 Longitude: 208.356 Instrument: VIS Captured: 2018-11-28 20:39 https://photojournal.jpl.nasa.gov/catalog/PIA22989
The linear depressions in today's VIS image are part of Nili Fossae. Nili Fossae is a collection of curved faults and down-dropped blocks of crust between the faults called graben. The graben lie northeast of the large volcano Syrtis Major and northwest of the ancient impact basin Isidis Planitia. Graben are formed by extension of the crust and faulting. When large amounts of pressure or tension are applied to rocks on timescales that are fast enough that the rock cannot respond by deforming, the rock breaks along faults. In the case of a graben, two parallel faults are formed by extension of the crust and the rock in between the faults drops downward into the space created by the extension. The crustal deformation in this region was in response to the basin forming event that created Isidis Planitia. The Nili Fossae graben arc around the northwestern edge of the planitia. The graben occur in many different widths. Orbit Number: 88919 Latitude: 22.3384 Longitude: 77.6092 Instrument: VIS Captured: 2021-12-30 21:37 https://photojournal.jpl.nasa.gov/catalog/PIA25343
The linear depressions in today's VIS image are part of Nili Fossae. Nili Fossae is a collection of curved faults and down-dropped blocks of crust between the faults called graben. The graben lie northeast of the large volcano Syrtis Major and northwest of the ancient impact basin Isidis Planitia. Graben are formed by extension of the crust and faulting. When large amounts of pressure or tension are applied to rocks on timescales that are fast enough that the rock cannot respond by deforming, the rock breaks along faults. In the case of a graben, two parallel faults are formed by extension of the crust and the rock in between the faults drops downward into the space created by the extension. The crustal deformation in this region was in response to the basin forming event that created Isidis Planitia. The Nili Fossae graben arc around the northwestern edge of the planitia. The graben occur in many different widths. Orbit Number: 88033 Latitude: 22.7248 Longitude: 78.5195 Instrument: VIS Captured: 2021-10-18 22:43 https://photojournal.jpl.nasa.gov/catalog/PIA25114
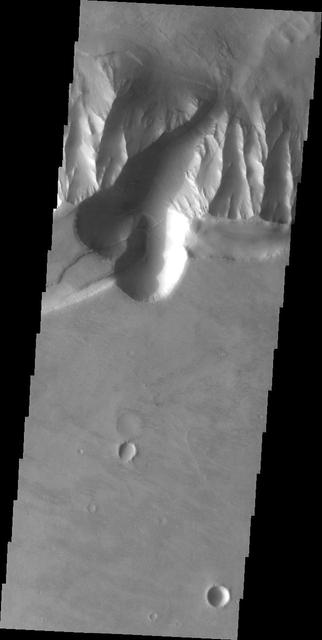
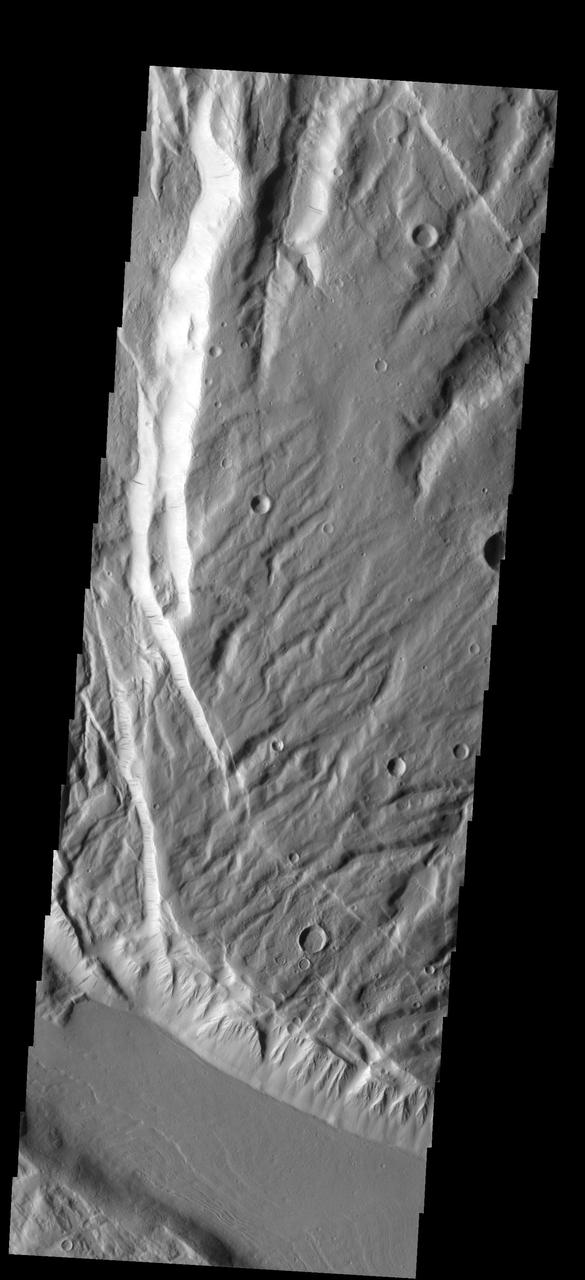
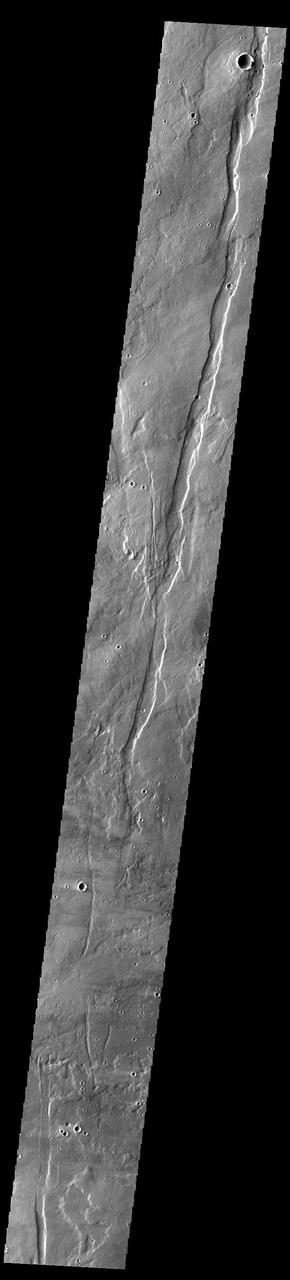
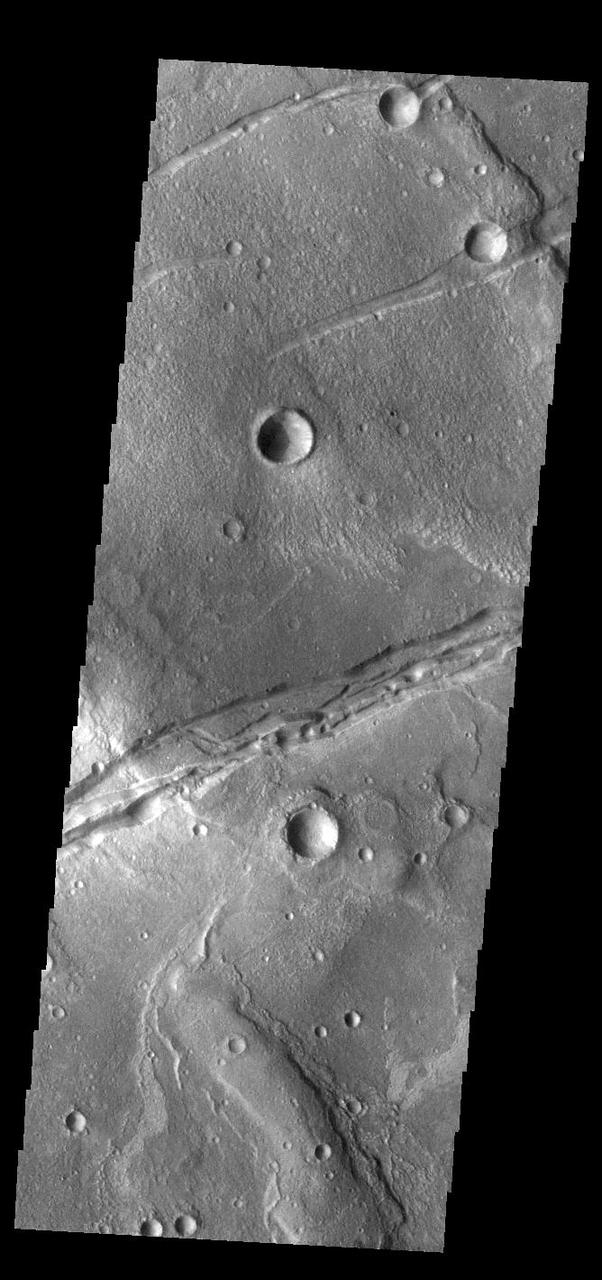
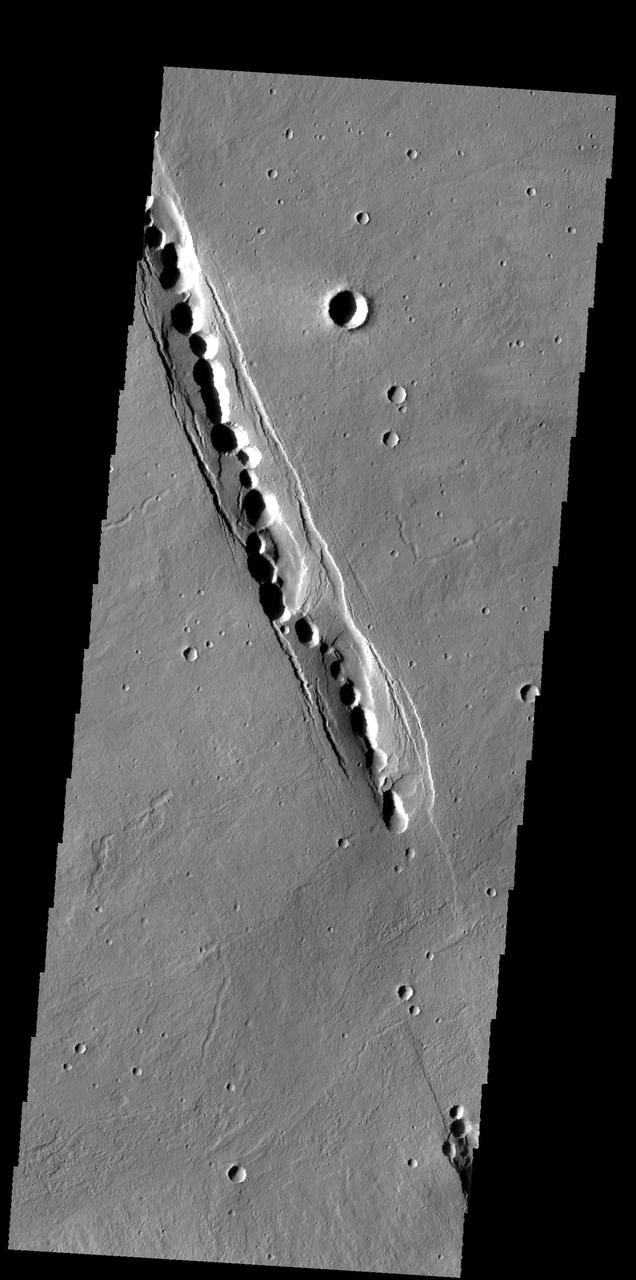
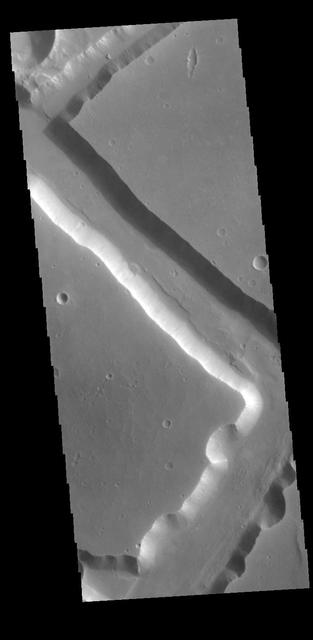
The linear wall at the bottom of this image from NASA 2001 Mars Odyssey spacecraft is a fault. The linear depression caused by faulting is part of a long depression called Mangala Fossae. Orbit Number: 58979 Latitude: -17.9823 Longitude: 210.806 Instrument: VIS Captured: 2015-04-01 00:54 http://photojournal.jpl.nasa.gov/catalog/PIA19468
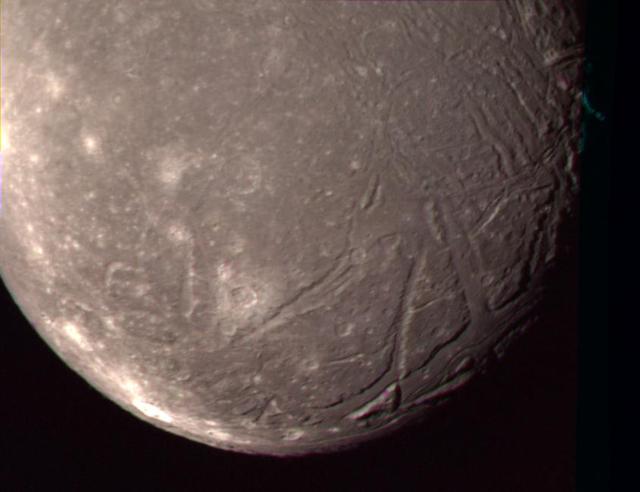
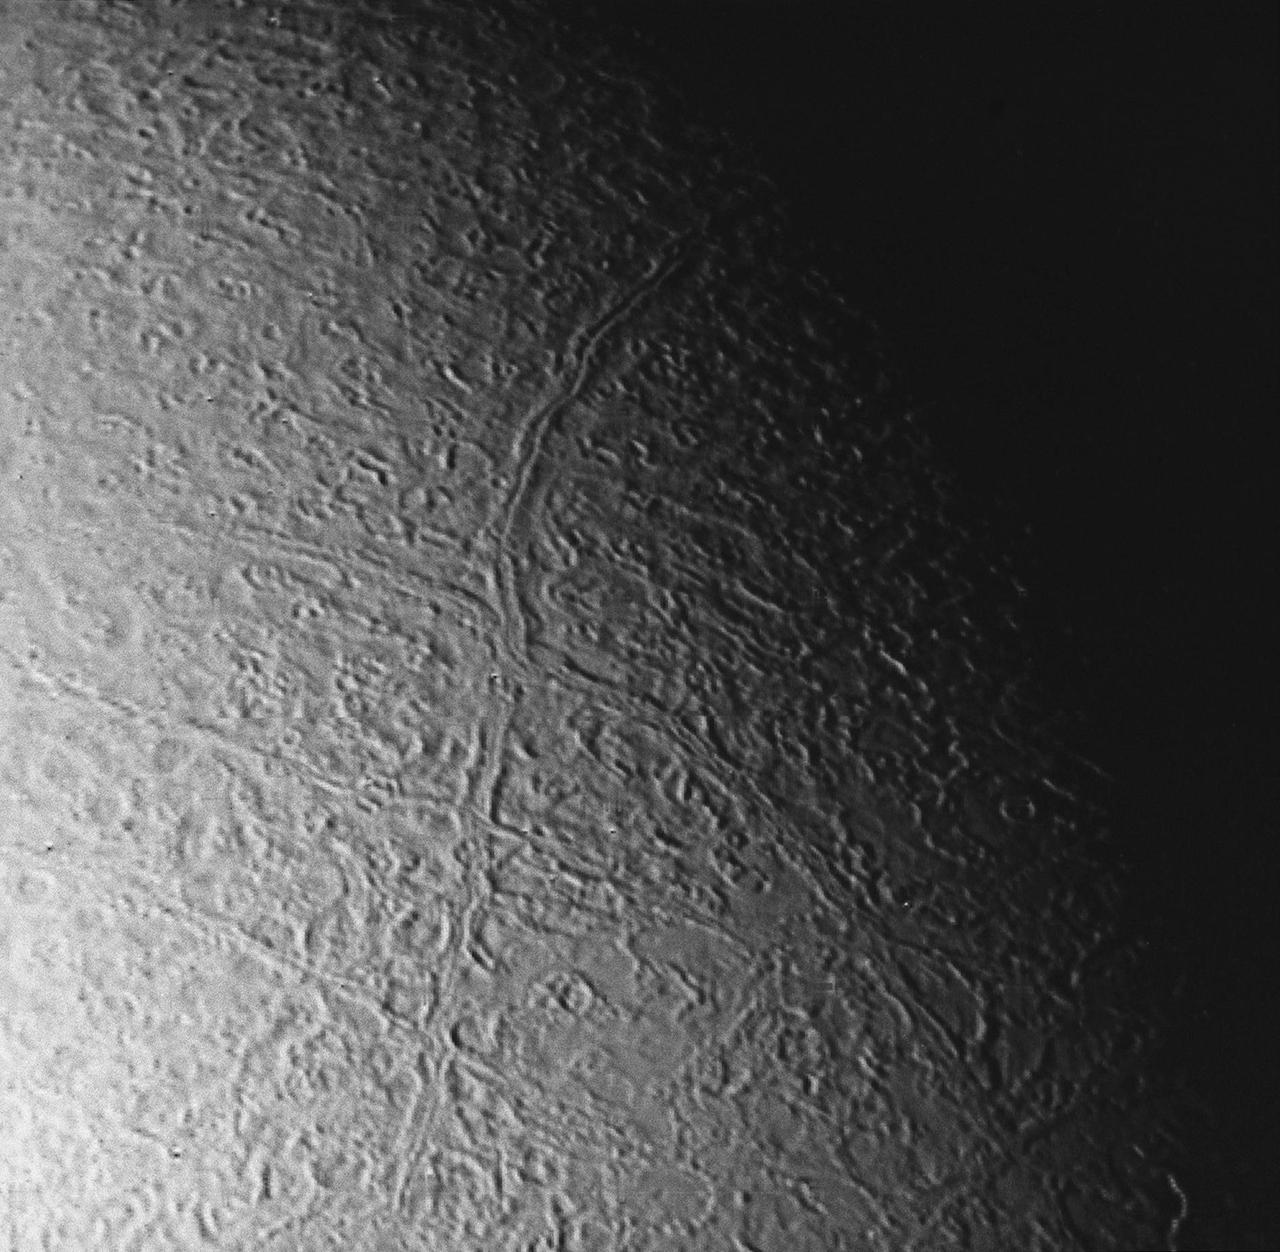
On Jan. 24, 1986, NASA Voyager 2 obtained this color picture of the Uranian moon, Ariel. Most of the visible surface consists of relatively intensely cratered terrain transected by fault scarps and fault-bounded valleys graben. http://photojournal.jpl.nasa.gov/catalog/PIA00041
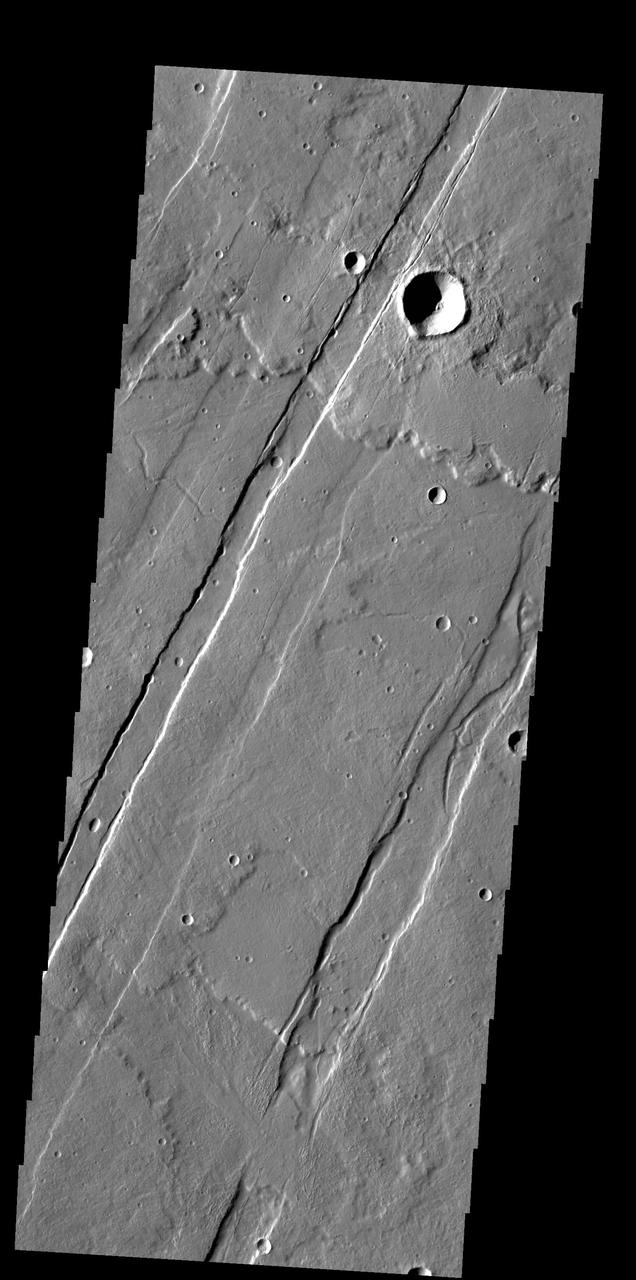
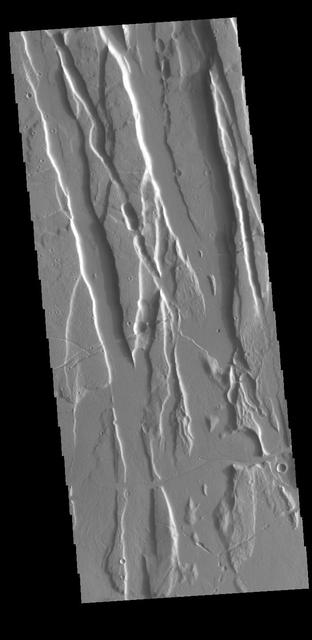
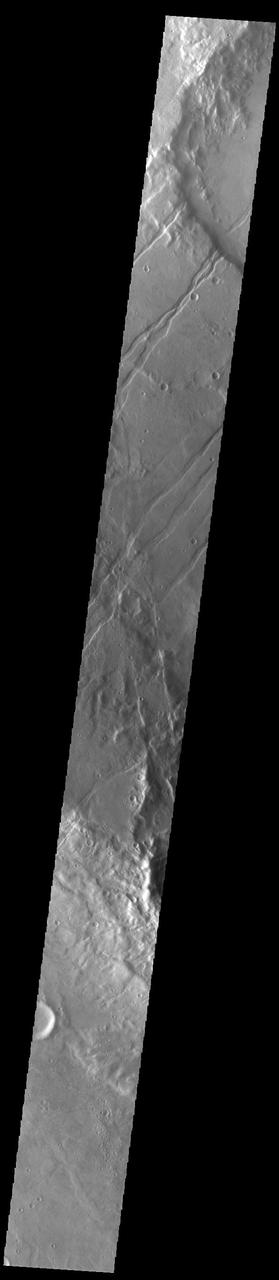
The Tharsis region of Mars is an immense region of volcanos, lava flows, and tectonic faulting. The entire area is a topographic bulge, with extensional stresses. The extension allowed magma to rise to the surface, creating the largest areal (Alba Mons) and tallest (Olympus Mons) volcanoes in the solar system. The extension also created faults and fractures. This VIS image shows some of the tectonic faults in the region. Orbit Number: 81214 Latitude: 10.0823 Longitude: 240.355 Instrument: VIS Captured: 2020-04-05 11:31 https://photojournal.jpl.nasa.gov/catalog/PIA23943
![Lyot Crater (220-kilometers in diameter) is located in the Northern lowlands of Mars. The crater's floor marks the lowest elevation in the Northern Hemisphere as seen in this image from NASA's Mars Reconnaissance Orbiter (MRO). On the crater's floor, we see a network of channels. connecting a series of irregular shaped pits. These resemble terrestrial beaded streams, which are common in the Arctic regions of Earth and develop from uneven permafrost thawing. If terrestrial beaded streams are a good analog, these landforms suggest liquid water flow in the past. If not then these pits may result from the process of sublimation and would indicate pockets of easily accessible near-surface ground ice, which might have potentially preserved evidence of past habitability. The map is projected here at a scale of 25 centimeters (9.8 inches) per pixel. [The original image scale is 12.2 centimeters (9.8 inches) per pixel (with 1 x 1 binning); objects on the order of 93 centimeters (36.6 inches) across are resolved.] North is up. https://photojournal.jpl.nasa.gov/catalog/PIA22186](https://images-assets.nasa.gov/image/PIA22187/PIA22187~medium.jpg)
Lyot Crater (220-kilometers in diameter) is located in the Northern lowlands of Mars. The crater's floor marks the lowest elevation in the Northern Hemisphere as seen in this image from NASA's Mars Reconnaissance Orbiter (MRO). On the crater's floor, we see a network of channels. connecting a series of irregular shaped pits. These resemble terrestrial beaded streams, which are common in the Arctic regions of Earth and develop from uneven permafrost thawing. If terrestrial beaded streams are a good analog, these landforms suggest liquid water flow in the past. If not then these pits may result from the process of sublimation and would indicate pockets of easily accessible near-surface ground ice, which might have potentially preserved evidence of past habitability. The map is projected here at a scale of 25 centimeters (9.8 inches) per pixel. [The original image scale is 12.2 centimeters (9.8 inches) per pixel (with 1 x 1 binning); objects on the order of 93 centimeters (36.6 inches) across are resolved.] North is up. https://photojournal.jpl.nasa.gov/catalog/PIA22186
This VIS image shows part of Mangala Fossae. Fossae are long linear depressions called a graben and were formed by extension of the crust and faulting. When large amounts of pressure or tension are applied to rocks on timescales that are fast enough that the rock cannot respond by deforming, the rock breaks along faults. In the case of a graben, two parallel faults are formed by extension of the crust and the rock in between the faults drops downward into the space created by the extension. Mangala Fossae is 828 km long (514 miles). Orbit Number: 91672 Latitude: -15.2701 Longitude: 219.213 Instrument: VIS Captured: 2022-08-14 13:49 https://photojournal.jpl.nasa.gov/catalog/PIA25619
Mangala Fossae is a long linear depression called a graben and was formed by extension of the crust and faulting. When large amounts of pressure or tension are applied to rocks on timescales that are fast enough that the rock cannot respond by deforming, the rock breaks along faults. In the case of a graben, two parallel faults are formed by extension of the crust and the rock in between the faults drops downward into the space created by the extension. Mangala Fossae is 828 km long (514 miles). Orbit Number: 88715 Latitude: -19.129 Longitude: 208.571 Instrument: VIS Captured: 2021-12-14 02:14 https://photojournal.jpl.nasa.gov/catalog/PIA25297
This image captured by NASA 2001 Mars Odyssey spacecraft shows several of the graben fault bounded depression that are part of Acheron Catena.

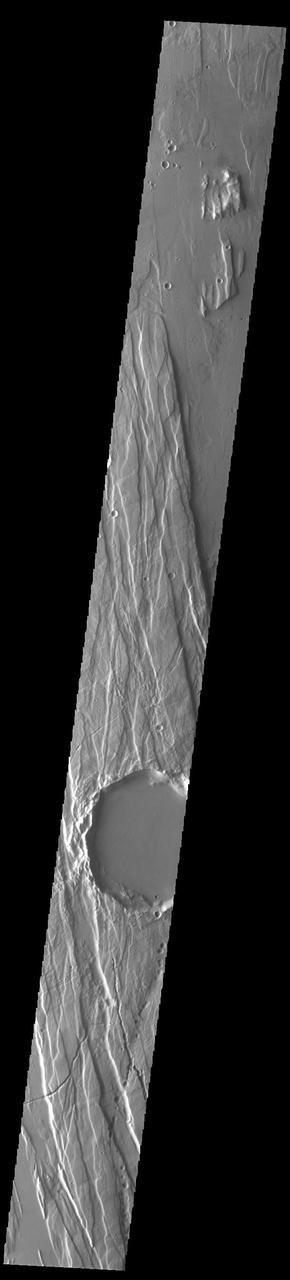
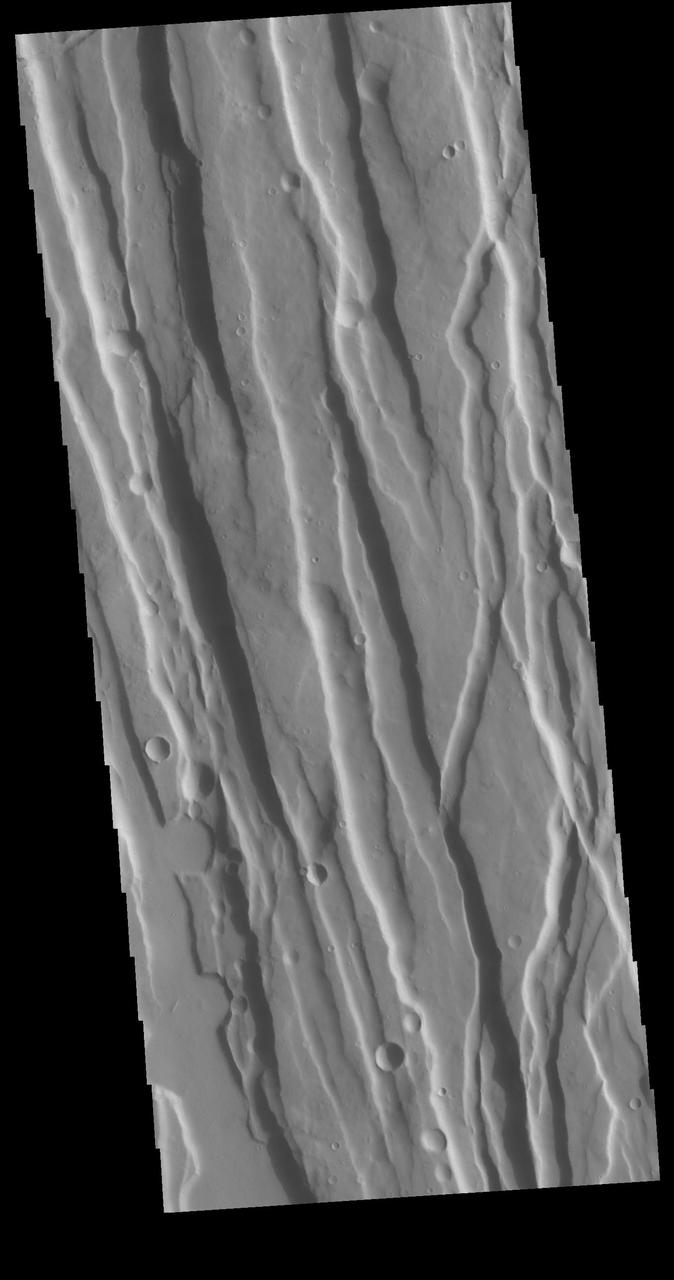
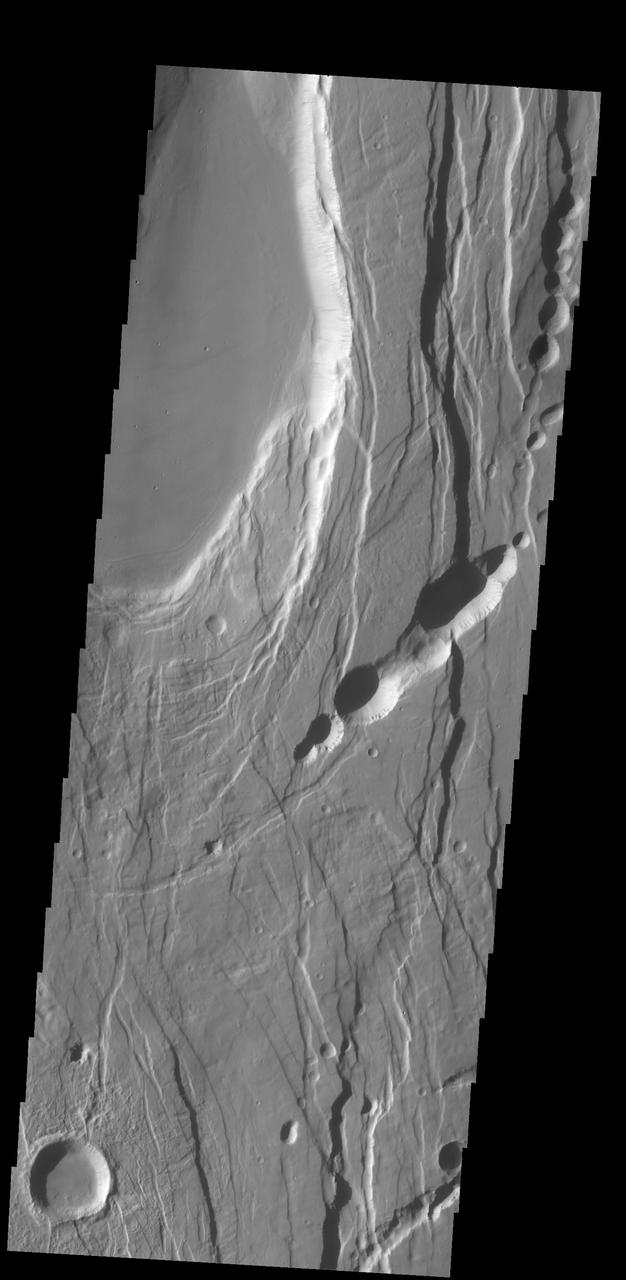
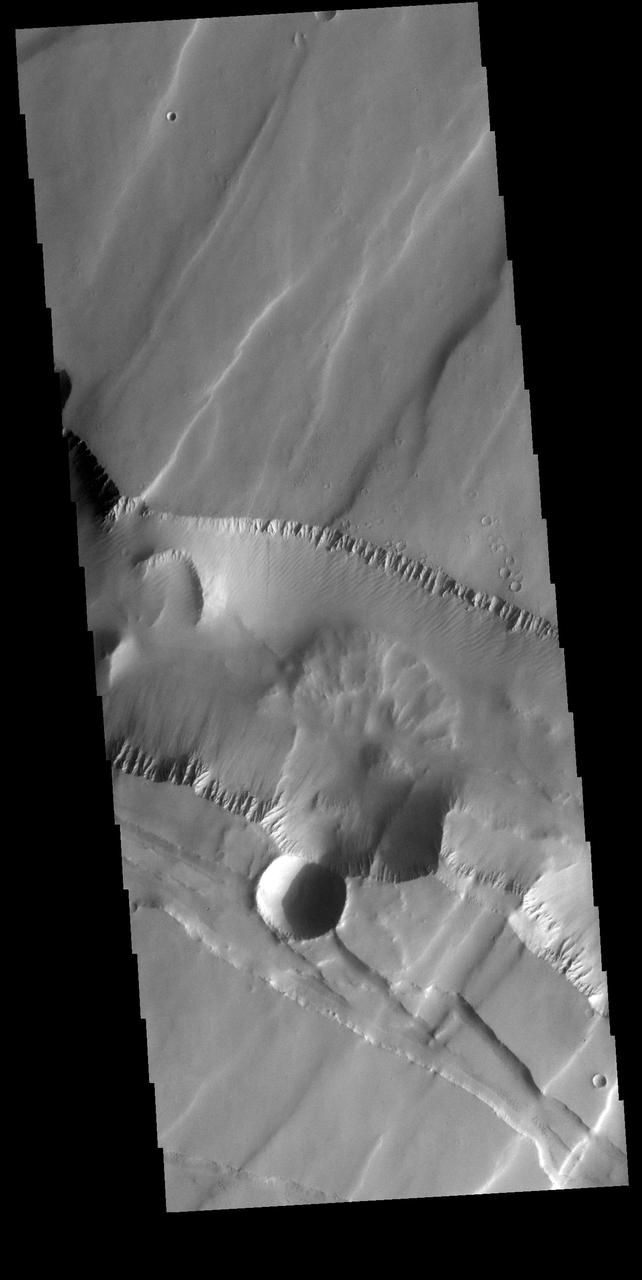
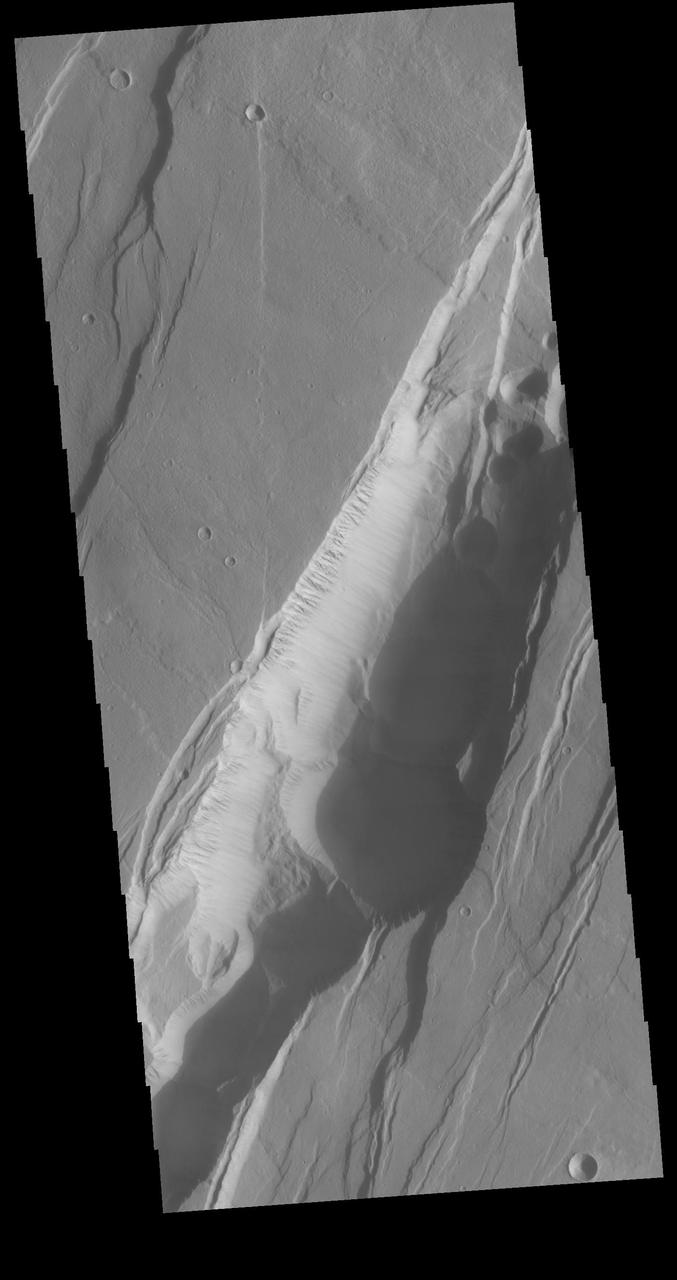
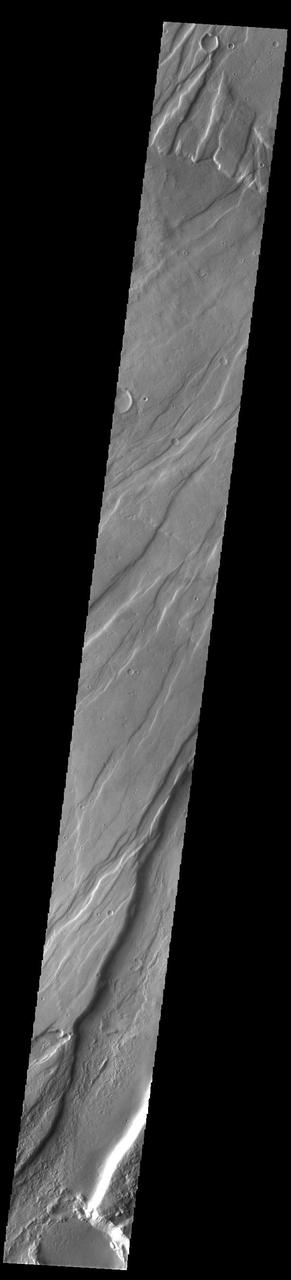
This image shows part of the western flank of Pavonis Mons. The linear features are faults. Faulting usually includes change of elevation, where blocks of material slide down the fault. Paired faults are call graben. The large depression is a graben, whereas most of the other faults are not paired. The rougher looking materials perpendicular to the faults are lava flows. "Down hill" is to the upper left corner of the image. Pavonis Mons is one of the three aligned Tharsis Volcanoes. The four Tharsis volcanoes are Ascreaus Mons, Pavonis Mons, Arsia Mons, and Olympus Mars. All four are shield type volcanoes. Shield volcanoes are formed by lava flows originating near or at the summit, building up layers upon layers of lava. The Hawaiian islands on Earth are shield volcanoes. The three aligned volcanoes are located along a topographic rise in the Tharsis region. Along this trend there are increased tectonic features and additional lava flows. Pavonis Mons is the smallest of the four volcanoes, rising 14km above the mean Mars surface level with a width of 375km. It has a complex summit caldera, with the smallest caldera deeper than the larger caldera. Like most shield volcanoes the surface has a low profile. In the case of Pavonis Mons the average slope is only 4 degrees. The Odyssey spacecraft has spent over 15 years in orbit around Mars, circling the planet more than 69000 times. It holds the record for longest working spacecraft at Mars. THEMIS, the IR/VIS camera system, has collected data for the entire mission and provides images covering all seasons and lighting conditions. Over the years many features of interest have received repeated imaging, building up a suite of images covering the entire feature. From the deepest chasma to the tallest volcano, individual dunes inside craters and dune fields that encircle the north pole, channels carved by water and lava, and a variety of other feature, THEMIS has imaged them all. For the next several months the image of the day will focus on the Tharsis volcanoes, the various chasmata of Valles Marineris, and the major dunes fields. We hope you enjoy these images! Orbit Number: 14857 Latitude: 1.4859 Longitude: 245.996 Instrument: VIS Captured: 2005-04-20 17:00 https://photojournal.jpl.nasa.gov/catalog/PIA22017
The linear features in this image are part of Mangala Fossae. Mangala Fossae are long linear depressions called a graben and were formed by extension of the crust and faulting. When large amounts of pressure or tension are applied to rocks on timescales that are fast enough that the rock cannot respond by deforming, the rock breaks along faults. In the case of a graben, two parallel faults are formed by extension of the crust and the rock in between the faults drops downward into the space created by the extension. Mangala Fossae is 828 km long (514 miles). Orbit Number: 91822 Latitude: -19.0175 Longitude: 212.283 Instrument: VIS Captured: 2022-08-26 22:12 https://photojournal.jpl.nasa.gov/catalog/PIA25650
STS039-89-053 (28 April-6 May 1991) --- A 70mm, infrared frame of the city of San Francisco, taken on a clear day. The gray areas represent urban regions, and the red areas are vegetated. Within the city of San Francisco, parks like Golden Gate park and the Presidio at the base of the Golden Gate Bridge easily stand out from the well-developed parts of the city. Major thoroughfares and bridges (Golden Gate and Bay Bridges) are seen as are other landmarks such as Candlestick Park and Alcatraz. The trace of the San Andreas faults show as a straight valley running northerly along the San Francisco peninsula. Good detail is visible in the turbid waters of San Francisco Bay.
Mangala Fossae is a long linear depression called a graben and was formed by extension of the crust and faulting. When large amounts of pressure or tension are applied to rocks on timescales that are fast enough that the rock cannot respond by deforming, the rock breaks along faults. In the case of a graben, two parallel faults are formed by extension of the crust and the rock in between the faults drops downward into the space created by the extension. At the right side of the image the graben enters an impact crater, and creates a complex group of tectonic fractures and depressions. Mangala Fossae is 828 km long (514 miles). Orbit Number: 91061 Latitude: -19.2481 Longitude: 206.825 Instrument: VIS Captured: 2022-06-25 06:21 https://photojournal.jpl.nasa.gov/catalog/PIA25533
The linear depressions in this VIS image were created by tectonic forces. The sides of the depression are faults. Paired faults will allow the block of material between them to "slide down" during marsquake events, forming the depressions. Orbit Number: 77132 Latitude: 30.5611 Longitude: 285.586 Instrument: VIS Captured: 2019-05-05 08:37 https://photojournal.jpl.nasa.gov/catalog/PIA23260
This VIS image shows part of Ceraunius Fossae. The linear depressions are fault bounded features called graben. Graben form from tectonic forces that are pulling apart the surface, created space for material to "slide down" along the fault. Alba Mons is surrounded by extensive regions of closely spaced graben. Ceraunius Fossae is located south of Alba Mons. Orbit Number: 78406 Latitude: 27.7831 Longitude: 248.084 Instrument: VIS Captured: 2019-08-18 06:29 https://photojournal.jpl.nasa.gov/catalog/PIA23484
This VIS image shows part of Cerunius Fossae. The linear depressions are fault bounded features called graben. These features form from tectonic forces that are pulling apart the surface, created space for material to "slide down" along the fault. Orbit Number: 77308 Latitude: 26.9347 Longitude: 248.025 Instrument: VIS Captured: 2019-05-19 20:27 https://photojournal.jpl.nasa.gov/catalog/PIA23283
Today's VIS image shows a portion of Sirenum Fossae. The linear features are tectonic graben. Graben are formed by extension of the crust and faulting. When large amounts of pressure or tension are applied to rocks on timescales that are fast enough that the rock cannot respond by deforming, the rock breaks along faults. In the case of a graben, two parallel faults are formed by extension of the crust and the rock in between the faults drops downward into the space created by the extension. Numerous sets of graben are visible in this THEMIS image, trending from north-northeast to south-southwest. Because the faults defining the graben are formed perpendicular to the direction of the applied stress, we know that extensional forces were pulling the crust apart in the west-northwest/east-southeast direction. The Sirenum Fossae graben are 2735km (1700 miles) long and stretch from eastern Terra Sirenum into western Daedalia Planum. Orbit Number: 92627 Latitude: -27.7786 Longitude: 216.392 Instrument: VIS Captured: 2022-11-01 04:18 https://photojournal.jpl.nasa.gov/catalog/PIA25766
Today's VIS image shows a portion of Sirenum Fossae. The linear features are tectonic graben. Graben are formed by extension of the crust and faulting. When large amounts of pressure or tension are applied to rocks on timescales that are fast enough that the rock cannot respond by deforming, the rock breaks along faults. In the case of a graben, two parallel faults are formed by extension of the crust and the rock in between the faults drops downward into the space created by the extension. Numerous sets of graben are visible in this THEMIS image, trending from north-northeast to south-southwest. Because the faults defining the graben are formed perpendicular to the direction of the applied stress, we know that extensional forces were pulling the crust apart in the west-northwest/east-southeast direction. The Sirenum Fossae graben are 2735km (1700 miles) long and stretch from eastern Terra Sirenum into western Daedalia Planum. Orbit Number: 91816 Latitude: -29.2208 Longitude: 213.139 Instrument: VIS Captured: 2022-08-26 09:39 https://photojournal.jpl.nasa.gov/catalog/PIA25645
Today's VIS image shows a portion of Sirenum Fossae. The linear features are tectonic graben. Graben are formed by extension of the crust and faulting. When large amounts of pressure or tension are applied to rocks on timescales that are fast enough that the rock cannot respond by deforming, the rock breaks along faults. In the case of a graben, two parallel faults are formed by extension of the crust and the rock in between the faults drops downward into the space created by the extension. Numerous sets of graben are visible in this THEMIS image, trending from north-northeast to south-southwest. Because the faults defining the graben are formed perpendicular to the direction of the applied stress, we know that extensional forces were pulling the crust apart in the west-northwest/east-southeast direction. The Sirenum Fossae graben are 2735km (1700 miles) long and stretch from eastern Terra Sirenum into western Daedalia Planum. Orbit Number: 92416 Latitude: -39.2691 Longitude: 181.857 Instrument: VIS Captured: 2022-10-14 19:23 https://photojournal.jpl.nasa.gov/catalog/PIA25758
Today's VIS image shows a portion of Sirenum Fossae. The linear features are tectonic graben. Graben are formed by extension of the crust and faulting. When large amounts of pressure or tension are applied to rocks on timescales that are fast enough that the rock cannot respond by deforming, the rock breaks along faults. In the case of a graben, two parallel faults are formed by extension of the crust and the rock in between the faults drops downward into the space created by the extension. Numerous sets of graben are visible in this THEMIS image, trending from north-northeast to south-southwest. Because the faults defining the graben are formed perpendicular to the direction of the applied stress, we know that extensional forces were pulling the crust apart in the west-northwest/east-southeast direction. The Sirenum Fossae graben are 2735km (1700 miles) long and stretch from eastern Terra Sirenum into western Daedalia Planum. Orbit Number: 92253 Latitude: -32.4503 Longitude: 205.396 Instrument: VIS Captured: 2022-10-01 09:14 https://photojournal.jpl.nasa.gov/catalog/PIA25753
Today's VIS image shows a portion of Sirenum Fossae. The linear features are tectonic graben. Graben are formed by extension of the crust and faulting. When large amounts of pressure or tension are applied to rocks on timescales that are fast enough that the rock cannot respond by deforming, the rock breaks along faults. In the case of a graben, two parallel faults are formed by extension of the crust and the rock in between the faults drops downward into the space created by the extension. Numerous sets of graben are visible in this THEMIS image, trending from north-northeast to south-southwest. Because the faults defining the graben are formed perpendicular to the direction of the applied stress, we know that extensional forces were pulling the crust apart in the west-northwest/east-southeast direction. The Sirenum Fossae graben are 2735km (1700 miles) long and stretch from eastern Terra Sirenum into western Daedalia Planum. Orbit Number: 93139 Latitude: -32.2816 Longitude: 204.773 Instrument: VIS Captured: 2022-12-13 08:06 https://photojournal.jpl.nasa.gov/catalog/PIA25842
This VIS image shows several linear depressions called graben. Graben are formed due to extensional tectonic stresses, creating linear faults that allow subsidence of blocks of material between paired faults. At the top of the image several graben of Mangala Fossae intersect an impact crater. The other graben in the rest of the image are part of Memnonia Fossae. Both sets of fossae cross between Terra Sirenum and Daedalia Planum. Orbit Number: 83137 Latitude: -19.9645 Longitude: 207.232 Instrument: VIS Captured: 2020-09-10 19:29 https://photojournal.jpl.nasa.gov/catalog/PIA24190
This image of Triton was taken on Aug. 25 1989 by NASA Voyager 2. The image was received at JPL four hours later at about 4:20 a.m. The smallest detail that can be seen is about 2.5 kilometers 1.5 miles across.
This image is a false-color composite of three channels of the UAVSAR polarimetric data acquired over the San Andreas Fault west of San Mateo, California.
The defining landmarks of San Francisco, its bay and the San Andreas Fault are clearly seen in this computer-generated perspective viewed from the south.
This image from NASA 2001 Mars Odyssey spacecraft shows a small portion of Sirenum Fossae. The fractures of the Fossae are graben -- a downdropped block between two faults.
The depression in the center of this image captured by NASA 2001 Mars Odyssey spacecraft is a graben fault bounded block of material. This graben is called Mangala Fossa.
This complexly faulted region is part of Ceraunius Fossae, located south of Alba Mons. This image was captured by NASA 2001 Mars Odyssey spacecraft.
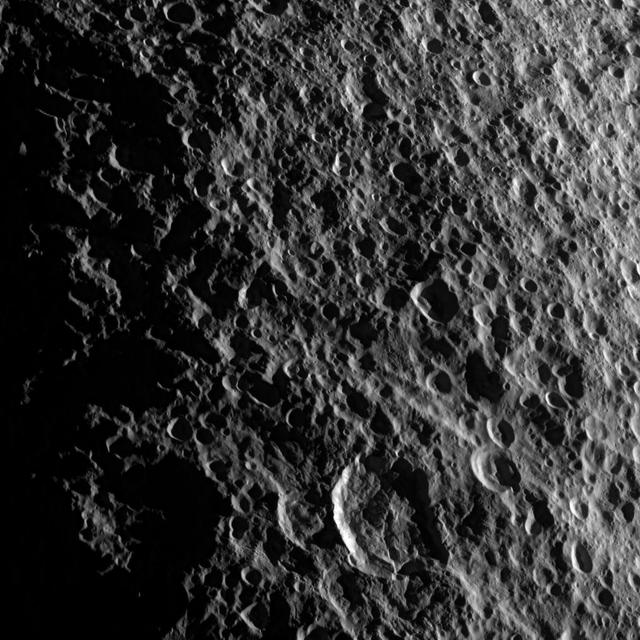
Geologic faults among craters on Saturn moon Tethys are depicted in this image captured during a flyby of the moon by NASA Cassini spacecraft on Aug. 14, 2010.
The linear feature in this image captured by NASA 2001 Mars Odyssey spacecraft is part of Cyane Fossae. The circular collapse features are bounded by linear faults.
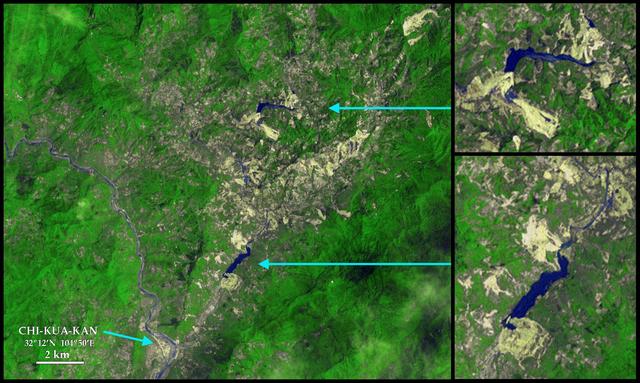
This image acquired by NASA Terra satellite May 12, 2008, shows faults within the mountains, but near and almost parallel the mountain front, northwest of the city of Chengdu.
The linear feature in this image from NASA 2001 Mars Odyssey spacecraft is part of Granicus Valles. The linear nature, and uniform width is indicative of a fault bounded graben.
The linear depression in the center of this image captured by NASA Mars Odyssey spacecraft is a graben - a fault bounded block of material. The graben crosses the crater and ejecta in the middle of the image.
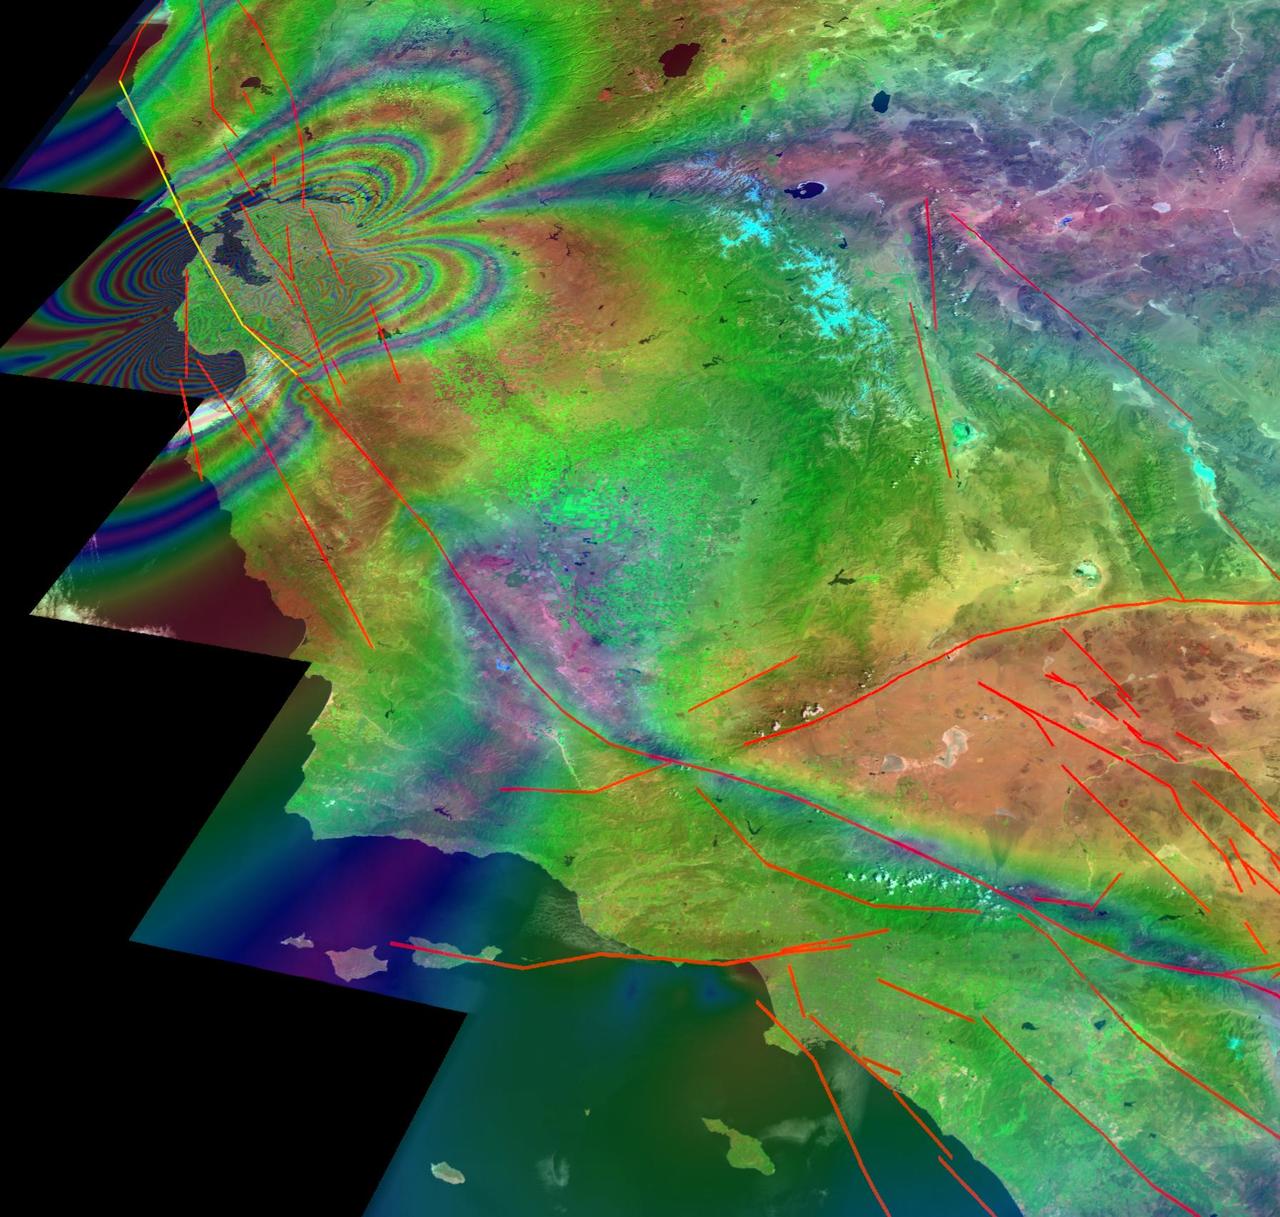
This illustration depicts synthetic aperature radar patterns of seismic deformations associated with a model earthquake on the San Francisco section of the San Andreas Fault depicted in yellow.
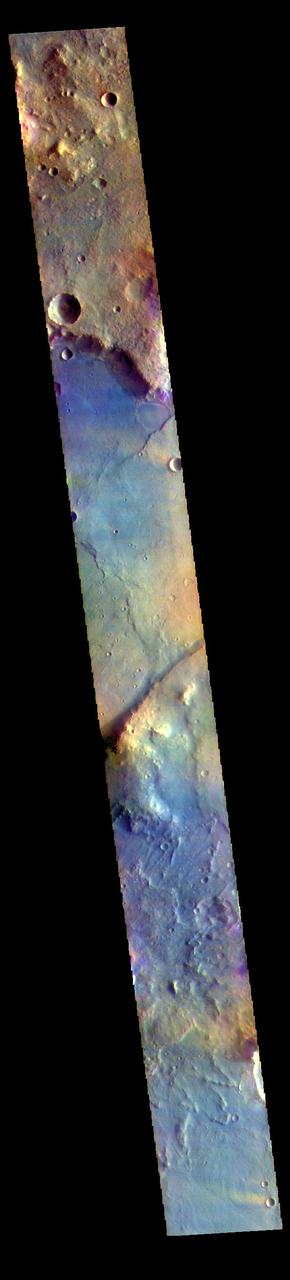
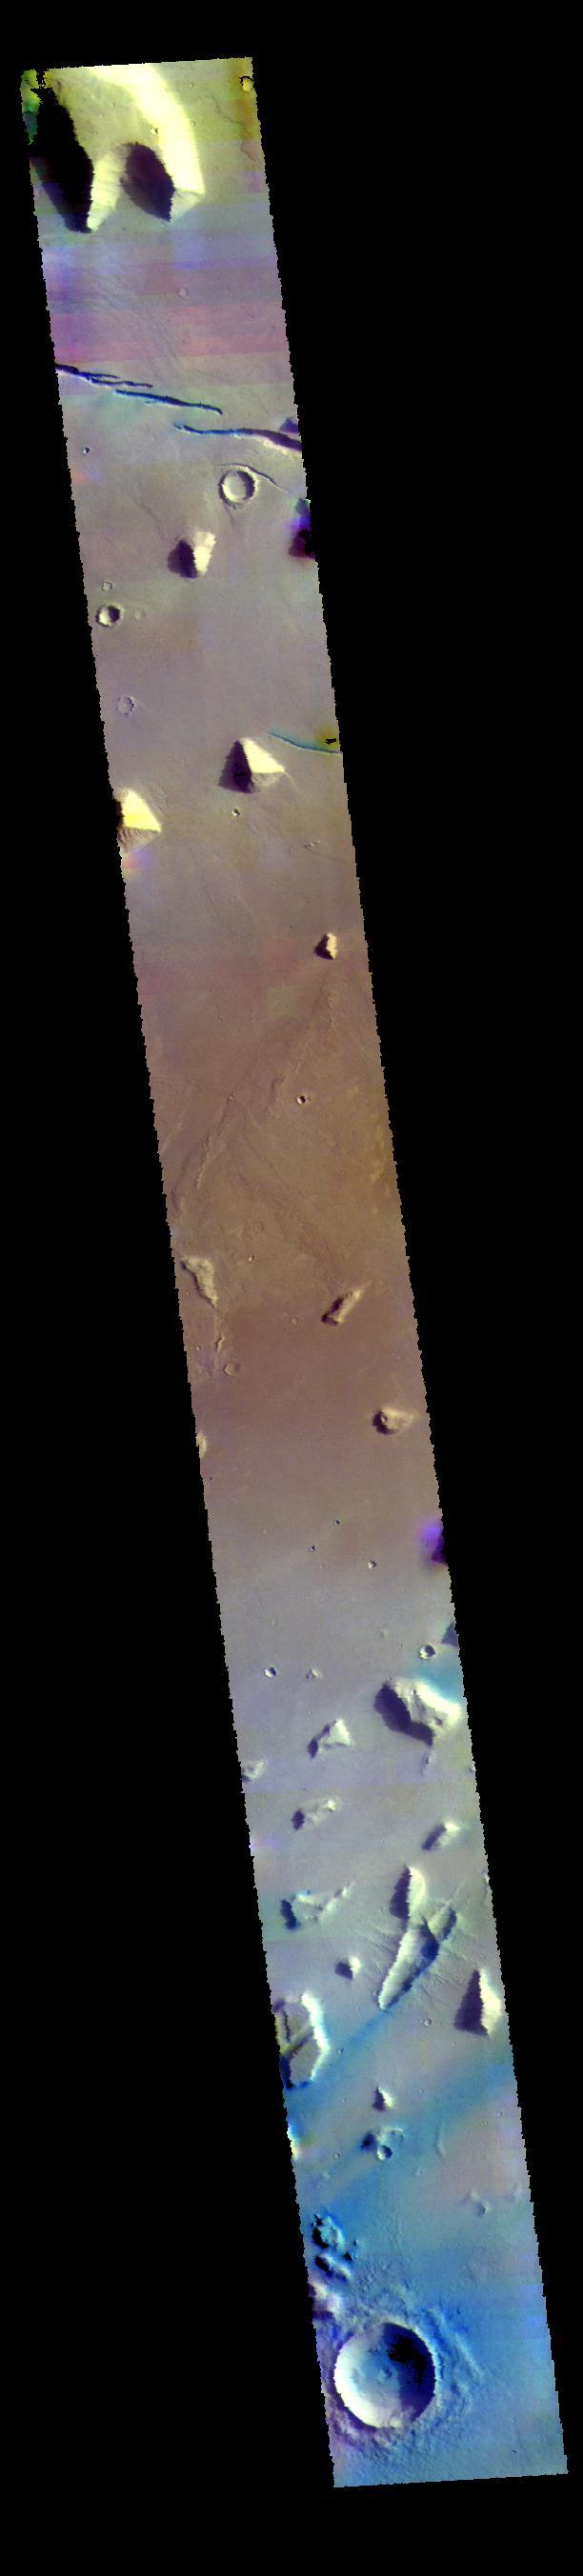
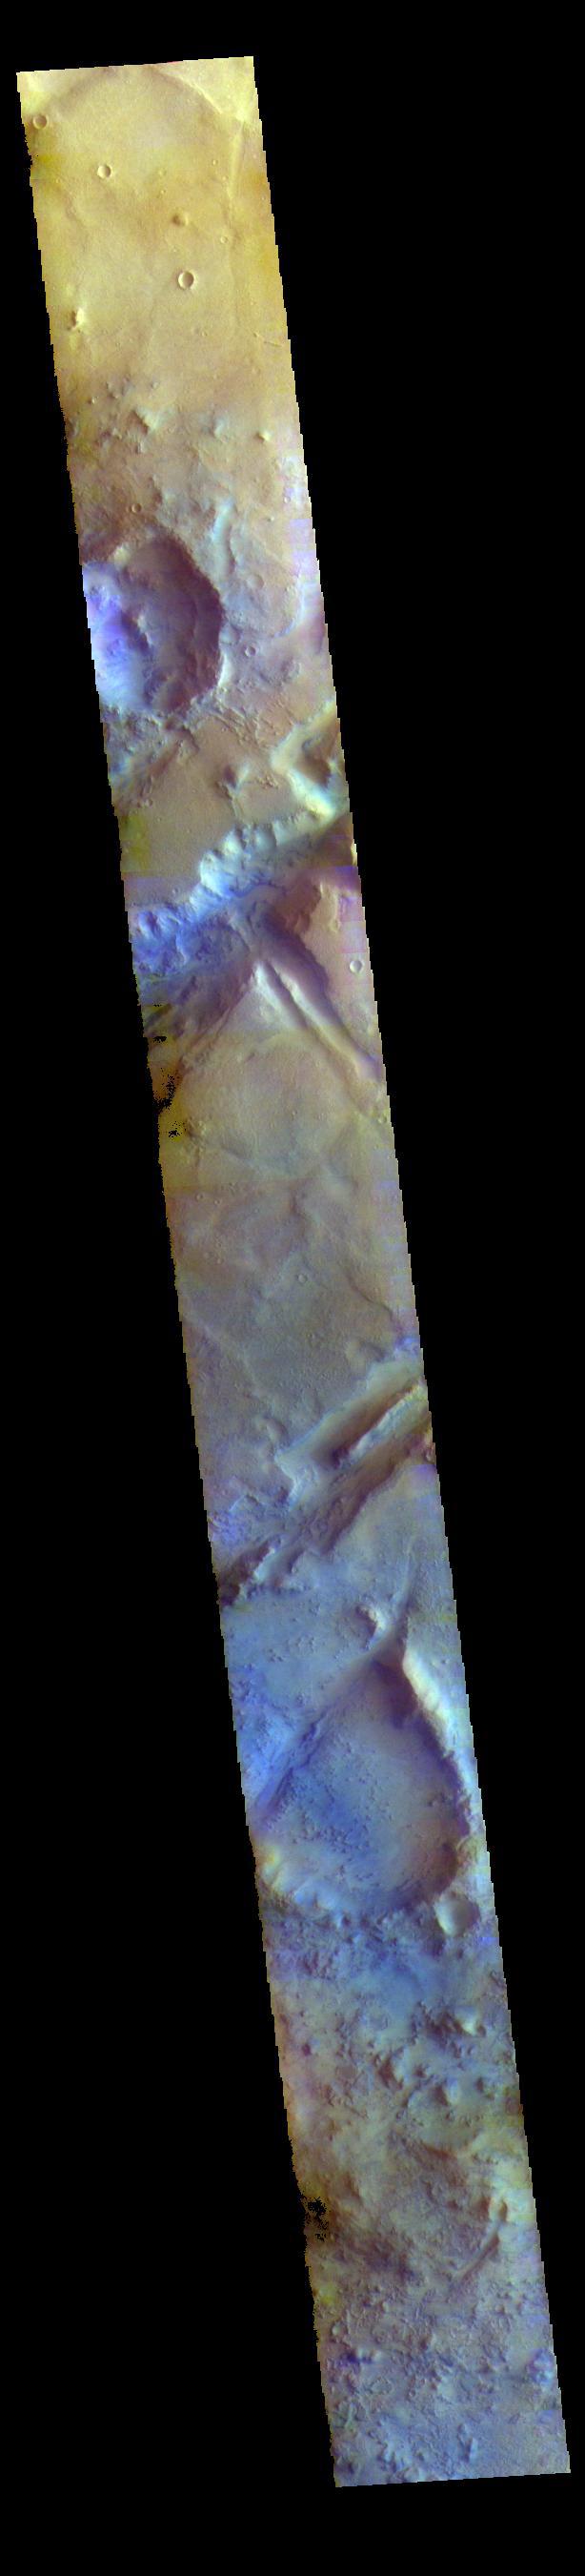
The THEMIS VIS camera contains 5 filters. The data from different filters can be combined in multiple ways to create a false color image. These false color images may reveal subtle variations of the surface not easily identified in a single band image. Today's false color image shows part of Nili Fossae. Nili Fossae is a collection of curved faults and down-dropped blocks of crust between the faults called graben. The graben lie northeast of the large volcano Syrtis Major and northwest of the ancient impact basin Isidis Planitia. The linear ridge in the center of the image is one side of a very large graben. When large amounts of pressure or tension are applied to rocks on timescales that are fast enough that the rock cannot respond by deforming, the rock breaks along faults. In the case of a graben, two parallel faults are formed by extension of the crust and the rock in between the faults drops downward into the space created by the extension. The THEMIS VIS camera is capable of capturing color images of the Martian surface using five different color filters. In this mode of operation, the spatial resolution and coverage of the image must be reduced to accommodate the additional data volume produced from using multiple filters. To make a color image, three of the five filter images (each in grayscale) are selected. Each is contrast enhanced and then converted to a red, green, or blue intensity image. These three images are then combined to produce a full color, single image. Because the THEMIS color filters don't span the full range of colors seen by the human eye, a color THEMIS image does not represent true color. Also, because each single-filter image is contrast enhanced before inclusion in the three-color image, the apparent color variation of the scene is exaggerated. Nevertheless, the color variation that does appear is representative of some change in color, however subtle, in the actual scene. Note that the long edges of THEMIS color images typically contain color artifacts that do not represent surface variation. Orbit Number: 85787 Latitude: 19.3564 Longitude: 73.5306 Instrument: VIS Captured: 2021-04-17 00:20 https://photojournal.jpl.nasa.gov/catalog/PIA25093
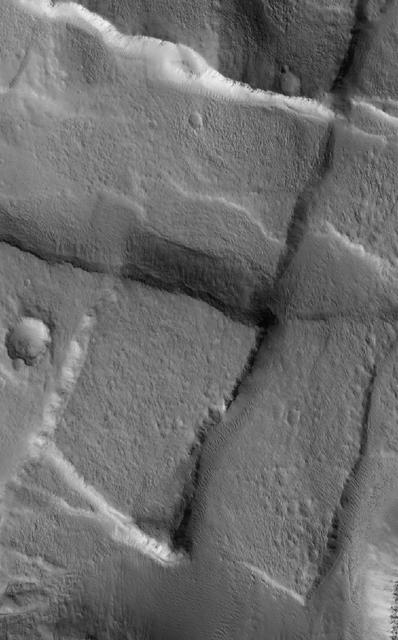
This VIS image is located in Noctis Labyrinthus. There are two directions of faults visible, which intersect at an approximately 90 degree angle. The faults running from bottom right to upper left are the younger set. The change in direction indicates a change in the tectonic stresses in the region. Orbit Number: 74276 Latitude: -6.04595 Longitude: 261.215 Instrument: VIS Captured: 2018-09-12 03:22 https://photojournal.jpl.nasa.gov/catalog/PIA22798
The linear depressions in this VIS image are part of Sirenum Fossae. These depressions are called graben, which form by the down drop of material between two parallel faults. The faults are caused by tectonic stresses in the region. The Sirenum Fossae graben are 2735km (1700 miles) long. Orbit Number: 82052 Latitude: -37.4717 Longitude: 191.302 Instrument: VIS Captured: 2020-06-13 11:16 https://photojournal.jpl.nasa.gov/catalog/PIA24118
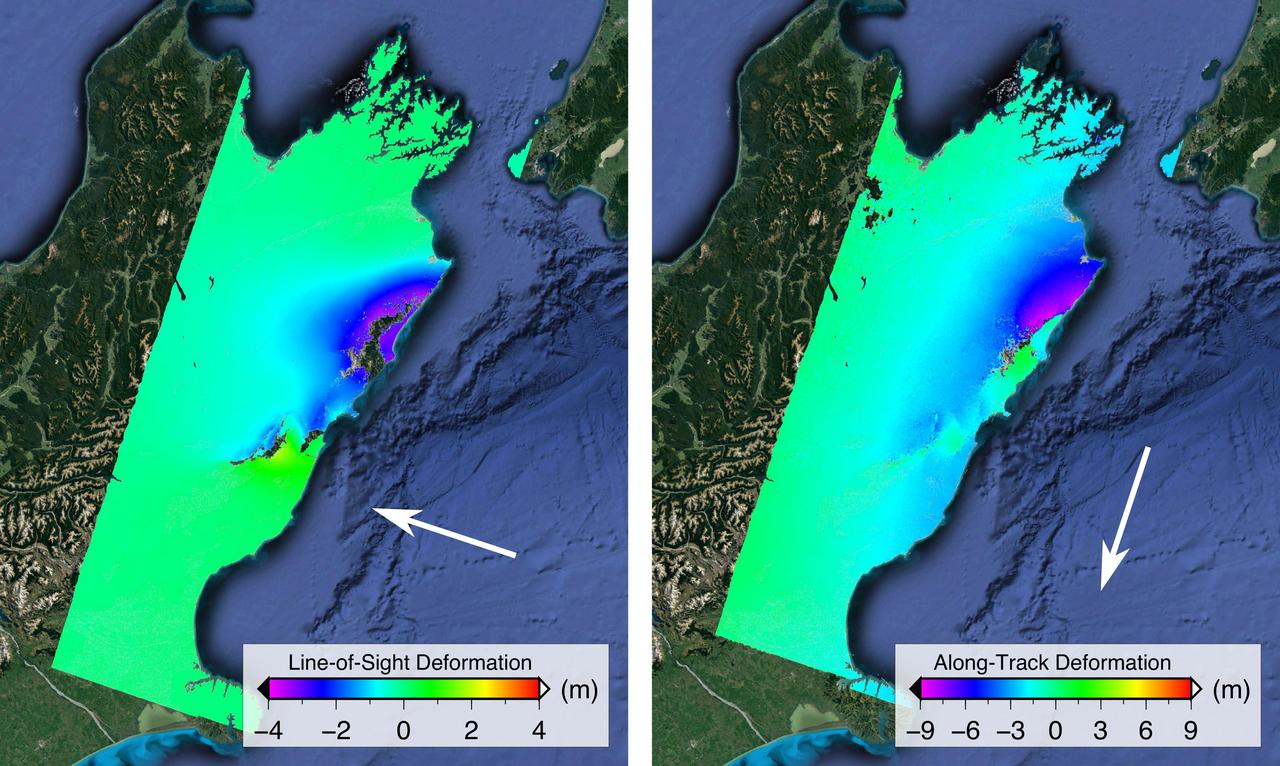
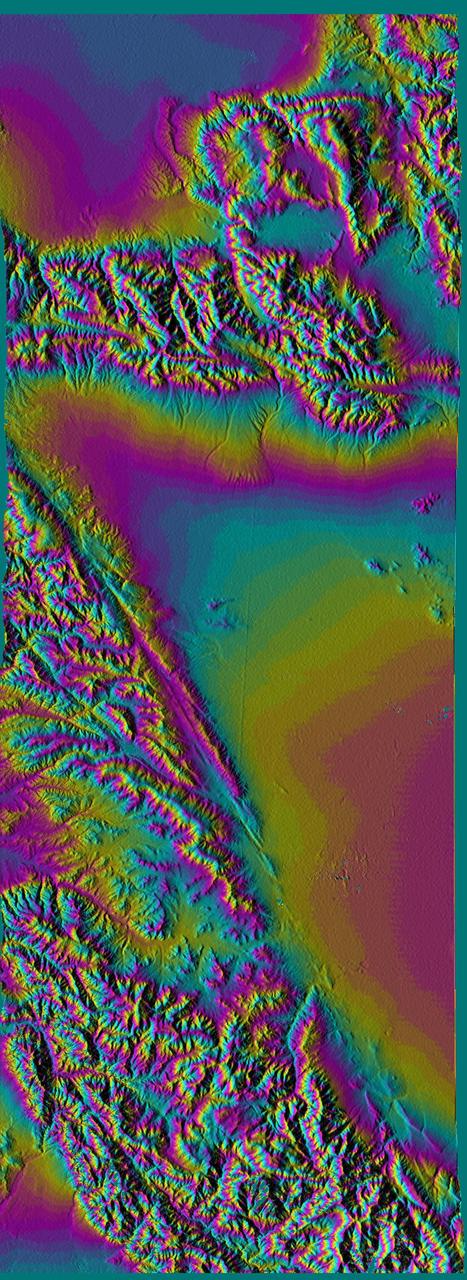
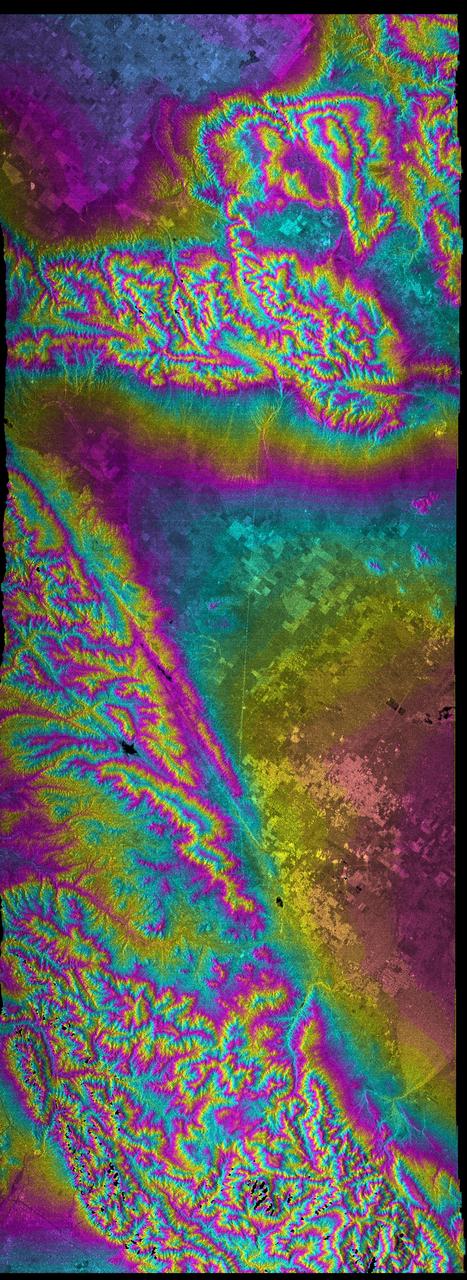
NASA and its partners are contributing important observations and expertise to the ongoing response to the Nov. 14, 2016, magnitude 7.8 Kaikoura earthquake in New Zealand. This shallow earthquake was so complex and unusual, it is likely to change how scientists think about earthquake hazards in plate boundary zones around the world. Scientists with the Advanced Rapid Imaging and Analysis project (ARIA), a collaboration between NASA's Jet Propulsion Laboratory, Pasadena, California, and Caltech in Pasadena, analyzed interferometric synthetic aperture radar images from the PALSAR-2 instrument on the ALOS-2 satellite operated by the Japan Aerospace Exploration Agency (JAXA) to calculate maps of the deformation of Earth's surface caused by the quake. Two maps show motion of the surface in two different directions. Each false-color map shows the amount of permanent surface movement caused almost entirely by the earthquake, as viewed by the satellite, during a 28-day interval between two ALOS-2 wide-swath images acquired on Oct. 18 and Nov. 15, 2016. In these two new maps made from the wide-swath images, the colors of the surface displacements are proportional to the surface motion. The wide-swath images cover the entire 106-mile (170-kilometer) length of the complex set of earthquake ruptures. The arrows show the direction of the radar motion measurement. In the left image, the blue and purple tones show the areas where the land around the Kaikoura peninsula in the Marlborough region of New Zealand's South Island has moved toward the satellite by up to 13.2 feet (4 meters), both eastward and upward. In the right image, the blue and purple tones show the areas that moved to the north by up to 30 feet (9 meters) and green tones show the area that moved to the south. The sharp line of color change is across the Kekerengu Fault, which had the largest amount of motion in the earthquake. Field studies found maximum rupture at the surface was measured at 39 feet (12 meters) of horizontal displacement. Several other faults have sharp color changes due to smaller amounts of motion, with a total of at least 12 faults rupturing in this single large earthquake. Areas without color have snow, heavy vegetation or open water that prevents the radar measurements from being coherent between satellite images – a required condition to measure ground displacement. Scientists use these maps to build detailed models of the fault slip at depth and associated land movements to better understand the impact on future earthquake activity. The PALSAR-2 data were provided by JAXA through the Committee on Earth Observation Satellites (CEOS) and through scientific research projects. The background image is from Google Earth. http://photojournal.jpl.nasa.gov/catalog/PIA21210
Today's VIS image is located in Elysium Planitia. The linear depressions at the top of the image are created by tectonic faults, where the center block of material has dropped downward between two parallel faults. Blue tones, like those at the bottom of the image, are indicative of basaltic sands. The THEMIS VIS camera contains 5 filters. The data from different filters can be combined in multiple ways to create a false color image. These false color images may reveal subtle variations of the surface not easily identified in a single band image. Orbit Number: 61919 Latitude: 14.9167 Longitude: 161.38 Instrument: VIS Captured: 2015-11-29 04:17 https://photojournal.jpl.nasa.gov/catalog/PIA23087
Located on the western margin of Lunae Planum, Sacra Fossae is a group of linear depressions. The right angle turns and uniform width seen in this VIS image indicate that these channels were formed by faulting rather than liquid flow. Two bounding faults with a down-dropped interior are called graben. Orbit Number: 71244 Latitude: 17.7623 Longitude: 288.309 Instrument: VIS Captured: 2018-01-05 09:06 https://photojournal.jpl.nasa.gov/catalog/PIA22373
The linear depression in this VIS image is part of Sirenum Fossae. Depressions of this type are called graben, which form by the down drop of material between two parallel faults. The faults are caused by tectonic stresses in the region. The Sirenum Fossae graben are 2735km (1700 miles) long. Orbit Number: 84379 Latitude: -32.7135 Longitude: 204.562 Instrument: VIS Captured: 2020-12-22 01:06 https://photojournal.jpl.nasa.gov/catalog/PIA24398
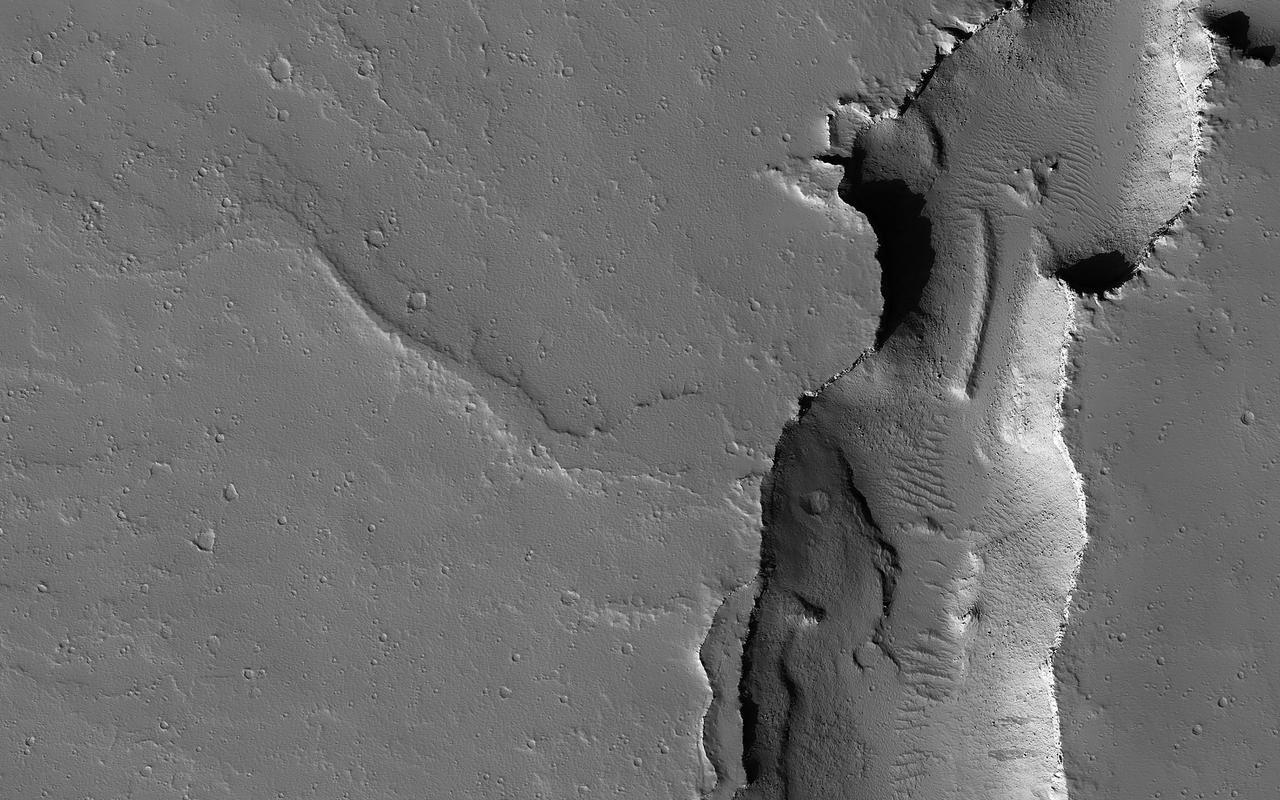
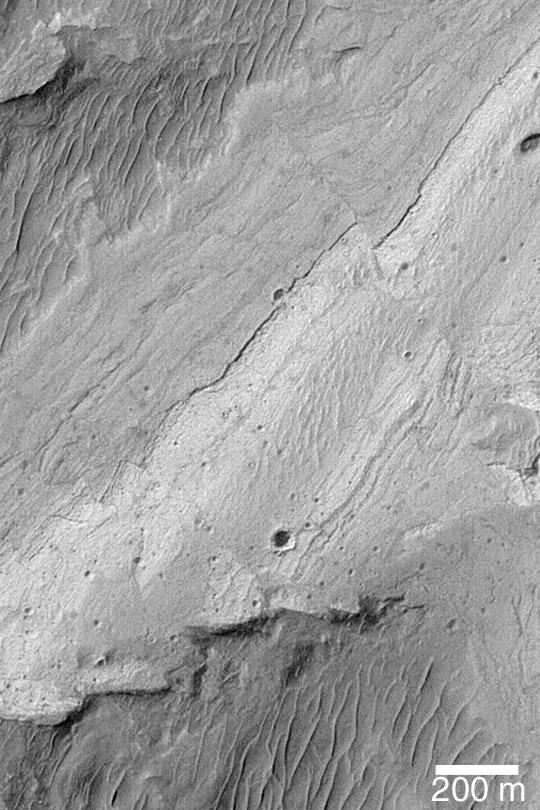
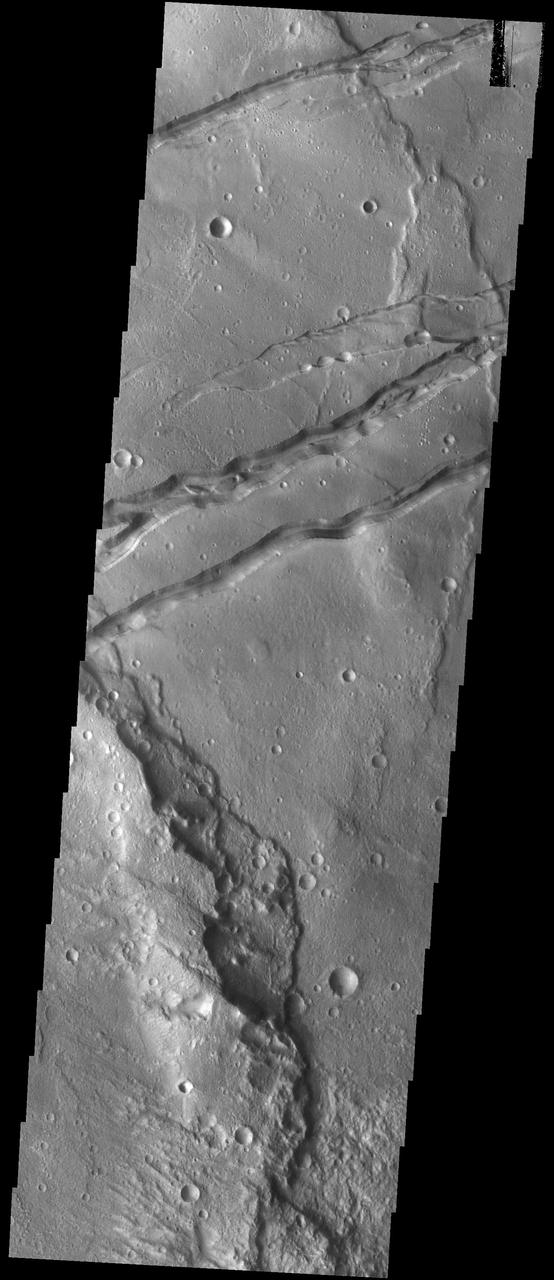
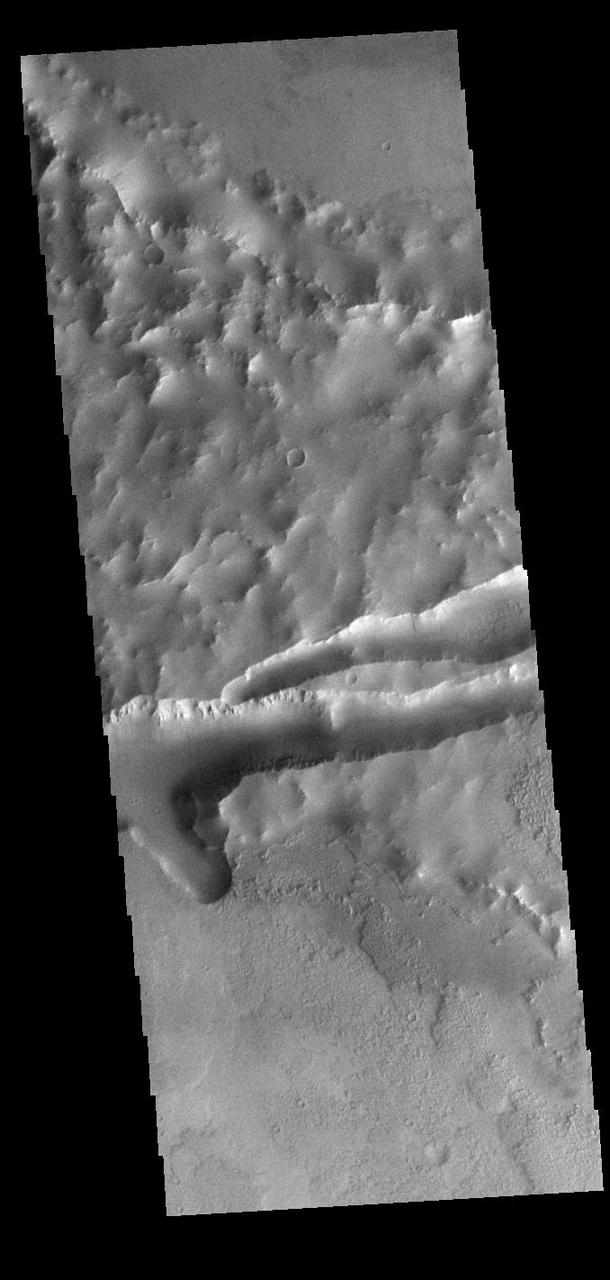
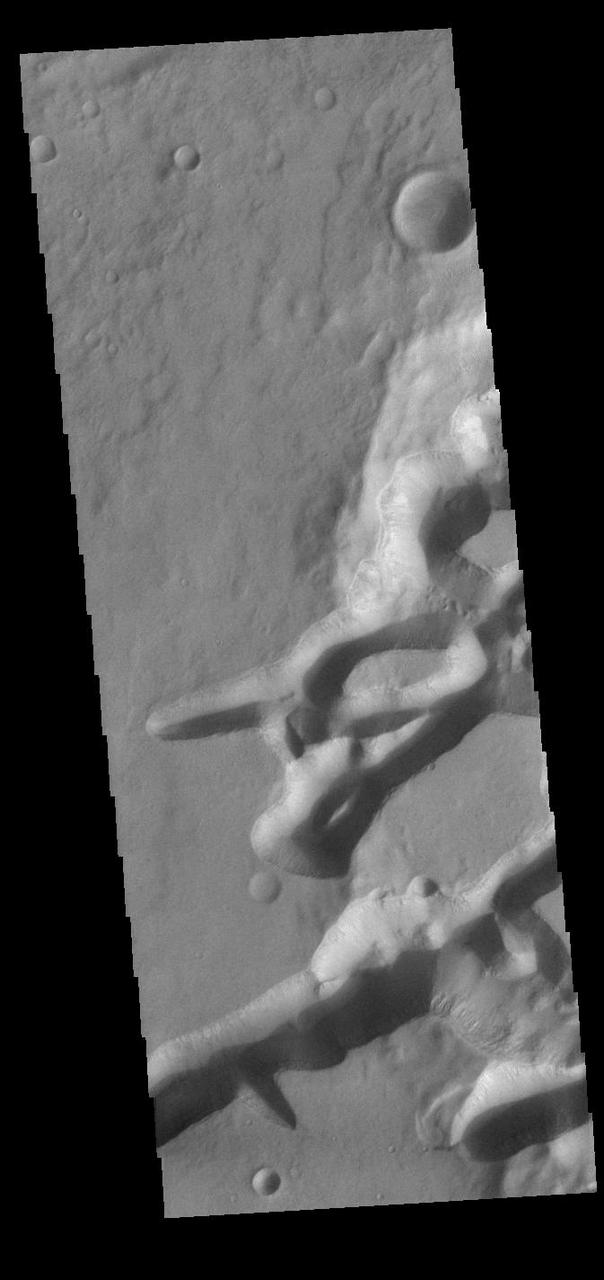
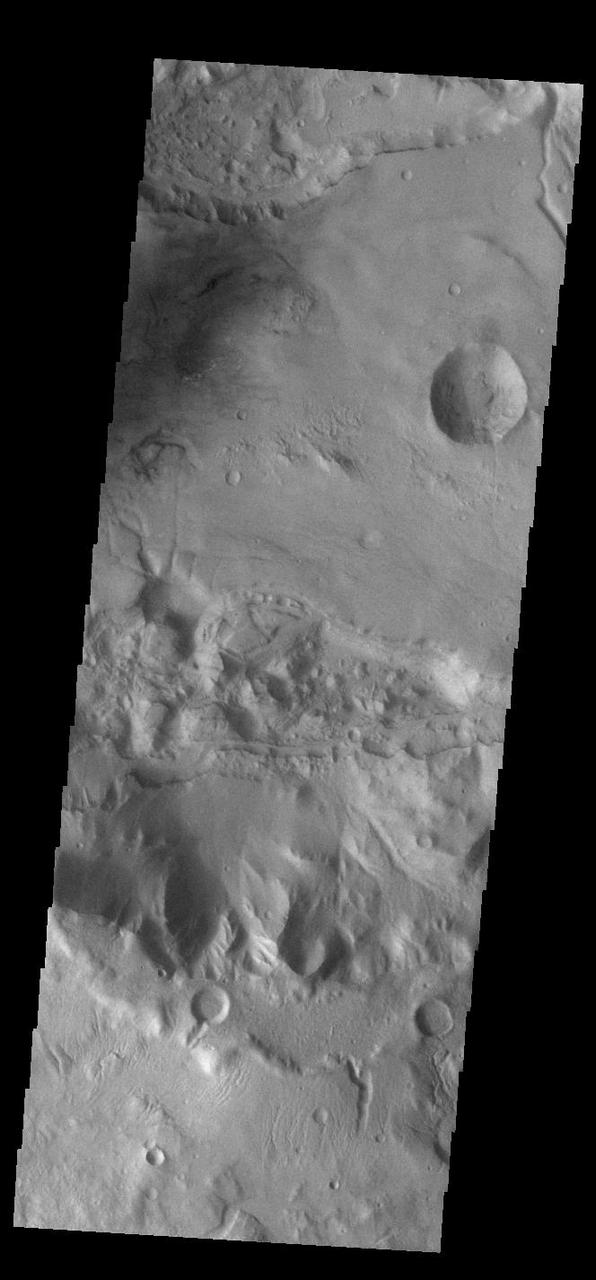
This image shows two cross-cutting depressions that may have been formed by the collapse of weak terrain along pre-existing faults. These faults are associated with the release of volcanic material and/or liquid water. Sinuous channels are visible emanating from the large vent toward the northwest. Some of these channels transition between positive-relief and negative-relief, suggesting they were once filled with erosion-resistant material. Liquid water is known to produce similar features on Earth. https://photojournal.jpl.nasa.gov/catalog/PIA25701
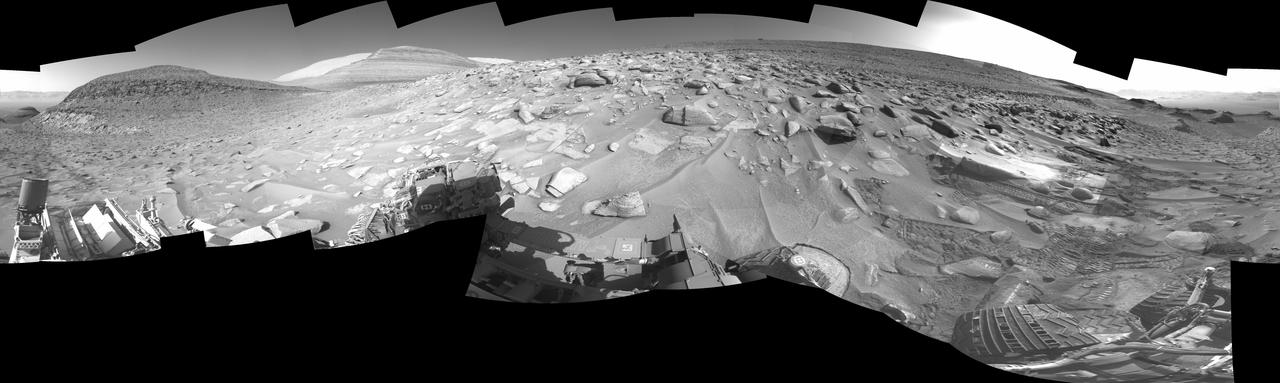
NASA's Curiosity Mars rover left several sets of tracks where the rover experienced a fault, or unexpected stoppage mid-drive, while climbing a particularly difficult slope. The bright rock seen directly above the rover's wheel is what caused the rover to fault. Tracks can be seen above the wheel at right, indicating where Curiosity backed up and repositioned to try again. The rover's navigation cameras captured this panorama on June 8, 2023, the 3,853rd Martian day, or sol, of the mission. https://photojournal.jpl.nasa.gov/catalog/PIA26015
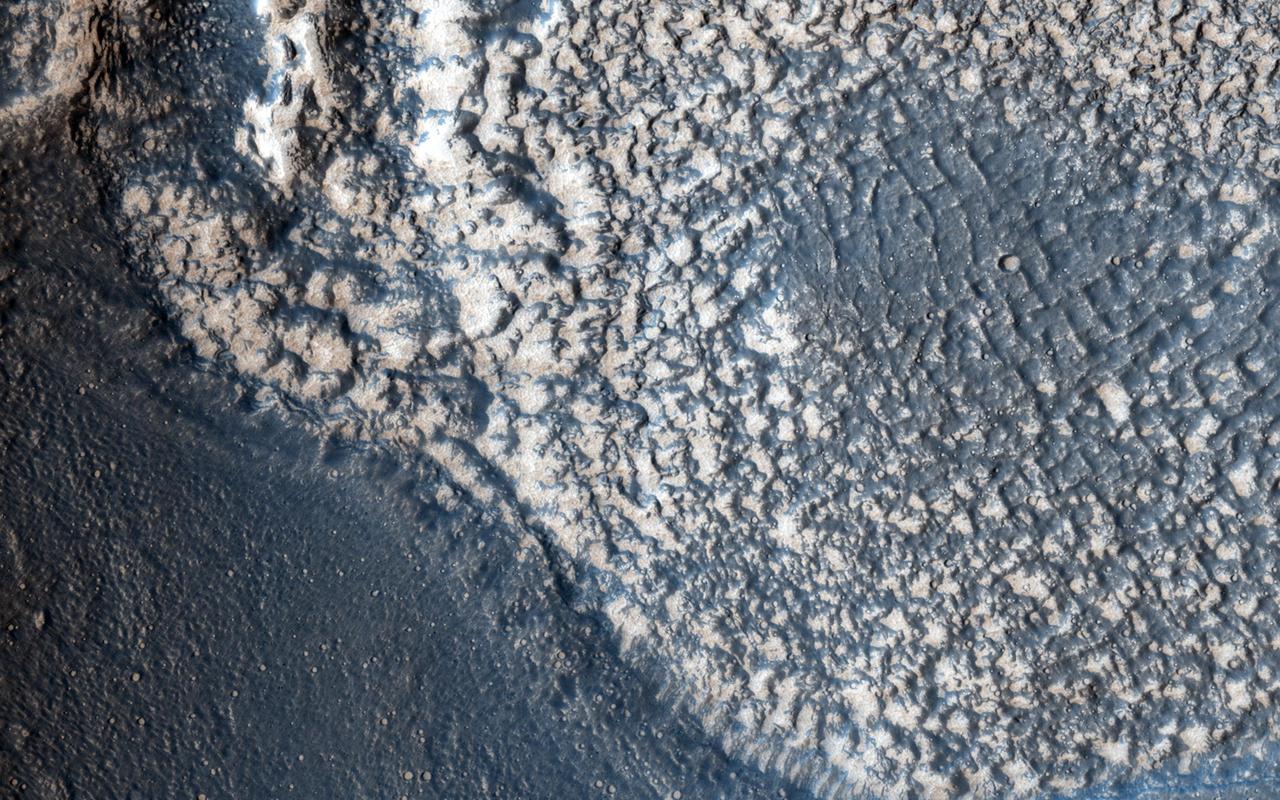
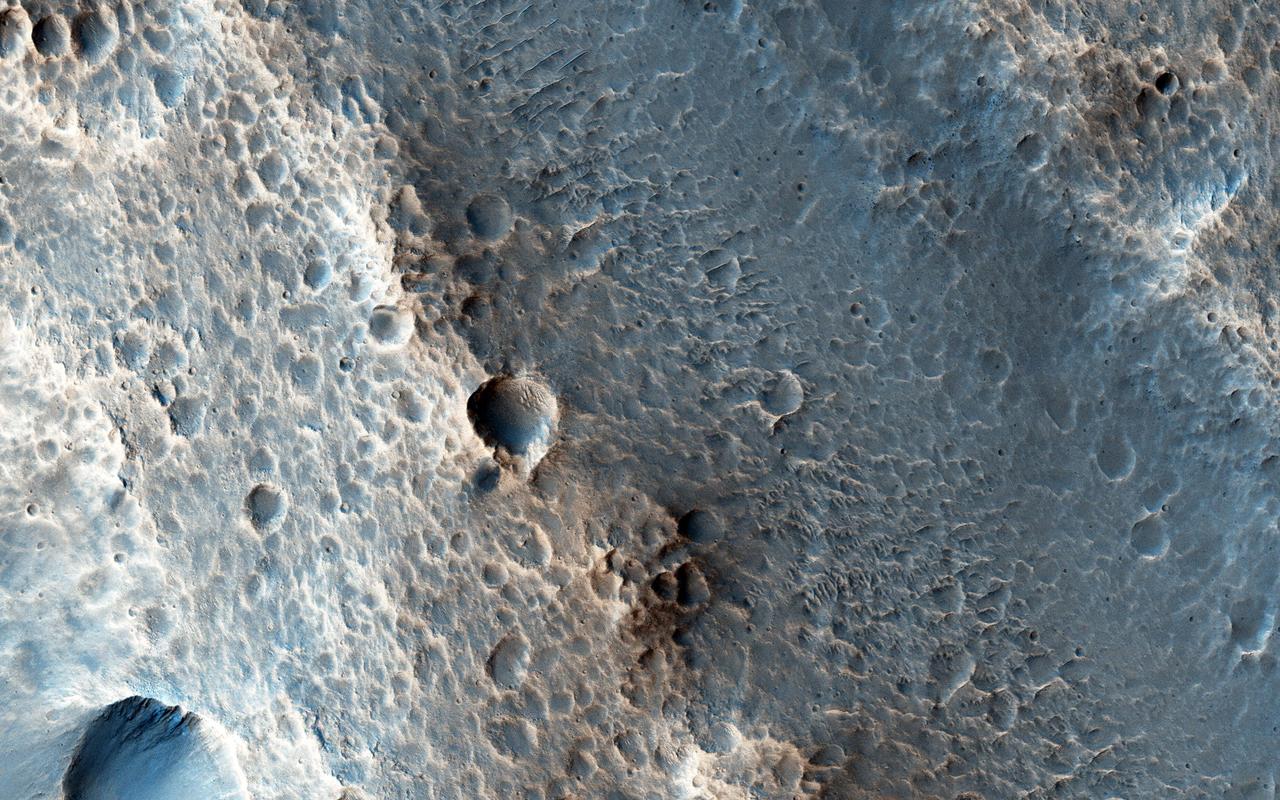
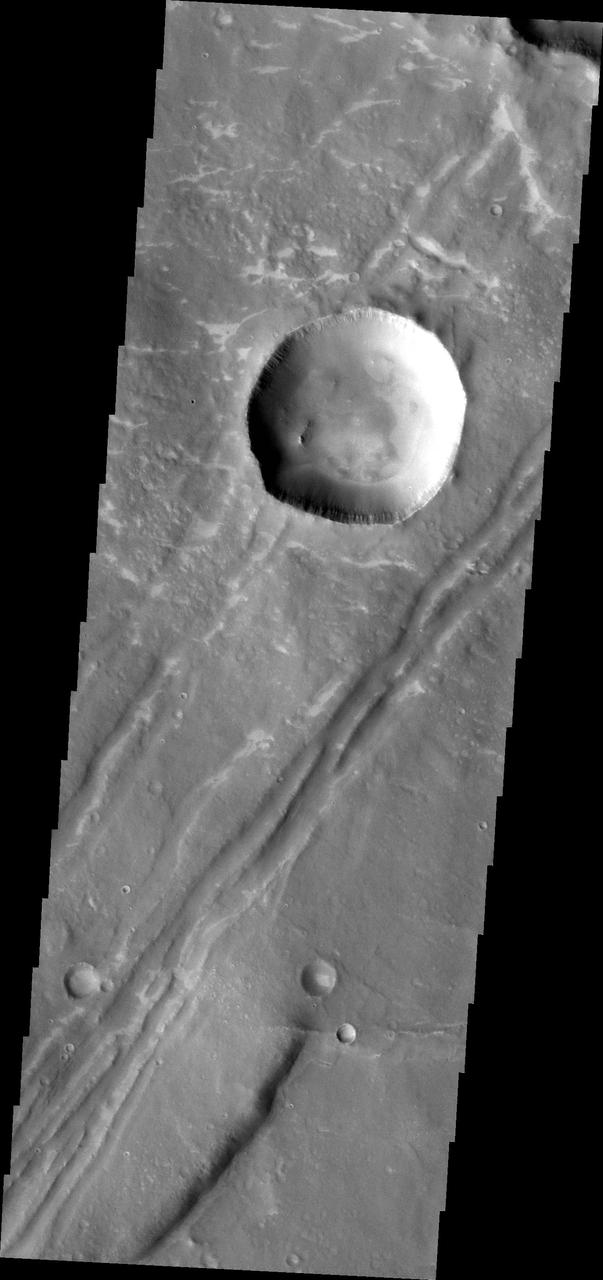
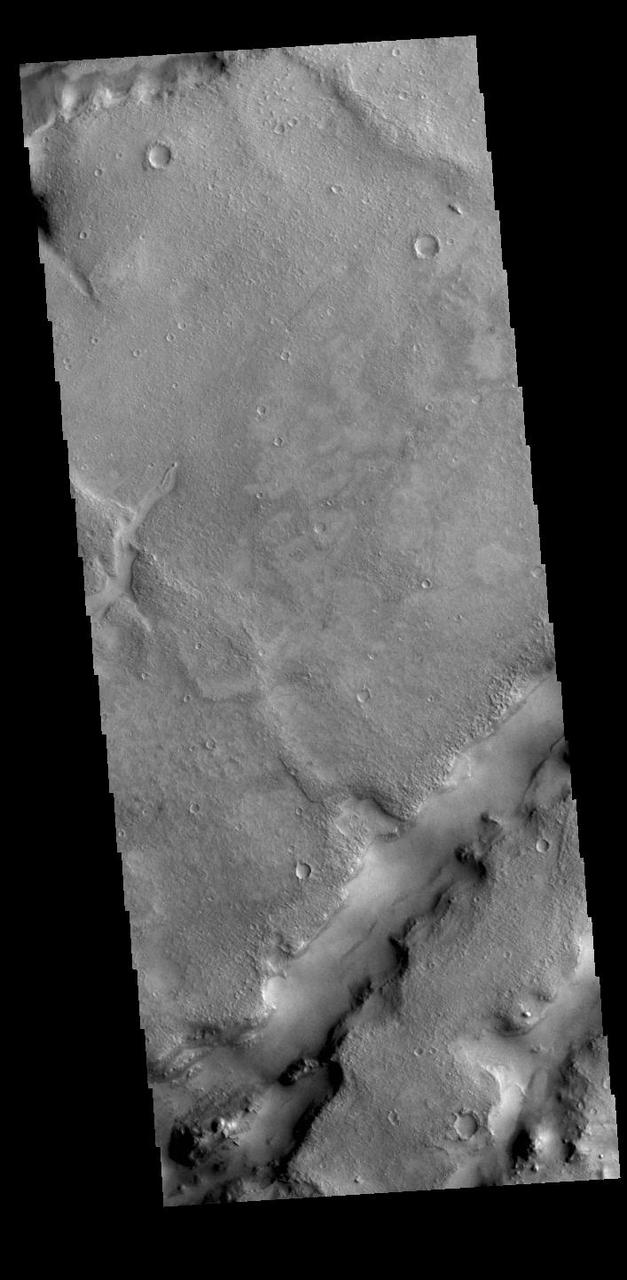
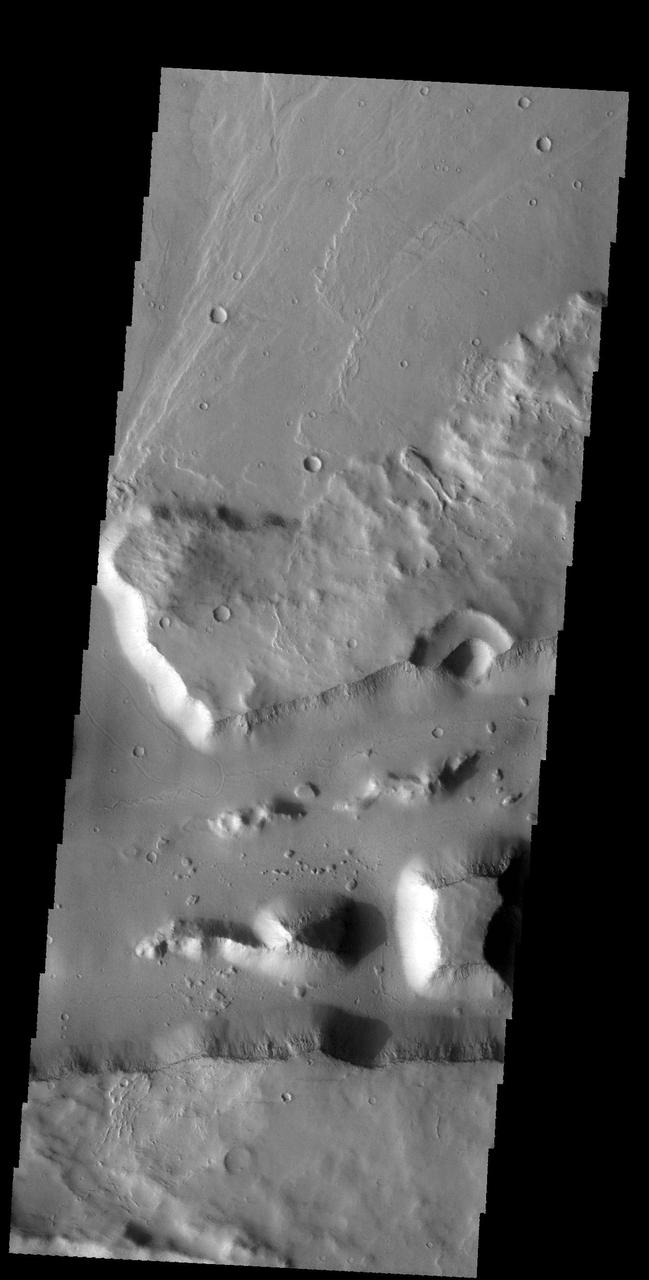
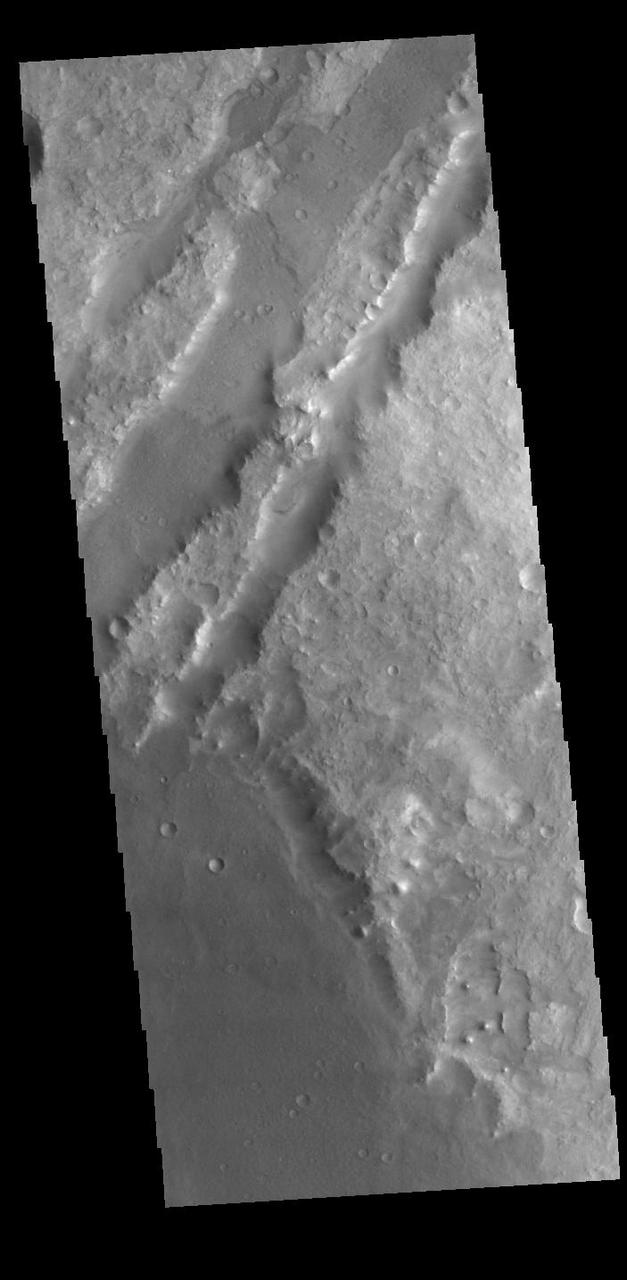
This highly tectonized terrain meaning it possesses many faults, as seen by NASA Mars Reconnaissance Orbiter, has its low-lying areas filled with some form of younger material. This particular fill is what geologists call "embayment." This observation helps scientists unravel the relative timing of the emplacement of the younger material and the numerous tectonic faults that run through this area. http://photojournal.jpl.nasa.gov/catalog/PIA19365
The linear depressions in this VIS image are part of Sirenum Fossae. These depressions are called graben, which form by the down drop of material between two parallel faults. The faults are caused by tectonic stresses in the region. The Sirenum Fossae graben are 2735km (1700 miles) long. Orbit Number: 80454 Latitude: -29.9435 Longitude: 211.124 Instrument: VIS Captured: 2020-02-02 21:26 https://photojournal.jpl.nasa.gov/catalog/PIA23844

tests the main observation helicopter's transmission used by the Army Kiowa Warrior (OH-58); Tests performed include seeded fault testing, planetary fault diagnostics, and fatigue tests
Today's VIS image shows some of the linear depressions that comprise Nili Fossae. Nili Fossae is the name of a collection of curved faults and down-dropped blocks of crust between the faults. The "fossae," or graben, lie northeast of the large volcano Syrtis Major and northwest of the ancient impact basin Isidis Planitia. The troughs, which can be almost 500 meters (1,600 feet) deep , make concentric curves that follow the outline of Isidis Planitia. The graben likely formed as the crust sagged under the weight of lava flows filling the Isidis Planitia impact basin. Orbit Number: 88158 Latitude: 20.507 Longitude: 72.6076 Instrument: VIS Captured: 2021-10-29 05:43 https://photojournal.jpl.nasa.gov/catalog/PIA25129
The THEMIS VIS camera contains 5 filters. The data from different filters can be combined in multiple ways to create a false color image. These false color images may reveal subtle variations of the surface not easily identified in a single band image. Today's false color image shows part of Nili Fossae. Nili Fossae is a collection of curved faults and down-dropped blocks of crust between the faults called graben. The graben lie northeast of the large volcano Syrtis Major and northwest of the ancient impact basin Isidis Planitia. The graben are concentric to the Isidis impact basin and extend for 727km (452 miles). Orbit Number: 77264 Latitude: 22.4987 Longitude: 78.2175 Instrument: VIS Captured: 2019-05-16 05:27 https://photojournal.jpl.nasa.gov/catalog/PIA24607
This VIS image is located on the eastern flank of Alba Mons. Linear faults and graben surround the volcano aligned north/south, intersecting and deflected around the summit. The large graben is called Phlegethon Catena. The term catena means a string of craters or circular depressions. The depressions in this image were likely formed by the collapse of the preexisting surface into a subsurface void. Graben are caused by blocks of material that drop down along paired faults. Orbit Number: 72405 Latitude: 36.2522 Longitude: 255.129 Instrument: VIS Captured: 2018-04-11 00:39 https://photojournal.jpl.nasa.gov/catalog/PIA22596
The linear features in this VIS image are tectonic graben called Icaria Fossae and are located in Terra Sirenum. Graben are formed by extension of the crust and faulting. When large amounts of pressure or tension are applied to rocks on timescales that are fast enough that the rock cannot respond by deforming, the rock breaks along faults. In the case of a graben, two parallel faults are formed by extension of the crust and the rock in between the faults drops downward into the space created by the extension. The Icaria Fossae graben are 2115km (1314 miles) long. Orbit Number: 93200 Latitude: -41.7764 Longitude: 243.379 Instrument: VIS Captured: 2022-12-18 08:42 https://photojournal.jpl.nasa.gov/catalog/PIA25847

FAULT TOLERANT MAGNETIC BEARING HARDWARE
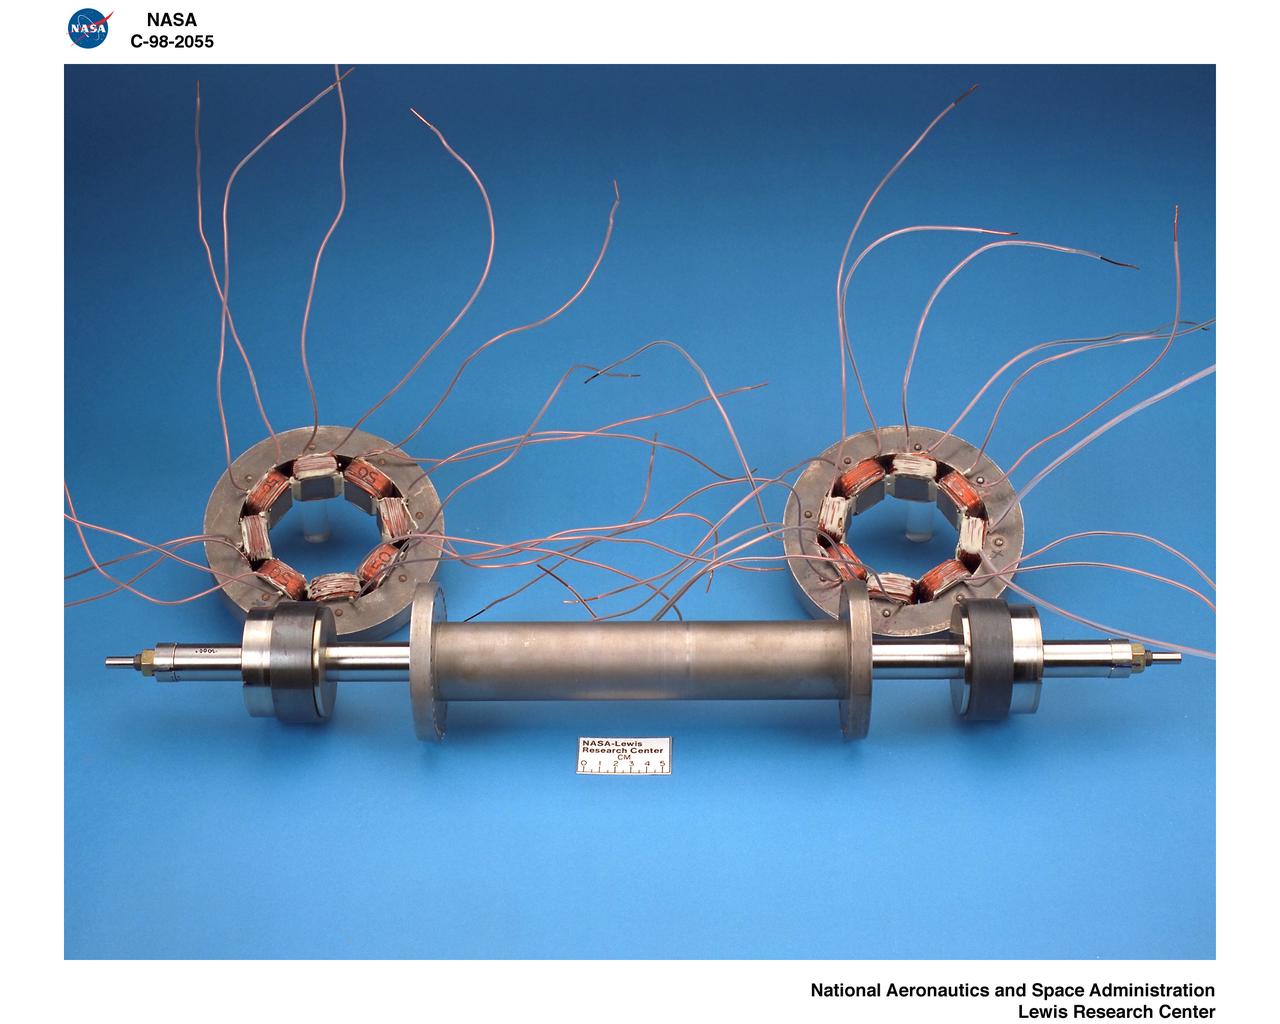
FAULT TOLERANT MAGNETIC BEARING HARDWARE
Today's VIS image is shows a small portion of Tempe Fossae. The linear features are tectonic graben. Graben are formed by extension of the crust and faulting. When large amounts of pressure or tension are applied to rocks on timescales that are fast enough that the rock cannot respond by deforming, the rock breaks along faults. In the case of a graben, two parallel faults are formed by extension of the crust and the rock in between the faults drops downward into the space created by the extension. Numerous sets of graben are visible in this THEMIS image, trending from north-northeast to south-southwest. Because the faults defining the graben are formed perpendicular to the direction of the applied stress, we know that extensional forces were pulling the crust apart in the west-northwest/east-southeast direction. The complete fossae system is almost 2000 km (1242 miles) long. Orbit Number: 94159 Latitude: 38.314 Longitude: 279.856 Instrument: VIS Captured: 2023-03-07 09:20 https://photojournal.jpl.nasa.gov/catalog/PIA25979