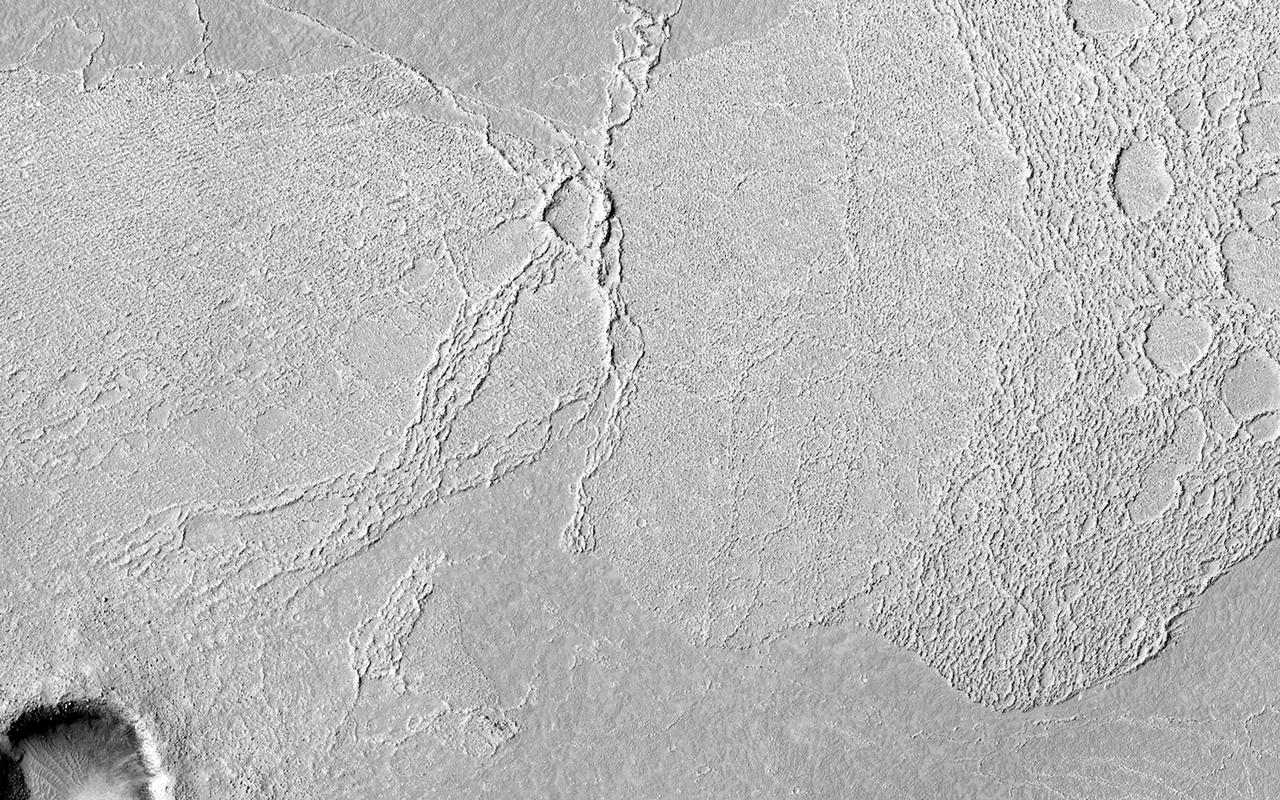
This image covers part of the Athabasca Valles flood lava plain, the youngest large lava flow on the surface of Mars as observed by NASA Mars Reconnaissance Orbiter.
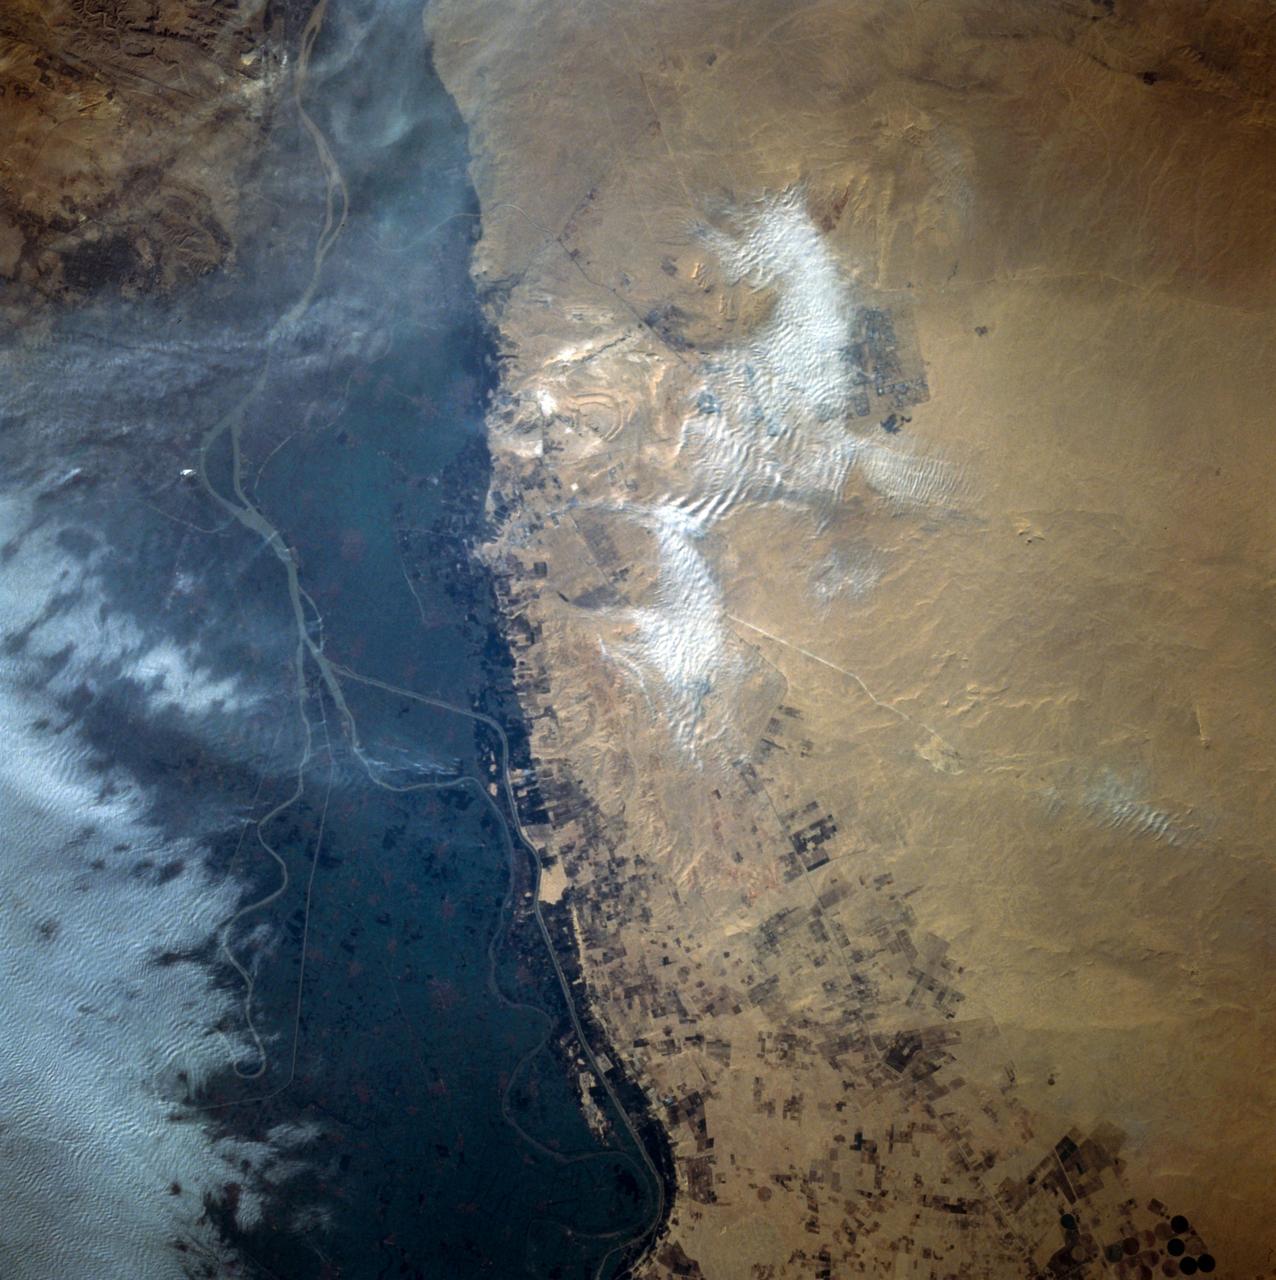
This close-up view of the intensively cultivated Nile River flood plain near Cairo presents a sharp color contrast to the virtually non-vegetated, sandy desert, located to the west of the vegetated area. Some rectangular cultivated field patterns, as well as circular center pivot irrigation patterns, can be observed northwest of the Nile River flood plain. The world famous Giza Pyramids are located near the center of this photography (see highly reflective sand surfaces).
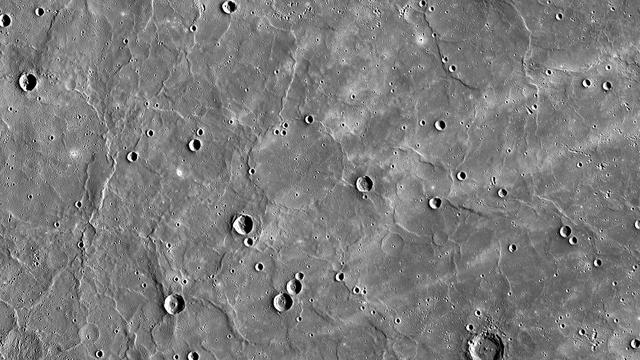
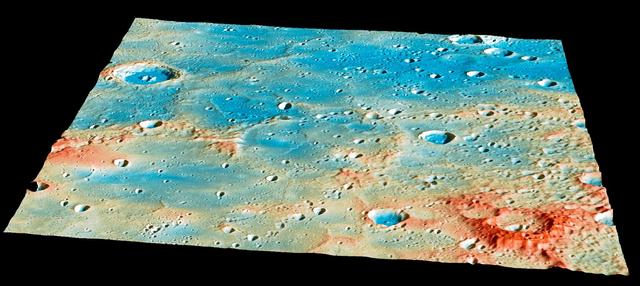
Mercury northern region is dominated by expansive smooth plains, created by huge amounts of volcanic material flooding across Mercury surface in the past, as seen by NASA MESSENGER spacecraft. The volcanic lava flows buried craters, leaving only traces of their rims visible. Such craters are called ghost craters, and there are many visible in this image, including a large one near the center. Wrinkle ridges cross this scene and small troughs are visible regionally within ghost craters, formed as a result of the lava cooling. The northern plains are often described as smooth since their surface has fewer impact craters and thus has been less battered by such events. This indicates that these volcanic plains are younger than Mercury's rougher surfaces. Instrument: Mercury Dual Imaging System (MDIS) Center Latitude: 60.31° N Center Longitude: 36.87° E Scale: The large ghost crater at the center of the image is approximately 103 kilometers (64 miles) in diameter http://photojournal.jpl.nasa.gov/catalog/PIA19415
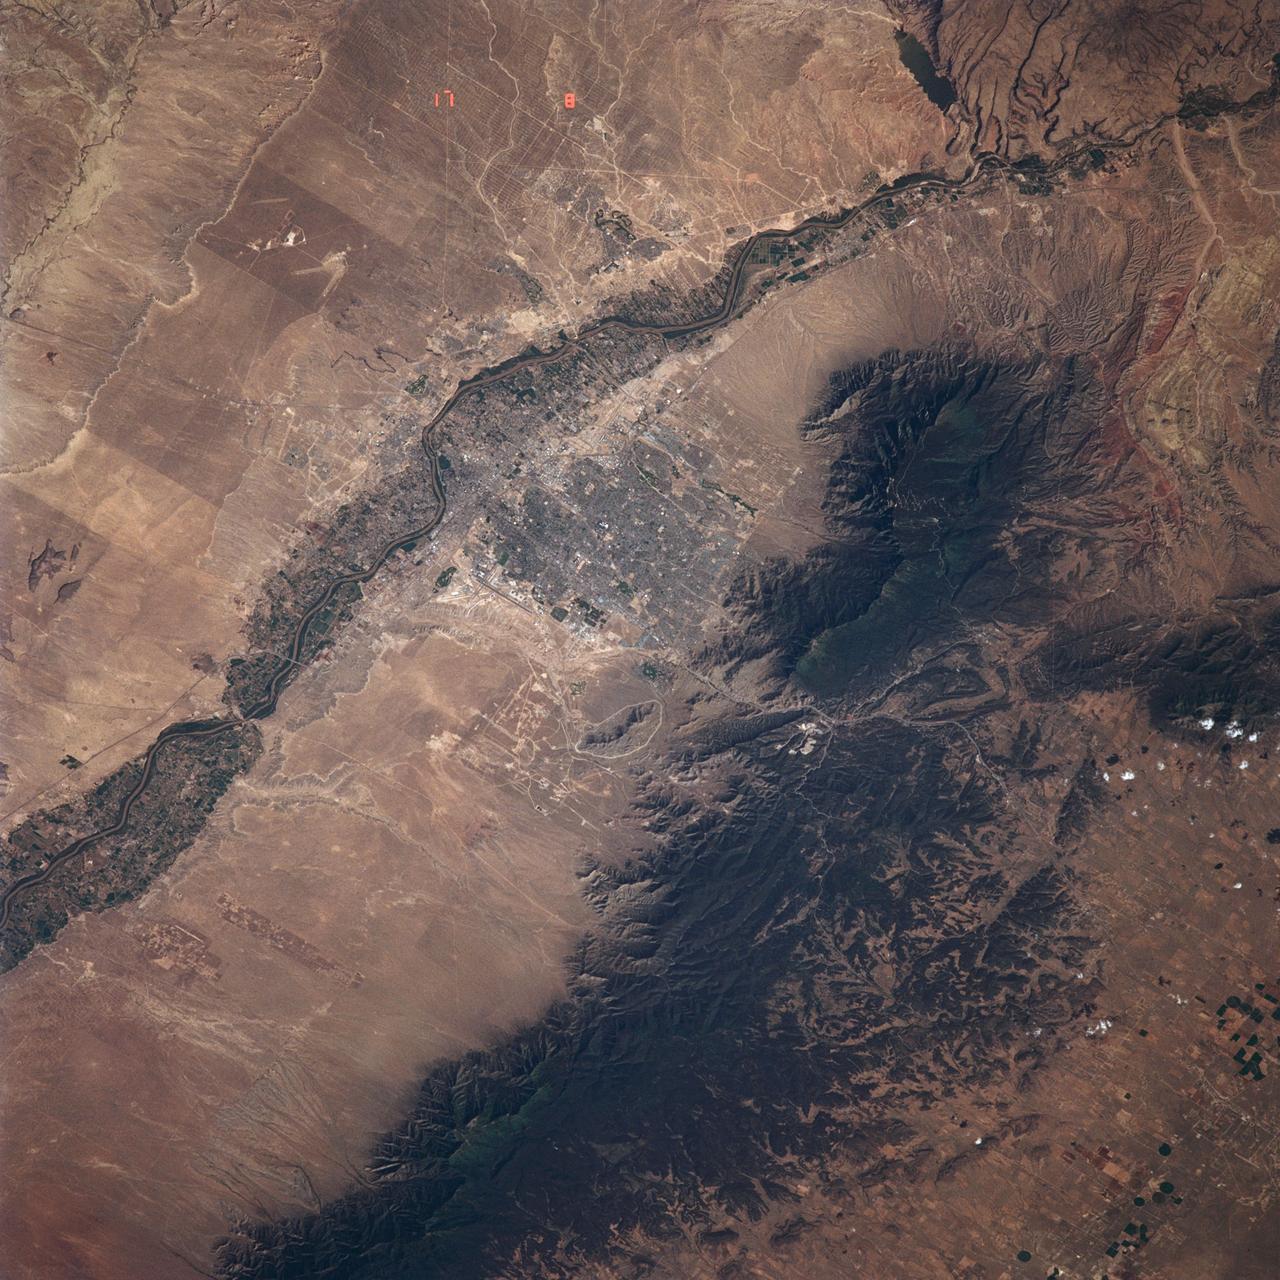
STS040-614-061 (5-14 June 1991) --- Albuquerque, New Mexico is perched on the edge of the Rio Grande floodplain, which crosses the photograph from upper left to center lower right. The reddish-brown surface of the Albuquerque Basin, a fault-bounded structural basin filled by alluvial fan and lake-bed sediments, is broken by an irregular light-toned rim River along both the Rio Grande and Rio Puerco (lower left). The rim marks the erosional edge of an ancient caliche soil that formed more than a half-million years ago, before the Rio Grande integrated its drainage from basin to basin. The upper right portion of the photograph is dominated by dark tones, representing pinyon/juniper and other timber growing on very old rocks of the Sandia Mountains. Interstate 40 can be seen passing through Sandia Pass which cuts the mountain mass.
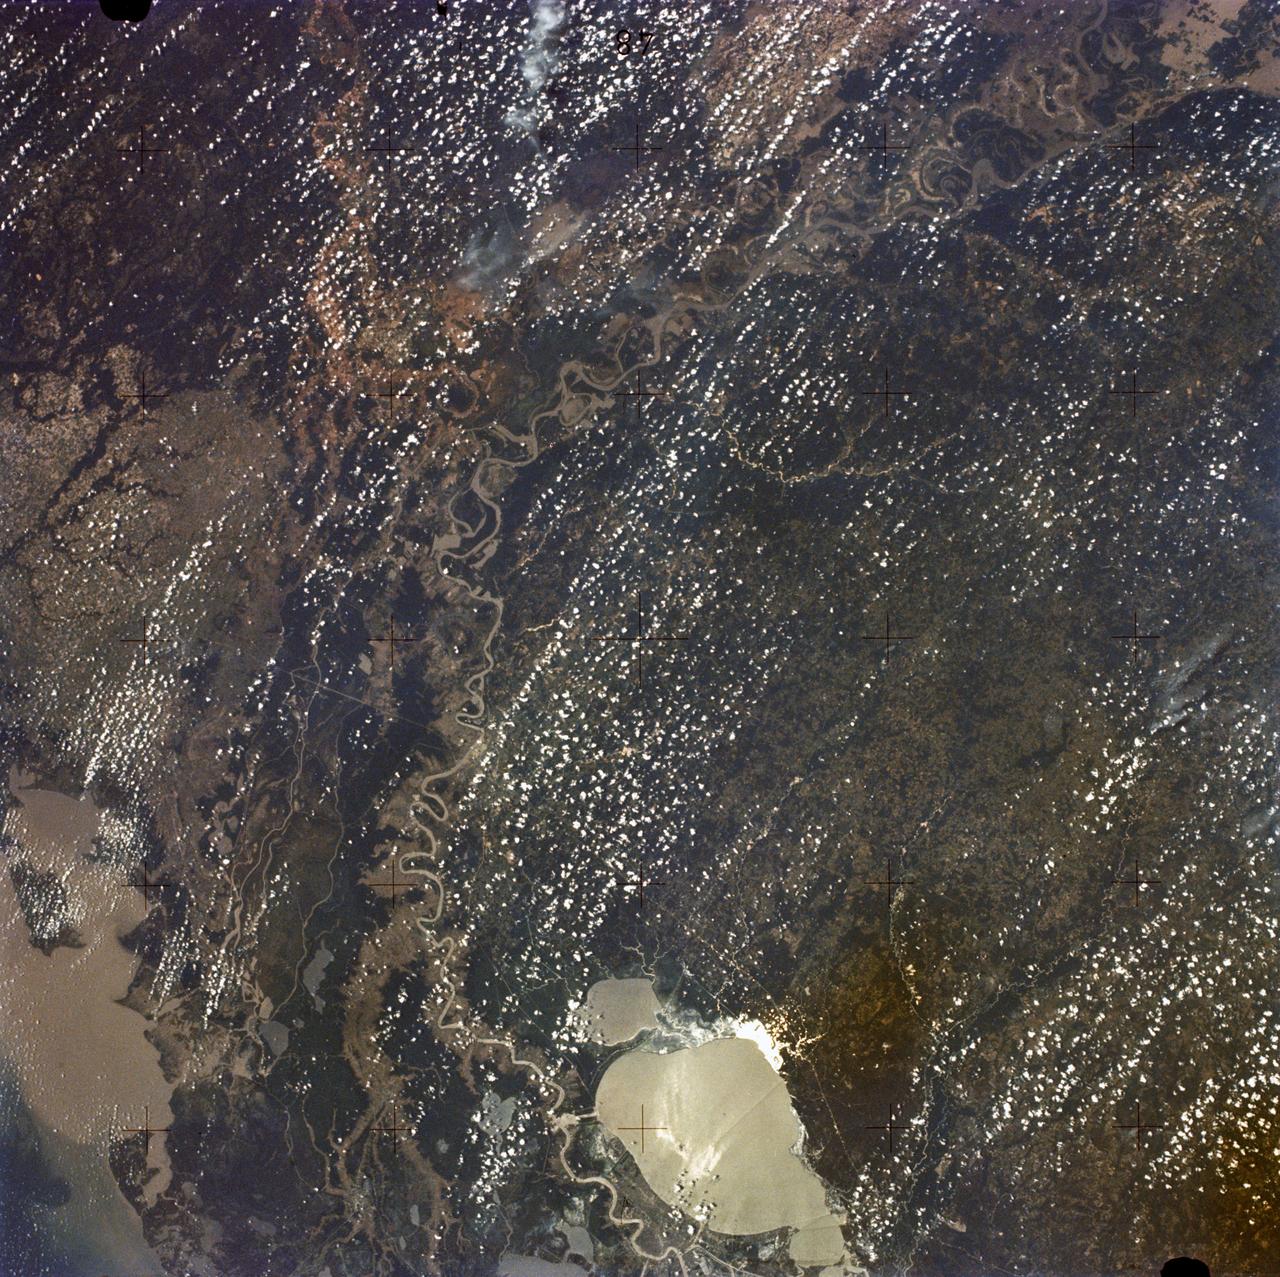
SL2-05-397 (22 June 1973) --- New Orleans, Louisiana, Mississippi River, and Lake Pontchartrain (31.0N, 91.0W) can all be seen in this single detailed view. The marshlands of the Atchafalaya Basin, previously the main drainage way for the Mississippi River, can be seen to be partially silted as a result of sediments. The long narrow field patterns fronting on the river is called the "Long Lot" system of equal land distribution based on the French Napoleonic Civil Code. Photo credit: NASA
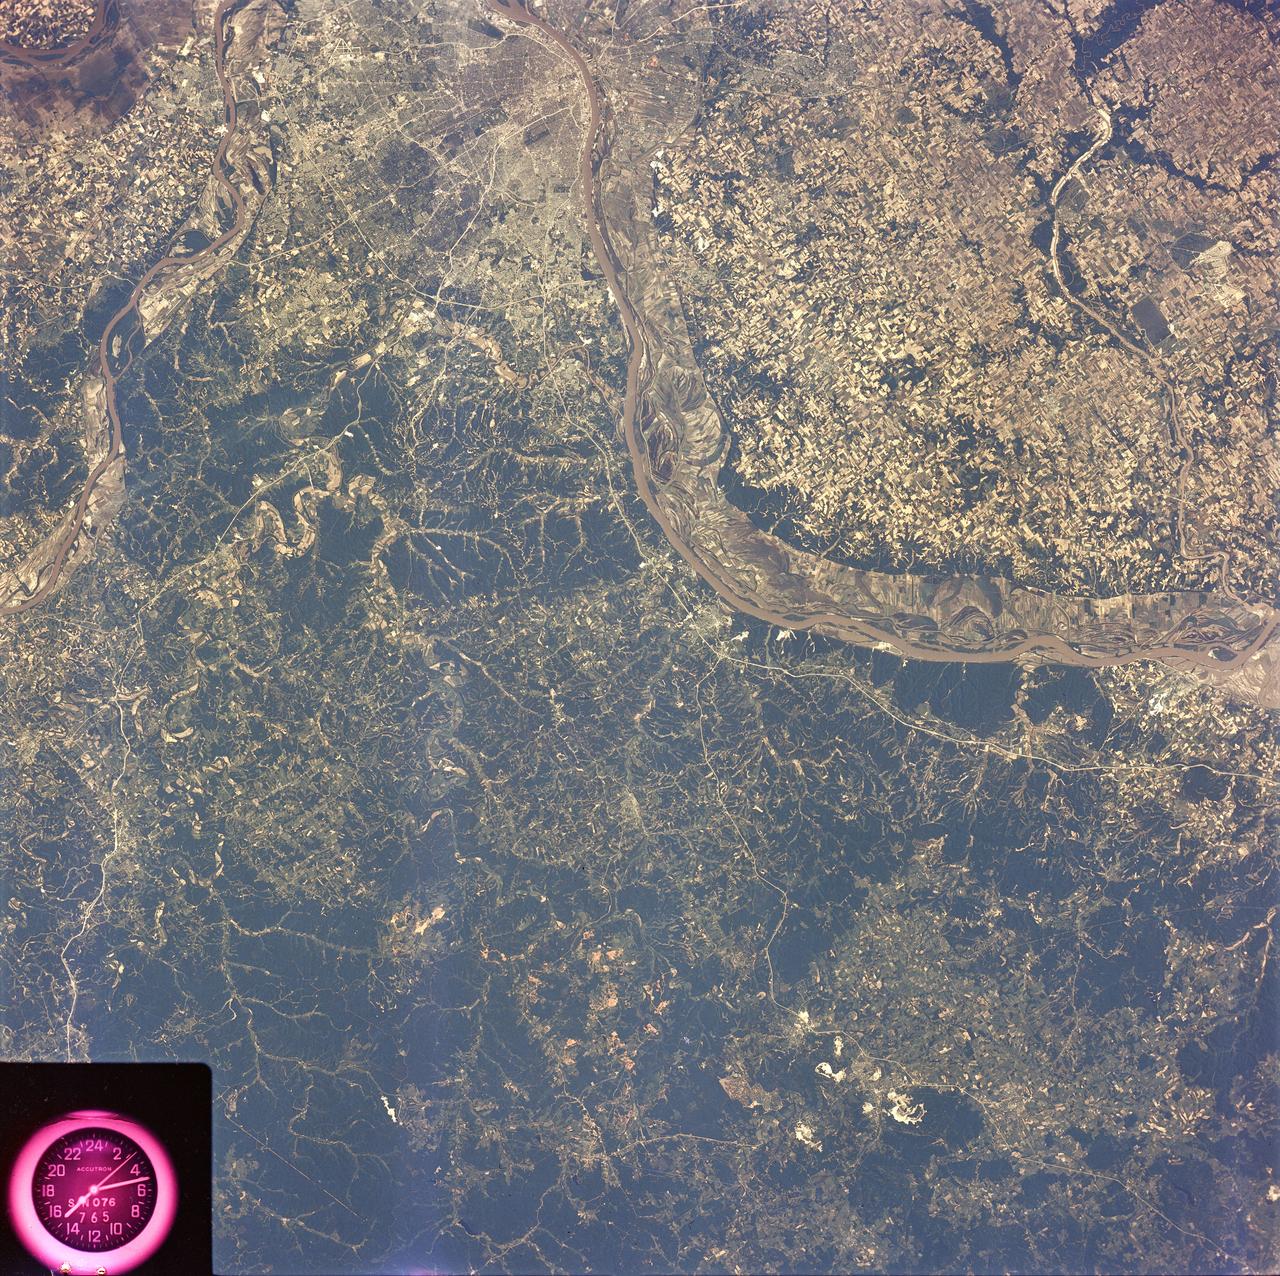
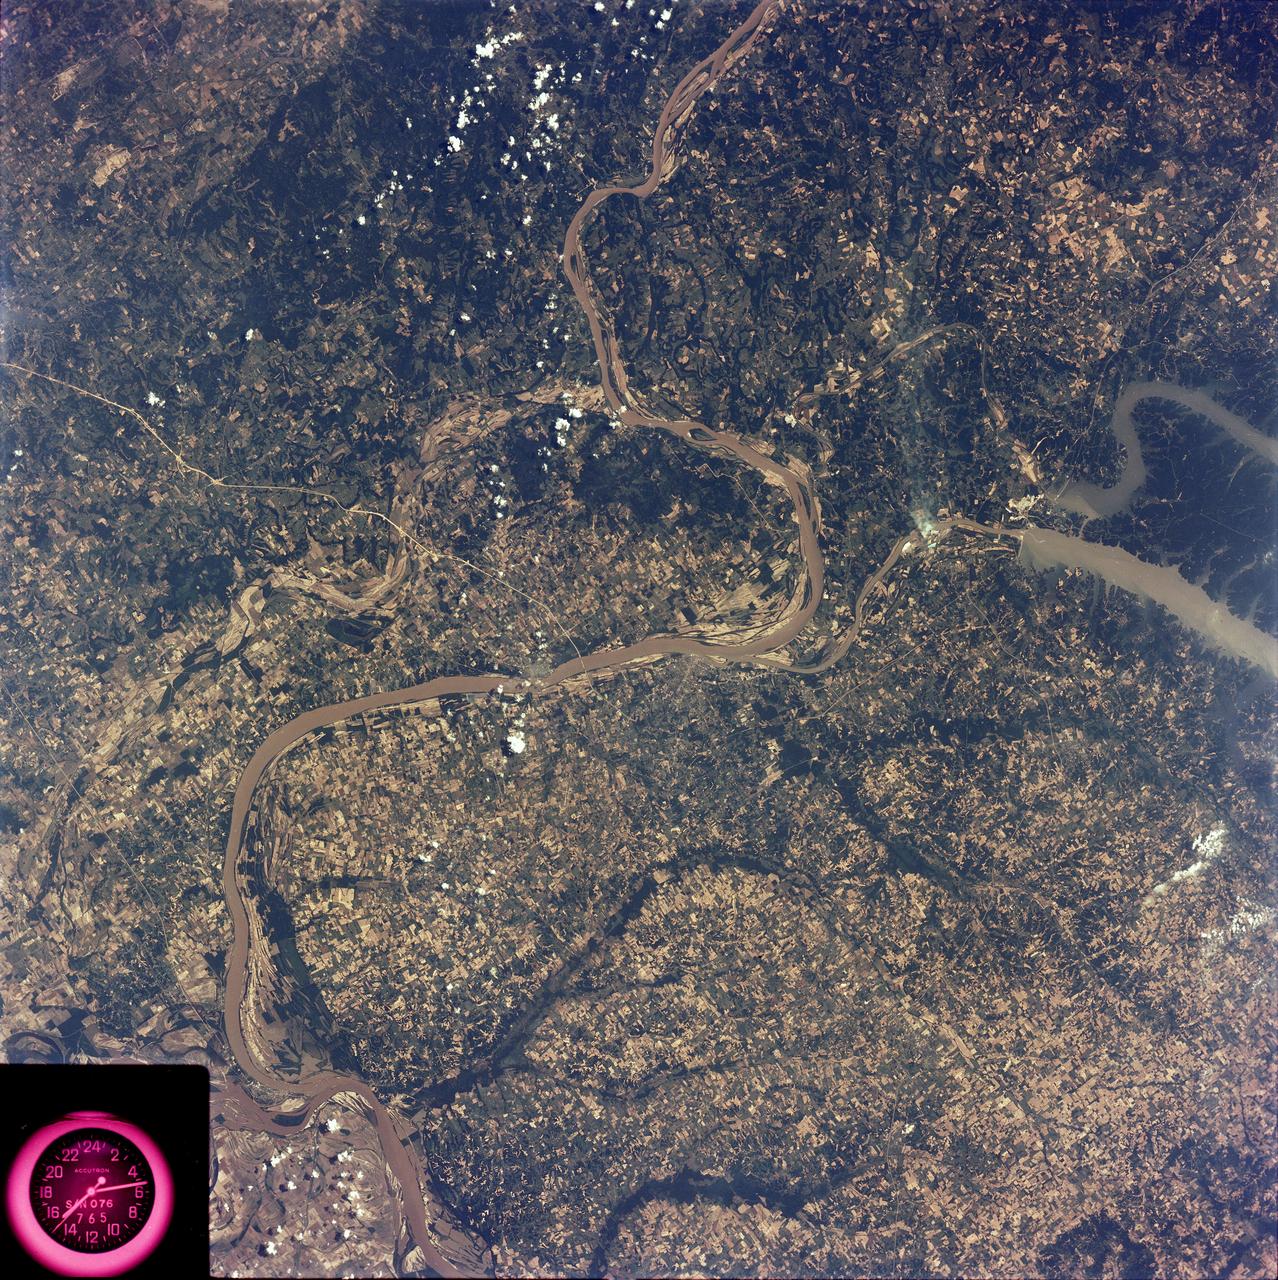
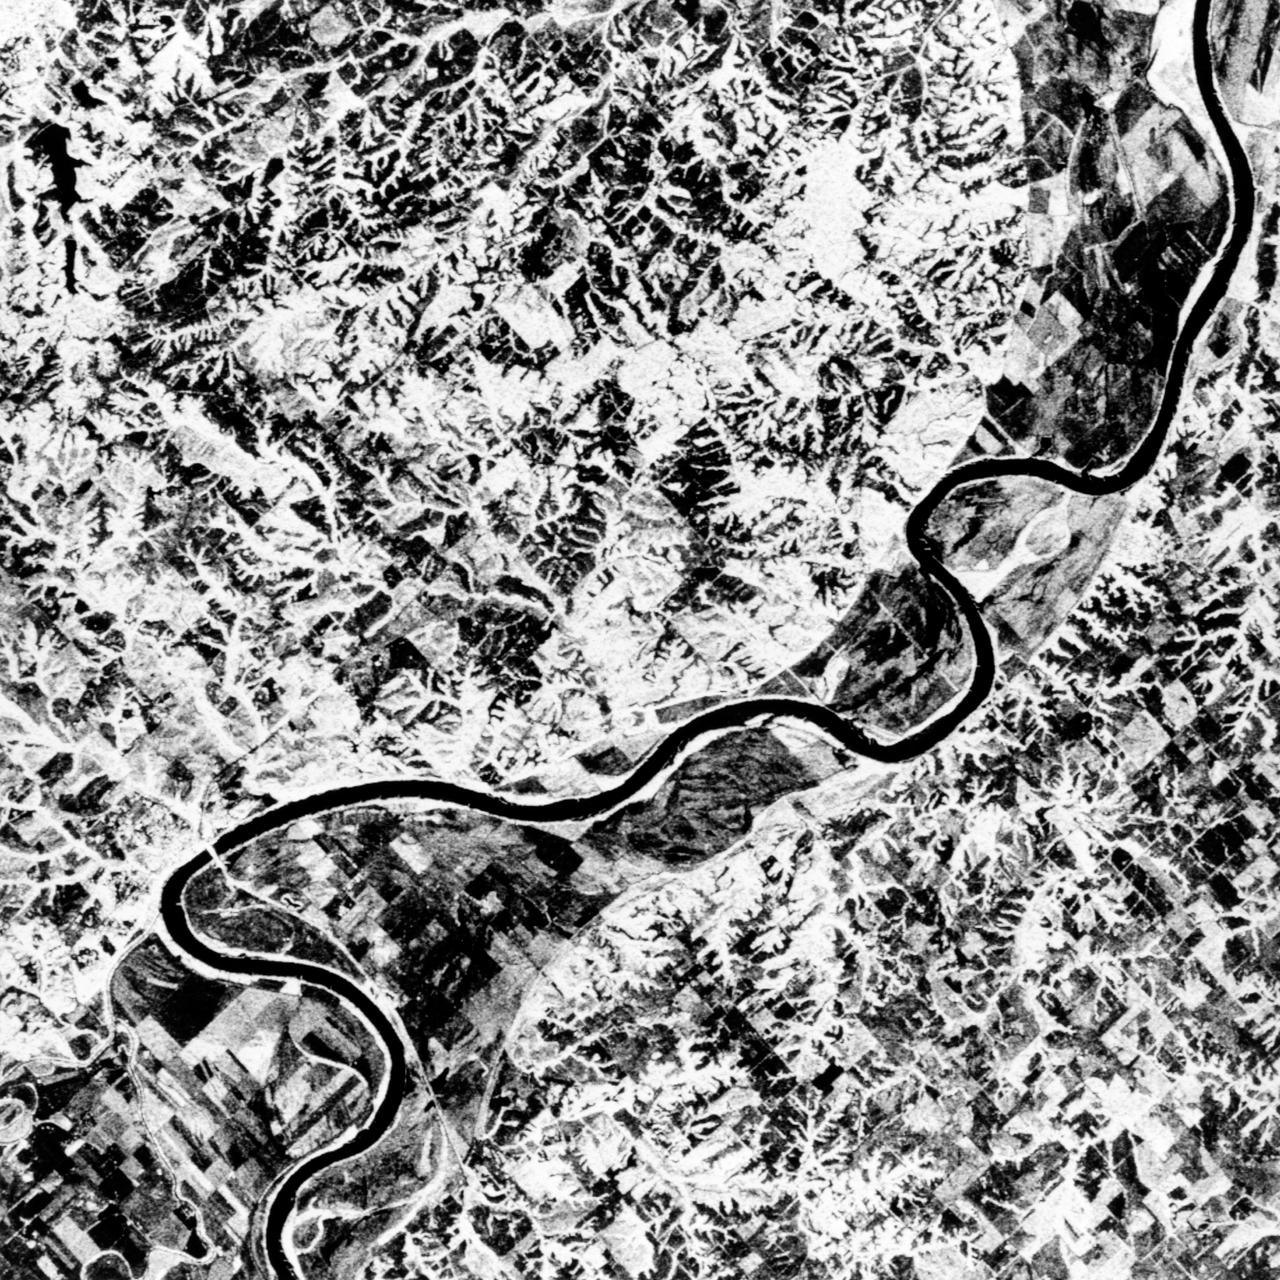
SL2-81-189 (22 June 1973) --- The well defined meanderings of the Mississippi River, just to the south of St. Louis, MO (38.5N, 90.5W) can easily be seen as curved lines and loops roughly paralleling the present river in this view showing the former water channels. The vegetated bluffs on either side of the river define the limits of the meanders where the rich river flood plain offers some of the most fertile land for agriculture although flooding remains a constant threat. Photo credit: NASA
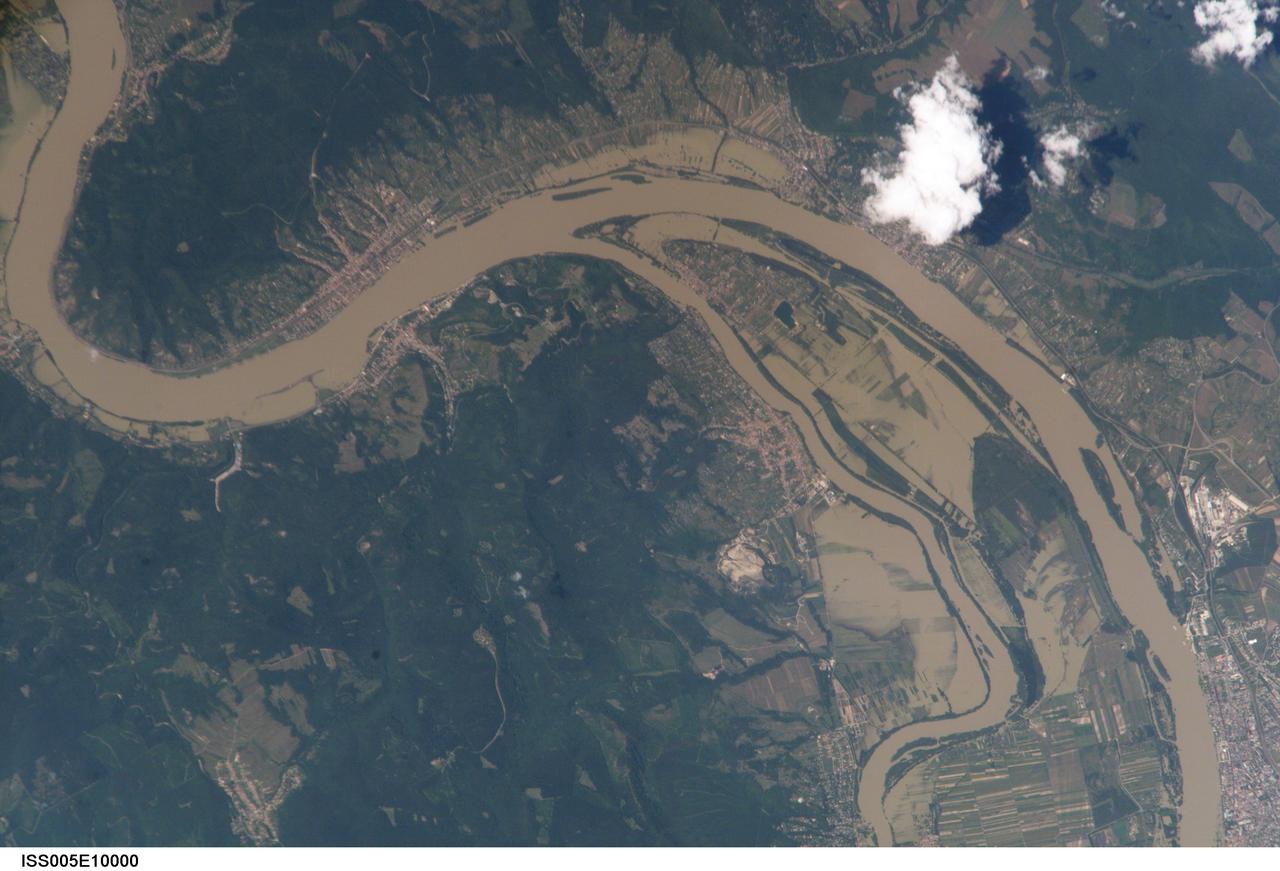
ISS005-E-10000 (18 August 2002) --- This is the first of two images recently released by the Earth Sciences and Image Analysis Laboratory at Johnson Space Center, showing the devastating European flooding in August. The images were captured by astronauts using a digital still camera onboard the International Space Station (ISS). The photographs show flooding around the Danube Bend area just north of Budapest near the city of Vác, Hungary. The flood peaked in Budapest the day after this photo was made, on August 19, at about 8.5 meters (28 feet), exceeding the previous 1965 flood record. This image shows the waters inundating farmland in the flood plain. Image no. ISS005-E-10926 shows the area four days later.
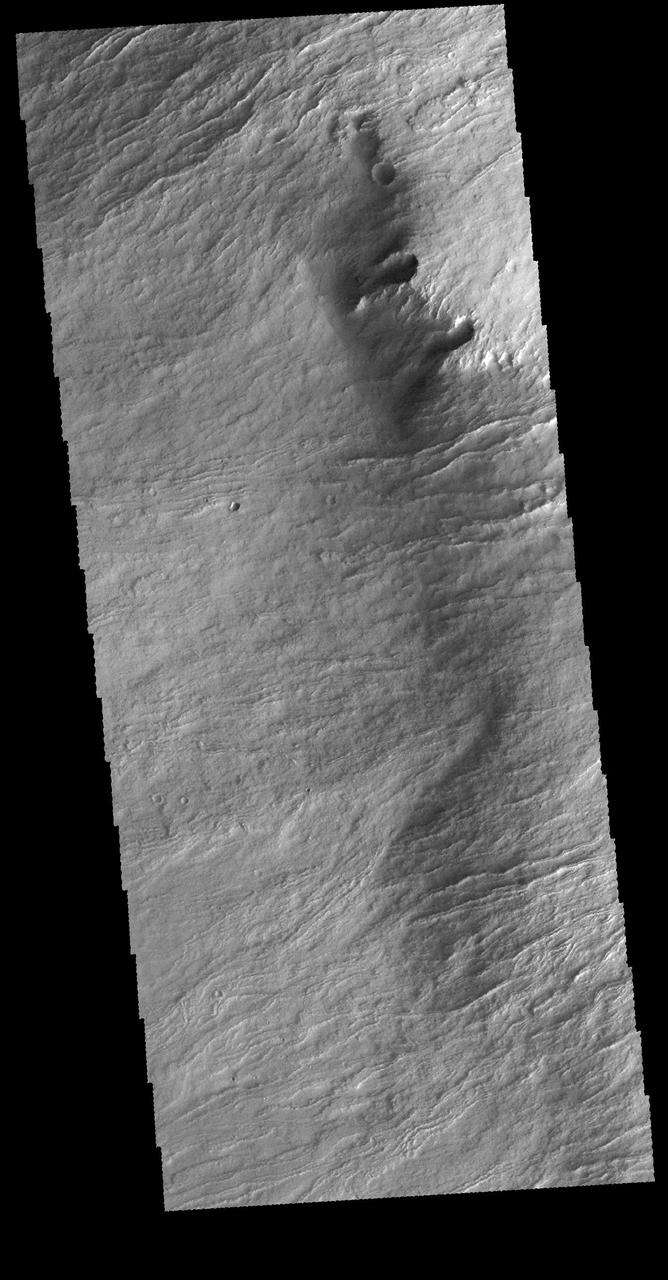
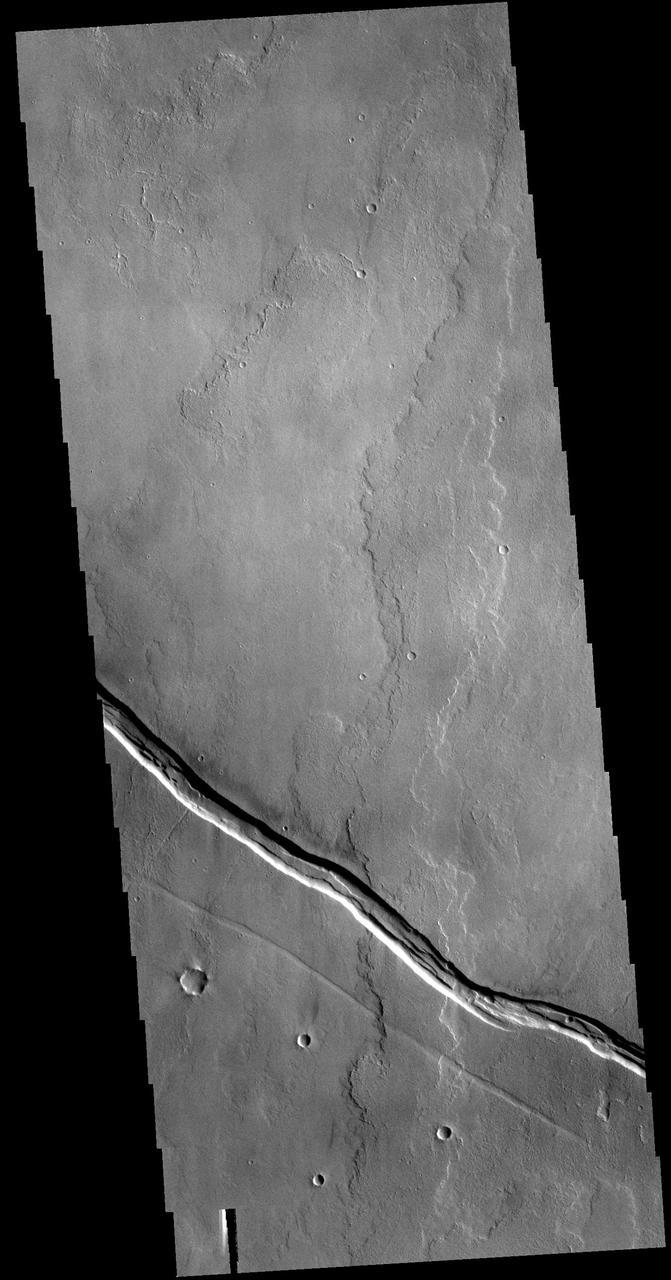
The margin of Olympus Mons consists of a cliff-like edge where elevation changes very quickly over a very small width. This edge is called Olympus Rupes. This VIS image shows part of that edge and the lava flows that spilled over the edge to flood the surrounding plains. Orbit Number: 65335 Latitude: 16.0811 Longitude: 221.373 Instrument: VIS Captured: 2016-09-05 12:58 http://photojournal.jpl.nasa.gov/catalog/PIA21155
SL2-81-194 (22 June 1973) --- This view of southern Illinois and Western Kentucky (37.0N, 88.5W), with the winding Ohio River in between also illustrates the rich agriculture potential of the flood plains in the river bottom lands. To the east are the waters of Lake Kentucky and Lake Barkley which flow into the Ohio at Paducah, KY and may be seen stretching for several miles. Except for the Land Between the Lakes State Park, Extensive agriculture may be seen throughout the area. Photo credit: NASA
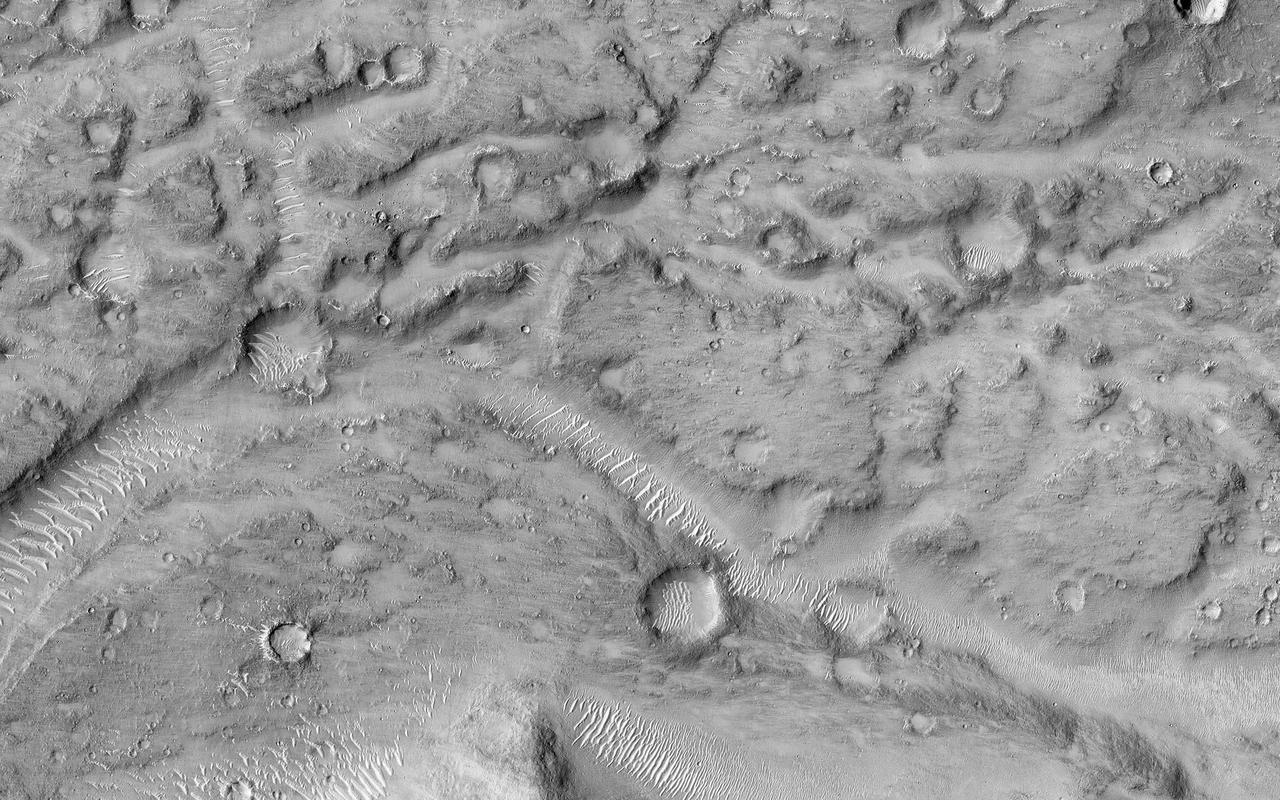
This image shows the northern terminus of an outflow channel located in the volcanic terrains of Amenthes Planum. The channel sources from the Palos impact crater to the south, where water flowed into the crater from Tinto Vallis and eventually formed a paleo lake. As rising lake levels breached through the crater's rim and inundated the plains to the north, the resulting high velocity, large discharge floods plucked out and eroded the volcanic plains scouring out the "Palos Outflow Channel" and the streamlined mesa-islands on its floor. These streamlined forms are the eroded remnants of plains material sculpted by catastrophic floods and are not sediment deposits emplaced by lower magnitude stream flows. Both the fluvial channel floor and the volcanic island surfaces are densely cratered by impacts suggesting that both the surfaces and the flood events are ancient. The morphology (shape) of the channel system and its islands have been preserved through the eons, but water has long been absent from this drainage system. Since then, winds have transported light-toned sediments across this terrain forming extensive dune fields within the channel system, on the floors of impact craters, and in other protected locations in the Palos Outflow Channel region. A closer look shows chevron, or fish-bone shaped, light-toned dunes located near the top of the image where numerous smaller channels have cut through the landscape. These dunes likely started out as Transverse Aeolian Ridges (TAR) that form perpendicular to the prevailing wind direction where the wind-blown sediment supply is scarce. This intriguing morphology likely reflects changes in the prevailing wind environment over time. http://photojournal.jpl.nasa.gov/catalog/PIA21023
This image from NASA Mars Reconnaissance Orbiter spacecraft contains interesting examples of crosscutting, sinuous and straight ridges. The ridge in the lower left of the image (orange) has gradual bends and well-defined positive relief, while the ridge in the upper right (blue) exhibits a degree of high sinuosity. Both ridges may be ancient river deposits. In the southern part of the image, there are also possible cut bank and point bar deposition scars (green), but these do not possess visible positive relief. Although lacking relief, the sinuosity of these scars implies an ancient, mature, and low-gradient meandering river. The upper right ridge exhibits a sinuous geometry with positive relief reminiscent of a mature meandering river. Cementation of by underground fluids may have given the river deposits a higher resistance to erosion compared to the surrounding flood plain. Subsequent weathering removed the deposits in the flood plain, leaving behind the river channel positive relief. Offsets of the lower left ridge along possible fault scarps (red) suggest that the area was cut by faults either during or after deposition of the river deposits. There also appears to be a less pronounced fault at the terminus of the upper right ridge. http://photojournal.jpl.nasa.gov/catalog/PIA20160
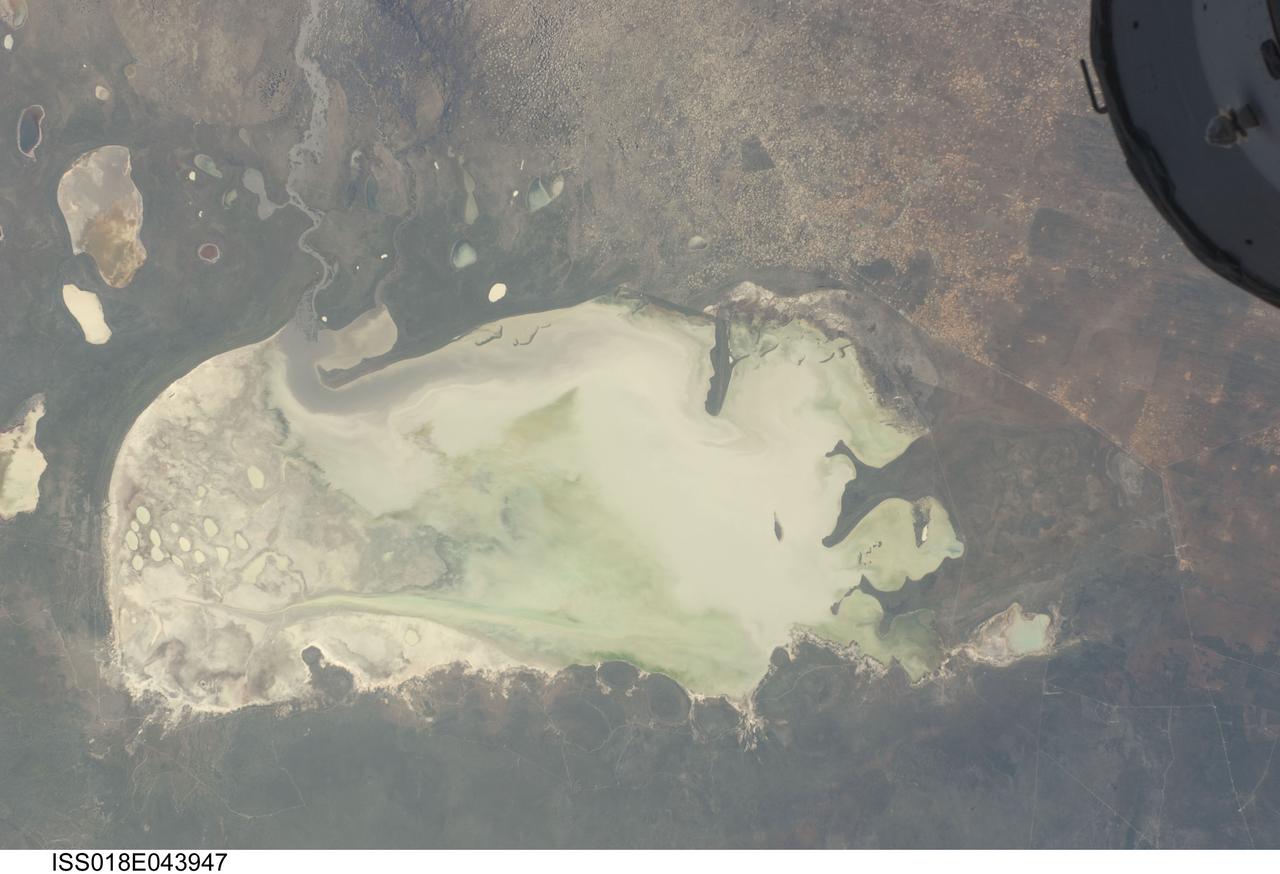
ISS018-E-043947 (26 March 2009) --- Etosha Pan in Namibia is featured in this image photographed by an Expedition 18 crewmember on the International Space Station. Etosha Pan is a large dry lake about 130 kilometers long that dominates Namibia?s Etosha National Park (the sharp edge of the park fence can be seen at right). Small related dry lake beds appear as bright shapes top left, a portion of the International Space Station appears at top right. This view shows the pan as it appeared almost ten years ago. The pan is the low point in a major inland basin in northern Namibia. During occasional flood events, such those experienced in the last nine months, rivers from Angola (the Namibia?Angola boundary lies just outside the top of the image) deliver large quantities of water to the pan. In this image flood water in the Oshigambo River, resulting from recent heavy rains in Angola, appears as a gray stream entering the northwest corner of the pan (top left). The floodwater becomes a thin sheet on the vast salt flat of the pan floor. Algae blooms in the warm water have produced a light-green tinge. Another image of the Oshigambo River mouth in flood can be seen here. Reports on the ground, augmented with orbital unmanned satellite imagery acquired subsequent to this photograph, show that the plains north of the pan are now flooded, causing damage to homesteads, crops and roads. More than 340,000 people have been affected in northern Namibia and approximately 250,000 in southern Angola.
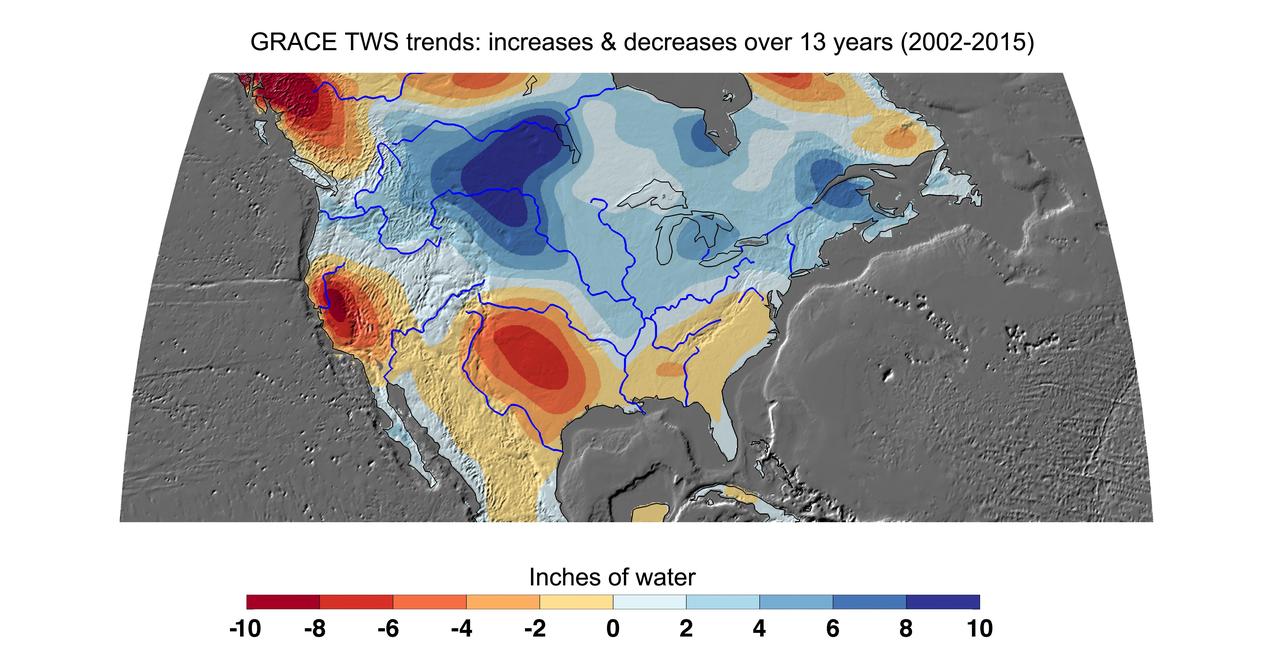
Cumulative total freshwater losses in the United States from 2002 to 2015 (in inches) observed by NASA's Gravity Recovery and Climate Experiment (GRACE) mission. Total water refers to all of the snow, surface water, soil water and groundwater combined. Much of the northern half of the country experienced increasing total water storage during this time period, while total water storage in the southern half decline. Areas where groundwater depletion strongly impacted total water losses include California's Central Valley, and the southern High Plains aquifer beneath the Texas and Oklahoma panhandles. Total water storage in the Upper Missouri River basin increased signficantly and contributed to considerable flooding during the 2002-15 time period. Image updated from Famiglietti and Rodell, 2013. Citation of Record: Famiglietti, J. S., and M. Rodell, Water in the Balance, Science, 340, 1300-1301. http://photojournal.jpl.nasa.gov/catalog/PIA20204
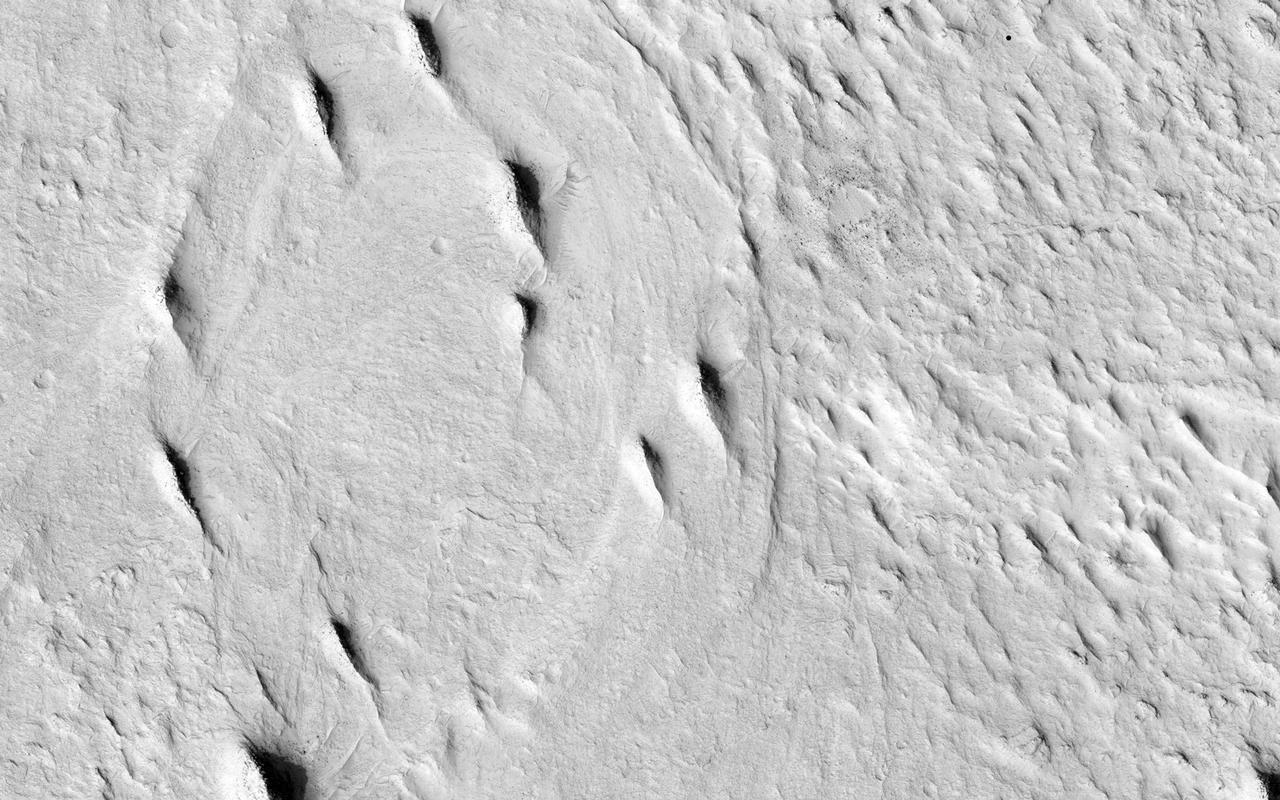
The sinuous ridges in this image display strong characteristics of ancient meandering riverbeds that are preserved as inverted topography (blue). The ancient river sediments that make up the ridges might have allowed fluids to produce cements (e.g., calcite or iron oxides) to make the channel lithology resistant to weathering and erosion. Later, physical and/or chemical processes removed the weaker surrounding flood plain material and left inverted river channels, or "positive relief." On closer inspection, degradation along sections of some inverted channels display large blocks of cemented sediment that were transported downslope by mass wasting. The sinuous character of the ridges resembles multi-thread river branches, implying that the ancient river flowed down a gentle to nearly horizontal slope (i.e., a moderate to low stream gradient). This ancient river was a mature meandering system, with flow from south to north. Multiple branches that diverted from the main flow later converged back with it. http://photojournal.jpl.nasa.gov/catalog/PIA20210
This VIS image shows part of the Tharsis lava plains between Sulci Gordii and Ulysses Fossae. While large volcanoes and huge lava flow sheets dominate the Tharsis region, extensive tectonic features are also present. The entire Tharsis region forms a bulge on the equatorial part of Mars, generated by the uplift of magma rising through the crust. The motion of subsurface magma created extensional forces, tearing the surface apart releasing the magma in floods of lava and volcano building events. At the same time the extension cracked the surface creating the faults and graben also seen in the region. In this image, the linear graben post-date the lava flows. Orbit Number: 78394 Latitude: 17.6427 Longitude: 235.778 Instrument: VIS Captured: 2019-08-17 06:43 https://photojournal.jpl.nasa.gov/catalog/PIA23475
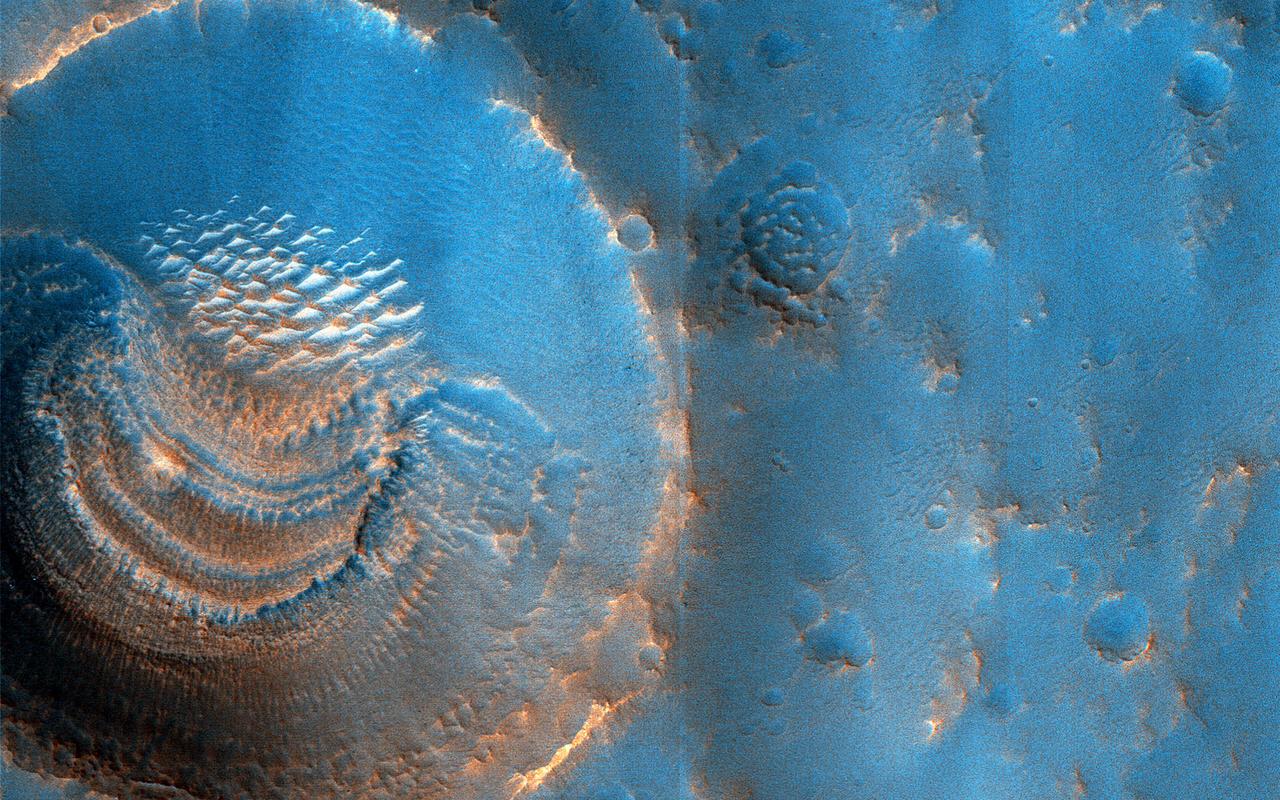
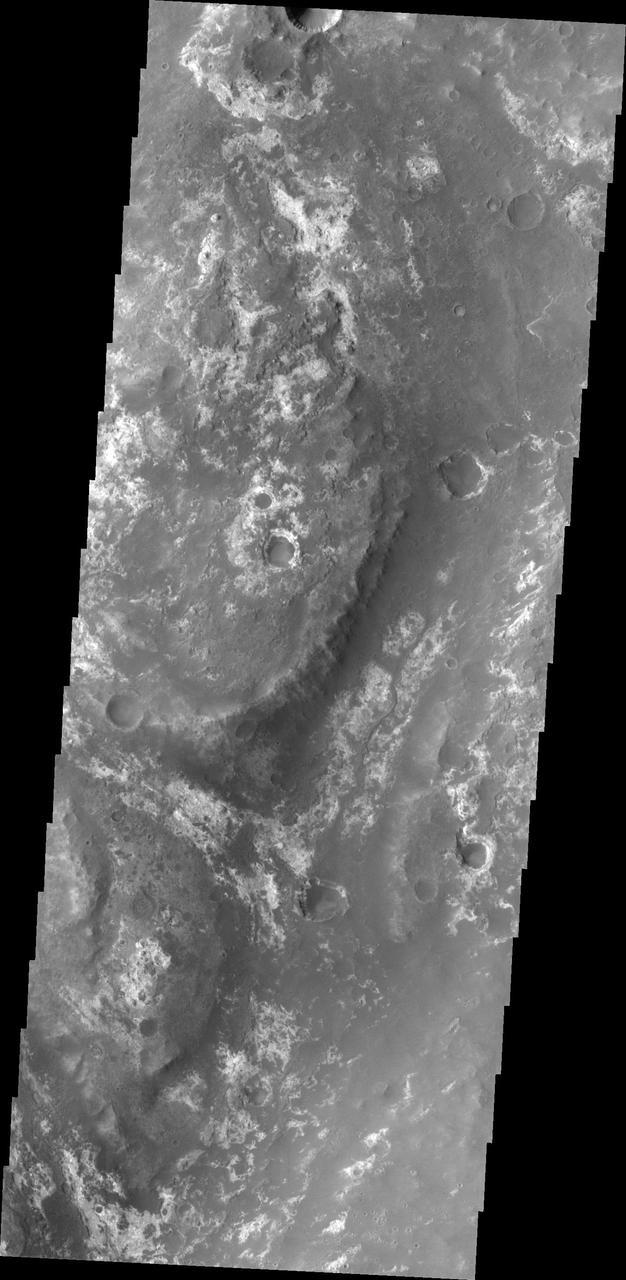
HiRISE images often raise more questions than answers. For example, this image of the northern plains of Arabia Terra shows craters that contain curious deposits with mysterious shapes and distribution. The deposits are found only in craters larger than 600 meters in diameter and are absent from craters measuring 450 meters and less. The deposits are located on the south sides of the craters but not in the north (although the cutout shows a crater that also has windblown deposits in the north). The deposits have horizontal laminations that could be layers or terraces. The deposits also have radial striations formed by small bright ridges. We suspect that these features formed by sublimation of ice-rich material. The terraces might represent different epochs of sublimation. Perhaps the larger craters penetrated to a water table between 45 and 60 meters below the surface and were flooded after formation. https://photojournal.jpl.nasa.gov/catalog/PIA25703
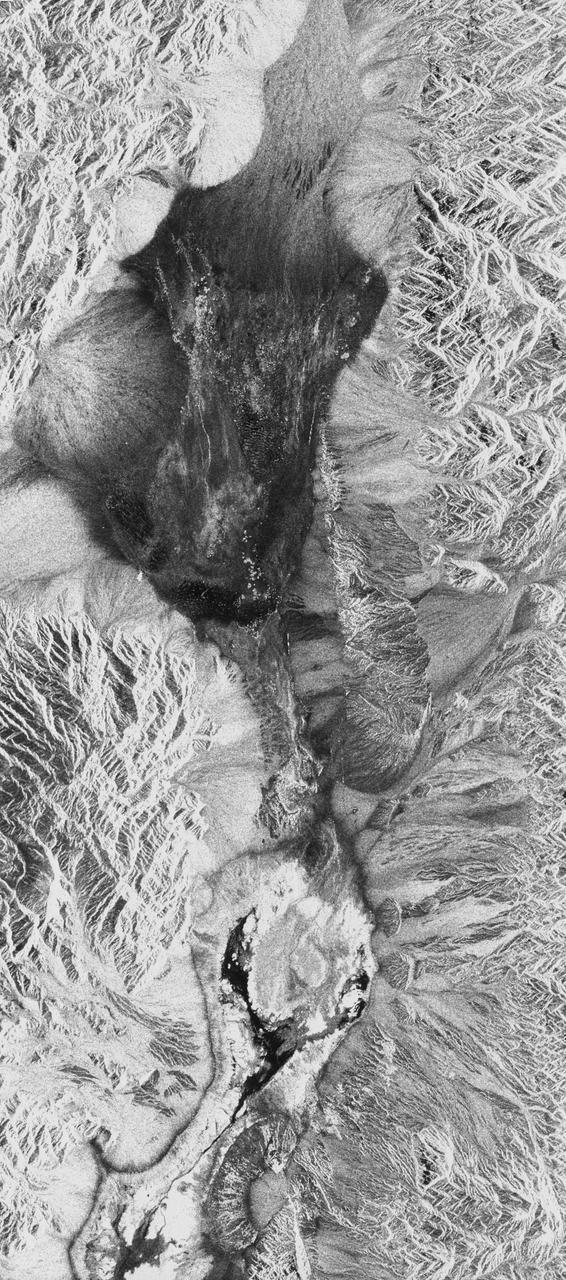
STS068-S-055 (7 October 1994) --- This is a false-color L-Band image of an area near Glasgow, Missouri, centered at about 39.2 degrees north latitude and 92.8 degrees west longitude. The image was acquired using the L-Band radar channel (horizontally transmitted and received and horizontally transmitted and vertically received) polarization's combined. The data were acquired by the Spaceborne Imaging Radar-C/X-Band Synthetic Aperture Radar (SIR-C/X-SAR) aboard the Space Shuttle Endeavour on orbit 50 on October 3, 1994. The area shown is approximately 37 by 25 kilometers (23 by 16 miles). The radar data, coupled with pre-flood aerial photography and satellite data and post-flood topographic and field data, are being used to evaluate changes associated with levee breaks in land forms, where deposits formed during the widespread flooding in 1993 along the Missouri and Mississippi Rivers. The distinct radar scattering properties of farmland, sand fields and scoured areas will be used to inventory flood plains along the Missouri River and determine the processes by which these areas return to preflood conditions. The image shows one such levee break near Glasgow, Missouri. In the upper center of the radar image, below the bend of the river, is a region covered by several meters of sand, shown as dark regions. West (left) of the dark areas, a gap in the levee tree canopy shows the area where the levee failed. Radar data such as these can help scientists more accurately assess the potential for future flooding in this region and how that might impact surrounding communities. Spaceborne Imaging Radar-C/X-Band Synthetic Aperture Radar (SIR-C/X-SAR) is part of NASA's Mission to Planet Earth. The radars illuminate Earth with microwaves, allowing detailed observations at any time, regardless of weather or sunlight conditions. SIR-C/X-SAR uses the three microwave wavelengths: the L-Band (24 centimeters), C-Band (6 centimeters) and X-Band (3 centimeters). The multi-frequency data will be used by the international scientific community to better understand the global environment and how it is changing. The SIR-C/X-SAR data, complemented by aircraft and ground studies, will give scientists clearer insights into those environmental changes which are caused by nature and those changes which are induced by human activity. SIR-C was developed by NASA's Jet Propulsion Laboratory (JPL). X-SAR was developed by the Dornier and Alenia Spazio companies for the German space agency, Deutsche Agentur fuer Raumfahrtangelegenheiten (DARA), and the Italian space agency, Agenzia Spaziale Italiana (ASI), with the Deutsche Forschungsanstalt fuer Luft und Raumfahrt e.v. (DLR), the major partner in science, operations and data processing of X-SAR. (P-44734)
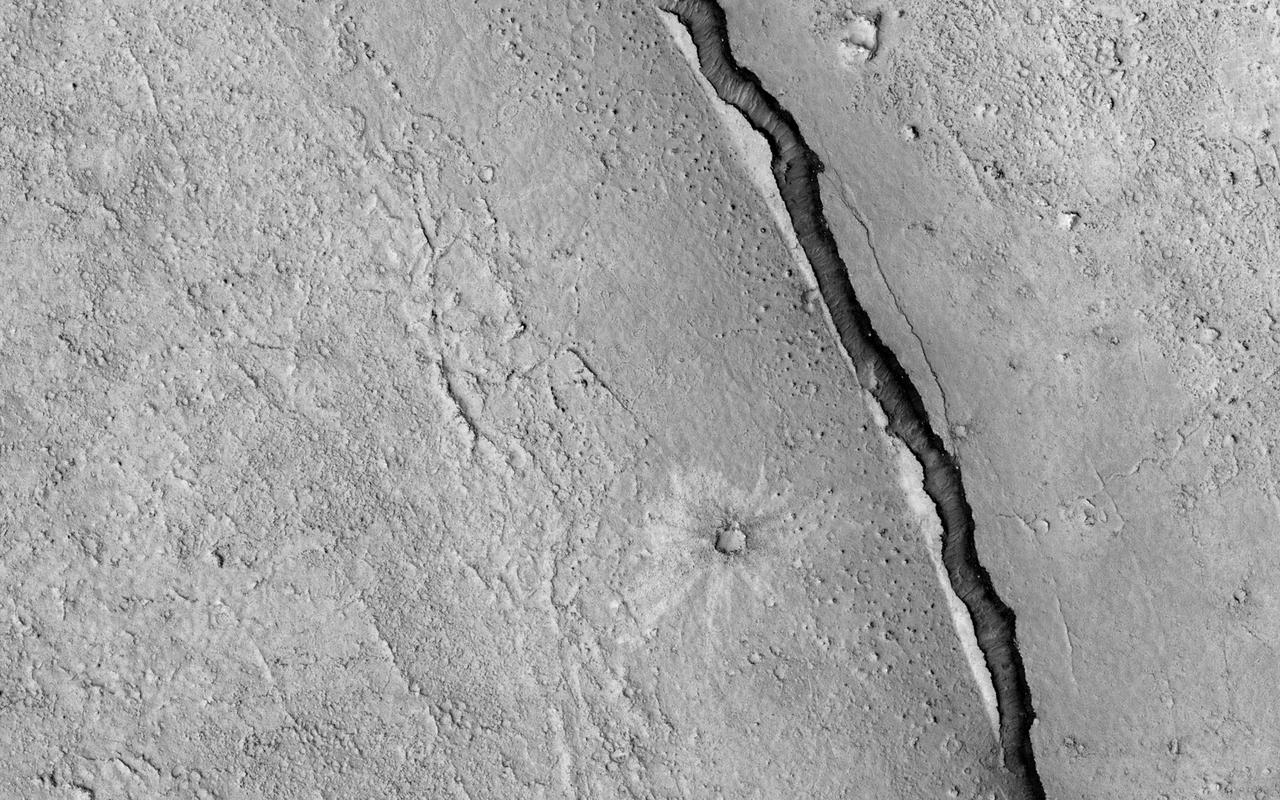
Given enough time, impact craters on Mars tend to fill up with different materials. For instance, some craters on Mars had lakes inside them in the past. When these lakes dried out, they left behind traces of their past existence, such as sedimentary deposits (materials that were carried along with the running water into the lake inside the crater and then settled down). Some craters, especially in high latitudes, contain ice deposits that filled the crater when an earlier ice age allowed ice to extend into the crater's latitude. Here, NASA's Mars Reconnaissance Orbiter spies a crater that lies close to Elysium, a major volcanic system on Mars. The whole region surrounding the crater was at some point covered by lava from the volcano creating vast lava plains, and in the process, flooding impact craters in their way. When the lava eventually cooled down, it solidified and began to shrink in size. This shrinking led to formation of cracks on the surface of the lava that grew in a circular pattern matching the shape of the crater it was filling. Scientists can study these fractures and estimate how much it shrank in volume to better understand the properties of the lava (such as its temperature) during the time it filled the crater. https://photojournal.jpl.nasa.gov/catalog/PIA21596
All this week, the THEMIS Image of the Day is following on the real Mars the path taken by fictional astronaut Mark Watney, stranded on the Red Planet in the book and movie, The Martian. Today's image shows part of Mawrth Valles, a channel carved by giant floods billions of years ago. The highlands lying to the south and west of the channel are under consideration as a potential landing site for NASA's Mars 2020 rover. Remote-sensing observations from orbit show widespread exposures of clay minerals, indicating alteration by water early in Martian history. These might preserve traces of ancient life, if there was any. For astronaut Mark Watney, driving in a pressurized and solar-powered rover vehicle, Mawrth Valles offers a gentle slope and an easy-to-follow route up from Acidalia's low-lying plains into the Arabia Terra highlands. At this point in his journey, he has driven about 750 kilometers (470 miles). Orbit Number: 38563 Latitude: 24.4297 Longitude: 341.726 Instrument: VIS Captured: 2010-08-24 14:56 http://photojournal.jpl.nasa.gov/catalog/PIA19797
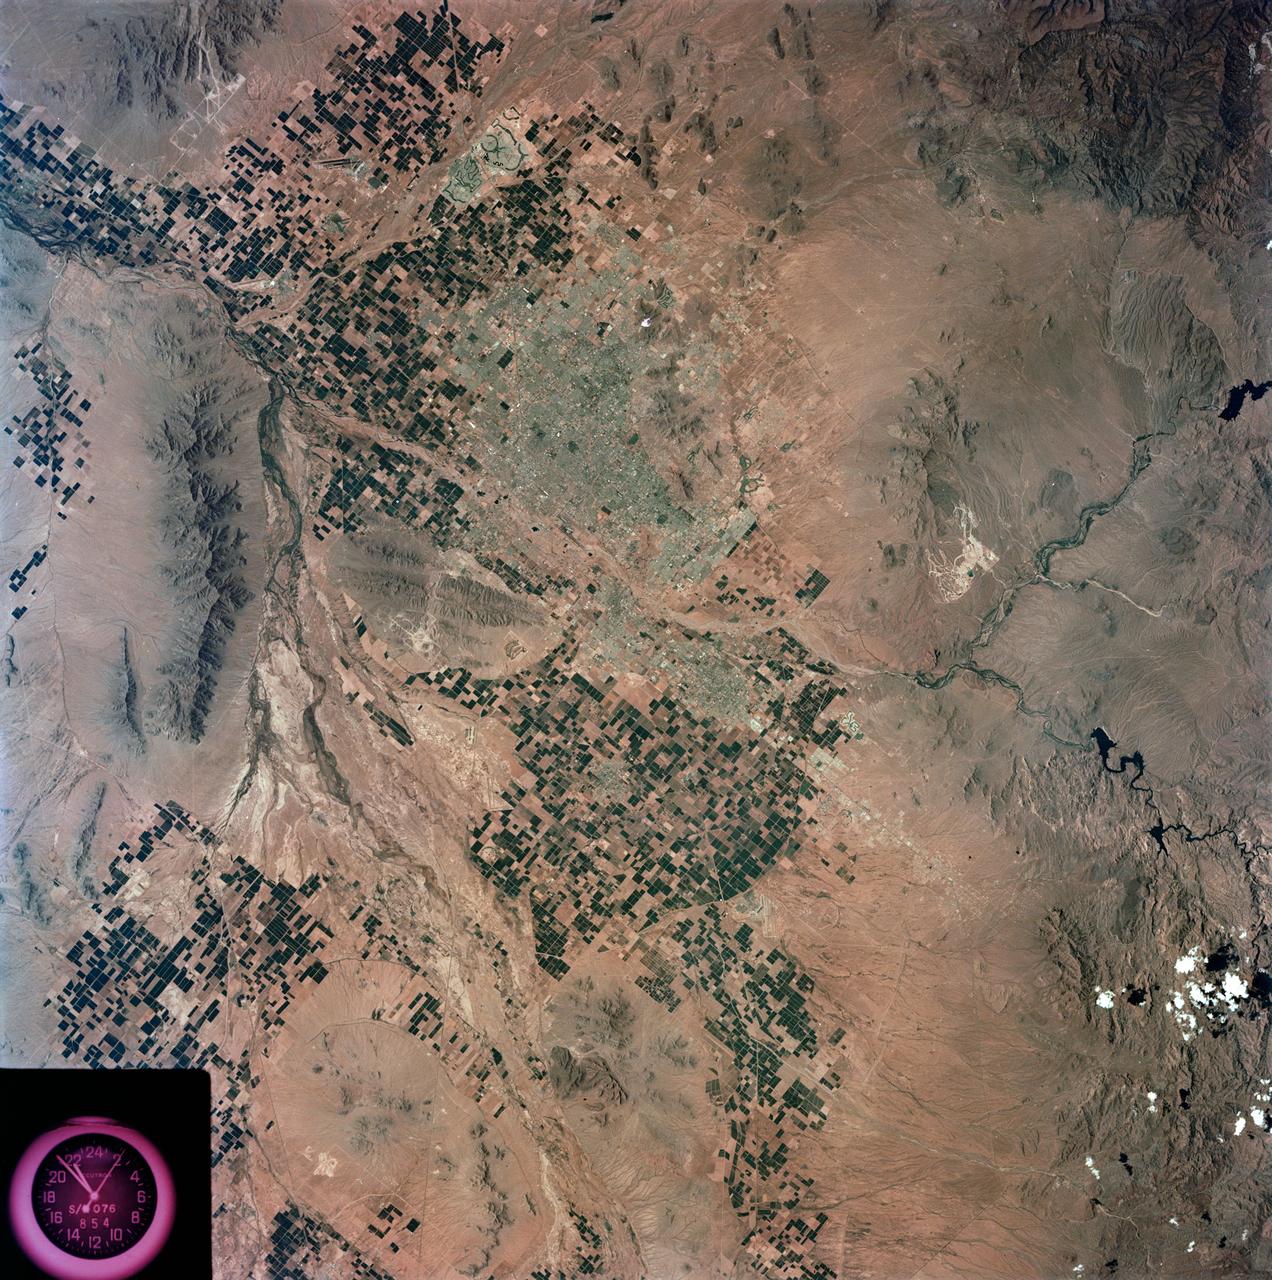
S73-35078 (July-Sept. 1973) --- A nearly vertical view of the Phoenix, Arizona metropolitan area is seen in this Skylab 3 (second manning) Earth Resources Experiments Package S190-B (five-inch Earth terrain camera) photograph taken from the Skylab space station in Earth orbit. Also in the picture are Scottsdale, Paradise Valley, Tempe, Mesa, Komatke, Salt River Indian Reservation and part of the Gila River Indian Reservation. Features which can be delineated from the photograph include: cultural patterns defined by commercial, industrial, agricultural and residential areas; transportation networks consisting of major corridors, primary, secondary and feeder streets; major urban developments in the area such as airports, Squaw Peak City Park, Turf Paradise Race Track and the State Fairgrounds. Phoenix is one of the 27 census cities of interest under study by the U.S. Geological Survey and is the center of the Arizona Regional Ecological Test Site. A large number of investigators will be using the Skylab data. This photo will be compared to earlier ones to document changes in the urban area with time. The landscape is well defined in terms of mountains, alluvial fans and river flood plains. Several different types of natural vegetation and irrigated crop lands can be mapped. Geological features are not well displayed but mining activities are readily identified. Photo credit: NASA
On April 30th, this region of Mercury's surface will have a new crater! Traveling at 3.91 kilometers per second (over 8,700 miles per hour), the MESSENGER spacecraft will collide with Mercury's surface, creating a crater estimated to be 16 meters (52 feet) in diameter. The large, 400-kilometer-diameter (250-mile-diameter), impact basin Shakespeare occupies the bottom left quarter of this image. Shakespeare is filled with smooth plains material, likely due to extensive lava flooding the basin in the past. As of 24 hours before the impact, the current best estimates predict that the spacecraft will strike a ridge slightly to the northeast of Shakespeare. View this image to see more details of the predicted impact site and time. Instrument: Mercury Dual Imaging System (MDIS) and Mercury Laser Altimeter (MLA) Latitude Range: 49°-59° N Longitude Range: 204°-217° E Topography: Exaggerated by a factor of 5.5. Colors: Coded by topography. The tallest regions are colored red and are roughly 3 kilometers (1.9 miles) higher than low-lying areas such as the floors of impact craters, colored blue. Scale: The large crater on the left side of the image is Janacek, with a diameter of 48 kilometers (30 miles) http://photojournal.jpl.nasa.gov/catalog/PIA19444
The drainages in this image are part of Hebrus Valles, an outflow channel system likely formed by catastrophic floods. Hebrus Valles is located in the plains of the Northern lowlands, just west of the Elysium volcanic region. Individual channels range from several hundred meters to several kilometers wide and form multi-threaded (anastamosing) patterns. Separating the channels are streamlined forms, whose tails point downstream and indicate that channel flow is to the north. The channels seemingly terminate in an elongated pit that is approximately 1875 meters long and 1125 meters wide. Using the shadow that the wall has cast on the floor of the pit, we can estimate that the pit is nearly 500 meters deep. The pit, which formed after the channels, exposes a bouldery layer below the dusty surface mantle and is underlain by sediments. Boulders several meters in diameter litter the slopes down into the pit. Pits such as these are of interest as possible candidate landing sites for human exploration because they might retain subsurface water ice (Schulze-Makuch et al. 2016, 6th Mars Polar Conf.) that could be utilized by future long-term human settlements. http://photojournal.jpl.nasa.gov/catalog/PIA11704
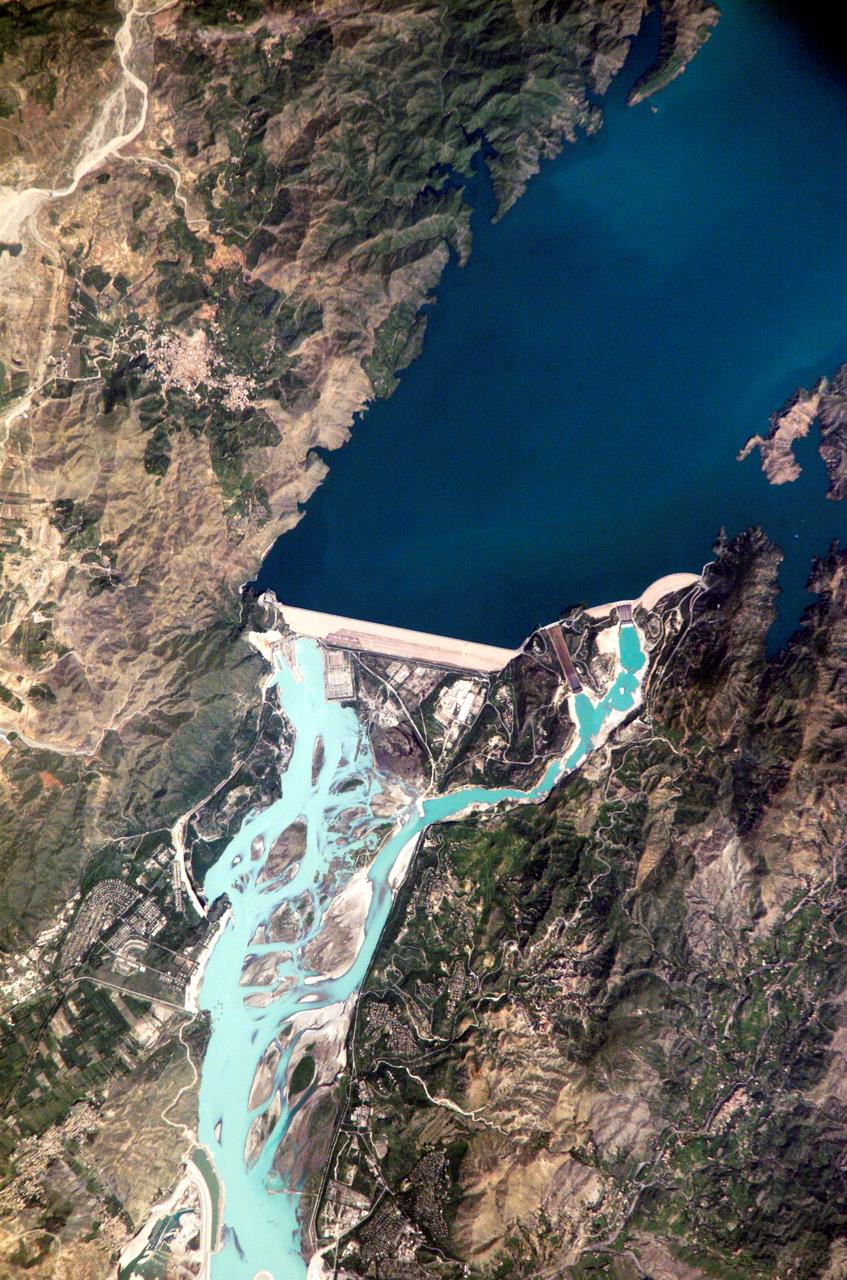
ISS005-E-12804 (6 September 2002) --- Tarbela Dam, Pakistan is featured in this image photographed by an Expedition 5 crewmember on the International Space Station (ISS). The Indus River basin extends from the Himalaya mountain ranges forming the northeastern boundary of Pakistan, to the alluvial plains of Sindh near the Arabian Sea coastline. Tarbela Dam is part of the Indus Basin Project that resulted from a water treaty signed in 1960 between India and Pakistan. This treaty guaranteed Pakistan water supplies independent of upstream control by India. Designed primarily for water storage rather than power generation, the dam was completed in 1977. Turquoise waters of the Indus River (to the south of the dam) reflect the high proportion of silt and clay suspended in waters released by the spillways (chutes on either of side of the main dam). With a volume of 142,000,000 cubic meters, the Tarbela Dam is the largest earth and rockfill dam in the world and stands 147 meters above the Indus riverbed. Its reservoir occupies an area of 37 square kilometers. While the dam has fulfilled its purpose in storing water for agricultural use in Pakistan, there have been environmental consequences to the Indus river delta, according to NASA scientists who are studying the Space Station photography. Reduction of seasonal flooding and reduced water flows to the delta have resulted in decrease of mangrove stands and abundance of some fish species.

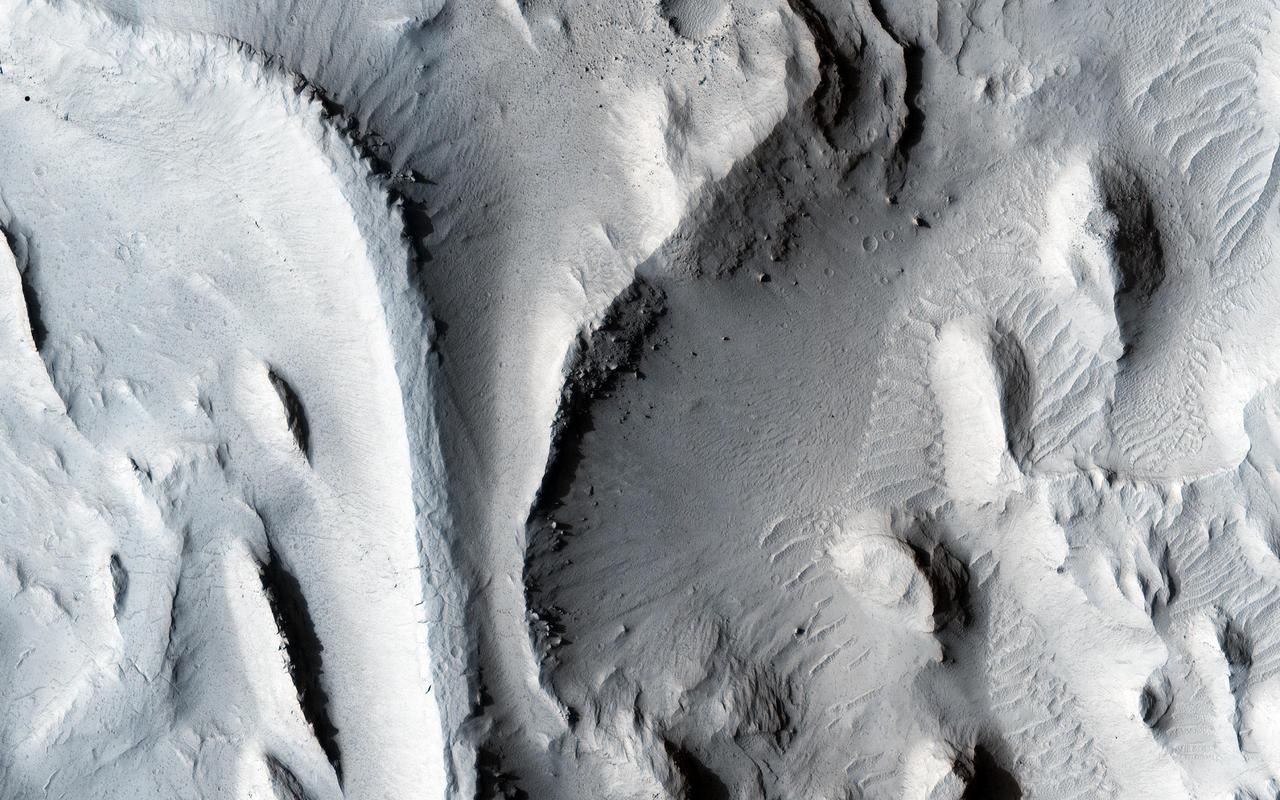
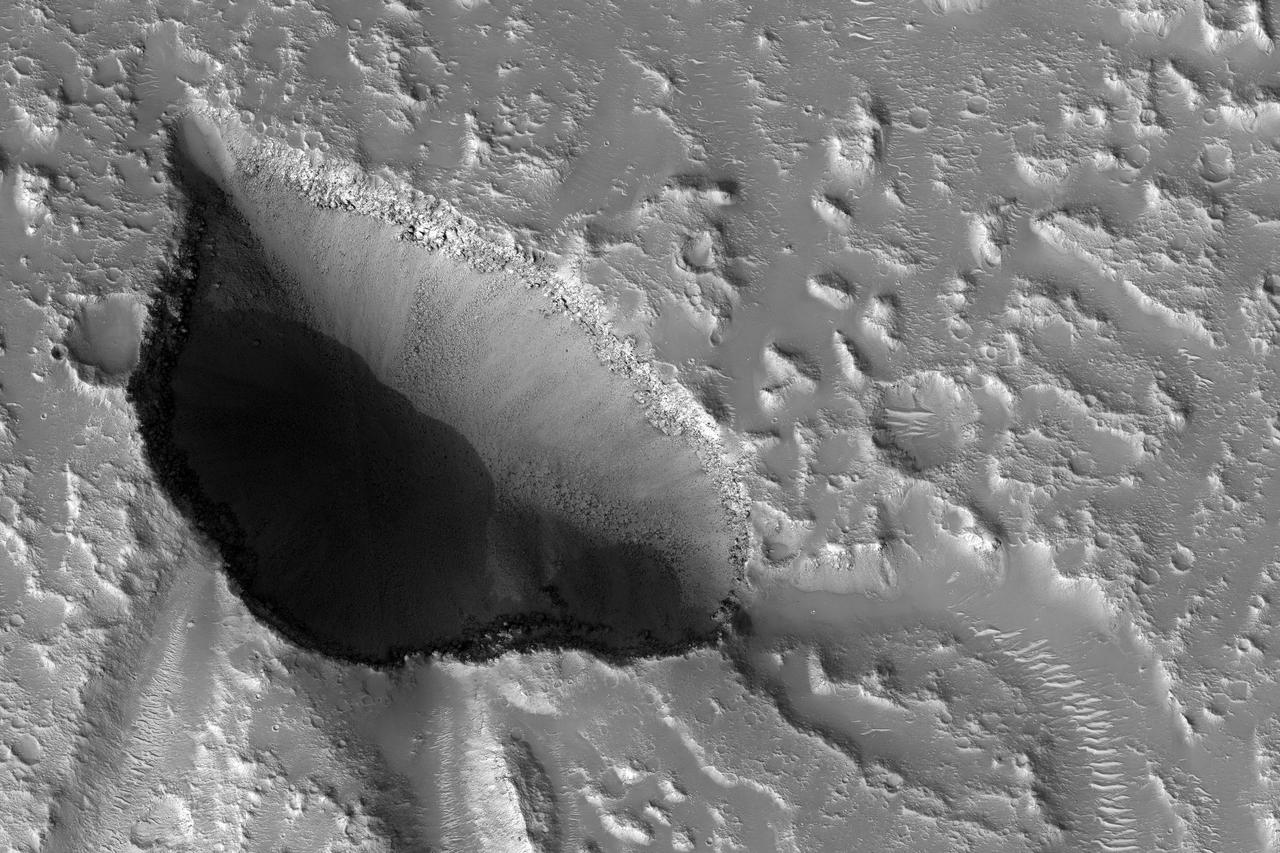
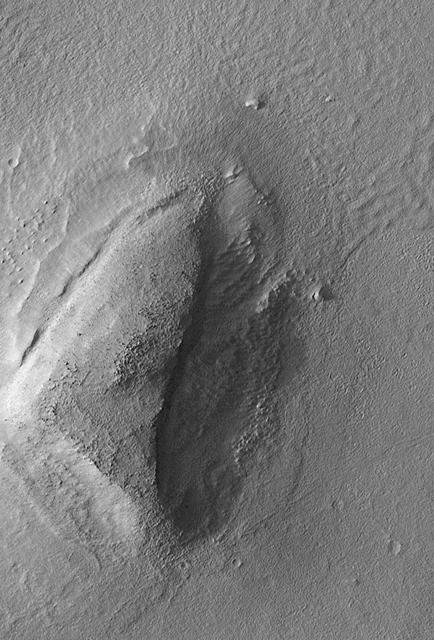
This image shows a bright, rectangular-looking landform surrounded by a dark floor. How did this feature get here if it looks so different than its surroundings? The feature resembles a plateau. Dark streaks mark steep slopes on its sides while the top appears flat. The slope streaks are not all the same age, as we see a variation in colors from faint to dark. Craters in a variety of sizes and ages pepper the entire rectangle, but the dark, textured floor has very few noticeable craters. The evidence suggests that this rectangular feature is a high-standing "island" of older land surrounded by one or more younger lava flows. This landmass is located in Amazonis Planitia, a smooth plains area potentially formed by large-scale lava floods between the Tharsis and Elysium volcanic regions. As lava flowed into this area, the rectangular plateau was too high to cover completely, leaving a bright spot sticking out of the dark basalt floor for us to find. https://photojournal.jpl.nasa.gov/catalog/PIA22725
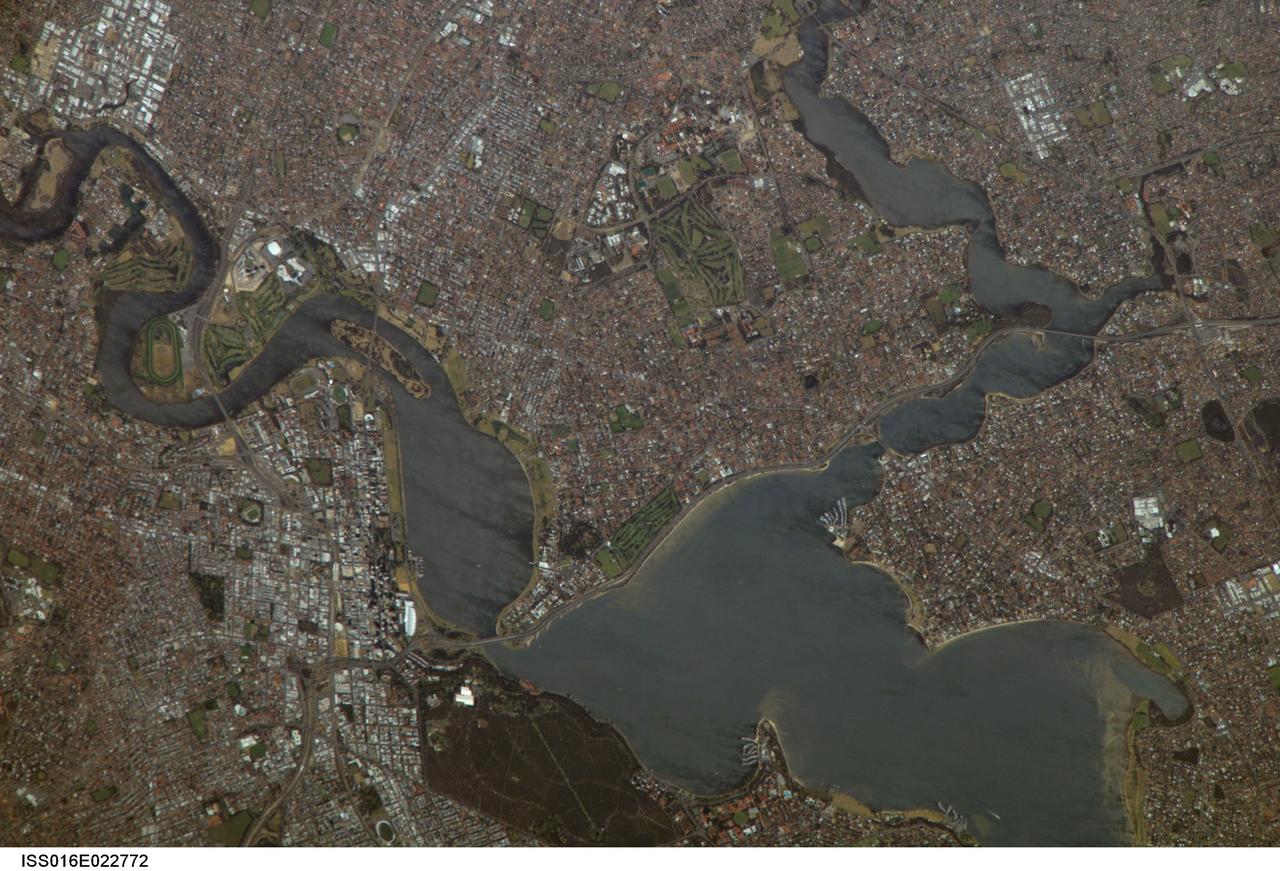
ISS016-E-022772 (11 Jan. 2008) --- Perth, Australia is featured in this image photographed by an Expedition 16 crewmember on the International Space Station (ISS). Perth is the capital of the state of Western Australia, and the largest city of the southwestern continent of Australia with an estimated population of over 1.5 million (December 2006). The downtown area of Perth and the surrounding suburbs are located on flood plain deposits of the Swan and Canning Rivers that flow through the center of the metropolitan area. Perth enjoys a Mediterranean climate, where the summers are hot and dry and winters are cool and moist. Wildfires can develop during the summer months; several large fires threatened the eastern portion of the metropolitan area in 2005. This view captures variations in urban land cover in the visible wavelengths to which the human eye is sensitive (visible red, green, and blue). The downtown center of Perth at left is characterized by large buildings (such as skyscrapers) with white reflective rooftops. Suburbs to the south (across the Swan River) are characterized by higher density of small buildings with predominantly reddish-purple roofs. Several areas of green vegetation are visible in the image. Parks and golf courses comprised mainly of grass present an even green coloration, while the dense tree canopy of Kings Park appears dark green. Variations in the coloration of the Swan and Canning Rivers is due to sunglint, or light reflected off the water surface back to the observer (in this case, a crewmember onboard the ISS).
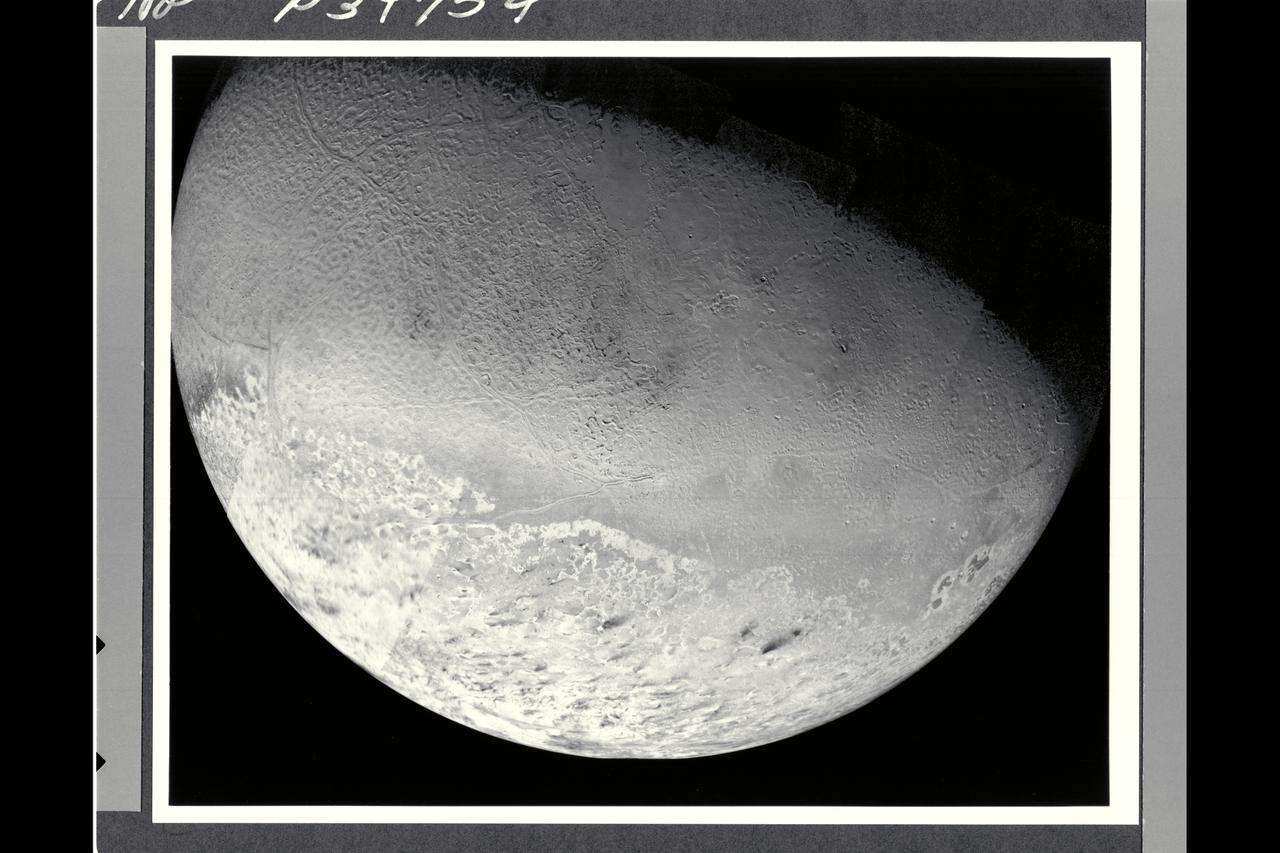
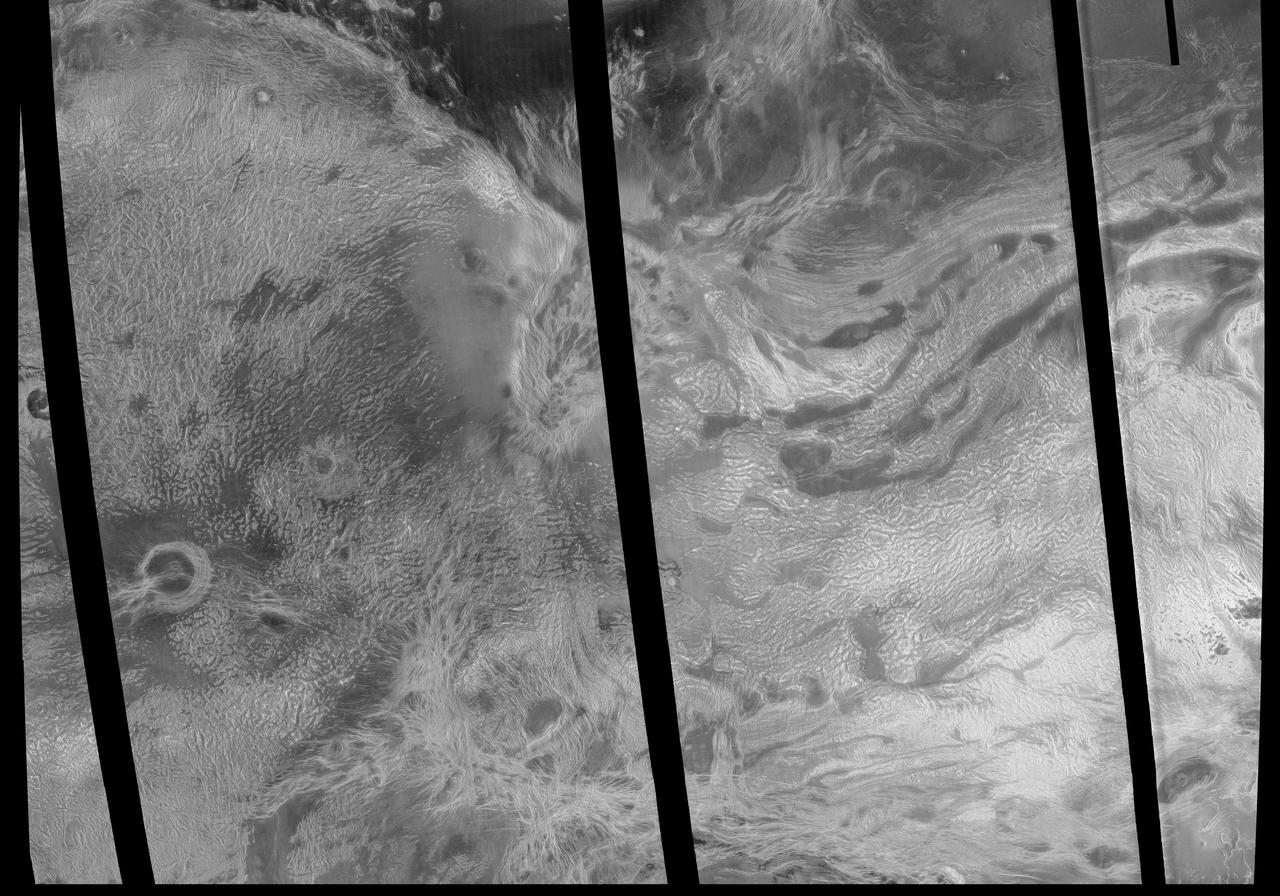
This photomosaic of Triton, assembled from 14 individual frames, shows the great variety of its surface features. At the bottom of the image are remnants of the south polar cap, containing 'dark' streaks generally aligned towards the northeast (upper right in the image). Even though these are darker than other features on Triton, they reflect nearly ten times as much light as the surface of the Earth's moon. North of the cap, in the western (left) half of the disk is the region which has been informally dubbed the 'cantaloupe' terrain. Small dimples with upraised rims and shallow central depressions dot the area. Long fractures have opened allowing some icy material to ooze up and form a central ridge. These criss-cross the region and extend into parts of the polar cap region. Towards the south this terrain has a light covering of frost. Running east to the limb of Triton, just north of the polar cap, is an area of smooth plains and low hills which is the most densely cratered region seen. In the northeast (upper right) of this image are plains which show evidence for extensive resurfacing, including possible extrusions of flowing material onto the surface. This region also contains two large smooth areas reminiscent of the maria of the Earth's moon which were formed by large-scale volcanic flooding. Near the eastern (right) limb of Triton are three darker gray markings with sharply defined brighter borders. These are unlike anything else seen in the solar system, and their origin is not yet understood.
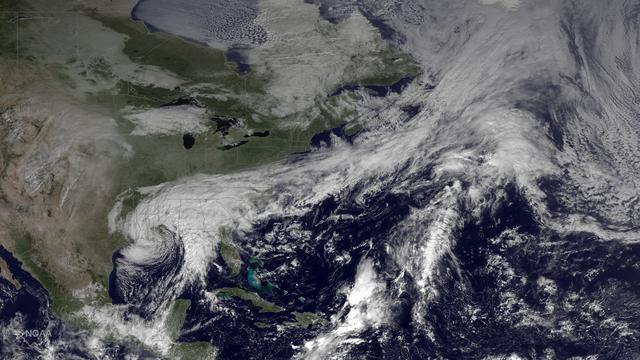
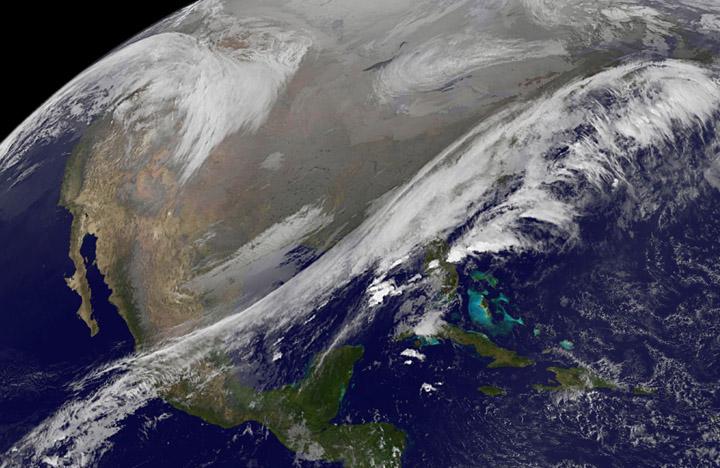
The system that brought heavy rainfall and flash flooding to parts of the southern Plains and western Gulf Coast over the past several days continues to push eastward, with the greatest potential for heavy rain and flash flooding on Monday across parts of the lower Mississippi Valley and Southeast. This image was taken by GOES East at 1515Z on October 26, 2015. <b><a href="http://goes.gsfc.nasa.gov/" rel="nofollow">Credit: NOAA/NASA GOES Project</a></b> Credit: NASA/NOAA via <b><a href="www.nnvl.noaa.gov/" rel="nofollow"> NOAA Environmental Visualization Laboratory</a></b> <b><a href="http://www.nasa.gov/audience/formedia/features/MP_Photo_Guidelines.html" rel="nofollow">NASA image use policy.</a></b> <b><a href="http://www.nasa.gov/centers/goddard/home/index.html" rel="nofollow">NASA Goddard Space Flight Center</a></b> enables NASA’s mission through four scientific endeavors: Earth Science, Heliophysics, Solar System Exploration, and Astrophysics. Goddard plays a leading role in NASA’s accomplishments by contributing compelling scientific knowledge to advance the Agency’s mission. <b>Follow us on <a href="http://twitter.com/NASAGoddardPix" rel="nofollow">Twitter</a></b> <b>Like us on <a href="http://www.facebook.com/pages/Greenbelt-MD/NASA-Goddard/395013845897?ref=tsd" rel="nofollow">Facebook</a></b> <b>Find us on <a href="http://instagrid.me/nasagoddard/?vm=grid" rel="nofollow">Instagram</a></b>
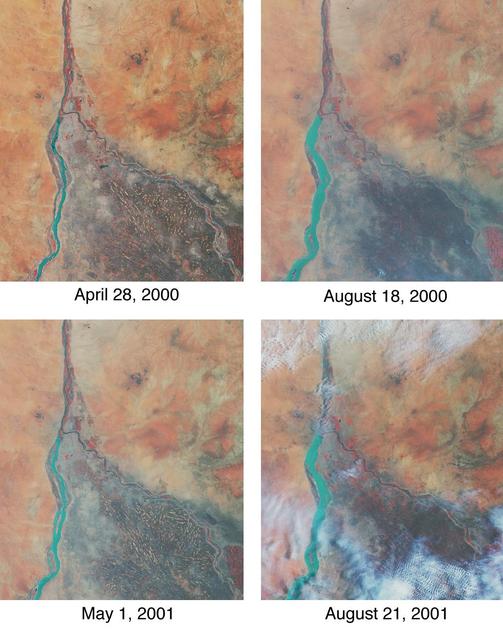
Throughout history, the rising and falling waters of the mighty Nile River have directly impacted the lives of the people who live along its banks. These images of the area around Sudan's capital city of Khartoum capture the river's dynamic nature. Acquired by the Multi-angle Imaging SpectroRadiometer's nadir (vertical-viewing) camera, they display the extent of the Nile waters before and after the onset of the rainy seasons of 2000 (top pair) and 2001 (bottom pair). The images are displayed in "false color," using the camera's near-infrared, green, and blue bands. With this particular spectral combination, water appears in shades of blue and turquoise, and highly vegetated areas show up as bright red. Originating in Uganda and Ethiopia, respectively, the waters of the White Nile (western branch) and Blue Nile (eastern branch) converge at Khartoum (about half-way between image center and the left-hand side), and continue to flow northward as the Great Nile. Although the most obvious feature in these images is the increased width of the White Nile between spring and summer, careful inspection shows that the Great Nile is at its widest in August 2001 (note in particular the area between the clouds near the top of this panel). Heavy rains in the Blue Nile catchment area of the Ethiopian highlands led to a rapid overflow of the river's floodwaters into the main stream of the Great Nile, leading to extensive flooding, the worst effects of which occurred north of Khartoum. According to the Food and Agriculture Organization of the United Nations, tens of thousands of people have fled their homes, and the number of people in need of urgent food assistance in Sudan, estimated at three million earlier in the year, was likely to increase with the onset of these floods. South of the confluence of the White Nile and the Blue Nile, the area of a cross-hatched appearance is the irrigated plain of El Gezira. The Gezira irrigation scheme uses water from the Makwar Dam (now called the Sennar Dam), located across the Blue Nile south of Khartoum. Among the main agricultural products of this region are cotton, millet, peanuts and fodder crops. Overall prospects for Sudan's 2001 grain crop were already poor prior to the flooding due to a late start of the rainy season in parts of the country. Following two consecutive years of serious drought, precipitation arrived too late to save the grain harvest that normally begins in late August. Lower harvests for the past two years coupled with depletion of stocks have led to a rise in cereal prices, reducing access to food for the Sudan's poorer citizens, already suffering from the effects of Africa's longest running civil war. Each of these images represents an area of about 130 kilometers x 150 kilometers. The data were obtained during Terra orbits 1922, 3553, 7281, and 8912. http://photojournal.jpl.nasa.gov/catalog/PIA03420
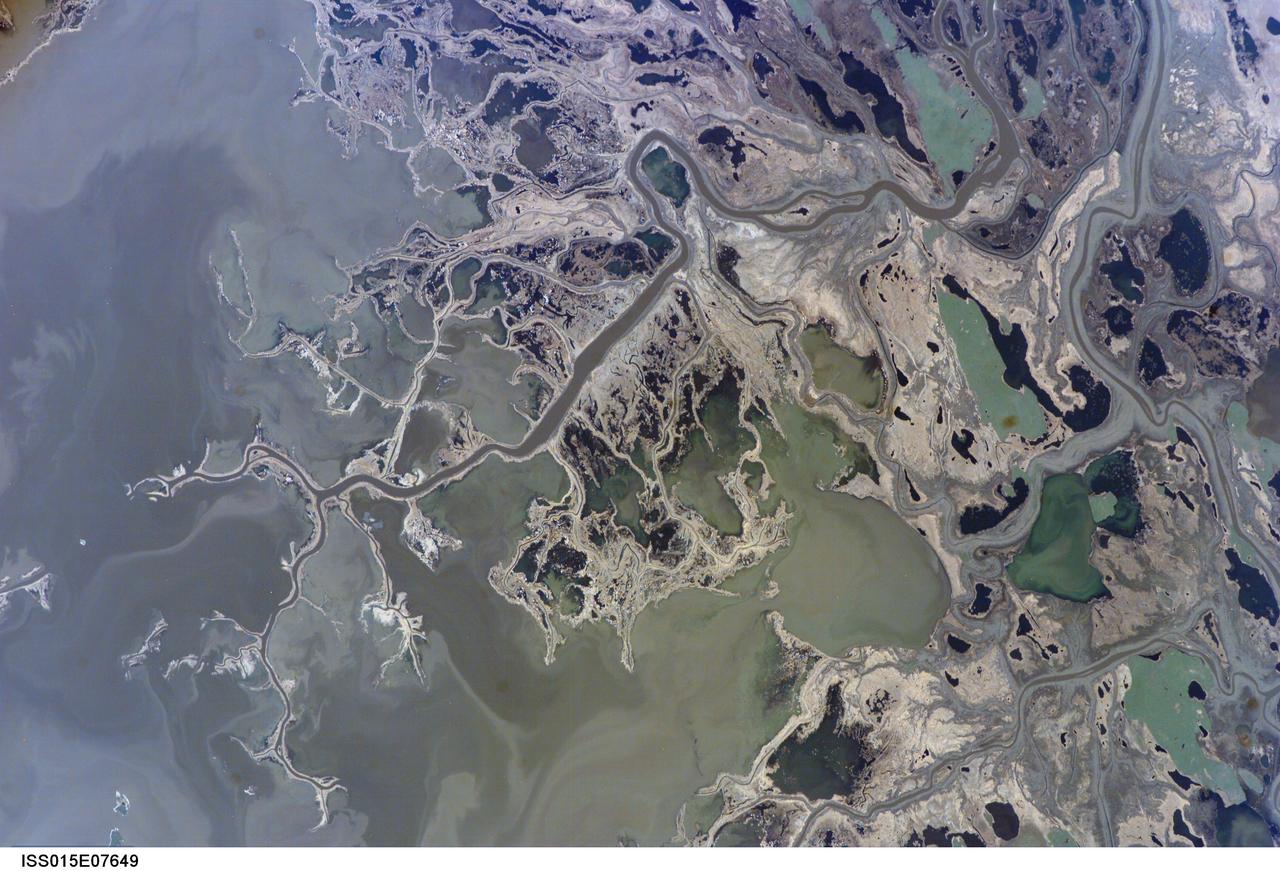
ISS015-E-07649 (11 May 2007) --- Saskatchewan River Delta, Manitoba, Canada is featured in this image photographed by an Expedition 15 crewmember on the International Space Station. This image highlights a portion of the Saskatchewan River delta extending into Cedar Lake in the Province of Manitoba. The Saskatchewan River watershed extends from the Rocky Mountains of Alberta through the plains of Saskatchewan and Manitoba. The construction of the Grand Rapids Dam to the southeast (not shown) in the 1960s flooded the Cedar Lake basin. This has resulted in the formation of numerous shallow, muddy lakes and bogs (dark green to dark grey irregular areas and at upper right) in and around the Saskatchewan River delta. The level of saturation in these bogs is such that peat (semiconsolidated plant and organic matter) deposits have formed; over long periods of time and under the right geological conditions, such deposits can become coal. The velocity of Saskatchewan River water slows significantly as it enters Cedar Lake; as the flow velocity drops, entrained sediment comprised of silt, clay, sand, and gravel is deposited at the river mouth. These deposits, called alluvium by geologists, account for much of the light tan to grey materials bordering the active channels visible in the image (Saskatchewan River, Summerberry River). According to scientists, fossil-bearing amber -- originating from Late Cretaceous (approximately 65-99 million years ago) coal deposits over a thousand kilometers to the west of Cedar Lake -- is also found in the deltaic sediments. As the deposits accumulate, old channels are abandoned and new channels are formed, as the river seeks more favorable flow paths into the lake, this process (known as avulsion) builds out the river delta over time. A typical "birds foot" delta form is currently being constructed at the mouth of the Saskatchewan River (lower left). The birds foot structure is approximately 13 kilometers wide. The Mississippi River's active delta, while having the same general form, is much larger by comparison -- it is approximately 50 kilometers wide.
This image covers much of Ovda Regio, which forms the western part of Aphrodite Terra. It covers an area about 2,250 kilometers (1,386 miles) wide by 1,300 kilometers (800 miles) north to south, and ranges in latitude from 8 degrees north to 12 degrees south and in longitude from 62 degrees east to 90 degrees east. Ovda Regio is a highland region that rises over 4 kilometers (2.5 miles) above the surrounding plain. Magellan images show a complex surface, with several generations of structures. A pervasive fabric of irregular broad domes and ridges and associated curvilinear valleys was flooded by lava, then fractured. The circular feature surrounded by dark lava flows in the western part of the image is a caldera, or large volcanic collapse pit. Late-stage extension created long graben, or fault-bounded valleys, is best seen near the center of the image. The northern boundary of Ovda Regio is a steep, curvilinear mountain belt made up of long, narrow, rounded ridges. These ridges are similar in appearance to folded mountain belts on Earth. Several impact craters, such as the circular features on the western margin of the image, are scattered across the area. The bright area in the southeast part of the image indicates the presence of a radar-reflective mineral such as pyrite. Most of the highland areas on Venus display a similar bright signal. Each pixel of this image covers an area on the surface 675 meters (2,215 feet) across, representing a 9- times reduction in resolution compared to full-scale resolution data. http://photojournal.jpl.nasa.gov/catalog/PIA00146
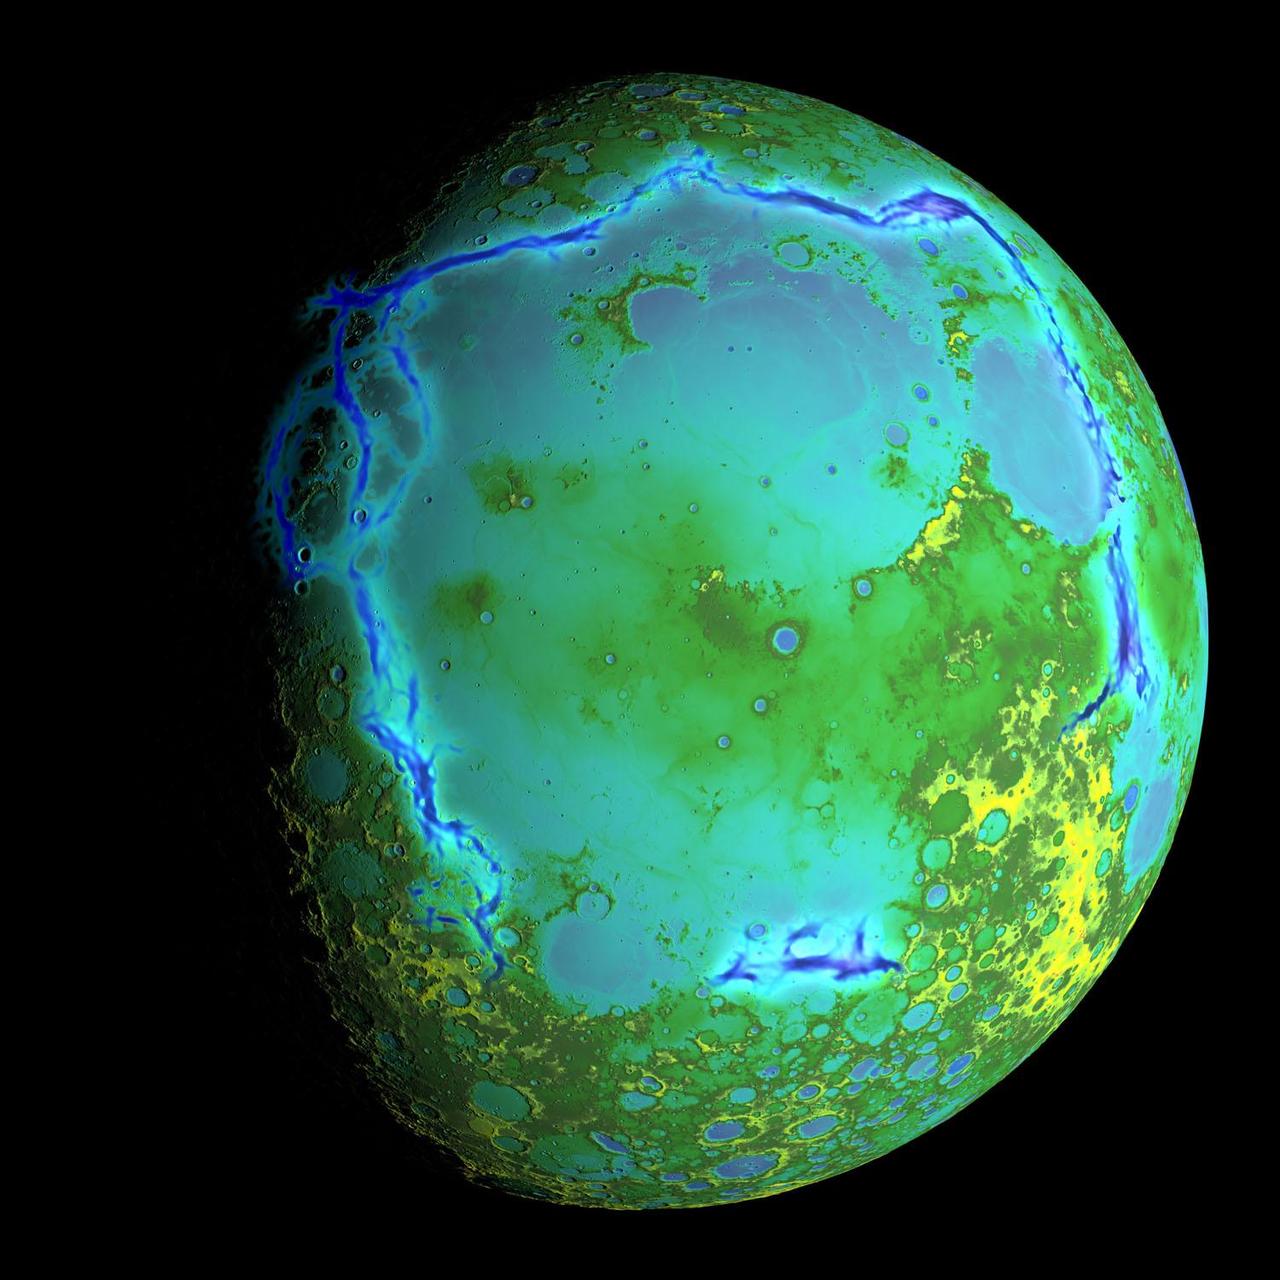
Topography of Earth's moon generated from data collected by the Lunar Orbiter Laser Altimeter, aboard NASA's Lunar Reconnaissance Orbiter, with the gravity anomalies bordering the Procellarum region superimposed in blue. The border structures are shown using gravity gradients calculated with data from NASA's Gravity Recovery and Interior Laboratory (GRAIL) mission. These gravity anomalies are interpreted as ancient lava-flooded rift zones buried beneath the volcanic plains (or maria) on the nearside of the Moon. Launched as GRAIL A and GRAIL B in September 2011, the probes, renamed Ebb and Flow, operated in a nearly circular orbit near the poles of the moon at an altitude of about 34 miles (55 kilometers) until their mission ended in December 2012. The distance between the twin probes changed slightly as they flew over areas of greater and lesser gravity caused by visible features, such as mountains and craters, and by masses hidden beneath the lunar surface. The twin spacecraft flew in a nearly circular orbit until the end of the mission on Dec. 17, 2012, when the probes intentionally were sent into the moon's surface. NASA later named the impact site in honor of late astronaut Sally K. Ride, who was America's first woman in space and a member of the GRAIL mission team. GRAIL's prime and extended science missions generated the highest-resolution gravity field map of any celestial body. The map will provide a better understanding of how Earth and other rocky planets in the solar system formed and evolved. The GRAIL mission was managed by NASA's Jet Propulsion Laboratory (JPL) in Pasadena, California, for NASA's Science Mission Directorate in Washington. The mission was part of the Discovery Program managed at NASA's Marshall Space Flight Center in Huntsville, Alabama. GRAIL was built by Lockheed Martin Space Systems in Denver. For more information about GRAIL, please visit <a href="http://grail.nasa.gov" rel="nofollow">grail.nasa.gov</a>. Credit: NASA/Colorado School of Mines/MIT/GSFC/Scientific Visualization Studio
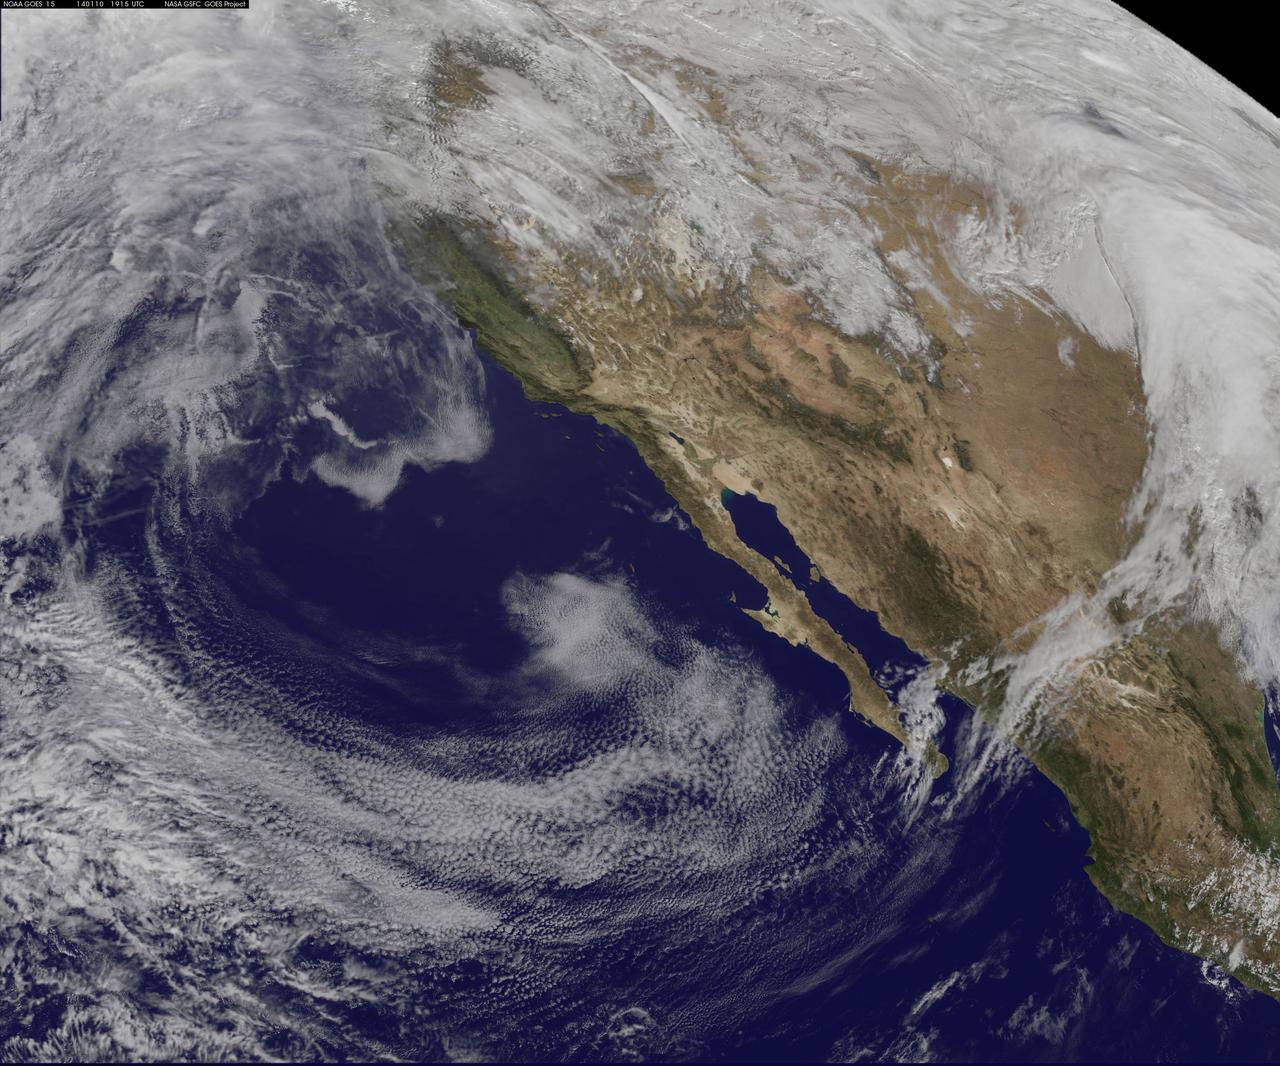
This NOAA GOES-west satellite image shows high pressure over the 4 corners region (Utah, Colorado, northern Arizona and northwestern New Mexico), and the National Weather Service has forecast snow north of the high in the Wasatch range and adjacent valleys. Toward the top of the GOES image, there's a strong Pacific storm moving onshore that NWS expects will bring high winds, heavy rains, and feet of snow to the northwestern U.S. There's a flood watch in effect for portions of western Washington State through Saturday night (January 11), that includes the counties of King, Mason, Pierce, and Snohomish. That storm will bring more snow to the Wasatch range that's getting snow today. Meanwhile, on the far right side of the image, there's a surface low pressure area moving through the Central Plains and middle Mississippi Valley today, Jan. 10, 2014. The image was created by the NASA-NOAA GOES Project at NASA's Goddard Space Flight Center, Greenbelt, Md. <b><a href="http://goes.gsfc.nasa.gov/" rel="nofollow">Credit: NOAA/NASA GOES Project</a></b> <b><a href="http://www.nasa.gov/audience/formedia/features/MP_Photo_Guidelines.html" rel="nofollow">NASA image use policy.</a></b> <b><a href="http://www.nasa.gov/centers/goddard/home/index.html" rel="nofollow">NASA Goddard Space Flight Center</a></b> enables NASA’s mission through four scientific endeavors: Earth Science, Heliophysics, Solar System Exploration, and Astrophysics. Goddard plays a leading role in NASA’s accomplishments by contributing compelling scientific knowledge to advance the Agency’s mission. <b>Follow us on <a href="http://twitter.com/NASA_GoddardPix" rel="nofollow">Twitter</a></b> <b>Like us on <a href="http://www.facebook.com/pages/Greenbelt-MD/NASA-Goddard/395013845897?ref=tsd" rel="nofollow">Facebook</a></b> <b>Find us on <a href="http://instagram.com/nasagoddard?vm=grid" rel="nofollow">Instagram</a></b>
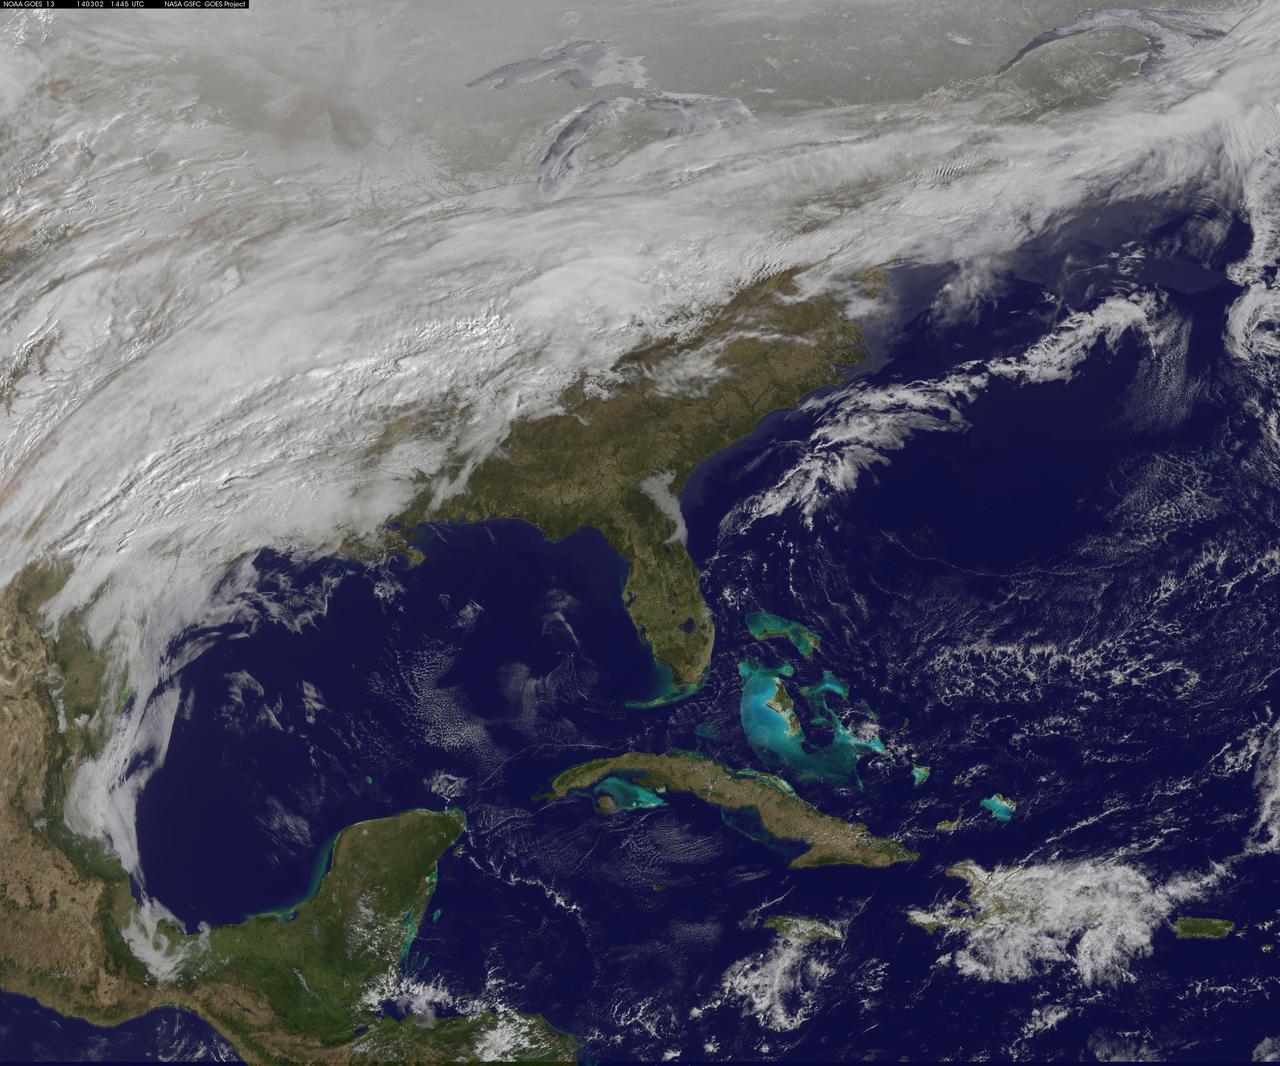
A major winter storm is poised to wallop the Mid-Atlantic and bring large amounts of snow to cities including Baltimore, Md., Washington, D.C. area on March 2 and 3, according to NOAA's National Weather Service. NOAA's GOES-East satellite captured this image of the clouds associated with the winter storm as it continued moving east toward those cities. On March 2, the National Weather Prediction Center in College Park, Md. noted that there is a slight risk for severe thunderstorms over parts of the western Gulf Coast and the Lower Mississippi Valley as a result of the southern portion of the system. The update at 7 a.m. EST noted that freezing rain/sleet is possible over parts of the lower Mississippi Valley and parts of the central Appalachians, while eastern Texas and the lower Mississippi Valley into the Ohio Valley are expected to experience heavy rain. The NWS Short Range Forecast Discussion stated "A strong storm over the Southern Plains/Lower Mississippi Valley will advance northeastward along a quasi-stationary front to off the Southern Mid-Atlantic Coast by Monday evening. Moisture from the Gulf of Mexico will overrun and pool along the associated front producing an area of snow extending from the Central Plains into the Northeast." The clouds are associated with a cold from that stretches from eastern Maine through Maryland and west into the Tennessee Valley. The low pressure center associated with the front was located over Arkansas. At NASA/NOAA's GOES Project at NASA's Goddard Space Flight Center in Greenbelt, Md. the cloud data from NOAA's GOES-East satellite were overlaid on a true-color image of land and ocean created by data from the Moderate Resolution Imaging Spectroradiometer or MODIS instrument that flies aboard NASA's Aqua and Terra satellites. Together, those data created the entire picture of the position of this major winter storm. GOES satellites provide the kind of continuous monitoring necessary for intensive data analysis. Geostationary describes an orbit in which a satellite is always in the same position with respect to the rotating Earth. This allows GOES to hover continuously over one position on Earth's surface, appearing stationary. As a result, GOES provide a constant vigil for the atmospheric "triggers" for severe weather conditions such as tornadoes, flash floods, hail storms and hurricanes. For updated information about the storm system, visit NOAA's NWS website: <a href="http://www.weather.gov" rel="nofollow">www.weather.gov</a> For more information about GOES satellites, visit: <a href="http://www.goes.noaa.gov/" rel="nofollow">www.goes.noaa.gov/</a> or <a href="http://goes.gsfc.nasa.gov/" rel="nofollow">goes.gsfc.nasa.gov/</a> Rob Gutro NASA Goddard Space Flight Center, Greenbelt, Md. <b><a href="http://www.nasa.gov/audience/formedia/features/MP_Photo_Guidelines.html" rel="nofollow">NASA image use policy.</a></b> <b><a href="http://www.nasa.gov/centers/goddard/home/index.html" rel="nofollow">NASA Goddard Space Flight Center</a></b> enables NASA’s mission through four scientific endeavors: Earth Science, Heliophysics, Solar System Exploration, and Astrophysics. Goddard plays a leading role in NASA’s accomplishments by contributing compelling scientific knowledge to advance the Agency’s mission. <b>Follow us on <a href="http://twitter.com/NASAGoddardPix" rel="nofollow">Twitter</a></b> <b>Like us on <a href="http://www.facebook.com/pages/Greenbelt-MD/NASA-Goddard/395013845897?ref=tsd" rel="nofollow">Facebook</a></b> <b>Find us on <a href="http://instagram.com/nasagoddard?vm=grid" rel="nofollow">Instagram</a></b>
The Mars Global Surveyor (MGS) Mars Orbiter Camera (MOC) was designed specifically to provide images of Mars that have a resolution comparable to the aerial photographs commonly used by Earth scientists to study geological processes and map landforms on our home planet. When MGS reaches its Mapping Orbit in March 1999, MOC will be able to obtain pictures with spatial resolutions of 1.5 meters (5 feet) per pixel--this good enough to easily see objects the size of an automobile. Boulders are one of the keys to determining which processes have eroded, transported, and deposited material on Mars (e.g.,landslides, mud flows, flood debris). During the first year in orbit,MGS MOC obtained pictures with resolutions between 2 and 30 meters (7to 98 feet) per pixel. It was found that boulders are difficult to identify on Mars in images with resolutions worse than about 2-3 meters per pixel. Although not known when the MOC was designed,"thresholds" like this are found on Earth, too. The MOC's 1.5 m/pixel resolution was a compromise between (1) the anticipation of such resolution-dependent sensitivity based on our experience with Earth and (2)the cost in terms of mass if we had built a larger telescope to get a higher resolution. Some rather larger boulders (i.e., larger than about 10 meters--or yards--in size) have already been seen on Mars by the orbiting camera. This is a feat similar to that which can be obtained by "spy" satellites on Earth. The MOC image 53104 subframe shown above features a low, rounded hill in southeastern Utopia Planitia. Each of the small, lumpy features on the top of this hill is a boulder. In this picture, boulders are not seen on the surrounding plain. These boulders are interpreted to be the remnants of a layer of harder rock that once covered the top of the hill, but was subsequently eroded and broken up by weathering and wind processes. MOC image 53104 was taken on September 2, 1998. The subframe shows an area 2.2 km by 3.3 km (1.4 miles by 2.7 miles). The image has a resolution of about 3.25 meters (10.7 feet) per pixel. The subframe is centered at 41.0°N latitude and 207.3°W longitude. North is approximately up, illumination is from the left. http://photojournal.jpl.nasa.gov/catalog/PIA01500
STS059-S-026 (11 April 1994) --- This is an image of Death Valley, California, centered at 36.629 degrees north latitude, 117.069 degrees west longitude. The image shows Furnace Creek alluvial fan and Furnace Creek Ranch at the far right, and the sand dunes near Stove Pipe Wells at the center. The dark fork-shaped feature between Furnace Creek fan and the dunes is a smooth flood-plain which encloses Cottonball Basin. The SIR-C/X-SAR supersite is an area of extensive field investigations and has been visited by both Space Radar Lab astronaut crews. Elevations in the Valley range from 70 meters below sea level, the lowest in the United States, to more than 3300 meters above sea level. Scientists are using SIR-C/X-SAR data from Death Valley to help answer a number of different questions about the Earth's geology. One question concerns how alluvial fans are formed and change through time under the influence of climatic changes and earthquakes. Alluvial fans are gravel deposits that wash down from the mountains over time. They are visible in the image as circular, fan-shaped bright areas extending into the darker valley floor from the mountains. Information about the alluvial fans help scientists study Earth's ancient climate. Scientists know the fans are bulit up through climatic and tectonic processes and they will use the SIR-C/X-SAR data to understand the nature and rates of weathering processes on the fans, soil formation, and the transport of sand and dust by the wind. SIR-C/X-SAR's sensitivity to centimeter-scale (or inch-scale) roughness provides detailed maps of surface texture. Such information can be used to study the occurrence and movement of dust storms and sand dunes. the goal of these studies is to gain a better understanding of the record of past climatic changes and the effects of those changes on a sensitive environment. This may lead to a better ability to predict future response of the land to different potential global cimate-change scenarios. Death Valley is also one of the primary calibration sites for SIR-C/X-SAR. The bright dots near the center of the image are corner reflectors that have been set-up to calibrate the radar as the Shuttle passes overhead. Thirty triangular-shaped reflectors (they look like aluminum pyramids) have been deployed by the calibration team from JPL over a 40 kilometer by 40 kilometer area in and around Death Valley. The calibration team will also deploy transponders (electronic reflectors) and recievers to measure the radar signals from SIR-C/X-SAR on the ground. Spaceborne Imaging Radar-C and X-Synthetic Aperture Radar (SIR-C/X-SAR) is part of NASA's Mission to Planet Earth (MTPE). The radars illuminate Earth with microwaves allowing detailed observations at any time, regardless of weather or sunlight conditions. SIR-C/X-SAR uses three microwave wavelengths: L-Band (24 cm), C-Band (6 cm), and X-Band (3 cm). The multi-frequency data will be used by the international scientific community to better understand the global environment and how it is changing. The SIR-C/X-SAR data, complemented by aircraft and ground studies, will give scientists clearer insights into those environmental changes which are caused by nature and those changes which are induced by human activity. SIR-C was develpoed by NASA's Jet Propulsion Laboratory (JPL). X-SAR was developed by the Dornire and Alenia Spazio Companies for the German Space Agency, Deutsche Agentur fuer Raumfahrtangelegenheiten (DARA), and the Italian Space Agency, Agenzia Spaziale Italiana (ASI). JPL Photo ID: P-43883
This NOAA's GOES satellite infrared image taken on Nov. 25 at 11:45 UTC (6:45 a.m. EST) shows two main weather systems over the U.S. Credit: NASA/NOAA GOES Project As the U.S. Thanksgiving holiday approaches this Thursday, November 27, NOAA's GOES-East and GOES-West satellites are keeping a weather eye out for storms that may affect early travelers. In an image from Nov. 25, the satellites show an active weather pattern is in place for travelers across the central and eastern U.S. NOAA's GOES-East satellite provides visible and infrared images over the eastern U.S. and the Atlantic Ocean, while NOAA's GOES-West satellite covers the western U.S. and Pacific Ocean from its fixed orbit in space. Data from both satellites were combined at NASA's GOES Project to create a full view of the U.S. on Nov. 25 at 11:45 UTC (6:45 a.m. EST). The image shows clouds associated with cold front stretching from the Gulf of Mexico over northern Florida and along the U.S. East coast to eastern Canada. Clouds associated with another area of low pressure are in the northern Rockies and northwestern U.S. To create the image, NASA/NOAA's GOES Project takes the cloud data from NOAA's GOES-East satellite and overlays it on a true-color image of land and ocean created by data from the Moderate Resolution Imaging Spectroradiometer, or MODIS, instrument that flies aboard NASA's Aqua and Terra satellites. Together, those data created the entire picture of the storm and show its movement. After the storm system passes, the snow on the ground becomes visible. NOAA's National Weather Service Weather Prediction Center said "a storm system will develop off the coast of the Carolinas early Wednesday (Nov. 25) and strengthen as it moves rapidly up the East Coast Wednesday into early Thursday (Nov. 26). Heavy snow is likely to begin in the central Appalachians early Wednesday morning, spreading northeast through the interior Mid-Atlantic into New England by Wednesday night. Winter Storm Watches are in effect for these areas." For travelers in the western U.S., the Northern Rocky Mountains are expected to receive more snow from the north side of a stationary frontal boundary. South of the boundary rain showers will affect the lower valley. The National Weather Service calls for cold weather to continue in the northern Plains and Upper Midwest as a Canadian surface high pressure rules the weather. The U.S. Southwest will experience nice weather for mid-week. In the Pacific Northwest, the National Weather Service noted that a warm front will bring rain, heavy at times, to the Cascades today and tonight. There will be a break in the heavier rains on Wednesday, then another period of heavy rain for the Cascades Wednesday night through Friday morning as a cold front slowly drags through the area. NOAA's GOES satellites provide the kind of continuous monitoring necessary for intensive data analysis. Geostationary describes an orbit in which a satellite is always in the same position with respect to the rotating Earth. This allows GOES to hover continuously over one position on Earth's surface, appearing stationary. As a result, GOES provide a constant vigil for the atmospheric triggers for severe weather conditions such as tornadoes, flash floods, hail storms and hurricanes.

NOAA's GOES-East satellite provided a look at the frigid eastern two-thirds of the U.S. on Jan. 7, 2015, that shows a blanket of northern snow, lake-effect snow from the Great Lakes and clouds behind the Arctic cold front. A visible picture captured at 1600 UTC (11 a.m. EST) showed the effects of the latest Arctic outbreak. The cold front that brought the Arctic air has moved as far south as Florida, and stretches back over the Gulf of Mexico and just west of Texas today. The image shows clouds behind the frontal boundary stretching from the Carolinas west over the Heartland. Farther north, a wide band of fallen snow covers the ground from New England west to Montana, with rivers appearing like veins. The GOES-East satellite image also shows wind-whipped lake-effect snows off the Great Lakes, blowing to the southeast. Meanwhile, Florida, the nation's warm spot appeared almost cloud-free. To create the image, NASA/NOAA's GOES Project used cloud data from NOAA's GOES-East satellite and overlaid it on a true-color image of land and ocean created by data from the Moderate Resolution Imaging Spectroradiometer, or MODIS, instrument that flies aboard NASA's Aqua and Terra satellites. Together, those data created the entire picture of the Arctic outbreak. The forecast from NOAA's National Weather Service Weather Prediction Center (WPC) calls for more snow along the Appalachian Mountains from Tennessee north to upstate New York. Snow is also expected to fall from New England west to Montana, and in eastern New Mexico and the Colorado Rockies. The WPC summary for Jan. 7 noted: Bitter cold will be felt from the western High Plains to the Mid-Atlantic and Northeast U.S. for the next few days. Widespread subzero overnight lows are forecast for the Dakotas, Upper Midwest, Great Lakes, and interior New England. Wind Chill Advisories and Warnings are in effect for many of these areas. GOES-East provides visible and infrared images over the eastern U.S. and the Atlantic Ocean from its fixed orbit in space. NOAA's GOES satellites provide the kind of continuous monitoring necessary for intensive data analysis. Geostationary describes an orbit in which a satellite is always in the same position with respect to the rotating Earth. This allows GOES to hover continuously over one position on Earth's surface, appearing stationary. As a result, GOES provide a constant vigil for the atmospheric triggers for severe weather conditions such as tornadoes, flash floods, hail storms and hurricanes. For updated information about the storm system, visit NOAA's NWS website: <a href="http://www.weather.gov" rel="nofollow">www.weather.gov</a> For more information about GOES satellites, visit: <a href="http://www.goes.noaa.gov/" rel="nofollow">www.goes.noaa.gov/</a> or goes.gsfc.nasa.gov/ Rob Gutro NASA's Goddard Space Flight Center, Greenbelt, Md. <b><a href="http://www.nasa.gov/audience/formedia/features/MP_Photo_Guidelines.html" rel="nofollow">NASA image use policy.</a></b> <b><a href="http://www.nasa.gov/centers/goddard/home/index.html" rel="nofollow">NASA Goddard Space Flight Center</a></b> enables NASA’s mission through four scientific endeavors: Earth Science, Heliophysics, Solar System Exploration, and Astrophysics. Goddard plays a leading role in NASA’s accomplishments by contributing compelling scientific knowledge to advance the Agency’s mission. <b>Follow us on <a href="http://twitter.com/NASAGoddardPix" rel="nofollow">Twitter</a></b> <b>Like us on <a href="http://www.facebook.com/pages/Greenbelt-MD/NASA-Goddard/395013845897?ref=tsd" rel="nofollow">Facebook</a></b> <b>Find us on <a href="http://instagram.com/nasagoddard?vm=grid" rel="nofollow">Instagram</a></b>
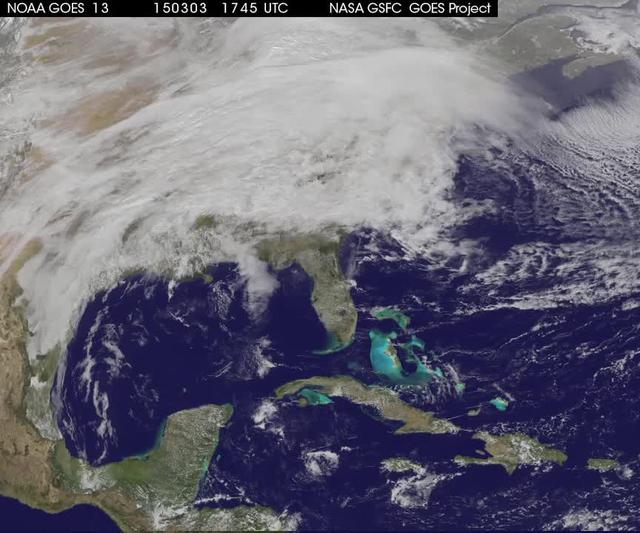
A winter storm was bringing snow, sleet and freezing rain from lower Mississippi Valley to Northeastern U.S. on Thursday, March 5, 2015. A new NASA animation of NOAA's GOES-East satellite imagery showed the progression of the clouds associated with the storm system that triggered winter storm warnings and winter weather advisories from the southern Plains eastward through the Mid-Atlantic and southern New England coast. The system also triggered flood warnings along and to the west of the central Appalachians. An animation of GOES satellite visible and infrared imagery from March 3 through March 5 showed clouds associated with a cold front push over U.S. East coast. Behind the front, Arctic air is expected to drop low temperatures into the single numbers from Washington, D.C. to Minnesota overnight. Temperatures in the Carolinas and Tennessee are expected to drop to the low 20s. NOAA's National Weather Service Weather Prediction Center (NWS NPC) in College Park, Maryland noted "a strong cold front moving across the eastern U.S. will bring heavy snow from parts of the Ohio Valley to the Northeast today (March 5) with rain, freezing rain and sleet possible from parts of the lower Mississippi Valley across the Southeast to the southern Mid-Atlantic. Snowfall totals of 5 to 10 inches are possible for some areas. Winter Storm Warnings remain in effect from Texas to Nantucket." The animation ends at 17:45 UTC (12:45 p.m. EST). Before the end of the animation, the low pressure center along an arctic frontal boundary was nearly stationary over western North Carolina at 9 a.m. EST on March 5, according to the NWS NPC. NWS radar and surface observations indicated an extended swath of precipitation from near the Texas Gulf Coast through the interior eastern U.S. into southern New England. NPC's storm summary noted at that time "rain was changing to sleet/freezing rain and to all snow along a band within this swath as colder air continues to filter in from the north. Some areas in Tennessee, the northern mid-Atlantic and southern New England were reporting moderate to heavy snow." To create the video and imagery, NASA/NOAA's GOES Project takes the cloud data from NOAA's GOES-East satellite and overlays it on a true-color image of land and ocean created by data from the Moderate Resolution Imaging Spectroradiometer, or MODIS, instrument that flies aboard NASA's Aqua and Terra satellites. Together, those data created the entire picture of the storm and show its movement. After the storm system passes, the snow on the ground becomes visible. GOES satellites provide the kind of continuous monitoring necessary for intensive data analysis. Geostationary describes an orbit in which a satellite is always in the same position with respect to the rotating Earth. This allows GOES to hover continuously over one position on Earth's surface, appearing stationary. For updated information about the storm system, visit NOAA's NWS website: <a href="http://www.weather.gov" rel="nofollow">www.weather.gov</a> For more information about GOES satellites, visit: <a href="http://www.goes.noaa.gov/" rel="nofollow">www.goes.noaa.gov/</a> or goes.gsfc.nasa.gov/ Rob Gutro NASA's Goddard Space Flight Center <b><a href="http://www.nasa.gov/audience/formedia/features/MP_Photo_Guidelines.html" rel="nofollow">NASA image use policy.</a></b> <b><a href="http://www.nasa.gov/centers/goddard/home/index.html" rel="nofollow">NASA Goddard Space Flight Center</a></b> enables NASA’s mission through four scientific endeavors: Earth Science, Heliophysics, Solar System Exploration, and Astrophysics. Goddard plays a leading role in NASA’s accomplishments by contributing compelling scientific knowledge to advance the Agency’s mission. <b>Follow us on <a href="http://twitter.com/NASAGoddardPix" rel="nofollow">Twitter</a></b> <b>Like us on <a href="http://www.facebook.com/pages/Greenbelt-MD/NASA-Goddard/395013845897?ref=tsd" rel="nofollow">Facebook</a></b> <b>Find us on <a href="http://instagrid.me/nasagoddard/?vm=grid" rel="nofollow">Instagram</a></b>