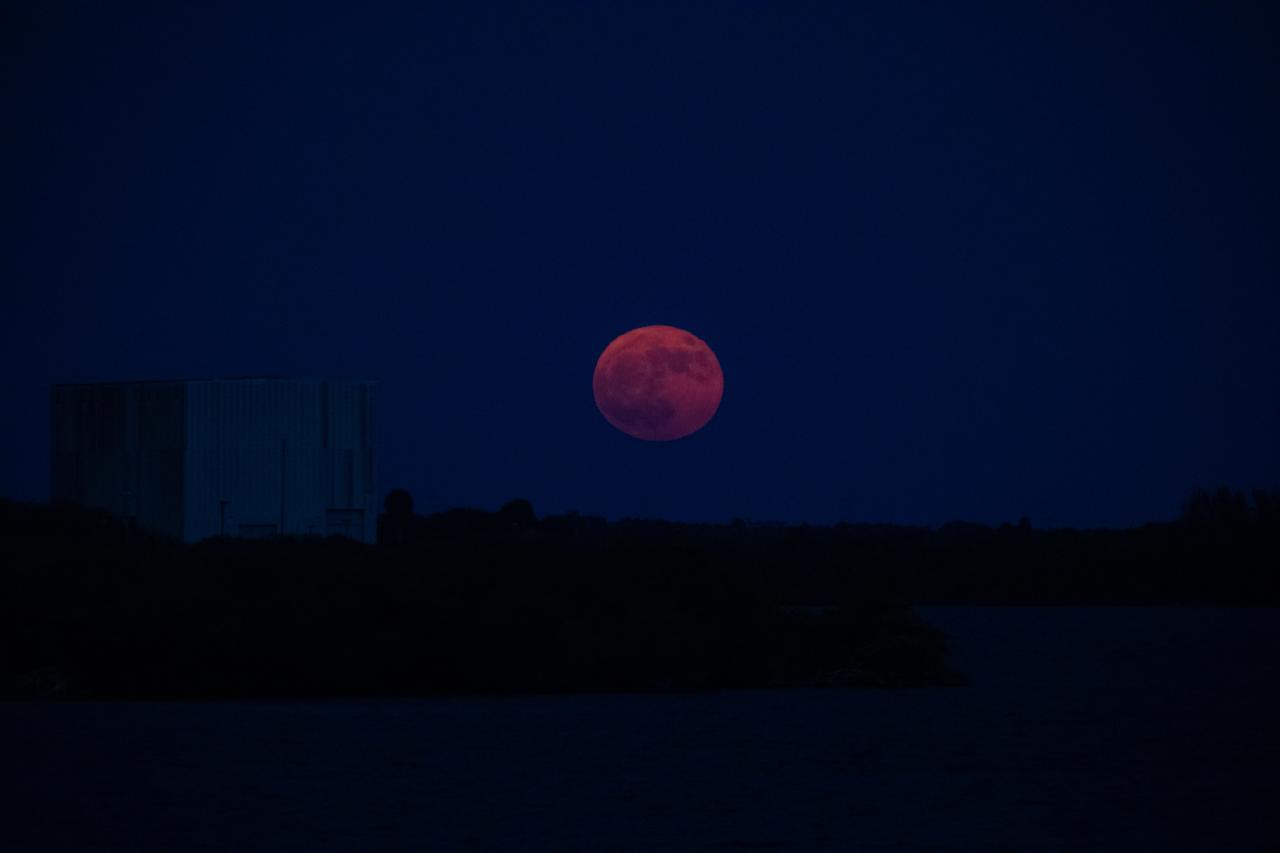
A super blue Moon rises above Kennedy Space Center in Florida on Monday, Aug. 18, 2024. Although not actually appearing blue, as the third full Moon in a season with four full Moons, this is called a “blue” Moon. The Moon at or near its closest point to Earth is a “super” Moon and can appear up to 14% bigger and brighter than normal full Moons. About 25% of all full Moons are super, but only 3% of full Moons are blue, with the next super blue Moons occurring as a pair in January and March 2037.

A super blue Moon rises above Kennedy Space Center in Florida on Monday, Aug. 18, 2024. Although not actually appearing blue, as the third full Moon in a season with four full Moons, this is called a “blue” Moon. The Moon at or near its closest point to Earth is a “super” Moon and can appear up to 14% bigger and brighter than normal full Moons. About 25% of all full Moons are super, but only 3% of full Moons are blue, with the next super blue Moons occurring as a pair in January and March 2037.
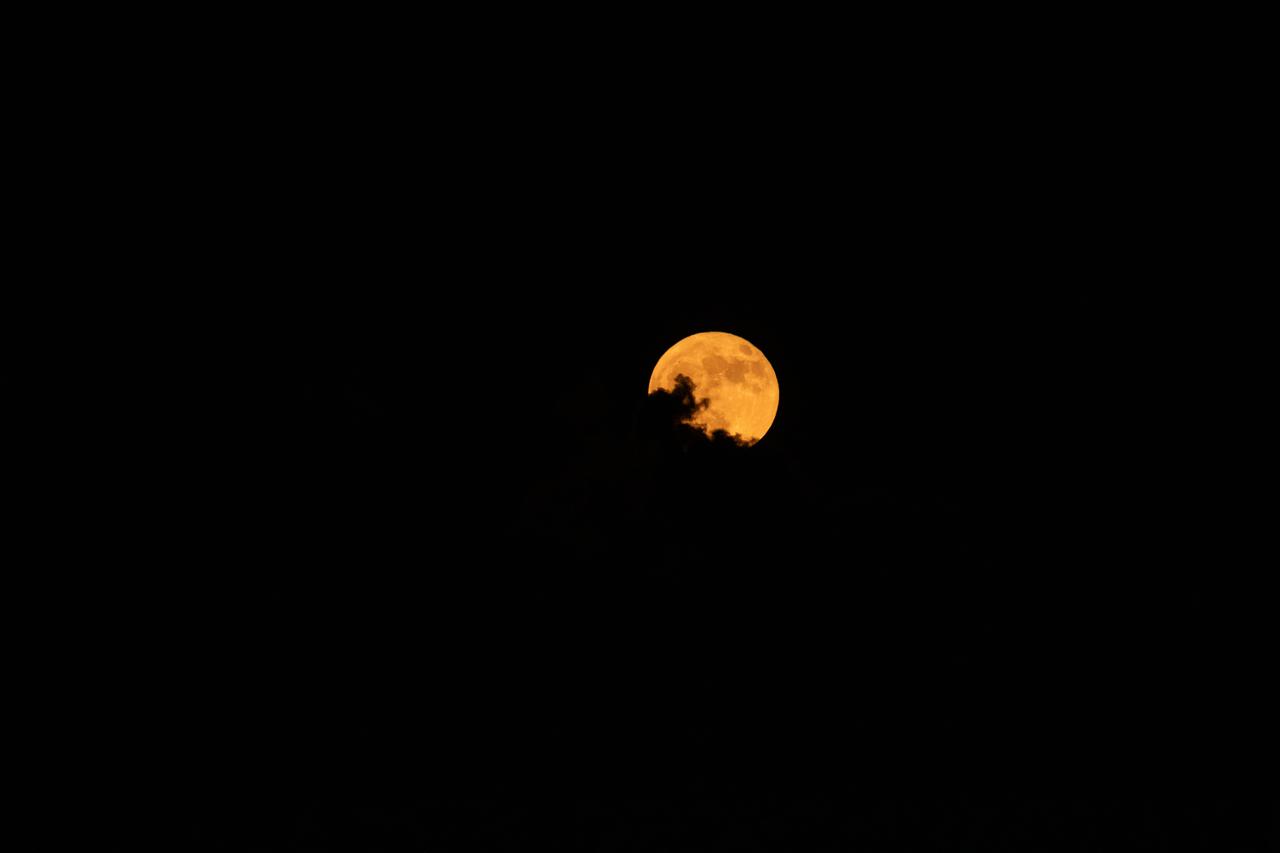
A super blue Moon rises above Kennedy Space Center in Florida on Monday, Aug. 18, 2024. Although not actually appearing blue, as the third full Moon in a season with four full Moons, this is called a “blue” Moon. The Moon at or near its closest point to Earth is a “super” Moon and can appear up to 14% bigger and brighter than normal full Moons. About 25% of all full Moons are super, but only 3% of full Moons are blue, with the next super blue Moons occurring as a pair in January and March 2037.
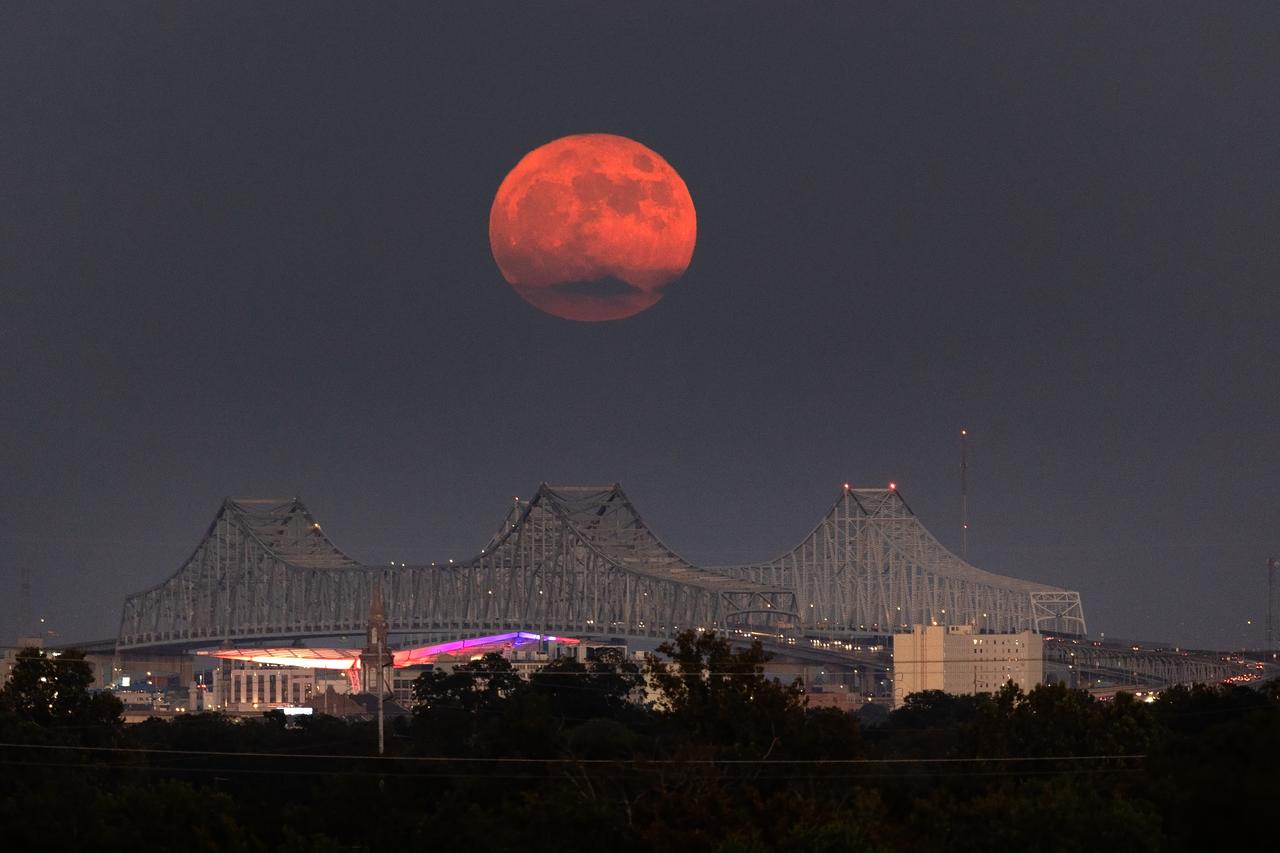
A Super Blue Moon rises above the Mississippi River and the Crescent City Connection Bridge in New Orleans, Aug. 30. The full moon is “super” because it’s slightly closer to Earth and “blue” because it’s the second full moon in a month. About 25% of all full moons are supermoons, but only 3% of full moons are blue moons. The next super blue moons will occur in a pair in January and March 2037. New Orleans is home to NASA’s Michoud Assembly Facility, where stages for NASA’s SLS (Space Launch System) rocket and structures for Orion spacecraft are produced for the Artemis missions.

A supermoon rises over Huntsville, Alabama, home to NASA’s Marshall Space Flight Center, Aug. 19. Visible through Wednesday, Aug. 21, the full Moon is both a supermoon and a Blue Moon. Supermoons are the biggest and brightest full Moons of the year because the Moon is within 90% of its closest point to Earth. While not blue in color, the third full Moon in a season with four full Moons is called a “Blue Moon.” Huntsville is known as the “Rocket City” because of its proximity to NASA Marshall, which manages vital propulsion systems and hardware, launch vehicles, engineering technologies, and cutting-edge science for the agency.

A supermoon rises over Huntsville, Alabama, home to NASA’s Marshall Space Flight Center, Aug. 19. Visible through Wednesday, Aug. 21, the full Moon is both a supermoon and a Blue Moon. Supermoons are the biggest and brightest full Moons of the year because the Moon is within 90% of its closest point to Earth. While not blue in color, the third full Moon in a season with four full Moons is called a “Blue Moon.” Huntsville is known as the “Rocket City” because of its proximity to NASA Marshall, which manages vital propulsion systems and hardware, launch vehicles, engineering technologies, and cutting-edge science for the agency.

A supermoon rises over Huntsville, Alabama, home to NASA’s Marshall Space Flight Center, Aug. 19. Visible through Wednesday, Aug. 21, the full Moon is both a supermoon and a Blue Moon. Supermoons are the biggest and brightest full Moons of the year because the Moon is within 90% of its closest point to Earth. While not blue in color, the third full Moon in a season with four full Moons is called a “Blue Moon.” Huntsville is known as the “Rocket City” because of its proximity to NASA Marshall, which manages vital propulsion systems and hardware, launch vehicles, engineering technologies, and cutting-edge science for the agency.

NASA Armstrong Flight Research Center photographer Lauren Hughes takes photos of the Super Blue Blood Moon eclipse from California’s Trona Pinnacles Desert National Conservation for the Jan. 31 of the total lunar eclipse that provided a rare opportunity to capture a supermoon, a blue moon and a lunar eclipse at the same time. A supermoon occurs when the Moon is closer to Earth in its orbit and appearing 14 percent brighter than usual. As the second full moon of the month, this moon is also commonly known as a blue moon, though it will not be blue in appearance. The super blue moon passed through Earth’s shadow and took on a reddish tint, known as a blood moon. This total lunar eclipse occurs when the Sun, Earth, and a full moon form a near-perfect lineup in space. The Moon passes directly behind the Earth into its umbra (shadow).
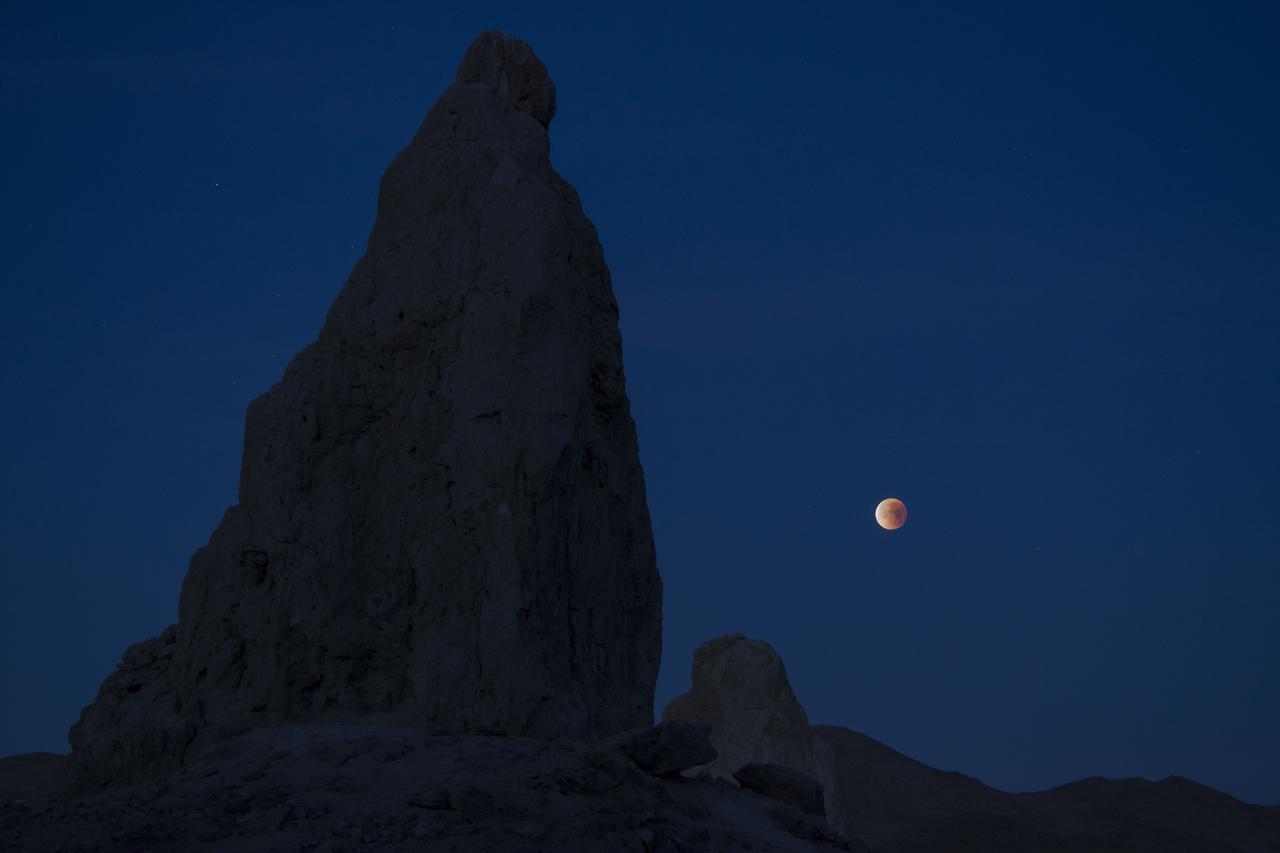
NASA Armstrong Flight Research Center photographer Lauren Hughes takes photos of the Super Blue Blood Moon eclipse from California's Trona Pinnacles Desert National Conservation for the Jan. 31 of the total lunar eclipse that provided a rare opportunity to capture a supermoon, a blue moon and a lunar eclipse at the same time. A supermoon occurs when the Moon is closer to Earth in its orbit and appearing 14 percent brighter than usual. As the second full moon of the month, this moon is also commonly known as a blue moon, though it will not be blue in appearance. The super blue moon passed through Earth's shadow and took on a reddish tint, known as a blood moon. This total lunar eclipse occurs when the Sun, Earth, and a full moon form a near-perfect lineup in space. The Moon passes directly behind the Earth into its umbra (shadow).
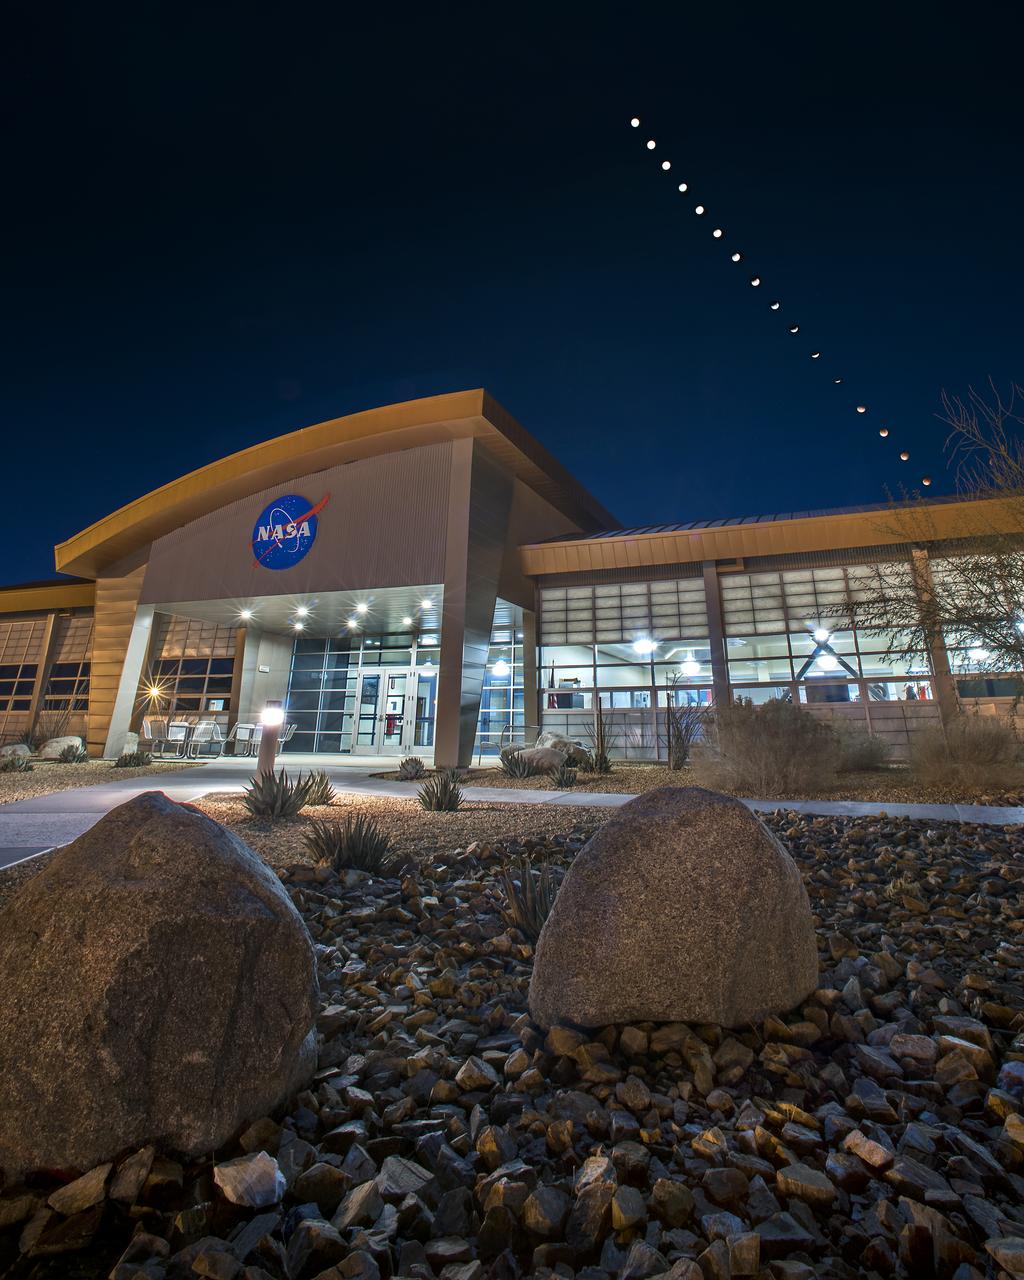
California’s NASA Armstrong Flight Research Center photographer Ken Ulbrich takes photos of Super Blue Blood Moon eclipse making a time-lapse composition of the event on January 31. The total lunar eclipse provided a rare opportunity to capture a supermoon, a blue moon and a lunar eclipse at the same time. A supermoon occurs when the Moon is closer to Earth in its orbit and appearing 14 percent brighter than usual. As the second full moon of the month, this moon is also commonly known as a blue moon, though it will not be blue in appearance. The super blue moon passed through Earth’s shadow and took on a reddish tint, known as a blood moon. This total lunar eclipse occurs when the Sun, Earth, and a full moon form a near-perfect lineup in space. The Moon passes directly behind the Earth into its umbra (shadow).
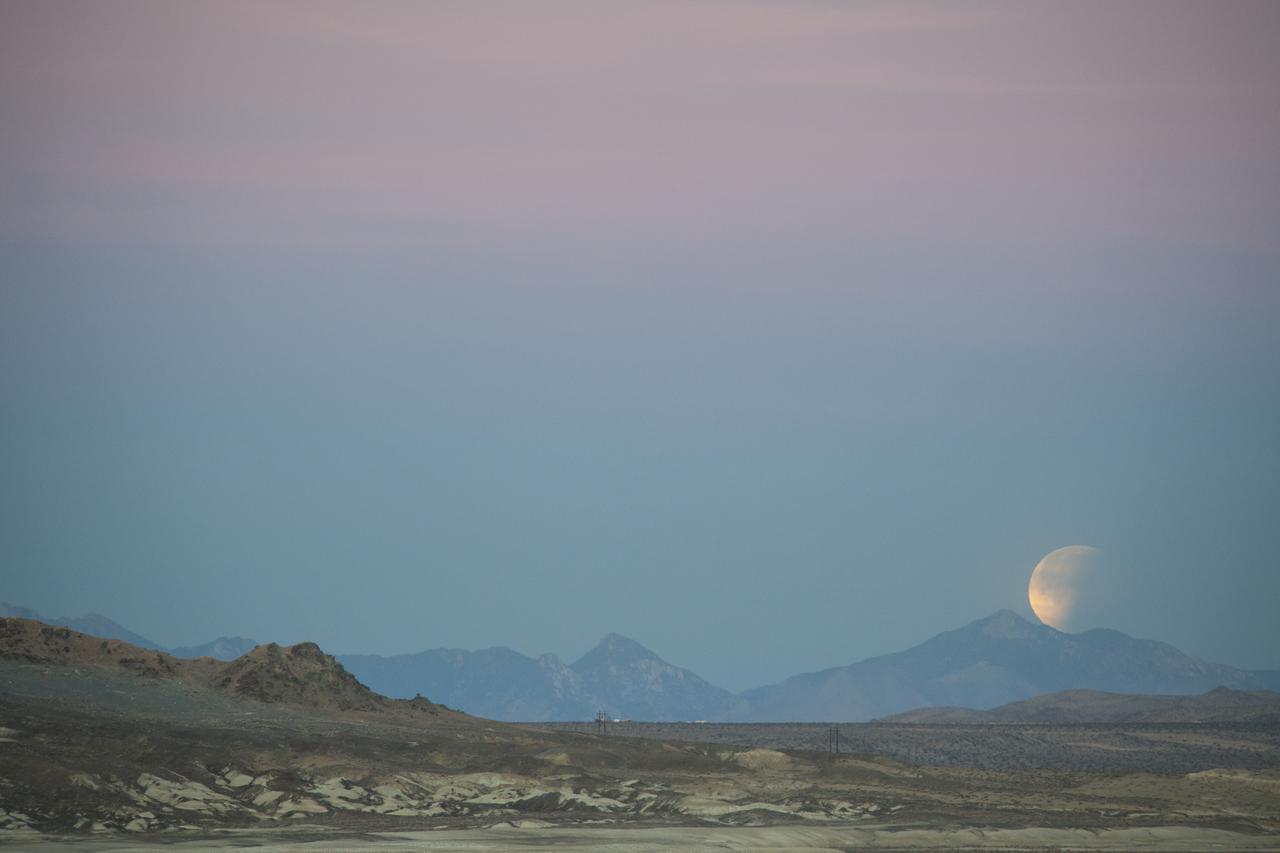
NASA Armstrong Flight Research Center photographer Lauren Hughes takes photos of the Super Blue Blood Moon eclipse from California’s Trona Pinnacles Desert National Conservation for the Jan. 31 of the total lunar eclipse that provided a rare opportunity to capture a supermoon, a blue moon and a lunar eclipse at the same time. A supermoon occurs when the Moon is closer to Earth in its orbit and appearing 14 percent brighter than usual. As the second full moon of the month, this moon is also commonly known as a blue moon, though it will not be blue in appearance. The super blue moon passed through Earth’s shadow and took on a reddish tint, known as a blood moon. This total lunar eclipse occurs when the Sun, Earth, and a full moon form a near-perfect lineup in space. The Moon passes directly behind the Earth into its umbra (shadow).
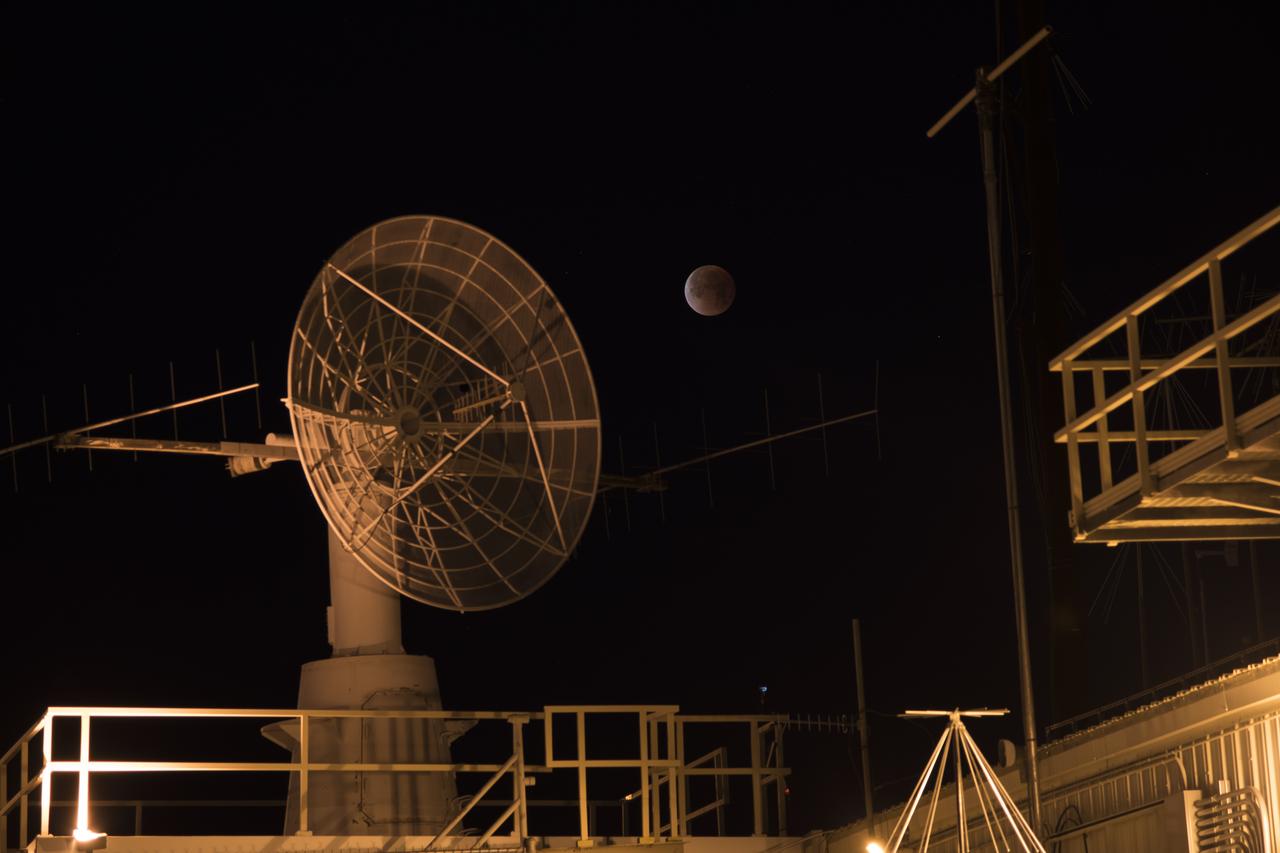
California’s NASA Armstrong Flight Research Center’s photographer Carla Thomas takes photos on January 31 of the rare opportunity to capture a supermoon, a blue moon and a lunar eclipse at the same time. A supermoon occurs when the Moon is closer to Earth in its orbit and appearing 14 percent brighter than usual. As the second full moon of the month, this moon is also commonly known as a blue moon, though it will not be blue in appearance. The super blue moon passed through Earth’s shadow and took on a reddish tint, known as a blood moon. This total lunar eclipse occurs when the Sun, Earth, and a full moon form a near-perfect lineup in space. The Moon passes directly behind the Earth into its umbra (shadow).

California's NASA Armstrong Flight Research Center photographer Carla Thomas takes photos on January 31 of the rare opportunity to capture a supermoon, a blue moon and a lunar eclipse at the same time. A supermoon occurs when the Moon is closer to Earth in its orbit and appearing 14 percent brighter than usual. As the second full moon of the month, this moon is also commonly known as a blue moon, though it will not be blue in appearance. The super blue moon will pass through Earth's shadow and take on a reddish tint, known as a blood moon. This total lunar eclipse occurs when the Sun, Earth, and a full moon form a near-perfect lineup in space. The Moon passes directly behind the Earth into its umbra (shadow).
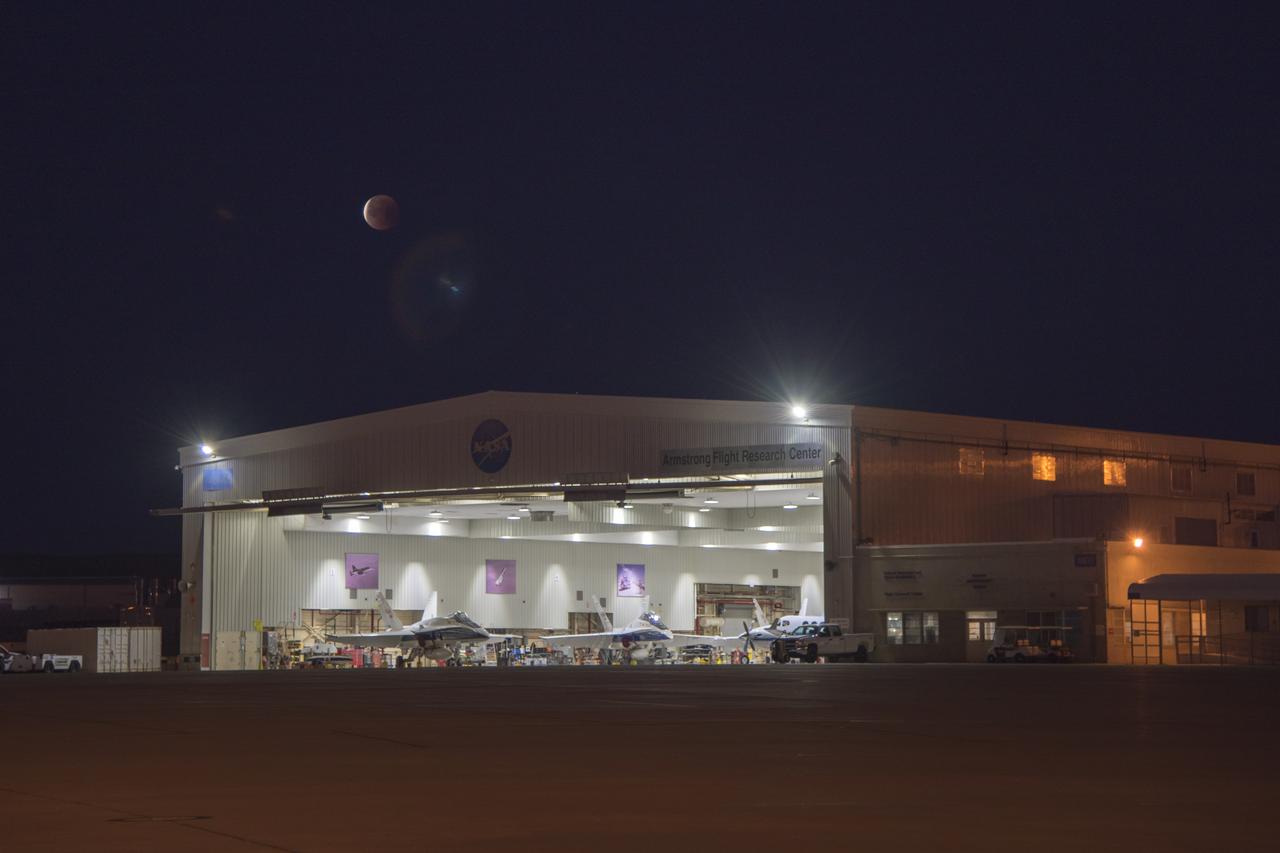
California's NASA Armstrong Flight Research Center photographer Carla Thomas takes photos on January 31 of the rare opportunity to capture a supermoon, a blue moon and a lunar eclipse at the same time. A supermoon occurs when the Moon is closer to Earth in its orbit and appearing 14 percent brighter than usual. As the second full moon of the month, this moon is also commonly known as a blue moon, though it will not be blue in appearance. The super blue moon passed through Earth's shadow and took on a reddish tint, known as a blood moon. This total lunar eclipse occurs when the Sun, Earth, and a full moon form a near-perfect lineup in space. The Moon passes directly behind the Earth into its umbra (shadow).
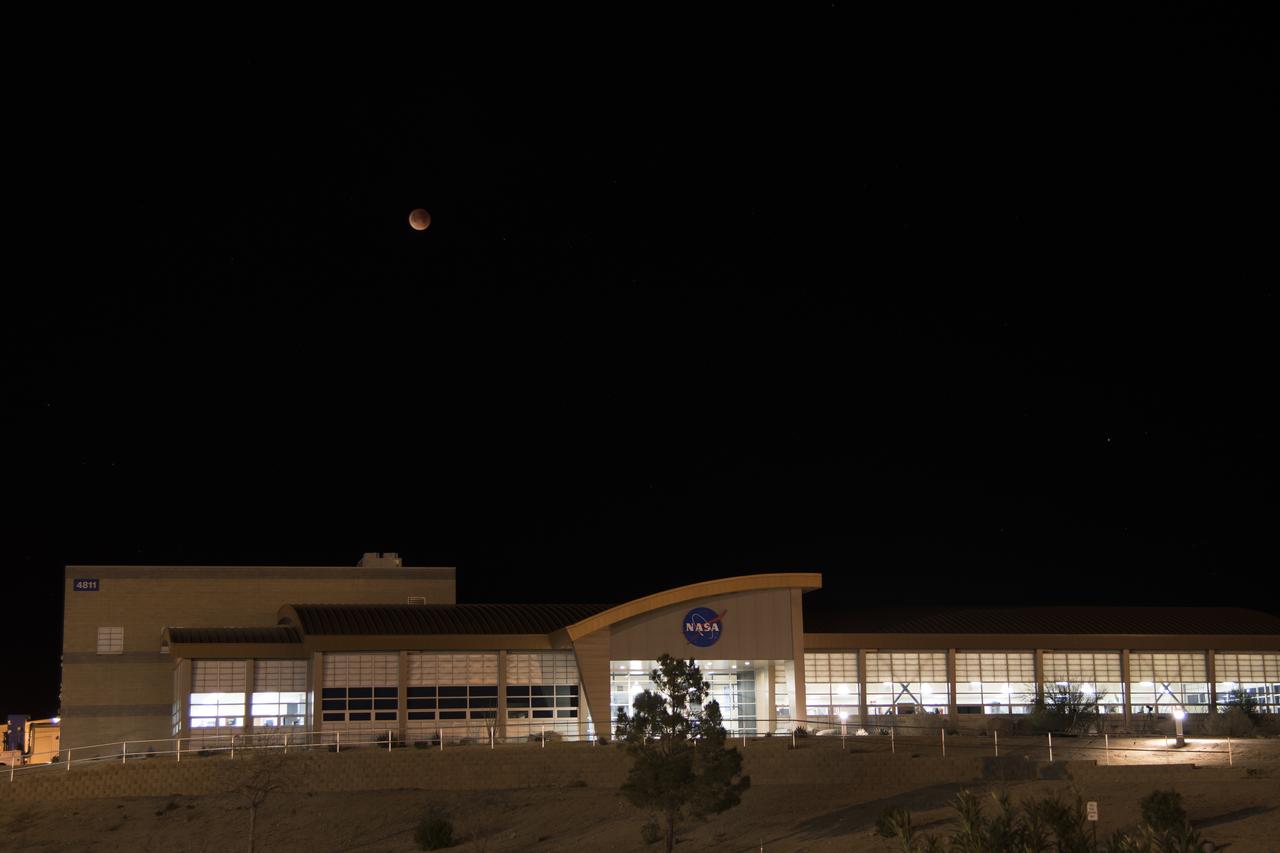
California's NASA Armstrong Flight Research Center photographer Carla Thomas takes photos on January 31 of the rare opportunity to capture a supermoon, a blue moon and a lunar eclipse at the same time. A supermoon occurs when the Moon is closer to Earth in its orbit and appearing 14 percent brighter than usual. As the second full moon of the month, this moon is also commonly known as a blue moon, though it will not be blue in appearance. The super blue moon passed through Earth's shadow and took on a reddish tint, known as a blood moon. This total lunar eclipse occurs when the Sun, Earth, and a full moon form a near-perfect lineup in space. The Moon passes directly behind the Earth into its umbra (shadow).

California's NASA Armstrong Flight Research Center photographer Carla Thomas takes photos on January 31 of the rare opportunity to capture a supermoon, a blue moon and a lunar eclipse at the same time. A supermoon occurs when the Moon is closer to Earth in its orbit and appearing 14 percent brighter than usual. As the second full moon of the month, this moon is also commonly known as a blue moon, though it will not be blue in appearance. The super blue moon passed through Earth's shadow and took on a reddish tint, known as a blood moon. This total lunar eclipse occurs when the Sun, Earth, and a full moon form a near-perfect lineup in space. The Moon passes directly behind the Earth into its umbra (shadow).
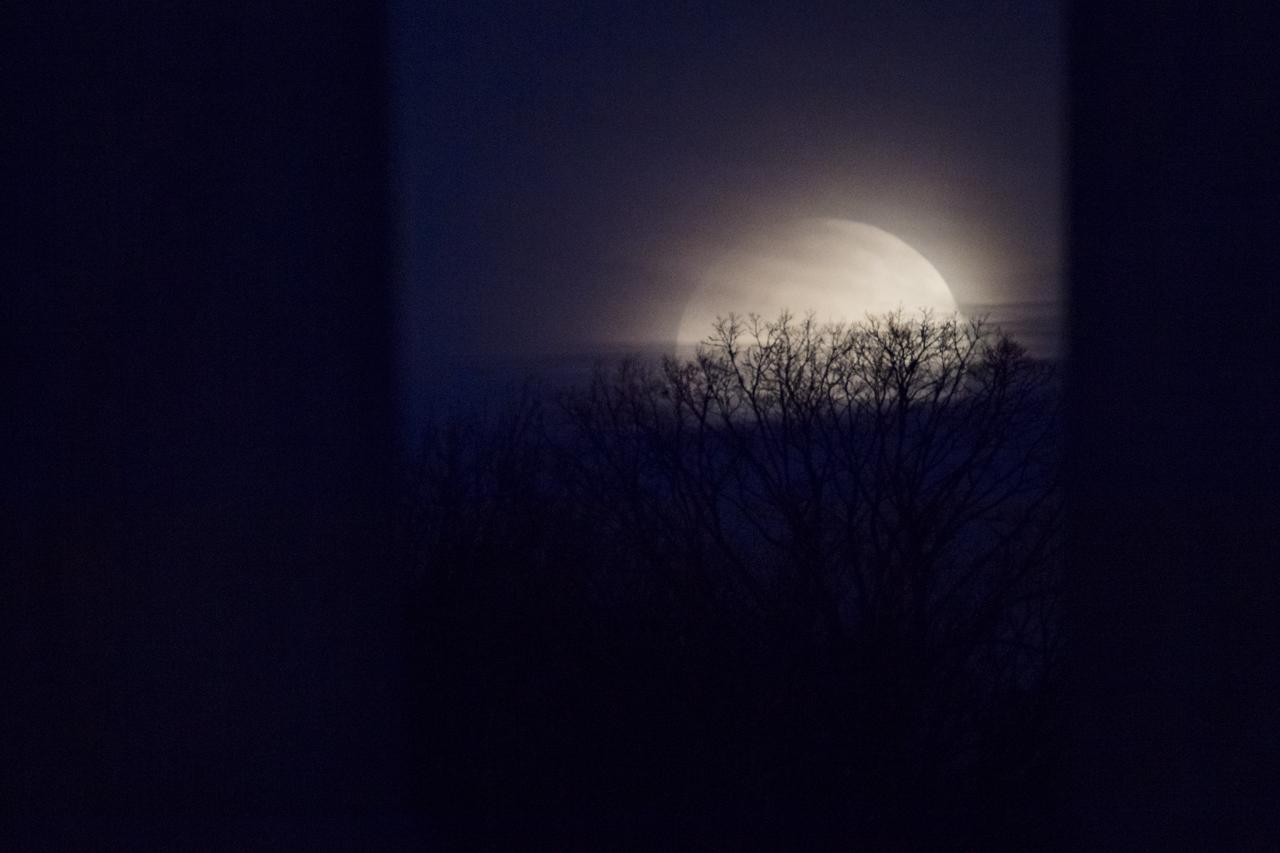
The Moon is seen as it sets behind the National Capitol Columns at The US National Arboretum on Wednesday, Jan. 31, 2018 in Washington. Today’s full Moon is unique for three reasons: it is the third in a series of supermoons, occurring when the Moon is closer to Earth in its orbit. It is also the second full moon of the month, commonly known as a blue moon. The moon will also be passing through Earth’s shadow, giving skywatchers in the right locations a view of a total lunar eclipse. Photo Credit: (NASA/Aubrey Gemignani)

Traveling west to east, the full moon, viewed from Merritt Island, Fla., at 10:18 p.m. EST, begins moving into the Earth's shadow, at the start of a lunar eclipse. Eclipses occur when the Sun, Earth and Moon line up. They are rare because the Moon usually passes above or below the imaginary line connecting Earth and the Sun. The Earth casts a shadow that the Moon can pass through -when it does, it is called a lunar eclipse. They can only occur when the moon is "full." During a total lunar eclipse the Moon takes on a dark red color because it is being lighted slightly by sunlight passing through the Earth's atmosphere and this light has the blue component preferentially scattered out (this is also why the sky appears blue from the surface of the Earth), leaving faint reddish light to illuminate the Moon during the eclipse
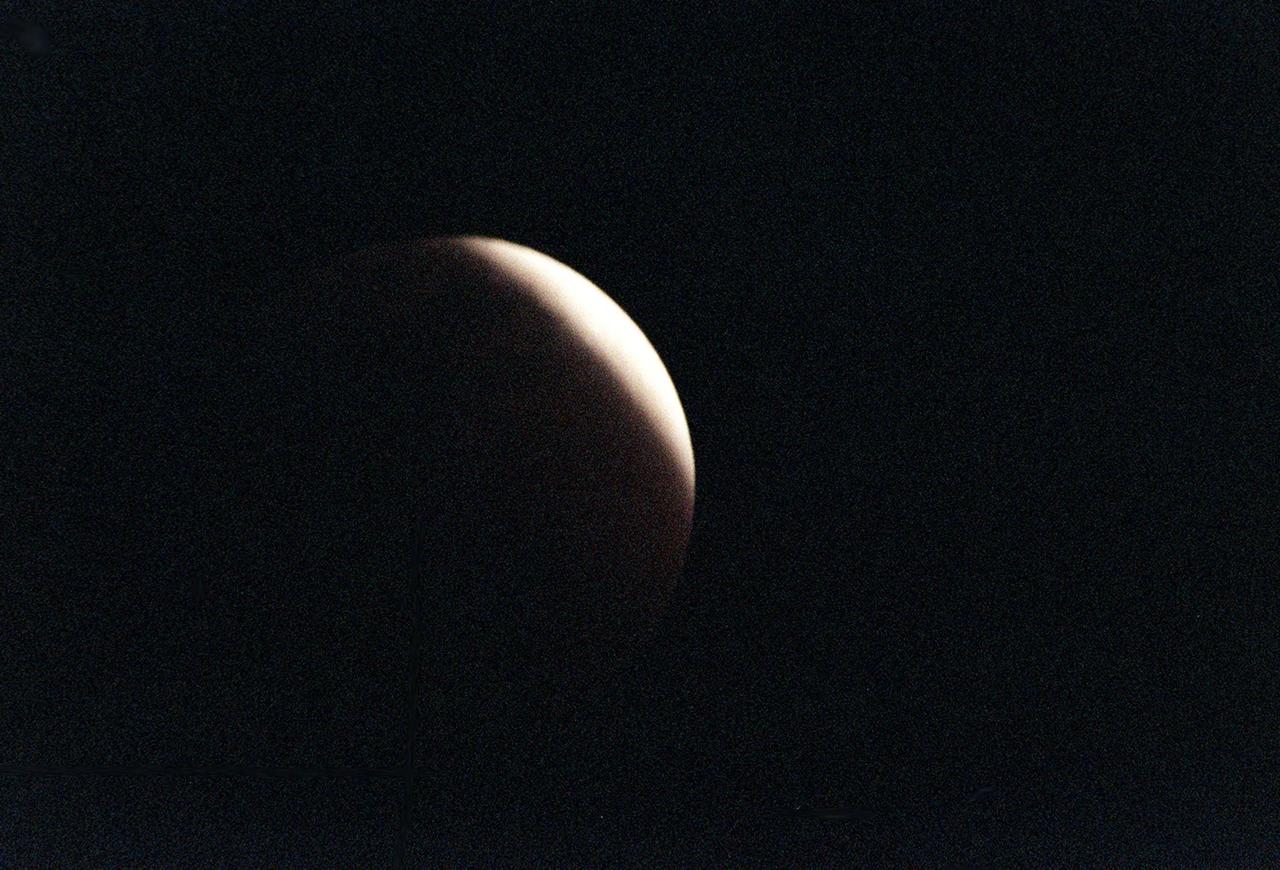
Viewed from Merritt Island, Fla., at 11:25 p.m. EST, the full moon, traveling west to east, is nearly completely in the Earth's shadow, producing a lunar eclipse. Eclipses occur when the Sun, Earth and Moon line up. They are rare because the Moon usually passes above or below the imaginary line connecting Earth and the Sun. The Earth casts a shadow that the Moon can pass through -when it does, it is called a lunar eclipse. They can only occur when the moon is "full." During a total lunar eclipse the Moon takes on a dark red color because it is being lighted slightly by sunlight passing through the Earth's atmosphere and this light has the blue component preferentially scattered out (this is also why the sky appears blue from the surface of the Earth), leaving faint reddish light to illuminate the Moon during the eclipse
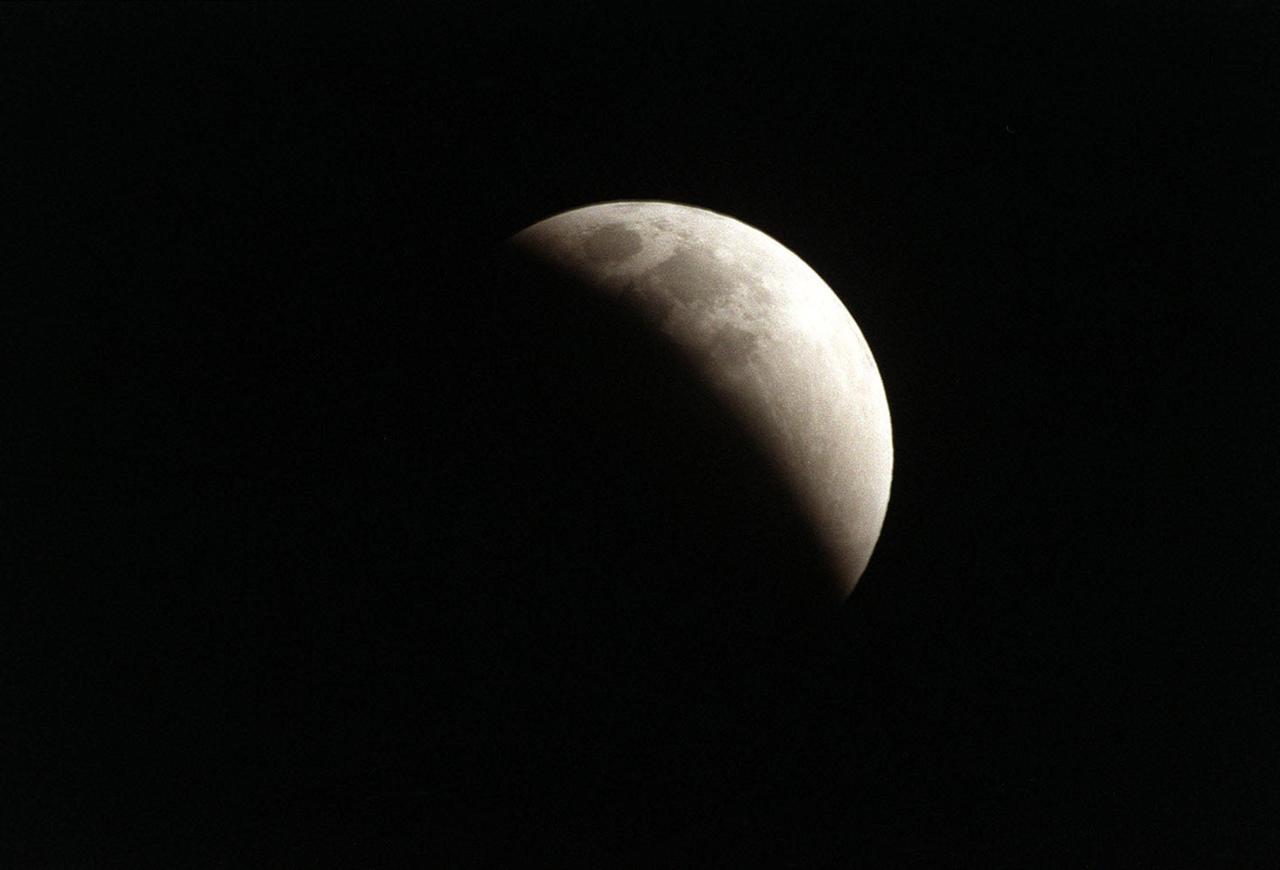
Viewed from Merritt Island, Fla., at 10:59 p.m. EST, the full moon, traveling west to east, is three-quarters of the way into the Earth's shadow during a lunar eclipse. Eclipses occur when the Sun, Earth and Moon line up. They are rare because the Moon usually passes above or below the imaginary line connecting Earth and the Sun. The Earth casts a shadow that the Moon can pass through -when it does, it is called a lunar eclipse. They can only occur when the moon is "full." During a total lunar eclipse the Moon takes on a dark red color because it is being lighted slightly by sunlight passing through the Earth's atmosphere and this light has the blue component preferentially scattered out (this is also why the sky appears blue from the surface of the Earth), leaving faint reddish light to illuminate the Moon during the eclipse
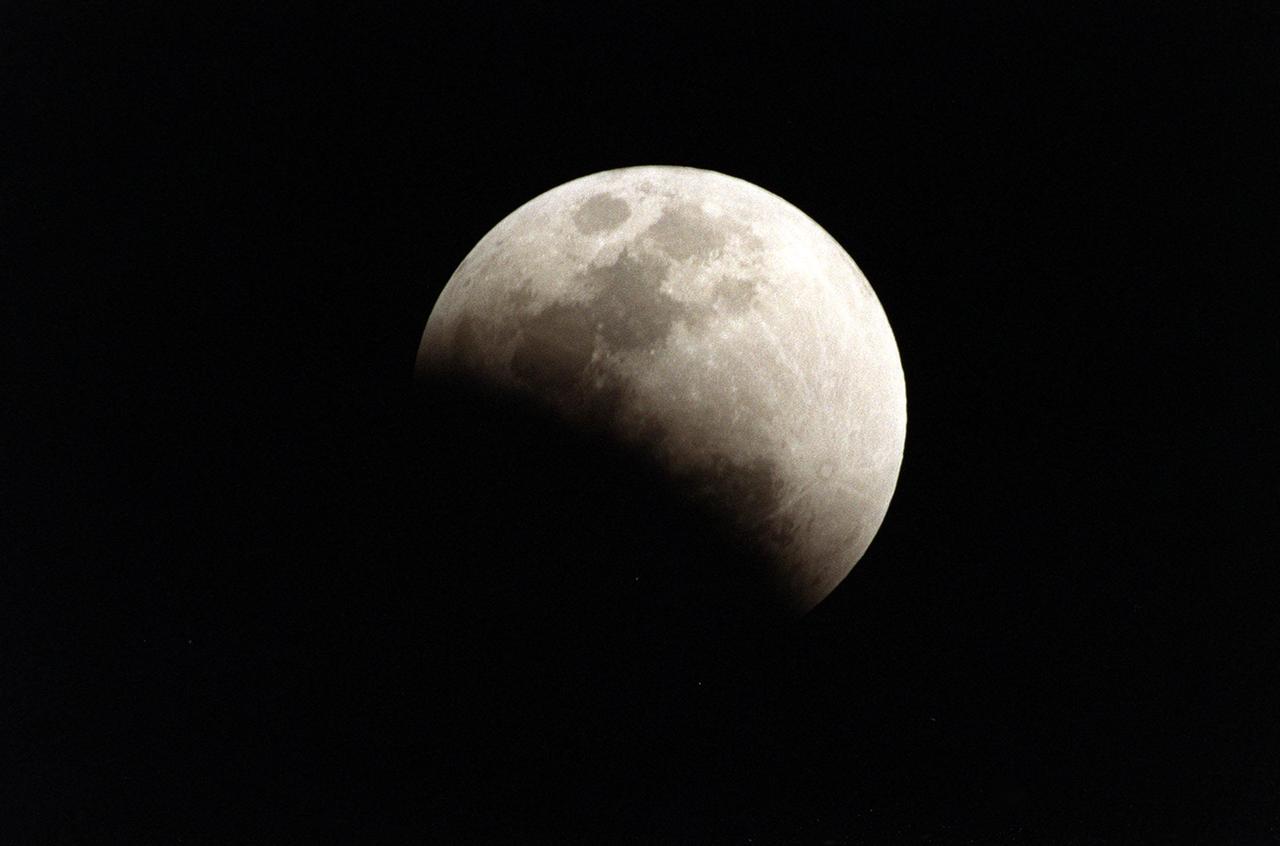
Traveling west to east, the full moon, viewed from Merritt Island, Fla., at 10:35 p.m. EST, moves into the Earth's shadow during a lunar eclipse. Eclipses occur when the Sun, Earth and Moon line up. They are rare because the Moon usually passes above or below the imaginary line connecting Earth and the Sun. The Earth casts a shadow that the Moon can pass through -when it does, it is called a lunar eclipse. They can only occur when the moon is "full." During a total lunar eclipse the Moon takes on a dark red color because it is being lighted slightly by sunlight passing through the Earth's atmosphere and this light has the blue component preferentially scattered out (this is also why the sky appears blue from the surface of the Earth), leaving faint reddish light to illuminate the Moon during the eclipse

In this lunar eclipse viewed from Merritt Island, Fla., the full moon takes on a dark red color because it is being lighted slightly by sunlight passing through the Earth's atmosphere. This light has the blue component preferentially scattered out (this is also why the sky appears blue from the surface of the Earth), leaving faint reddish light to illuminate the Moon. Eclipses occur when the Sun, Earth and Moon line up. They are rare because the Moon usually passes above or below the imaginary line connecting Earth and the Sun. The Earth casts a shadow that the Moon can pass through - when it does, it is called a lunar eclipse.

In this lunar eclipse viewed from Merritt Island, Fla., at midnight, the full moon takes on a dark red color because it is being lighted slightly by sunlight passing through the Earth's atmosphere. This light has the blue component preferentially scattered out (this is also why the sky appears blue from the surface of the Earth), leaving faint reddish light to illuminate the Moon during the eclipse. Eclipses occur when the Sun, Earth and Moon line up. They are rare because the Moon usually passes above or below the imaginary line connecting Earth and the Sun. The Earth casts a shadow that the Moon can pass through -when it does, it is called a lunar eclipse

In this lunar eclipse viewed from Merritt Island, Fla., at 11:55 p.m., the full moon takes on a dark red color because it is being lighted slightly by sunlight passing through the Earth's atmosphere. This light has the blue component preferentially scattered out (this is also why the sky appears blue from the surface of the Earth), leaving faint reddish light to illuminate the Moon during the eclipse. Eclipses occur when the Sun, Earth and Moon line up. They are rare because the Moon usually passes above or below the imaginary line connecting Earth and the Sun. The Earth casts a shadow that the Moon can pass through -when it does, it is called a lunar eclipse
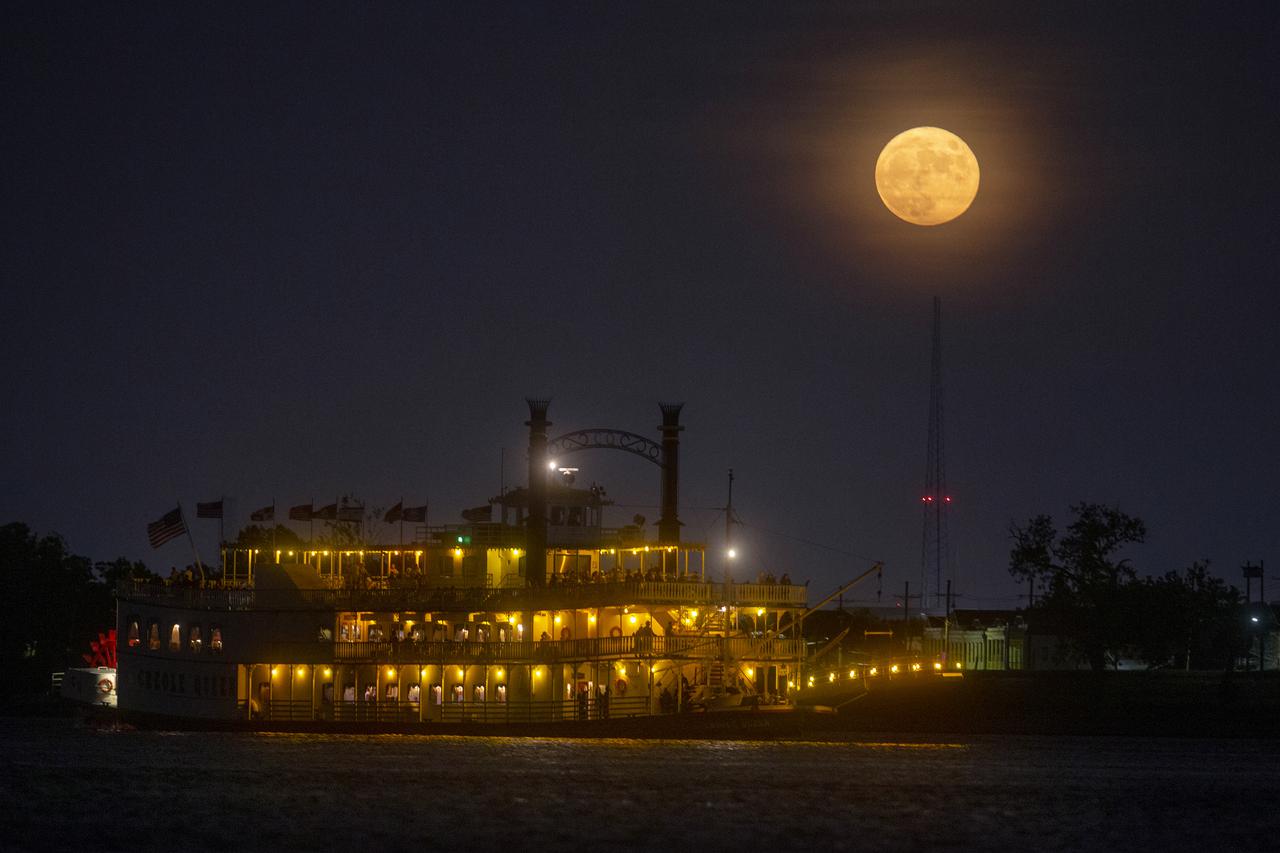
A paddlewheeler makes its way up the Mississippi River as the moon rises over New Orleans on Sunday evening, August 22, 2021. The August Sturgeon Moon, which was also a rare Blue Moon, was full at 7:02 A.M. local time Sunday but the nearly full moon still put on a show when it rose over New Orleans later that evening. New Orleans is home to the NASA Michoud Assembly Facility where the core stage of the Space Launch System that will return people to the moon is being built. Image credit: NASA/Michael DeMocker

<b>Share YOUR Supermoon images with NASA in our Flickr Group: <a href="http://www.flickr.com/groups/supermoon2013/">www.flickr.com/groups/supermoon2013/</a></b> Up there in the sky – it's not a bird or a plane; it's a "Supermoon." Bigger and brighter then normal full moons, the supermoon on June 22/23 will be the closest and largest full moon for all of 2013. The moon will be some 29,000 miles closer to Earth than the farthest point in its orbit, but not to worry the moon will still be more than 221,000 miles away from our blue planet. --- This is an animation of the moon that was created using data from NASA's LRO satellite. Details: Time: Sunday, June 23, 2013, 15:00 UT (11:00 AM EDT) Phase: 99.9% Diameter:2007.5 arcseconds Distance:357015 km (28.02 Earth diameters) J2000 Right Ascension, Declination18h 17m 42s, -19° 31' 35" Subsolar Longitude, Latitude-1.905°, -1.129° Sub-Earth Longitude, Latitude0.093°, -5.002° Position Angle:359.213° Credit: NASA/Goddard/LRO More images and animarions of the moon can be found here: <a href="http://1.usa.gov/14bPRjT" rel="nofollow">1.usa.gov/14bPRjT</a> <b><a href="http://www.nasa.gov/audience/formedia/features/MP_Photo_Guidelines.html" rel="nofollow">NASA image use policy.</a></b> <b><a href="http://www.nasa.gov/centers/goddard/home/index.html" rel="nofollow">NASA Goddard Space Flight Center</a></b> enables NASA’s mission through four scientific endeavors: Earth Science, Heliophysics, Solar System Exploration, and Astrophysics. Goddard plays a leading role in NASA’s accomplishments by contributing compelling scientific knowledge to advance the Agency’s mission. <b>Follow us on <a href="http://twitter.com/NASA_GoddardPix" rel="nofollow">Twitter</a></b> <b>Like us on <a href="http://www.facebook.com/pages/Greenbelt-MD/NASA-Goddard/395013845897?ref=tsd" rel="nofollow">Facebook</a></b> <b>Find us on <a href="http://instagram.com/nasagoddard?vm=grid" rel="nofollow">Instagram</a></b>
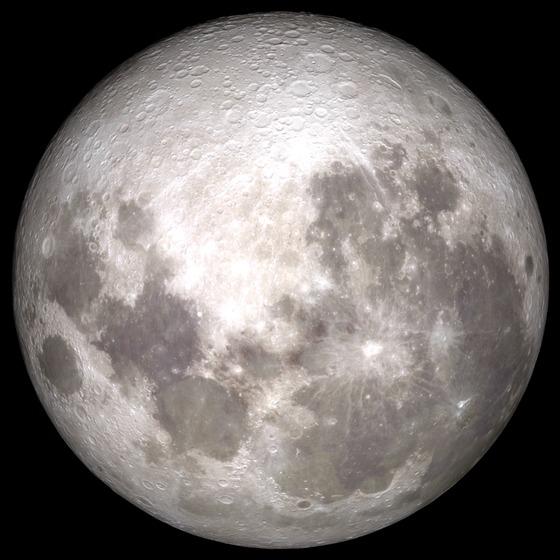
<b>Share YOUR Supermoon images with NASA in our Flickr Group: <a href="http://www.flickr.com/groups/supermoon2013/">www.flickr.com/groups/supermoon2013/</a></b> Up there in the sky – it's not a bird or a plane; it's a "Supermoon." Bigger and brighter then normal full moons, the supermoon on June 22/23 will be the closest and largest full moon for all of 2013. The moon will be some 29,000 miles closer to Earth than the farthest point in its orbit, but not to worry the moon will still be more than 221,000 miles away from our blue planet. --- This is an animation of the moon that was created using data from NASA's LRO satellite. Details: Time: Sunday, June 23, 2013, 15:00 UT (11:00 AM EDT) Phase: 99.9% Diameter:2007.5 arcseconds Distance:357015 km (28.02 Earth diameters) J2000 Right Ascension, Declination18h 17m 42s, -19° 31' 35" Subsolar Longitude, Latitude-1.905°, -1.129° Sub-Earth Longitude, Latitude0.093°, -5.002° Position Angle:359.213° Credit: NASA/Goddard/LRO More images and animarions of the moon can be found here: <a href="http://1.usa.gov/14bPRjT" rel="nofollow">1.usa.gov/14bPRjT</a> <b><a href="http://www.nasa.gov/audience/formedia/features/MP_Photo_Guidelines.html" rel="nofollow">NASA image use policy.</a></b> <b><a href="http://www.nasa.gov/centers/goddard/home/index.html" rel="nofollow">NASA Goddard Space Flight Center</a></b> enables NASA’s mission through four scientific endeavors: Earth Science, Heliophysics, Solar System Exploration, and Astrophysics. Goddard plays a leading role in NASA’s accomplishments by contributing compelling scientific knowledge to advance the Agency’s mission. <b>Follow us on <a href="http://twitter.com/NASAGoddardPix" rel="nofollow">Twitter</a></b> <b>Like us on <a href="http://www.facebook.com/pages/Greenbelt-MD/NASA-Goddard/395013845897?ref=tsd" rel="nofollow">Facebook</a></b> <b>Find us on <a href="http://instagram.com/nasagoddard?vm=grid" rel="nofollow">Instagram</a></b>

This image from NASA's retired Spitzer Space Telescope highlights the stars and dust clouds in the Andromeda galaxy. One of Earth's nearest galactic neighbors, Andromeda spans a swath of sky nearly 3.8 degrees across, which is close to the width of eight full Moons lined up side by side. The area around the galaxy includes data from NASA's Wide-field Infrared Survey Explorer (WISE). Spitzer observed infrared light, a range of wavelengths longer than what human eyes can detect. In this image, starlight glows blue and cyan (representing infrared wavelengths of 3.6 and 4.5 microns). Dust dominates the galaxy in red (8 microns). The longest wavelength detected by Spitzer (24 microns) gives an indication of the dust's temperature and is represented in green; it combines with the red to create orange and yellow, indicating regions where stars are forming. https://photojournal.jpl.nasa.gov/catalog/PIA26276
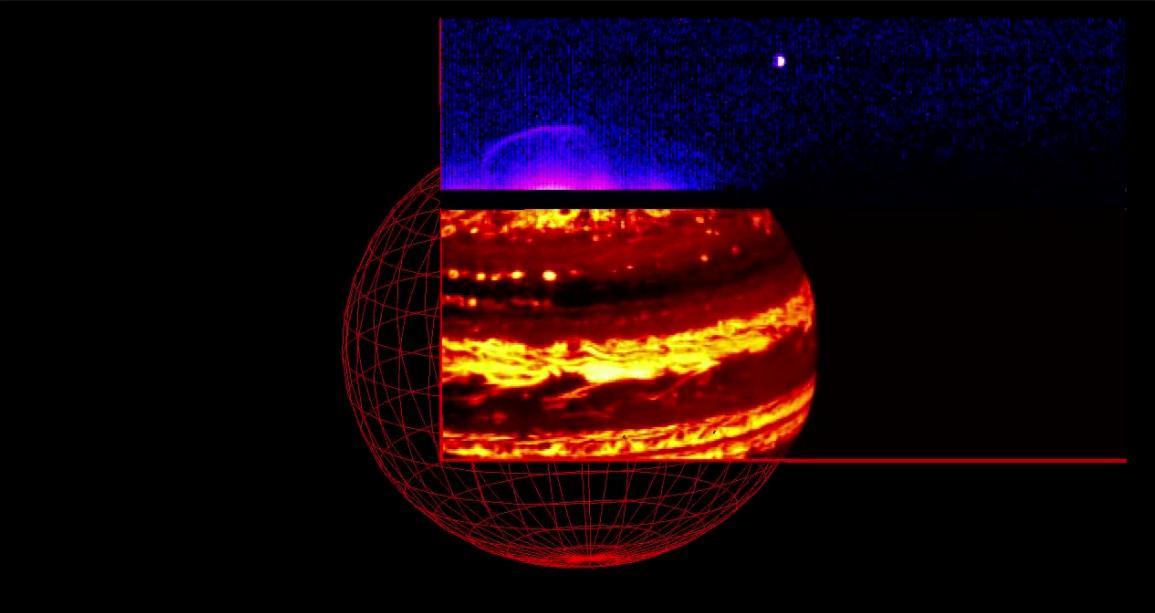
As NASA's Juno spacecraft approached Jupiter on Aug. 27, 2016, the Jovian Infrared Auroral Mapper (JIRAM) instrument captured the planet's glow in infrared light. The video is composed of 580 images collected over a period of about nine hours while Jupiter completed nearly a full rotation on its axis. The video shows the two parts composing the JIRAM imager: the lower one, in a red color scale, is used for mapping the planet's thermal emission at wavelengths around 4.8 microns; the upper one, in a blue color scale, is used to map the auroras at wavelengths around 3.45 microns. In this case the exposure time of the imager was optimized to observe the planet's thermal emission. However, it is possible to see a faint aurora and Jupiter's moon Io approaching the planet. The Great Red Spot is also visible just south of the planet's equator. A movie is available at http://photojournal.jpl.nasa.gov/catalog/PIA21036

The CTB 1 supernova remnant resembles a ghostly bubble in this image, which combines new 1.5 gigahertz observations from the Very Large Array (VLA) radio telescope (orange, near center) with older observations from the Dominion Radio Astrophysical Observatory’s Canadian Galactic Plane Survey (1.42 gigahertz, magenta and yellow; 408 megahertz, green) and infrared data (blue). The VLA data clearly reveal the straight, glowing trail from pulsar J0002+6216 and the curved rim of the remnant’s shell. CTB 1 is about half a degree across, the apparent size of a full Moon. Credits: Composite by Jayanne English, University of Manitoba, using data from NRAO/F. Schinzel et al., DRAO/Canadian Galactic Plane Survey and NASA/IRAS More info: https://go.nasa.gov/2TKpyWF

Since its launch five years ago, the Galaxy Evolution Explorer has photographed hundreds of millions of galaxies in ultraviolet light. M106 is one of those galaxies, 22 light years away, it strikes a pose in blue and gold for this new commemorative portrait. The galaxy's extended arms are the blue filaments that curve around its edge, creating its outer disk. Tints of blue in M106's arms reveal hot, young massive stars. Traces of gold toward the center show an older stellar population and indicate the presence of obscuring dust. From 24 million light-years away, neighboring galaxy NGC 4248 also makes a memorable appearance, sitting just right of M106. The irregular galaxy looks like a yellow smudge, with a bluish-white bar in the center. The galaxy's outer golden glow indicates a population of older stars, while the blue central region shows a younger stellar demographic. Dwarf galaxy UGC 7365 emerges at the bottom center of this image, as a faint yellow smudge directly below M106. This galaxy is not forming any new stars, and looks much smaller than M106 despite being closer to Earth, at 14 million light-years away. Over the past five years, the Galaxy Evolution Explorer has imaged half a billion objects over 27,000 square degrees of sky —equivalent to an area that would be covered by 138,000 full moons. The telescope orbits Earth every 94 minutes and travels approximately 408,470 million miles per day. Its overarching question is: how do galaxies grow and change over 10 billion years of cosmic history? M106, also known as NGC 4258, is located in the constellation Canes Venatici. This image is a two-color composite, where far-ultraviolet light is blue, and near-ultraviolet light is red. http://photojournal.jpl.nasa.gov/catalog/PIA10600
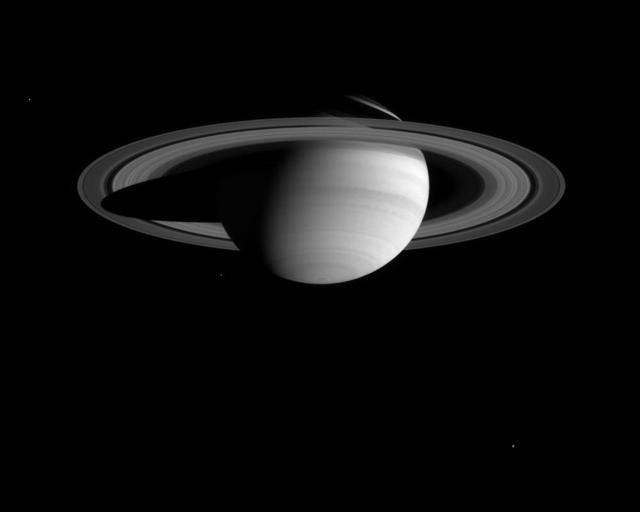
Bands and spots in Saturn's atmosphere, including a dark band south of the equator with a scalloped border, are visible in this image from the Cassini-Huygens spacecraft. The narrow angle camera took the image in blue light on Feb. 29, 2004. The distance to Saturn was 59.9 million kilometers (37.2 million miles). The image scale is 359 kilometers (223 miles) per pixel. Three of Saturn's moons are seen in the image: Enceladus (499 kilometers, or 310 miles across) at left; Mimas (398 kilometers, or 247 miles across) left of Saturn's south pole; and Rhea (1,528 kilometers, or 949 miles across) at lower right. The imaging team enhanced the brightness of the moons to aid visibility. The BL1 broadband spectral filter (centered at 451 nanometers) allows Cassini to "see" light in a part of the spectrum visible as the color blue to human eyes. Scientist can combine images made with this filter with those taken with red and green filters to create full-color composites. Scientists can also assess cloud heights by combining images from the blue filter with images taken in other spectral regions. For example, the bright clouds that form the equatorial zone are the highest in altitude and have pressures at their tops of about one quarter of Earth's atmospheric pressure at sea level. The cloud tops at middle latitudes are lower in altitude and have higher pressures of about half that found at sea level. Analysis of Saturn images like this one will be extremely useful to researchers assessing cloud altitudes during the Cassini-Huygens mission. http://photojournal.jpl.nasa.gov/catalog/PIA05383

In this rare image taken on July 19, 2013, the wide-angle camera on NASA's Cassini spacecraft has captured Saturn's rings and our planet Earth and its moon in the same frame. It is only one footprint in a mosaic of 33 footprints covering the entire Saturn ring system (including Saturn itself). At each footprint, images were taken in different spectral filters for a total of 323 images: some were taken for scientific purposes and some to produce a natural color mosaic. This is the only wide-angle footprint that has the Earth-moon system in it. The dark side of Saturn, its bright limb, the main rings, the F ring, and the G and E rings are clearly seen; the limb of Saturn and the F ring are overexposed. The "breaks" in the brightness of Saturn's limb are due to the shadows of the rings on the globe of Saturn, preventing sunlight from shining through the atmosphere in those regions. The E and G rings have been brightened for better visibility. Earth, which is 898 million miles (1.44 billion kilometers) away in this image, appears as a blue dot at center right; the moon can be seen as a fainter protrusion off its right side. An arrow indicates their location in the annotated version. (The two are clearly seen as separate objects in the accompanying composite image PIA14949.) The other bright dots nearby are stars. This is only the third time ever that Earth has been imaged from the outer solar system. The acquisition of this image, along with the accompanying composite narrow- and wide-angle image of Earth and the moon and the full mosaic from which both are taken, marked the first time that inhabitants of Earth knew in advance that their planet was being imaged. That opportunity allowed people around the world to join together in social events to celebrate the occasion. This view looks toward the unilluminated side of the rings from about 20 degrees below the ring plane. Images taken using red, green and blue spectral filters were combined to create this natural color view. The images were obtained with the Cassini spacecraft wide-angle camera on July 19, 2013 at a distance of approximately 753,000 miles (1.212 million kilometers) from Saturn, and approximately 898.414 million miles (1.445858 billion kilometers) from Earth. Image scale on Saturn is 43 miles (69 kilometers) per pixel; image scale on the Earth is 53,820 miles (86,620 kilometers) per pixel. The illuminated areas of neither Earth nor the Moon are resolved here. Consequently, the size of each "dot" is the same size that a point of light of comparable brightness would have in the wide-angle camera. http://photojournal.jpl.nasa.gov/catalog/PIA17171
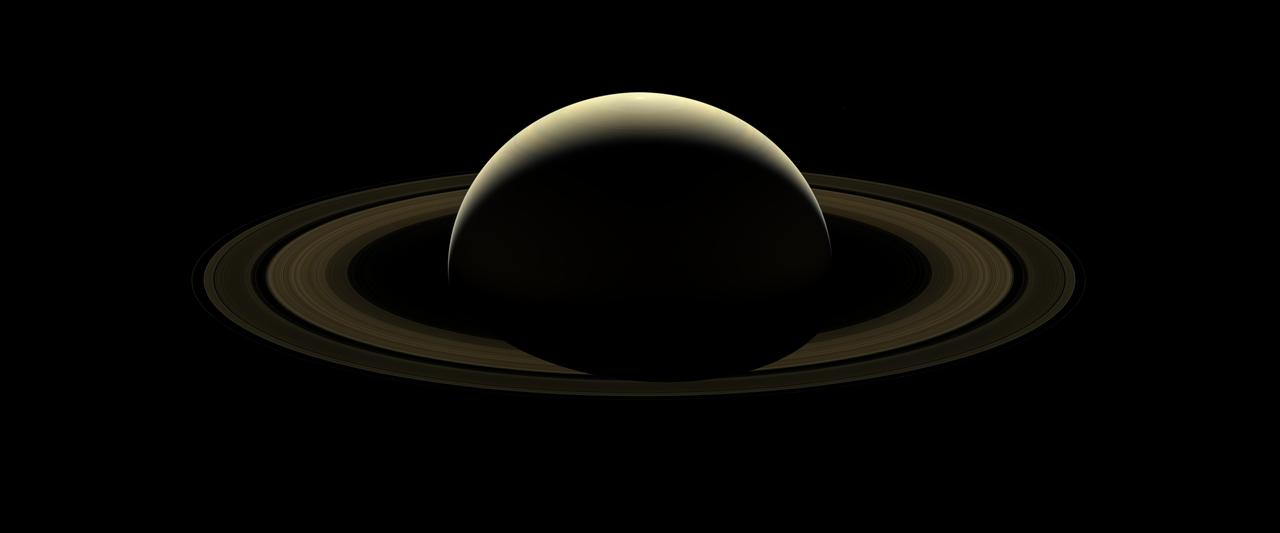
After more than 13 years at Saturn, and with its fate sealed, NASA's Cassini spacecraft bid farewell to the Saturnian system by firing the shutters of its wide-angle camera and capturing this last, full mosaic of Saturn and its rings two days before the spacecraft's dramatic plunge into the planet's atmosphere. During the observation, a total of 80 wide-angle images were acquired in just over two hours. This view is constructed from 42 of those wide-angle shots, taken using the red, green and blue spectral filters, combined and mosaicked together to create a natural-color view. Six of Saturn's moons -- Enceladus, Epimetheus, Janus, Mimas, Pandora and Prometheus -- make a faint appearance in this image. (Numerous stars are also visible in the background.) A second version of the mosaic is provided in which the planet and its rings have been brightened, with the fainter regions brightened by a greater amount. (The moons and stars have also been brightened by a factor of 15 in this version.) The ice-covered moon Enceladus -- home to a global subsurface ocean that erupts into space -- can be seen at the 1 o'clock position. Directly below Enceladus, just outside the F ring (the thin, farthest ring from the planet seen in this image) lies the small moon Epimetheus. Following the F ring clock-wise from Epimetheus, the next moon seen is Janus. At about the 4:30 position and outward from the F ring is Mimas. Inward of Mimas and still at about the 4:30 position is the F-ring-disrupting moon, Pandora. Moving around to the 10 o'clock position, just inside of the F ring, is the moon Prometheus. This view looks toward the sunlit side of the rings from about 15 degrees above the ring plane. Cassini was approximately 698,000 miles (1.1 million kilometers) from Saturn, on its final approach to the planet, when the images in this mosaic were taken. Image scale on Saturn is about 42 miles (67 kilometers) per pixel. The image scale on the moons varies from 37 to 50 miles (59 to 80 kilometers) pixel. The phase angle (the Sun-planet-spacecraft angle) is 138 degrees. The Cassini spacecraft ended its mission on Sept. 15, 2017. https://photojournal.jpl.nasa.gov/catalog/PIA17218
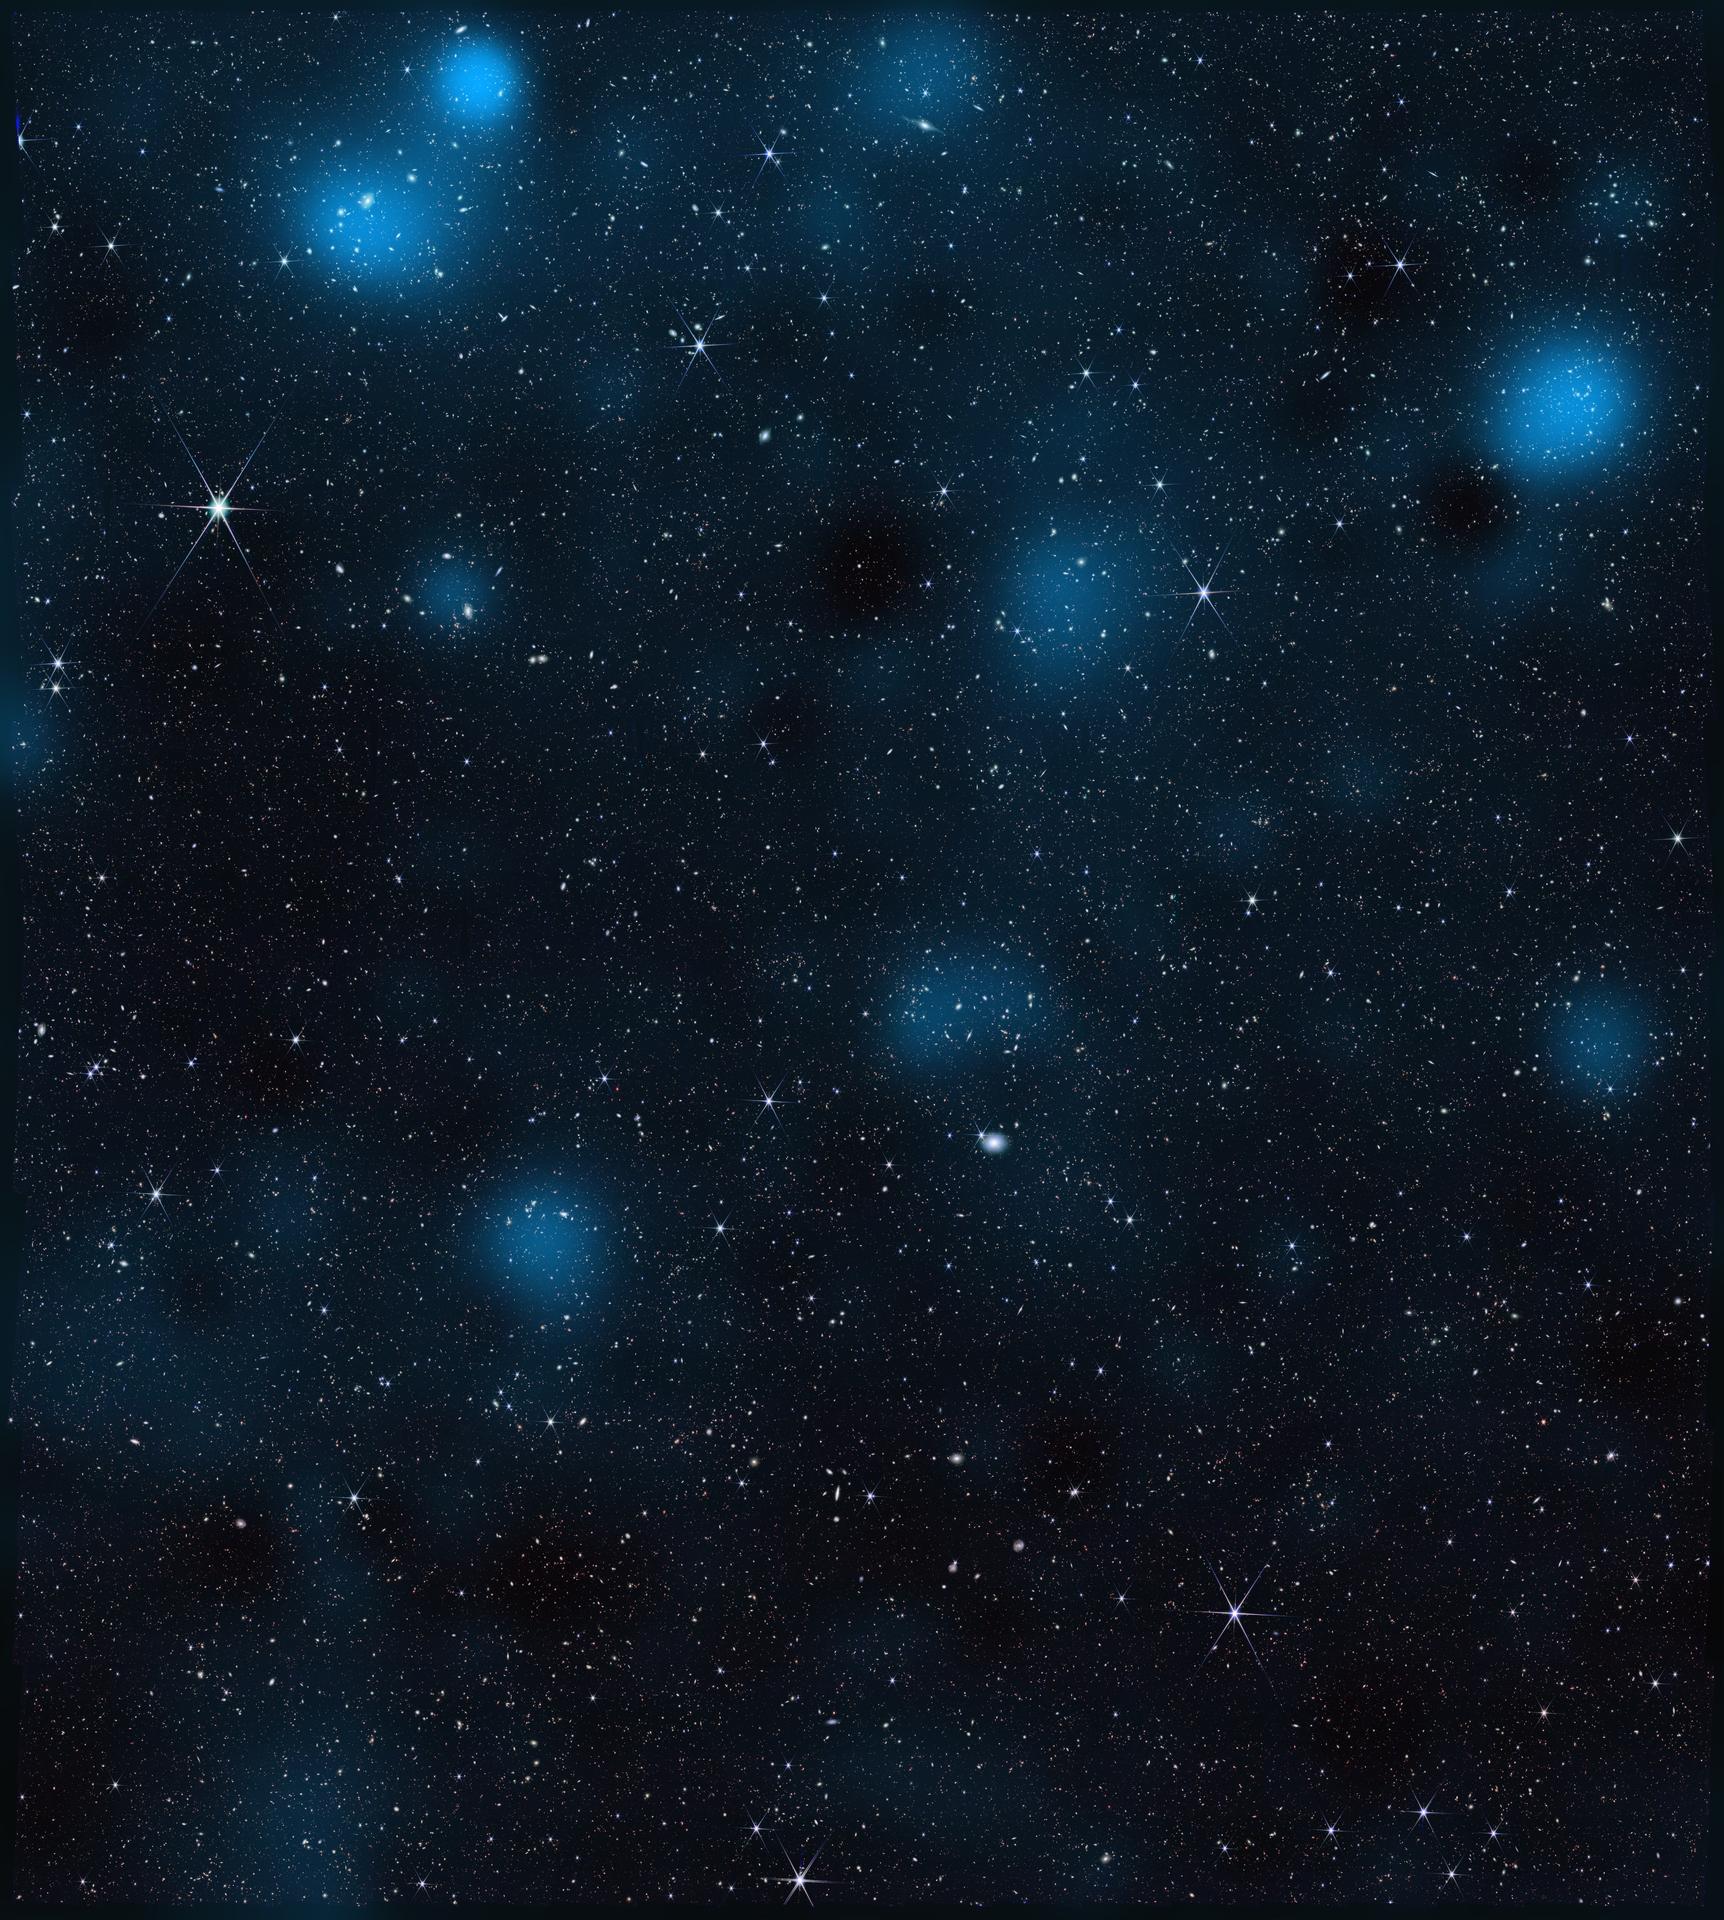
This image from NASA’s James Webb Space Telescope, containing nearly 800,000 galaxies, is overlaid with a map of dark matter, represented in blue. Brighter blue areas indicate a higher density of dark matter. Researchers used Webb data to find the dark matter — which is invisible — via its gravitational influence on regular matter. The area of sky shown here is 0.54 square degrees (about 2½ times the size of the full Moon) and located in the constellation Sextans. Webb’s Near-Infrared Camera (NIRCam) peered at this region for a total of about 255 hours. Dark matter doesn’t emit, reflect, absorb, or even block light, and is therefore not visible to the human eye or traditional telescopes. But it does interact with the universe through gravity, and large clumps or clusters of dark matter have enough mass to curve space itself. Light traveling to Earth from distant galaxies becomes slightly distorted as it passes through the curved fabric of spacetime. In some cases, the warping is significant enough that it is apparent to the naked eye, almost as if the galaxy were being viewed through a warped windowpane, an effect called strong gravitational lensing. In the case of the dark matter map shown here, scientists inferred dark matter’s distribution by relying instead on an effect called weak gravitational lensing, which leads to much more subtle distortions of the light from thousands of galaxies. The dark matter in this area of sky was also mapped in 2007 using data from NASA’s Hubble Space Telescope. The Webb map contains about 10 times more galaxies than do maps of the area made by ground-based observatories and twice as many as Hubble’s map. It reveals new clumps of dark matter and captures a higher-resolution view compared to the Hubble map. Both the Hubble and Webb dark matter maps are part of a project called the Cosmic Evolution Survey (COSMOS). The full COSMOS “field” is 2 square degrees (about 10 times the size of the full Moon) and has been imaged by at least 15 telescopes in space and on the ground. Observing the same region with many different telescopes allows scientists to combine complementary views to understand how galaxies grow and how dark matter influences their evolution. Only Webb and Hubble data have been used to map dark matter in the region. To refine measurements of the distance to many galaxies for the map, the team used Webb’s Mid-Infrared Instrument (MIRI), designed and managed through launch by the agency’s Jet Propulsion Laboratory, along with other space- and ground-based telescopes. The wavelengths that MIRI detects also make it adept at detecting galaxies obscured by cosmic dust clouds. The James Webb Space Telescope is solving mysteries in our solar system, looking beyond to distant worlds around other stars, and probing the mysterious structures and origins of our universe and our place in it. Webb is an international program led by NASA with its partners, ESA (European Space Agency) and CSA (Canadian Space Agency). Webb’s MIRI was developed through a 50-50 partnership between NASA and ESA. A division of Caltech in Pasadena, California, JPL led the U.S. contribution to MIRI. JPL also led development of MIRI’s cryocooler, done in collaboration with Northrop Grumman in Redondo Beach, California, and NASA’s Goddard Space Flight Center in Greenbelt, Maryland. To learn more about Webb, visit: https://science.nasa.gov/webb
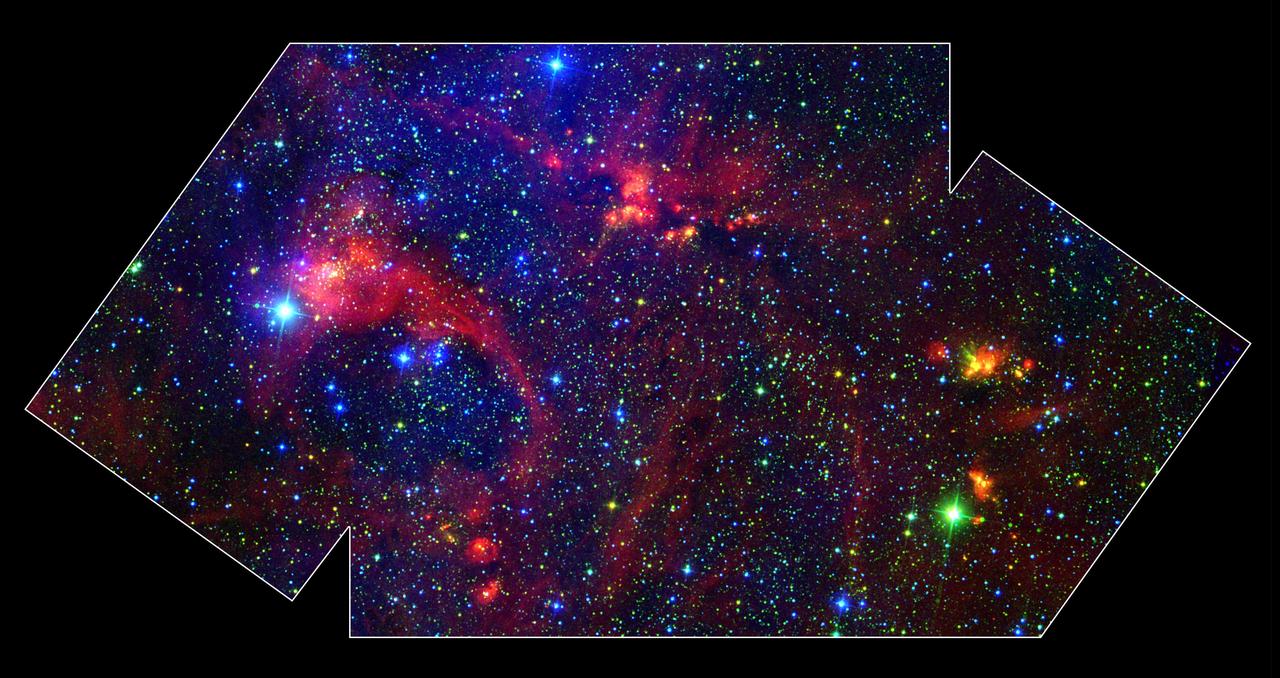
Hidden behind a shroud of dust in the constellation Cygnus is a stellar nursery called DR21, which is giving birth to some of the most massive stars in our galaxy. Visible light images reveal no trace of this interstellar cauldron because of heavy dust obscuration. In fact, visible light is attenuated in DR21 by a factor of more than 10,000,000,000,000,000,000,000,000,000,000,000,000,000 (ten thousand trillion heptillion). New images from NASA's Spitzer Space Telescope allow us to peek behind the cosmic veil and pinpoint one of the most massive natal stars yet seen in our Milky Way galaxy. The never-before-seen star is 100,000 times as bright as the Sun. Also revealed for the first time is a powerful outflow of hot gas emanating from this star and bursting through a giant molecular cloud. The colorful image is a large-scale composite mosaic assembled from data collected at a variety of different wavelengths. Views at visible wavelengths appear blue, near-infrared light is depicted as green, and mid-infrared data from the InfraRed Array Camera (IRAC) aboard NASA's Spitzer Space Telescope is portrayed as red. The result is a contrast between structures seen in visible light (blue) and those observed in the infrared (yellow and red). A quick glance shows that most of the action in this image is revealed to the unique eyes of Spitzer. The image covers an area about two times that of a full moon. http://photojournal.jpl.nasa.gov/catalog/PIA05734
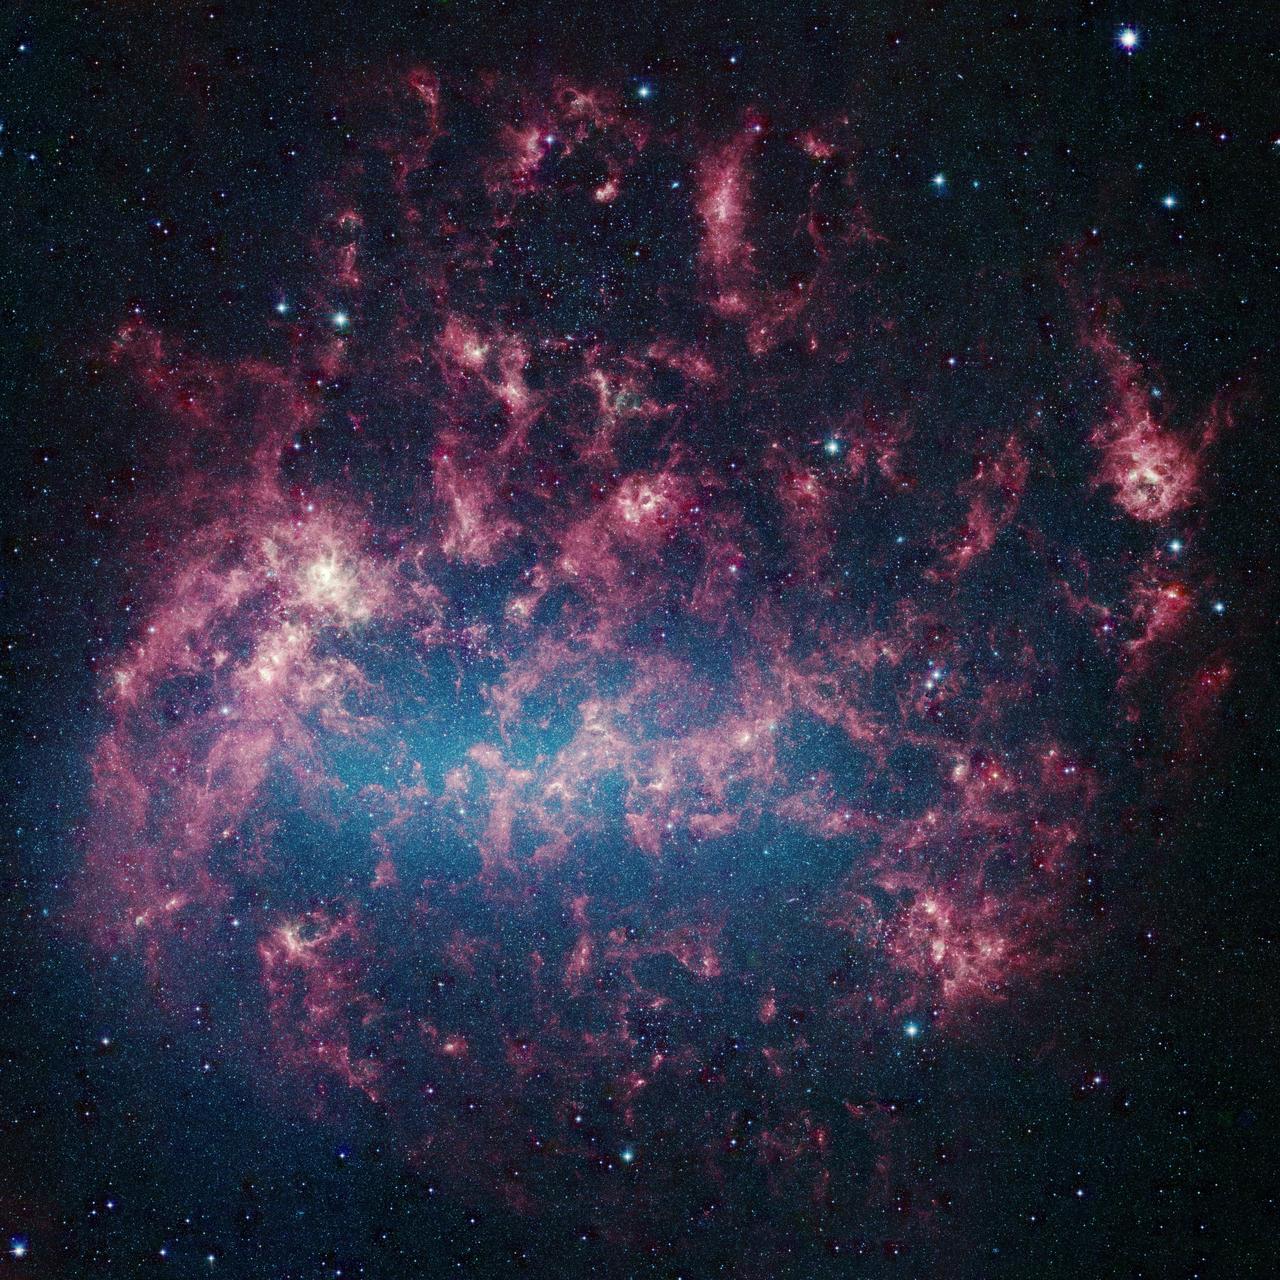
This vibrant image from NASA's Spitzer Space Telescope shows the Large Magellanic Cloud, a satellite galaxy to our own Milky Way galaxy. The infrared image, a mosaic of more than 100,000 individual tiles, offers astronomers a unique chance to study the lifecycle of stars and dust in a single galaxy. Nearly one million objects are revealed for the first time in this Spitzer view, which represents about a 1,000-fold improvement in sensitivity over previous space-based missions. Most of the new objects are dusty stars of various ages populating the Large Magellanic Cloud; the rest are thought to be background galaxies. The blue color in the picture, seen most prominently in the central bar, represents starlight from older stars. The chaotic, bright regions outside this bar are filled with hot, massive stars buried in thick blankets of dust. The red clouds contain cooler interstellar gas and molecular-sized dust grains illuminated by ambient starlight. The Large Magellanic Cloud, located 160,000 light-years from Earth, is one of a handful of dwarf galaxies that orbit our own Milky Way. It is approximately one-third as wide as the Milky Way, and, if it could be seen in its entirety, would cover the same amount of sky as a grid of about 480 full moons. About one-third of the whole galaxy can be seen in the Spitzer image. This picture is a composite of infrared light captured by Spitzer's infrared array camera. Light with wavelengths of 8 and 5.8 microns is red and orange: 4.5-micron light is green; and 3.6-micron light is blue. http://photojournal.jpl.nasa.gov/catalog/PIA07136
![These six infrared images of Saturn's moon Titan represent some of the clearest, most seamless-looking global views of the icy moon's surface produced so far. The views were created using 13 years of data acquired by the Visual and Infrared Mapping Spectrometer (VIMS) instrument on board NASA's Cassini spacecraft. The images are the result of a focused effort to smoothly combine data from the multitude of different observations VIMS made under a wide variety of lighting and viewing conditions over the course of Cassini's mission. Previous VIMS maps of Titan (for example, PIA02145) display great variation in imaging resolution and lighting conditions, resulting in obvious seams between different areas of the surface. With the seams now gone, this new collection of images is by far the best representation of how the globe of Titan might appear to the casual observer if it weren't for the moon's hazy atmosphere, and it likely will not be superseded for some time to come. Observing the surface of Titan in the visible region of the spectrum is difficult, due to the globe enshrouding haze that envelops the moon. This is primarily because small particles called aerosols in Titan's upper atmosphere strongly scatter visible light. But Titan's surface can be more readily imaged in a few infrared "windows" -- infrared wavelengths where scattering and absorption is much weaker. This is where the VIMS instrument excelled, parting the haze to obtain clear images of Titan's surface. (For comparison, Figure 1 shows Titan as it appears in visible light, as does PIA11603.) Making mosaics of VIMS images of Titan has always been a challenge because the data were obtained over many different flybys with different observing geometries and atmospheric conditions. One result is that very prominent seams appear in the mosaics that are quite difficult for imaging scientists to remove. But, through laborious and detailed analyses of the data, along with time consuming hand processing of the mosaics, the seams have been mostly removed. This is an update to the work previously discussed in PIA20022. Any full color image is comprised of three color channels: red, green and blue. Each of the three color channels combined to create these views was produced using a ratio between the brightness of Titan's surface at two different wavelengths (1.59/1.27 microns [red], 2.03/1.27 microns [green] and 1.27/1.08 microns [blue]). This technique (called a "band-ratio" technique) reduces the prominence of seams, as well as emphasizing subtle spectral variations in the materials on Titan's surface. For example, the moon's equatorial dune fields appear a consistent brown color here. There are also bluish and purplish areas that may have different compositions from the other bright areas, and may be enriched in water ice. For a map of Titan with latitudes, longitudes and labeled surface features, see PIA20713. It is quite clear from this unique set of images that Titan has a complex surface, sporting myriad geologic features and compositional units. The VIMS instrument has paved the way for future infrared instruments that could image Titan at much higher resolution, revealing features that were not detectable by any of Cassini's instruments. https://photojournal.jpl.nasa.gov/catalog/PIA21923](https://images-assets.nasa.gov/image/PIA21923/PIA21923~medium.jpg)
These six infrared images of Saturn's moon Titan represent some of the clearest, most seamless-looking global views of the icy moon's surface produced so far. The views were created using 13 years of data acquired by the Visual and Infrared Mapping Spectrometer (VIMS) instrument on board NASA's Cassini spacecraft. The images are the result of a focused effort to smoothly combine data from the multitude of different observations VIMS made under a wide variety of lighting and viewing conditions over the course of Cassini's mission. Previous VIMS maps of Titan (for example, PIA02145) display great variation in imaging resolution and lighting conditions, resulting in obvious seams between different areas of the surface. With the seams now gone, this new collection of images is by far the best representation of how the globe of Titan might appear to the casual observer if it weren't for the moon's hazy atmosphere, and it likely will not be superseded for some time to come. Observing the surface of Titan in the visible region of the spectrum is difficult, due to the globe enshrouding haze that envelops the moon. This is primarily because small particles called aerosols in Titan's upper atmosphere strongly scatter visible light. But Titan's surface can be more readily imaged in a few infrared "windows" -- infrared wavelengths where scattering and absorption is much weaker. This is where the VIMS instrument excelled, parting the haze to obtain clear images of Titan's surface. (For comparison, Figure 1 shows Titan as it appears in visible light, as does PIA11603.) Making mosaics of VIMS images of Titan has always been a challenge because the data were obtained over many different flybys with different observing geometries and atmospheric conditions. One result is that very prominent seams appear in the mosaics that are quite difficult for imaging scientists to remove. But, through laborious and detailed analyses of the data, along with time consuming hand processing of the mosaics, the seams have been mostly removed. This is an update to the work previously discussed in PIA20022. Any full color image is comprised of three color channels: red, green and blue. Each of the three color channels combined to create these views was produced using a ratio between the brightness of Titan's surface at two different wavelengths (1.59/1.27 microns [red], 2.03/1.27 microns [green] and 1.27/1.08 microns [blue]). This technique (called a "band-ratio" technique) reduces the prominence of seams, as well as emphasizing subtle spectral variations in the materials on Titan's surface. For example, the moon's equatorial dune fields appear a consistent brown color here. There are also bluish and purplish areas that may have different compositions from the other bright areas, and may be enriched in water ice. For a map of Titan with latitudes, longitudes and labeled surface features, see PIA20713. It is quite clear from this unique set of images that Titan has a complex surface, sporting myriad geologic features and compositional units. The VIMS instrument has paved the way for future infrared instruments that could image Titan at much higher resolution, revealing features that were not detectable by any of Cassini's instruments. https://photojournal.jpl.nasa.gov/catalog/PIA21923
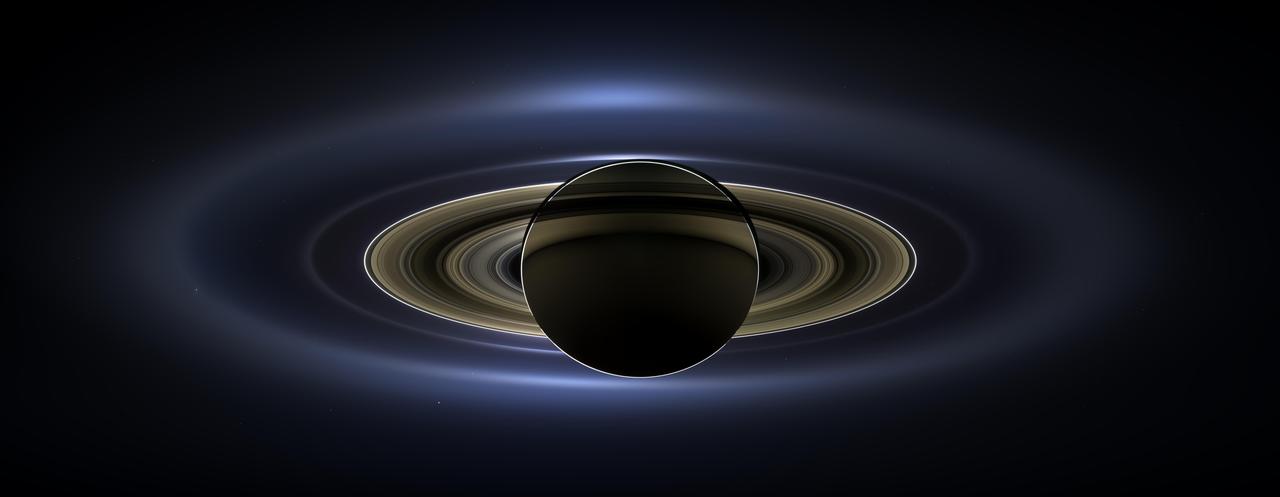
On July 19, 2013, in an event celebrated the world over, NASA's Cassini spacecraft slipped into Saturn's shadow and turned to image the planet, seven of its moons, its inner rings -- and, in the background, our home planet, Earth. With the sun's powerful and potentially damaging rays eclipsed by Saturn itself, Cassini's onboard cameras were able to take advantage of this unique viewing geometry. They acquired a panoramic mosaic of the Saturn system that allows scientists to see details in the rings and throughout the system as they are backlit by the sun. This mosaic is special as it marks the third time our home planet was imaged from the outer solar system; the second time it was imaged by Cassini from Saturn's orbit; and the first time ever that inhabitants of Earth were made aware in advance that their photo would be taken from such a great distance. With both Cassini's wide-angle and narrow-angle cameras aimed at Saturn, Cassini was able to capture 323 images in just over four hours. This final mosaic uses 141 of those wide-angle images. Images taken using the red, green and blue spectral filters of the wide-angle camera were combined and mosaicked together to create this natural-color view. A brightened version with contrast and color enhanced (Figure 1), a version with just the planets annotated (Figure 2), and an annotated version (Figure 3) are shown above. This image spans about 404,880 miles (651,591 kilometers) across. The outermost ring shown here is Saturn's E ring, the core of which is situated about 149,000 miles (240,000 kilometers) from Saturn. The geysers erupting from the south polar terrain of the moon Enceladus supply the fine icy particles that comprise the E ring; diffraction by sunlight gives the ring its blue color. Enceladus (313 miles, or 504 kilometers, across) and the extended plume formed by its jets are visible, embedded in the E ring on the left side of the mosaic. At the 12 o'clock position and a bit inward from the E ring lies the barely discernible ring created by the tiny, Cassini-discovered moon, Pallene (3 miles, or 4 kilometers, across). (For more on structures like Pallene's ring, see PIA08328). The next narrow and easily seen ring inward is the G ring. Interior to the G ring, near the 11 o'clock position, one can barely see the more diffuse ring created by the co-orbital moons, Janus (111 miles, or 179 kilometers, across) and Epimetheus (70 miles, or 113 kilometers, across). Farther inward, we see the very bright F ring closely encircling the main rings of Saturn. Following the outermost E ring counter-clockwise from Enceladus, the moon Tethys (662 miles, or 1,066 kilometers, across) appears as a large yellow orb just outside of the E ring. Tethys is positioned on the illuminated side of Saturn; its icy surface is shining brightly from yellow sunlight reflected by Saturn. Continuing to about the 2 o'clock position is a dark pixel just outside of the G ring; this dark pixel is Saturn's Death Star moon, Mimas (246 miles, or 396 kilometers, across). Mimas appears, upon close inspection, as a very thin crescent because Cassini is looking mostly at its non-illuminated face. The moons Prometheus, Pandora, Janus and Epimetheus are also visible in the mosaic near Saturn's bright narrow F ring. Prometheus (53 miles, or 86 kilometers, across) is visible as a faint black dot just inside the F ring and at the 9 o'clock position. On the opposite side of the rings, just outside the F ring, Pandora (50 miles, or 81 kilometers, across) can be seen as a bright white dot. Pandora and Prometheus are shepherd moons and gravitational interactions between the ring and the moons keep the F ring narrowly confined. At the 11 o'clock position in between the F ring and the G ring, Janus (111 miles, or 179 kilometers, across) appears as a faint black dot. Janus and Prometheus are dark for the same reason Mimas is mostly dark: we are looking at their non-illuminated sides in this mosaic. Midway between the F ring and the G ring, at about the 8 o'clock position, is a single bright pixel, Epimetheus. Looking more closely at Enceladus, Mimas and Tethys, especially in the brightened version of the mosaic, one can see these moons casting shadows through the E ring like a telephone pole might cast a shadow through a fog. In the non-brightened version of the mosaic, one can see bright clumps of ring material orbiting within the Encke gap near the outer edge of the main rings and immediately to the lower left of the globe of Saturn. Also, in the dark B ring within the main rings, at the 9 o'clock position, one can see the faint outlines of two spoke features, first sighted by NASA's Voyager spacecraft in the early 1980s and extensively studied by Cassini. Finally, in the lower right of the mosaic, in between the bright blue E ring and the faint but defined G ring, is the pale blue dot of our planet, Earth. Look closely and you can see the moon protruding from the Earth's lower right. (For a higher resolution view of the Earth and moon taken during this campaign, see PIA14949.) Earth's twin, Venus, appears as a bright white dot in the upper left quadrant of the mosaic, also between the G and E rings. Mars also appears as a faint red dot embedded in the outer edge of the E ring, above and to the left of Venus. For ease of visibility, Earth, Venus, Mars, Enceladus, Epimetheus and Pandora were all brightened by a factor of eight and a half relative to Saturn. Tethys was brightened by a factor of four. In total, 809 background stars are visible and were brightened by a factor ranging from six, for the brightest stars, to 16, for the faintest. The faint outer rings (from the G ring to the E ring) were also brightened relative to the already bright main rings by factors ranging from two to eight, with the lower-phase-angle (and therefore fainter) regions of these rings brightened the most. The brightened version of the mosaic was further brightened and contrast-enhanced all over to accommodate print applications and a wide range of computer-screen viewing conditions. Some ring features -- such as full rings traced out by tiny moons -- do not appear in this version of the mosaic because they require extreme computer enhancement, which would adversely affect the rest of the mosaic. This version was processed for balance and beauty. This view looks toward the unlit side of the rings from about 17 degrees below the ring plane. Cassini was approximately 746,000 miles (1.2 million kilometers) from Saturn when the images in this mosaic were taken. Image scale on Saturn is about 45 miles (72 kilometers) per pixel. This mosaic was made from pictures taken over a span of more than four hours while the planets, moons and stars were all moving relative to Cassini. Thus, due to spacecraft motion, these objects in the locations shown here were not in these specific places over the entire duration of the imaging campaign. Note also that Venus appears far from Earth, as does Mars, because they were on the opposite side of the sun from Earth. http://photojournal.jpl.nasa.gov/catalog/PIA17172
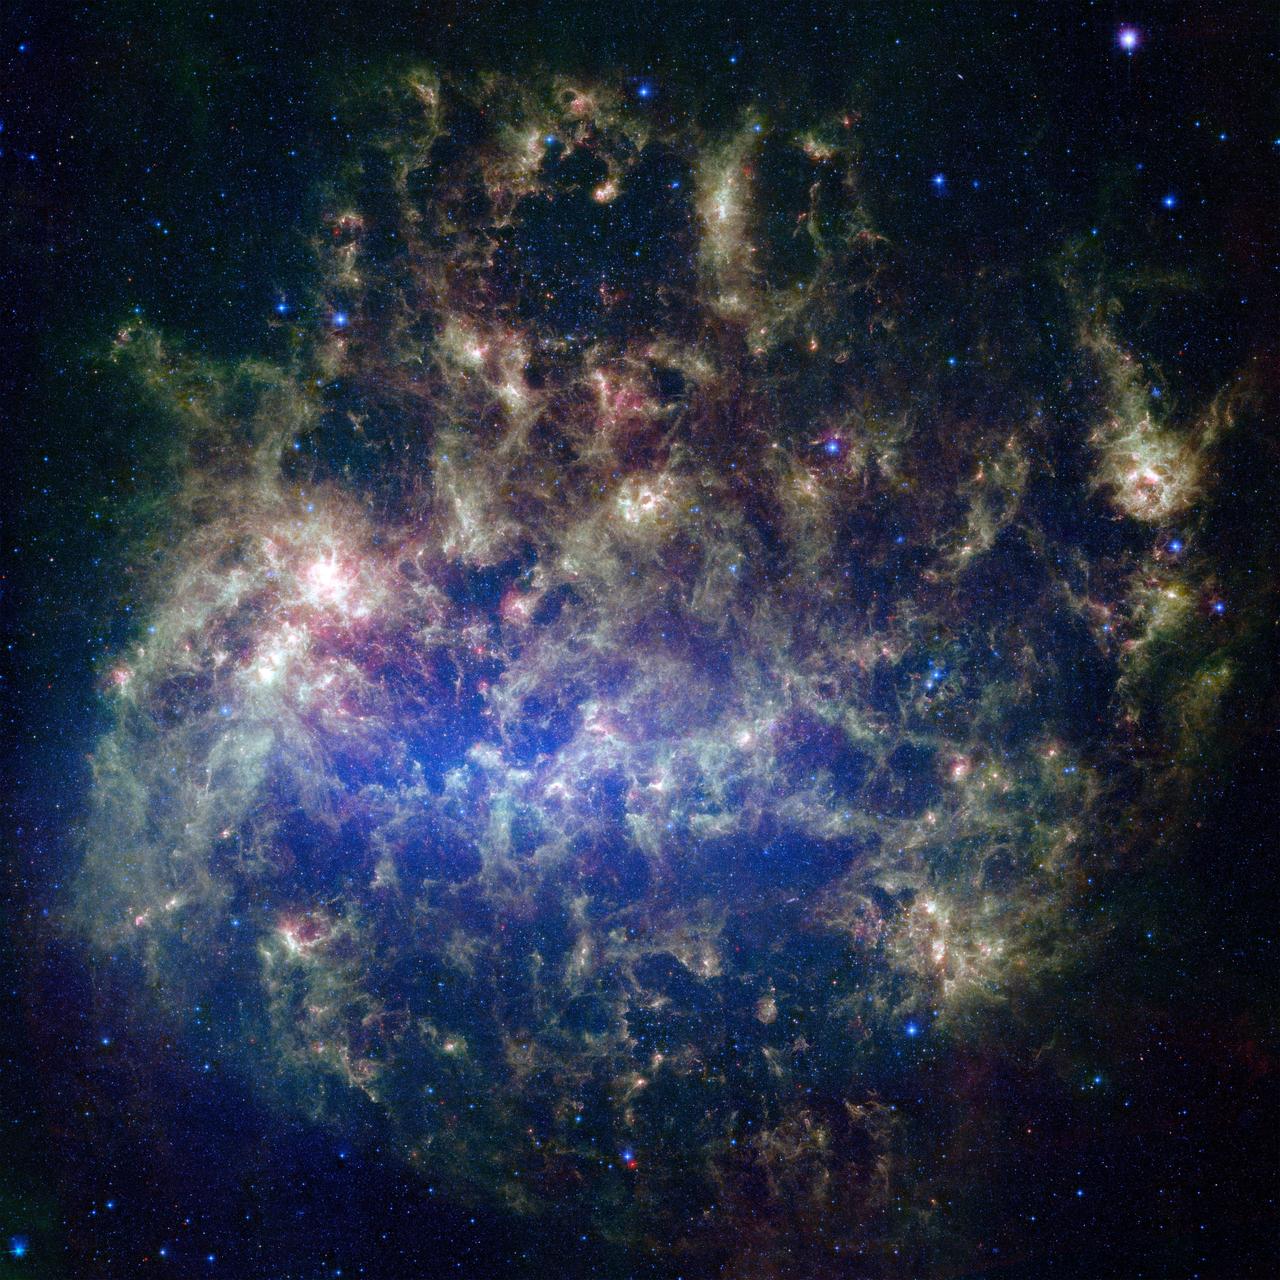
This vibrant image from NASA's Spitzer Space Telescope shows the Large Magellanic Cloud, a satellite galaxy to our own Milky Way galaxy. The infrared image, a mosaic of 300,000 individual tiles, offers astronomers a unique chance to study the lifecycle of stars and dust in a single galaxy. Nearly one million objects are revealed for the first time in this Spitzer view, which represents about a 1,000-fold improvement in sensitivity over previous space-based missions. Most of the new objects are dusty stars of various ages populating the Large Magellanic Cloud; the rest are thought to be background galaxies. The blue color in the picture, seen most prominently in the central bar, represents starlight from older stars. The chaotic, bright regions outside this bar are filled with hot, massive stars buried in thick blankets of dust. The red color around these bright regions is from dust heated by stars, while the red dots scattered throughout the picture are either dusty, old stars or more distant galaxies. The greenish clouds contain cooler interstellar gas and molecular-sized dust grains illuminated by ambient starlight. Astronomers say this image allows them to quantify the process by which space dust -- the same stuff that makes up planets and even people -- is recycled in a galaxy. The picture shows dust at its three main cosmic hangouts: around the young stars, where it is being consumed (red-tinted, bright clouds); scattered about in the space between stars (greenish clouds); and in expelled shells of material from old stars (randomly-spaced red dots). The Large Magellanic Cloud, located 160,000 light-years from Earth, is one of a handful of dwarf galaxies that orbit our own Milky Way. It is approximately one-third as wide as the Milky Way, and, if it could be seen in its entirety, would cover the same amount of sky as a grid of about 480 full moons. About one-third of the entire galaxy can be seen in the Spitzer image. This picture is a composite of infrared light captured by Spitzer. Light with wavelengths of 3.6 (blue) and 8 (green) microns was captured by the telescope's infrared array camera; 24-micron light (red) was detected by the multiband imaging photometer. http://photojournal.jpl.nasa.gov/catalog/PIA07137

NASA Spitzer Space Telescope, formerly known as the Space Infrared Telescope Facility, has captured in stunning detail the spidery filaments and newborn stars of theTarantula Nebula, a rich star-forming region also known as 30 Doradus. This cloud of glowing dust and gas is located in the Large Magellanic Cloud, the nearest galaxy to our own Milky Way, and is visible primarily from the Southern Hemisphere. This image of an interstellar cauldron provides a snapshot of the complex physical processes and chemistry that govern the birth - and death - of stars. At the heart of the nebula is a compact cluster of stars, known as R136, which contains very massive and young stars. The brightest of these blue supergiant stars are up to 100 times more massive than the Sun, and are at least 100,000 times more luminous. These stars will live fast and die young, at least by astronomical standards, exhausting their nuclear fuel in a few million years. The Spitzer Space Telescope image was obtained with an infrared array camera that is sensitive to invisible infrared light at wavelengths that are about ten times longer than visible light. In this four-color composite, emission at 3.6 microns is depicted in blue, 4.5 microns in green, 5.8 microns in orange, and 8.0 microns in red. The image covers a region that is three-quarters the size of the full moon. The Spitzer observations penetrate the dust clouds throughout the Tarantula to reveal previously hidden sites of star formation. Within the luminescent nebula, many holes are also apparent. These voids are produced by highly energetic winds originating from the massive stars in the central star cluster. The structures at the edges of these voids are particularly interesting. Dense pillars of gas and dust, sculpted by the stellar radiation, denote the birthplace of future generations of stars. The Spitzer image provides information about the composition of the material at the edges of the voids. The surface layers closest to the massive stars are subject to the most intense stellar radiation. Here, the atoms are stripped of their electrons, and the green color of these regions is indicative of the radiation from this highly excited, or 'ionized,' material. The ubiquitous red filaments seen throughout the image reveal the presence of molecular material thought to be rich in hydrocarbons. The Tarantula Nebula is the nearest example of a 'starburst' phenomenon, in which intense episodes of star formation occur on massive scales. Most starbursts, however, are associated with dusty and distant galaxies. Spitzer infrared observations of the Tarantula provide astronomers with an unprecedented view of the lifecycle of massive stars and their vital role in regulating the birth of future stellar and planetary systems. http://photojournal.jpl.nasa.gov/catalog/PIA05062
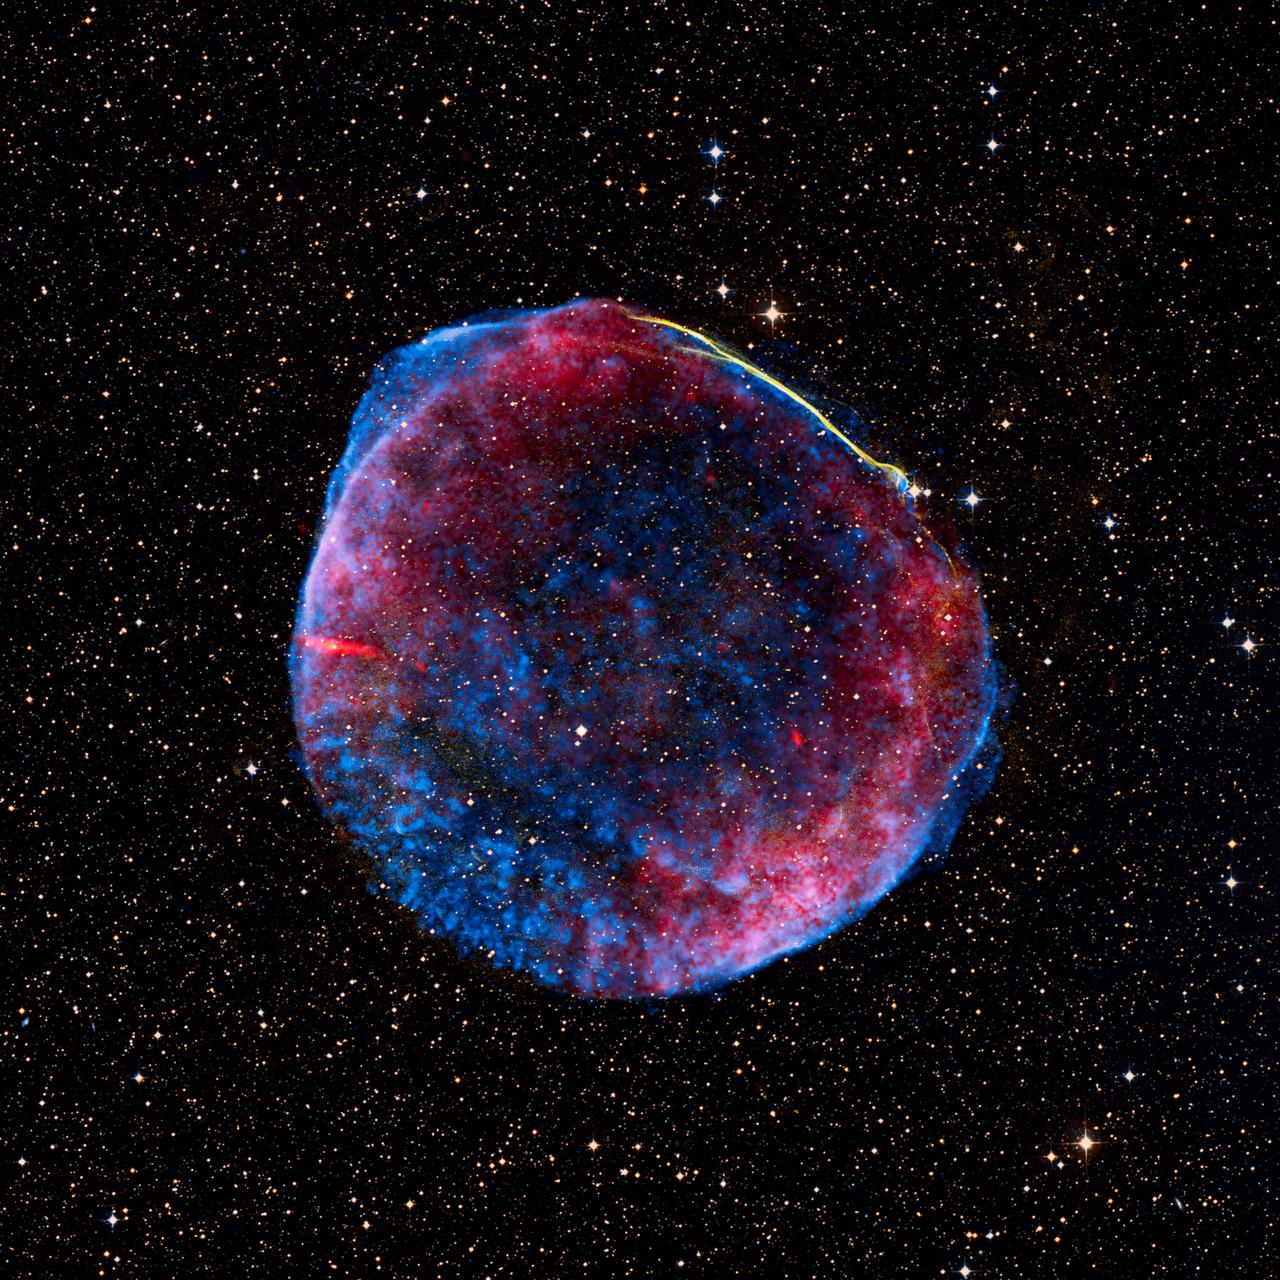
Release date: July 1, 2008 This image is a composite of visible (or optical), radio, and X-ray data of the full shell of the supernova remnant from SN 1006. The radio data show much of the extent that the X-ray image shows. In contrast, only a small linear filament in the northwest corner of the shell is visible in the optical data. The object has an angular size of roughly 30 arcminutes (0.5 degree, or about the size of the full moon), and a physical size of 60 light-years (18 parsecs) based on its distance of nearly 7,000 light-years. The small green box along the bright filament at the top of the image corresponds to the dimensions of the Hubble release image. The optical data was obtained at the University of Michigan's 0.9-meter Curtis Schmidt telescope at the National Science Foundation's Cerro Tololo Inter-American Observatory (CTIO) near La Serena, Chile. H-alpha, continuum-subtracted data were provided by F. Winkler (Middlebury COllege) et al. The X-ray data were acquired from the Chandra X-ray Observatory's AXAF CCD Imaging Spectrometer (ACIS) at 0.5-3keV, and were provided by J. Hughes (Rutgers University) et al. The radio data, supplied by K. Dyer (NRAO, Socorro) et al., were a composite from the National Radio Astronomy Observatory's Very Large Array (NRAO/VLA) in Socorro, New Mexico, along with the Green Bank Telescope (GBT) in Green Bank, West Virginia. Data of the supernova remnant were blended on a visible-light stellar background created using the Digitized Sky Survey's Anglo-Australian Observatory (AAO2) blue and red plates. Photo Credit: NASA, ESA, and Z. Levay (STScI) Science Credit: Radio: NRAO/AUI/NSF GBT+VLA 1.4 GHz mosaic (Dyer, Maddalena and Cornwell, NRAO); X-ray: NASA/CXC/Rutgers/G. Cassam-Chenai and J. Hughes et al.; Optical: F.Winkler/Middlebury College and NOAO/AURA/NSF; and DSS To learn more about the Hubble Space Telescope go here: <a href="http://www.nasa.gov/mission_pages/hubble/main/index.html" rel="nofollow">www.nasa.gov/mission_pages/hubble/main/index.html</a> <b><a href="http://www.nasa.gov/centers/goddard/home/index.html" rel="nofollow">NASA Goddard Space Flight Center</a></b> is home to the nation's largest organization of combined scientists, engineers and technologists that build spacecraft, instruments and new technology to study the Earth, the sun, our solar system, and the universe. <b>Follow us on <a href="http://twitter.com/NASAGoddardPix" rel="nofollow">Twitter</a></b> <b>Join us on <a href="http://www.facebook.com/pages/Greenbelt-MD/NASA-Goddard/395013845897?ref=tsd" rel="nofollow">Facebook</a><b> </b></b>
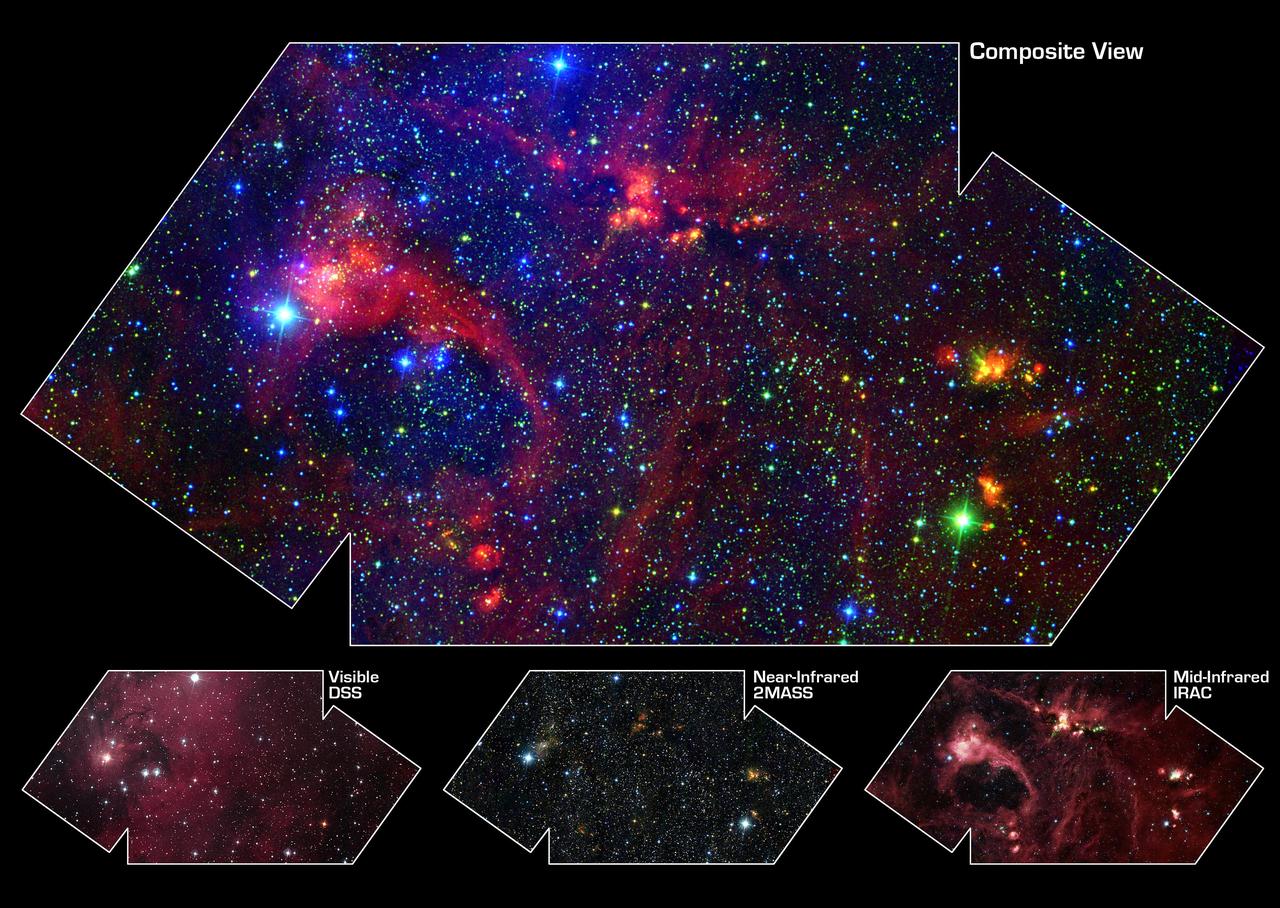
Hidden behind a shroud of dust in the constellation Cygnus is a stellar nursery called DR21, which is giving birth to some of the most massive stars in our galaxy. Visible light images reveal no trace of this interstellar cauldron because of heavy dust obscuration. In fact, visible light is attenuated in DR21 by a factor of more than 10,000,000,000,000,000,000,000,000,000,000,000,000,000 (ten thousand trillion heptillion). New images from NASA's Spitzer Space Telescope allow us to peek behind the cosmic veil and pinpoint one of the most massive natal stars yet seen in our Milky Way galaxy. The never-before-seen star is 100,000 times as bright as the Sun. Also revealed for the first time is a powerful outflow of hot gas emanating from this star and bursting through a giant molecular cloud. The colorful image (top panel) is a large-scale composite mosaic assembled from data collected at a variety of different wavelengths. Views at visible wavelengths appear blue, near-infrared light is depicted as green, and mid-infrared data from the InfraRed Array Camera (IRAC) aboard NASA's Spitzer Space Telescope is portrayed as red. The result is a contrast between structures seen in visible light (blue) and those observed in the infrared (yellow and red). A quick glance shows that most of the action in this image is revealed to the unique eyes of Spitzer. The image covers an area about two times that of a full moon. Each of the constituent images is shown below the large mosaic. The Digital Sky Survey (DSS) image (lower left) provides a familiar view of deep space, with stars scattered around a dark field. The reddish hue is from gas heated by foreground stars in this region. This fluorescence fades away in the near-infrared Two-Micron All-Sky Survey (2MASS) image (lower center), but other features start to appear through the obscuring clouds of dust, now increasingly transparent. Many more stars are discerned in this image because near-infrared light pierces through some of the obscuration of the interstellar dust. Note that some stars seen as very bright in the visible image are muted in the near-infrared image, whereas other stars become more prominent. Embedded nebulae revealed in the Spitzer image are only hinted at in this picture. The Spitzer image (lower right) provides a vivid contrast to the other component images, revealing star-forming complexes and large-scale structures otherwise hidden from view. The Spitzer image is composed of photographs obtained at four wavelengths: 3.6 microns (blue), 4.5 microns (green), 5.8 microns (orange) and 8 microns (red). The brightest infrared cloud near the top center corresponds to DR21, which presumably contains a cluster of newly forming stars at a distance of nearly 10,000 light-years. The red filaments stretching across the Spitzer image denote the presence of polycyclic aromatic hydrocarbons. These organic molecules, comprised of carbon and hydrogen, are excited by surrounding interstellar radiation and become luminescent at wavelengths near 8 microns. The complex pattern of filaments is caused by an intricate combination of radiation pressure, gravity, and magnetic fields. The result is a tapestry in which winds, outflows, and turbulence move and shape the interstellar medium. http://photojournal.jpl.nasa.gov/catalog/PIA05735

This composite picture is a seamless blend of ultra-sharp NASA Hubble Space Telescope (HST) images combined with the wide view of the Mosaic Camera on the National Science Foundation's 0.9-meter telescope at Kitt Peak National Observatory, part of the National Optical Astronomy Observatory, near Tucson, Ariz. Astronomers at the Space Telescope Science Institute assembled these images into a mosaic. The mosaic was then blended with a wider photograph taken by the Mosaic Camera. The image shows a fine web of filamentary "bicycle-spoke" features embedded in the colorful red and blue gas ring, which is one of the nearest planetary nebulae to Earth. Because the nebula is nearby, it appears as nearly one-half the diameter of the full Moon. This required HST astronomers to take several exposures with the Advanced Camera for Surveys to capture most of the Helix. HST views were then blended with a wider photo taken by the Mosaic Camera. The portrait offers a dizzying look down what is actually a trillion-mile-long tunnel of glowing gases. The fluorescing tube is pointed nearly directly at Earth, so it looks more like a bubble than a cylinder. A forest of thousands of comet-like filaments, embedded along the inner rim of the nebula, points back toward the central star, which is a small, super-hot white dwarf. The tentacles formed when a hot "stellar wind" of gas plowed into colder shells of dust and gas ejected previously by the doomed star. Ground-based telescopes have seen these comet-like filaments for decades, but never before in such detail. The filaments may actually lie in a disk encircling the hot star, like a collar. The radiant tie-die colors correspond to glowing oxygen (blue) and hydrogen and nitrogen (red). Valuable Hubble observing time became available during the November 2002 Leonid meteor storm. To protect the spacecraft, including HST's precise mirror, controllers turned the aft end into the direction of the meteor stream for about half a day. Fortunately, the Helix Nebula was almost exactly in the opposite direction of the meteor stream, so Hubble used nine orbits to photograph the nebula while it waited out the storm. To capture the sprawling nebula, Hubble had to take nine separate snapshots. Planetary nebulae like the Helix are sculpted late in a Sun-like star's life by a torrential gush of gases escaping from the dying star. They have nothing to do with planet formation, but got their name because they look like planetary disks when viewed through a small telescope. With higher magnification, the classic "donut-hole" in the middle of a planetary nebula can be resolved. Based on the nebula's distance of 650 light-years, its angular size corresponds to a huge ring with a diameter of nearly 3 light-years. That's approximately three-quarters of the distance between our Sun and the nearest star. The Helix Nebula is a popular target of amateur astronomers and can be seen with binoculars as a ghostly, greenish cloud in the constellation Aquarius. Larger amateur telescopes can resolve the ring-shaped nebula, but only the largest ground-based telescopes can resolve the radial streaks. After careful analysis, astronomers concluded the nebula really isn't a bubble, but is a cylinder that happens to be pointed toward Earth. http://photojournal.jpl.nasa.gov/catalog/PIA18164
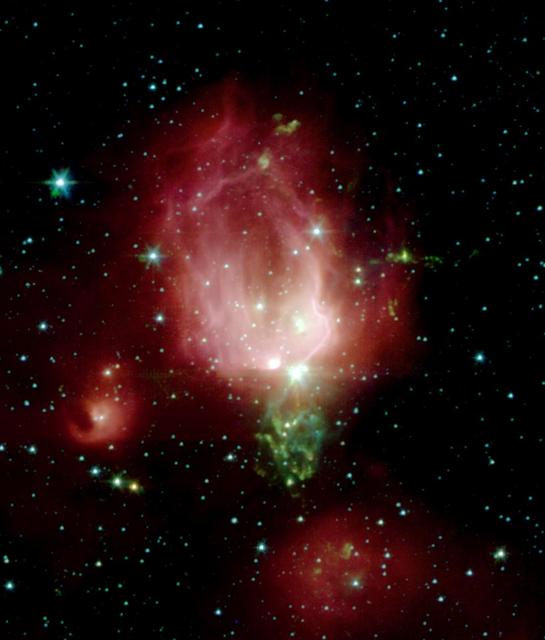
A cluster of newborn stars herald their birth in this interstellar Valentine Day commemorative picture obtained with NASA Spitzer Space Telescope. These bright young stars are found in a rosebud-shaped and rose-colored nebulosity known as NGC 7129. The star cluster and its associated nebula are located at a distance of 3300 light-years in the constellation Cepheus. A recent census of the cluster reveals the presence of 130 young stars. The stars formed from a massive cloud of gas and dust that contains enough raw materials to create a thousand Sun-like stars. In a process that astronomers still poorly understand, fragments of this molecular cloud became so cold and dense that they collapsed into stars. Most stars in our Milky Way galaxy are thought to form in such clusters. The Spitzer Space Telescope image was obtained with an infrared array camera that is sensitive to invisible infrared light at wavelengths that are about ten times longer than visible light. In this four-color composite, emission at 3.6 microns is depicted in blue, 4.5 microns in green, 5.8 microns in orange, and 8.0 microns in red. The image covers a region that is about one quarter the size of the full moon. As in any nursery, mayhem reigns. Within the astronomically brief period of a million years, the stars have managed to blow a large, irregular bubble in the molecular cloud that once enveloped them like a cocoon. The rosy pink hue is produced by glowing dust grains on the surface of the bubble being heated by the intense light from the embedded young stars. Upon absorbing ultraviolet and visible-light photons produced by the stars, the surrounding dust grains are heated and re-emit the energy at the longer infrared wavelengths observed by Spitzer. The reddish colors trace the distribution of molecular material thought to be rich in hydrocarbons. The cold molecular cloud outside the bubble is mostly invisible in these images. However, three very young stars near the center of the image are sending jets of supersonic gas into the cloud. The impact of these jets heats molecules of carbon monoxide in the cloud, producing the intricate green nebulosity that forms the stem of the rosebud. Not all stars are formed in clusters. Away from the main nebula and its young cluster are two smaller nebulae, to the left and bottom of the central 'rosebud,'each containing a stellar nursery with only a few young stars. Astronomers believe that our own Sun may have formed billions of years ago in a cluster similar to NGC 7129. Once the radiation from new cluster stars destroys the surrounding placental material, the stars begin to slowly drift apart. http://photojournal.jpl.nasa.gov/catalog/PIA05266
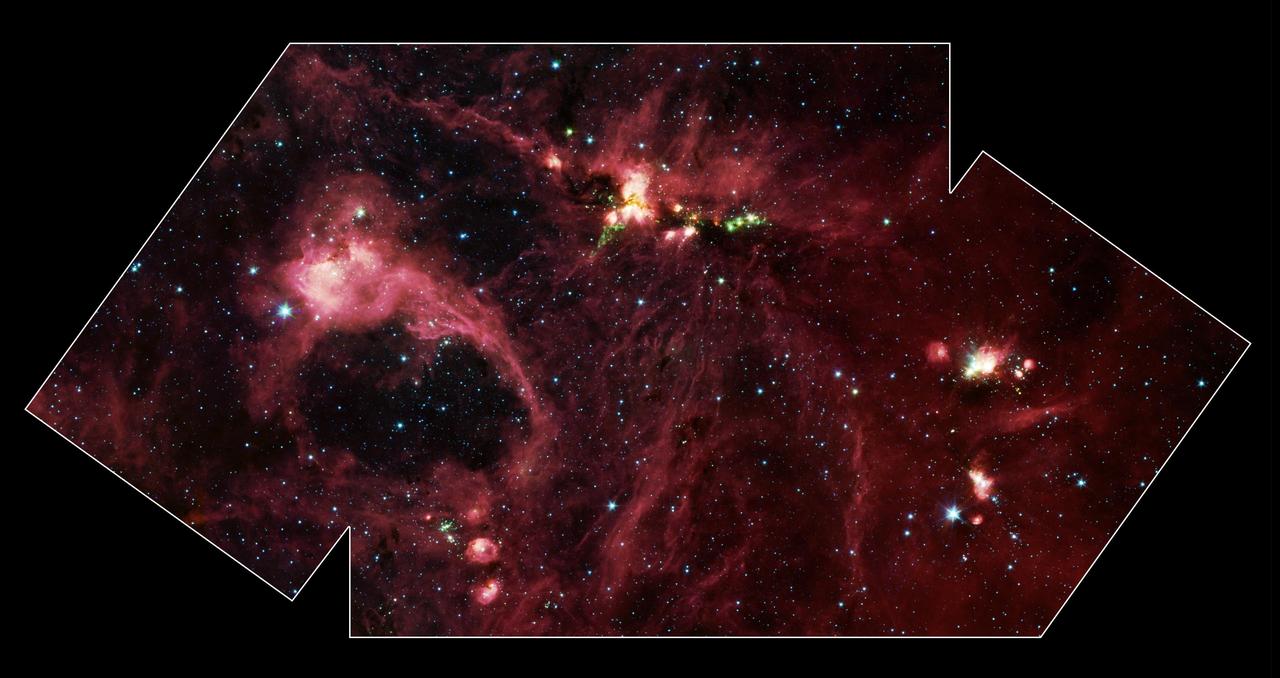
Hidden behind a shroud of dust in the constellation Cygnus is a stellar nursery called DR21, which is giving birth to some of the most massive stars in our galaxy. Visible light images reveal no trace of this interstellar cauldron because of heavy dust obscuration. In fact, visible light is attenuated in DR21 by a factor of more than 10,000,000,000,000,000,000,000,000,000,000,000,000,000 (ten thousand trillion heptillion). New images from NASA's Spitzer Space Telescope allow us to peek behind the cosmic veil and pinpoint one of the most massive natal stars yet seen in our Milky Way galaxy. The never-before-seen star is 100,000 times as bright as the Sun. Also revealed for the first time is a powerful outflow of hot gas emanating from this star and bursting through a giant molecular cloud. This image is a large-scale mosaic assembled from individual photographs obtained with the InfraRed Array Camera (IRAC) aboard Spitzer. The image covers an area about two times that of a full moon. The mosaic is a composite of images obtained at mid-infrared wavelengths of 3.6 microns (blue), 4.5 microns (green), 5.8 microns (orange) and 8 microns (red). The brightest infrared cloud near the top center corresponds to DR21, which presumably contains a cluster of newly forming stars at a distance of 10,000 light-years. Protruding out from DR21 toward the bottom left of the image is a gaseous outflow (green), containing both carbon monoxide and molecular hydrogen. Data from the Spitzer spectrograph, which breaks light into its constituent individual wavelengths, indicate the presence of hot steam formed as the outflow heats the surrounding molecular gas. Outflows are physical signatures of processes that create supersonic beams, or jets, of gas. They are usually accompanied by discs of material around the new star, which likely contain the materials from which future planetary systems are formed. Additional newborn stars, depicted in green, can be seen surrounding the DR21 region. The red filaments stretching across this image denote the presence of polycyclic aromatic hydrocarbons. These organic molecules, comprised of carbon and hydrogen, are excited by surrounding interstellar radiation and become luminescent at wavelengths near 8.0 microns. The complex pattern of filaments is caused by an intricate combination of radiation pressure, gravity and magnetic fields. The result is a tapestry in which winds, outflows and turbulence move and shape the interstellar medium. To the lower left of the mosaic is a large bubble of gas and dust, which may represent the remnants of a past generation of stars. http://photojournal.jpl.nasa.gov/catalog/PIA05732
![In celebration of the International Year of Astronomy 2009, NASA's Great Observatories -- the Hubble Space Telescope, the Spitzer Space Telescope, and the Chandra X-ray Observatory -- have produced a matched trio of images of the central region of our Milky Way galaxy. Each image shows the telescope's different wavelength view of the galactic center region, illustrating the unique science each observatory conducts. In this spectacular image, observations using infrared light and X-ray light see through the obscuring dust and reveal the intense activity near the galactic core. Note that the center of the galaxy is located within the bright white region to the right of and just below the middle of the image. The entire image width covers about one-half a degree, about the same angular width as the full moon. Spitzer's infrared-light observations provide a detailed and spectacular view of the galactic center region [Figure 1 (top frame of poster)]. The swirling core of our galaxy harbors hundreds of thousands of stars that cannot be seen in visible light. These stars heat the nearby gas and dust. These dusty clouds glow in infrared light and reveal their often dramatic shapes. Some of these clouds harbor stellar nurseries that are forming new generations of stars. Like the downtown of a large city, the center of our galaxy is a crowded, active, and vibrant place. Although best known for its visible-light images, Hubble also observes over a limited range of infrared light [Figure 2 (middle frame of poster)]. The galactic center is marked by the bright patch in the lower right. Along the left side are large arcs of warm gas that have been heated by clusters of bright massive stars. In addition, Hubble uncovered many more massive stars across the region. Winds and radiation from these stars create the complex structures seen in the gas throughout the image.This sweeping panorama is one of the sharpest infrared pictures ever made of the galactic center region. X-rays detected by Chandra expose a wealth of exotic objects and high-energy features [Figure 3 (bottom frame of poster)]. In this image, pink represents lower energy X-rays and blue indicates higher energy. Hundreds of small dots show emission from material around black holes and other dense stellar objects. A supermassive black hole -- some four million times more massive than the Sun -- resides within the bright region in the lower right. The diffuse X-ray light comes from gas heated to millions of degrees by outflows from the supermassive black hole, winds from giant stars, and stellar explosions. This central region is the most energetic place in our galaxy. http://photojournal.jpl.nasa.gov/catalog/PIA12348](https://images-assets.nasa.gov/image/PIA12348/PIA12348~medium.jpg)
In celebration of the International Year of Astronomy 2009, NASA's Great Observatories -- the Hubble Space Telescope, the Spitzer Space Telescope, and the Chandra X-ray Observatory -- have produced a matched trio of images of the central region of our Milky Way galaxy. Each image shows the telescope's different wavelength view of the galactic center region, illustrating the unique science each observatory conducts. In this spectacular image, observations using infrared light and X-ray light see through the obscuring dust and reveal the intense activity near the galactic core. Note that the center of the galaxy is located within the bright white region to the right of and just below the middle of the image. The entire image width covers about one-half a degree, about the same angular width as the full moon. Spitzer's infrared-light observations provide a detailed and spectacular view of the galactic center region [Figure 1 (top frame of poster)]. The swirling core of our galaxy harbors hundreds of thousands of stars that cannot be seen in visible light. These stars heat the nearby gas and dust. These dusty clouds glow in infrared light and reveal their often dramatic shapes. Some of these clouds harbor stellar nurseries that are forming new generations of stars. Like the downtown of a large city, the center of our galaxy is a crowded, active, and vibrant place. Although best known for its visible-light images, Hubble also observes over a limited range of infrared light [Figure 2 (middle frame of poster)]. The galactic center is marked by the bright patch in the lower right. Along the left side are large arcs of warm gas that have been heated by clusters of bright massive stars. In addition, Hubble uncovered many more massive stars across the region. Winds and radiation from these stars create the complex structures seen in the gas throughout the image.This sweeping panorama is one of the sharpest infrared pictures ever made of the galactic center region. X-rays detected by Chandra expose a wealth of exotic objects and high-energy features [Figure 3 (bottom frame of poster)]. In this image, pink represents lower energy X-rays and blue indicates higher energy. Hundreds of small dots show emission from material around black holes and other dense stellar objects. A supermassive black hole -- some four million times more massive than the Sun -- resides within the bright region in the lower right. The diffuse X-ray light comes from gas heated to millions of degrees by outflows from the supermassive black hole, winds from giant stars, and stellar explosions. This central region is the most energetic place in our galaxy. http://photojournal.jpl.nasa.gov/catalog/PIA12348
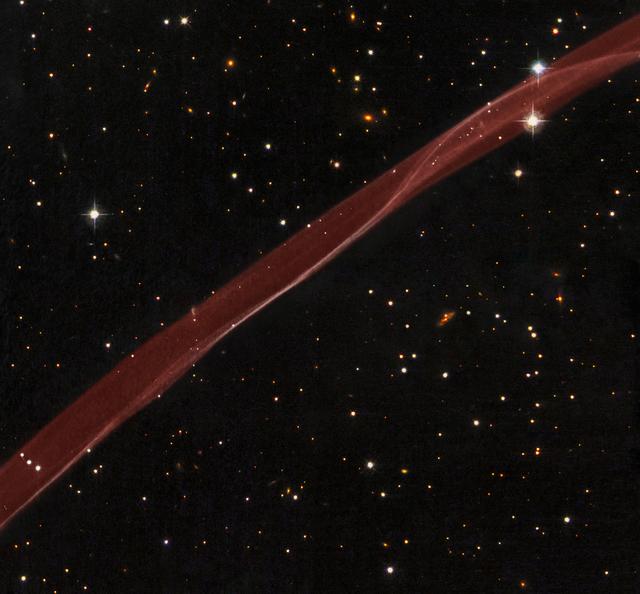
Release date: July 1, 2008 SN 1006 Supernova Remnant (Hubble) A delicate ribbon of gas floats eerily in our galaxy. A contrail from an alien spaceship? A jet from a black-hole? Actually this image, taken by NASA's Hubble Space Telescope, is a very thin section of a supernova remnant caused by a stellar explosion that occurred more than 1,000 years ago. On or around May 1, 1006 A.D., observers from Africa to Europe to the Far East witnessed and recorded the arrival of light from what is now called SN 1006, a tremendous supernova explosion caused by the final death throes of a white dwarf star nearly 7,000 light-years away. The supernova was probably the brightest star ever seen by humans, and surpassed Venus as the brightest object in the night time sky, only to be surpassed by the moon. It was visible even during the day for weeks, and remained visible to the naked eye for at least two and a half years before fading away. It wasn't until the mid-1960s that radio astronomers first detected a nearly circular ring of material at the recorded position of the supernova. The ring was almost 30 arcminutes across, the same angular diameter as the full moon. The size of the remnant implied that the blast wave from the supernova had expanded at nearly 20 million miles per hour over the nearly 1,000 years since the explosion occurred. In 1976, the first detection of exceedingly faint optical emission of the supernova remnant was reported, but only for a filament located on the northwest edge of the radio ring. A tiny portion of this filament is revealed in detail by the Hubble observation. The twisting ribbon of light seen by Hubble corresponds to locations where the expanding blast wave from the supernova is now sweeping into very tenuous surrounding gas. The hydrogen gas heated by this fast shock wave emits radiation in visible light. Hence, the optical emission provides astronomers with a detailed "snapshot" of the actual position and geometry of the shock front at any given time. Bright edges within the ribbon correspond to places where the shock wave is seen exactly edge on to our line of sight. Today we know that SN 1006 has a diameter of nearly 60 light-years, and it is still expanding at roughly 6 million miles per hour. Even at this tremendous speed, however, it takes observations typically separated by years to see significant outward motion of the shock wave against the grid of background stars. In the Hubble image as displayed, the supernova would have occurred far off the lower right corner of the image, and the motion would be toward the upper left. SN 1006 resides within our Milky Way Galaxy. Located more than 14 degrees off the plane of the galaxy's disk, there is relatively little confusion with other foreground and background objects in the field when trying to study this object. In the Hubble image, many background galaxies (orange extended objects) far off in the distant universe can be seen dotting the image. Most of the white dots are foreground or background stars in our Milky Way galaxy. This image is a composite of hydrogen-light observations taken with Hubble's Advanced Camera for Surveys in February 2006 and Wide Field Planetary Camera 2 observations in blue, yellow-green, and near-infrared light taken in April 2008. The supernova remnant, visible only in the hydrogen-light filter was assigned a red hue in the Heritage color image. Credit: NASA, ESA, and the Hubble Heritage Team (STScI/AURA) Acknowledgment: W. Blair (Johns Hopkins University) To learn more about the Hubble Space Telescope go here: <a href="http://www.nasa.gov/mission_pages/hubble/main/index.html" rel="nofollow">www.nasa.gov/mission_pages/hubble/main/index.html</a> <b><a href="http://www.nasa.gov/audience/formedia/features/MP_Photo_Guidelines.html" rel="nofollow">NASA image use policy.</a></b> <b><a href="http://www.nasa.gov/centers/goddard/home/index.html" rel="nofollow">NASA Goddard Space Flight Center</a></b> enables NASA’s mission through four scientific endeavors: Earth Science, Heliophysics, Solar System Exploration, and Astrophysics. Goddard plays a leading role in NASA’s accomplishments by contributing compelling scientific knowledge to advance the Agency’s mission. <b>Follow us on <a href="http://twitter.com/NASAGoddardPix" rel="nofollow">Twitter</a></b> <b>Like us on <a href="http://www.facebook.com/pages/Greenbelt-MD/NASA-Goddard/395013845897?ref=tsd" rel="nofollow">Facebook</a></b> <b>Find us on <a href="http://instagram.com/nasagoddard?vm=grid" rel="nofollow">Instagram</a></b>