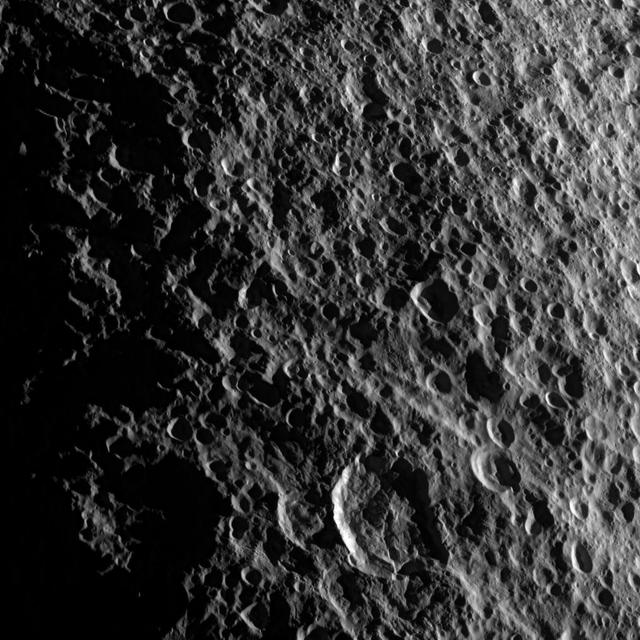
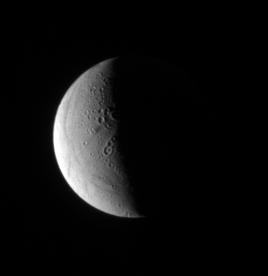
Geologic faults among craters on Saturn moon Tethys are depicted in this image captured during a flyby of the moon by NASA Cassini spacecraft on Aug. 14, 2010.
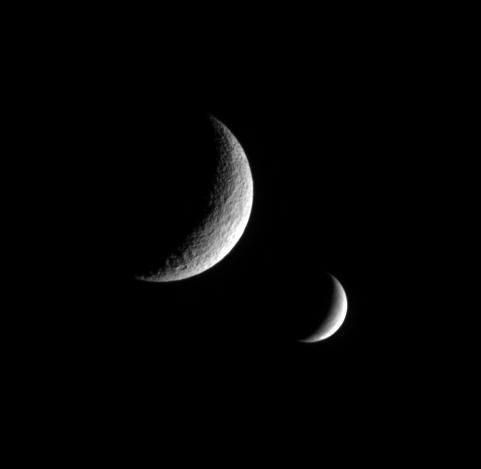
NASACassini spacecraft captures this dual portrait of an apparently dead moon and one that is very much alive. Tethys, shows no signs of recent geologic activity. Enceladus, however, is covered in fractures and faults and spews icy particles into space
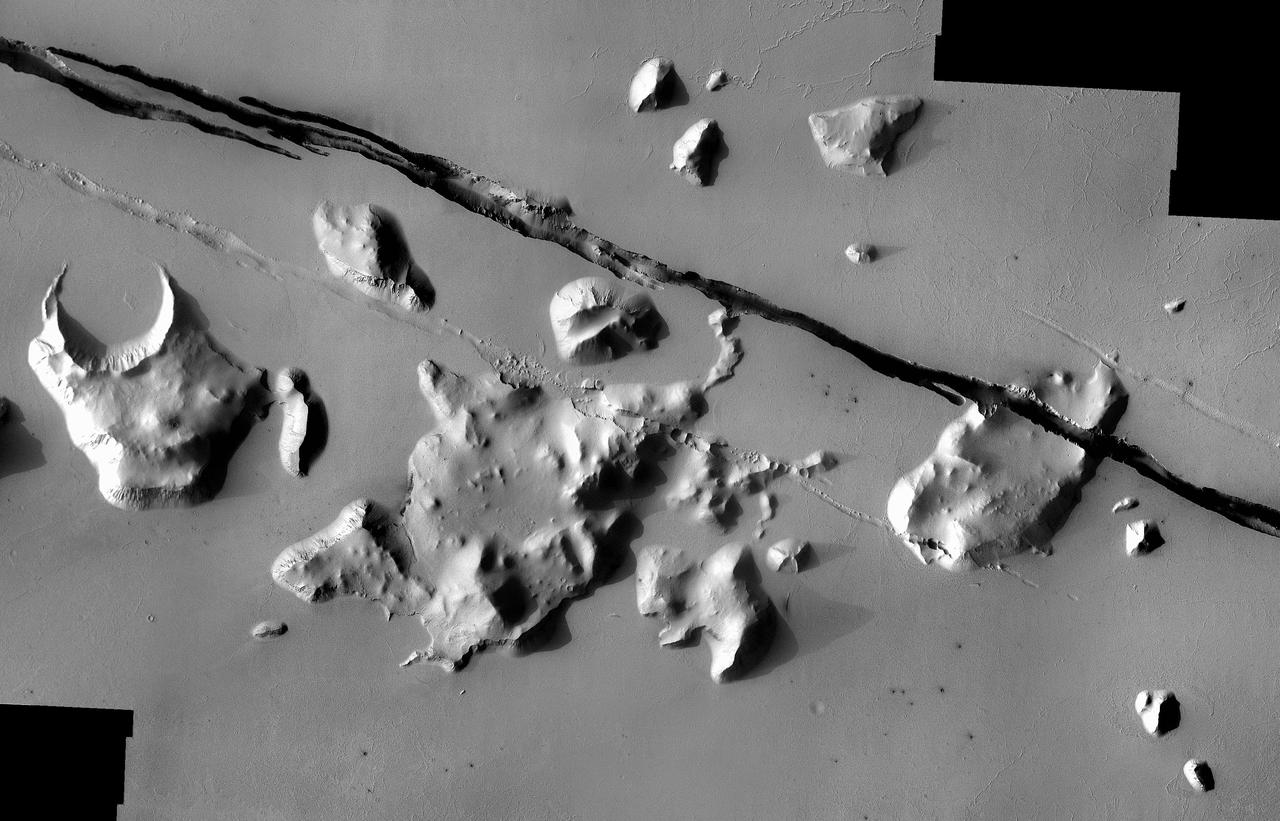
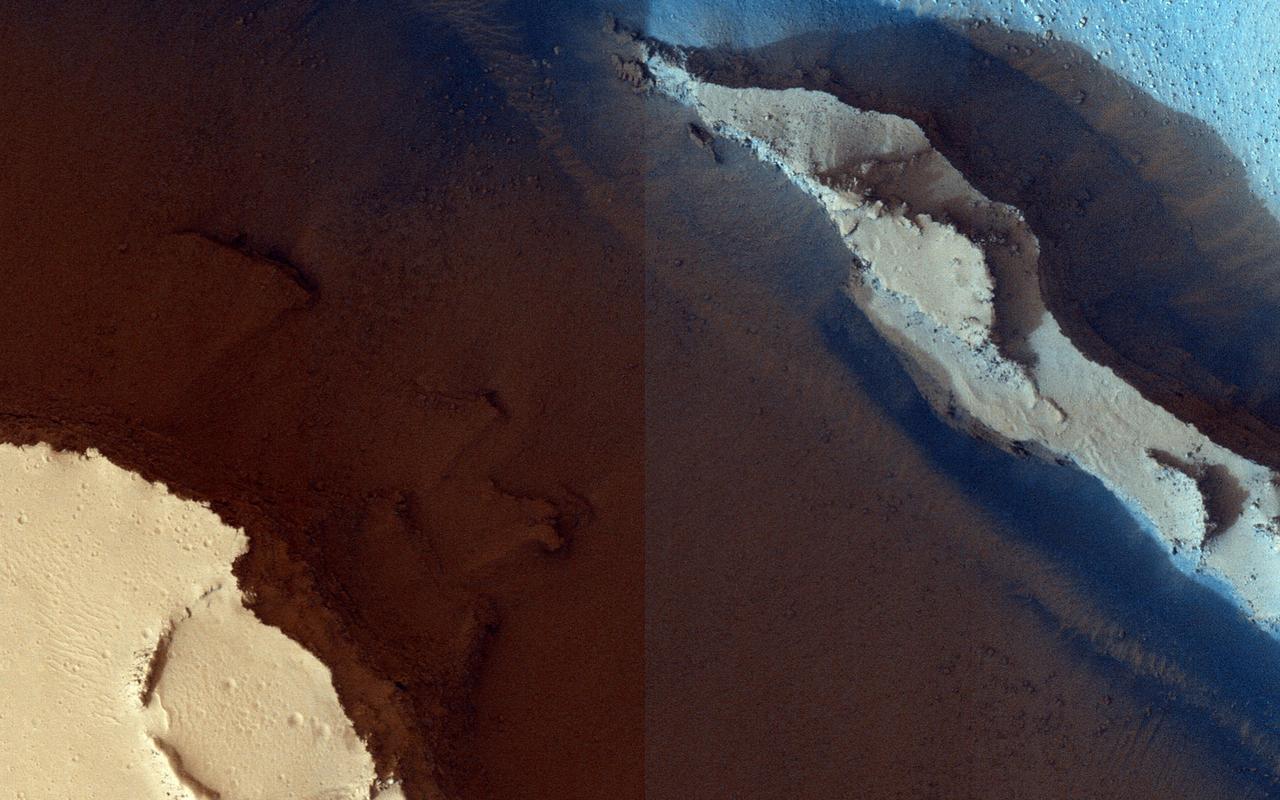
Geological faulting has opened cracks in the Cerberus region that slice through flat plains and mesas alike. This image is part of an All Star set marking the occasion of NASA Mars Odyssey as the longest-working Mars spacecraft in history.
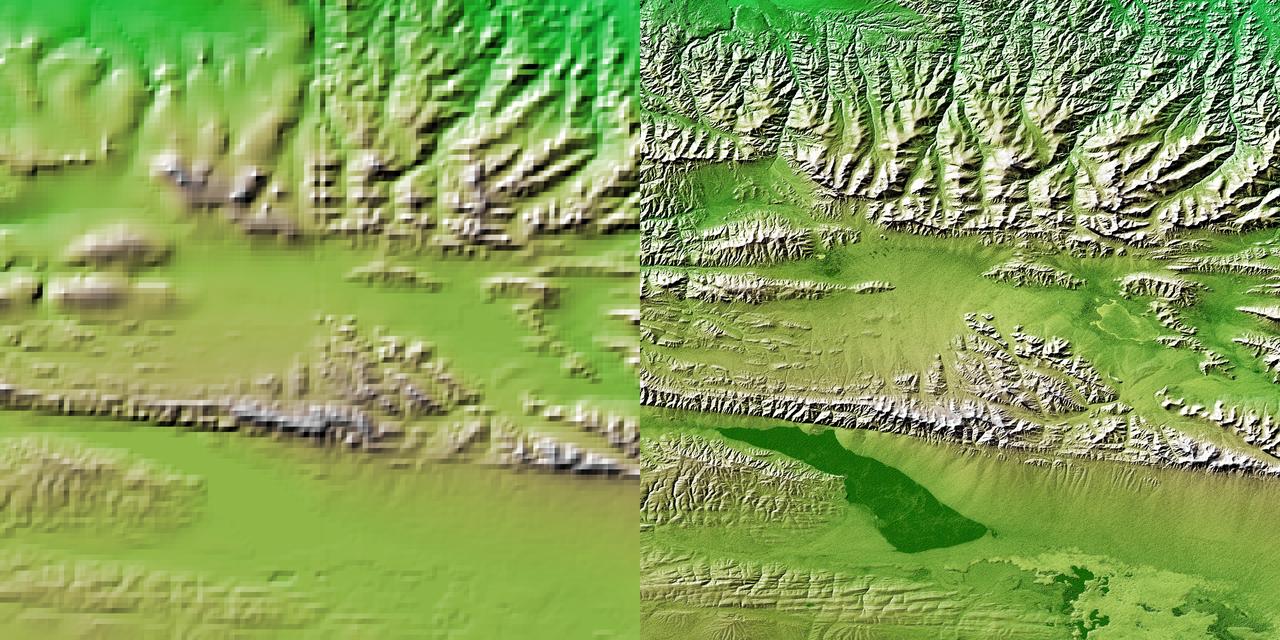
These two images show exactly the same area, part of the Kunlun fault in northern Tibet. The image on the left was created using the best global topographic data set previously available, the U.S. Geological Survey GTOPO30.
Looking down onto the northern hemisphere of geologically complex Enceladus, the Cassini spacecraft spies softened, or relaxed, craters and east-west trending fractures and faults.
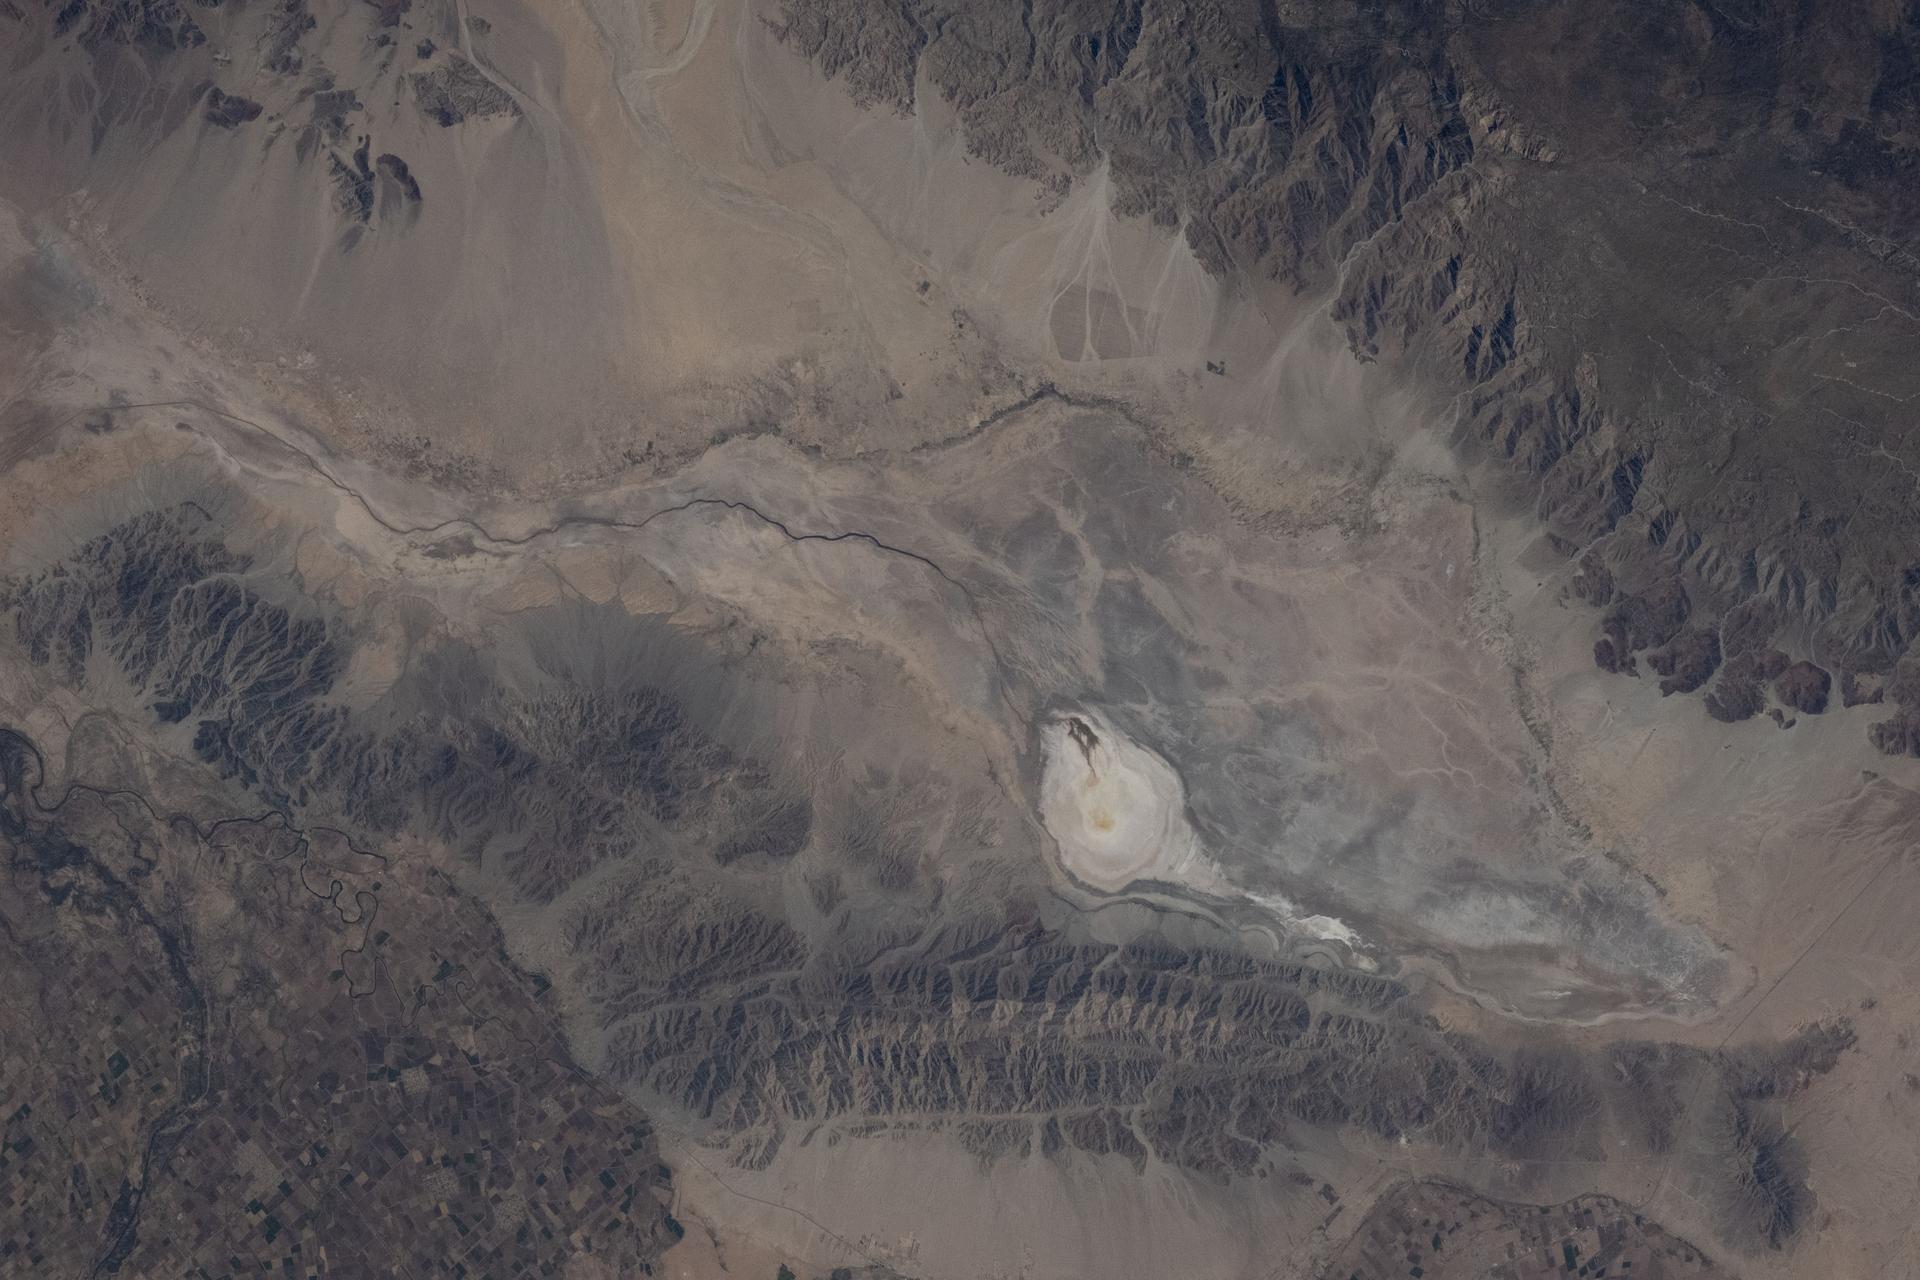
iss073e0886770 (Oct. 1, 2025) --- Laguna Salada is a dry lakebed in the Baja California portion of the Sonoran Desert, located near the geologically active San Andreas Fault system. The International Space Station was orbiting 261 miles above Earth when this image was taken.
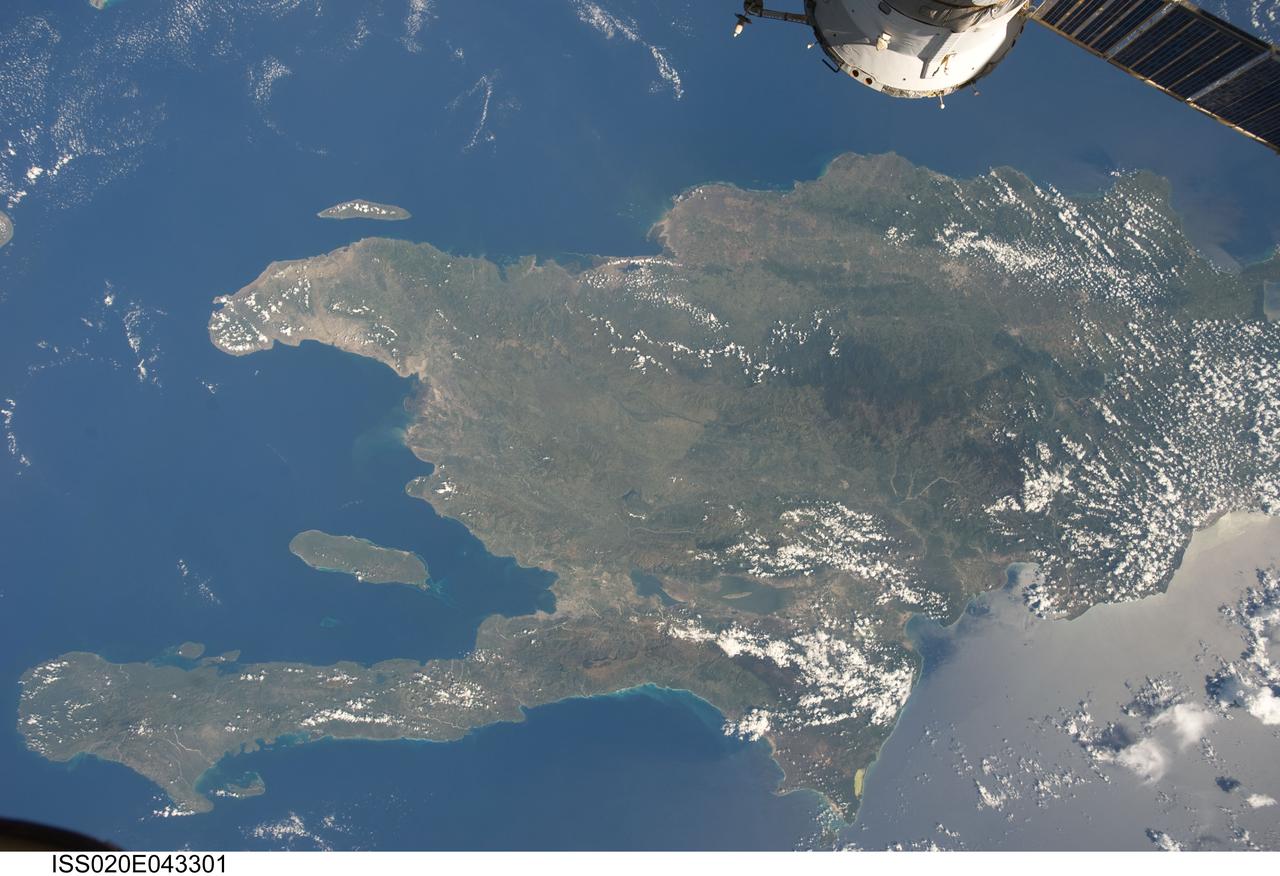
ISS020-E-043301 (28 Sept. 2009) ?-- A view of the Caribbean island of Hispaniola from the International Space Station. This island is comprised of Haiti (in the center left of the image) and the Dominican Republic and is part of the Greater Antilles island chain which lies along the geological boarder of the North America Plate and the Caribbean Plate. A major fault line in the region, Enriquillo-Plantain Garden Fault, runs along the longer peninsula, in the foreground, and just south of Port-Au-Prince. Part of a docked Russian spacecraft can be seen in the foreground. The epicenter of the recent disastrous earthquake occurred near this fault. This image was taken by the Expedition 20 crew on the International Space Station on Sept. 28, 2009 using a 25 mm lens setting.
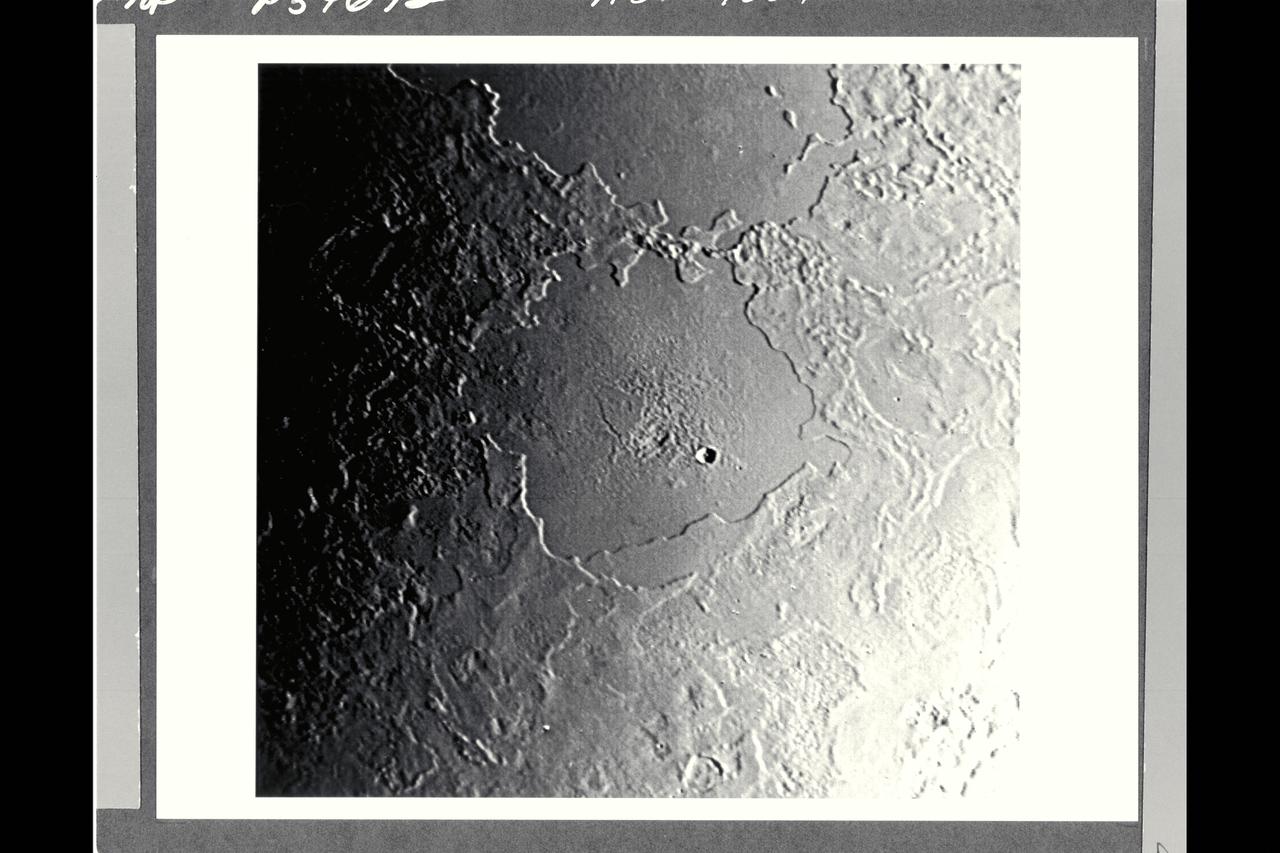
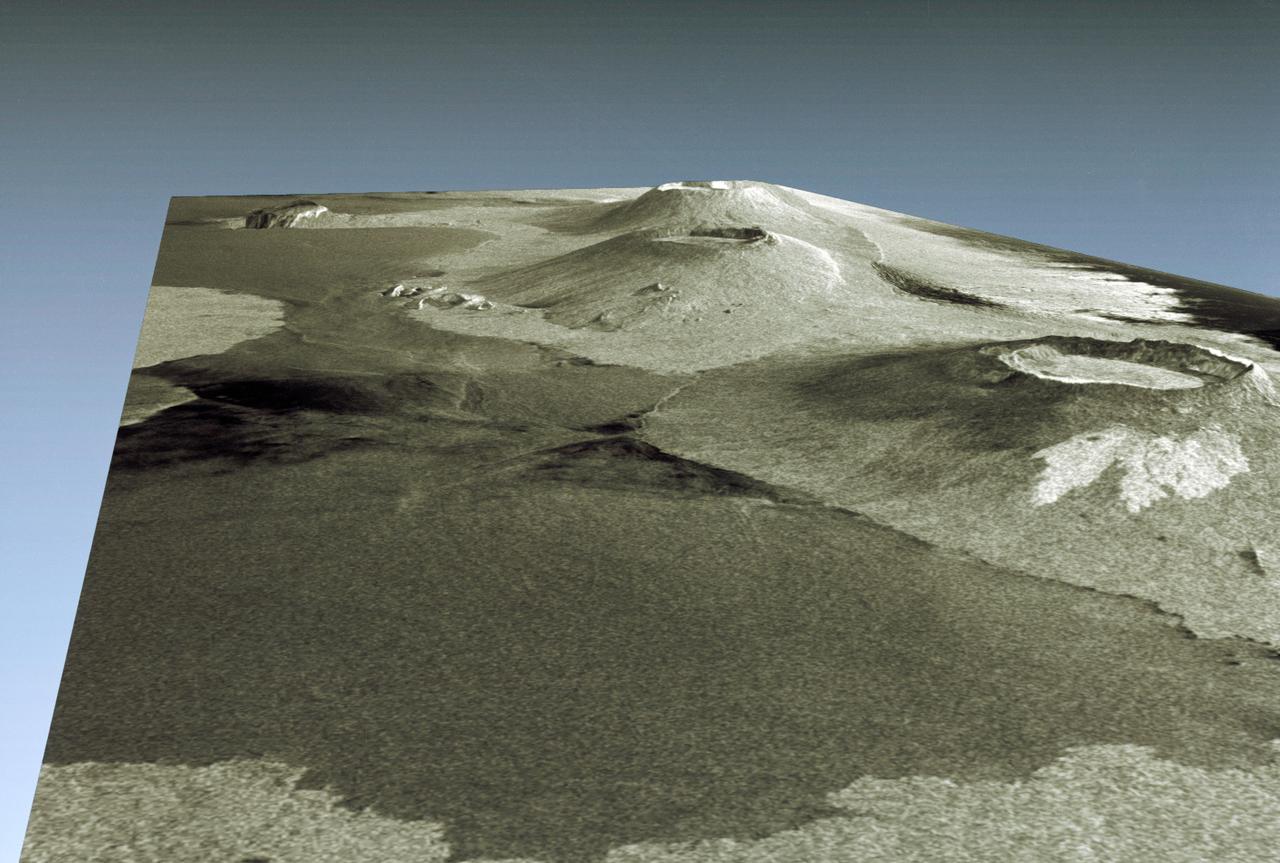
P-34692 Range : 500 km. ( 300 miles ) Smallest Resolvable Feature : 900 m. or 2,700 ft. Part of Triton's complex geological history canbe seen in this image, shot by Voyager 2. Part of a sequence, this photograph encompasses two depressions, possibly old impact basins, that have been extensively modified by floodind, melting, faulting, and collapse. Several episodes of filling and partial removal of material appear to have occurred. The rough area in the middle of the bottom depression probably marks the most recent eruption of material. Only a few impact craters dot the area, which shows the dominance of internally driven geologic processes on Triton.
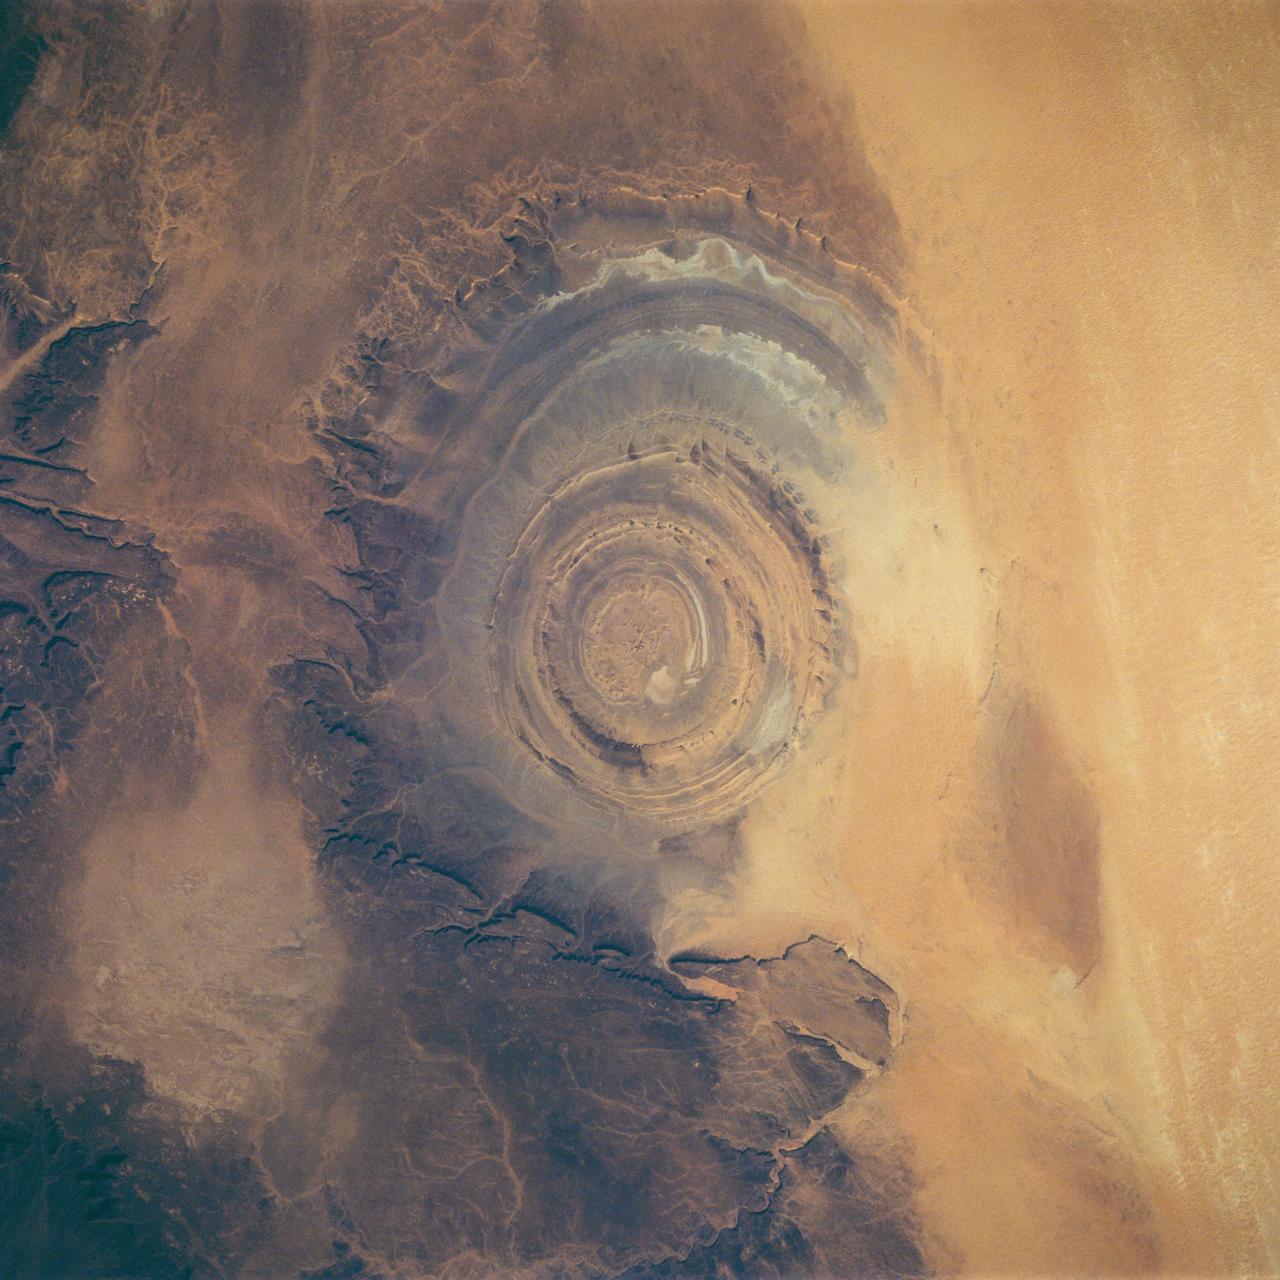
STS058-88-017 (18 Oct-1 Nov 1993) --- The eye-catching "bullseye" of the Richat Structure adds interest to the barren Gres de Chinguetti Plateau in central Mauretania, northwest Africa. It represents domally uplifted, layered (sedimentary) rocks that have been eroded by water and wind into the present shape. Desert sands have invaded the feature from the south. The origin of the structure is unknown. It is not an impact structure, because field work showed that strata are undisturbed and flat-lying in the middle of the feature, and no shock-altered rock could be found. There is no evidence for a salt dome or shale diapir, nor is there any geophysical evidence for an underlying dome of dense igneous rock having about the same density as the sedimentary layers.
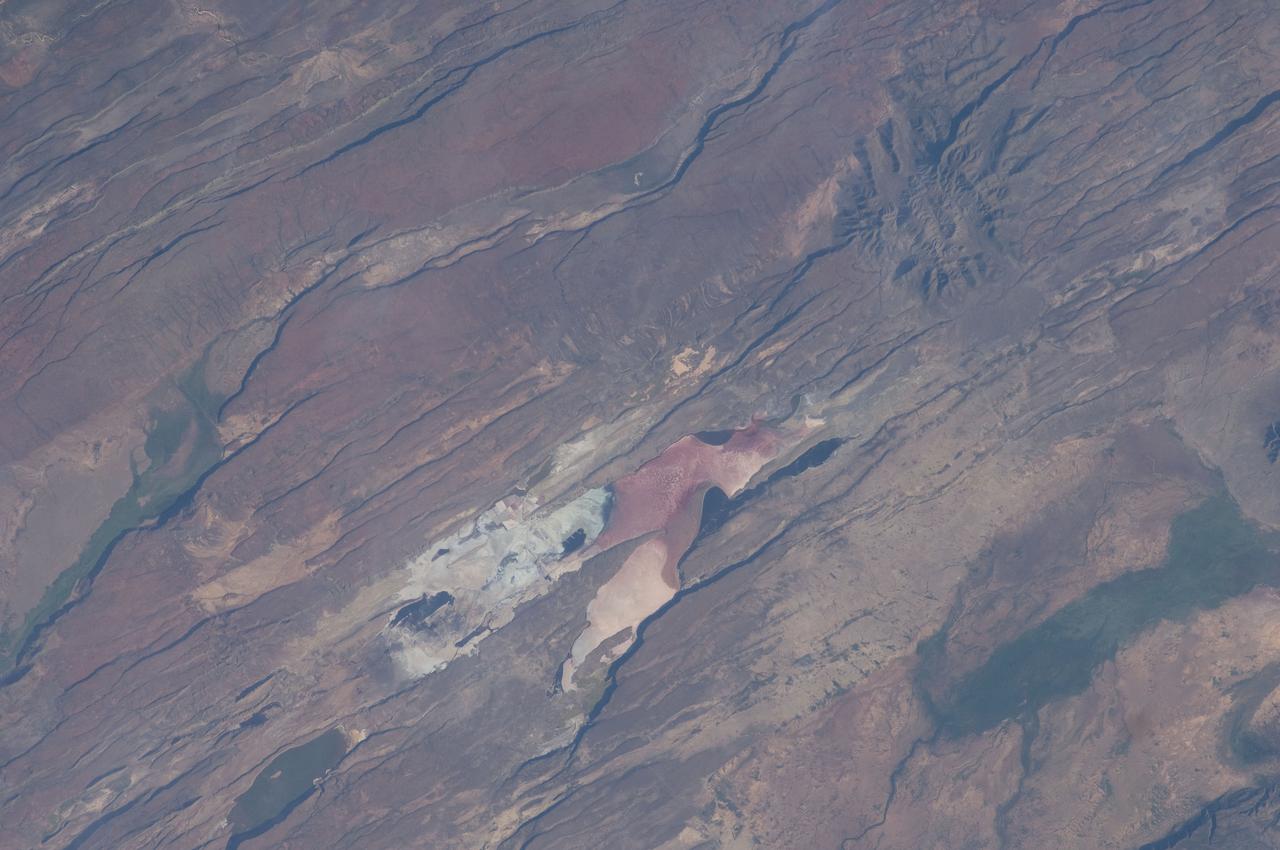
ISS030-E-035487 (14 Jan. 2012) --- The East African Rift Valley in Kenya is featured in this image photographed by an Expedition 30 crew member on the International Space Station. This photograph highlights classical geological structures associated with a tectonic rift valley, in this case the Eastern Branch of the East African Rift near Kenya’s southern border with Tanzania and just south of the Equator. The East African Rift is one of the great tectonic features of Africa, caused by fracturing of Earth’s crust. The Nubian (or African) plate includes the older continental crust of Africa to the west, while the Somalian plate that is moving away includes the Horn of Africa to the northeast; the tectonic boundary stretches from the southern Red Sea to central Mozambique. Landscapes in the rift valley can appear confusing. The most striking features in this view are the numerous, nearly parallel, linear fault lines that occupy the floor of the valley (most of the image). Shadows cast by the late afternoon sun make the fault scarps (steps in the landscape caused by slip motion along individual faults) more prominent. The faults are aligned with the north-south axis of the valley (lower left to top right). A secondary trend of less linear faults cuts the main fault trend at an acute angle, the fault steps throwing large shadows. The Eastern Branch of the East African Rift is arid (compared with the Western Branch which lies on the border of the Congolese rainforest). Evidence of this can be seen in the red, salt-loving algae of the shallow and salty Lake Magadi (center). A neighboring small lake to the north has deeper water and appears dark in the image. The white salt deposits of the dry part of the Lake Magadi floor (center) host a few small commercial salt pans. The lakes appear to be located where the main and secondary fault trends intersect. The East African rift system is marked by substantial volcanic activity, including lavas erupted from fissures along the rift in the region. Much of the faulting observed in this image cuts through such lavas. Elsewhere along the rift system individual volcanoes form. Some of those volcanoes are very large, including Mt. Kilimanjaro and Mt. Kenya. In this image, rising 400 meters above the valley floor, a volcano appears to be superimposed on the faults—indicating that the volcano is younger than the faults it covers. Deeply eroded slopes also suggest that the volcano has not been active for a long time. The largest vegetated area (lower left)—in an desert zone with no vegetation visible to the naked eye from space—is the green floor of a valley which drains an area large enough for water to exist near the surface so that plants can thrive. For a sense of scale, the vegetated valley floor is 17 kilometers long (10.5 miles).
The trenches or fossae are found in Athabasca Valles as seen by NASA Mars Reconnaissance Orbiter. These trenches or "fossae" are about a kilometer (0.62 miles) across. This area shows where two segments have joined up and are close to a third section. The fossae are probably areas where the surface has collapsed down into voids made from faults (huge cracks with movement on either side) that don't extend up to the surface. In structural geology, when multiple faults are closely spaced, we call that a relay zone. These zones have much higher stress built up in the crust and consequently tend to be more fractured. These fractures can serve as "pipes" for fluids (water, lava, gases) to flow through. This area corresponds with the youngest of Mars' giant outflow channels, Athabasca Valles, that is only 2 to 20 million years old and shows geologic evidence of having been formed and modified jointly by water and lava. http://photojournal.jpl.nasa.gov/catalog/PIA19300
ISS028-E-044433 (8 Sept. 2011) --- Bigach Impact Crater in Kazakhstan is featured in this image photographed by an Expedition 28 crew member on the International Space Station. Some meteor impact craters, like Barringer Crater in Arizona, are easily recognizable on the landscape due to well-preserved form and features. Other impact structures, such as Bigach Impact Crater in northeastern Kazakhstan are harder to recognize due to their age, modification by subsequent geologic processes, or even human alteration of the landscape. According to scientists, at approximately 5 million years old, Bigach is a relatively young geologic feature; however active tectonic processes in the region have caused movement of parts of the structure along faults, leading to a somewhat angular appearance (center). The roughly circular rim of the eight kilometers in diameter structure is still discernable around the relatively flat interior in this photograph. In addition to modification by faulting and erosion, the interior of the impact structure has also been used for agricultural activities, as indicated by the presence of tan regular graded fields. Other rectangular agricultural fields are visible to the northeast and east. The closest settlement, Novopavlovka, is barely visible near the top of the image.

Range : 170,000 km. ( 105,000 mi. ) Resolution : 3 km. ( 2 mi. ) P-29523C This Voyager 2 photograph of the Uranian Moon Ariel, is the best quality to date. This view of Ariel's southern hemisphere is a composite of photographs taken through green, blue, and violet filters from the narrow angle camera. Most of the visible surface consists of relatively intensely cratered terrain transected by fault scarps and fault bounded valleys (graben). Some of the largest valleys, which can be seen near the terminator (at right), are partly filled with younger deposits that are less heavily cratered. Bright spots near the limb and toward are chiefly the rims of small craters. Most of the brightly rimmed craters are too small to be resolved here, although one about 30 km. (20 mi.) in diameter can be easily distiguished near the center. These bright-rim craters, thogh the youngest features on Ariel, probably have formed over a long span of geological tome. Although Ariel has a diameter of abou 1,200 km. ( 750 mi. ), it clearly experienced a great deal of geological activity in the past.
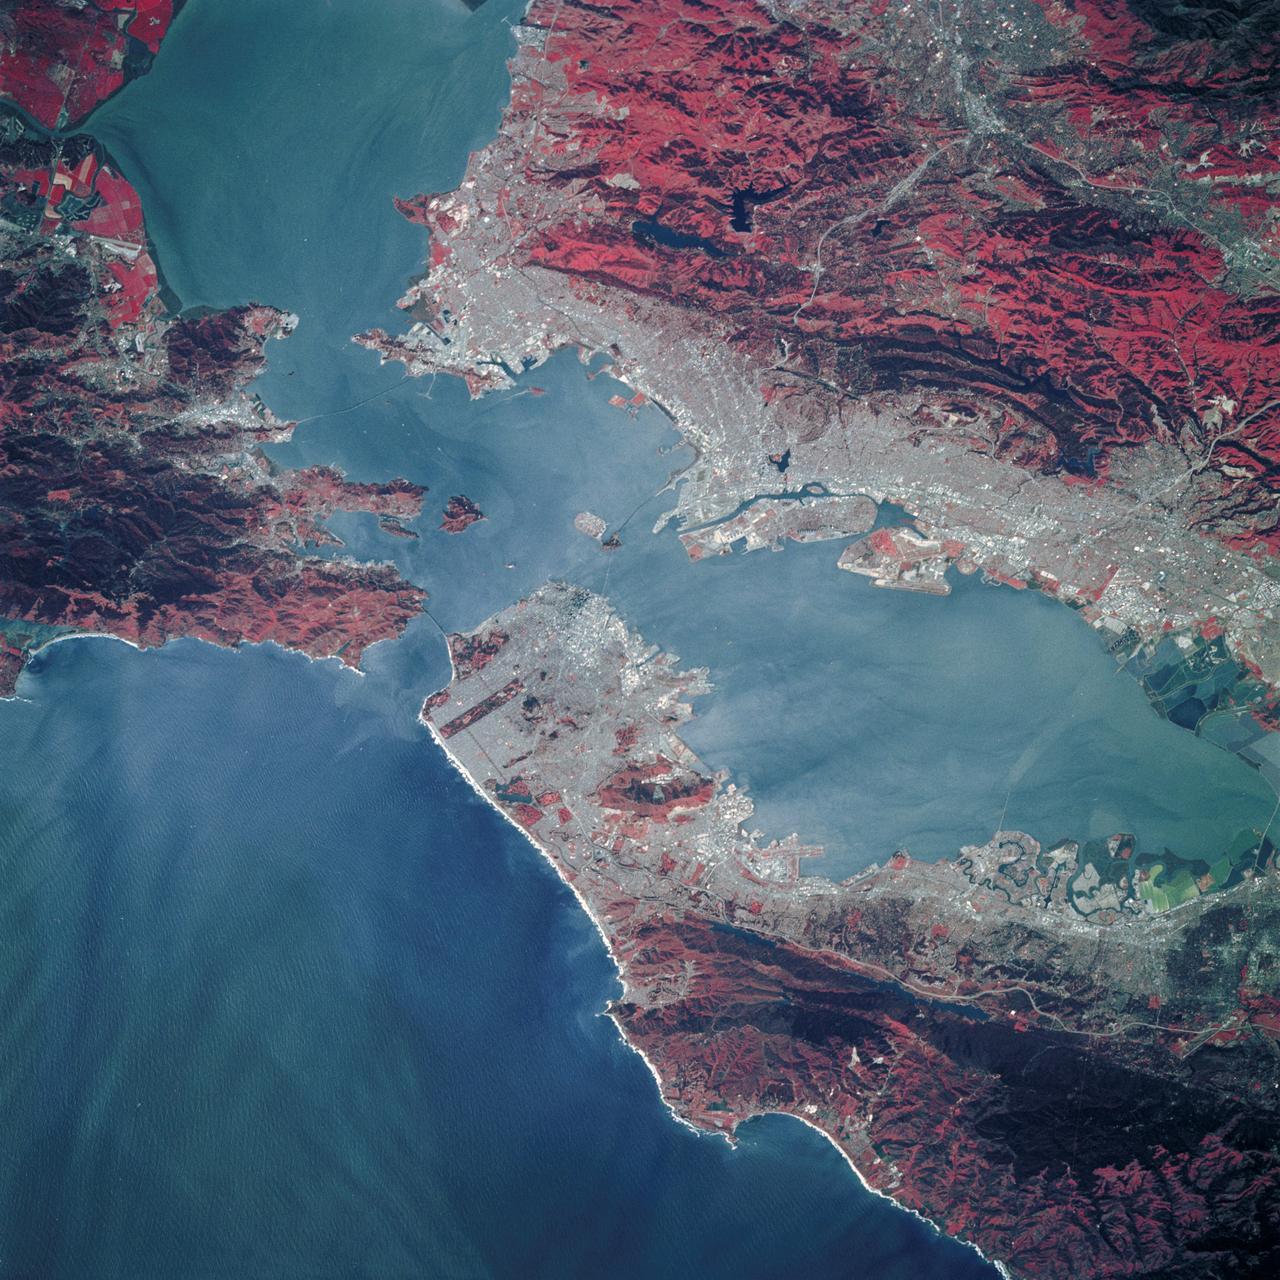
STS039-89-053 (28 April-6 May 1991) --- A 70mm, infrared frame of the city of San Francisco, taken on a clear day. The gray areas represent urban regions, and the red areas are vegetated. Within the city of San Francisco, parks like Golden Gate park and the Presidio at the base of the Golden Gate Bridge easily stand out from the well-developed parts of the city. Major thoroughfares and bridges (Golden Gate and Bay Bridges) are seen as are other landmarks such as Candlestick Park and Alcatraz. The trace of the San Andreas faults show as a straight valley running northerly along the San Francisco peninsula. Good detail is visible in the turbid waters of San Francisco Bay.
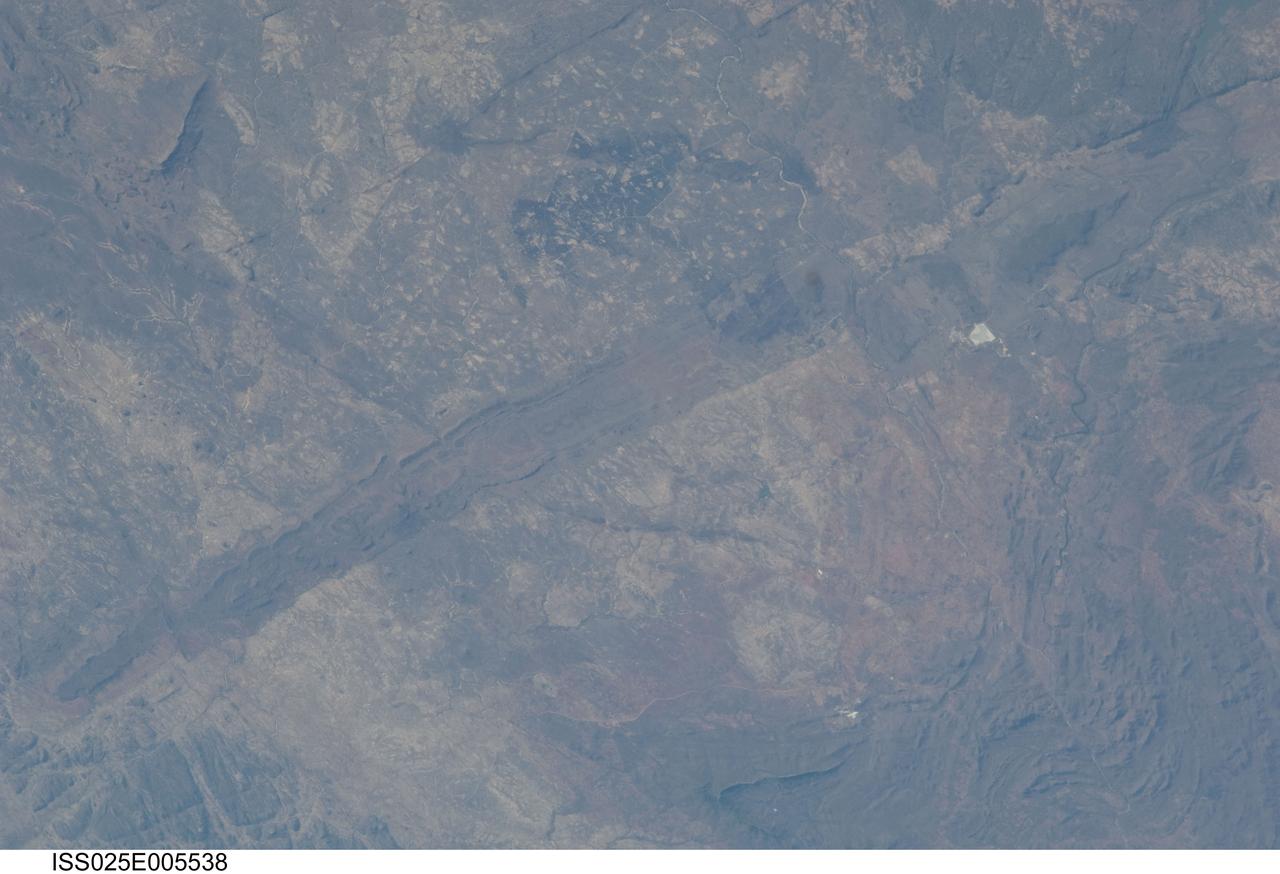
ISS025-E-005538 (30 Sept. 2010) --- The Great Dyke of Zimbabwe, Africa is featured in this image photographed by an Expedition 25 crew member on the International Space Station. The Great Dyke of Zimbabwe is a prominent geological feature that extends for over 550 kilometers, varying from 3-12 kilometers in width across the center of the country northeast – southwest; the southern end of the Dyke is illustrated in this view. The Dyke (or Dike in American English) is a layered mafic intrusion of igneous, metal-bearing rock that has been dated using uranium-lead isotopes to approximately 2.5 billion years in age, according to scientists. It intrudes even older rocks of the African craton, or core of oldest rocks forming the continent; in cross section, the Great Dyke looks somewhat triangular or keel-shaped suggesting to geologists that it rose along deep faults associated with extension of the African crust. Layered mafic intrusions are usually associated with economically important metals such as chromium, nickel, copper, platinum, titanium, iron, vanadium and tin. Chromium, in the form of the mineral chromite and platinum are particularly abundant in the Great Dyke and actively mined. Younger faults have offset sections of the Dyke along its length – two of the most obvious faults in the image are indicated, with arrows showing the relative directions of offset relative to the main trend of the intrusion. While the Great Dyke and its metal ores are products of geologic processes operating in the deep past, more recent events have also left their mark on the landscape as illustrated by two large fire burn scars which are visible at top center.
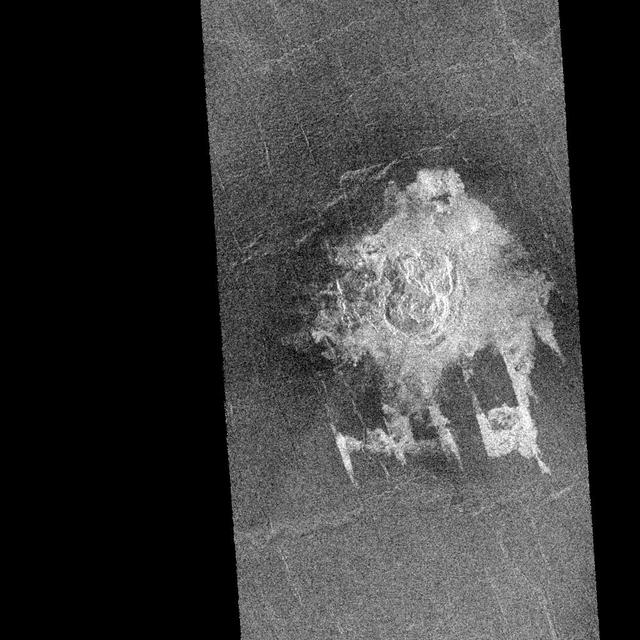
NASA' sMagellan imaged this multiple-floored, irregular impact crater at latitude 16.4 degrees north, longitude 352.1 degrees east, during orbits 481 and 482 on 27 September 1990. This crater, about 9.2 kilometers in maximum diameter, was formed on what appears to be a slightly fractured, radar-dark (smooth) plain. The abundant, low viscosity flows associated with this cratering event have, however, filled local, fault-controlled troughs (called graben). These shallow graben are well portrayed on this Magellan image but would be unrecognizable but for their coincidental infilling by the radar-bright crater flows. This fortuitous enhancement by the crater flows of fault structures that are below the resolution of the Magellan synthetic aperture radar is providing the Magellan Science Team with valuable geologic information. The flow deposits from the craters are thought to consist primarily of shock melted rock and fragmented debris resulting from the nearly simultaneous impacts of two projectile fragments into the hot (800 degrees Fahrenheit) surface rocks of Venus. The presence of the various floors of this irregular crater is interpreted to be the result of crushing, fragmentation, and eventual aerodynamic dispersion of a single entry projectile during passage through the dense Venusian atmosphere. http://photojournal.jpl.nasa.gov/catalog/PIA00462

This complicated area contains various types of channels, pits and fractures. We can determine the relative ages of the pits and channels based on which features cross-cut others. Older channels appear smooth-edged and shallow. Younger channels and pits are deeper and more sharp-edged, as well as less sinuous than the shallower channels. What caused this array of various channels and intersecting pits? This region is covered in vast lava flows. The collapse pits here may be collapsed lava tubes or where overlying rock "drained" into voids created by extensional faulting. The older smoother channel that seems to source from this region may have carried an outflow of groundwater. It continues on for over 100 kilometers (62 miles). The orientation and shapes of these features make an interesting geological puzzle. http://photojournal.jpl.nasa.gov/catalog/PIA21066

ISS034-E-029105 (15 Jan. 2013) --- One of the Expedition 34 crew members aboard the Earth-orbiting International Space Station photographed this image of the Piccaninny impact structure, located within the semi-arid Purnululu National Park and World Heritage site in Australia. The structure is believed by most scientists to have been formed less than 360 million years ago. Specifically, the 7.5 kilometer diameter structure forms a roughly circular plateau within the striking sandstone cone towers of the Bungle Bungle Range. Geological evidence indicating an impact structure includes regional folding and faulting patterns both within and surrounding the plateau. Features confirming an impact, such as shock textures (indicating rapid compression, melting, and fracturing during impact) in rocks and minerals have not yet been found; this, according to scientists, is perhaps due to removal during erosion of an original crater.
Many craters in the mid-latitudes of Mars are partially filled with deposits that have been interpreted to be ice-rich. We expect the deposits to have formed at an earlier (but relatively recent) time when Mars' orbital parameters were different and allowed ice to condense and deposit in these locations. The ice is covered by dust layers protecting it from sublimating away. The ice deposits are probably no older than a few million years, which is recent in geological terms. However, we can observe that these deposits have been affected by even more recent movement of the crust (the curving trough) that clearly post-dates the ice deposits because it is cutting through them. A wider view allows us to trace this crustal movement or "fault," and we can see it is also affecting the crater wall and the area surrounding it. This observation indicates that Mars' interior is still (or at least until recently was) warm enough to sustain such activity. https://photojournal.jpl.nasa.gov/catalog/PIA26323
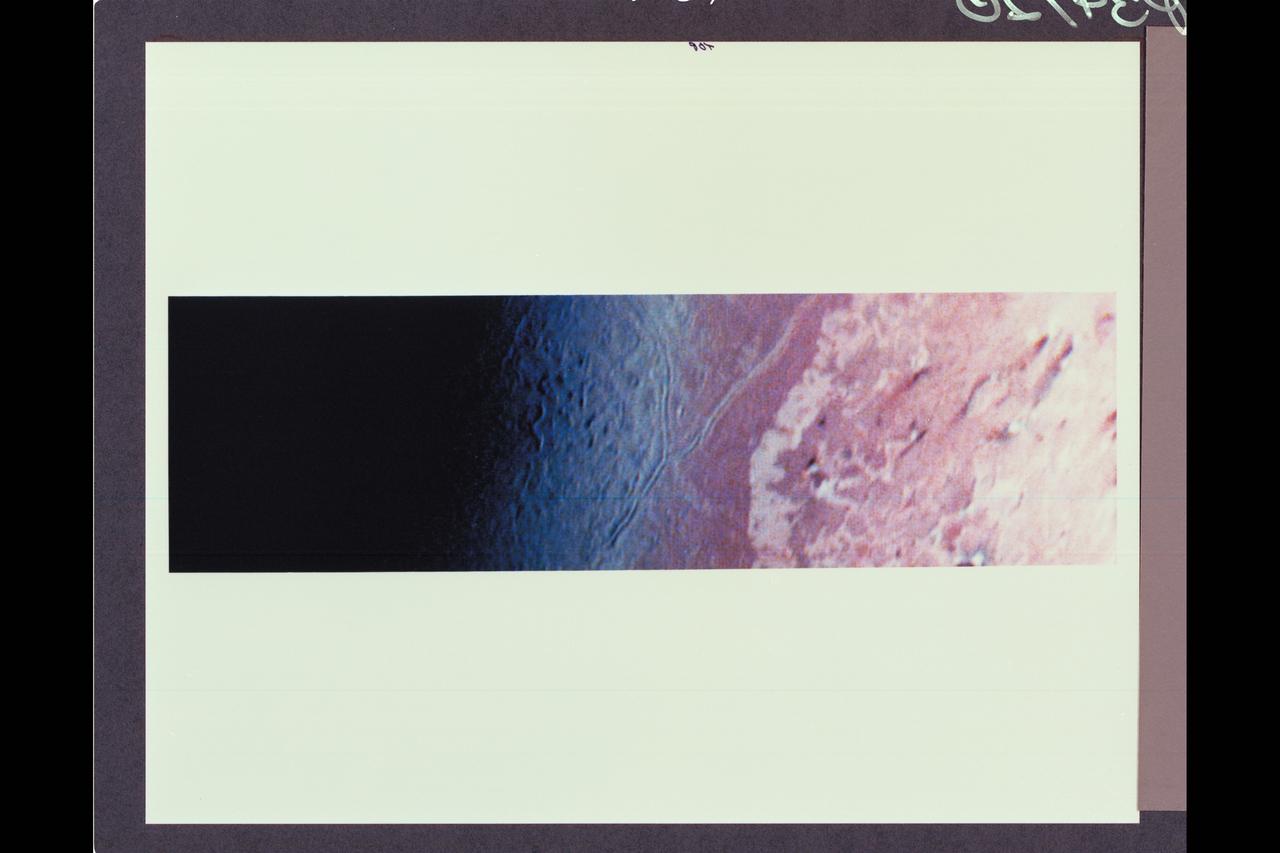
Voyager violet, green and ultraviolet images of Triton were map projected into cylindrical coordinates and combines to produce this false-color terrain map. Several compositionally distinct terrain and geologic features are portrayed. At center is a gray-blue unit referred to as 'cantaloupe' terrain because of its unusual topographic texture. The unit appears to predate other units to the left. Immediately adjacent to the cantaloupe terrain, is a smoother unit, represented by a reddish color, that has been dissected by a prominent fault system. This unit apparently overlies a much-higher-albedo material, seen farther left. A prominent angular albedo boundary separates relatively undisturbed smooth terrain from irregular patches which seem to emanate from circular, often bright-centered features. The parallel streaks may represent vented particulate materials blown in the same direction by winds in Triton's thin atmosphere.
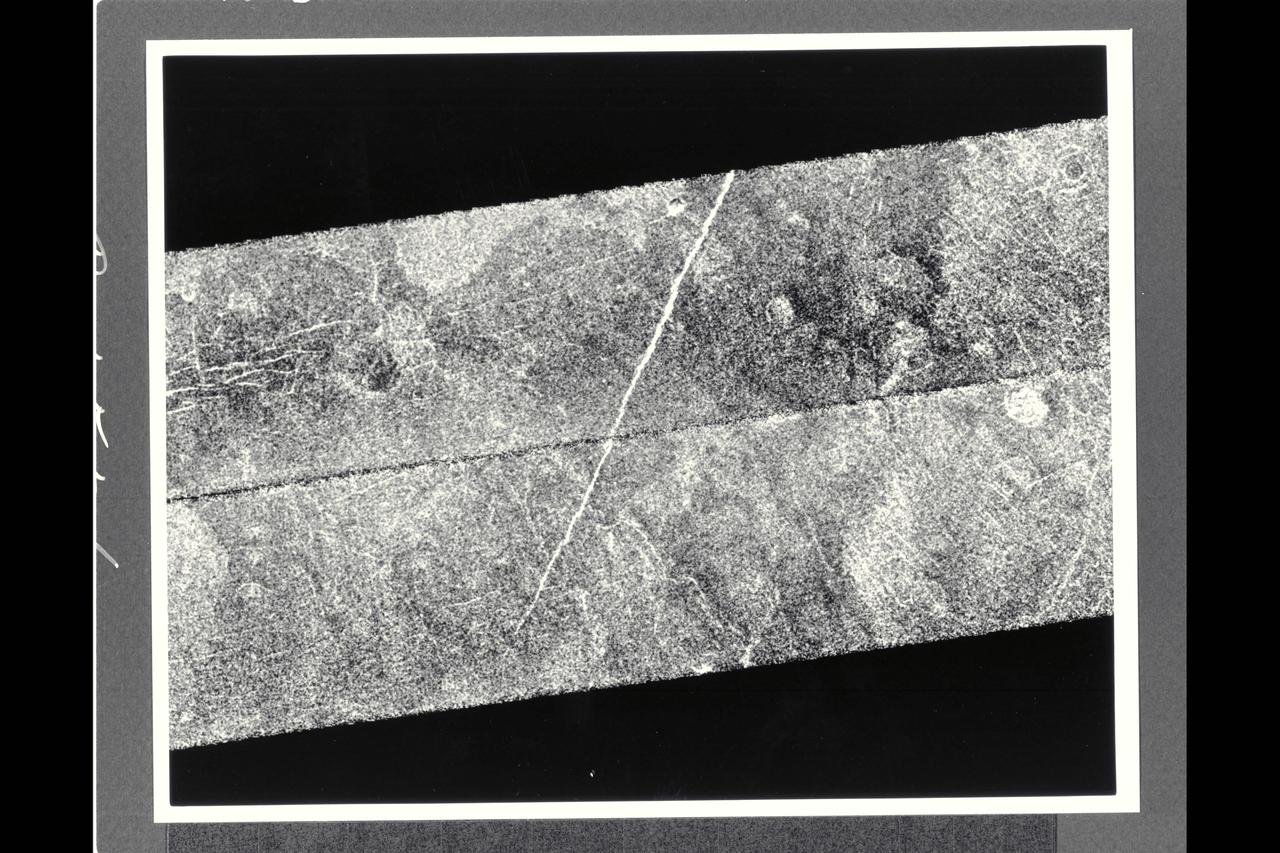
After traveling more than 1.5 billion km (948 million mi.), the Magellan spacecraft was inserted into orbit around Venus on Aug. 10, 1990. This mosaic consists of adjacent pieces of two magellan image strips obtained in the first radar test. The radar test was part of a planned In-Orbit Checkout sequence designed to prepare the magellan spacecraft and radar to begin mapping after Aug. 31. The strip on the left was returned to the Goldstone Deep Space Network station in California; the strip to the right was received at the DSN in Canberra, Australia. A third station that will be receiving Magellan data is locaterd near Madrid, Spain. Each image strip is 20 km (12 mi.) wide and 16,000 km (10,000 mi.) long. This mosaic is a small portion 80 km (50 mi.) long. This image is centered at 21 degrees north latitude and 286.8 degrees east longitude, southeast of a volcanic highland region called Beta Regio. The resolution of the image is about 120 meters (400 feet), 10 times better than revious images of the same area of Venus, revealing many new geologic features. The bright line trending northwest-southeast across the center of the image is a fracture or fault zone cutting the volcanic plains. In the upper lest corner of the image, a multiple-ring circular feature of probable volcanic origin can be seen, approx. 4.27 km (2.65 mi.) across. The bright and dark variations seen in the plains surrounding these features correspond to volcanic lava flows of varying ages. The volcanic lava flows in the southern half of the image have been cut by north-south trending faults. This area is similar geologically to volcanic deposits seen on Earth at Hawaii and the Snake River Plains in Idaho.
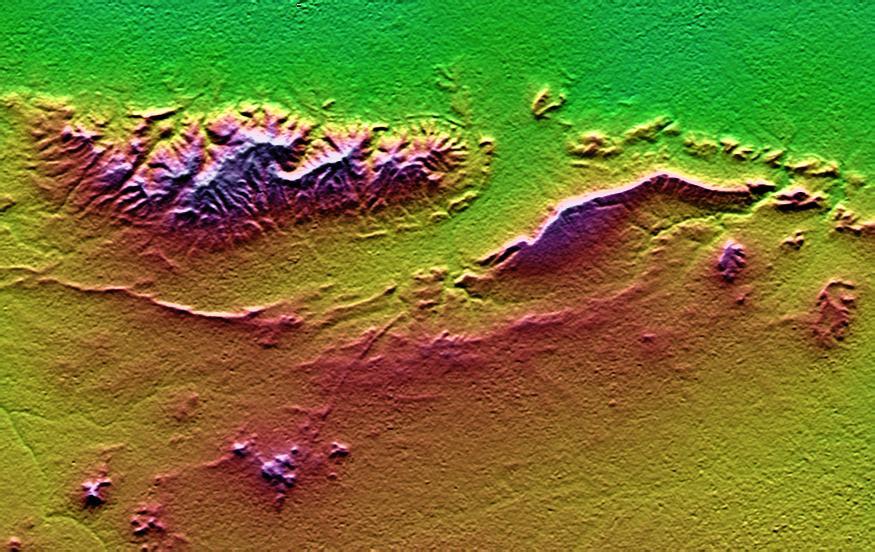
On January 26, 2001, the Kachchh region in western India suffered the most deadly earthquake in India's history. This shaded topography view of landforms northeast of the city of Bhuj depicts geologic structures that are of interest in the study the tectonic processes that may have led to that earthquake. However, preliminary field studies indicate that these structures are composed of Mesozoic rocks that are overlain by younger rocks showing little deformation. Thus these structures may be old, not actively growing, and not directly related to the recent earthquake. The Haro Hills are on the left and the Kas Hills are on the right. The Haro Hills are an "anticline," which is an upwardly convex elongated fold of layered rocks. In this view, the anticline is distinctly ringed by an erosion resistant layer of sandstone. The east-west orientation of the anticline may relate to the crustal compression that has occurred during India's northward movement toward, and collision with, Asia. In contrast, the largest of the Kas Hills appears to be a tilted (to the south) and faulted (on the north) block of layered rocks. Also seen here, the linear feature trending toward the southwest from the image center is an erosion-resistant "dike," which is an igneous intrusion into older "host" rocks along a fault plane or other crack. These features are simple examples of how shaded topography can provide a direct input to geologic studies. In this image, colors show the elevation as measured by the Shuttle Radar Topography Mission (SRTM). Colors range from green at the lowest elevations, through yellow and red, to purple at the highest elevations. Elevations here range from near sea level to about 300 meters (about 1000 feet). Shading has been added, with illumination from the north (image top). http://photojournal.jpl.nasa.gov/catalog/PIA03300
ISS011-E-08410 (9 June 2005) --- Las Cruces, New Mexico is featured in this image photographed by an Expedition 11 crewmember on the International Space Station. The city of Las Cruces is located within the Rio Grande Rift, a large geological feature that extends from Colorado southward into Mexico. According to NASA geologists, rifting usually heralds the breakup of continental landmasses, such as the separation of South America and Africa to form the southern Atlantic Ocean during the Mesozoic Era. The Rift is marked by a series of depressions (known as graben) caused by the subsidence of crustal blocks between parallel faults as the continental crust is pulled apart by tectonic forces. These graben are frequently marked by uplifted rocks along bounding faults — the striking Organ Mountains to the east of Las Cruces are one such uplifted fault block. While separation of the continental crust is no longer occurring, the Rio Grande Rift is still considered active as evidenced by frequent low-intensity earthquakes and hot springs to the north of Las Cruces. The modern city of Las Cruces — the seat of Doña Ana County and home to New Mexico State University — is undergoing rapid urban expansion due to influx of new residents attracted to the climate and landscape. The current urban area (gray to white region at image center) contrasts sharply with agricultural lands (dark green and grey brown) located along the Rio Grande River and the surrounding desert valley floor to the northeast and southwest (brown, blue gray and tan areas).
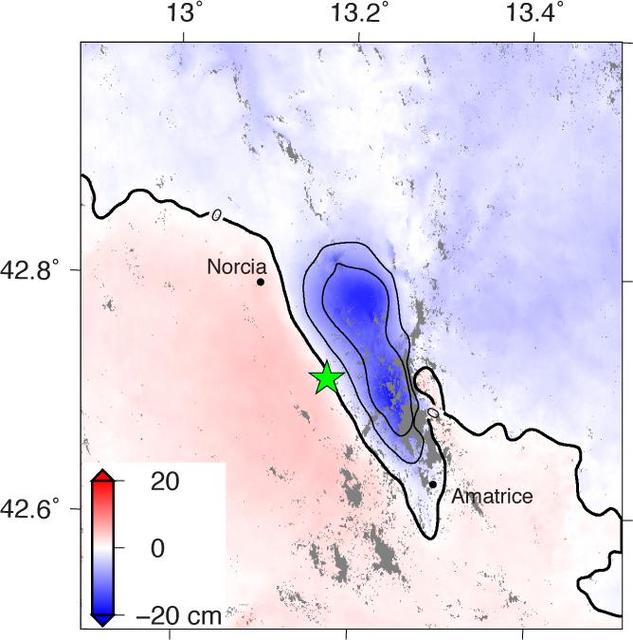
NASA and its partners are contributing observations and expertise to the ongoing response to the Aug. 23, 2016, magnitude 6.2 Amatrice earthquake in central Italy caused widespread building damage to several towns throughout the region. This earthquake was the strongest in that area since the 2009 earthquake that destroyed the city of L'Aquila. Scientists with the Advanced Rapid Imaging and Analysis project (ARIA), a collaboration between NASA's Jet Propulsion Laboratory, Pasadena, California, and the California Institute of Technology in Pasadena, analyzed interferometric synthetic aperture radar images from the PALSAR-2 instrument on the ALOS-2 satellite operated by the Japan Aerospace Exploration Agency (JAXA) to calculate a map of the deformation of Earth's surface caused by the quake. This false-color map shows the amount of permanent surface movement, as viewed by the satellite, during a seven-month interval between two ALOS-2 images acquired on Sept. 9, 2015 and Aug. 24, 2016. The movement was caused almost entirely by the earthquake. In this map, the colors of the surface displacements are proportional to the surface motion. The red and pink tones show the areas where the land moved toward the satellite by up to 2 inches (5 centimeters). The area with various shades of blue moved away from the satellite, mostly downward, by as much as 8 inches (20 centimeters). Contours on the surface motion are 2 inches (5 centimeters) The green star shows the epicenter where the earthquake started as located by the U.S. Geological Survey National Earthquake Information Center. Black dots show town locations. Scientists use these maps to build detailed models of the fault slip at depth and associated land movements to better understand the impact on future earthquake activity. The map shows the fault or faults that moved in the earthquake is about 14 miles (22 kilometers) long between Amatrice and Norcia and slopes to the west beneath the area that moved downward. The PALSAR-2 data were provided by JAXA through a science project. http://photojournal.jpl.nasa.gov/catalog/PIA20893
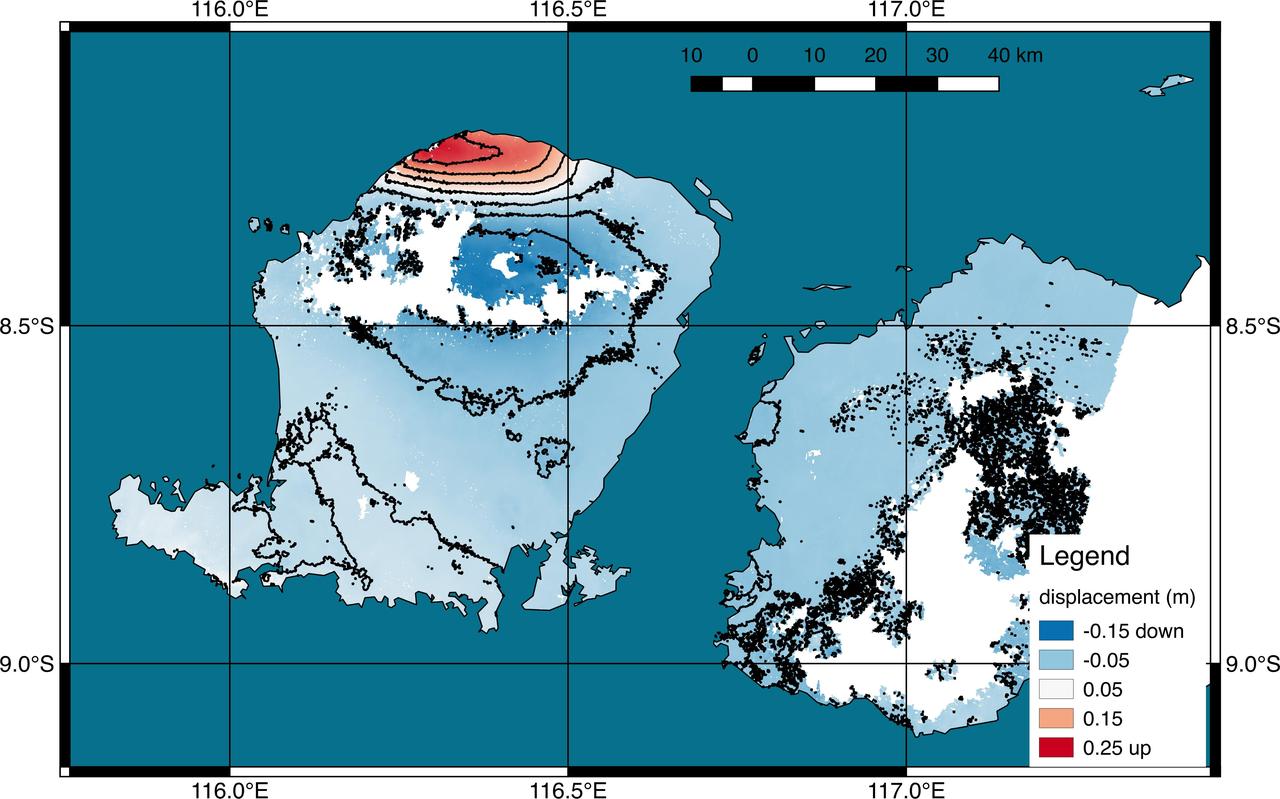
Scientists with the Advanced Rapid Imaging and Analysis project (ARIA), a collaboration between NASA's Jet Propulsion Laboratory in Pasadena, California, and Caltech, also in Pasadena, used synthetic aperture radar (SAR) data from the European Union's Copernicus Sentinel-1A and -1B satellites, operated by the European Space Agency. They generated a map of the deformation of Earth's surface caused by the Aug. 5, 2018 magnitude 6.9 earthquake under Lombok island, Indonesia. The deformation map is produced from automated interferometric processing of the SAR data using the JPL-Caltech ARIA data system in response to a signal received from the U.S. Geological Survey. The false-color map shows the amount of permanent surface movement that occurred almost entirely due to the quake, as viewed by the satellite, during a 6-day interval between two Sentinel-1 images acquired on July 30 and Aug. 5, 2018. The map shows that the earthquake fault was under the northwest corner of Lombok island, probably extending offshore to the west. Through these maps, NASA and its partners are contributing observations and expertise that can assist with response to earthquakes and other natural or human-produced hazards. From the pattern of deformation in the map, scientists have determined that the earthquake fault slip was on a fault beneath the northwestern part of Lombok Island and caused as much as 10 inches (25 centimeters) of uplift of the ground surface. The map depicts motion towards the satellite (up and west) in the direction of the radar's line-of-sight, with contours every 2 inches (5 centimeters). White areas are places where the radar measurement was not possible, largely due to dense forests in the middle of the islands. https://photojournal.jpl.nasa.gov/catalog/PIA22491
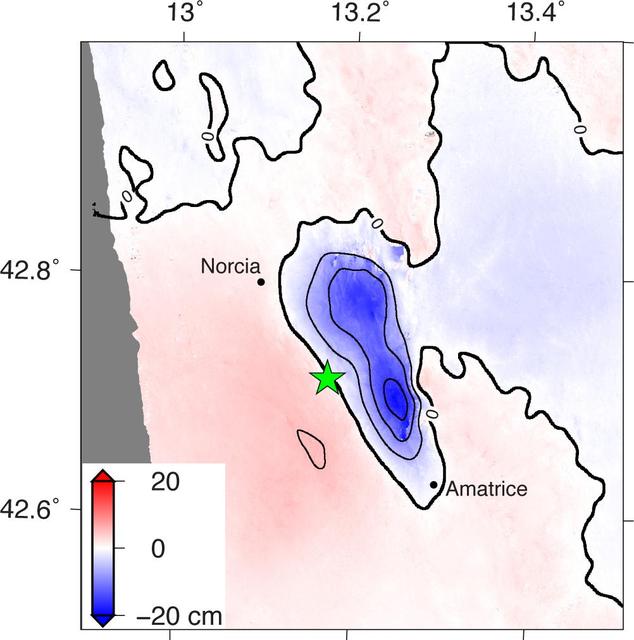
Amatrice earthquake in central Italy, which caused widespread building damage to several towns throughout the region. This earthquake was the strongest in that area since the 2009 earthquake that destroyed the city of L'Aquila. The Advanced Rapid Imaging and Analysis (ARIA) data system, a collaborative project between NASA's Jet Propulsion Laboratory, Pasadena, California, and the California Institute of Technology in Pasadena, automatically generated interferometric synthetic aperture radar images from the Copernicus Sentinel 1A satellite operated by the European Space Agency (ESA) for the European Commission to calculate a map of the deformation of Earth's surface caused by the quake. This false-color map shows the amount of permanent surface movement, as viewed by the satellite, during a 12-day interval between two Sentinel 1 images acquired on Aug. 15, 2016, and Aug. 27, 2016. The movement was caused almost entirely by the earthquake. In this map, the colors of the surface displacements are proportional to the surface motion. The red and pink tones show the areas where the land moved toward the satellite by up to 2 inches (5 centimeters). The area with various shades of blue moved away from the satellite, mostly downward, by as much as 8 inches (20 centimeters). Contours on the surface motion are 2 inches (5 centimeters) The green star shows the epicenter where the earthquake started as located by the U.S. Geological Survey National Earthquake Information Center. Black dots show town locations. Scientists use these maps to build detailed models of the fault slip at depth and associated land movements to better understand the impact on future earthquake activity. The map shows the fault or faults that moved in the earthquake is about 14 miles (22 kilometers) long between Amatrice and Norcia and slopes to the west beneath the area that moved downward. http://photojournal.jpl.nasa.gov/catalog/PIA20896
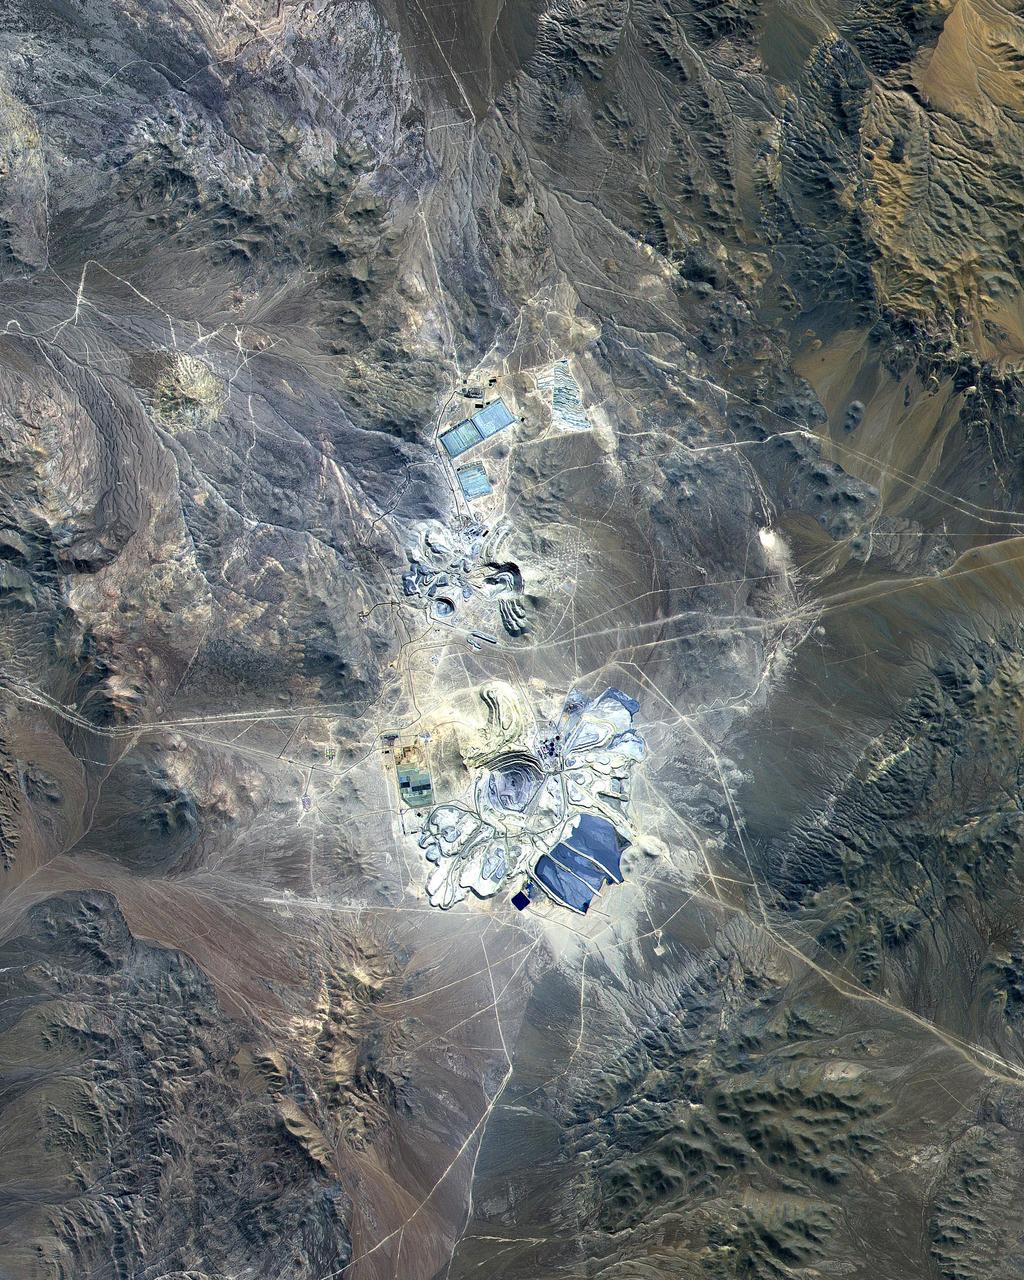
This ASTER image covers 30 by 37 km in the Atacama Desert, Chile and was acquired on April 23, 2000. The Escondida Cu-Au-Ag open-pit mine is at an elevation of 3050 m, and came on stream in 1990. Current capacity is 127,000 tons/day of ore; in 1999 production totaled 827,000 tons of copper, 150,000 ounces of gold and 3.53 million ounces of silver. Primary concentration of the ore is done on-site; the concentrate is then sent to the coast for further processing through a 170 km long, 9 pipe. Escondida is related geologically to three porphyry bodies intruded along the Chilean West Fissure Fault System. A high grade supergene cap overlies primary sulfide ore. This image is a conventional 3-2-1 RGB composite. Figure 1 displays SWIR bands 4-6-8 in RGB, and highlights lithologic and alteration differences of surface units. The image is located at 24.3 degrees south latitude and 69.1 degrees west longitude. http://photojournal.jpl.nasa.gov/catalog/PIA11090
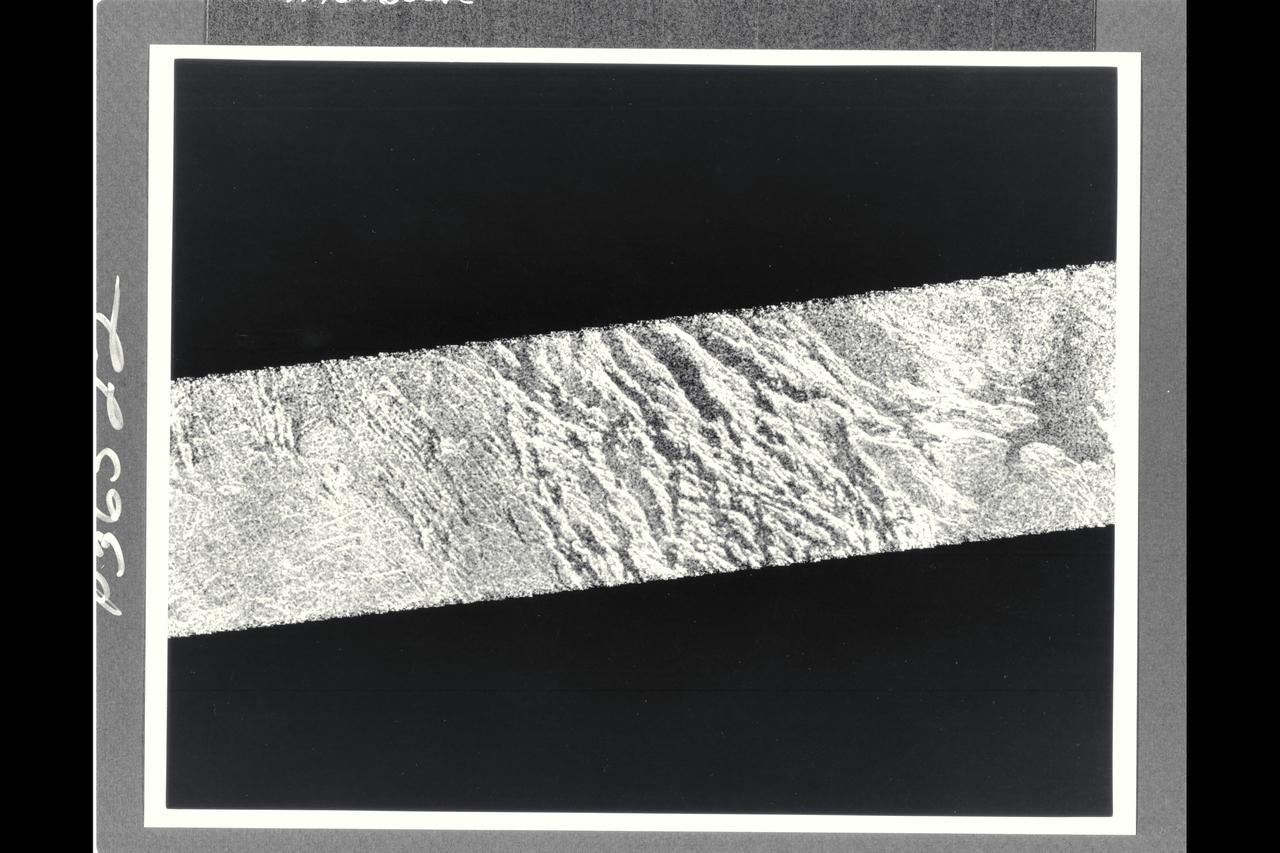
This portion of a Magellan radar image strip shows a small region on Venus 20 km (12.4 mi.) wide and 75 km (50 mi.) long on the east flank of a major volcanic upland called Beta Regio. The image is centerd at 23 degrees north latitude and 286.7 degrees east longitude. The ridge and valley networkin the middle part of the image is formed by intersection faults which have broken the Venusian crust into a clomplex, deformed type of surface called tessera, the Latin word for tile. The parallel mountains and valleys resemble the Basin and Range Province in the western United States. The irregular dark patch near the top of the image is a smooth surface, probably formed by lava flows in a region about 10 km (6 mi.) across. Similar dark surfaces within the valleys indicate lava flows that are younger than the tessera giving an indication of the geologic time relationships of the events that formed the present surface. The image has a resolution of 120 meters (400 feet).

Voyager violet, green, and ultraviolet images of Triton were map projected into cylindrical coordinates and combined to produce this false color terrain map. Several compositionally distinct terrain and geologic features are portrayed. At center is a gray blue unit referred to as 'cantaloupe' terrain because of its unusual topographic texture. The unit appears to predate other units to the left. Immediately adjacent to the cantaloupe terrain, is a smoother unit, represented by a reddish color, that has been dissected by a prominent fault system. This unit apparently overlies a much higher albedo material, seen farther left. A prominent angular albedo boundary separates relatively undisturbed smooth terrain from irregular patches which have been derived from breakup of the same material. Also visible at the far left are diffuse, elongated streaks, which seem to emanate from circular, often bright centered features. The parallel streaks may represent vented particulate materials blown in the same direction by winds in Triton's thin atmosphere. The Voyager Mission was conducted by JPL for NASA's Office of Space Science and Applications. http://photojournal.jpl.nasa.gov/catalog/PIA00060
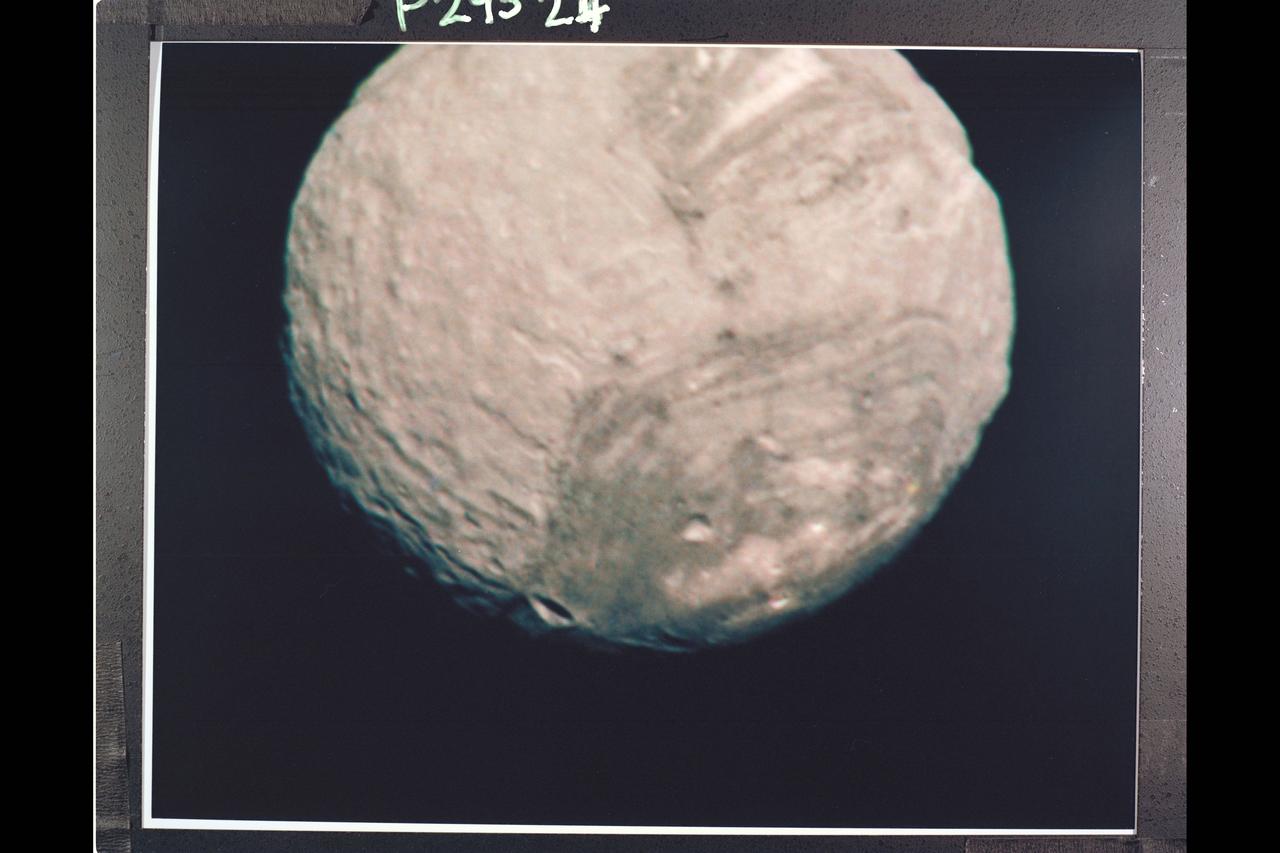
Range : 147,000 km. ( 91,000 mi. ) Resolution : 2.7 km. ( 1.7 mi. ) P-29524C this Voyager 2 color image of the Uranian satellite, Miranda is a composite of three shots taken through green, violet, and ultraviolet filters from the narrow angle camera. It is the best color image of Miranda returned to date. Miranda, just 480 km. (300 mi.) across, is the smallest of Uranus' five major satellites. Miranda's regional geologic provinces show very well in this view of the southern hemisphere. The dark and bright banded region, with its curvilinear traces, covers about half of the image. Higher resolution pictures taken later show many fault lines valleys and ridges parallel to these bands. Near the terminator (at right), another system of ridges and valleys abuts the banded terrain, while many impact craters pockmark the surface in this region. The largest of these are about 30 km. (20 mi.) in diameter. Many more lie in the range of 5 to 10 km. (3 to 6 mi.) in diameter
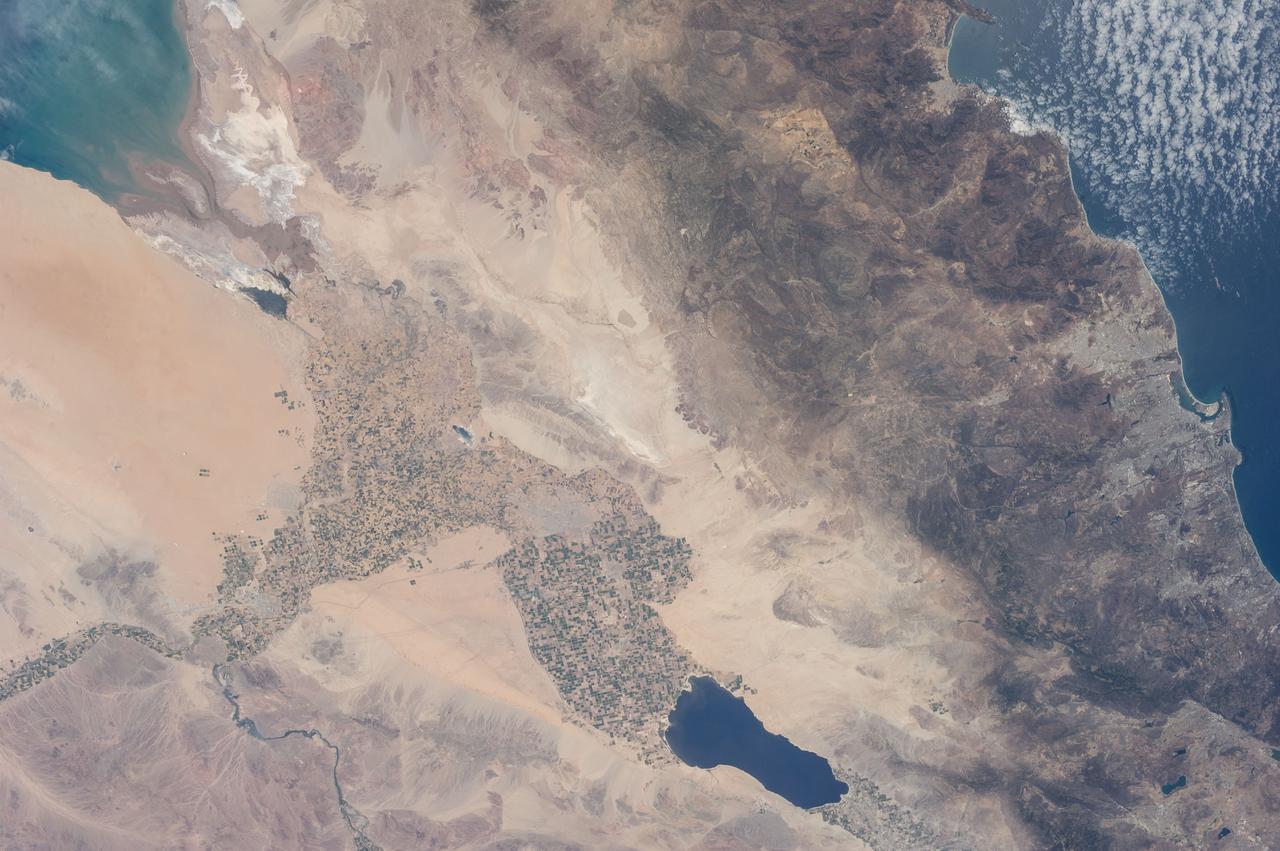
ISS036-E-011034 (21 June 2013) --- The Salton Trough is featured in this image photographed by an Expedition 36 crew member on the International Space Station. The Imperial and Coachella Valleys of southern California – and the corresponding Mexicali Valley and Colorado River Delta in Mexico – are part of the Salton Trough, a large geologic structure known to geologists as a graben or rift valley that extends into the Gulf of California. The trough is a geologically complex zone formed by interaction of the San Andreas transform fault system that is, broadly speaking, moving southern California towards Alaska; and the northward motion of the Gulf of California segment of the East Pacific Rise that continues to widen the Gulf of California by sea-floor spreading. According to scientists, sediments deposited by the Colorado River have been filling the northern rift valley (the Salton Trough) for the past several million years, excluding the waters of the Gulf of California and providing a fertile environment – together with irrigation—for the development of extensive agriculture in the region (visible as green and yellow-brown fields at center). The Salton Sea, a favorite landmark of astronauts in low Earth orbit, was formed by an irrigation canal rupture in 1905, and today is sustained by agricultural runoff water. A wide array of varying landforms and land uses in the Salton Trough are visible from space. In addition to the agricultural fields and Salton Sea, easily visible metropolitan areas include Yuma, AZ (lower left); Mexicali, Baja California, Mexico (center); and the San Diego-Tijuana conurbation on the Pacific Coast (right). The approximately 72-kilometer-long Algodones Dunefield is visible at lower left.
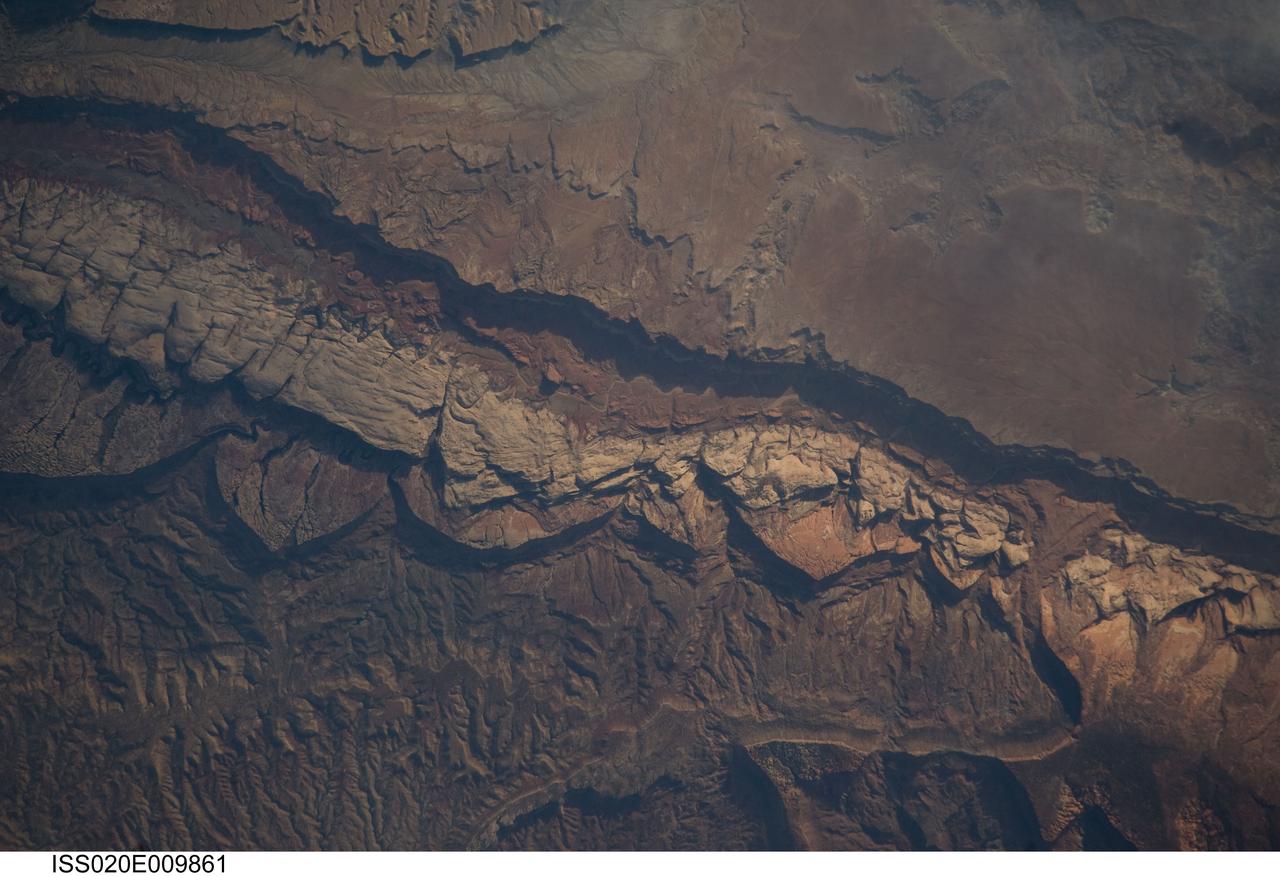
ISS020-E-009861 (14 June 2009) --- Big Thompson Mesa in the Capitol Reef National Park, Utah is featured in this image photographed by an Expedition 20 crew member on the International Space Station. This detailed photograph depicts a portion of Big Thompson Mesa located near the southern end of Capitol Reef National Park. Capitol Reef National Park is located on the Colorado Plateau, a physiographic and geologic province that comprises the adjacent quarters of Arizona, Colorado, New Mexico and Utah. Big Thompson Mesa (upper right) is part of a large feature known as the Waterpocket Fold. The Fold is a geologic structure called a monocline, characterized by generally flat-laying sedimentary rock layers with a steep and highly localized flexure– much like a carpet runner draped over a stair step. Monoclines on the Colorado Plateau are thought to be the result of faulting of stratigraphically lower and more brittle crystalline rocks; while the crystalline rocks were broken into raised or lowered blocks, the overlaying, less brittle sedimentary rocks were flexed without breaking. According to scientists, the portion of the Waterpocket Fold illustrated in this image includes layered rocks formed during the Mesozoic Era (approximately 250 – 65 million years ago) – the oldest layers are at the bottom of the sequence (and also, in this view, the image), with each successive layer younger than the preceding one going upwards in the sequence. Not all of the units present are clearly visible, but some of the major units can be easily distinguished. The bottom half of the image includes the oldest rocks in the view: dark brown and dark green Moenkopi (Trm) and Chinle (Trc) Formations. At center, two strikingly colored units are visible – light red to orange Wingate Sandstone (Jw) and white Navajo Sandstone (Jn). A topographic bench above these units includes reddish brown to brown Carmel Formation (Jc) and Entrada Sandstone (Je). The top of the cliff face above this bench - Big Thompson Mesa - is comprised of brown Dakota Sandstone (Kd). Scientists believe this sequence represents more than 100 million years of deposition. Much younger Quaternary (2.0 million to approximately 10,000 years old) deposits are also present in the view. A regional view of Capitol Reef National Park and the Waterpocket Fold is available here. The area shown in this view is located approximately 65 kilometers to the southeast of Fruita, UT near the southern end of Capitol Reef National Park.
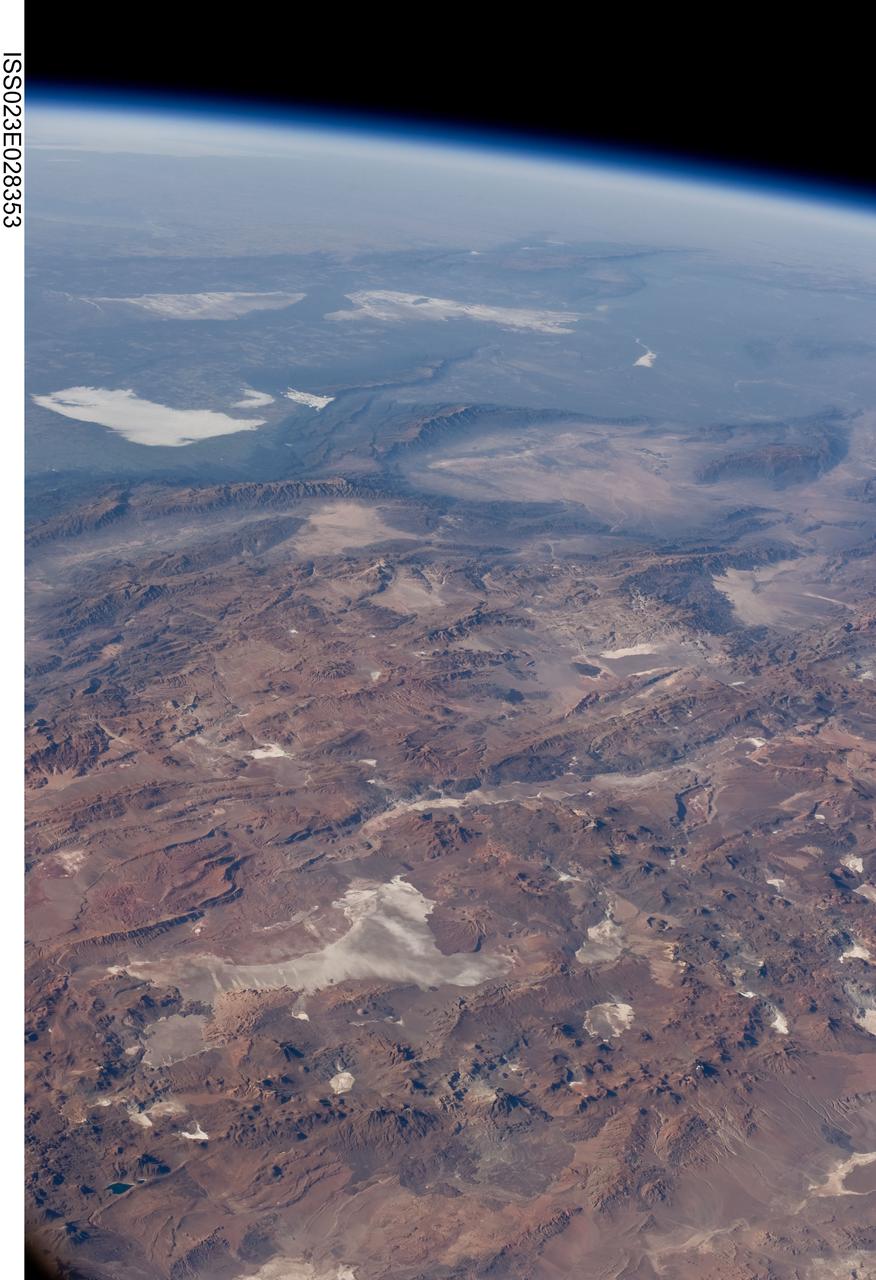
ISS023-E-028353 (26 April 2010) --- Central Andes Mountains, Salar de Arizaro, Argentina are featured in this image photographed by an Expedition 23 crew member on the International Space Station. The high plains (3,000 to greater than 5,000 meters elevation, 13,000 to 19,000 feet) of the Andes Mountains, also known as the Puna, appear in the foreground of this photograph, with a line of young volcanoes facing the much lower Atacama Desert (1,000–2,000 meters elevation). Several large dry lakes, marked by light-toned salt crusts, occupy the basins between major thrust faults in the Puna. Salar de Arizaro (foreground) is the largest of the dry lakes in this view (salar means waterless salt flat in Spanish). This panorama was taken by a station crew member looking southeast across the South American continent when the ISS was almost directly over the Atacama Desert near Chile’s Pacific coast. The Atlantic Ocean coastline (River Plate where Argentina’s capital city of Buenos Aires is located) is dimly visible at top left. A striking geological and landscape contrast is visible at center which separates two distinct geological zones, namely the Puna and the Sierras Pampeanas. The Sierras Pampeanas Mountains are lower in elevation and have few young volcanoes, in contrast to the Puna. Sharp-crested ranges are separated by wide, low valleys in this region. The Salinas Grandes—ephemeral shallow salt lakes at top left (salina means salt lake in Spanish) — occupies one of these valleys. The general color change from reds and browns in the foreground to blues and greens in the upper part of the image reflects the major climatic regions, namely the deserts of the Atacama and Puna, versus the low grassy plains of central Argentina where rainfall is sufficient to promote lush prairie grass growth—known famously as the pampas in Argentina. The Salinas Grandes mark an intermediate semiarid region. What accounts for the changes in landscape? The geology of this part of the Andes is a result of the eastward subduction of the Nazca tectonic plate underneath South America. Investigations using seismic data suggest that the Puna is underlain by a steeply dipping sector of the subducting Nazca plate. The Sierras Pampeanas zone however, is underlain by a sector of the Nazca plate that is almost horizontal, possibly due to the subduction of a submarine mountain range known as the Juan Fernandez Ridge. In the simplest terms, ridges are topographic highs that are difficult to stuff down subduction zones, with profound effects on the volcanism and structures of the upper plate.
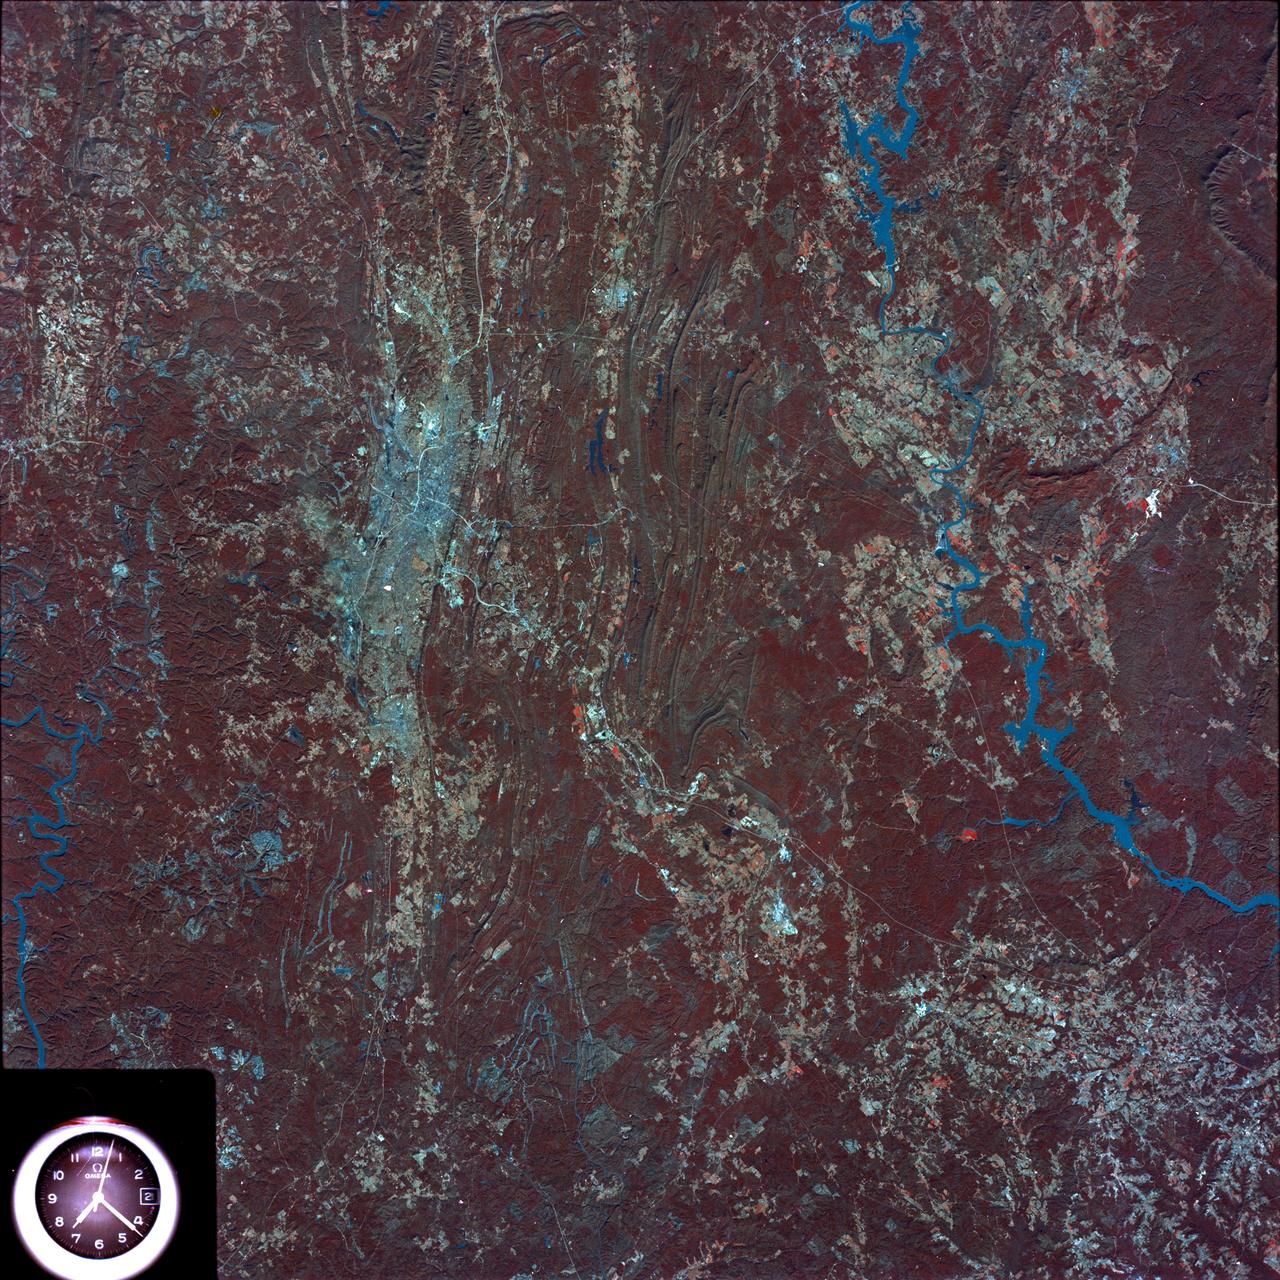
SL4-93-153 (February 1974) --- A vertical view of the Birmingham and central Alabama area is seen in this Skylab 4 Earth Resources Experiments Package S190-B (five-inch earth terrain camera) infrared photographed taken from the Skylab space station in Earth orbit. Illustrated here is the utility of color infrared film in depicting distribution of living vegetation in the 3,600 square mile Birmingham region. The Birmingham industrial complex, with a population of nearly 850,000, is the light gray area nestled in the valley between the northeast-trending ridges that are prominent topographic features in the southern Appalachian Mountains. The narrow ridges and adjacent valleys reflect folded and faulted sedimentary rocks, indicating the complex geological history of the region. Two major rivers and several reservoirs are easily distinguished in this photograph. Bankhand Lake, formed by a dam on the Black Warrior River, appears as bright blue west of Birmingham. Two lakes are formed by dams on the Goosa River east of Birmingham. Federal and state highways appear as thin white lines and are easily identified. Interstate 65 to Montgomery is the prominent white line extending southward from Birmingham. Power line clearings are visible in the center of the picture along the Goosa River, and can be traced northwestward to northern parts of Birmingham. The predominant deep red color of the picture is due to the reflections from living vegetation. In contrast are the light tan areas that commonly occur as rectangular patterns in the east part of the photograph and represent mature agricultural crops or grazing lands. Analysis of the photographic data from the earth terrain camera will be conducted by Dr. H. Jayroe of the Marshall Space Flight Center in developing analytical techniques. All EREP photography is available to the public through the Department of Interior's Earth Resources Observations Systems Data Center, Sioux Falls, South Dakota, 57198. Photo credit: NASA
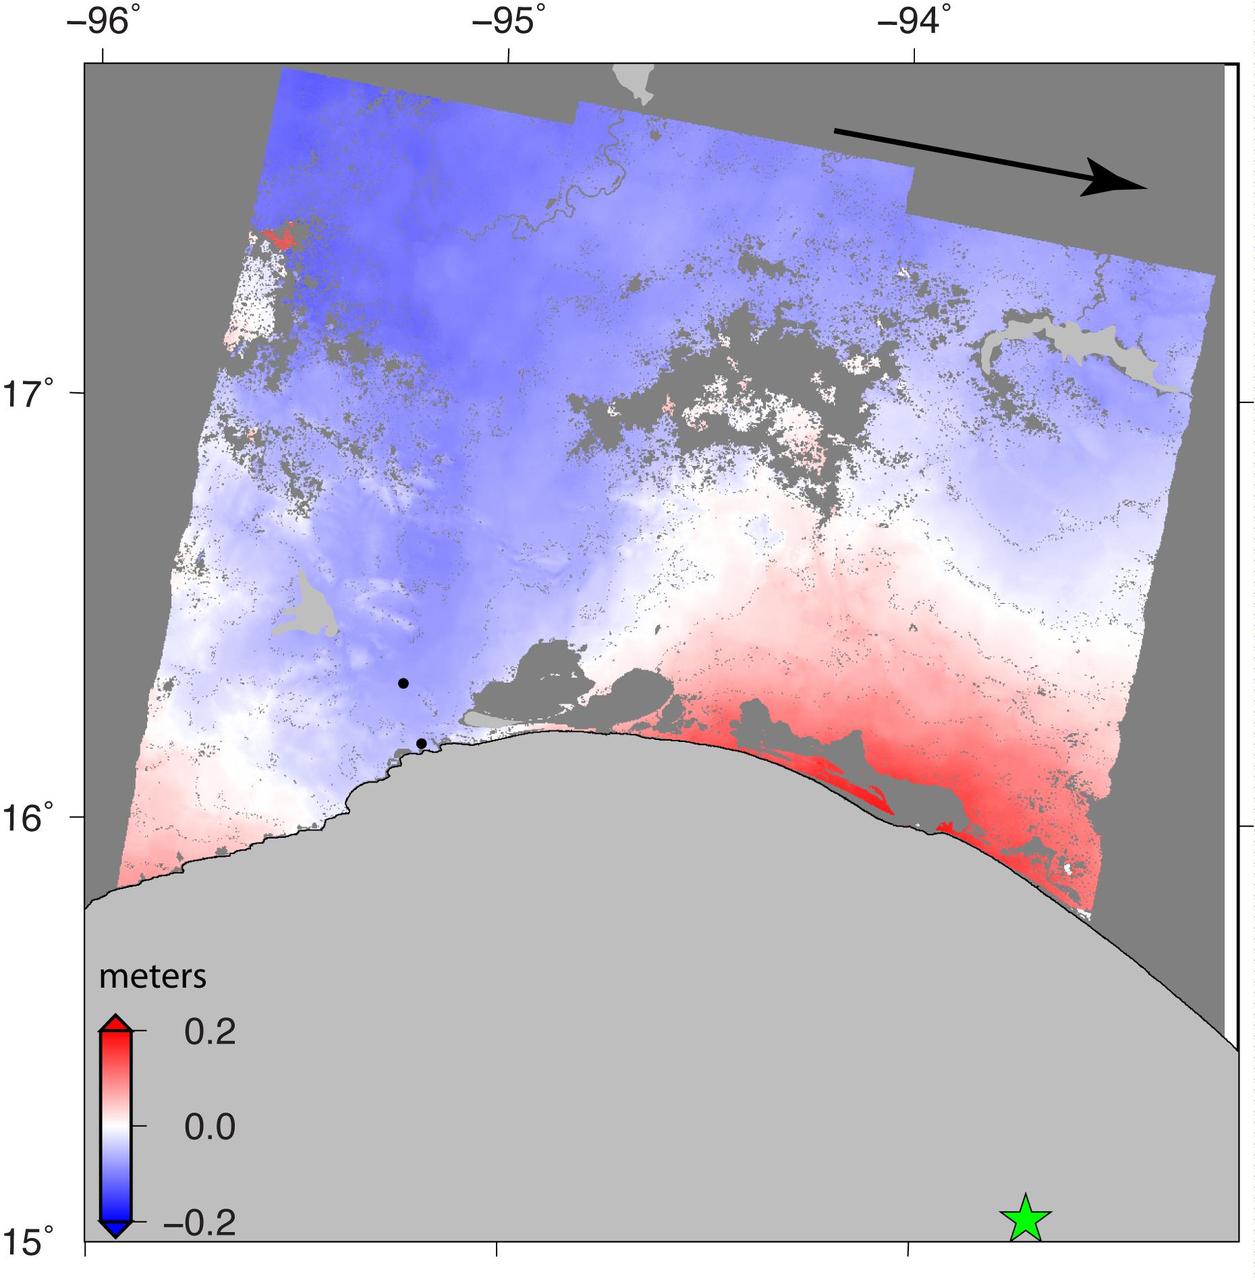
NASA and its partners are contributing important observations and expertise to the ongoing response to the Sept. 7, 2017 (local time), magnitude 8.1 Oaxaca-Chiapas earthquake in Mexico. This earthquake was the strongest in more than a century in Mexico. It has caused a significant humanitarian crisis, with widespread building damage and triggered landslides throughout the region. Scientists with the Advanced Rapid Imaging and Analysis project (ARIA), a collaboration between NASA's Jet Propulsion Laboratory in Pasadena, California; and Caltech, also in Pasadena, analyzed interferometric synthetic aperture radar images from the radar instrument on the Copernicus Sentinel-1A and Sentinel-1B satellites operated by the European Space Agency (ESA) to calculate a map of the deformation of Earth's surface caused by the quake. This false-color map shows the amount of permanent surface movement caused almost entirely by the earthquake, as viewed by the satellite, during a six-day interval between radar images acquired by the two Sentinel-1 satellites on Sept. 7 and Sept. 13, 2017. In this map, the colors of the surface displacements are proportional to the surface motion. The red tones show the areas along the coast of Chiapas and Oaxaca have moved toward the satellite by as much as 9 inches (22 centimeters) in a combination of up and eastward motion. The area in between and farther north with various shades of blue moved away from the satellite, mostly downward or westward, by as much as 6 inches (15 centimeters). Areas without color are open water or heavy vegetation, which prevent the radar from measuring change between the satellite images. Scientists use these maps to build detailed models of the fault slip at depth and associated land movements to better understand the impact on future earthquake activity. The green star shows the location of the earthquake epicenter estimated by the United States Geological Survey (USGS) National Earthquake Information Center. Map contains modified Copernicus Sentinel data 2017, processed by ESA and analyzed by the NASA-JPL/Caltech ARIA team. This research was carried out at JPL under a contract with NASA. Sentinel-1 data were accessed through the Copernicus Open Access Hub. An annotated figures is available at https://photojournal.jpl.nasa.gov/catalog/PIA21962
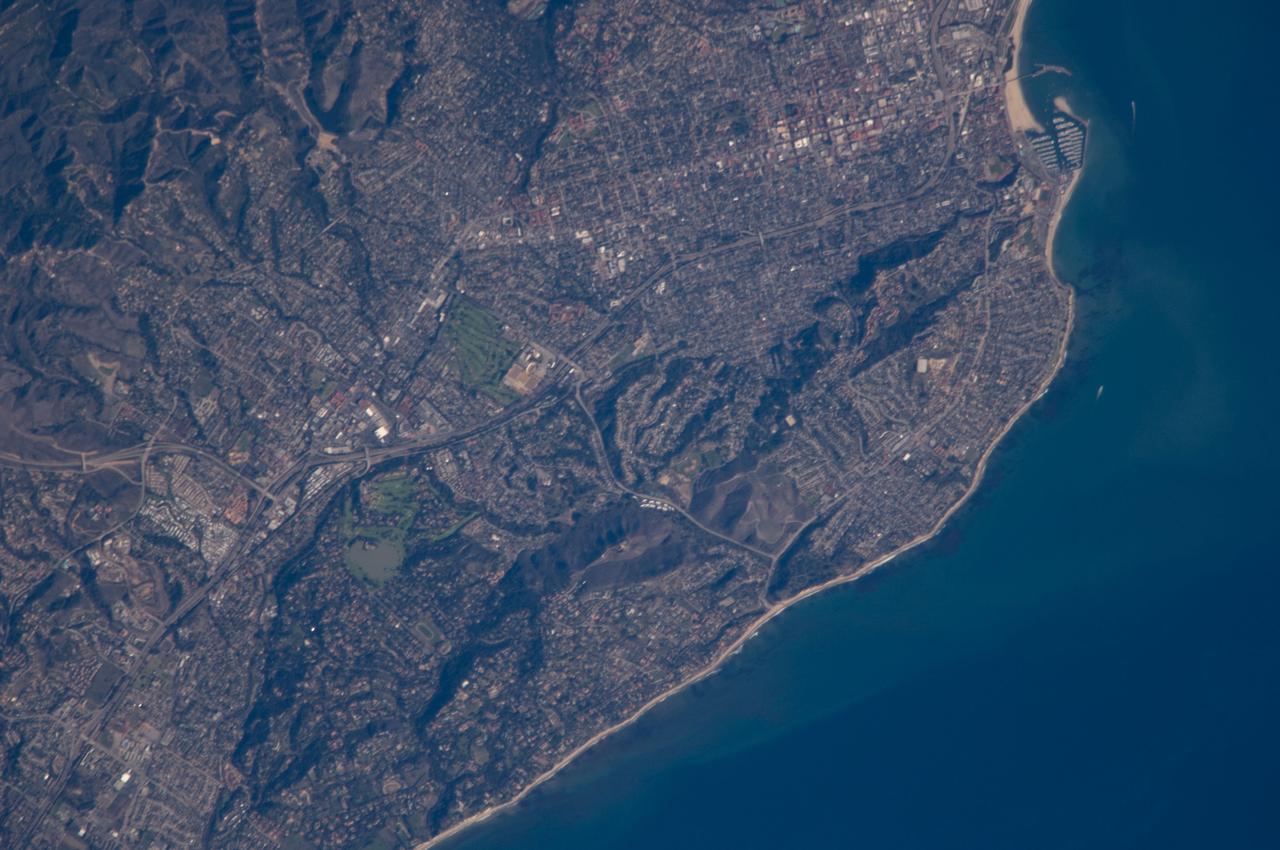
ISS018-E-011096 (6 Dec. 2008) --- Santa Barbara, CA metropolitan area, also known as the ?American Riviera?, is featured in this image photographed by an Expedition 18 crewmember on the International Space Station. The geographic setting of the city - between the Santa Barbara Channel to the south and the steep Santa Ynez Mountains to the north. The city was officially founded as a Spanish mission in 1786, and was incorporated into the United States from Mexico in 1848 following the Mexican-American War. The dramatic landscape of the city is the result of tectonic forces ? the Santa Barbara Channel is part of the boundary between the Pacific oceanic and North American continental crustal plates. Movement along the San Andreas Fault ? the actual zone of contact between the two plates ? over geologic time both raised the Santa Ynez range and lowered the seafloor, forming the deep Santa Barbara Channel. The city has experienced two earthquakes, one in 1812 and another in 1925 that caused significant damage. The urban street grid is defined by white and red rooftops at top center; to the southeast lie beaches and the boat slips of a large marina (top right). Two large golf courses, characterized by expanses of green grass, are visible at center. Low east-west trending hills that parallel the coastline are almost completely covered by residential and commercial development, lending a speckled appearance to the hillsides. Immediately offshore, giant kelp beds are the focus of the Santa Barbara Coastal Long Term Ecological Research site, part of the National Science Foundation?s Long Term Ecological Research Network.

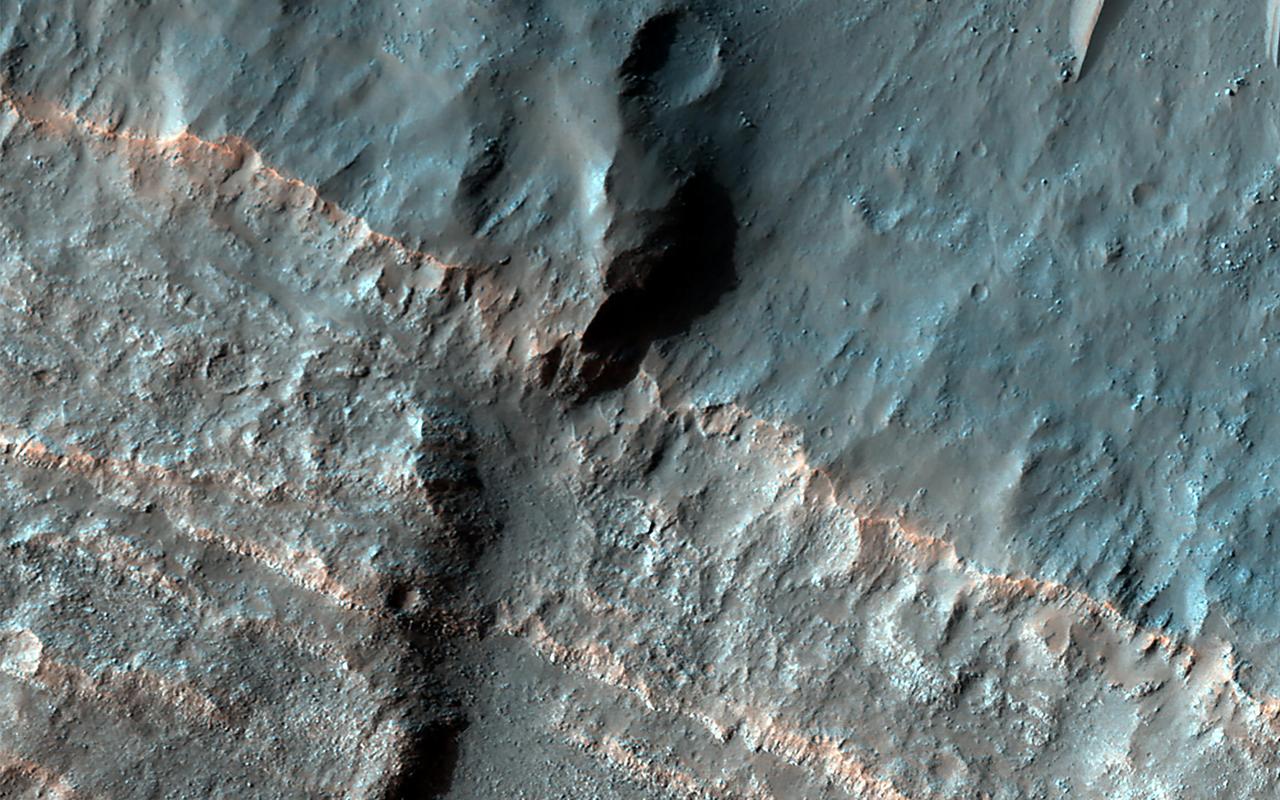
This HiRISE image shows the central pit feature of an approximately 20-kilometer diameter complex crater in located at 304.480 degrees east, -11.860 degrees south, just north of the Valles Marineris. Here we can observe a partial ring of light-toned, massive and fractured bedrock, which has been exposed by the impact-forming event, and via subsequent erosion that typically obscure the bedrock of complex central features. Features such as this one are of particular interest as they provide scientists with numerous exposures of bedrock that can be readily observed from orbit and originate from the deep Martian subsurface. Unlike on Earth, plate tectonics do not appear to be active on Mars. Thus, much of the Martian subsurface is not directly observable through uplift, erosion and exposure of mountain chains, which provide the majority of bedrock exposures on Earth. Exposures of subsurface materials generated by these features provides us with some of the only "windows" into the subsurface geology. This makes the study of impact craters an invaluable source of information when trying to understand, not only the impact process, but also the composition and history of Mars. Although much of what we see here is composed of massive and fractured bedrock, there are zones of rock fragmentation, called "brecciation." These fragmented rocks (a.k.a., breccias) are best viewed in the eastern portion of the central pit, which was captured in a previous HiRISE image. Additionally, we see some occurrences of impact melt-bearing deposits that surround and coat the bedrock exposed within the central pit. Several dunes are on the surface throughout the central pit and surrounding crater floor. The mechanisms behind the formation of central features, particularly central pits, are not completely understood. Geologic mapping of these circumferential "mega" blocks of bedrock indicate radial and concentric fracturing that is consistent with deformation through uplift. The exposed bedrock shows well-expressed lineament features that are likely fractures and faults formed during the uplift process. Studies of the bedrock, and such structures in this image, allows us better to understand the formative events and physical processes responsible for their formation. Current research suggests that their formation is the result of some component of uplift followed by collapse. http://photojournal.jpl.nasa.gov/catalog/PIA21205
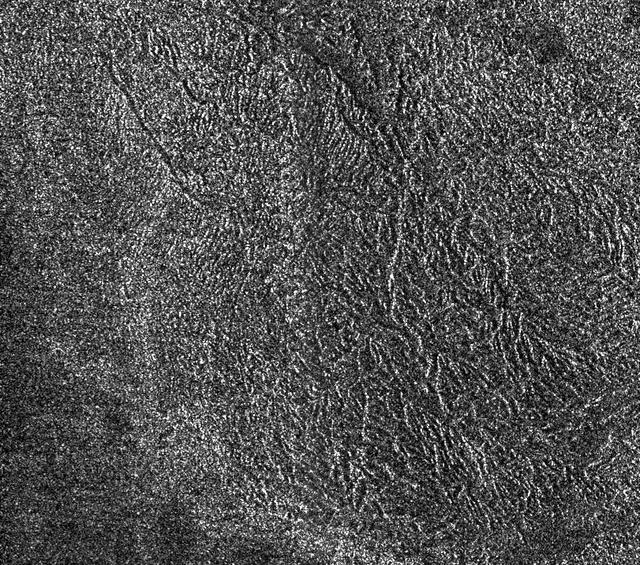
This synthetic-aperture radar image was obtained by NASA's Cassini spacecraft during its T-120 pass over Titan's southern latitudes on June 7, 2016. The image is centered near 47 degrees south, 153 degrees west. It covers an area of 87 by 75 miles (140 by 120 kilometers) and has a resolution of about 1,300 feet (400 meters). Radar illuminates the scene from the left at a 35-degree incidence angle. The features seen here are an excellent example of "labyrinth terrain." Labyrinth terrains on Titan are thought to be higher areas that have been cut apart by rivers of methane, eroded or dissolved as they were either lifted up or left standing above as the region around them lowered. (Other examples of labyrinth terrain can be seen in PIA10219.) In this image, several obvious valley systems have developed, draining liquids from methane rainfall toward the southeast (at top). Several of these systems are near parallel (running from upper left to lower right), suggesting that either the geological structure of the surface or the local topographic gradient (the general slope across the area) may be influencing their direction. Also presented here is an annotated version of the image, along with an aerial photograph of a region in southern Java known as Gunung Kidul that resembles this Titan labyrinth. This region is limestone that has been dissolved and eroded by water, creating a system of canyons called polygonal karst. Like on Titan, the canyons show a trend from upper left to lower right, in this case controlled by faults or joints. (Java photo from Haryono and Day, Journal of Cave and Karst Studies 66 (2004) 62-69, courtesy of Eko Haryono.) http://photojournal.jpl.nasa.gov/catalog/PIA20708
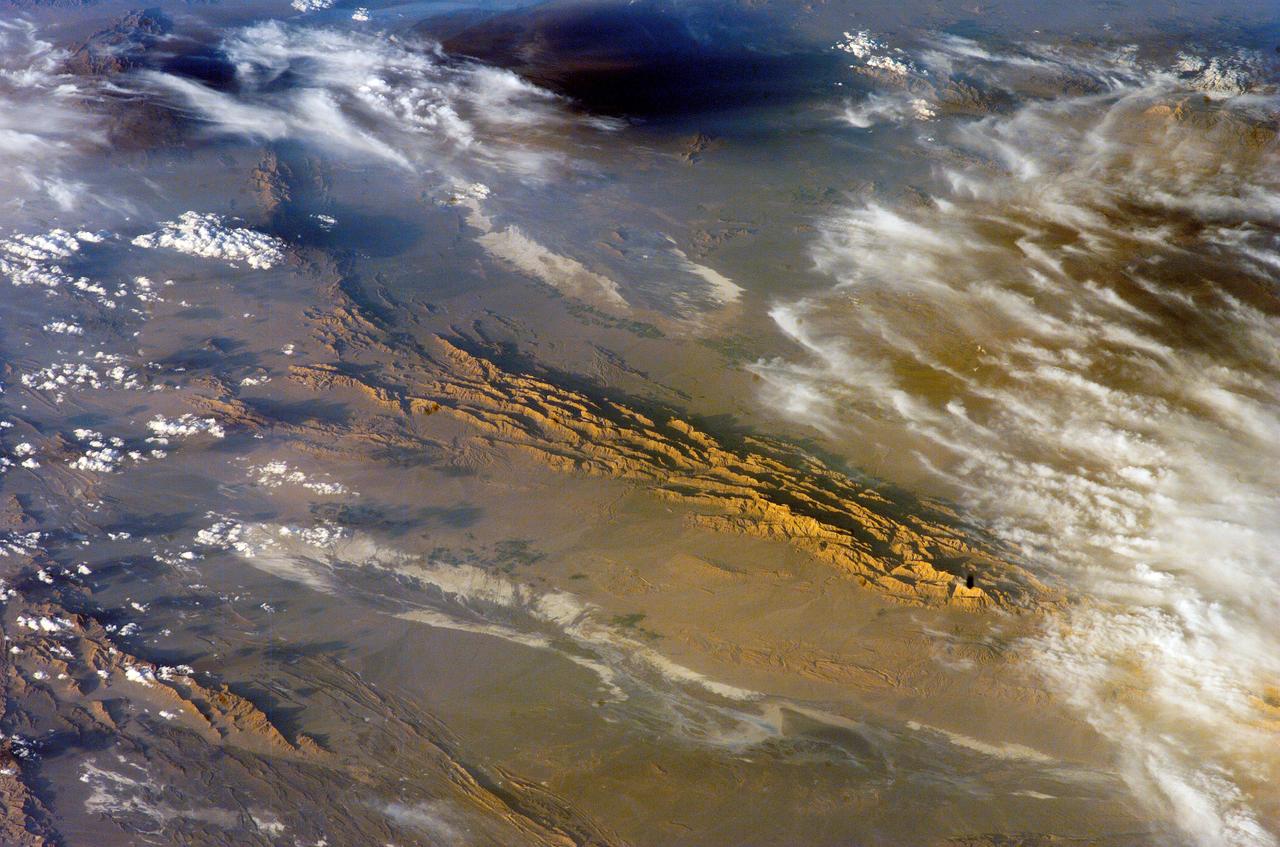
ISS012-E-18779 (28 Feb. 2006) --- Winter in the Dasht-e-Lut Desert, eastern Iran is featured in this image photographed by an Expedition 12 crew member on the International Space Station. The image takes advantage of the low angle of illumination to reveal linear geological structures of the Iranian mountain range bordering the western edge of the basin known as Dasht-e-Lut. The range rises 1818 meters (6000 feet) above sea level and lies 750 kilometers (466 miles) north of the Persian Gulf. The convoluted appearance results from erosion of folded and faulted rocks – softer rocks erode away quickly, leaving more resistant rock to form linear ridges perpendicular to the direction of compression. While not a major oil producing region like the Zagros Fold Belt to the southwest, the mountains of east-central Iran contain economically important deposits of copper and other metals. Little vegetation is visible from space in the arid interior basin of the Dasht-e-Lut. Iran is climatically part of the Afro-Asian belt of deserts that stretch from the Cape Verde islands off West Africa all the way to Mongolia near Beijing. The patchy, elongated, light-colored feature in the foreground (parallel to the mountain range) is the northernmost of the Dasht dry lakes that stretch southward 300 kilometers (186 miles). High country is the source of precipitation-derived water in all near-tropical deserts. Agricultural fields (small dark patches in the image) that depend on this precipitation are located down slope near the margin of the dry, salty soils of the lake.
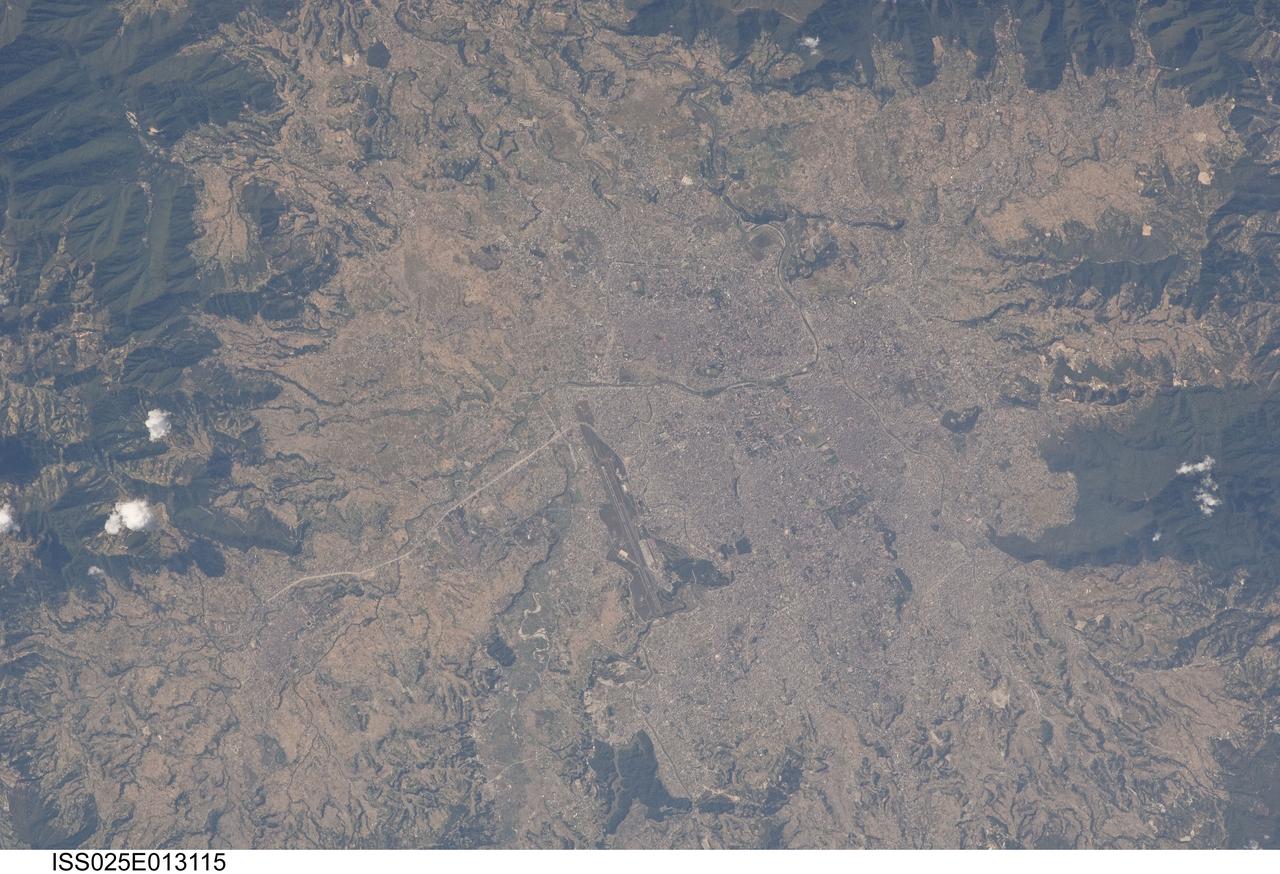
ISS025-E-013115 (9 Nov. 2010) --- Kathmandu, Nepal is featured in this image photographed by an Expedition 25 crew member on the International Space Station. The capital and largest city of Nepal, Kathmandu occupies much of the Kathmandu Valley located near the center of the country. Nepal itself contains much of the Himalaya mountain range between China (Tibet) to the north and India to the south. Geological and fossil evidence indicates that the Kathmandu Valley was filled by a large lake (Paleo-Kathmandu Lake) between approximately 2.8 million and 10,000 years ago, according to scientists. Geologists believe the lake drained in phases over time due both to a drier regional climate, continuing tectonic uplift and faulting in the region, and formation of an integrated valley drainage system as river channels cut through previous natural rock ridge dams. The green vegetated slopes that ring the Kathmandu metro area (light gray, center) include both forest reserves and national parks. The metropolitan area is relatively flat compared to the surrounding high mountains. Tribhuvan International Airport, located near the current eastern margin of the metro area, is the only international airport in Nepal. Archeological evidence suggests that the development of Kathmandu, together with the nearby “sister cities” of Lalitpur and Bhaktapur, began almost 2,000 years ago. Today, Kathmandu and its sister cities form the governmental, cultural, and—as a main access point to the Himalayas for tourism—economic center of the country.

ISS015-E-07928 (13 May 2007) --- Isla San Lorenzo and Isla Las Animas are featured in this image photographed by an Expedition 15 crewmember on the International Space Station. Located in the northern Gulf of California, Isla (island) San Lorenzo and Isla Las Animas -- part of the Midriff Islands -- record geologic processes involved in the creation of the Baja California peninsula over several hundred million years, according to scientists. A geologist walking along the 17-kilometer long central ridge of Isla San Lorenzo from the southeastern to the northwestern end would first encounter Cretaceous granitic rock in the southeastern third of the island (light tan, center left). The central third of the island is comprised mainly of older Paleozoic metamorphic rocks (brown, center; directly above "Isla San Lorenzo"). Together, these very old rocks form the crystalline "basement" of the island. The northwestern third of Isla San Lorenzo, and much of adjacent Isla Las Animas, is composed of much more recent volcanic and marine sedimentary rocks (yellow-brown to light brown, center right). According to scientists, these rocks were formed by volcanoes and fissure eruptions in and around basins in the growing Gulf of California between 5-8 million years ago. The islands themselves were formed as a result of uplift of crustal blocks along the southeastward-trending San Andreas Fault. This image illustrates the largely pristine nature of these islands. The islands are located in the rain shadow of mountains on the Baja Peninsula to the west, and arid conditions prevail through much of the year. The scarcity of water has limited human presence on the islands, and allowed flora and fauna unique to each island (known as endemic species) to flourish -- particularly reptiles. The islands are also home to colonies of seabirds and seals, both of which take advantage of deep productive waters adjacent to the eastern Baja coast. Shallow waters and high levels of nutrients can also lead to blooms of green phytoplankton; two such blooms can be seen along the coastline of Isla Las Animas (center right, in north and west-facing embayments). Surface water patterns around the islands -- enhanced by sunlight reflectance off the water surface -- are due to wind- and current-induced roughness (silver-gray regions). Regions of dark blue water are indicative of calm surface conditions, or the presence of oils and surfactants that decrease surface tension.
STS059-S-085 (18 April 1994) --- This is a three-dimensional perspective view of part of Isla Isabela in the western Galapagos Islands. It was taken by the L-Band radar in HH polarization from the Spaceborne Imaging Radar-C and X-Band Synthetic Aperture Radar (SIR-C/X-SAR) on the 40th orbit of the Space Shuttle Endeavour. This view was constructed by overlaying a SIR-C radar image on a U.S. Geological Survey digital elevation map. The image is centered at about .5 degrees south latitude and 91 degrees west longitude, and covers an area of 75 by 60 kilometers. The radar incidence angle at the center of the image is about 20 degrees. The western Galapagos Islands, which lie about 1200 kilometers west of Ecuador in the eastern Pacific, have six active volcanoes similar to the volcanoes found in Hawaii. Since the time of Charles Darwin's visit to the area in 1835, there have been over 60 recorded eruptions on these volcanoes. This SIR-C/X-SAR image of Alcedo and Sierra Negra volcanoes shows the rougher lava flows as bright features, while ash deposits and smooth pahoehoe lava flows appear dark. The Galapagos Islands are one of the SIR-C/X-SAR supersites and data of this area will be taken several times during the flight to allow scientists to conduct topographic change studies and to search for different lava flow types, ash deposits and fault lines. SIR-C/X-SAR is part of NASA's Mission to Planet Earth (MTPE). SIR-C/X-SAR radars illuminate Earth with microwaves allowing detailed observations at any time, regardless of weather or sunlight conditions. SIR-C/X-SAR uses three microwave wavelengths: L-Band (24 cm), C-Band (6 cm), and X-Band (3 cm). The multi-frequency data will be used by the international scientific community to better understand the global environment and how it is changing. The SIR-C/X-SAR data, complemented by aircraft and ground studies, will give scientists clearer insights into those environmental changes which are caused by nature and those changes which are induced by human activity. SIR-C was developed by NASA's Jet Propulsion Laboratory (JPL). X-SAR was developed by the Dornire and Alenia Spazio Companies for the German Space Agency, Deutsche Agentur fuer Raumfahrtangelegenheiten (DARA), and the Italian Space Agency, Agenzia Spaziale Italiana (ASI). JPL Photo ID: P-43938
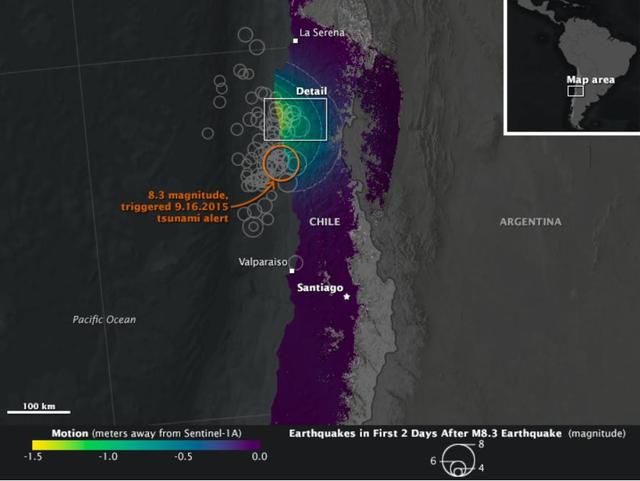
On Sept. 16, 2015, a magnitude 8.3 earthquake struck near the coast of central Chile along the boundary of the Nazca and South American tectonic plates. Dubbed the Illapel earthquake, the shaking lasted at least three minutes and propelled a 15-foot (4.5-meter) tsunami that washed into Coquimbo and other coastal areas. Smaller tsunami waves raced across the Pacific and showed up on the shores of Hawaii and other islands. The earthquake and tsunami caused substantial damage in several Chilean coastal towns, and at least 13 deaths have been reported. Demanding building codes and extensive disaster preparedness helped to limit the loss of life and property. The maps above, known as interferograms, show how the quake moved the ground, as observed by the Copernicus Sentinel-1A satellite (operated by the European Space Agency) and reported by ground stations to the U.S. Geological Survey. Sentinel-1A carries a synthetic aperture radar (SAR) instrument, which beams radio signals toward the ground and measures the reflections to determine the distance between the ground and the satellite. By comparing measurements made on Aug. 24 and Sept. 17, Cunren Liang, Eric Fielding, and other researchers from NASA's Jet Propulsion Laboratory were able to determine how the land surface shifted during and after the earthquake. Interferograms can be used to estimate where the fault moved deep in Earth and which areas have increased stress and higher likelihood of future earthquakes. The details can also provide important information to better understand the earthquake process. On both the close-up and the broad-view maps, the amount of land motion is represented in shades from yellow to purple. Areas where the ground shifted the most (vertically, horizontally, or both) are represented in yellow, while areas with little change are represented in purple. Circles show the location of earthquakes and aftershocks in the two days after the initial 8.3 earthquake, as reported by the USGS National Earthquake Information Center. Larger quakes are represented by larger circles. The base map layer uses a digital elevation model and a bathymetry map to show the contours of the land surface and seafloor. The interferograms above show that land moved as much as 1.4 meters toward to satellite (generally in the vertical direction) near the coast, and early estimates of the horizontal motion suggest it was as much as 2 meters. While SAR can see through clouds and the dark of night, it cannot see much through water. It is likely that much of the ground deformation from the earthquake occurred underwater, which explains the formation of the tsunami and the location of many aftershocks. http://photojournal.jpl.nasa.gov/catalog/PIA20002

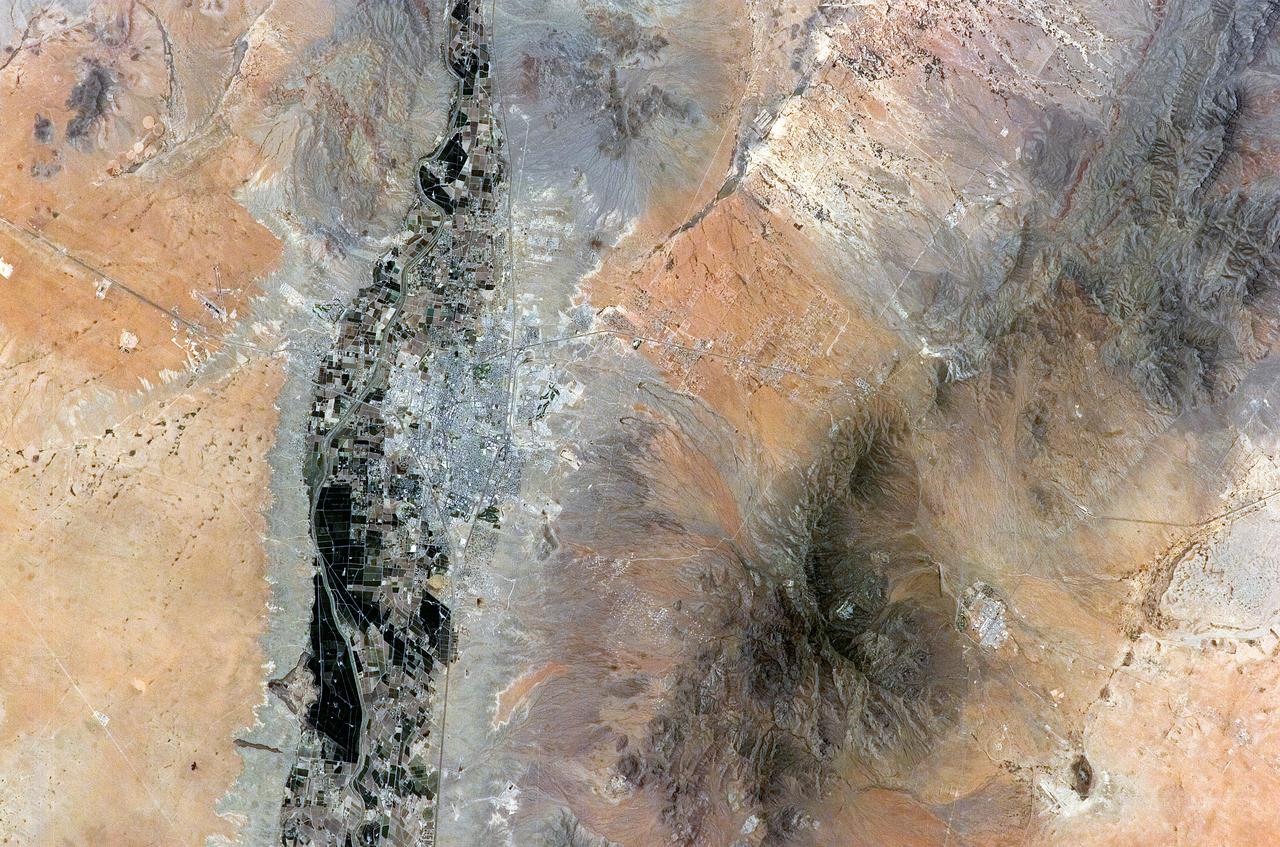
NASA image acquired July 27, 2001 In southwestern Jordan lies an unusual landscape. Mountains of granite and sandstone rise next to valleys filled with red sand. Some of the mountains reach a height of about 1,700 meters (5,600 feet) above sea level, and many have near-vertical slopes. So alien is this landscape, it’s nicknamed “Valley of the Moon,” and it has served as the film set for a movie about Mars. Yet nomadic people have lived here for thousands of years. Declared a protected area in 1998, this unearthly landscape is Wadi Rum. The Advanced Land Imager (ALI) on NASA’s Earth Observing-1 (EO-1) satellite captured this natural-color image on July 27, 2001. The scene includes part of Wadi Rum and an adjacent area to the east. East of the protected area, fields with center-pivot irrigation make circles of green and brown (image upper right). As the earth tones throughout the image attest, the area is naturally arid, receiving little annual precipitation and supporting only sparse vegetation. Between rocky peaks, the sandy valleys range in color from beige to brick. Ancient granite rocks dating from the Precambrian underlie younger rocks, and some of these basement rocks have eroded into rugged, steep-sloped mountains. The granite mountains have risen thanks partly to crisscrossing fault lines under the park. Overlying the granite are sandstones from the Cambrian and Ordovician Periods, as well as loose sands. Lawrence of Arabia, who fought in the Arab Revolt of 1917–1918, made frequent references to Wadi Rum in his book The Seven Pillars of Wisdom. Likewise, a prominent feature of the protected area is named after the book. Several popular sites in Wadi Rum bear Lawrence of Arabia’s name, but whether he actually visited those sites is uncertain. To download the full high res go to: <a href="http://earthobservatory.nasa.gov/IOTD/view.php?id=49945" rel="nofollow">earthobservatory.nasa.gov/IOTD/view.php?id=49945</a> NASA Earth Observatory image created by Jesse Allen and Robert Simmon, using EO-1 ALI data provided courtesy of the NASA EO-1 team and the United States Geological Survey. Caption by Michon Scott. Instrument: EO-1 - ALI Credit: <b><a href="http://www.earthobservatory.nasa.gov/" rel="nofollow"> NASA Earth Observatory</a></b> <b><a href="http://www.nasa.gov/centers/goddard/home/index.html" rel="nofollow">NASA Goddard Space Flight Center</a></b> enables NASA’s mission through four scientific endeavors: Earth Science, Heliophysics, Solar System Exploration, and Astrophysics. Goddard plays a leading role in NASA’s accomplishments by contributing compelling scientific knowledge to advance the Agency’s mission. <b>Follow us on <a href="http://twitter.com/NASA_GoddardPix" rel="nofollow">Twitter</a></b> <b>Join us on <a href="http://www.facebook.com/pages/Greenbelt-MD/NASA-Goddard/395013845897?ref=tsd" rel="nofollow">Facebook</a></b>
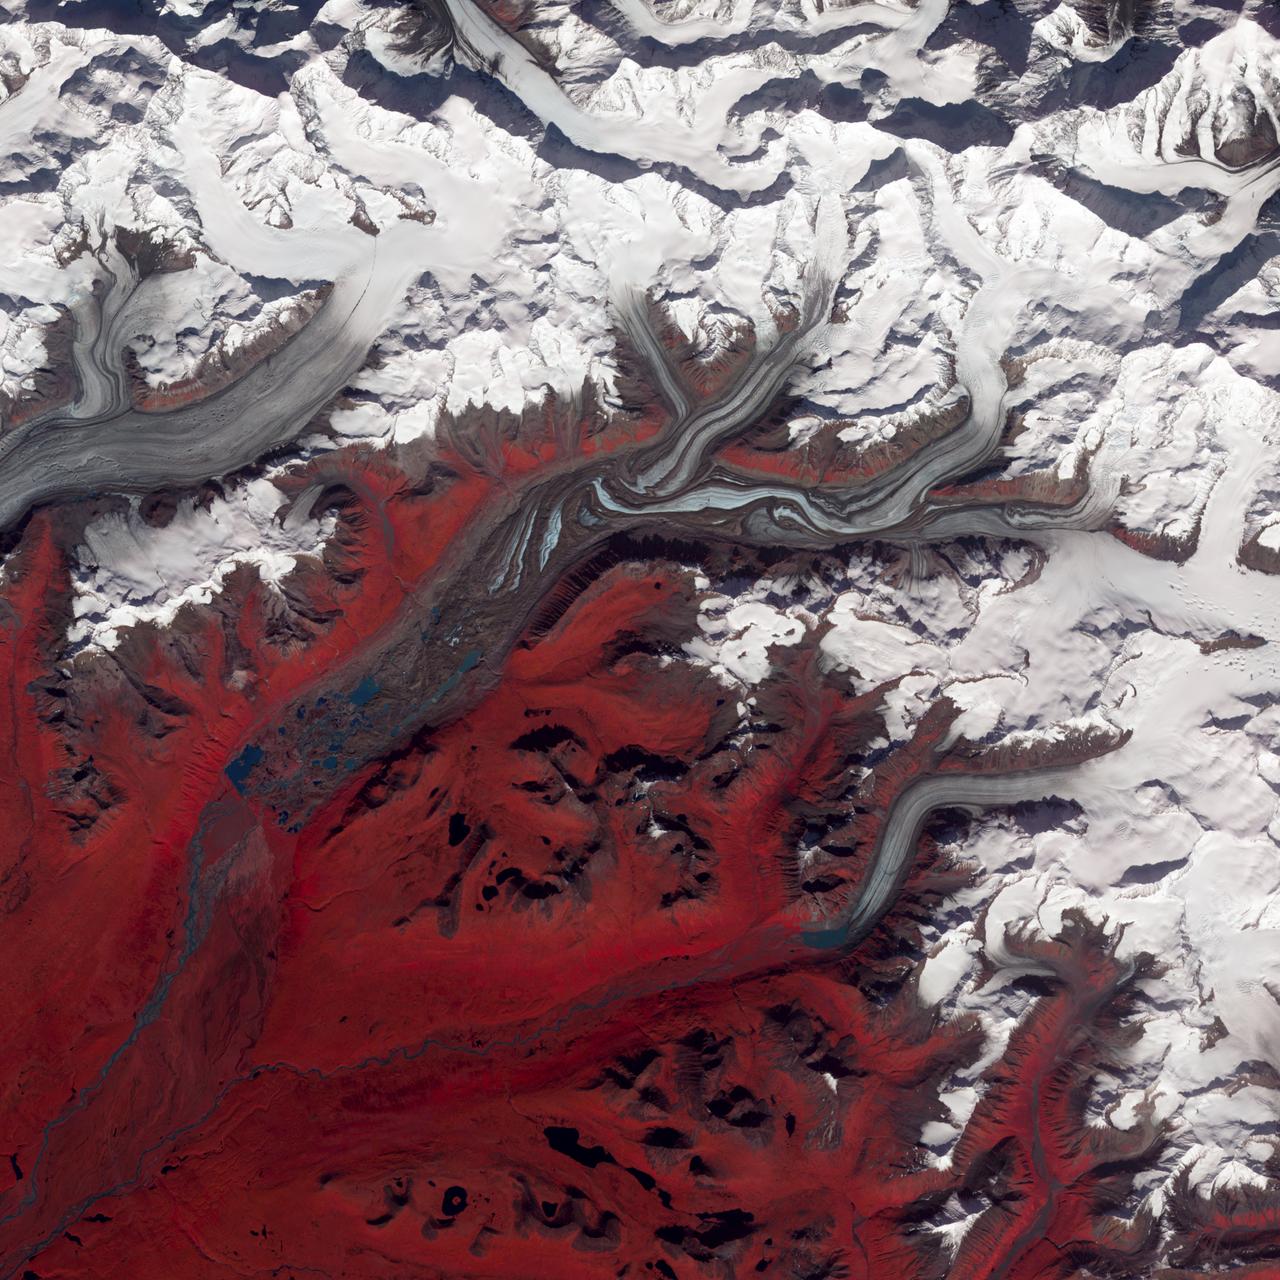
NASA image acquired August 27, 2009 Like rivers of liquid water, glaciers flow downhill, with tributaries joining to form larger rivers. But where water rushes, ice crawls. As a result, glaciers gather dust and dirt, and bear long-lasting evidence of past movements. Alaska’s Susitna Glacier revealed some of its long, grinding journey when the Advanced Spaceborne Thermal Emission and Reflection Radiometer (ASTER) on NASA’s Terra satellite passed overhead on August 27, 2009. This satellite image combines infrared, red, and green wavelengths to form a false-color image. Vegetation is red and the glacier’s surface is marbled with dirt-free blue ice and dirt-coated brown ice. Infusions of relatively clean ice push in from tributaries in the north. The glacier surface appears especially complex near the center of the image, where a tributary has pushed the ice in the main glacier slightly southward. A photograph taken by researchers from the U.S. Geological Survey (archived by the National Snow and Ice Data Center) shows an equally complicated Susitna Glacier in 1970, with dirt-free and dirt-encrusted surfaces forming stripes, curves, and U-turns. Susitna flows over a seismically active area. In fact, a 7.9-magnitude quake struck the region in November 2002, along a previously unknown fault. Geologists surmised that earthquakes had created the steep cliffs and slopes in the glacier surface, but in fact most of the jumble is the result of surges in tributary glaciers. Glacier surges—typically short-lived events where a glacier moves many times its normal rate—can occur when melt water accumulates at the base and lubricates the flow. This water may be supplied by meltwater lakes that accumulate on top of the glacier; some are visible in the lower left corner of this image. The underlying bedrock can also contribute to glacier surges, with soft, easily deformed rock leading to more frequent surges. NASA Earth Observatory image created by Jesse Allen and Robert Simmon, using data provided courtesy of NASA/GSFC/METI/ERSDAC/JAROS, and U.S./Japan ASTER Science Team. Caption by Michon Scott. Instrument: Terra - ASTER Credit: <b><a href="http://www.earthobservatory.nasa.gov/" rel="nofollow"> NASA Earth Observatory</a></b> <b><a href="http://www.nasa.gov/centers/goddard/home/index.html" rel="nofollow">NASA Goddard Space Flight Center</a></b> enables NASA’s mission through four scientific endeavors: Earth Science, Heliophysics, Solar System Exploration, and Astrophysics. Goddard plays a leading role in NASA’s accomplishments by contributing compelling scientific knowledge to advance the Agency’s mission. <b>Follow us on <a href="http://twitter.com/NASA_GoddardPix" rel="nofollow">Twitter</a></b> <b>Join us on <a href="http://www.facebook.com/pages/Greenbelt-MD/NASA-Goddard/395013845897?ref=tsd" rel="nofollow">Facebook</a></b>