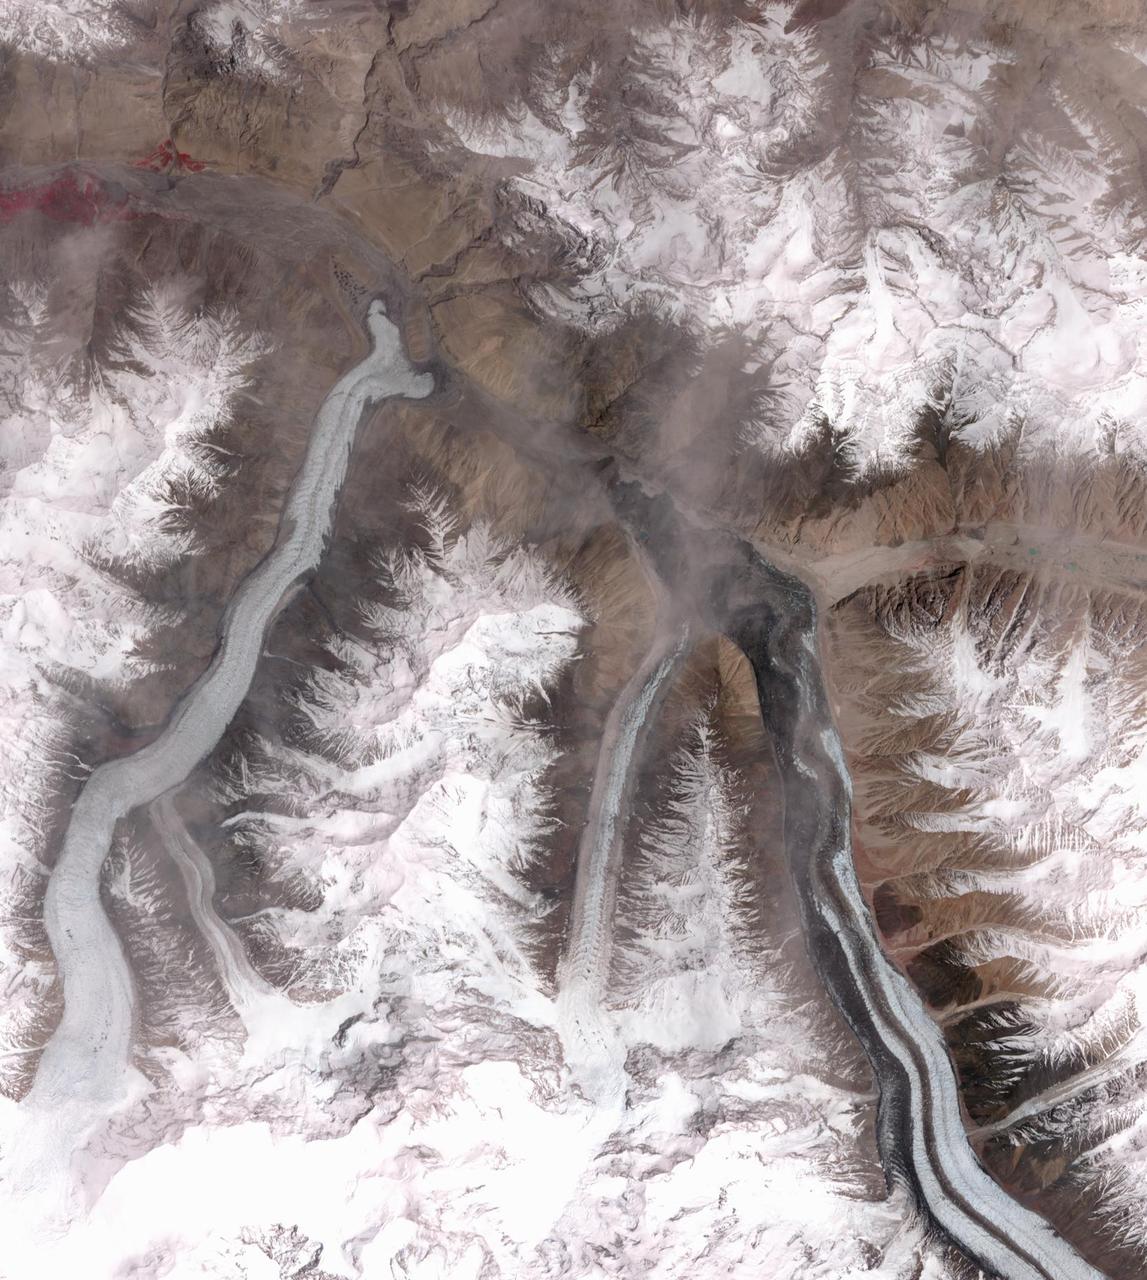
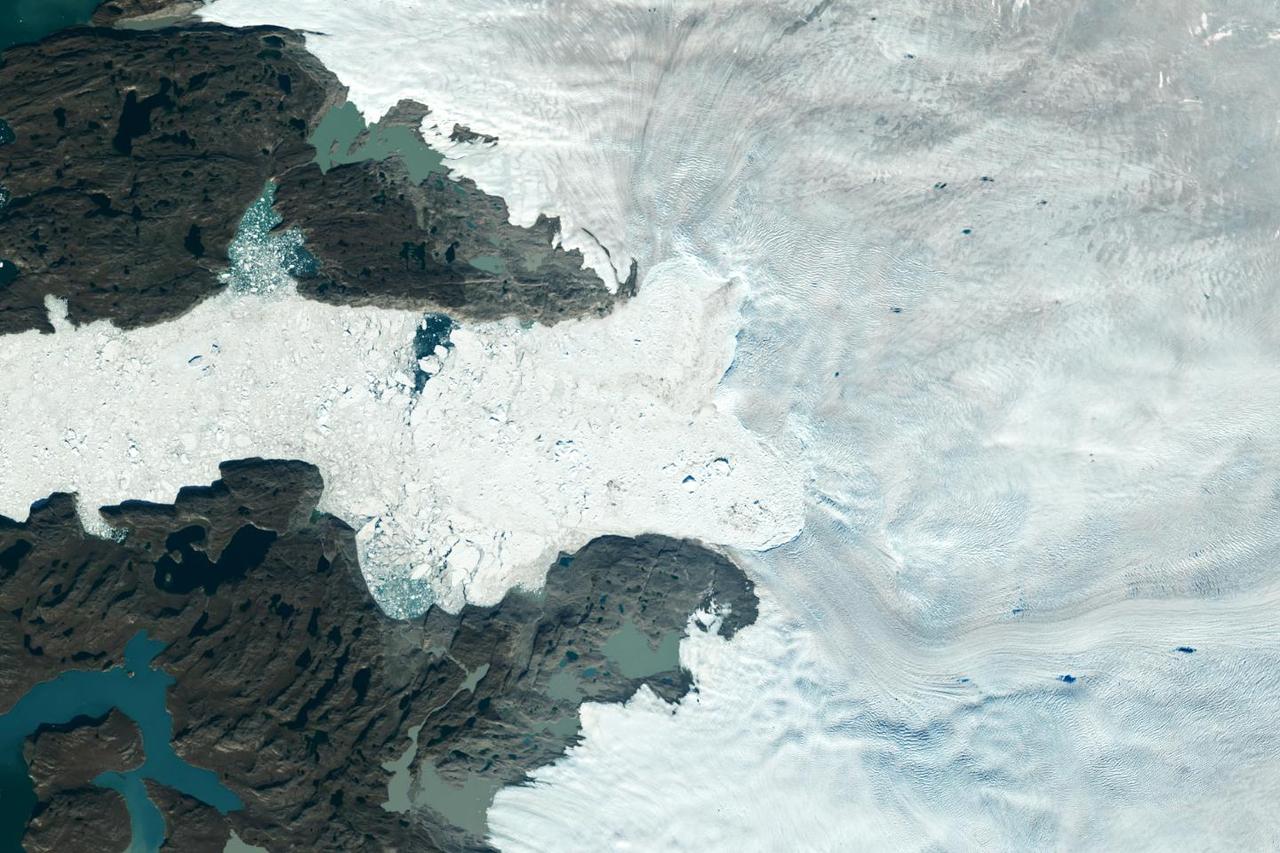
In October 2016, the Khurdopin Glacier in Pakistan began a rapid surge after 20 years of little movement. By March, 2017, a large lake had formed in the Shimshal River, where the glacier had formed a dam. Fortunately, the river carved an outlet through the glacier before the lake could empty catastrophically. In this pair of ASTER images, acquired August 20, 2015 and May 21, 2017, the advance of the Khurdopin Glacier (dark gray and white "river" in lower right quarter of image) is obvious by comparing the before and after images. The images cover an area of 25 by 27.8 km, and are located at 36.3 degrees north, 75.5 degrees east. https://photojournal.jpl.nasa.gov/catalog/PIA22304
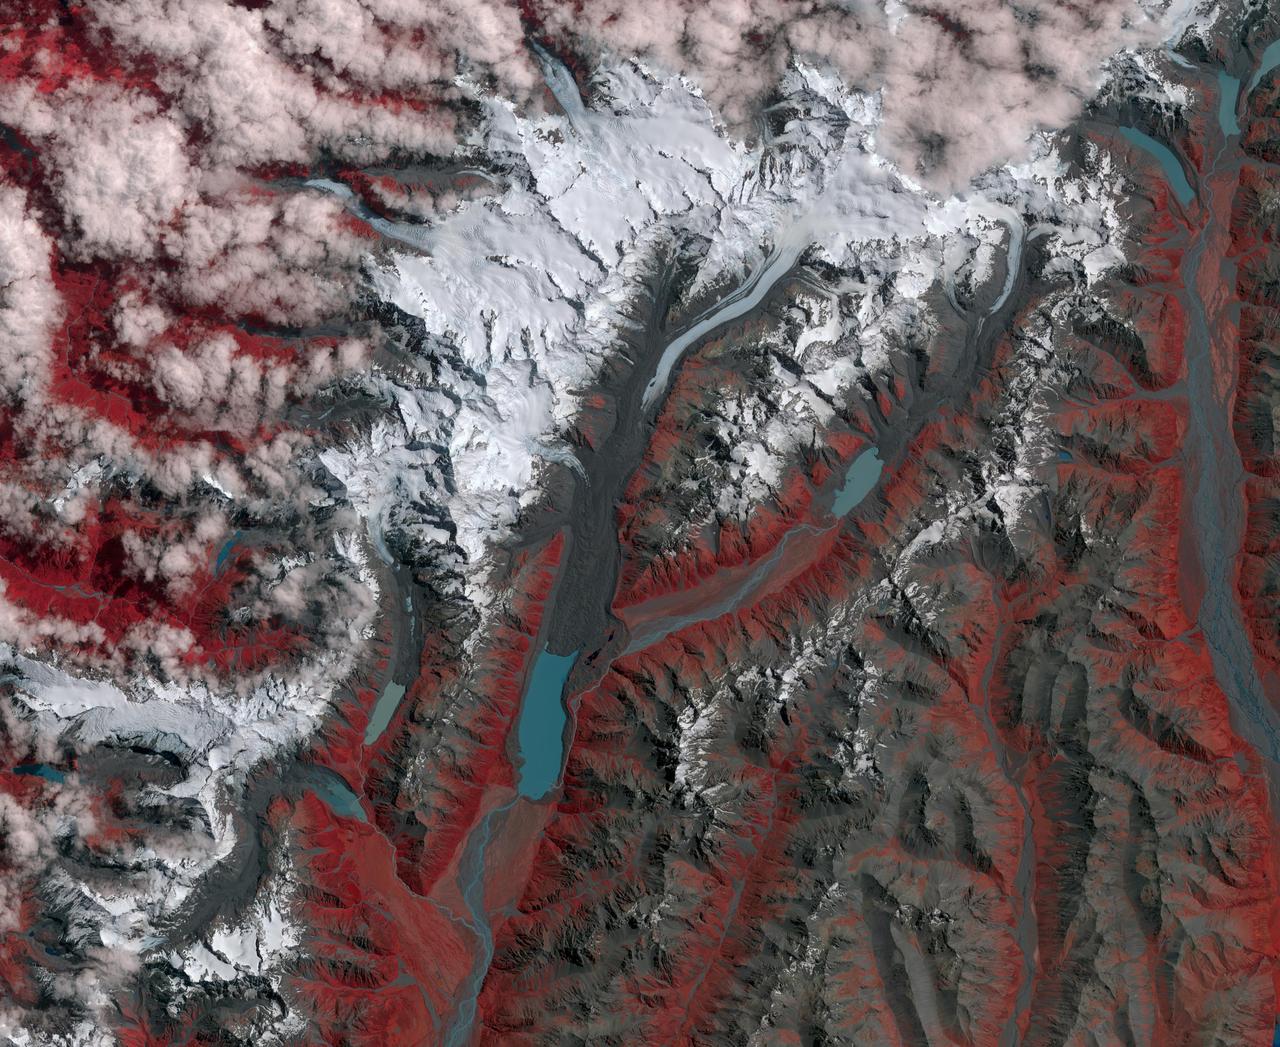
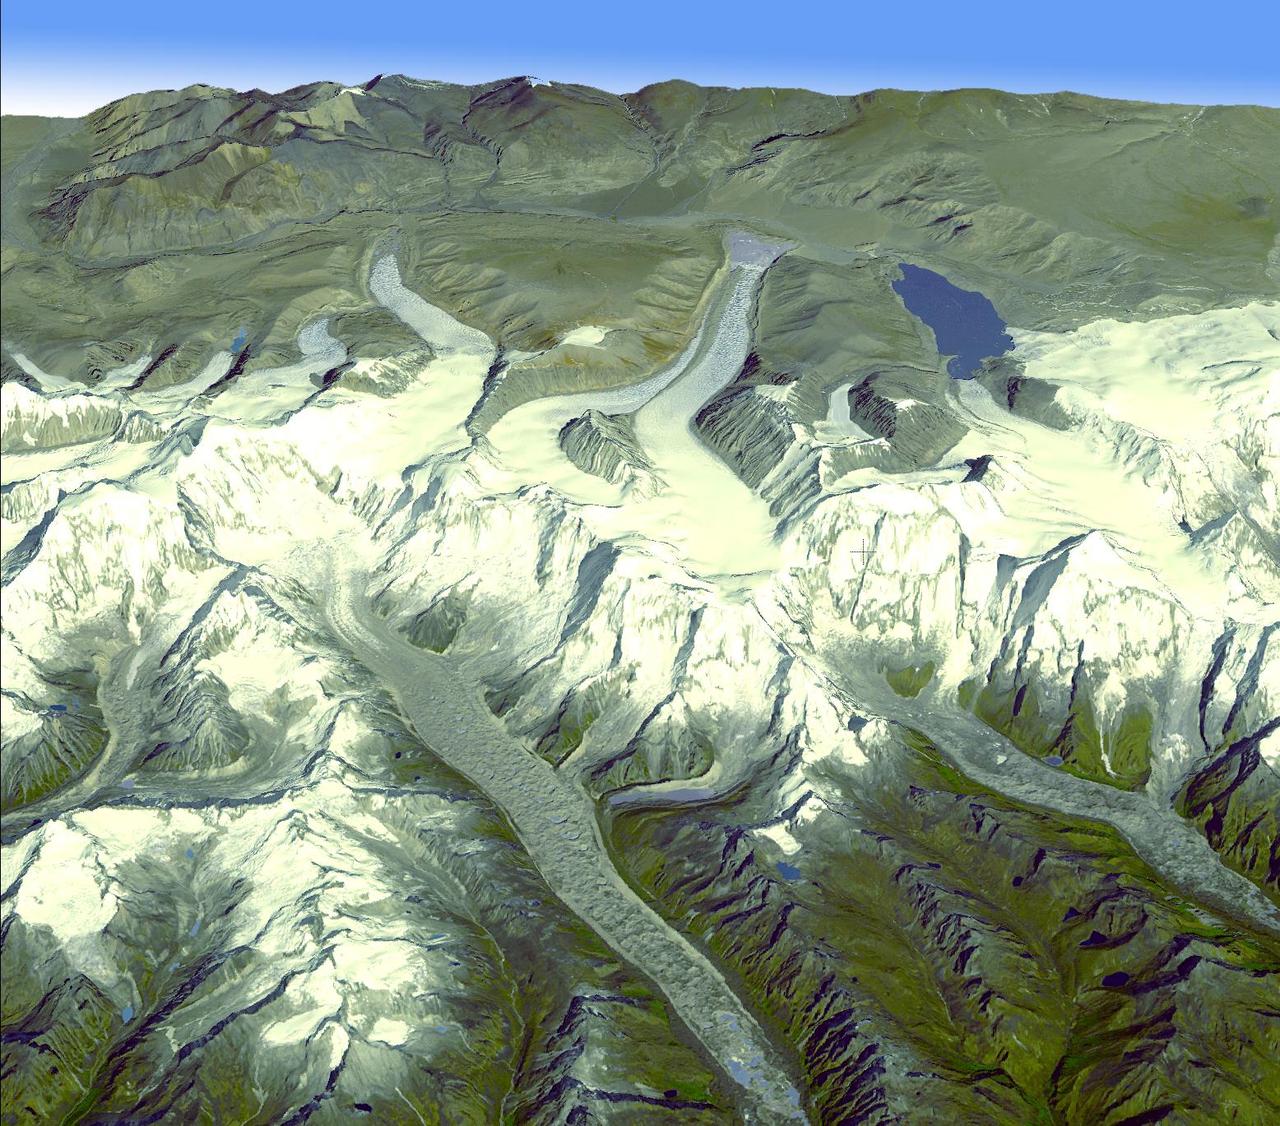
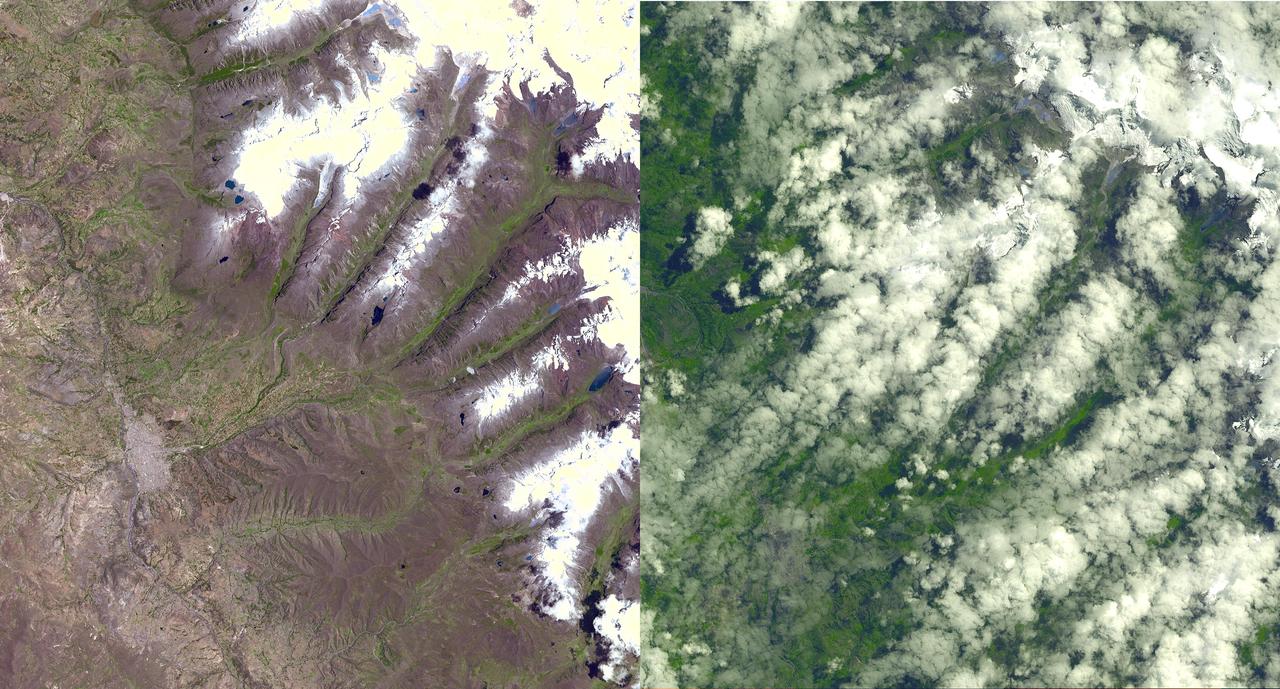
New Zealand contains over 3,000 glaciers, most of which are in the Southern Alps on the South Island. Since 1890, the glaciers have been retreating, with short periods of small advances, as shown in this image from NASA Terra spacecraft. The image cover an area of 39 by 46 km, and are located at 43.7 degrees south, 170 degrees east. http://photojournal.jpl.nasa.gov/catalog/PIA21509

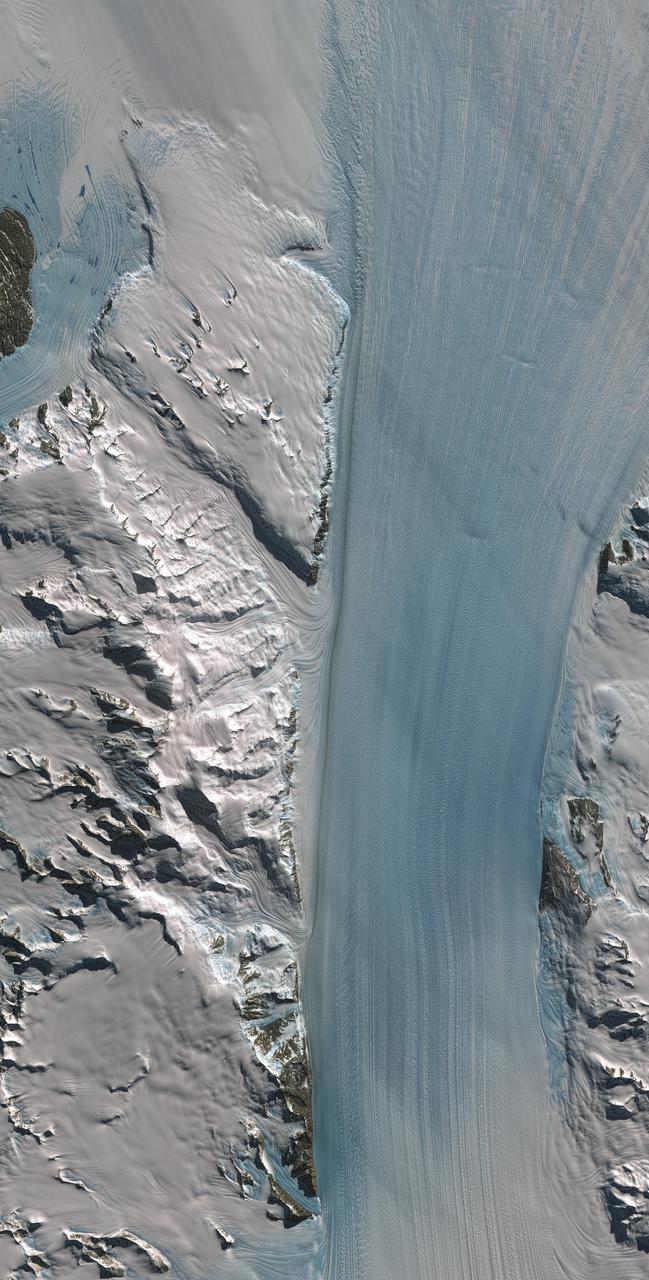
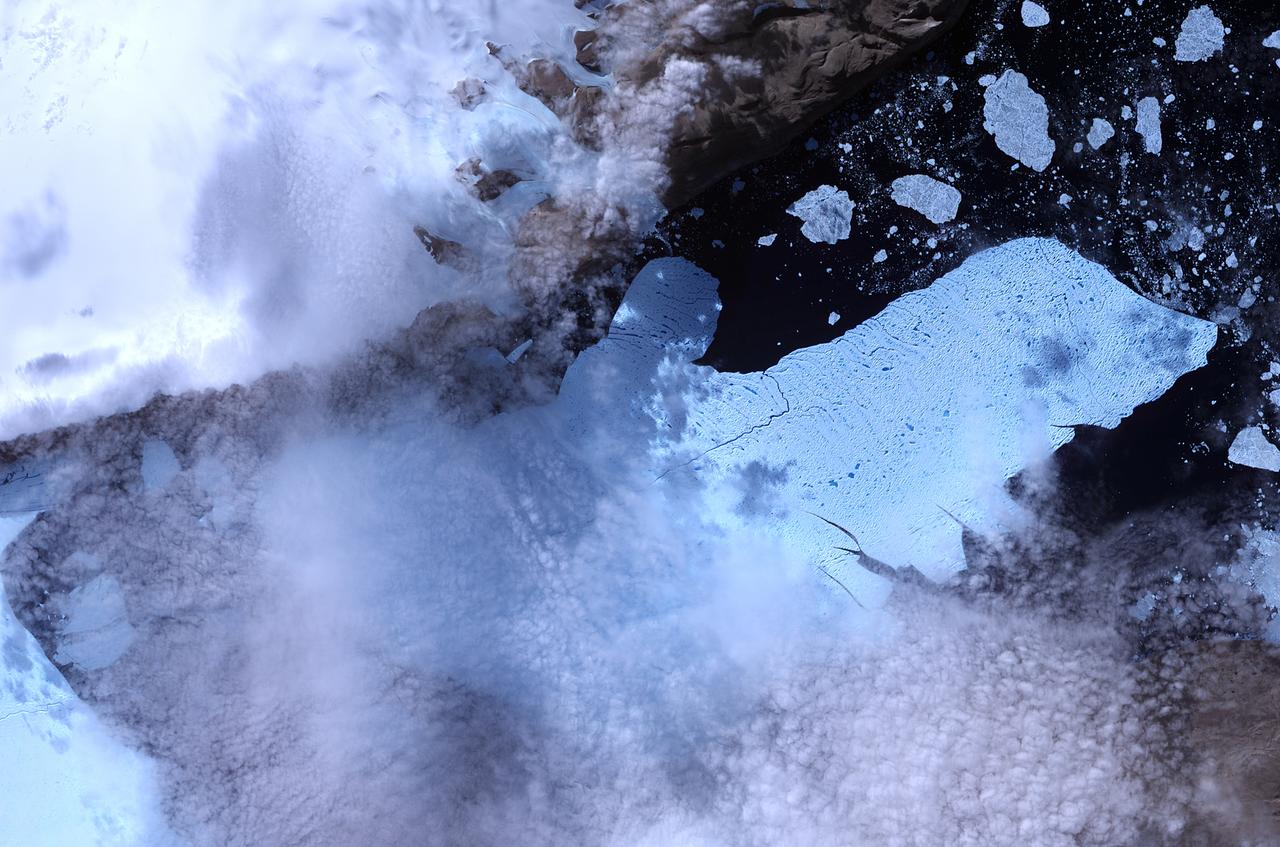
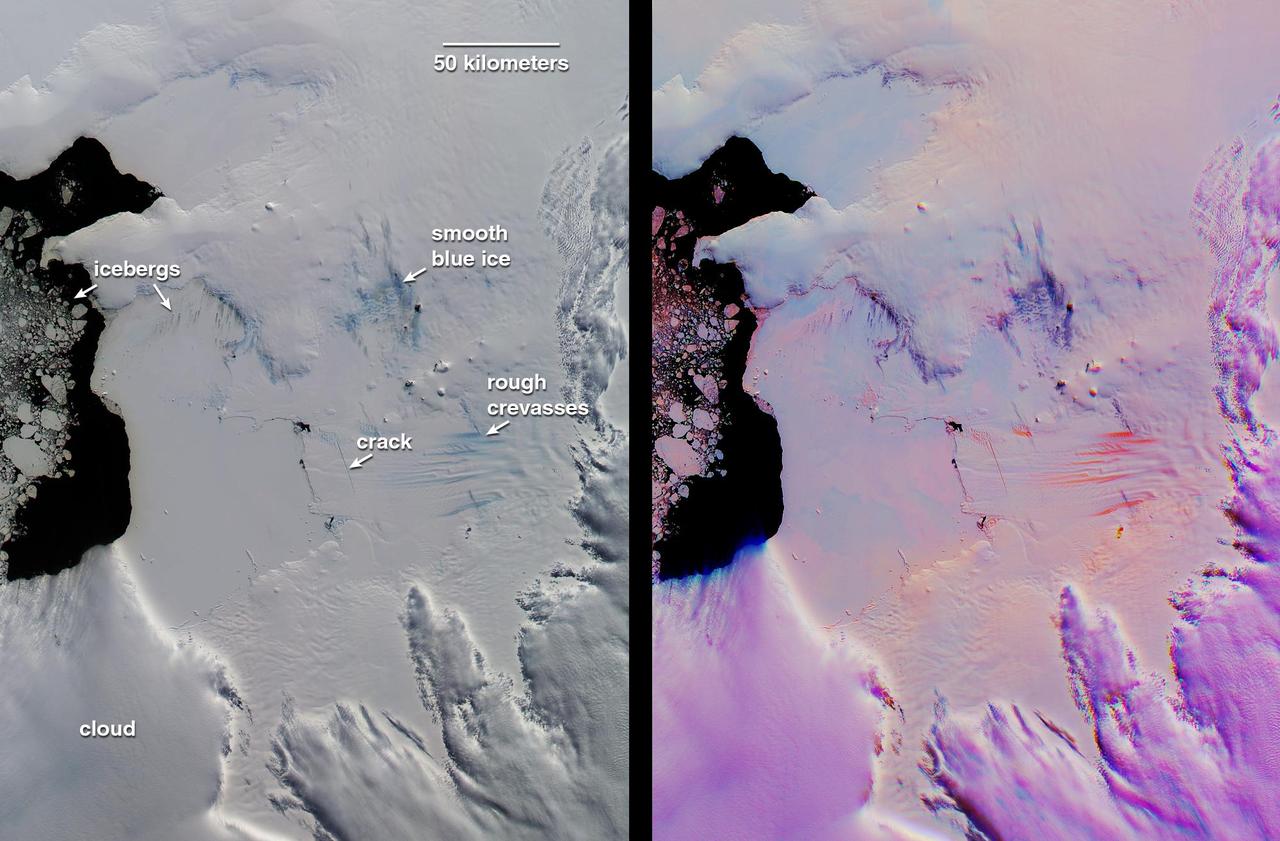
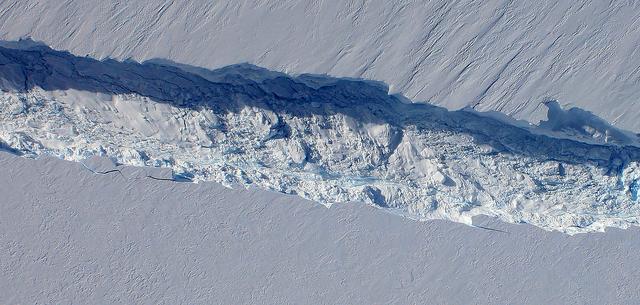
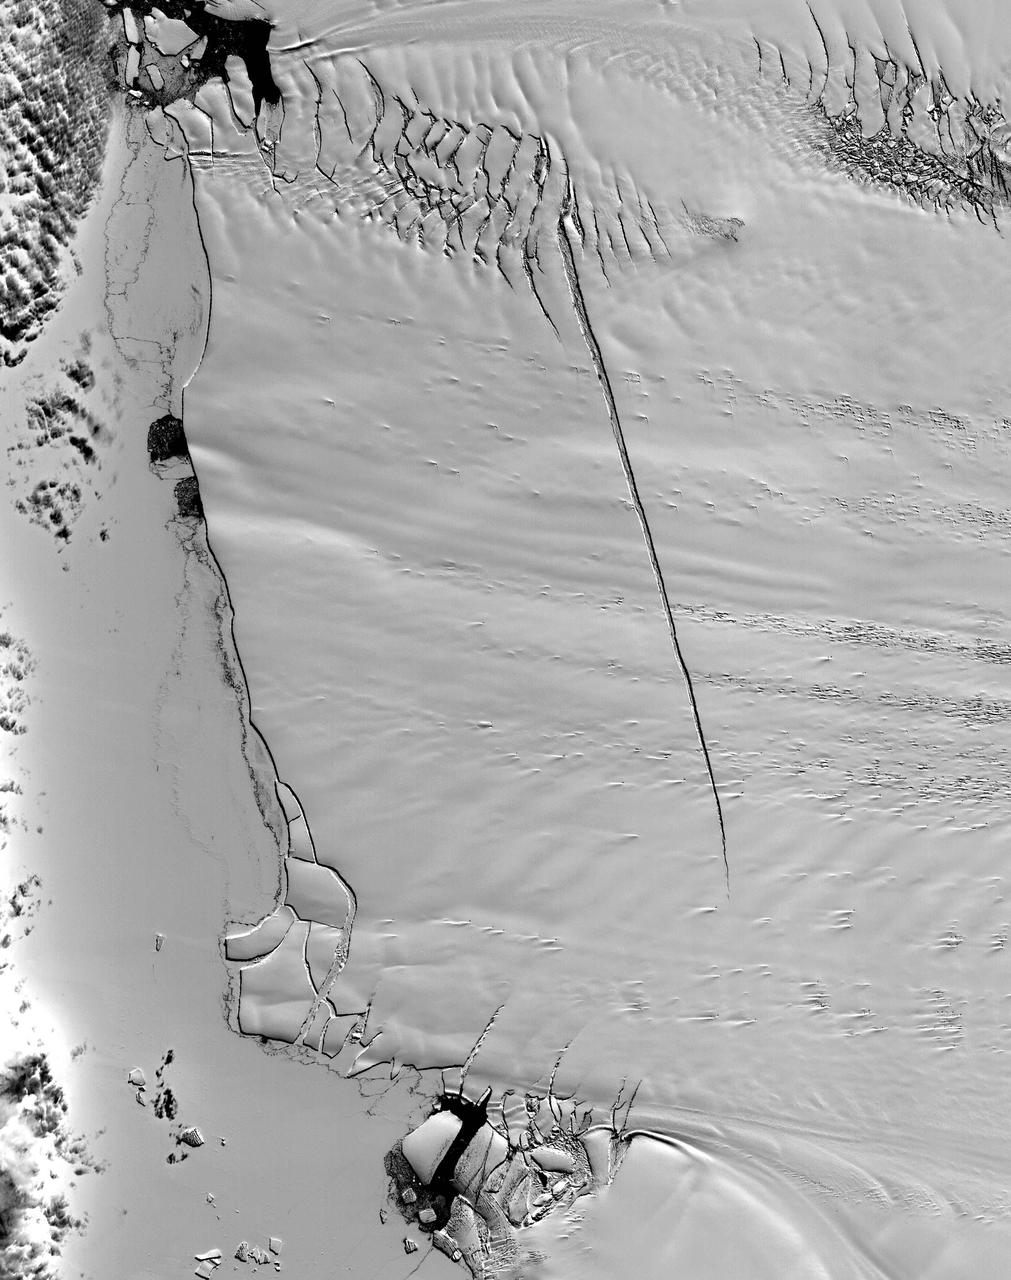
NASA image acquired September 6, 2010 The Matusevich Glacier flows toward the coast of East Antarctica, pushing through a channel between the Lazarev Mountains and the northwestern tip of the Wilson Hills. Constrained by surrounding rocks, the river of ice holds together. But stresses resulting from the glacier’s movement make deep crevasses, or cracks, in the ice. After passing through the channel, the glacier has room to spread out as it floats on the ocean. The expanded area and the jostling of ocean waves prompts the ice to break apart, which it often does along existing crevasses. On September 6, 2010, the Advanced Land Imager (ALI) on NASA’s Earth Observing-1 (EO-1) satellite captured this natural-color image of the margin of Matusevich Glacier. Shown here just past the rock-lined channel, the glacier is calving large icebergs. Low-angled sunlight illuminates north-facing surfaces and casts long shadows to the south. Fast ice anchored to the shore surrounds both the glacier tongue and the icebergs it has calved. Compared to the glacier and icebergs, the fast ice is thinner with a smoother surface. Out to sea (image left), the sea ice is even thinner and moves with winds and currents. Matusevich Glacier does not drain a significant amount of ice off of the Antarctic continent, so the glacier’s advances and retreats lack global significance. Like other Antarctic glaciers, however, Matusevich helps glaciologists form a larger picture of Antarctica’s glacial health and ice sheet volume. NASA Earth Observatory image created by Jesse Allen and Robert Simmon, using EO-1 ALI data provided courtesy of the NASA EO-1 team. Caption by Michon Scott based on image interpretation by Robert Bindschadler, NASA Goddard Space Flight Center, and Walt Meier, National Snow and Ice Data Center. Instrument: EO-1 - ALI Credit: <b><a href="http://www.earthobservatory.nasa.gov/" rel="nofollow"> NASA Earth Observatory</a></b> <b><a href="http://www.nasa.gov/centers/goddard/home/index.html" rel="nofollow">NASA Goddard Space Flight Center</a></b> enables NASA’s mission through four scientific endeavors: Earth Science, Heliophysics, Solar System Exploration, and Astrophysics. Goddard plays a leading role in NASA’s accomplishments by contributing compelling scientific knowledge to advance the Agency’s mission. <b>Follow us on <a href="http://twitter.com/NASA_GoddardPix" rel="nofollow">Twitter</a></b> <b>Join us on <a href="http://www.facebook.com/pages/Greenbelt-MD/NASA-Goddard/395013845897?ref=tsd" rel="nofollow">Facebook</a></b> To download the full resolution image go to: <a href="http://earthobservatory.nasa.gov/IOTD/view.php?id=46840" rel="nofollow">earthobservatory.nasa.gov/IOTD/view.php?id=46840</a>
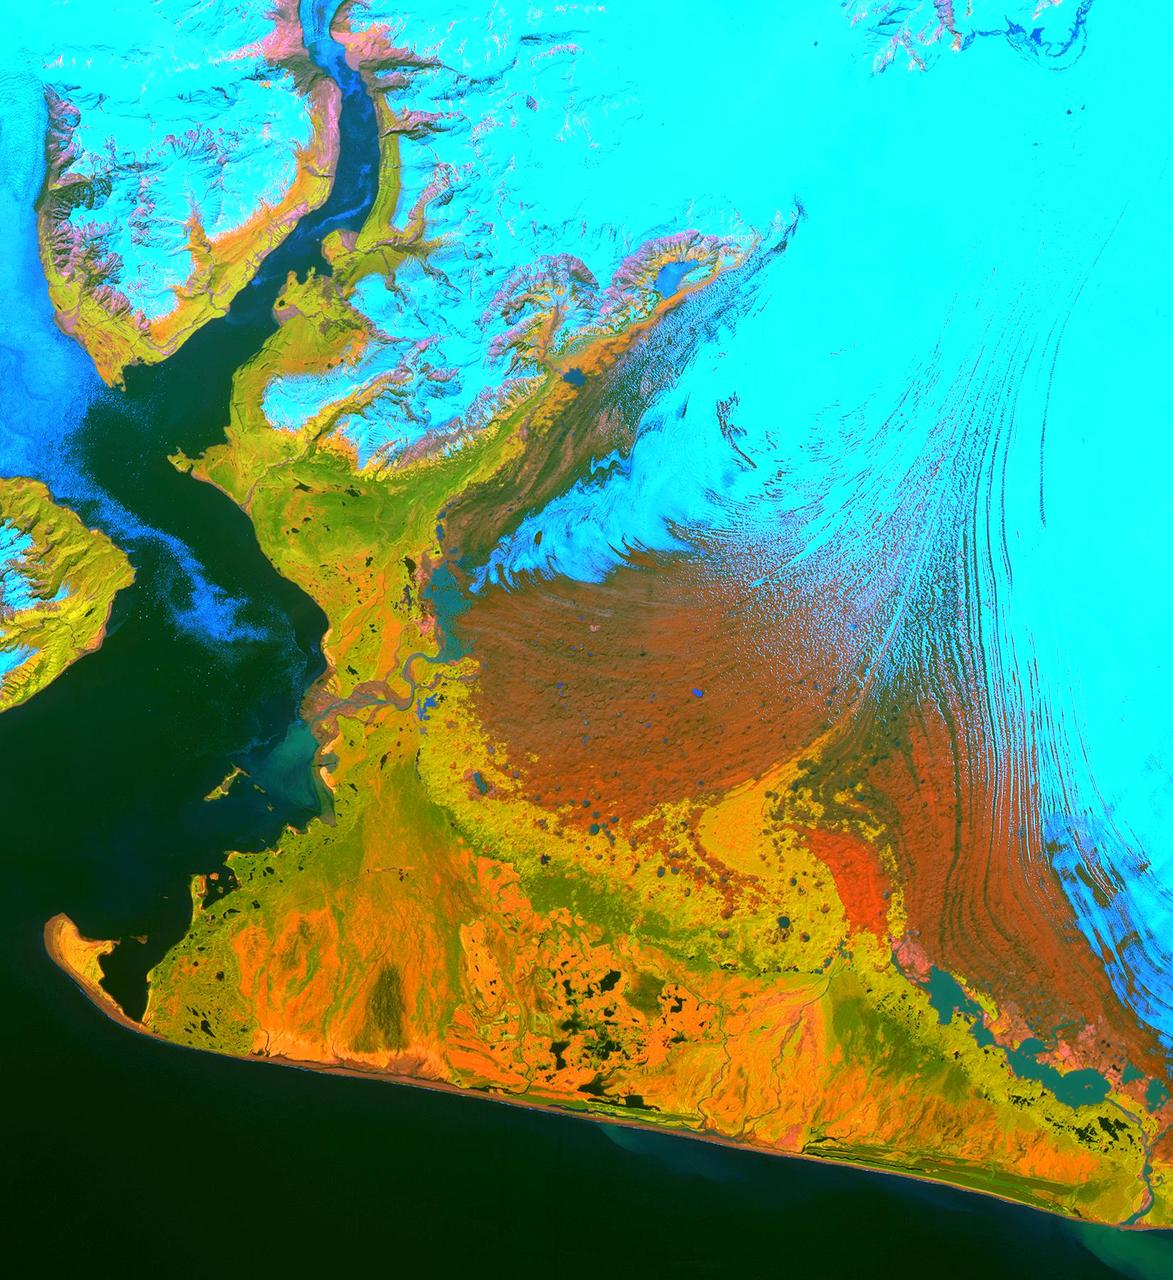
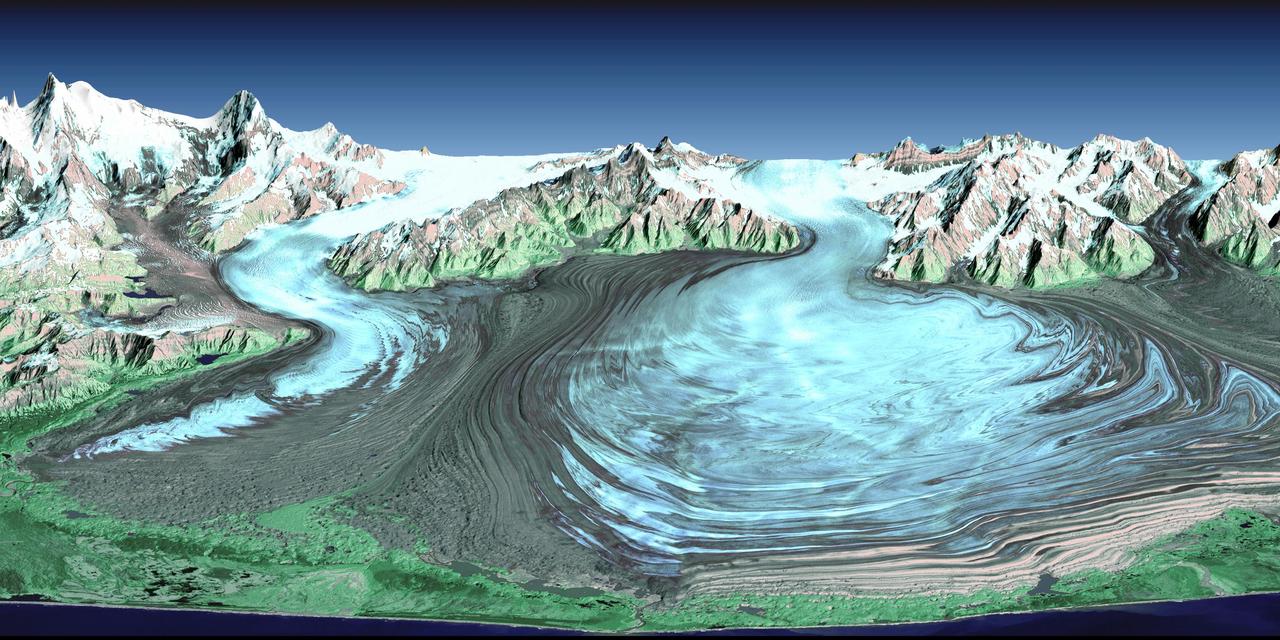
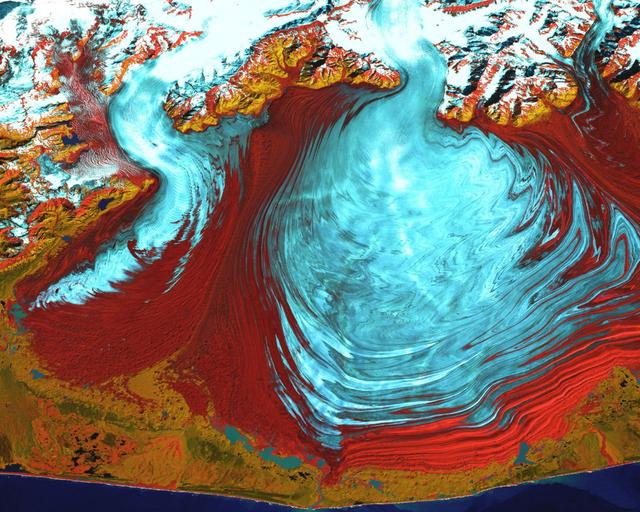
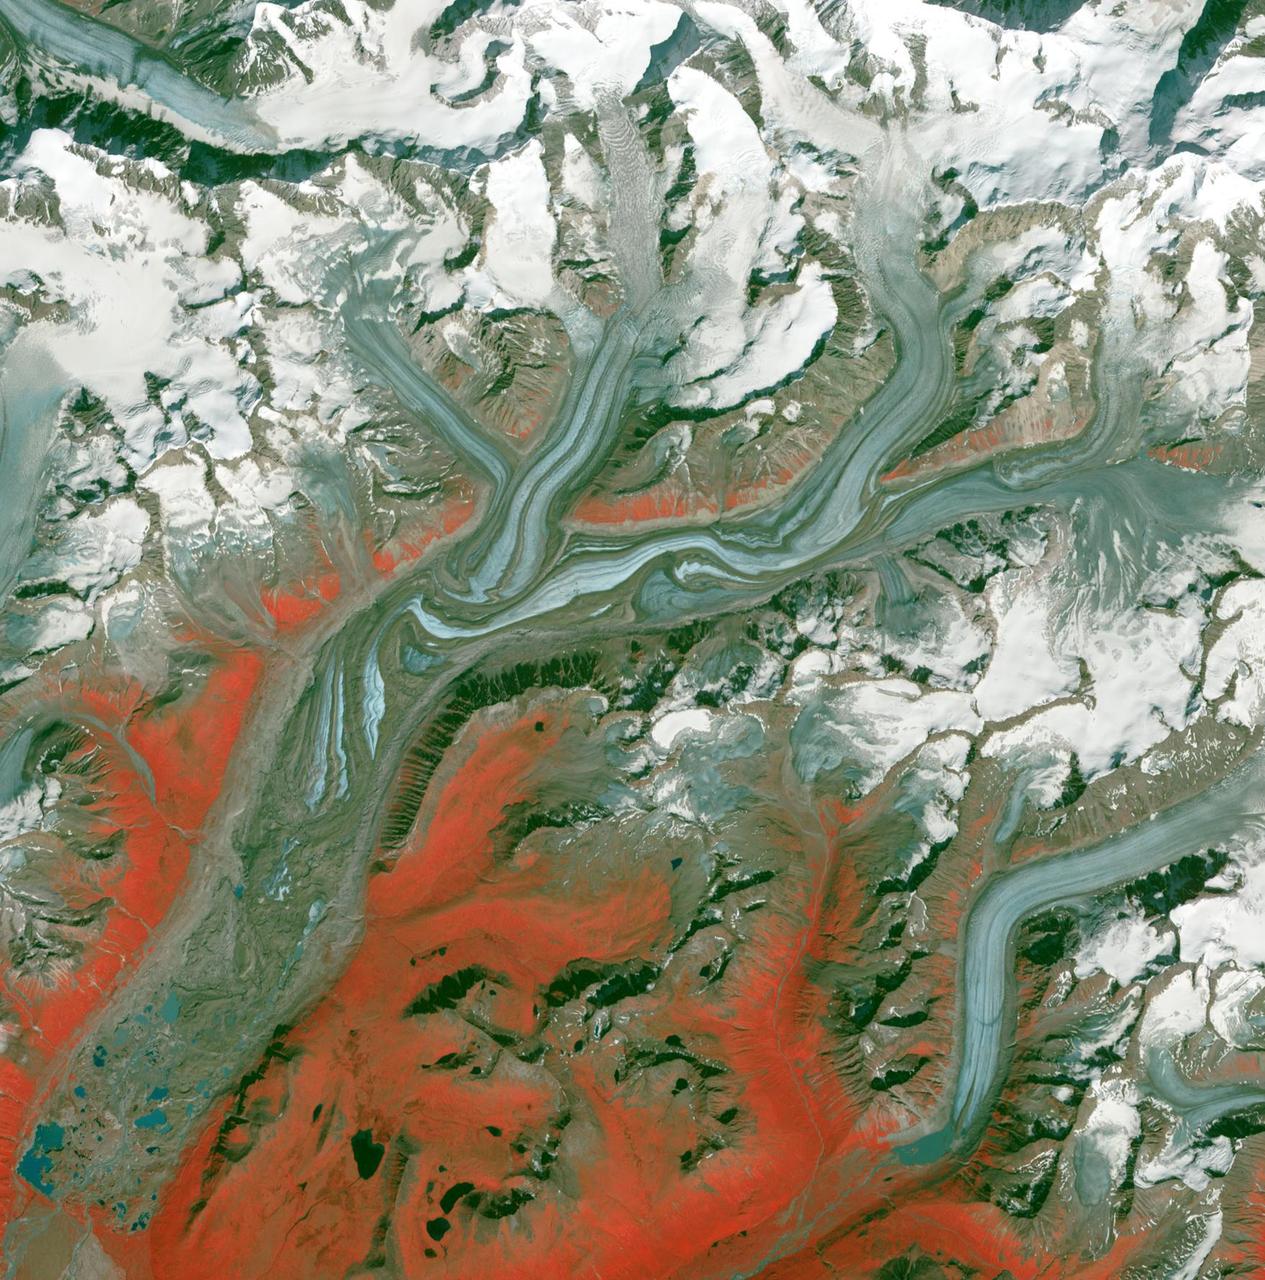
This image from the Advanced Spaceborne Thermal Emission and Reflection Radiometer (ASTER) instrument on NASA's Terra satellite covers an area of 55 by 40 kilometers (34 by 25 miles) over the southwest part of the Malaspina Glacier and Icy Bay in Alaska. The composite of infrared and visible bands results in the snow and ice appearing light blue, dense vegetation is yellow-orange and green, and less vegetated, gravelly areas are in orange. According to Dr. Dennis Trabant (U.S. Geological Survey, Fairbanks, Alaska), the Malaspina Glacier is thinning. Its terminal moraine protects it from contact with the open ocean; without the moraine, or if sea level rises sufficiently to reconnect the glacier with the ocean, the glacier would start calving and retreat significantly. ASTER data are being used to help monitor the size and movement of some 15,000 tidal and piedmont glaciers in Alaska. Evidence derived from ASTER and many other satellite and ground-based measurements suggests that only a few dozen Alaskan glaciers are advancing. The overwhelming majority of them are retreating. This ASTER image was acquired on June 8, 2001. With its 14 spectral bands from the visible to the thermal infrared wavelength region, and its high spatial resolution of 15 to 90 meters (about 50 to 300 feet), ASTER will image Earth for the next six years to map and monitor the changing surface of our planet. http://photojournal.jpl.nasa.gov/catalog/PIA03475
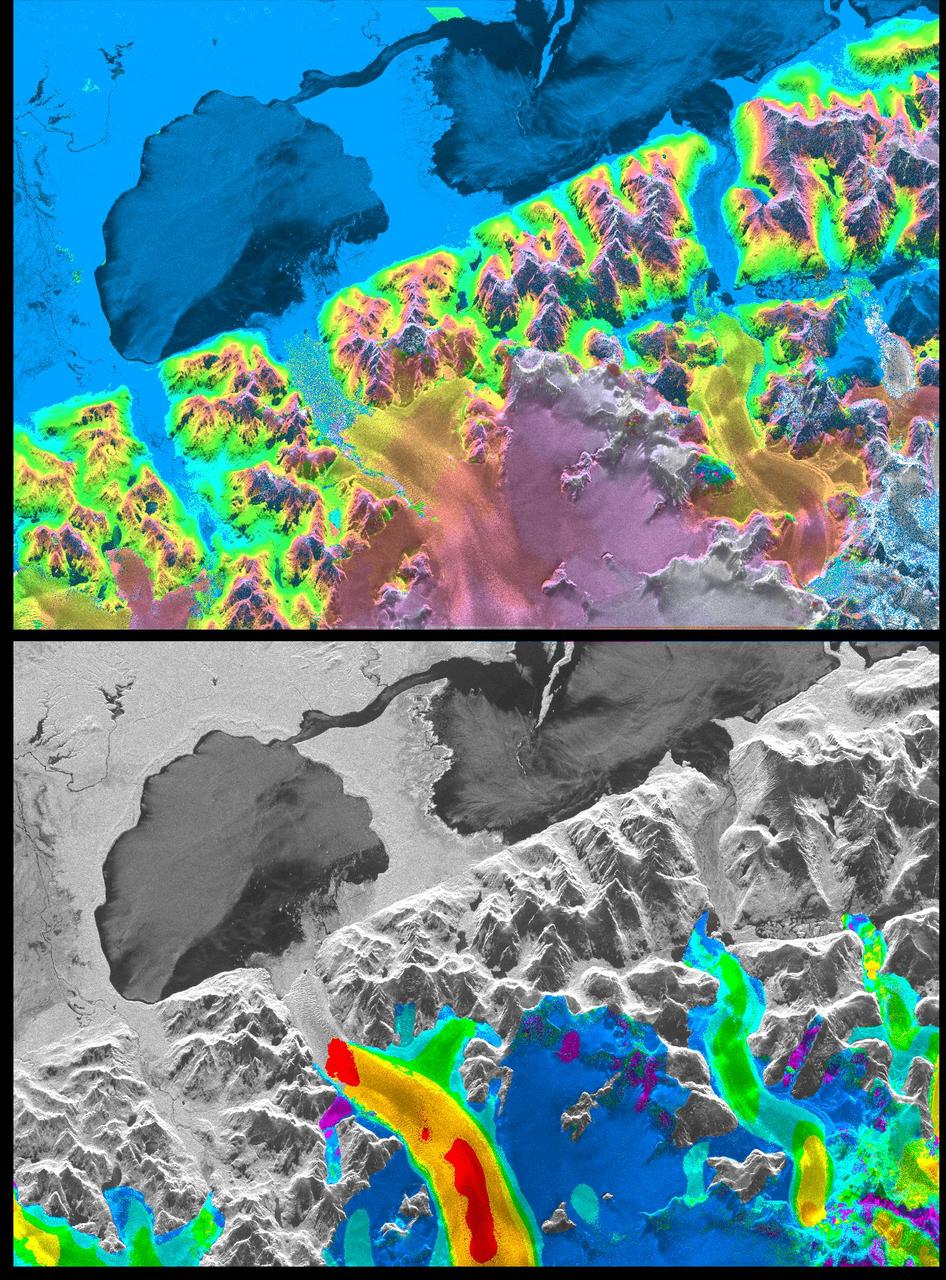
A NASA radar instrument has been successfully used to measure some of the fastest moving and most inaccessible glaciers in the world -- in Chile's huge, remote Patagonia ice fields -- demonstrating a technique that could produce more accurate predictions of glacial response to climate change and corresponding sea level changes. This image, produced with interferometric measurements made by the Spaceborne Imaging Radar-C and X-band Synthetic Aperture Radar (SIR-C/X-SAR) flown on the Space Shuttle last fall, has provided the first detailed measurements of the mass and motion of the San Rafael Glacier. Very few measurements have been made of the Patagonian ice fields, which are the world's largest mid-latitude ice masses and account for more than 60 percent of the Southern Hemisphere's glacial area outside of Antarctica. These features make the area essential for climatologists attempting to understand the response of glaciers on a global scale to changes in climate, but the region's inaccessibility and inhospitable climate have made it nearly impossible for scientists to study its glacial topography, meteorology and changes over time. Currently, topographic data exist for only a few glaciers while no data exist for the vast interior of the ice fields. Velocity has been measured on only five of the more than 100 glaciers, and the data consist of only a few single-point measurements. The interferometry performed by the SIR-C/X-SAR was used to generate both a digital elevation model of the glaciers and a map of their ice motion on a pixel-per-pixel basis at very high resolution for the first time. The data were acquired from nearly the same position in space on October 9, 10 and 11, 1994, at L-band frequency (24-cm wavelength), vertically transmitted and received polarization, as the Space Shuttle Endeavor flew over several Patagonian outlet glaciers of the San Rafael Laguna. The area shown in these two images is 50 kilometers by 30 kilometers (30 miles by 18 miles) in size and is centered at 46.6 degrees south latitude, 73.8 degrees west longitude. North is toward the upper right. The top image is a digital elevation model of the scene, where color and saturation represent terrain height (between 0 meters and 2,000 meters or up to 6,500 feet) and brightness represents radar backscatter. Low elevations are shown in blue and high elevations are shown in pink. The digital elevation map of the glacier surface has a horizontal resolution of 15 meters (50 feet) and a vertical resolution of 10 meters (30 feet). High-resolution maps like these acquired over several years would allow scientists to calculate directly long-term changes in the mass of the glacier. The bottom image is a map of ice motion parallel to the radar look direction only, which is from the top of the image. Purple indicates ice motion away from the radar at more than 6 centimeters per day; dark blue is ice motion toward or away at less than 6 cm per day; light blue is motion toward the radar of 6 cm to 20 cm (about 2 to 8 inches) per day; green is motion toward the radar of 20 cm to 45 cm (about 8 to 18 inches) per day; yellow is 45 cm to 85 cm (about 18 to 33 inches) per day; orange is 85 cm to 180 cm (about 33 to 71 inches) per day; red is greater than 180 cm (71 inches) per day. The velocity estimates are accurate to within 5 millimeters per day. The largest velocities are recorded on the San Rafael Glacier in agreement with previous work. Other outlet glaciers exhibit ice velocities of less than 1 meter per day. Several kilometers before its terminus, (left of center) the velocity of the San Rafael Glacier exceeds 10 meters (32 feet) per day, and ice motion cannot be estimated from the data. There, a revisit time interval of less than 12 hours would have been necessary to estimate ice motion from interferometry data. The results however demonstrate that the radar interferometry technique permits the monitoring of glacier characteristics unattainable by any other means. http://photojournal.jpl.nasa.gov/catalog/PIA01781
Alpine Glaciers
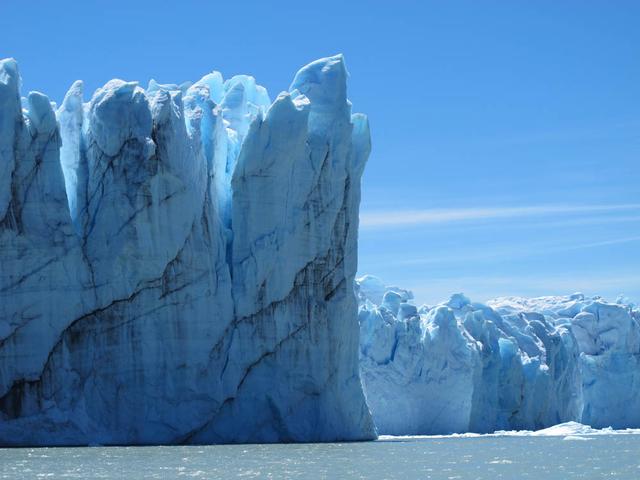
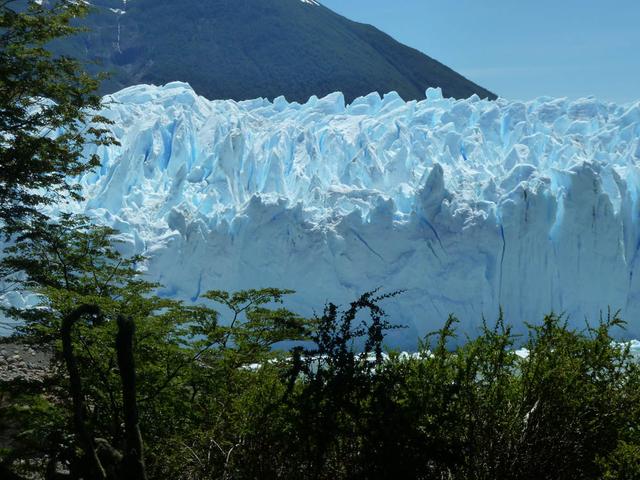
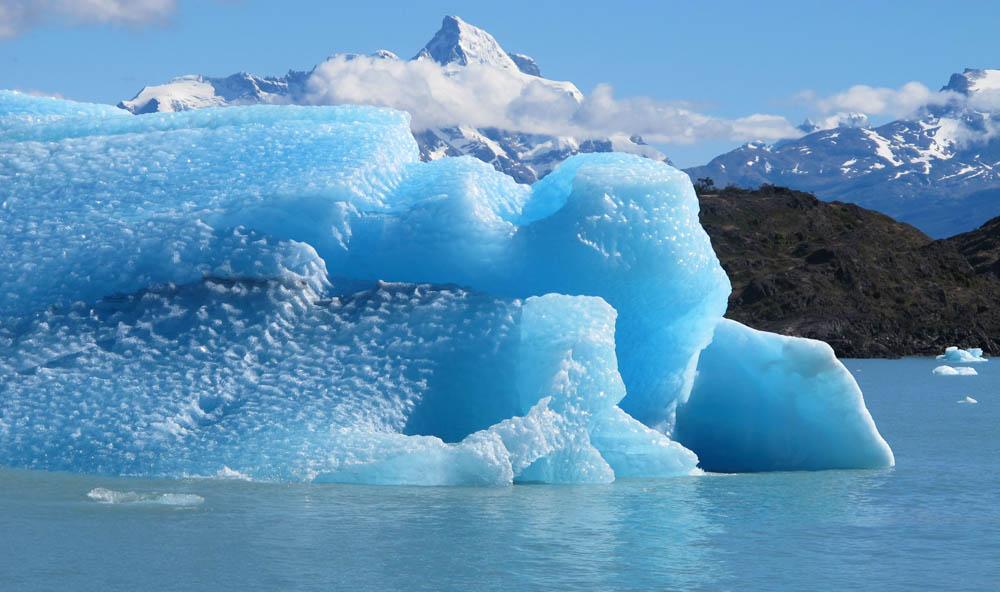
Calving front of the Perito Moreno Glacier (Argentina). Contrary to the majority of the glaciers from the southern Patagonian ice field, the Perito Moreno Glacier is currently stable. It is also one of the most visited glaciers in the world. To learn about the contributions of glaciers to sea level rise, visit: <a href="http://www.nasa.gov/topics/earth/features/glacier-sea-rise.html" rel="nofollow">www.nasa.gov/topics/earth/features/glacier-sea-rise.html</a> Credit: Etienne Berthier, Université de Toulouse <b><a href="http://www.nasa.gov/audience/formedia/features/MP_Photo_Guidelines.html" rel="nofollow">NASA image use policy.</a></b> <b><a href="http://www.nasa.gov/centers/goddard/home/index.html" rel="nofollow">NASA Goddard Space Flight Center</a></b> enables NASA’s mission through four scientific endeavors: Earth Science, Heliophysics, Solar System Exploration, and Astrophysics. Goddard plays a leading role in NASA’s accomplishments by contributing compelling scientific knowledge to advance the Agency’s mission. <b>Follow us on <a href="http://twitter.com/NASA_GoddardPix" rel="nofollow">Twitter</a></b> <b>Like us on <a href="http://www.facebook.com/pages/Greenbelt-MD/NASA-Goddard/395013845897?ref=tsd" rel="nofollow">Facebook</a></b> <b>Find us on <a href="http://instagram.com/nasagoddard?vm=grid" rel="nofollow">Instagram</a></b>
Calving front of the Perito Moreno Glacier (Argentina). Contrary to the majority of the glaciers from the southern Patagonian ice field, the Perito Moreno Glacier is currently stable. It is also one of the most visited glaciers in the world. To learn about the contributions of glaciers to sea level rise, visit: <a href="http://www.nasa.gov/topics/earth/features/glacier-sea-rise.html" rel="nofollow">www.nasa.gov/topics/earth/features/glacier-sea-rise.html</a> Credit: Etienne Berthier, Université de Toulouse <b><a href="http://www.nasa.gov/audience/formedia/features/MP_Photo_Guidelines.html" rel="nofollow">NASA image use policy.</a></b> <b><a href="http://www.nasa.gov/centers/goddard/home/index.html" rel="nofollow">NASA Goddard Space Flight Center</a></b> enables NASA’s mission through four scientific endeavors: Earth Science, Heliophysics, Solar System Exploration, and Astrophysics. Goddard plays a leading role in NASA’s accomplishments by contributing compelling scientific knowledge to advance the Agency’s mission. <b>Follow us on <a href="http://twitter.com/NASA_GoddardPix" rel="nofollow">Twitter</a></b> <b>Like us on <a href="http://www.facebook.com/pages/Greenbelt-MD/NASA-Goddard/395013845897?ref=tsd" rel="nofollow">Facebook</a></b> <b>Find us on <a href="http://instagram.com/nasagoddard?vm=grid" rel="nofollow">Instagram</a></b>
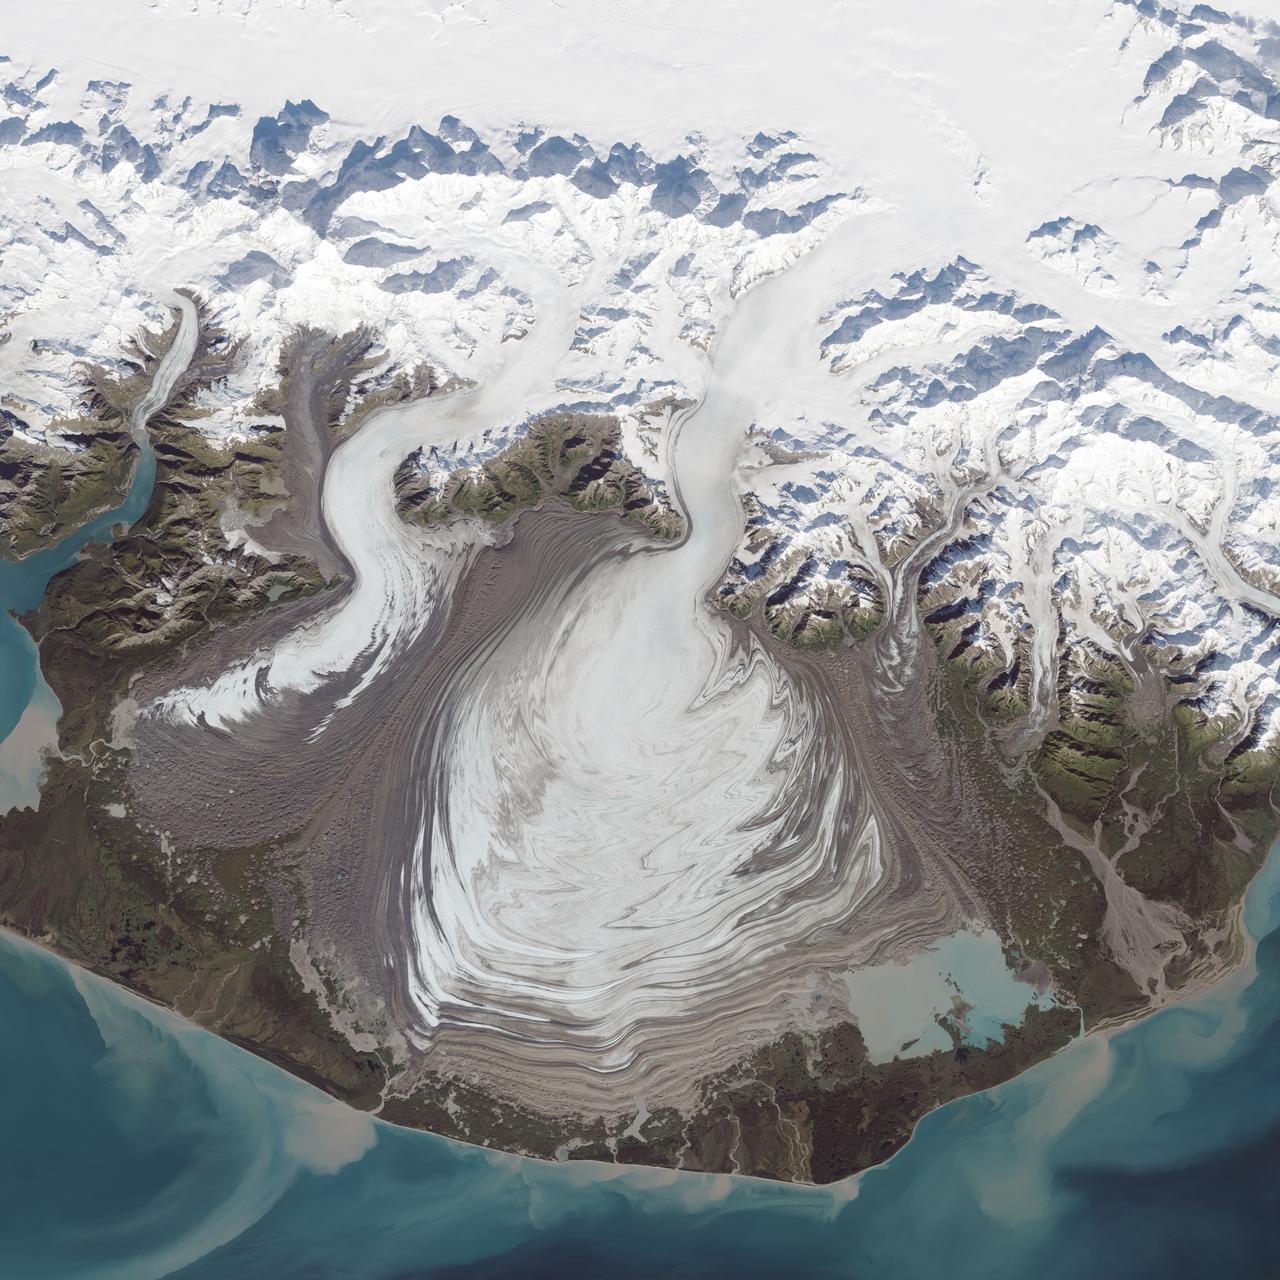
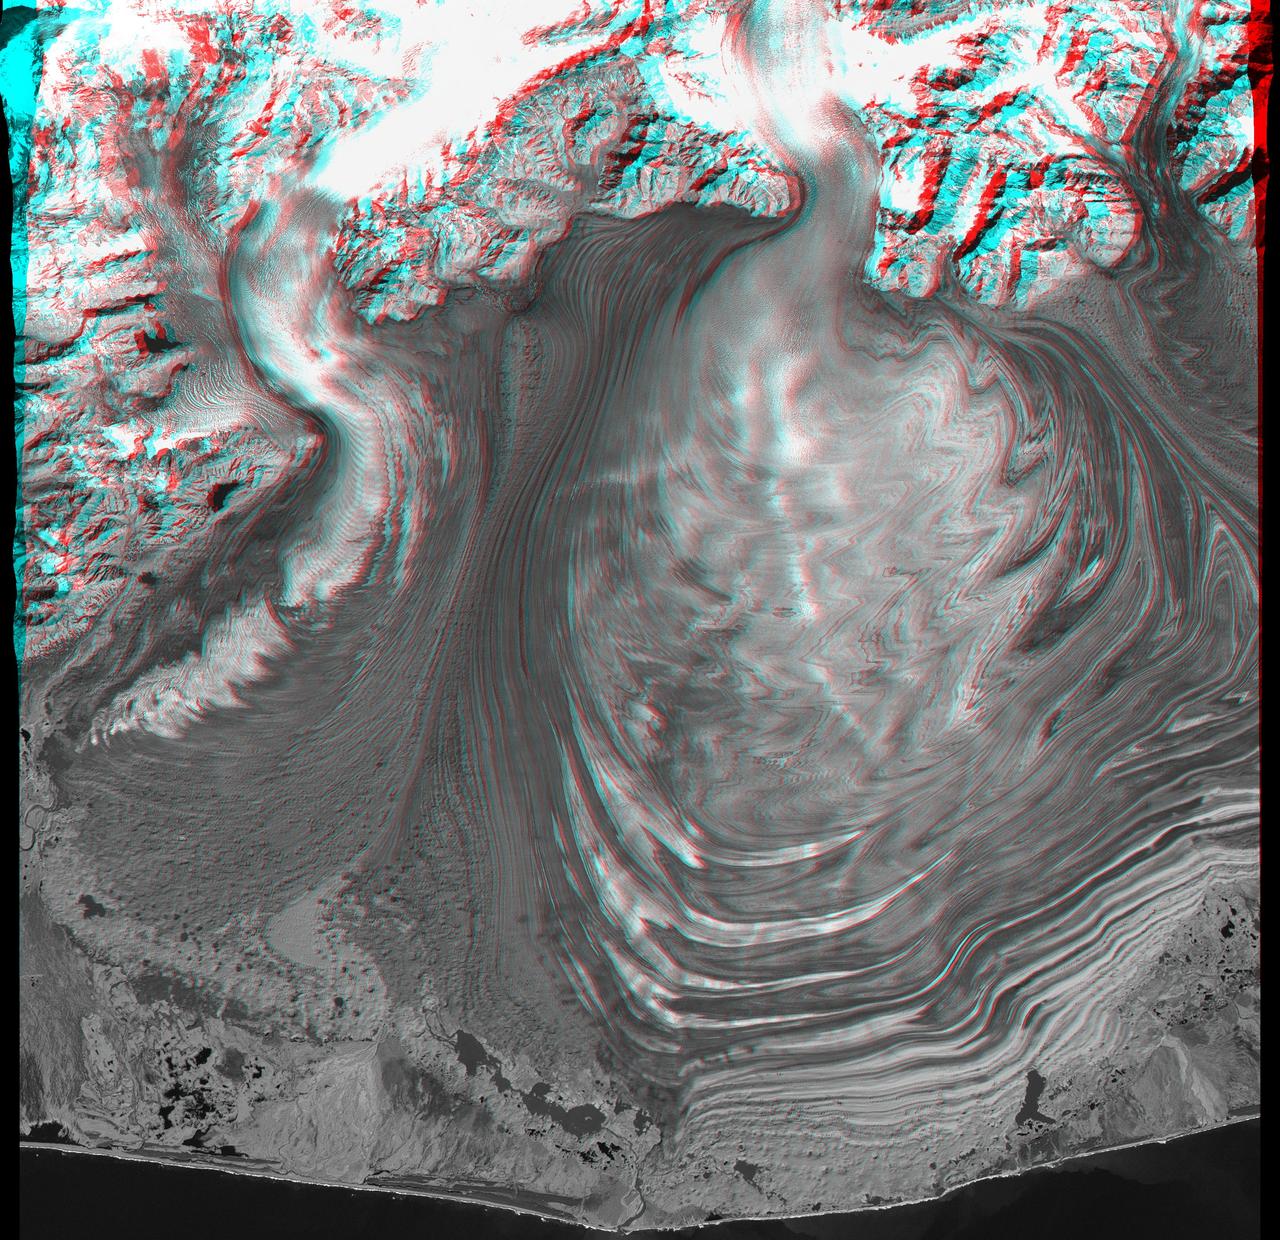
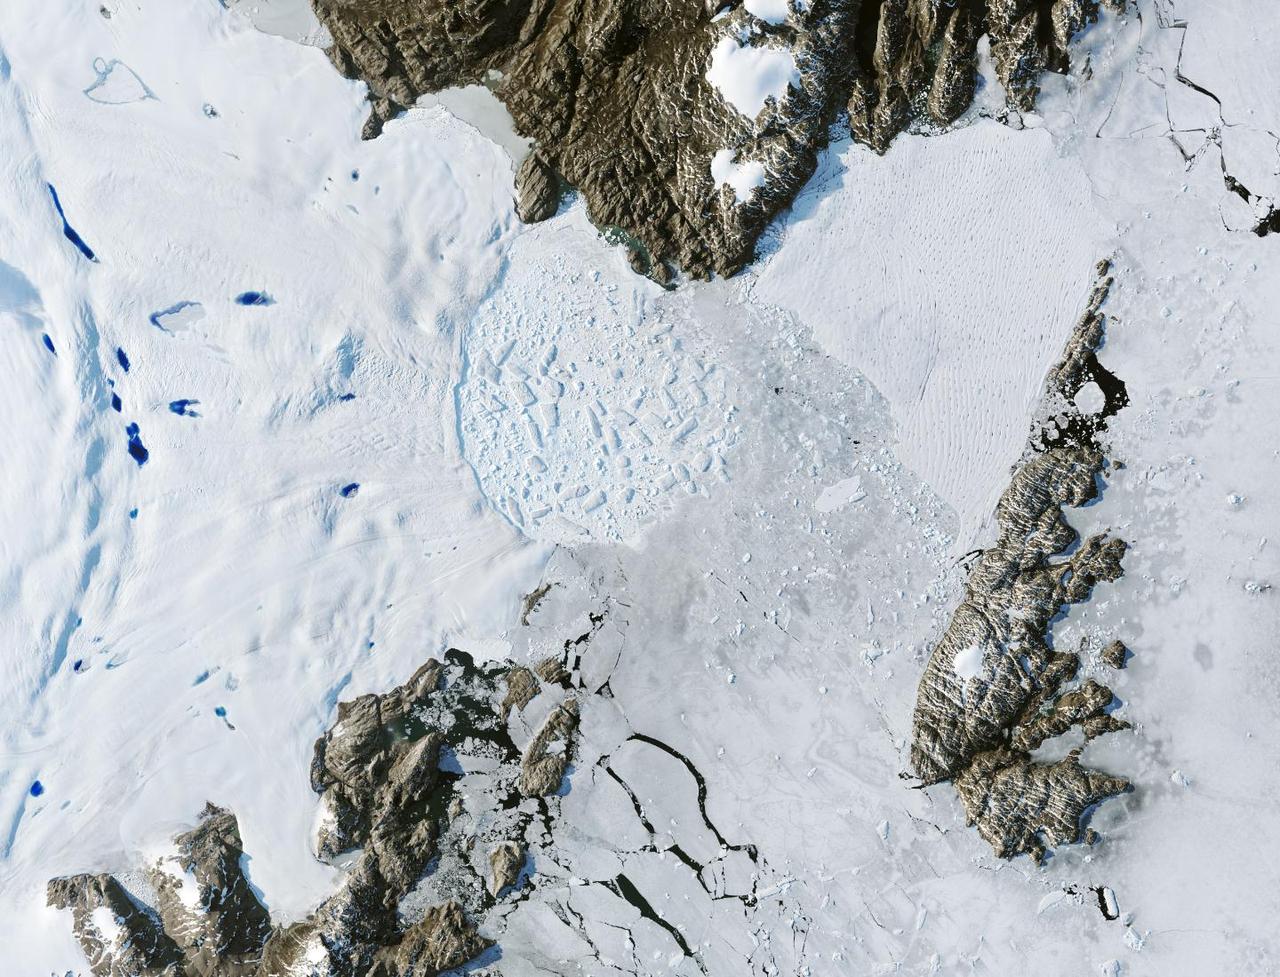
The ice of a piedmont glacier spills from a steep valley onto a relatively flat plain, where it spreads out unconstrained like pancake batter. Elephant Foot Glacier in northeastern Greenland is an excellent example; it is particularly noted for its symmetry. But the largest piedmont glacier in North America (and possibly the world) is Malaspina in southeastern Alaska. On September 24, 2014, the Operational Land Imager (OLI) on Landsat 8 acquired this image of Malaspina Glacier. The main source of ice comes from Seward Glacier, located at the top-center of this image. The Agassiz and Libbey glaciers are visible on the left side, and the Hayden and Marvine glaciers are on the right. The brown lines on the ice are moraines—areas where soil, rock, and other debris have been scraped up by the glacier and deposited at its sides. Where two glaciers flow together, the moraines merge to form a medial moraine. Glaciers that flow at a steady speed tend to have moraines that are relatively straight. But what causes the dizzying pattern of curves, zigzags, and loops of Malaspina’s moraines? Glaciers in this area of Alaska periodically “surge,”meaning they lurch forward quickly for one to several years. As a result of this irregular flow, the moraines at the edges and between glaciers can become folded, compressed, and sheared to form the characteristic loops seen on Malaspina. For instance, a surge in 1986 displaced moraines on the east side of Malaspina by as much as 5 kilometers (3 miles). NASA Earth Observatory image by Jesse Allen, using Landsat data from the U.S. Geological Survey. Caption by Kathryn Hansen. Credit: <b><a href="http://www.earthobservatory.nasa.gov/" rel="nofollow"> NASA Earth Observatory</a></b> <b><a href="http://www.nasa.gov/audience/formedia/features/MP_Photo_Guidelines.html" rel="nofollow">NASA image use policy.</a></b> <b><a href="http://www.nasa.gov/centers/goddard/home/index.html" rel="nofollow">NASA Goddard Space Flight Center</a></b> enables NASA’s mission through four scientific endeavors: Earth Science, Heliophysics, Solar System Exploration, and Astrophysics. Goddard plays a leading role in NASA’s accomplishments by contributing compelling scientific knowledge to advance the Agency’s mission. <b>Follow us on <a href="http://twitter.com/NASAGoddardPix" rel="nofollow">Twitter</a></b> <b>Like us on <a href="http://www.facebook.com/pages/Greenbelt-MD/NASA-Goddard/395013845897?ref=tsd" rel="nofollow">Facebook</a></b> <b>Find us on <a href="http://instagrid.me/nasagoddard/?vm=grid" rel="nofollow">Instagram</a></b>
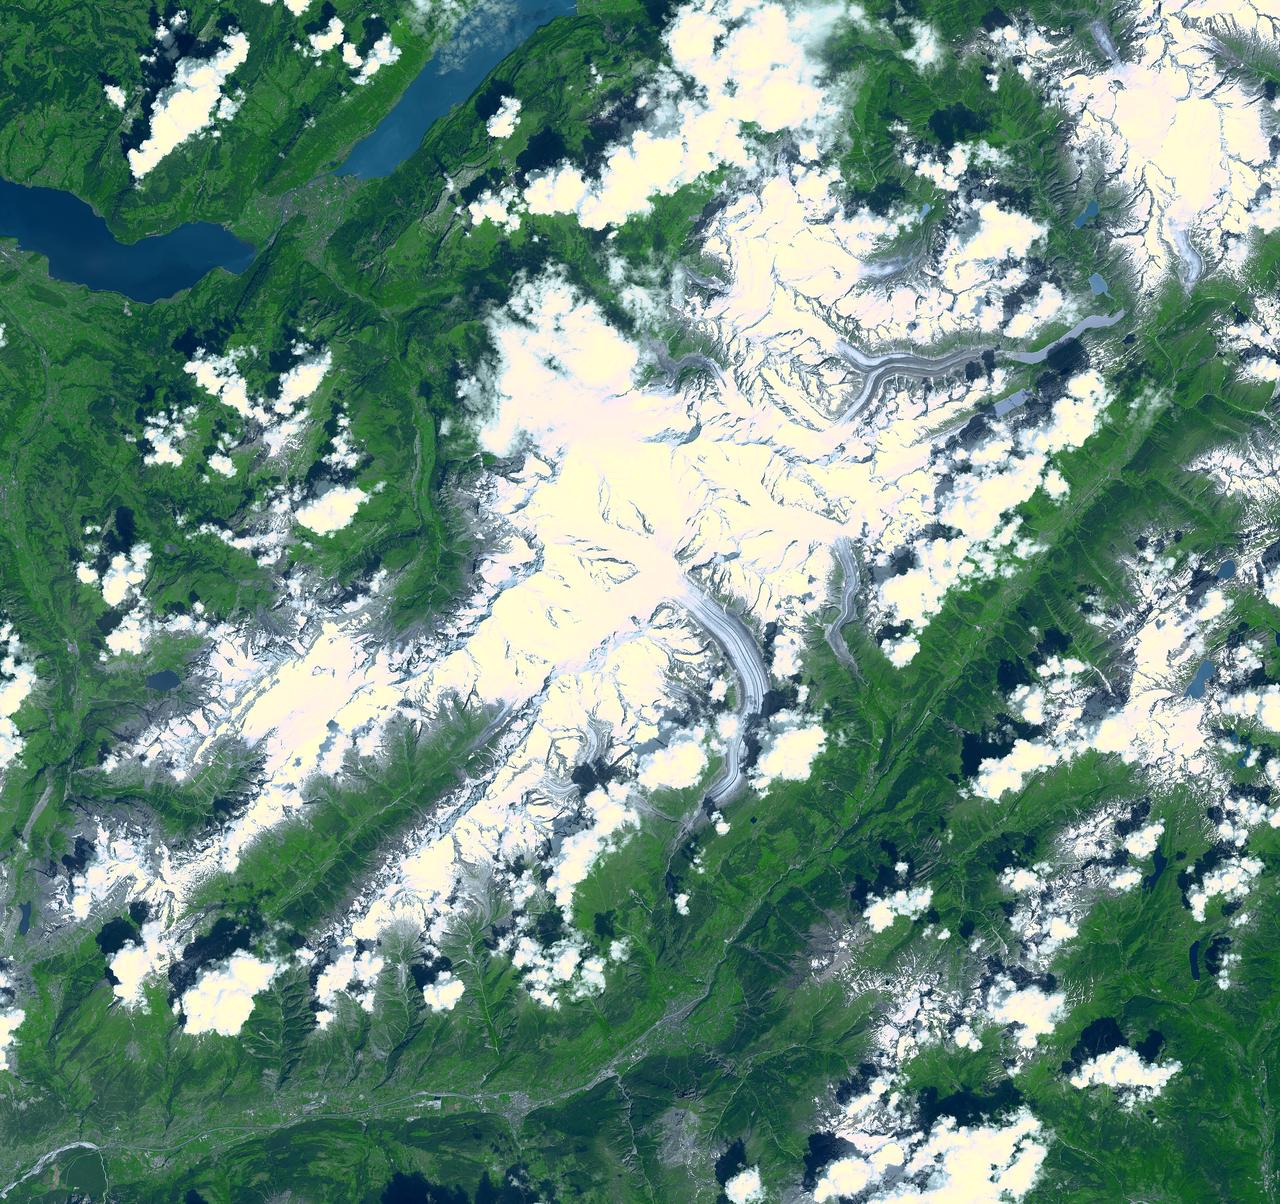
Aletsch Glacier, the largest glacier of Europe, covers more than 120 square kilometers (more than 45 square miles) in southern Switzerland. At its eastern extremity lies a glacierlake, Mdrjelensee (2,350 meters/7,711 feet above sea level). To the west rises Aletschhorn (4,195 meters/13,763 feet), which was first climbed in 1859. The Rhone River flows along the southern flank of the mountains. This image was acquired on July 23, 2001 by the Advanced Spaceborne Thermal Emission and Reflection Radiometer (ASTER) on NASA's Terra satellite. With its 14 spectral bands from the visible to the thermal infrared wavelength region, and its high spatial resolution of 15 to 90 meters (about 50 to 300 feet), ASTER will image Earth for the next 6 years to map and monitor the changing surface of our planet. ASTER is one of five Earth-observing instruments launched December 18, 1999, on NASA's Terra satellite. The instrument was built by Japan's Ministry of Economy, Trade and Industry. A joint U.S./Japan science team is responsible for validation and calibration of the instrument and the data products. http://photojournal.jpl.nasa.gov/catalog/PIA03857
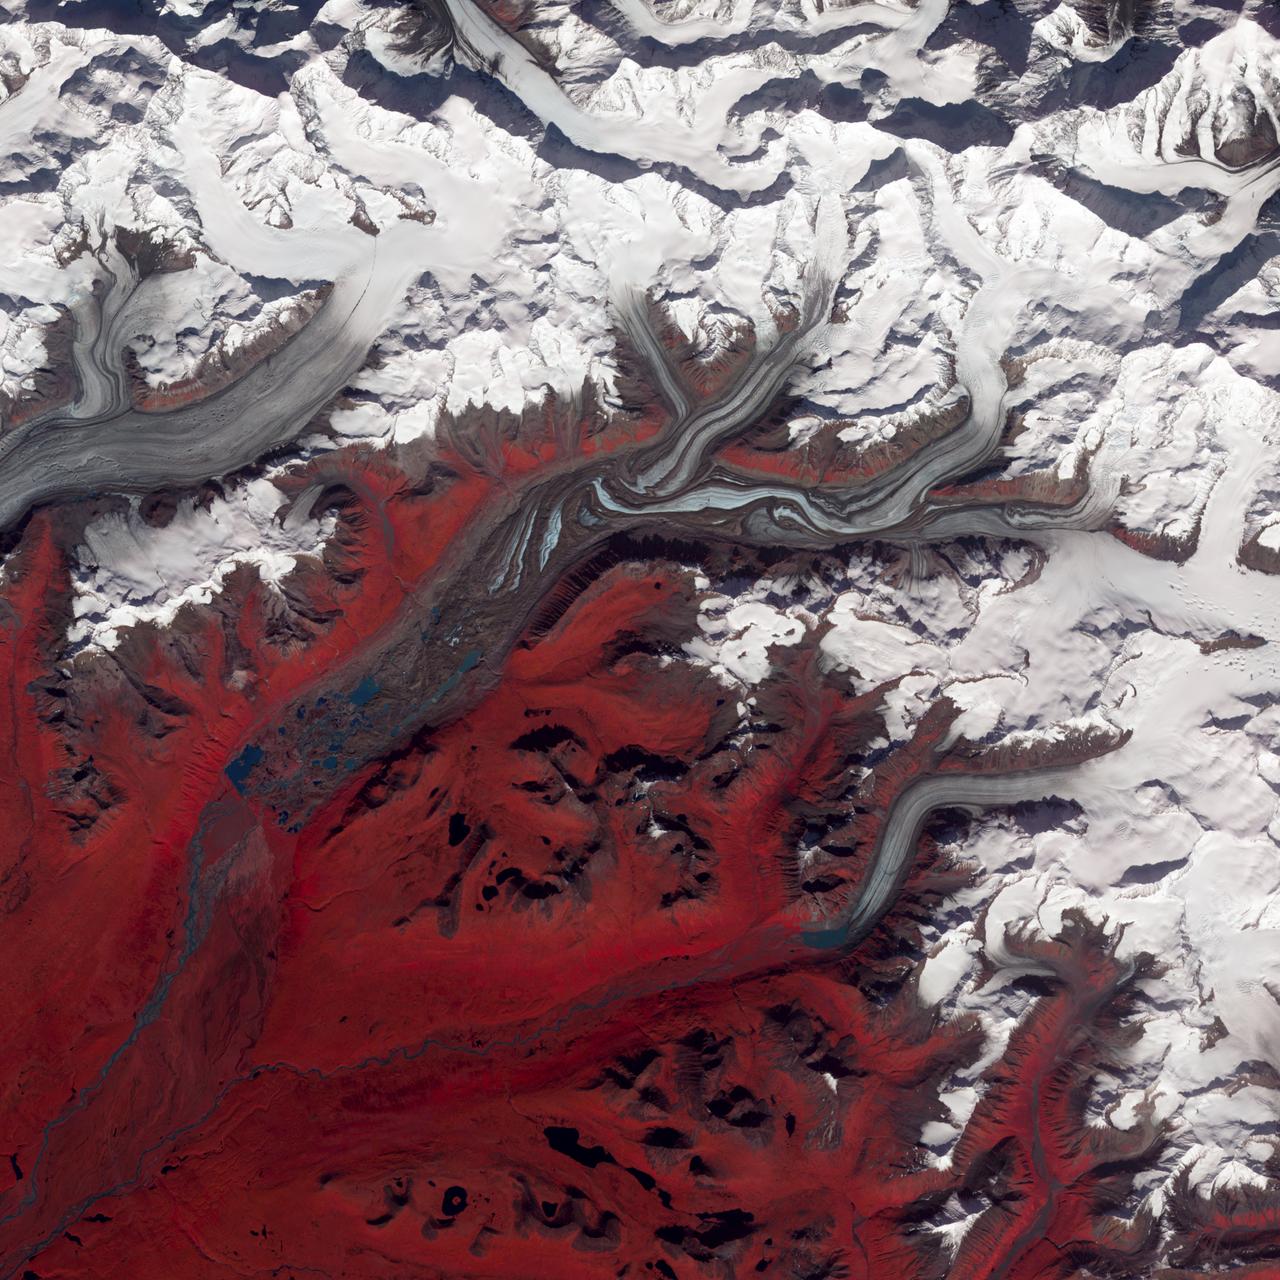
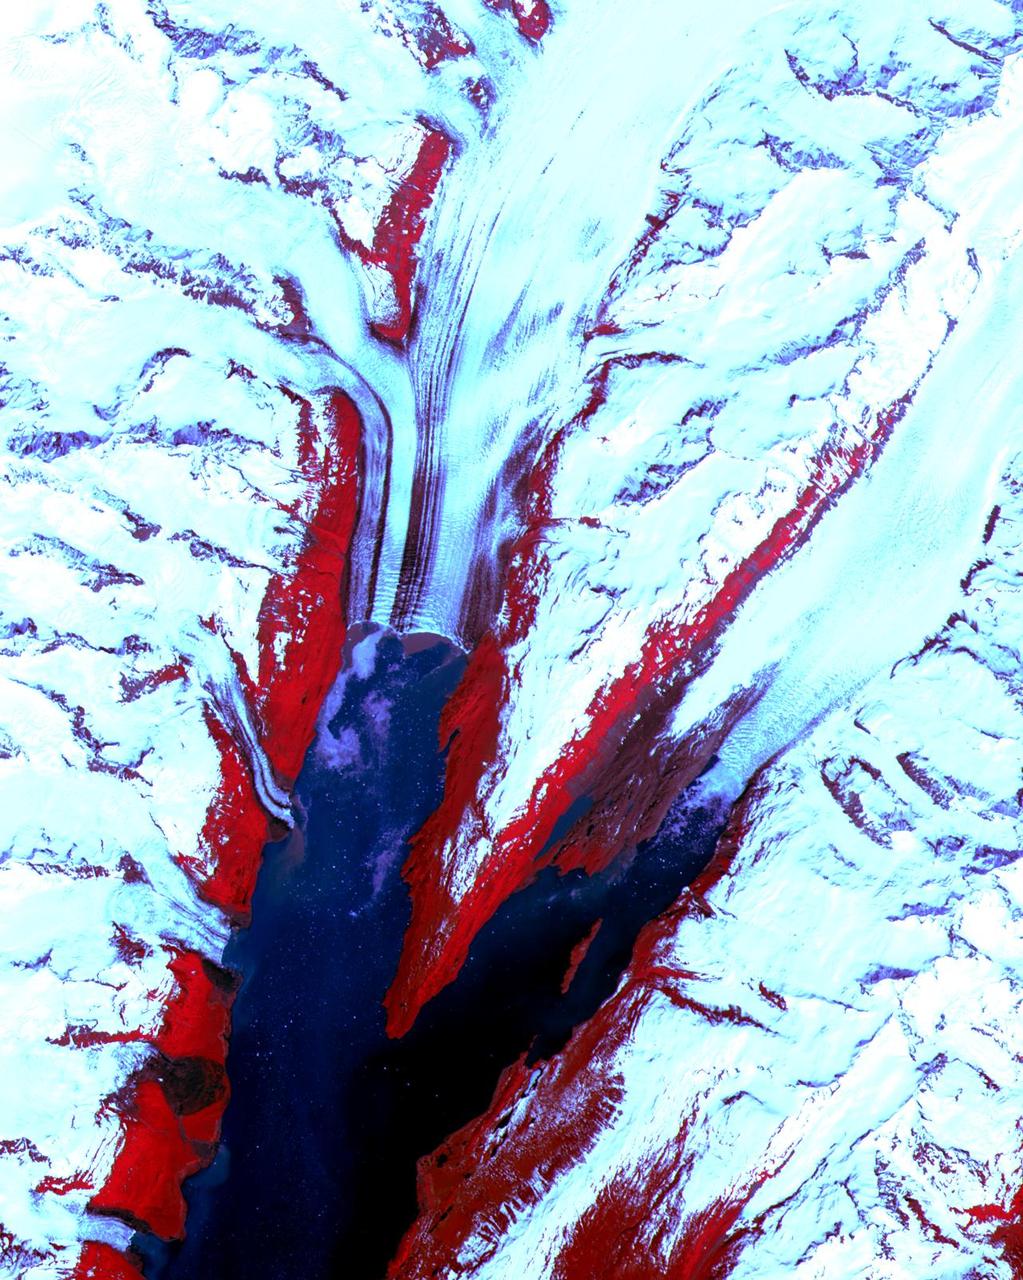
NASA image acquired August 27, 2009 Like rivers of liquid water, glaciers flow downhill, with tributaries joining to form larger rivers. But where water rushes, ice crawls. As a result, glaciers gather dust and dirt, and bear long-lasting evidence of past movements. Alaska’s Susitna Glacier revealed some of its long, grinding journey when the Advanced Spaceborne Thermal Emission and Reflection Radiometer (ASTER) on NASA’s Terra satellite passed overhead on August 27, 2009. This satellite image combines infrared, red, and green wavelengths to form a false-color image. Vegetation is red and the glacier’s surface is marbled with dirt-free blue ice and dirt-coated brown ice. Infusions of relatively clean ice push in from tributaries in the north. The glacier surface appears especially complex near the center of the image, where a tributary has pushed the ice in the main glacier slightly southward. A photograph taken by researchers from the U.S. Geological Survey (archived by the National Snow and Ice Data Center) shows an equally complicated Susitna Glacier in 1970, with dirt-free and dirt-encrusted surfaces forming stripes, curves, and U-turns. Susitna flows over a seismically active area. In fact, a 7.9-magnitude quake struck the region in November 2002, along a previously unknown fault. Geologists surmised that earthquakes had created the steep cliffs and slopes in the glacier surface, but in fact most of the jumble is the result of surges in tributary glaciers. Glacier surges—typically short-lived events where a glacier moves many times its normal rate—can occur when melt water accumulates at the base and lubricates the flow. This water may be supplied by meltwater lakes that accumulate on top of the glacier; some are visible in the lower left corner of this image. The underlying bedrock can also contribute to glacier surges, with soft, easily deformed rock leading to more frequent surges. NASA Earth Observatory image created by Jesse Allen and Robert Simmon, using data provided courtesy of NASA/GSFC/METI/ERSDAC/JAROS, and U.S./Japan ASTER Science Team. Caption by Michon Scott. Instrument: Terra - ASTER Credit: <b><a href="http://www.earthobservatory.nasa.gov/" rel="nofollow"> NASA Earth Observatory</a></b> <b><a href="http://www.nasa.gov/centers/goddard/home/index.html" rel="nofollow">NASA Goddard Space Flight Center</a></b> enables NASA’s mission through four scientific endeavors: Earth Science, Heliophysics, Solar System Exploration, and Astrophysics. Goddard plays a leading role in NASA’s accomplishments by contributing compelling scientific knowledge to advance the Agency’s mission. <b>Follow us on <a href="http://twitter.com/NASA_GoddardPix" rel="nofollow">Twitter</a></b> <b>Join us on <a href="http://www.facebook.com/pages/Greenbelt-MD/NASA-Goddard/395013845897?ref=tsd" rel="nofollow">Facebook</a></b>
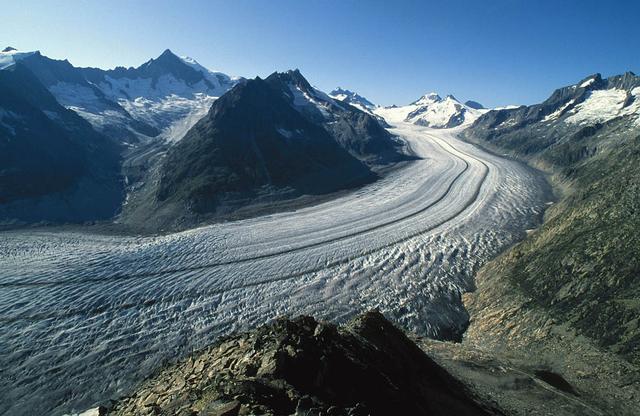
The Aletsch Glacier in Switzerland is the largest valley glacier in the Alps. Its volume loss since the middle of the 19th century is well-visible from the trimlines to the right of the image. To learn about the contributions of glaciers to sea level rise, visit: <a href="http://www.nasa.gov/topics/earth/features/glacier-sea-rise.html" rel="nofollow">www.nasa.gov/topics/earth/features/glacier-sea-rise.html</a> Credit: Frank Paul, University of Zurich <b><a href="http://www.nasa.gov/audience/formedia/features/MP_Photo_Guidelines.html" rel="nofollow">NASA image use policy.</a></b> <b><a href="http://www.nasa.gov/centers/goddard/home/index.html" rel="nofollow">NASA Goddard Space Flight Center</a></b> enables NASA’s mission through four scientific endeavors: Earth Science, Heliophysics, Solar System Exploration, and Astrophysics. Goddard plays a leading role in NASA’s accomplishments by contributing compelling scientific knowledge to advance the Agency’s mission. <b>Follow us on <a href="http://twitter.com/NASA_GoddardPix" rel="nofollow">Twitter</a></b> <b>Like us on <a href="http://www.facebook.com/pages/Greenbelt-MD/NASA-Goddard/395013845897?ref=tsd" rel="nofollow">Facebook</a></b> <b>Find us on <a href="http://instagram.com/nasagoddard?vm=grid" rel="nofollow">Instagram</a></b>
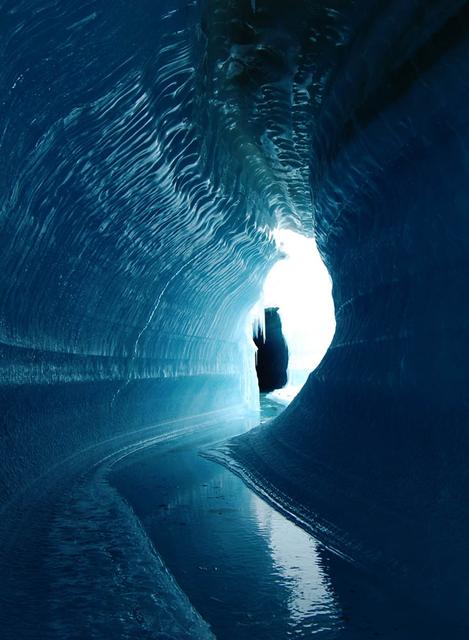
This ice cave in Belcher Glacier (Devon Island, Canada) was formed by melt water flowing within the glacier ice. To learn about the contributions of glaciers to sea level rise, visit: <a href="http://www.nasa.gov/topics/earth/features/glacier-sea-rise.html" rel="nofollow">www.nasa.gov/topics/earth/features/glacier-sea-rise.html</a> Credit: Angus Duncan, University of Saskatchewan <b><a href="http://www.nasa.gov/audience/formedia/features/MP_Photo_Guidelines.html" rel="nofollow">NASA image use policy.</a></b> <b><a href="http://www.nasa.gov/centers/goddard/home/index.html" rel="nofollow">NASA Goddard Space Flight Center</a></b> enables NASA’s mission through four scientific endeavors: Earth Science, Heliophysics, Solar System Exploration, and Astrophysics. Goddard plays a leading role in NASA’s accomplishments by contributing compelling scientific knowledge to advance the Agency’s mission. <b>Follow us on <a href="http://twitter.com/NASA_GoddardPix" rel="nofollow">Twitter</a></b> <b>Like us on <a href="http://www.facebook.com/pages/Greenbelt-MD/NASA-Goddard/395013845897?ref=tsd" rel="nofollow">Facebook</a></b> <b>Find us on <a href="http://instagram.com/nasagoddard?vm=grid" rel="nofollow">Instagram</a></b>
Calving front of the Upsala Glacier (Argentina). This glacier has been thinning and retreating at a rapid rate during the last decades – from 2006 to 2010, it receded 43.7 yards (40 meters) per year. During summer 2012, large calving events prevented boat access to the glacier. To learn about the contributions of glaciers to sea level rise, visit: <a href="http://www.nasa.gov/topics/earth/features/glacier-sea-rise.html" rel="nofollow">www.nasa.gov/topics/earth/features/glacier-sea-rise.html</a> Credit: Etienne Berthier, Université de Toulouse <b><a href="http://www.nasa.gov/audience/formedia/features/MP_Photo_Guidelines.html" rel="nofollow">NASA image use policy.</a></b> <b><a href="http://www.nasa.gov/centers/goddard/home/index.html" rel="nofollow">NASA Goddard Space Flight Center</a></b> enables NASA’s mission through four scientific endeavors: Earth Science, Heliophysics, Solar System Exploration, and Astrophysics. Goddard plays a leading role in NASA’s accomplishments by contributing compelling scientific knowledge to advance the Agency’s mission. <b>Follow us on <a href="http://twitter.com/NASA_GoddardPix" rel="nofollow">Twitter</a></b> <b>Like us on <a href="http://www.facebook.com/pages/Greenbelt-MD/NASA-Goddard/395013845897?ref=tsd" rel="nofollow">Facebook</a></b> <b>Find us on <a href="http://instagram.com/nasagoddard?vm=grid" rel="nofollow">Instagram</a></b>
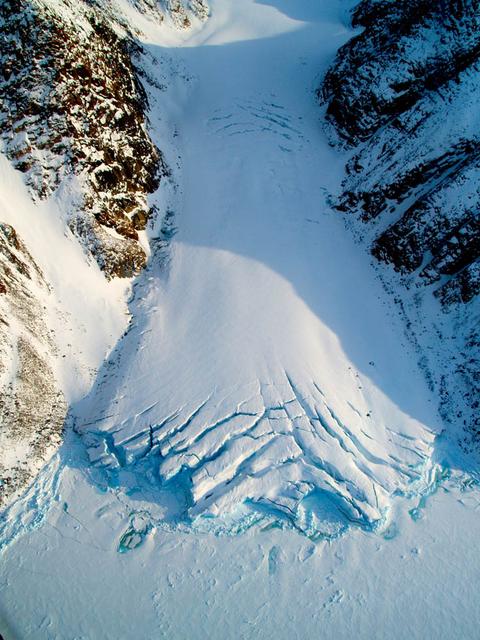
Small valley glacier exiting the Devon Island Ice Cap in Canada. To learn about the contributions of glaciers to sea level rise, visit: <a href="http://www.nasa.gov/topics/earth/features/glacier-sea-rise.html" rel="nofollow">www.nasa.gov/topics/earth/features/glacier-sea-rise.html</a> Credit: Alex Gardner, Clark University <b><a href="http://www.nasa.gov/audience/formedia/features/MP_Photo_Guidelines.html" rel="nofollow">NASA image use policy.</a></b> <b><a href="http://www.nasa.gov/centers/goddard/home/index.html" rel="nofollow">NASA Goddard Space Flight Center</a></b> enables NASA’s mission through four scientific endeavors: Earth Science, Heliophysics, Solar System Exploration, and Astrophysics. Goddard plays a leading role in NASA’s accomplishments by contributing compelling scientific knowledge to advance the Agency’s mission. <b>Follow us on <a href="http://twitter.com/NASA_GoddardPix" rel="nofollow">Twitter</a></b> <b>Like us on <a href="http://www.facebook.com/pages/Greenbelt-MD/NASA-Goddard/395013845897?ref=tsd" rel="nofollow">Facebook</a></b> <b>Find us on <a href="http://instagram.com/nasagoddard?vm=grid" rel="nofollow">Instagram</a></b>

Aerial view of the Sverdrup Glacier, a river of ice that flows from the interior of the Devon Island Ice Cap (Canada) into the ocean. To learn about the contributions of glaciers to sea level rise, visit: <a href="http://www.nasa.gov/topics/earth/features/glacier-sea-rise.html" rel="nofollow">www.nasa.gov/topics/earth/features/glacier-sea-rise.html</a> Credit: Alex Gardner, Clark University <b><a href="http://www.nasa.gov/audience/formedia/features/MP_Photo_Guidelines.html" rel="nofollow">NASA image use policy.</a></b> <b><a href="http://www.nasa.gov/centers/goddard/home/index.html" rel="nofollow">NASA Goddard Space Flight Center</a></b> enables NASA’s mission through four scientific endeavors: Earth Science, Heliophysics, Solar System Exploration, and Astrophysics. Goddard plays a leading role in NASA’s accomplishments by contributing compelling scientific knowledge to advance the Agency’s mission. <b>Follow us on <a href="http://twitter.com/NASA_GoddardPix" rel="nofollow">Twitter</a></b> <b>Like us on <a href="http://www.facebook.com/pages/Greenbelt-MD/NASA-Goddard/395013845897?ref=tsd" rel="nofollow">Facebook</a></b> <b>Find us on <a href="http://instagram.com/nasagoddard?vm=grid" rel="nofollow">Instagram</a></b>
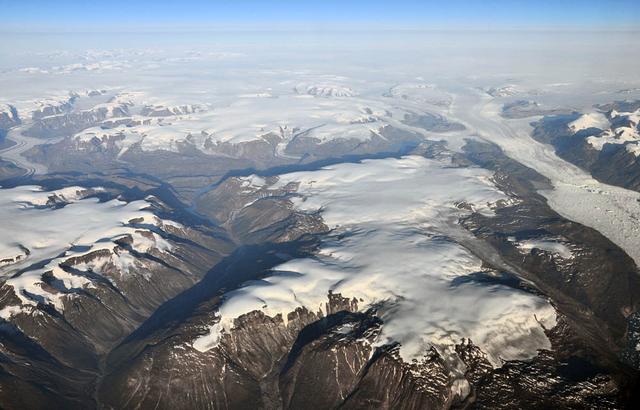
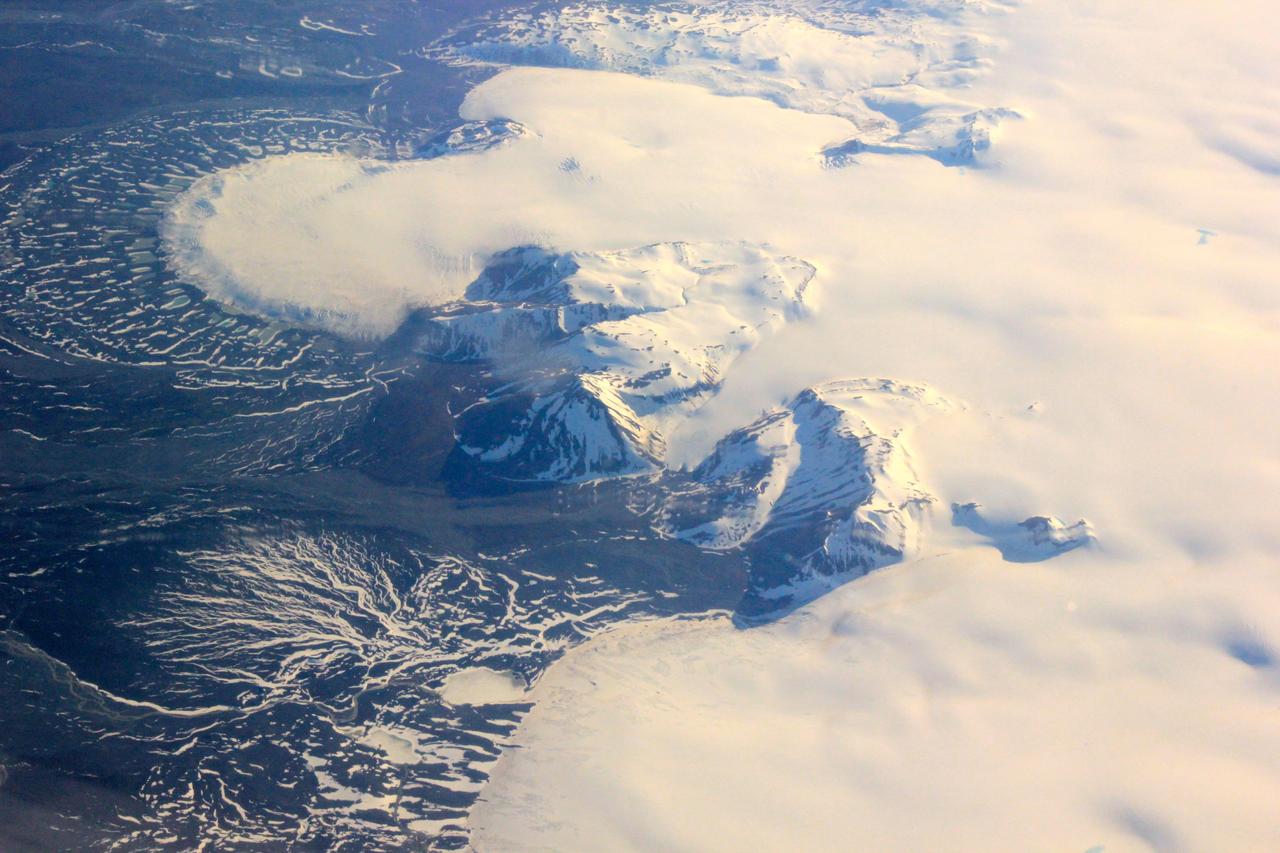
Peripheral glaciers and ice caps (isolated from the main ice sheet, which is seen in the upper right section of the image) in eastern Greenland. To learn about the contributions of glaciers to sea level rise, visit: <a href="http://www.nasa.gov/topics/earth/features/glacier-sea-rise.html" rel="nofollow">www.nasa.gov/topics/earth/features/glacier-sea-rise.html</a> Credit: Frank Paul, University of Zurich <b><a href="http://www.nasa.gov/audience/formedia/features/MP_Photo_Guidelines.html" rel="nofollow">NASA image use policy.</a></b> <b><a href="http://www.nasa.gov/centers/goddard/home/index.html" rel="nofollow">NASA Goddard Space Flight Center</a></b> enables NASA’s mission through four scientific endeavors: Earth Science, Heliophysics, Solar System Exploration, and Astrophysics. Goddard plays a leading role in NASA’s accomplishments by contributing compelling scientific knowledge to advance the Agency’s mission. <b>Follow us on <a href="http://twitter.com/NASA_GoddardPix" rel="nofollow">Twitter</a></b> <b>Like us on <a href="http://www.facebook.com/pages/Greenbelt-MD/NASA-Goddard/395013845897?ref=tsd" rel="nofollow">Facebook</a></b> <b>Find us on <a href="http://instagram.com/nasagoddard?vm=grid" rel="nofollow">Instagram</a></b>
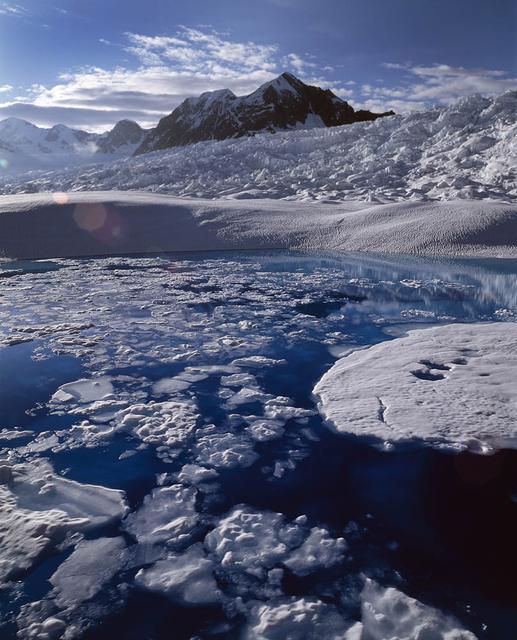
Melt water ponded at surface in the accumulation zone of Columbia Glacier, Alaska, in July 2008. To learn about the contributions of glaciers to sea level rise, visit: <a href="http://www.nasa.gov/topics/earth/features/glacier-sea-rise.html" rel="nofollow">www.nasa.gov/topics/earth/features/glacier-sea-rise.html</a> Credit: W. Tad Pfeffer, University of Colorado at Boulder <b><a href="http://www.nasa.gov/audience/formedia/features/MP_Photo_Guidelines.html" rel="nofollow">NASA image use policy.</a></b> <b><a href="http://www.nasa.gov/centers/goddard/home/index.html" rel="nofollow">NASA Goddard Space Flight Center</a></b> enables NASA’s mission through four scientific endeavors: Earth Science, Heliophysics, Solar System Exploration, and Astrophysics. Goddard plays a leading role in NASA’s accomplishments by contributing compelling scientific knowledge to advance the Agency’s mission. <b>Follow us on <a href="http://twitter.com/NASA_GoddardPix" rel="nofollow">Twitter</a></b> <b>Like us on <a href="http://www.facebook.com/pages/Greenbelt-MD/NASA-Goddard/395013845897?ref=tsd" rel="nofollow">Facebook</a></b> <b>Find us on <a href="http://instagram.com/nasagoddard?vm=grid" rel="nofollow">Instagram</a></b>
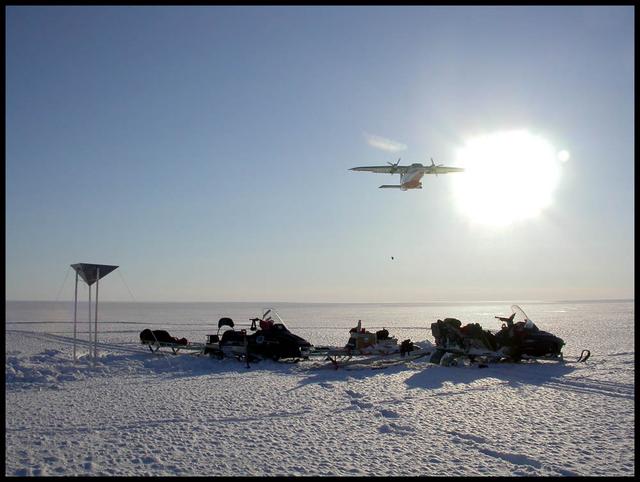
An airplane drops essential support on the Austfonna Ice Cap in Svalbard (Norwegian Arctic). The triangular structure is a corner reflector used as ground reference for airborne radar surveys. To learn about the contributions of glaciers to sea level rise, visit: <a href="http://www.nasa.gov/topics/earth/features/glacier-sea-rise.html" rel="nofollow">www.nasa.gov/topics/earth/features/glacier-sea-rise.html</a> Credit: Andrea Taurisano, Norwegian Polar Institute <b><a href="http://www.nasa.gov/audience/formedia/features/MP_Photo_Guidelines.html" rel="nofollow">NASA image use policy.</a></b> <b><a href="http://www.nasa.gov/centers/goddard/home/index.html" rel="nofollow">NASA Goddard Space Flight Center</a></b> enables NASA’s mission through four scientific endeavors: Earth Science, Heliophysics, Solar System Exploration, and Astrophysics. Goddard plays a leading role in NASA’s accomplishments by contributing compelling scientific knowledge to advance the Agency’s mission. <b>Follow us on <a href="http://twitter.com/NASA_GoddardPix" rel="nofollow">Twitter</a></b> <b>Like us on <a href="http://www.facebook.com/pages/Greenbelt-MD/NASA-Goddard/395013845897?ref=tsd" rel="nofollow">Facebook</a></b> <b>Find us on <a href="http://instagram.com/nasagoddard?vm=grid" rel="nofollow">Instagram</a></b>
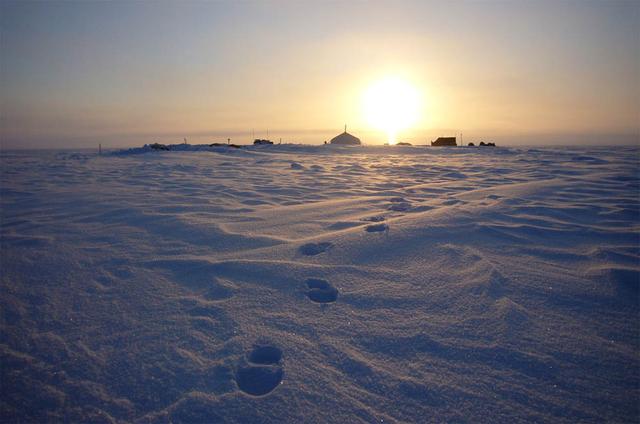
Summit camp on top of the Austfonna Ice Cap in Svalbard (Norwegian Arctic). To learn about the contributions of glaciers to sea level rise, visit: <a href="http://www.nasa.gov/topics/earth/features/glacier-sea-rise.html" rel="nofollow">www.nasa.gov/topics/earth/features/glacier-sea-rise.html</a> Credit: Thorben Dunse, University of Oslo <b><a href="http://www.nasa.gov/audience/formedia/features/MP_Photo_Guidelines.html" rel="nofollow">NASA image use policy.</a></b> <b><a href="http://www.nasa.gov/centers/goddard/home/index.html" rel="nofollow">NASA Goddard Space Flight Center</a></b> enables NASA’s mission through four scientific endeavors: Earth Science, Heliophysics, Solar System Exploration, and Astrophysics. Goddard plays a leading role in NASA’s accomplishments by contributing compelling scientific knowledge to advance the Agency’s mission. <b>Follow us on <a href="http://twitter.com/NASA_GoddardPix" rel="nofollow">Twitter</a></b> <b>Like us on <a href="http://www.facebook.com/pages/Greenbelt-MD/NASA-Goddard/395013845897?ref=tsd" rel="nofollow">Facebook</a></b> <b>Find us on <a href="http://instagram.com/nasagoddard?vm=grid" rel="nofollow">Instagram</a></b>
Malaspina Glacier in southeastern Alaska is considered the classic example of a piedmont glacier. Piedmont glaciers occur where valley glaciers exit a mountain range onto broad lowlands, are no longer laterally confined, and spread to become wide lobes.
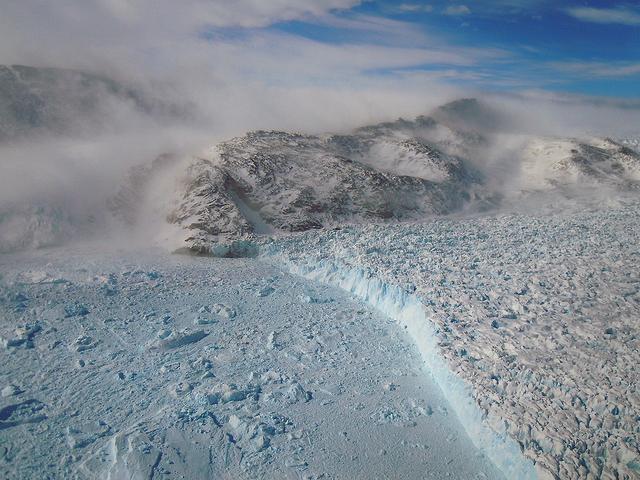
On April 11, 2011, IceBridge finally got the clear weather necessary to fly over glaciers in southeast Greenland. But with clear skies came winds of up to 70 knots, which made for a bumpy ride over the calving front of glaciers like Gyldenlove. Operation IceBridge, now in its third year, makes annual campaigns in the Arctic and Antarctic where science flights monitor glaciers, ice sheets and sea ice. Credit: NASA/GSFC/Michael Studinger To learn more about Ice Bridge go to: <a href="http://www.nasa.gov/mission_pages/icebridge/news/spr11/index.html" rel="nofollow">www.nasa.gov/mission_pages/icebridge/news/spr11/index.html</a> <b><a href="http://www.nasa.gov/centers/goddard/home/index.html" rel="nofollow">NASA Goddard Space Flight Center</a></b> enables NASA’s mission through four scientific endeavors: Earth Science, Heliophysics, Solar System Exploration, and Astrophysics. Goddard plays a leading role in NASA’s accomplishments by contributing compelling scientific knowledge to advance the Agency’s mission. <b>Follow us on <a href="http://twitter.com/NASA_GoddardPix" rel="nofollow">Twitter</a></b> <b>Join us on <a href="http://www.facebook.com/pages/Greenbelt-MD/NASA-Goddard/395013845897?ref=tsd" rel="nofollow">Facebook</a></b>

Image taken 12/2/2000: The Lambert Glacier in Antarctica, is the world's largest glacier. The focal point of this image is an icefall that feeds into the Lambert glacier from the vast ice sheet covering the polar plateau. Ice flows like water, albeit much more slowly. Cracks can be seen in this icefall as it bends and twists on its slow-motion descent 1300 feet (400 meters) to the glacier below. This Icefall can be found on Landsat 7 WRS Path 42 Row 133/134/135, center: -70.92, 69.15. To learn more about the Landsat satellite go to: <a href="http://landsat.gsfc.nasa.gov/" rel="nofollow">landsat.gsfc.nasa.gov/</a>
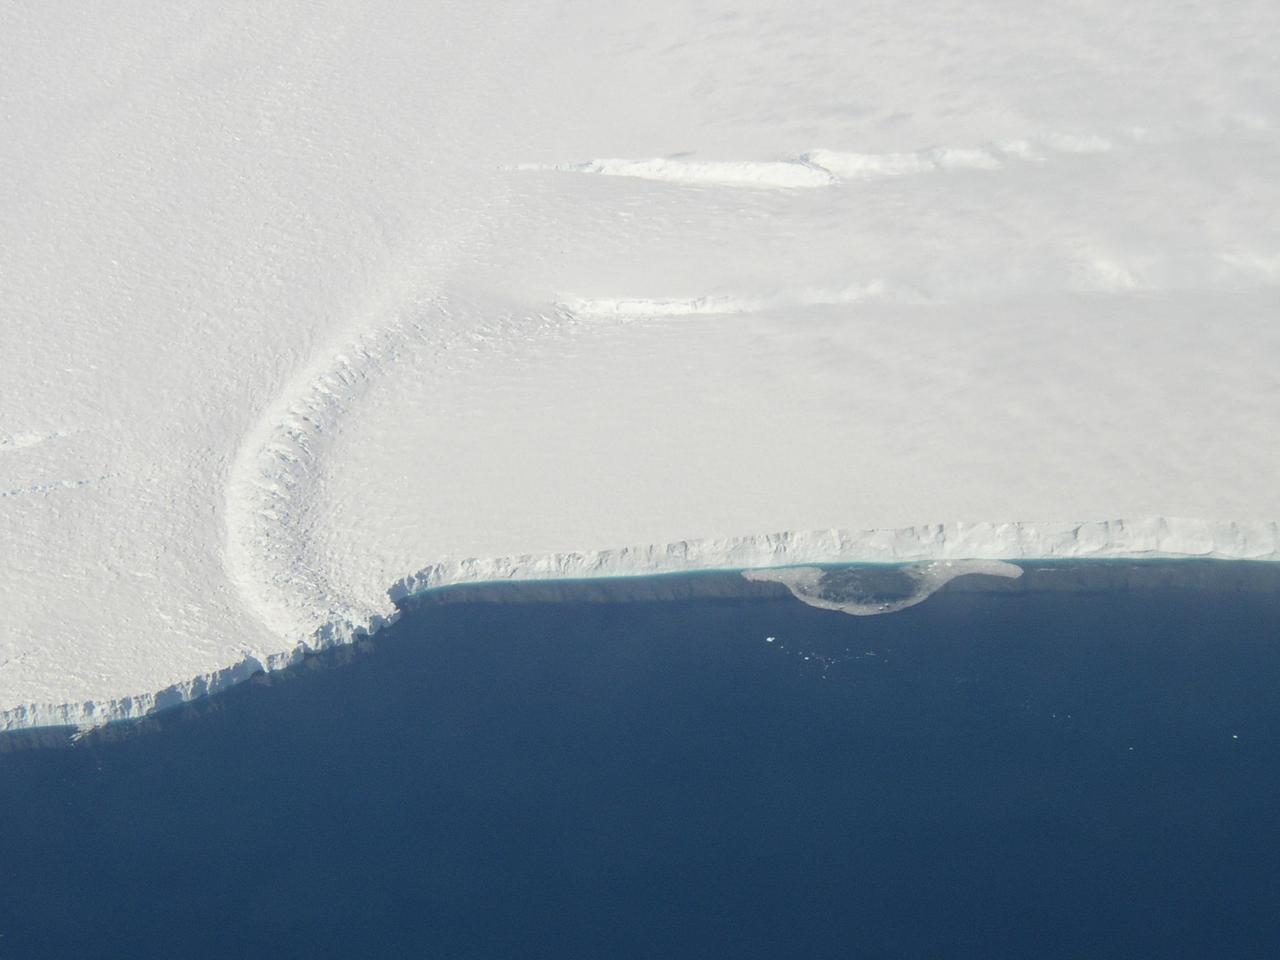
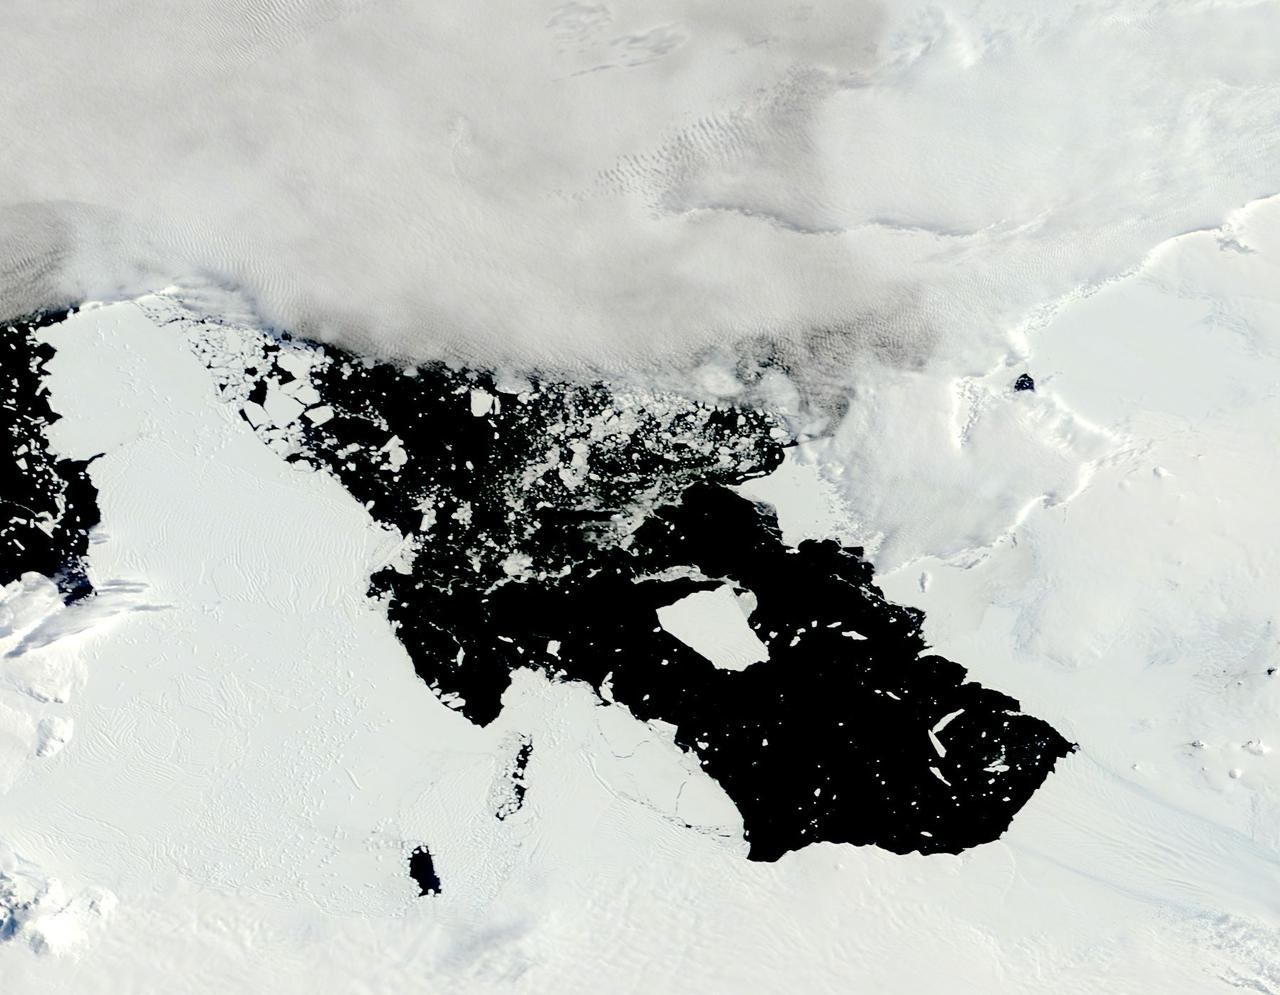
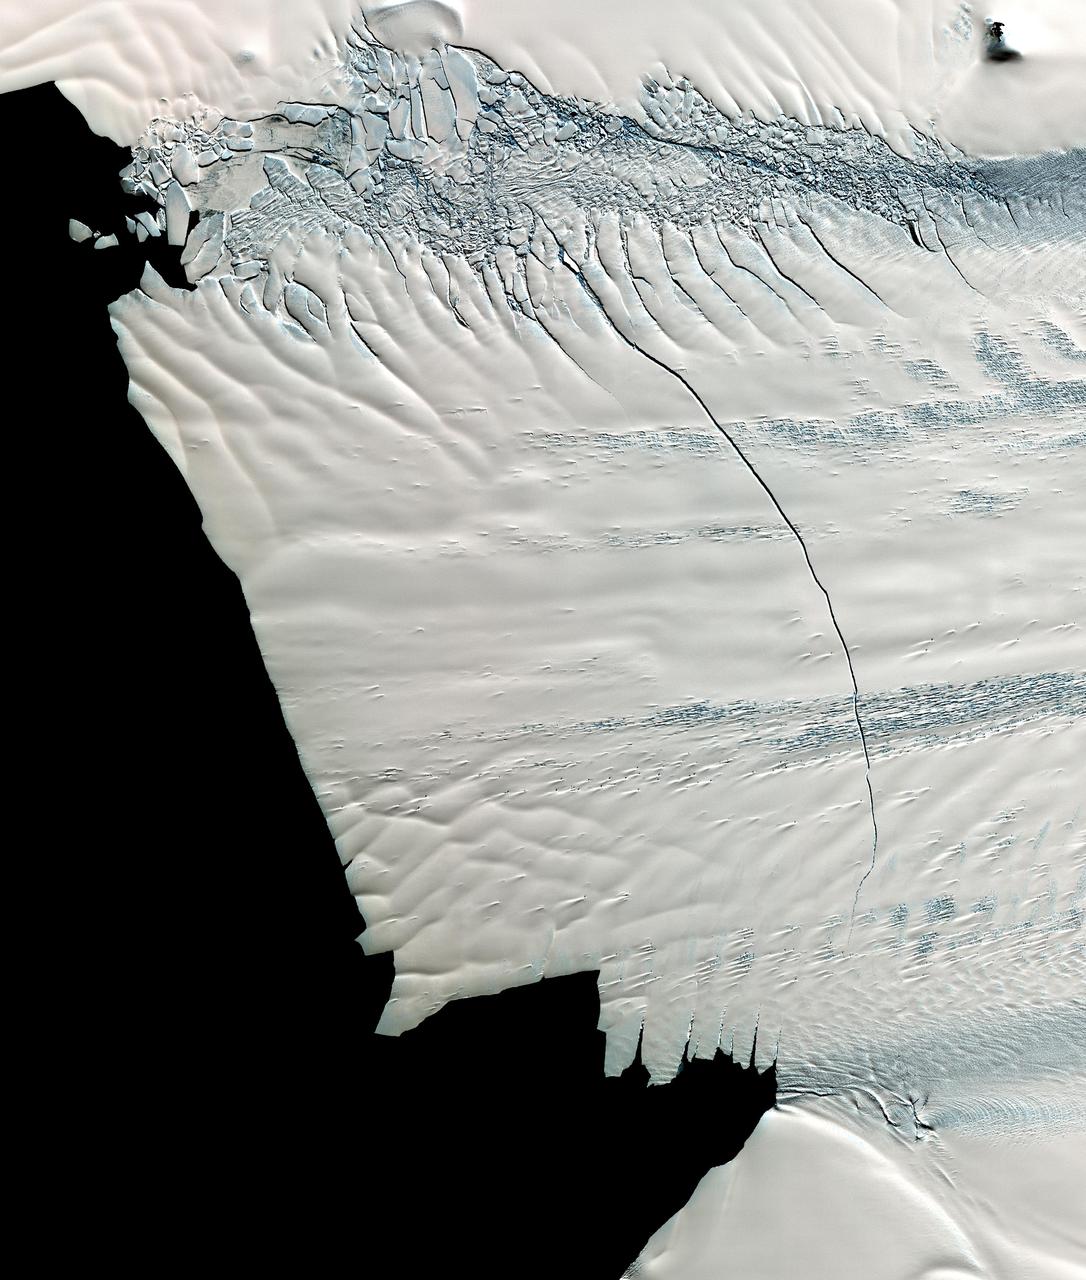
This photo shows the ice front of the ice shelf in front of Pine Island Glacier, a major glacier system of West Antarctica.
NASA image acquired August 5, 2010 On August 5, 2010, an enormous chunk of ice, roughly 97 square miles (251 square kilometers) in size, broke off the Petermann Glacier, along the northwestern coast of Greenland. The Canadian Ice Service detected the remote event within hours in near real-time data from the Moderate Resolution Imaging Spectroradiometer (MODIS) on NASA’s Aqua satellite. The Peterman Glacier lost about one-quarter of its 70-kilometer (40-mile) long floating ice shelf, said researchers who analyzed the satellite data at the University of Delaware. The Moderate Resolution Imaging Spectroradiometer (MODIS) on NASA’s Terra satellite captured these natural-color images of Petermann Glacier 18:05 UTC on August 5, 2010 (top), and 17:15 UTC on July 28, 2010 (bottom). The Terra image of the Petermann Glacier on August 5 was acquired almost 10 hours after the Aqua observation that first recorded the event. By the time Terra took this image, skies were less cloudy than they had been earlier in the day, and the oblong iceberg had broken free of the glacier and moved a short distance down the fjord. Icebergs calving off the Petermann Glacier are not unusual. Petermann Glacier’s floating ice tongue is the Northern Hemisphere’s largest, and it has occasionally calved large icebergs. The recently calved iceberg is the largest to form in the Arctic since 1962, said the University of Delaware. To read more and or to download the high res go here: <a href="http://www.nasa.gov/topics/earth/features/petermann-calve.html" rel="nofollow">www.nasa.gov/topics/earth/features/petermann-calve.html</a> or Click here to see more images from <b><a href="#//earthobservatory.nasa.gov/" rel="nofollow"> NASA Goddard’s Earth Observatory</a></b> NASA Earth Observatory image created by Jesse Allen and Robert Simmon, using data obtained from the Goddard Level 1 and Atmospheric Archive and Distribution System (LAADS). Caption by Holli Riebeek and Michon Scott. Instrument: Terra - MODIS <b><a href="http://www.nasa.gov/centers/goddard/home/index.html" rel="nofollow">NASA Goddard Space Flight Center</a></b> is home to the nation's largest organization of combined scientists, engineers and technologists that build spacecraft, instruments and new technology to study the Earth, the sun, our solar system, and the universe. <b>Follow us on <a href="http://twitter.com/NASA_GoddardPix" rel="nofollow">Twitter</a></b> <b>Join us on <a href="http://www.facebook.com/pages/Greenbelt-MD/NASA-Goddard/395013845897?ref=tsd" rel="nofollow">Facebook</a><b></b></b>
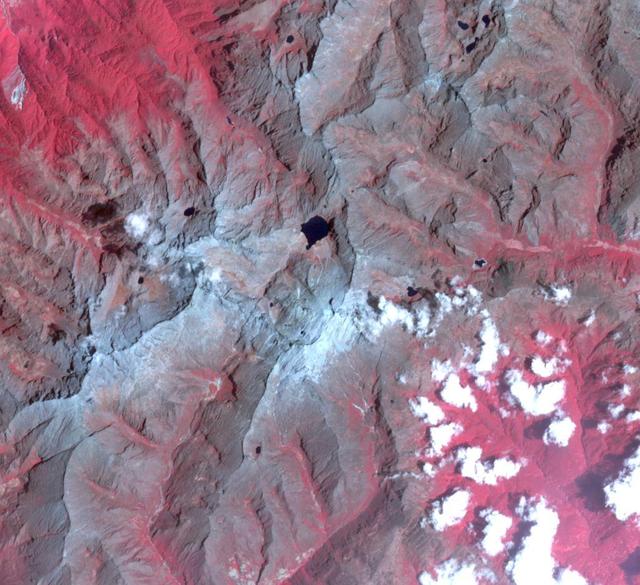
Venezuela may be the first nation in modern history to lose all its glaciers after climate scientists downgraded its last one to an ice field. The International Cryosphere Climate Initiative (ICCI said that the nation's only remaining glacier – the Humboldt, or La Corona, in the Andes – had become too small to be classed as a glacier. Researchers found that the glacier had shrunk from 450 hectares to just two. The images were acquired July 21, 2002 and March 15, 2024. They cover an area of 14.2 by 15.3 km, and are located at 8.5 degrees north, 71 degrees west. https://photojournal.jpl.nasa.gov/catalog/PIA26447
NASA image captured August 31, 2000 The tongue of the Malaspina Glacier, the largest glacier in Alaska, fills most of this image. The Malaspina lies west of Yakutat Bay and covers 1,500 sq. MI (3,880 sq. km). Credit: NASA/Landsat <b><a href="http://www.nasa.gov/centers/goddard/home/index.html" rel="nofollow">NASA Goddard Space Flight Center</a></b> enables NASA’s mission through four scientific endeavors: Earth Science, Heliophysics, Solar System Exploration, and Astrophysics. Goddard plays a leading role in NASA’s accomplishments by contributing compelling scientific knowledge to advance the Agency’s mission. <b>Follow us on <a href="http://twitter.com/NASA_GoddardPix" rel="nofollow">Twitter</a></b> <b>Join us on <a href="http://www.facebook.com/pages/Greenbelt-MD/NASA-Goddard/395013845897?ref=tsd" rel="nofollow">Facebook</a></b>
Folds in the lower reaches of valley glaciers can be caused by powerful surges of tributary ice streams. This phenomenon is spectacularly displayed by the Sustina Glacier in the Alaska Range as seen by NASA Terra spacecraft.
Byrd Glacier is a major glacier in Antarctica; it drains an extensive area of the polar plateau and flows eastward between the Britannia Range and the Churchill Mountains to discharge into the Ross Ice Shelf. This image is from NASA Terra satellite.
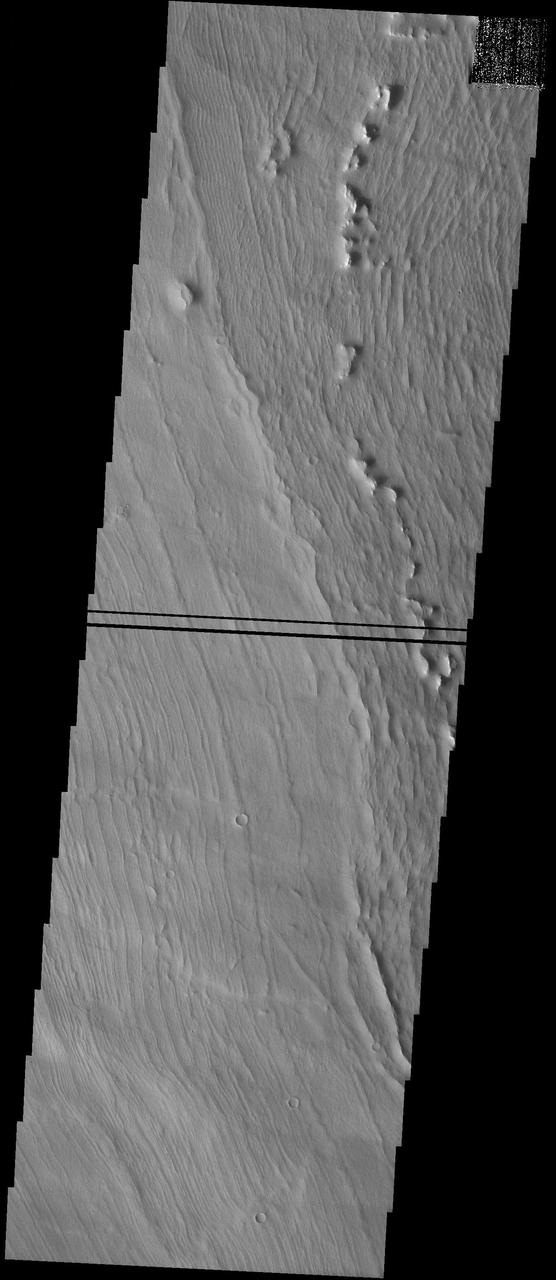
Glacier-Like Flow on Arsia Mons Flank
STS066-117-014 (3-14 Nov. 1994) --- Malaspina Glacier can be seen in this north-northeastern photograph taken in November, 1994. The glacier, located in the south shore of Alaska is a classic example of a piedmont glacier lying along the foot of a mountain range. The principal source of ice for the glacier is provided by the Seward Ice Field to the north (top portion of the view) which flows through three narrow outlets onto the coastal plain. The glacier moves in surges that rush earlier-formed moraines outward into the expanding concentric patterns along the flanks of the ice mass.
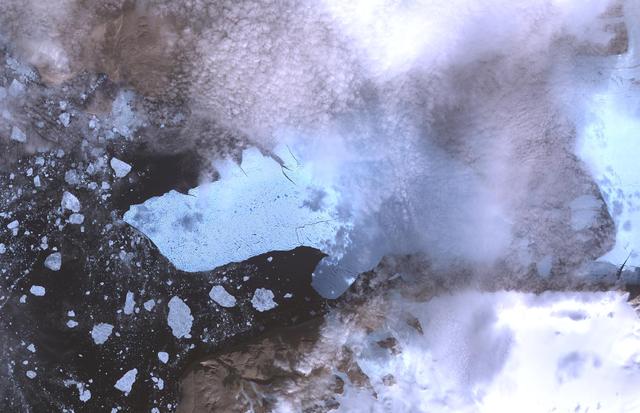
NASA image acquired August 11, 2010. After breaking off the Petermann Glacier on August 5, 2010, a massive ice island floated slowly down the fjord toward the Nares Strait. The Advanced Spaceborne Thermal Emission and Reflection Radiometer (ASTER) on NASA’s Terra satellite captured this false-color image of the ice island on August 11, 2010. In this image, ice is light blue, water is nearly black, and clouds are nearly white. Although a bank of thin clouds hovers over the fjord, the southernmost margin of the ice island is still visible. Toward the north, the leading edge of the ice island retains the same shape it had days earlier, at the time of the initial calving. NASA Earth Observatory image created by Jesse Allen, using data provided courtesy of NASA/GSFC/METI/ERSDAC/JAROS, and U.S./Japan ASTER Science Team. Caption by Michon Scott. Instrument: Terra - ASTER To see more images from of the glacier go to: <a href="http://earthobservatory.nasa.gov/NaturalHazards/event.php?id=45116" rel="nofollow">earthobservatory.nasa.gov/NaturalHazards/event.php?id=45116</a> <b><a href="http://www.nasa.gov/centers/goddard/home/index.html" rel="nofollow">NASA Goddard Space Flight Center</a></b> is home to the nation's largest organization of combined scientists, engineers and technologists that build spacecraft, instruments and new technology to study the Earth, the sun, our solar system, and the universe. <b>Follow us on <a href="http://twitter.com/NASA_GoddardPix" rel="nofollow">Twitter</a></b> <b>Join us on <a href="http://www.facebook.com/pages/Greenbelt-MD/NASA-Goddard/395013845897?ref=tsd" rel="nofollow">Facebook</a><b></b></b>
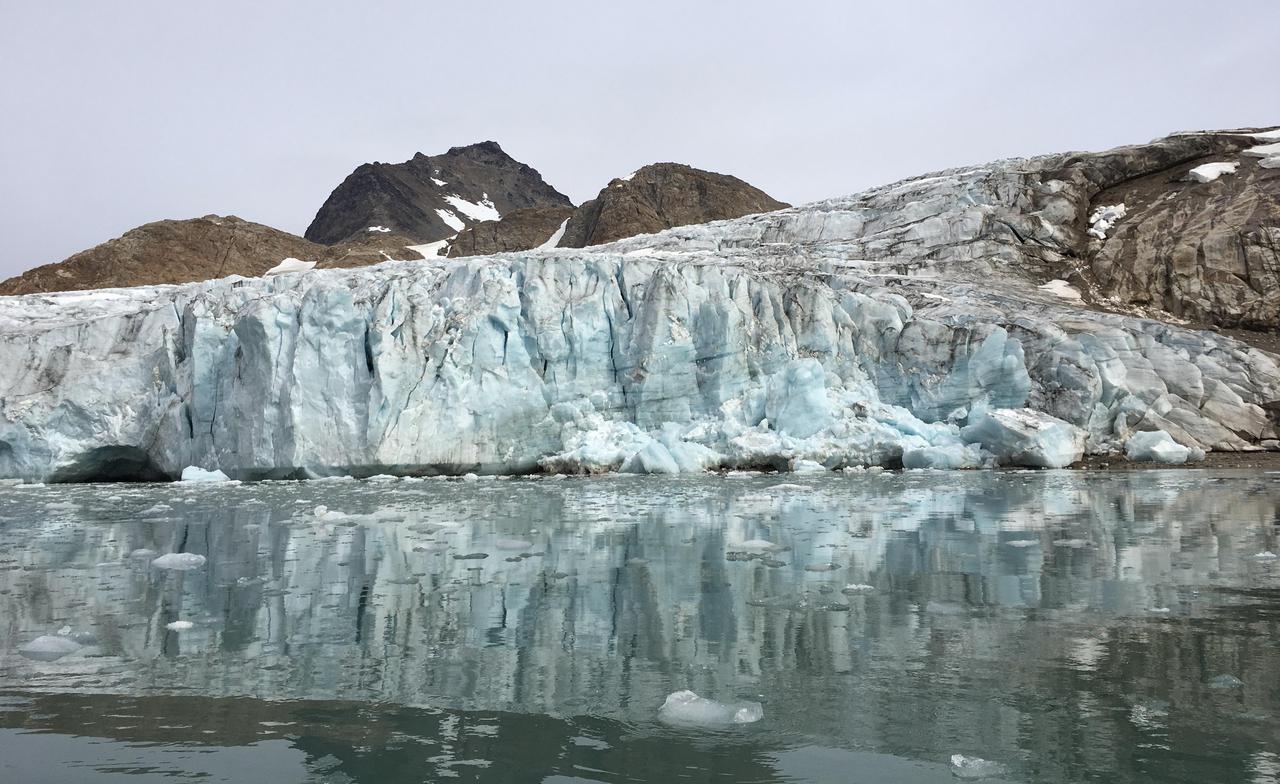
NASA's Oceans Melting Greenland airborne mission found that most of Greenland's glaciers that empty into the ocean are at greater risk of rapid ice loss than previously understood. OMG's six-year field campaign studied the ocean's role in glacial ice loss by gathering precise measurements of ocean depth, temperature, and salinity in front of more than 220 glaciers. The mission's goal was to clarify our understanding of sea level rise over the next 50 years. This photo of Apusiaajik Glacier was taken near Kulusuk, Greenland, on Aug. 26, 2018, during OMG's field operations. https://photojournal.jpl.nasa.gov/catalog/PIA24983
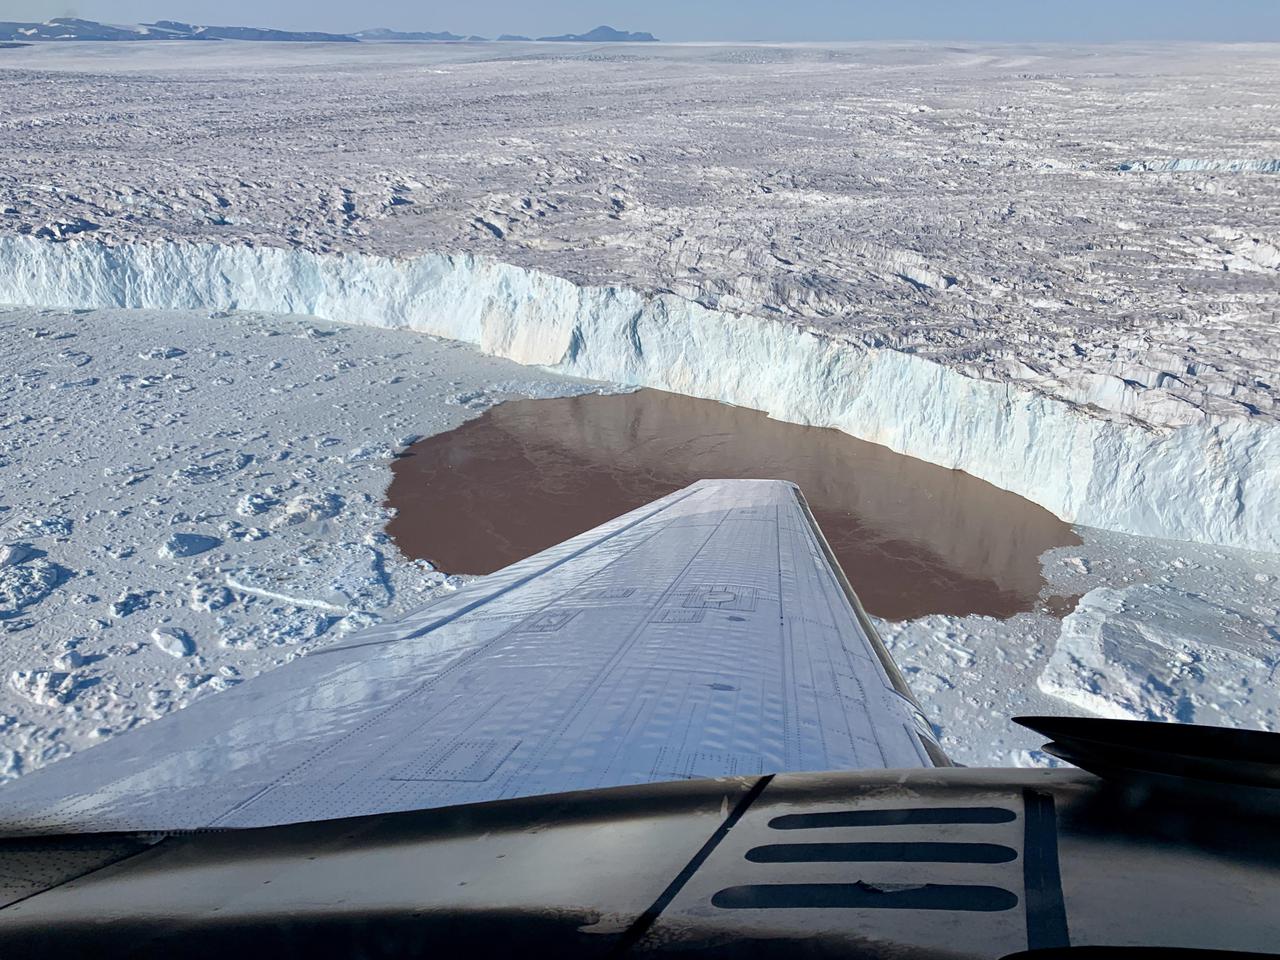
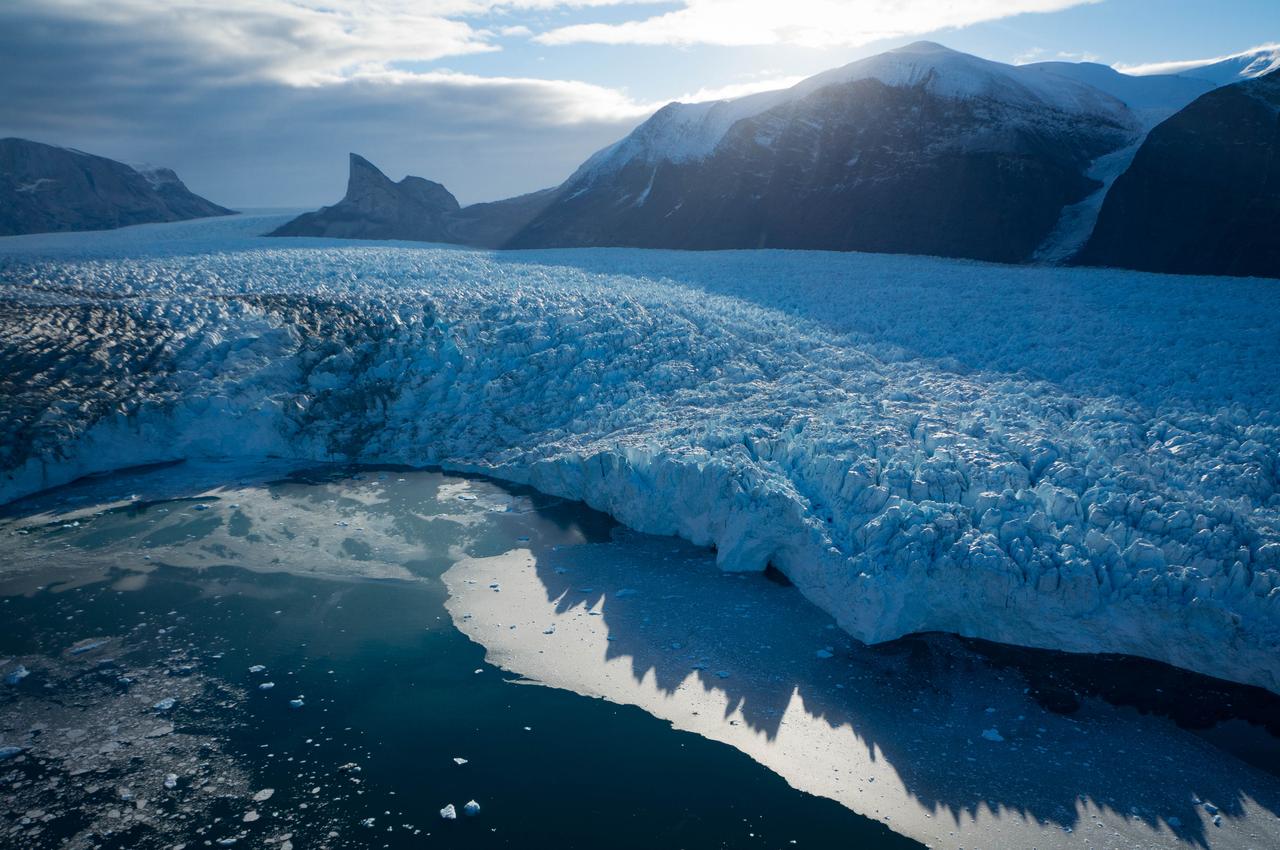
In this aerial view, a glacier along Greenland's craggy coastline is actively undergoing undercutting, a process in which meltwater flowing out from the bottom of the glacier enters the fjord. The brown water in front of the glacier is caused by sediment being dredged up from the base of the glacier by meltwater plumes reaching the surface of the fjord. Because the meltwater contains no salt, it is lighter and rises through the saltier ocean water, dragging the warm ocean water into contact with the ice at the glacier's base. The result is increased melting at the bottom of the glacier, which creates and overhanging layer of ice that breaks off (or calves) as icebergs. As the climate warms, the ocean water temperature and the amount of meltwater both increase, combining to hasten this undercutting process and speed up the ice loss from Greenland's Ice Sheet. The image was taken on Aug. 25, 2019 by a probe-dropping airplane as part of the Oceans Melting Greenland (OMG) mission. OMG has been studying glaciers that plunge into Greenland's steep-sided inlets, or fjords, for the past five years, gathering precise measurements of fjord depth and water salinity from probes dropped by plane, supplemented by measurements made by boat. The aim is to better understand how the warming ocean water around Greenland is hastening ice melt and calving of these marine-terminating glaciers. https://photojournal.jpl.nasa.gov/catalog/PIA24162
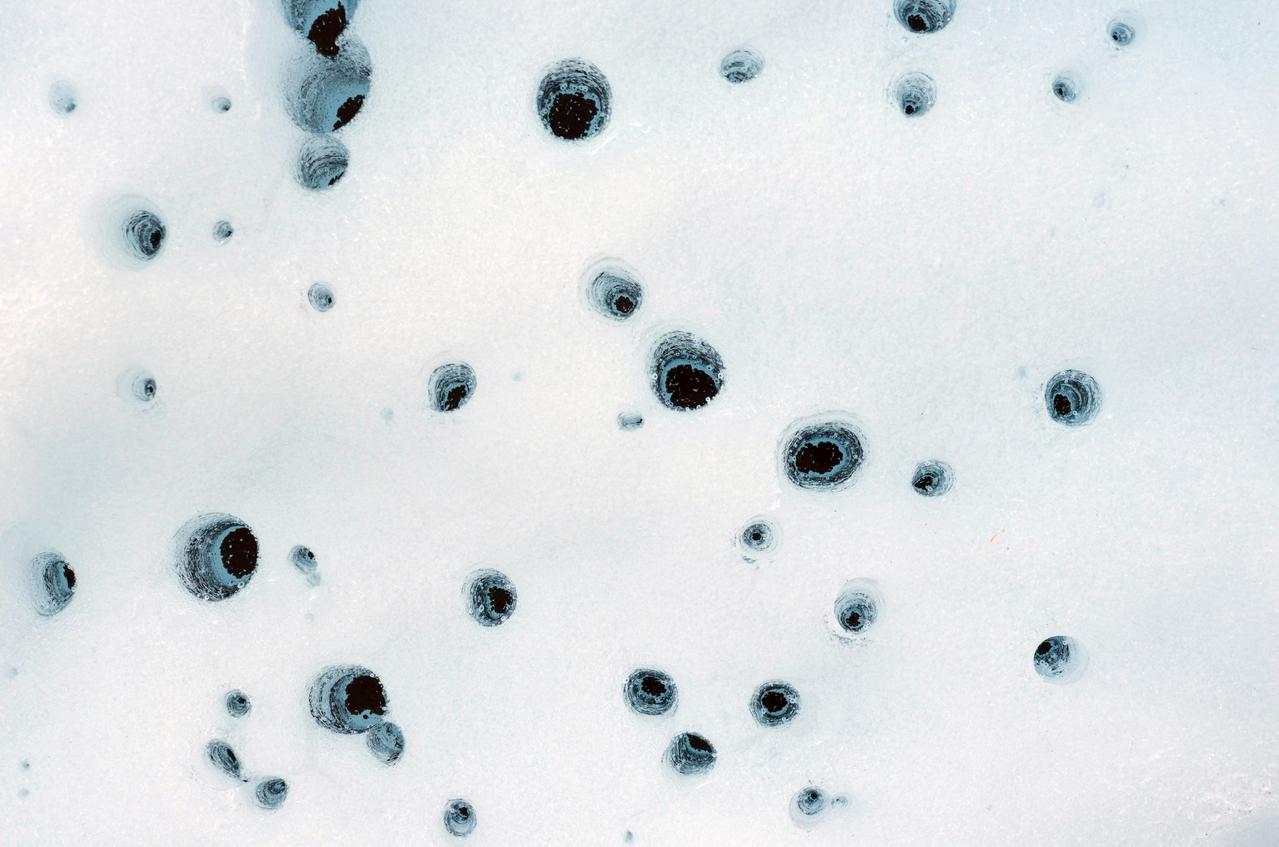
These holes, captured on Alaska's Matanuska Glacier in July 2012, are formed by cryoconite – dust particles that melt into the ice over time, eventually forming small pockets of water below the glacier's surface. Scientists believe similar pockets of water – called cryoconite holes on Earth – could form within dusty water ice on Mars. https://photojournal.jpl.nasa.gov/catalog/PIA26409
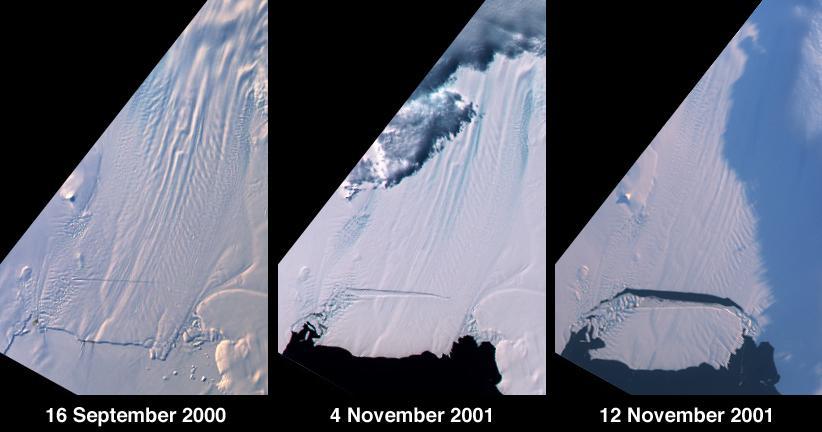
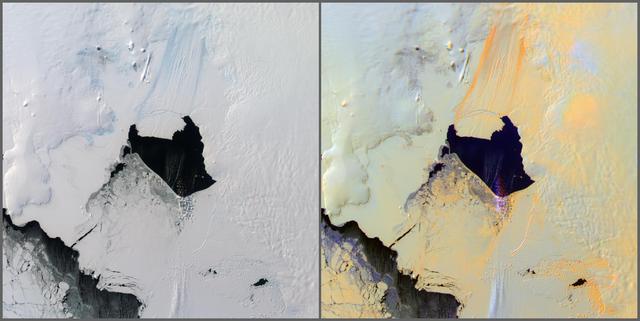
A large tabular iceberg (42 kilometers x 17 kilometers) broke off Pine Island Glacier, West Antarctica (75ºS latitude, 102ºW longitude) sometime between November 4 and 12, 2001. Images of the glacier were acquired by the Multi-angle Imaging SpectroRadiometer (MISR) instrument aboard NASA's Terra spacecraft. This event was preceded by the formation of a large crack across the glacier in mid 2000. Data gathered by other imaging instruments revealed the crack to be propagating through the shelf ice at a rate averaging 15 meters per day, accompanied by a slight rotation of about one percent per year at the seaward margin of the rift. The image set shows three views of Pine Island Glacier acquired by MISR's vertical-viewing (nadir) camera. The first was captured in late 2000, early in the development of the crack. The second and third views were acquired in November 2001, just before and just after the new iceberg broke off. The existence of the crack took the glaciological community by surprise, and the rapid rate at which the crack propagated was also not anticipated. Glaciologists predicted that the rift would reach the other side of the glacier sometime in 2002. However, the iceberg detached much sooner than anticipated, and the last 10-kilometer segment that was still attached to the ice shelf snapped off in a matter of days. http://photojournal.jpl.nasa.gov/catalog/PIA03431
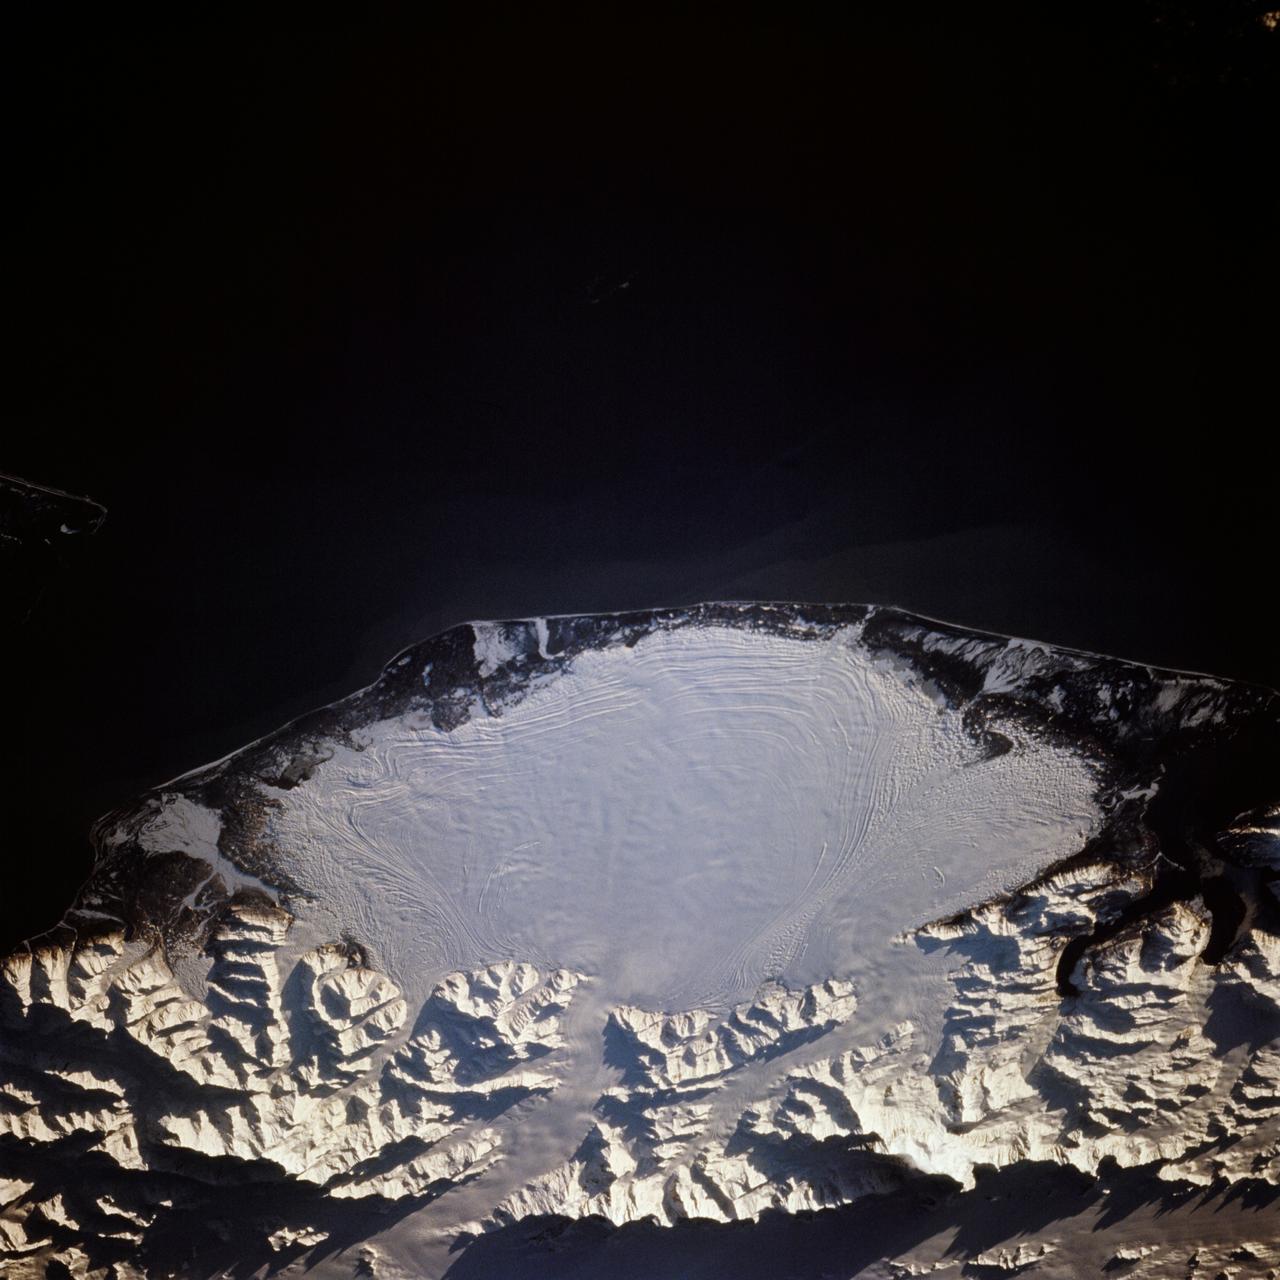
This image shows a small part of the Hofsjökull ice cap in Iceland, which encompasses several glaciers. The fan at upper left is part of a glacier called Mûlajökul.
A chunk of glacier was threatening to fall into an Andean lake and cause major flooding in a Peruvian city of 60,000. A fissure has appeared in the glacier that feeds the Lake Palcacocha near the city of Huaraz, 270 km north of Lima. If the piece breaks off, ensuing floods would take 15 minutes to reach the city. In 1941, the lake overflowed and caused massive destruction, killing 7,000 people. The city can be seen in the left-center part of the image. Lake Palcacocha is in the upper right corner of the image at the head of a valley, below the snow and glacier cap. The ASTER instrument is being tasked to obtain current images of the glacier to help monitor the situation. This image was acquired on November 5, 2001 by the Advanced Spaceborne Thermal Emission and Reflection Radiometer (ASTER) on NASA's Terra satellite. With its 14 spectral bands from the visible to the thermal infrared wavelength region, and its high spatial resolution of 15 to 90 meters (about 50 to 300 feet), ASTER images Earth to map and monitor the changing surface of our planet. http://photojournal.jpl.nasa.gov/catalog/PIA03898
The voyage of Iceberg B-31 continued in January, 2014 as the giant iceberg drifted over the frigid waters of Pine Island Bay and widened the gap between the newly-calved iceberg and the “mother” glacier. Between November 9 and 11, 20143 a giant crack in the Pine Island Glacier gave completely away, liberating Iceberg B-31 from the end of the glacial tongue. The new iceberg was estimated to be 35 km by 20 km (21 mi by 12 mi) in size – or roughly the size of Singapore. On January 5, 2014 the Moderate Resolution Imaging Spectroradiometer (MODIS) aboard NASA’s Terra satellite captured this true-color image of B-31 floating in the center of Pine Island Bay on an approach to the Amundsen Sea. Pine Island Glacier can be seen on the upper right coast of the bay, and is marked by parallel lines in the ice. According to measurements reported by the National U.S. Ice Center, on January 10, B-31 was maintaining its size, and was located at 74°24'S and 104°33'W. Credit: NASA/GSFC/Jeff Schmaltz/MODIS Land Rapid Response Team <b><a href="http://www.nasa.gov/audience/formedia/features/MP_Photo_Guidelines.html" rel="nofollow">NASA image use policy.</a></b> <b><a href="http://www.nasa.gov/centers/goddard/home/index.html" rel="nofollow">NASA Goddard Space Flight Center</a></b> enables NASA’s mission through four scientific endeavors: Earth Science, Heliophysics, Solar System Exploration, and Astrophysics. Goddard plays a leading role in NASA’s accomplishments by contributing compelling scientific knowledge to advance the Agency’s mission. <b>Follow us on <a href="http://twitter.com/NASA_GoddardPix" rel="nofollow">Twitter</a></b> <b>Like us on <a href="http://www.facebook.com/pages/Greenbelt-MD/NASA-Goddard/395013845897?ref=tsd" rel="nofollow">Facebook</a></b> <b>Find us on <a href="http://instagrid.me/nasagoddard/?vm=grid" rel="nofollow">Instagram</a></b>
Onboard NASA Terra spacecraft, the Advanced Spaceborne Thermal Emission and Reflection Radiometer data have revealed significant spatial variability in glacier flow in the Bhutan Himalayas.
This pair of images from NASA Terra satellite are of the Pine Island Glacier in western Antarctica, acquired on December 12, 2000 during Terra orbit 5246.
This image of Petermann Glacier and the new iceberg was acquired from NASA Terra spacecraft on Aug. 12, 2010. On Aug. 5, 2010, an enormous chunk of ice broke off the Petermann Glacier along the northwestern coast of Greenland.
This image from NASA Terra spacecraft shows a massive crack across the Pine Island Glacier, a major ice stream that drains the West Antarctic Ice Sheet. Eventually, the crack will extend all the way across the glacier.
This anaglyph, from NASA Shuttle Radar Topography Mission, is of Malaspina Glacier in southeastern Alaska. 3D glasses are necessary to view this image.
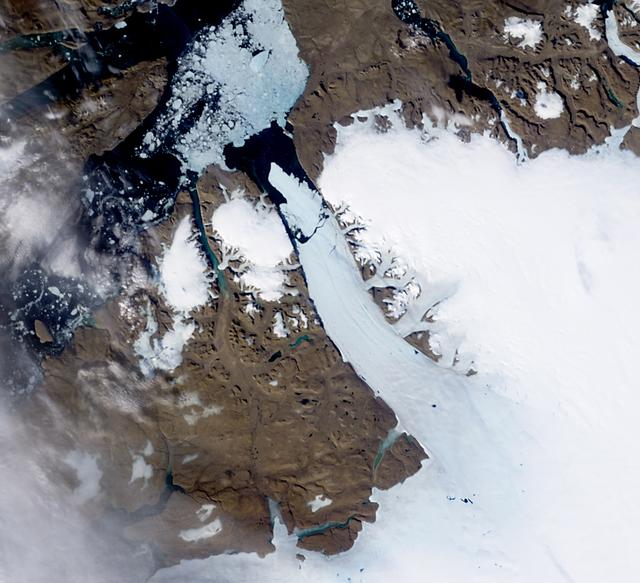
A new NASA-funded study has identified which glaciers in West Greenland are most susceptible to thinning in the coming decades by analyzing how they’re shaped. The research could help predict how much the Greenland Ice Sheet will contribute to future sea level rise in the next century, a number that currently ranges from inches to feet. “There are glaciers that popped up in our study that flew under the radar until now,” said lead author Denis Felikson, a graduate research assistant at The University of Texas Institute for Geophysics (UTIG) and a Ph.D. student in The University of Texas Department of Aerospace Engineering and Engineering Mechanics. Felikson’s study was published in Nature Geoscience on April 17. Read more: <a href="https://go.nasa.gov/2pJJwNA" rel="nofollow">go.nasa.gov/2pJJwNA</a> Caption: Terminus of Kangerlugssuup Sermerssua glacier in west Greenland Photo credit: Denis Felikson, Univ. of Texas <b><a href="http://www.nasa.gov/audience/formedia/features/MP_Photo_Guidelines.html" rel="nofollow">NASA image use policy.</a></b> <b><a href="http://www.nasa.gov/centers/goddard/home/index.html" rel="nofollow">NASA Goddard Space Flight Center</a></b> enables NASA’s mission through four scientific endeavors: Earth Science, Heliophysics, Solar System Exploration, and Astrophysics. Goddard plays a leading role in NASA’s accomplishments by contributing compelling scientific knowledge to advance the Agency’s mission. <b>Follow us on <a href="http://twitter.com/NASAGoddardPix" rel="nofollow">Twitter</a></b> <b>Like us on <a href="http://www.facebook.com/pages/Greenbelt-MD/NASA-Goddard/395013845897?ref=tsd" rel="nofollow">Facebook</a></b> <b>Find us on <a href="http://instagrid.me/nasagoddard/?vm=grid" rel="nofollow">Instagram</a></b>
This image from NASA Mars Reconnaissance Orbiter shows one of these icy lobate features wrapping around a small hill. Many lobate features are now known to be almost pure ice, like glaciers on the Earth.
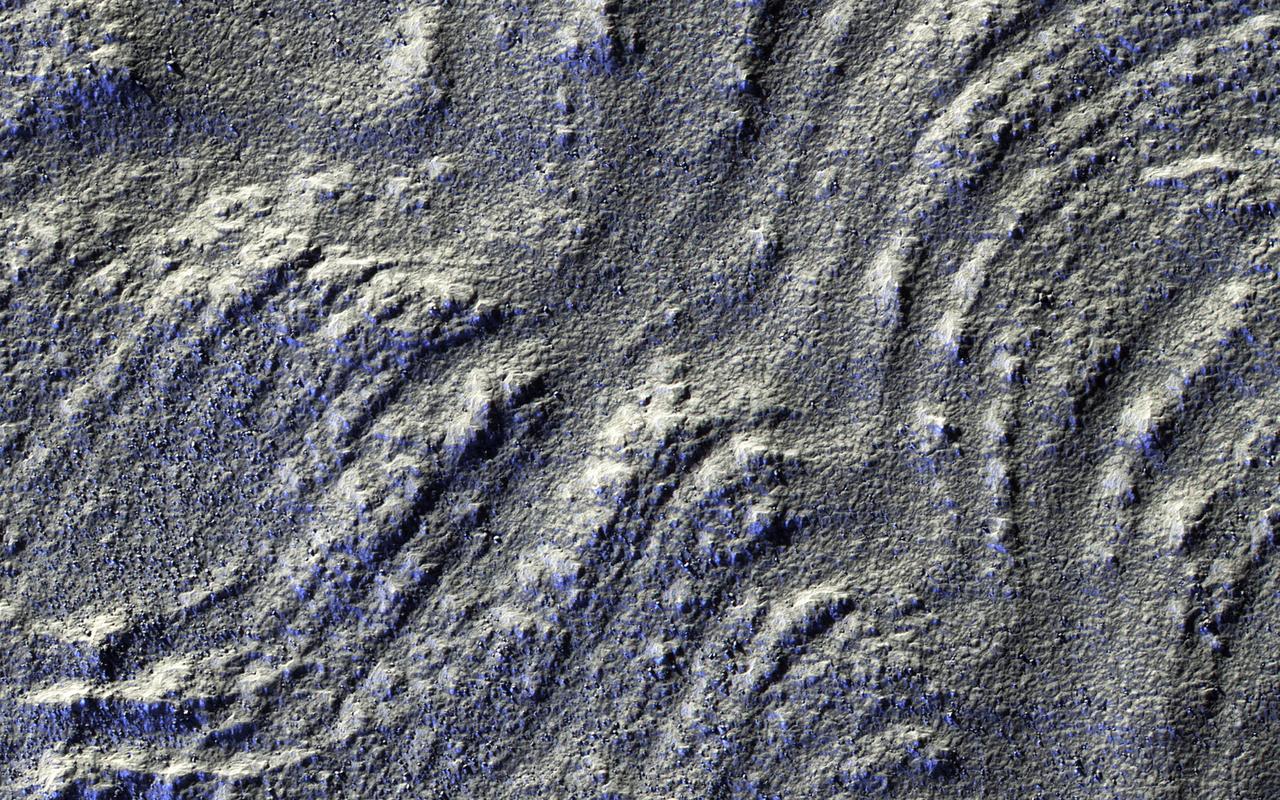
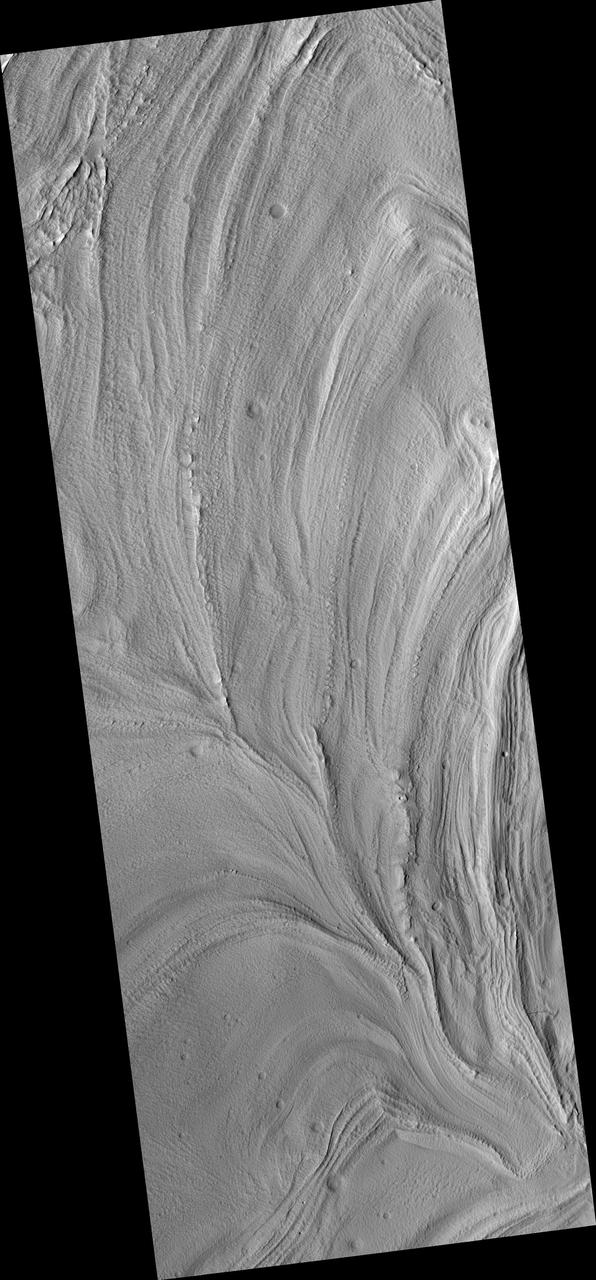
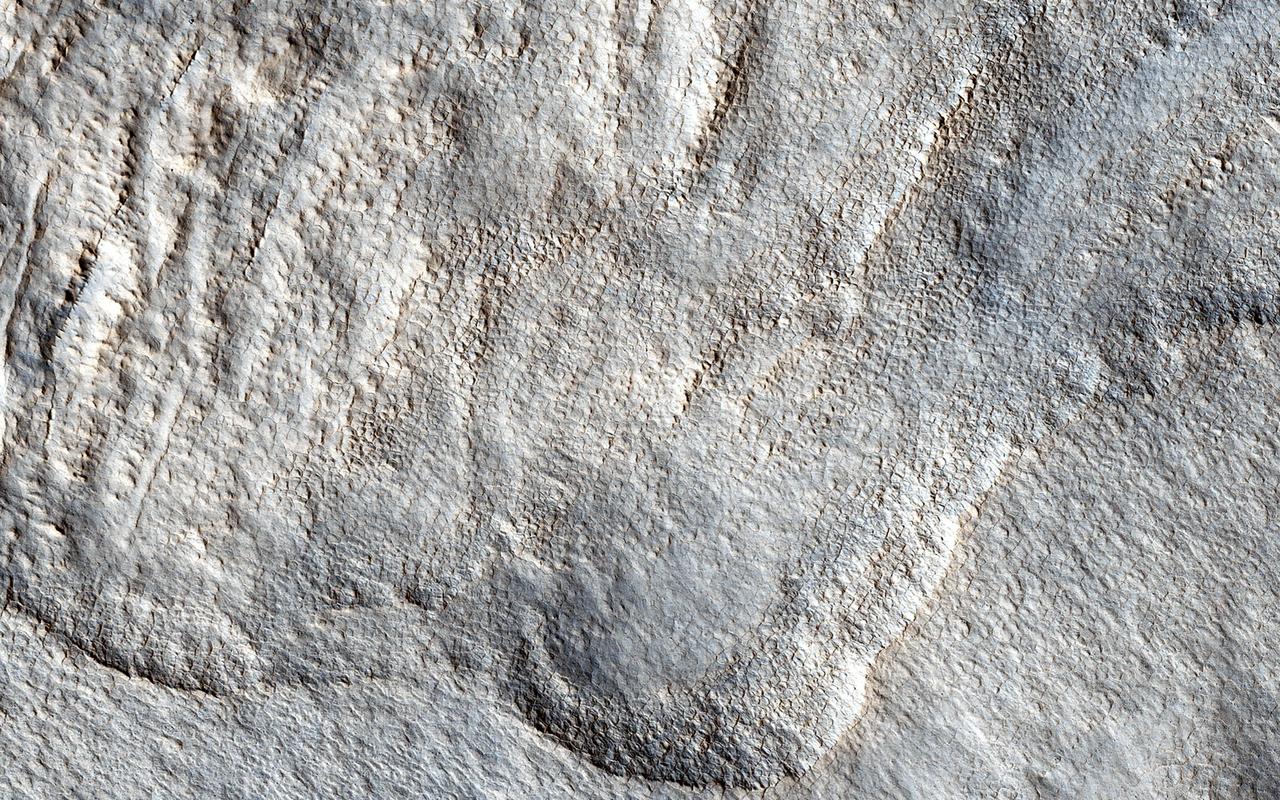
This image has low-sun lighting that accentuates the many transverse ridges on this slope, extending from Euripus Mons (mountains). These flow-like structures were previously called "lobate debris aprons," but the Shallow Radar (SHARAD) instrument on MRO has shown that they are actually debris-covered flows of ice, or glaciers. There is no evidence for present-day flow of these glaciers, so they appear to be remnants of past climates. http://photojournal.jpl.nasa.gov/catalog/PIA20745
ISS040-E-000298 (16 May 2014) --- NASA astronaut Steve Swanson, Expedition 40 commander, works with the General Laboratory Active Cryogenic ISS Experiment Refrigerator (GLACIER) in the Destiny laboratory of the International Space Station.

ISS040-E-000297 (16 May 2014) --- NASA astronaut Steve Swanson, Expedition 40 commander, works with the General Laboratory Active Cryogenic ISS Experiment Refrigerator (GLACIER) in the Destiny laboratory of the International Space Station.

ISS040-E-000296 (16 May 2014) --- NASA astronaut Steve Swanson, Expedition 40 commander, works with the General Laboratory Active Cryogenic ISS Experiment Refrigerator (GLACIER) in the Destiny laboratory of the International Space Station.
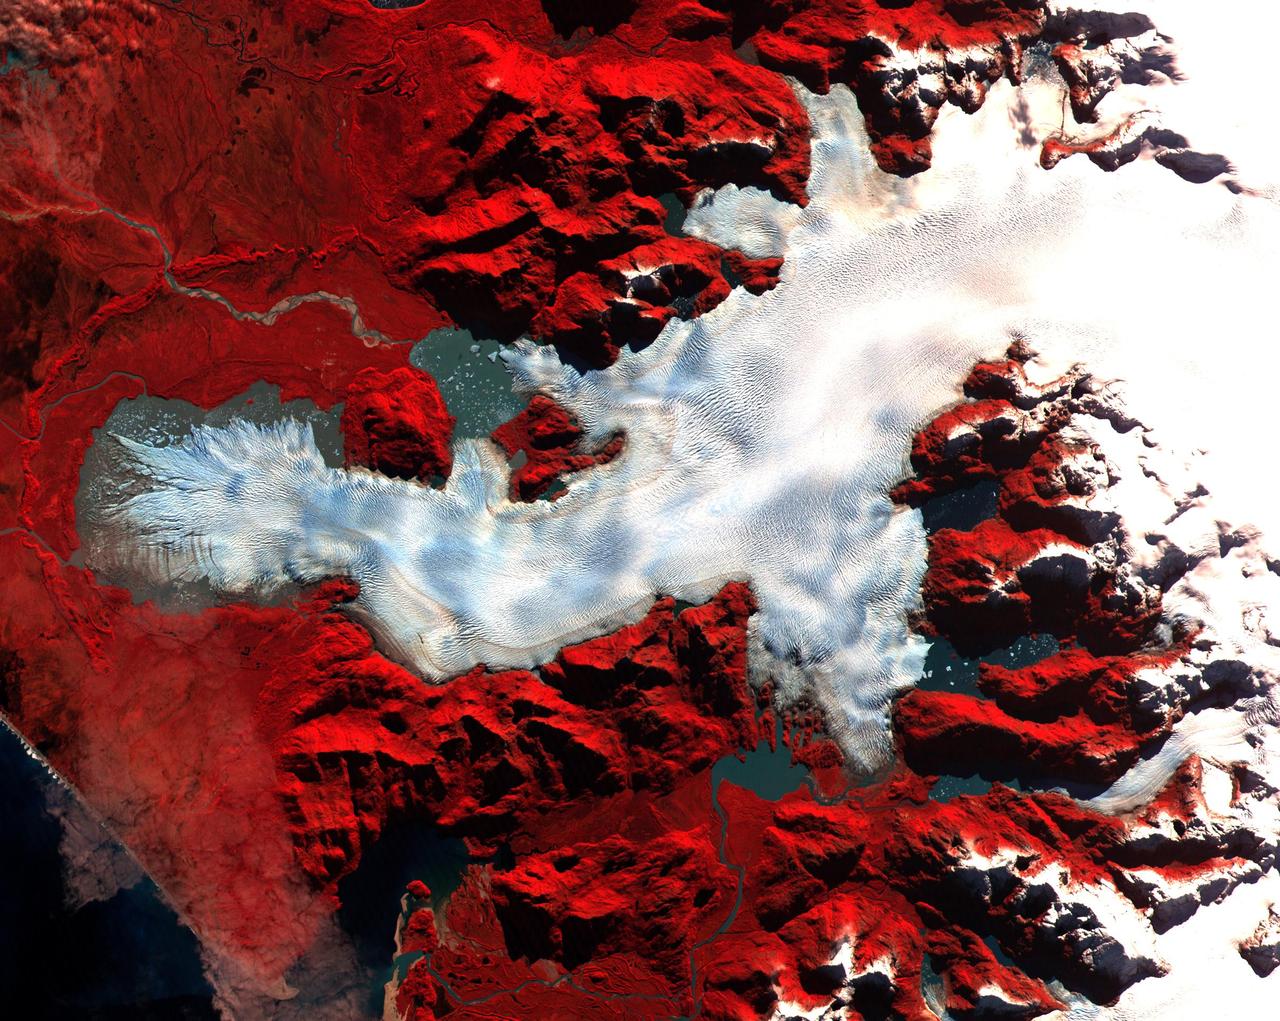
This ASTER image was acquired on May 2, 2000 over the North Patagonia Ice Sheet, Chile near latitude 47 degrees south, longitude 73 degrees west. The image covers 36 x 30 km. The false color composite displays vegetation in red. The image dramatically shows a single large glacier, covered with crevasses. A semi-circular terminal moraine indicates that the glacier was once more extensive than at present. ASTER data are being acquired over hundreds of glaciers worldwide to measure their changes over time. Since glaciers are sensitive indicators of warming or cooling, this program can provide global data set critical to understand climate change. This image is located at 46.5 degrees south latitude and 73.9 degrees west longitude. http://photojournal.jpl.nasa.gov/catalog/PIA02670
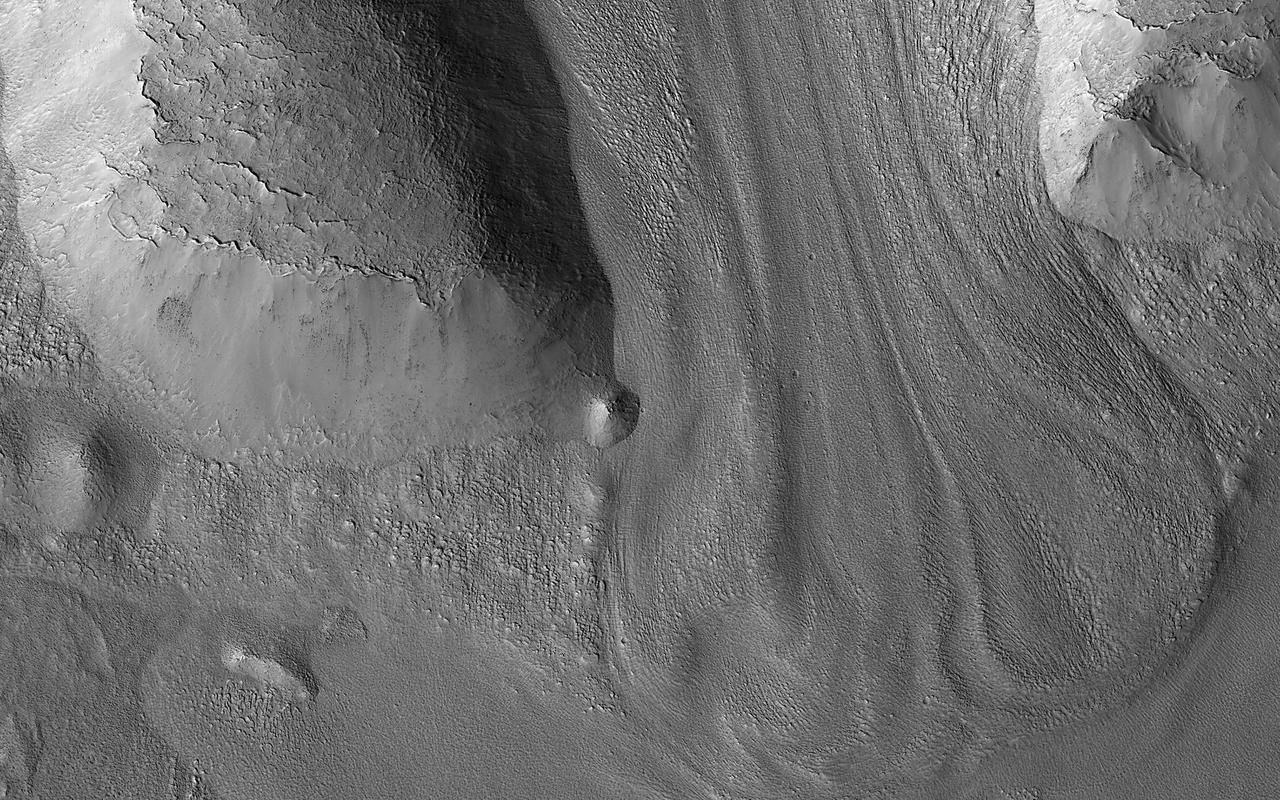
There are many locations in the mid-latitudes of Mars that look like material has flowed. This image shows an example flowing downhill between two ridges. Comparing these to what we see on the Earth and to other information we have about Mars leads scientists to believe that these are glaciers. Glacier-like features like this indicate that ice accumulated here in the past, which does not happen in today's climate. It's somewhat of a mystery why these features have flowed so much when they are so thin, the ice is so cold, and Martian gravity is so low. They probably move much more slowly than typical glaciers on Earth, but Mars has plenty of time on its hands so they end up looking very similar to the valley glaciers we see on our own planet. https://photojournal.jpl.nasa.gov/catalog/PIA25947
NASA Terra satellite passed over the Pine Island Glacier in Antarctica around Oct. 27, 2013, just days before iceberg B-31 broke completely free. B-31 is finally moving away from the coast, with open water between the iceberg and the glacier.

S119-E-006764 (20 March 2009) --- Japan Aerospace Exploration Agency astronaut Koichi Wakata is pictured on Discovery's middeck with the General Laboratory Active Cryogenic ISS Experiment Refrigerator (GLACIER). The astronauts changed out the International Space Station's glacier with a new one on March 20 to return urine, saliva, and blood samples from the Expedition 18 crew to Earth with Discovery's STS-119 astronauts. Wakata will be serving with both the current (Expedition 18) and the following (Expedition 19) crews aboard the station.
Satellite images from 2022 (Main image) and 1985 (Figure A) capture the retreat of Jakobshavn Isbrae, a glacier on Greenland's western coast, as icebergs broke off its edge over nearly four decades. In a recent study in Nature, researchers from NASA's Jet Propulsion Laboratory in Southern California calculated that Jakobshavn lost an estimated 97 billion tons (88 billion metric tons) of ice in the period between the two images. The earlier image was taken by the Thematic Mapper instrument on the Landsat 5 satellite on Sept. 5, 1985, while the later image was captured by the Operational Land Imager on the Landsat 8 satellite on Sept. 4, 2022. Of the 207 glaciers analyzed in the study, Jakobshavn lost the second most ice mass, trailing only Zachariae Isstrom, a glacier in northeast Greenland. The study took a comprehensive look at glacial retreat around the edges of the entire Greenland Ice Sheet from 1985 to 2022 and found that 179 glaciers retreated significantly since 1985, 27 held steady, and just one advanced slightly. The study found that overall the ice sheet shed about 1,140 billion tons (1,034 billion metric tons) of ice from 1985 to 2022, one-fifth more mass than previously estimated, as icebergs fell into the ocean at an accelerating rate. Most of the ice loss came from below sea level, in fjords on Greenland's periphery. Once occupied by ancient glacial ice, many of these deep coastal valleys have filled with seawater – meaning the ice that broke off made little net contribution to sea level. But the loss likely accelerated the movement of ice flowing down from higher elevations, which in turn added to sea level rise. It also added previously unaccounted-for fresh water to the North Atlantic Ocean, which could have impacts on global ocean currents. https://photojournal.jpl.nasa.gov/catalog/PIA26117
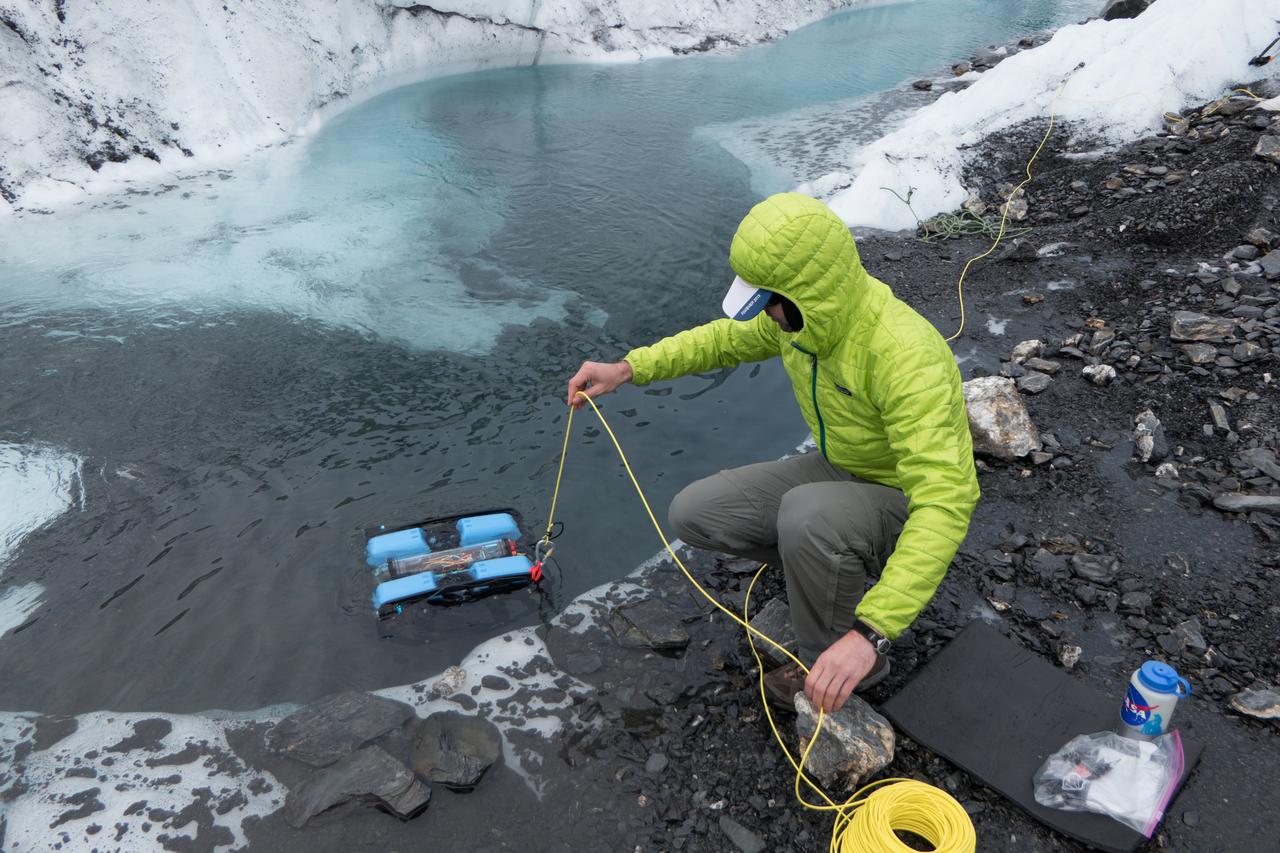
JPL engineer Andy Klesh lowers a robotic submersible into a moulin. Klesh and JPL's John Leichty used robots and probes to explore the Matanuska Glacier in Alaska this past July. Image Credit: NASA/JPL-Caltech

LISA SMITH, THE TRAINING TEAM LEAD IN MARSHALL'S MISSION OPERATIONS LAB, EXAMINES THE DRAWERS IN THE GLACIER MOCK-UP, A TRAINING VERSION OF A FREEZER ON THE INTERNATIONAL SPACE STATION INSTALLED IN THE MARSHALL CENTER'S LABORATORY TRAINING COMPLEX
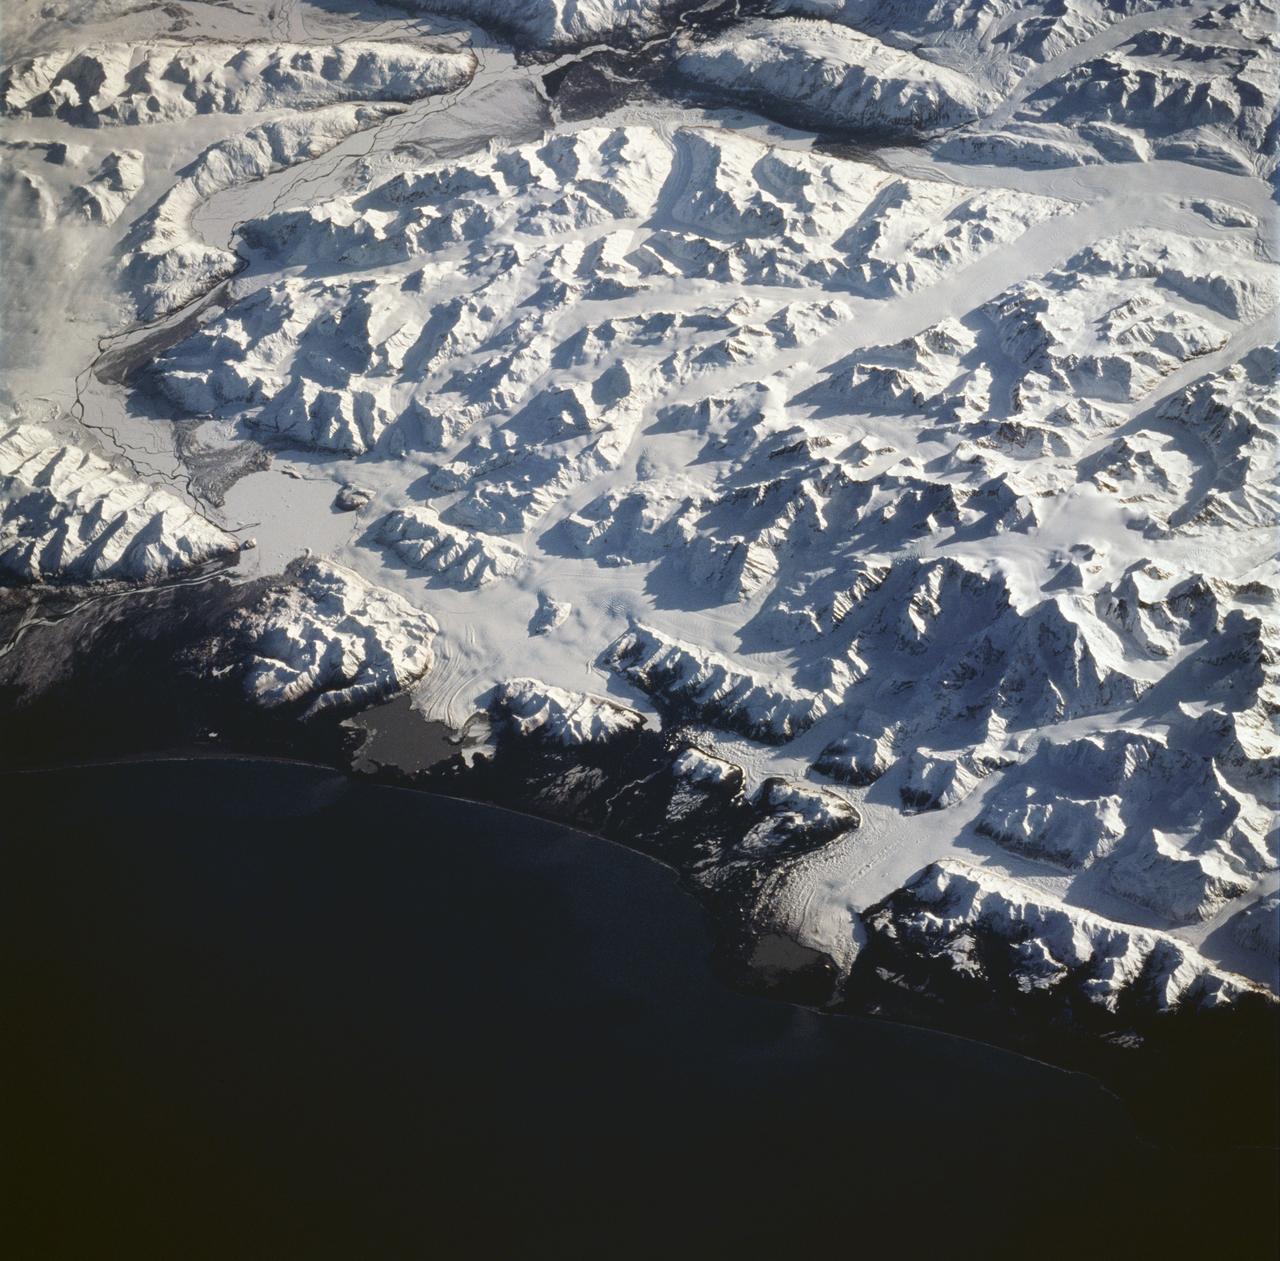
STS059-228-094 (9-20 April 1994) --- The spring thaw along the coast of the Gulf of Alaska has not touched the St. Elias Mountains, southeast of Yakutat Bay and Malaspina Glacier. A prominent glacier flows from Mt. Fairweather (15,300 feet) at right center, to form Cape Fairweather. Another glacier to the northwest almost reaches the sea; the valley of the Alsek River forms a broad, braided plan at upper left. The low sun elevation and oblique angle of this photograph provide a striking 3-dimensional appearance to the black-and-white landscape. SRL investigators will study microwave response to varying depths and conditions of ice and snow along this coast, in Spring and Summer. Hasselblad photograph.
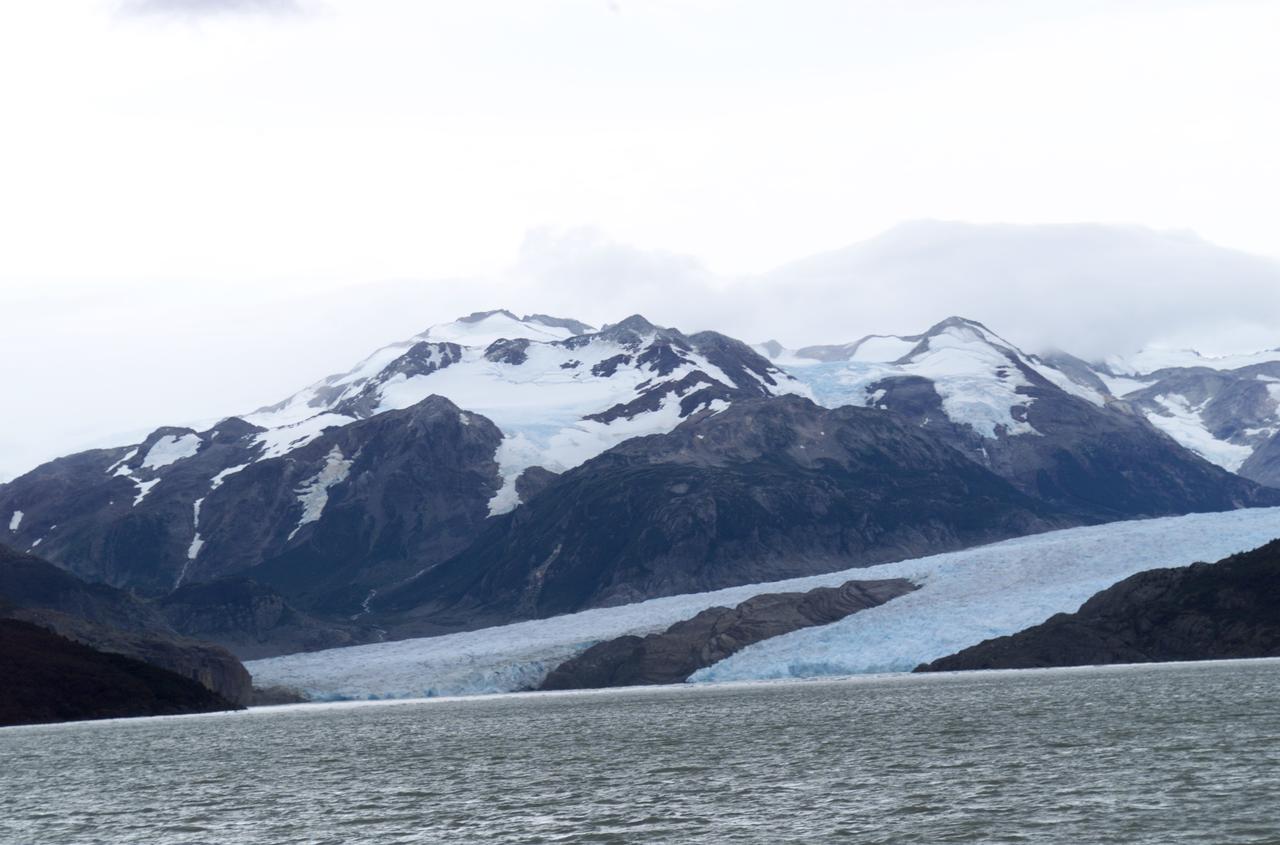
Glacier Grey view from Lago Grey (Grey Lake), photographed during NASA's AirSAR 2004 campaign in Chile. Land visible in this photo was covered by glacier just 6 years earlier. AirSAR 2004 is a three-week expedition in Central and South America by an international team of scientists that is using an all-weather imaging tool, called the Airborne Synthetic Aperture Radar (AirSAR), located onboard NASA's DC-8 airborne laboratory. Scientists from many parts of the world are combining ground research with NASA's AirSAR technology to improve and expand on the quality of research they are able to conduct. Founded in 1959, Torres del Paine National Park encompasses 450,000 acres in the Patagonia region of Chile. This region is being studied by NASA using a DC-8 equipped with an Airborne Synthetic Aperture Radar (AirSAR) developed by scientists from NASA’s Jet Propulsion Laboratory. This is a very sensitive region that is important to scientists because the temperature has been consistently rising causing a subsequent melting of the region’s glaciers. AirSAR will provide a baseline model and unprecedented mapping of the region. This data will make it possible to determine whether the warming trend is slowing, continuing or accelerating. AirSAR will also provide reliable information on ice shelf thickness to measure the contribution of the glaciers to sea level.
A close-up image of the crack spreading across the ice shelf of Pine Island Glacier shows the details of the boulder-like blocks of ice that fell into the rift when it split. For most of the 18-mile stretch of the crack that NASA’s DC-8 flew over on Oct. 26, 2011, it stretched about 240 feet wide, as roughly seen here. The deepest points ranged from about 165 to 190 feet, roughly equal to the top of the ice shelf down to sea level. Scientists expect the crack to propagate and the ice shelf to calve an iceberg of more than 300 square miles in the coming months. This image was captured by the Digital Mapping System (DMS) aboard the DC-8. Credit: NASA/DMS NASA's Operation IceBridge returns to a base camp of Punta Arenas, Chile for the third year of flights over Antarctica's changing sea ice, glaciers and ice sheets. NASA's DC-8, outfitted with seven remote-sensing instruments, and a Gulfstream 5 operated by the National Science Foundation and National Center for Atmospheric Research and outfitted with a high-altitude laser-ranging mapper, will fly from Chile over Antarctica in October and November. The mission is designed to record changes to Antarctica's ice sheets and give scientists insight into what is driving those changes. Follow the progress of the mission: Campaign News site: <a href="http://www.nasa.gov/mission_pages/icebridge/index.html" rel="nofollow">www.nasa.gov/mission_pages/icebridge/index.html</a> IceBridge blog: <a href="http://blogs.nasa.gov/cm/newui/blog/viewpostlist.jsp?blogname=icebridge" rel="nofollow">blogs.nasa.gov/cm/newui/blog/viewpostlist.jsp?blogname=ic...</a> Twitter: @nasa_ice <b><a href="http://www.nasa.gov/audience/formedia/features/MP_Photo_Guidelines.html" rel="nofollow">NASA image use policy.</a></b> <b><a href="http://www.nasa.gov/centers/goddard/home/index.html" rel="nofollow">NASA Goddard Space Flight Center</a></b> enables NASA’s mission through four scientific endeavors: Earth Science, Heliophysics, Solar System Exploration, and Astrophysics. Goddard plays a leading role in NASA’s accomplishments by contributing compelling scientific knowledge to advance the Agency’s mission. <b>Follow us on <a href="http://twitter.com/NASA_GoddardPix" rel="nofollow">Twitter</a></b> <b>Like us on <a href="http://www.facebook.com/pages/Greenbelt-MD/NASA-Goddard/395013845897?ref=tsd" rel="nofollow">Facebook</a></b> <b>Find us on <a href="http://instagrid.me/nasagoddard/?vm=grid" rel="nofollow">Instagram</a></b>
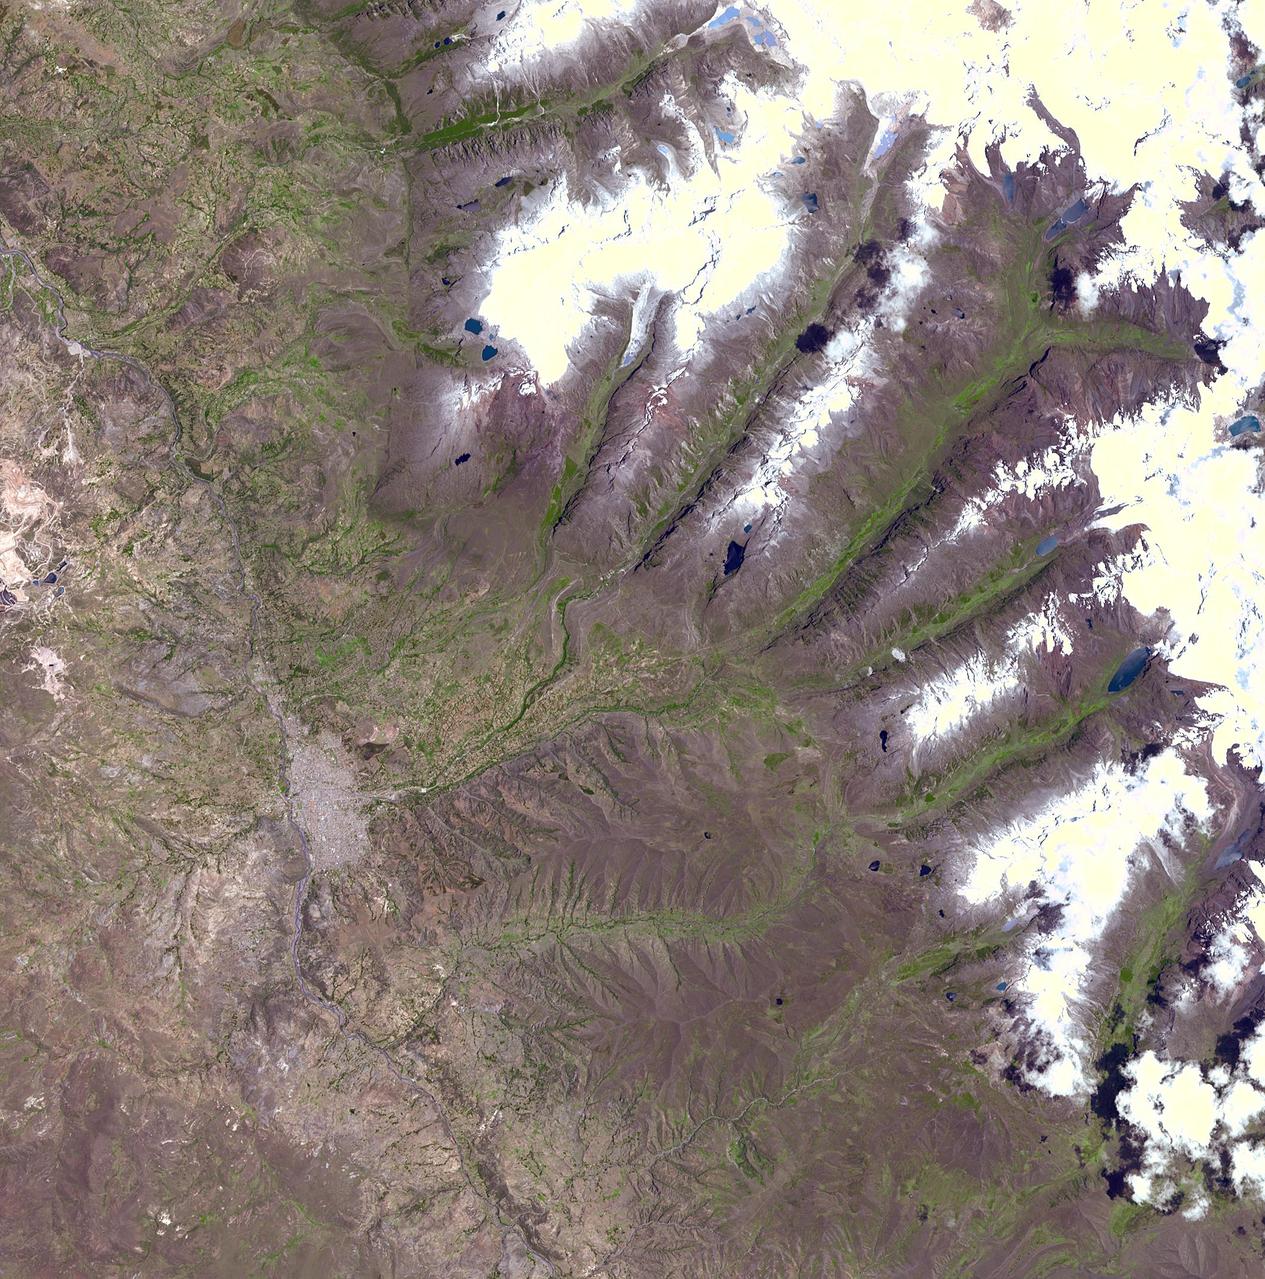
An Earth-monitoring instrument aboard NASA's Terra satellite is keeping a close eye on a potential glacial disaster in the making in Peru's spectacular, snow-capped Cordillera Blanca (White Mountains), the highest range of the Peruvian Andes. Data from NASA's Advanced Spaceborne Thermal Emission and Reflection Radiometer (Aster) is assisting Peruvian government officials and geologists in monitoring a glacier that feeds Lake Palcacocha, located high above the city of Huaraz, 270 kilometers (168 miles) north of Lima. An ominous crack has developed in the glacier. Should the large glacier chunk break off and fall into the lake, the ensuing flood could hurtle down the Cojup Valley into the Rio Santa Valley below, reaching Huaraz, population 60,000, in less than 15 minutes. "Glacial natural hazards like the one in Huaraz are an increasing threat to people in many parts of the world," said Dr. Michael Abrams, associate Aster team leader at NASA's Jet Propulsion Laboratory, Pasadena, Calif. "Remote sensing instruments like Aster can serve a vital role in mountain hazard management and disaster mapping by providing rapid access to data, even in regions not easily accessible by humans. Aster's unique vantage point from space gives scientists another tool with which to see early signs of potential glacial flood-burst events and to monitor changes in glacial behavior over time. In Huaraz, Peruvian authorities and scientists will incorporate Aster data along with data from ground-based monitoring techniques to better assess current conditions and take steps necessary to reduce risks to human lives and property." Comparison images of the area are available at: http://asterweb.jpl.nasa.gov . Huaraz can be seen in the images' left-center, with Lake Palcacocha in the images' upper right corners at the head of a valley, below the snow and glacier cap. The left image was acquired on November 5, 2001; the right on April 8, 2003. Glacial flood-bursts, known by Peruvians as "aluviones," occur periodically when water is released abruptly from a previously ice-dammed lake alongside, within, or above a glacier. The release can be caused by various triggering events. These flood-bursts typically arrive with little or no warning, carrying liquid mud, large rock boulders and blocks of ice. The Rio Santa Valley is no stranger to such disasters. Since 1702, floods caused by glaciological conditions have repeatedly caused death and destruction in the region. One particularly devastating event in 1941 destroyed approximately one-third of Huaraz, killing an estimated 5,000 to 7,000 people. Since then, the Peruvian government has emphasized control of the water level in Lake Palcacocha and other lakes in the region that pose similar threats. The efforts appear to have worked; since 1972, no destructive floods resulting from the breakout of glacial lakes have occurred. Nevertheless, officials are still monitoring the current situation closely. http://photojournal.jpl.nasa.gov/catalog/PIA03899

ISS020-E-010016 (15 June 2009) --- Japan Aerospace Exploration Agency (JAXA) astronaut Koichi Wakata, Expedition 20 flight engineer, works with the General Laboratory Active Cryogenic ISS Experiment Refrigerator (GLACIER) in the Destiny laboratory of the International Space Station.

ISS024-E-012995 (1 Sept. 2010) --- NASA astronaut Tracy Caldwell Dyson, Expedition 24 flight engineer, works with the General Laboratory Active Cryogenic ISS Experiment Refrigerator (GLACIER) in the Destiny laboratory of the International Space Station.

ISS020-E-010017 (15 June 2009) --- Japan Aerospace Exploration Agency (JAXA) astronaut Koichi Wakata, Expedition 20 flight engineer, works with the General Laboratory Active Cryogenic ISS Experiment Refrigerator (GLACIER) in the Destiny laboratory of the International Space Station.
The backlighting highlights the intricate flow lines on the glaciers. The flow front of the ice is moving into the informally named Sputnik Planum. The origin of the ridges and pits on the right side of the image remains uncertain. This image is 390 miles (630 kilometers) across. http://photojournal.jpl.nasa.gov/catalog/PIA19943
Satellite images from 2022 (Main image) and 1999 (Figure A) capture the retreat of Zachariae Isstrom, a glacier in northeast Greenland, as icebergs broke off its edge over the course of 23 years. In a recent study in Nature, researchers from NASA's Jet Propulsion Laboratory in Southern California calculated that Zachariae lost an estimated 176 billion tons (160 billion metric tons) of ice in the period between 1985 and 2022. That was the greatest mass lost for the period of any of the 207 glaciers analyzed in the paper. The earlier image was taken by the Enhanced Thematic Mapper Plus on the Landsat 7 satellite on Aug. 5, 1999, while the later image was captured by the Operational Land Imager on the Landsat 8 satellite on Aug. 22, 2022. The study took a comprehensive look at glacial retreat around the edges of the entire Greenland Ice Sheet from 1985 to 2022 and found that 179 glaciers retreated significantly since 1985, 27 held steady, and just one advanced slightly. The study found that overall the ice sheet shed about 1,140 billion tons (1,034 billion metric tons) of ice from 1985 to 2022, one-fifth more mass than previously estimated, as icebergs fell into the ocean at an accelerating rate. Most of the ice loss came from below sea level, in fjords on Greenland's periphery. Once occupied by ancient glacial ice, many of these deep coastal valleys have filled with seawater – meaning the ice that broke off made little net contribution to sea level. But the loss likely accelerated the movement of ice flowing down from higher elevations, which in turn added to sea level rise. It also added previously unaccounted-for fresh water to the North Atlantic Ocean, which could have impacts on global ocean currents. https://photojournal.jpl.nasa.gov/catalog/PIA26118
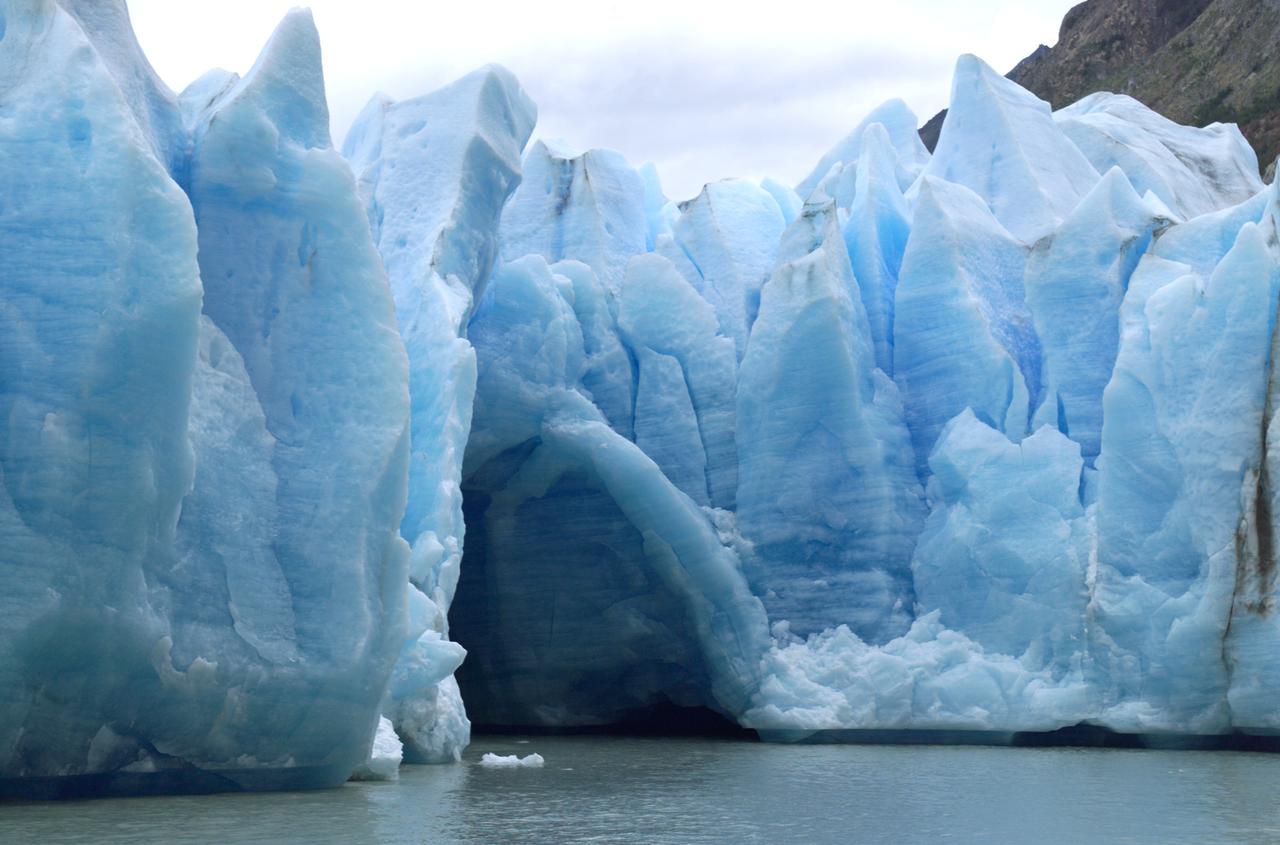
A cave in Glacier Grey in Torres del Paine National Park, seen during NASA's AirSAR 2004 campaign in Chile. AirSAR 2004 is a three-week expedition in Central and South America by an international team of scientists that is using an all-weather imaging tool, called the Airborne Synthetic Aperture Radar (AirSAR), located onboard NASA's DC-8 airborne laboratory. Scientists from many parts of the world are combining ground research with NASA's AirSAR technology to improve and expand on the quality of research they are able to conduct. Founded in 1959, Torres del Paine National Park encompasses 450,000 acres in the Patagonia region of Chile. This region is being studied by NASA using a DC-8 equipped with an Airborne Synthetic Aperture Radar (AirSAR) developed by scientists from NASA’s Jet Propulsion Laboratory. This is a very sensitive region that is important to scientists because the temperature has been consistently rising causing a subsequent melting of the region’s glaciers. AirSAR will provide a baseline model and unprecedented mapping of the region. This data will make it possible to determine whether the warming trend is slowing, continuing or accelerating. AirSAR will also provide reliable information on ice shelf thickness to measure the contribution of the glaciers to sea level.
This ASTER image was acquired on December 12, 2000, and covers an area of 38 x 48 km. Pine Island Glacier has undergone a steady loss of elevation with retreat of the grounding line in recent decades. Now, space imagery has revealed a wide new crack that some scientists think will soon result in a calving event. Glaciologist Robert Bindschadler of NASA's Goddard Space Flight Center predicts this crack will result in the calving of a major iceberg, probably in less than 18 months. Discovery of the crack was possible due to multi-year image archives and high resolution imagery. This image is located at 74.1 degrees south latitude and 105.1 degrees west longitude. http://photojournal.jpl.nasa.gov/catalog/PIA11095
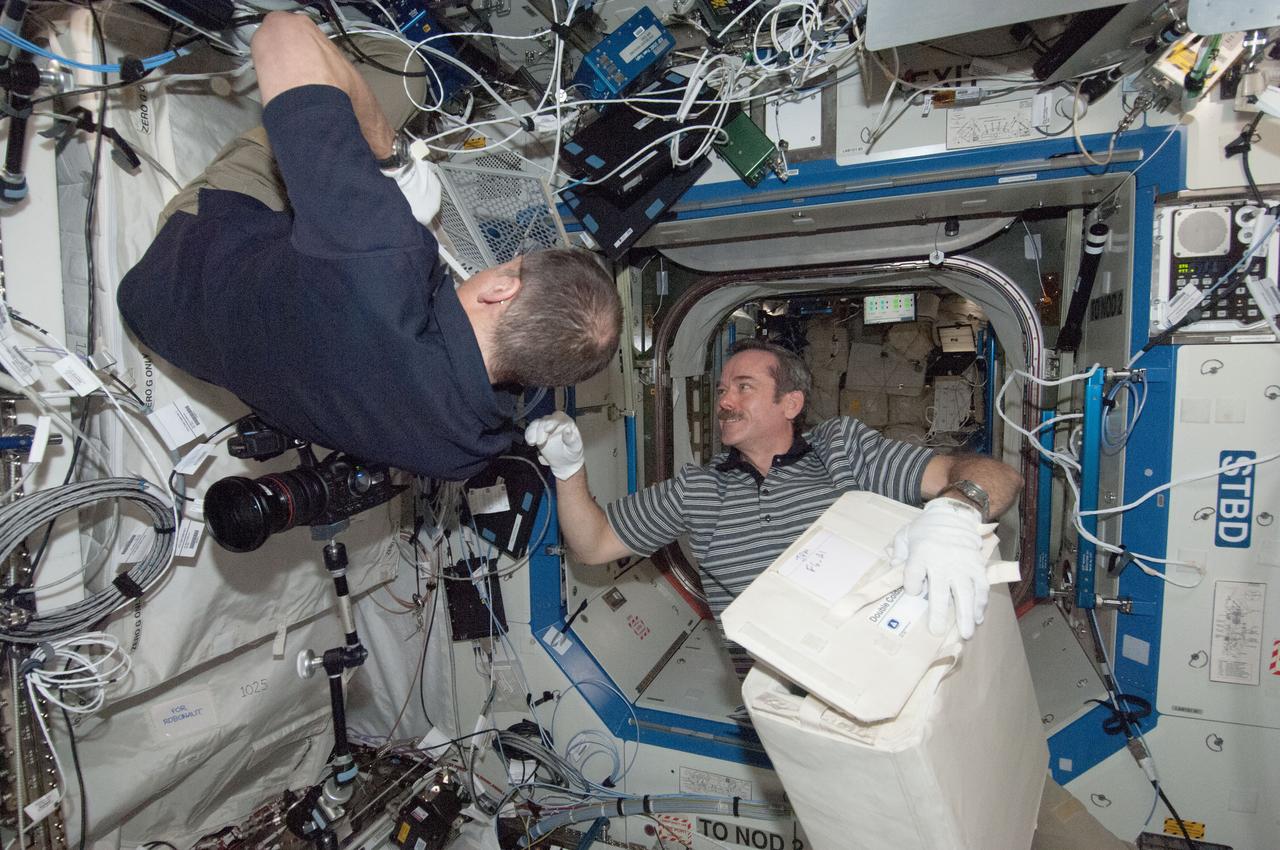
ISS034-E-067263 (12 March 2013) --- Canadian astronaut Chris Hadfield, right, assists fellow Expedition 34 flight engineer and NASA astronaut Tom Marshburn during Minus Eighty-Degree Laboratory Freezer for International Space Station (MELFI)operations. The two are doing transfers of samples connected to the General Laboratory Active Cryogenic ISS Experiment Refrigerator or GLACIER in the U.S. lab Destiny.
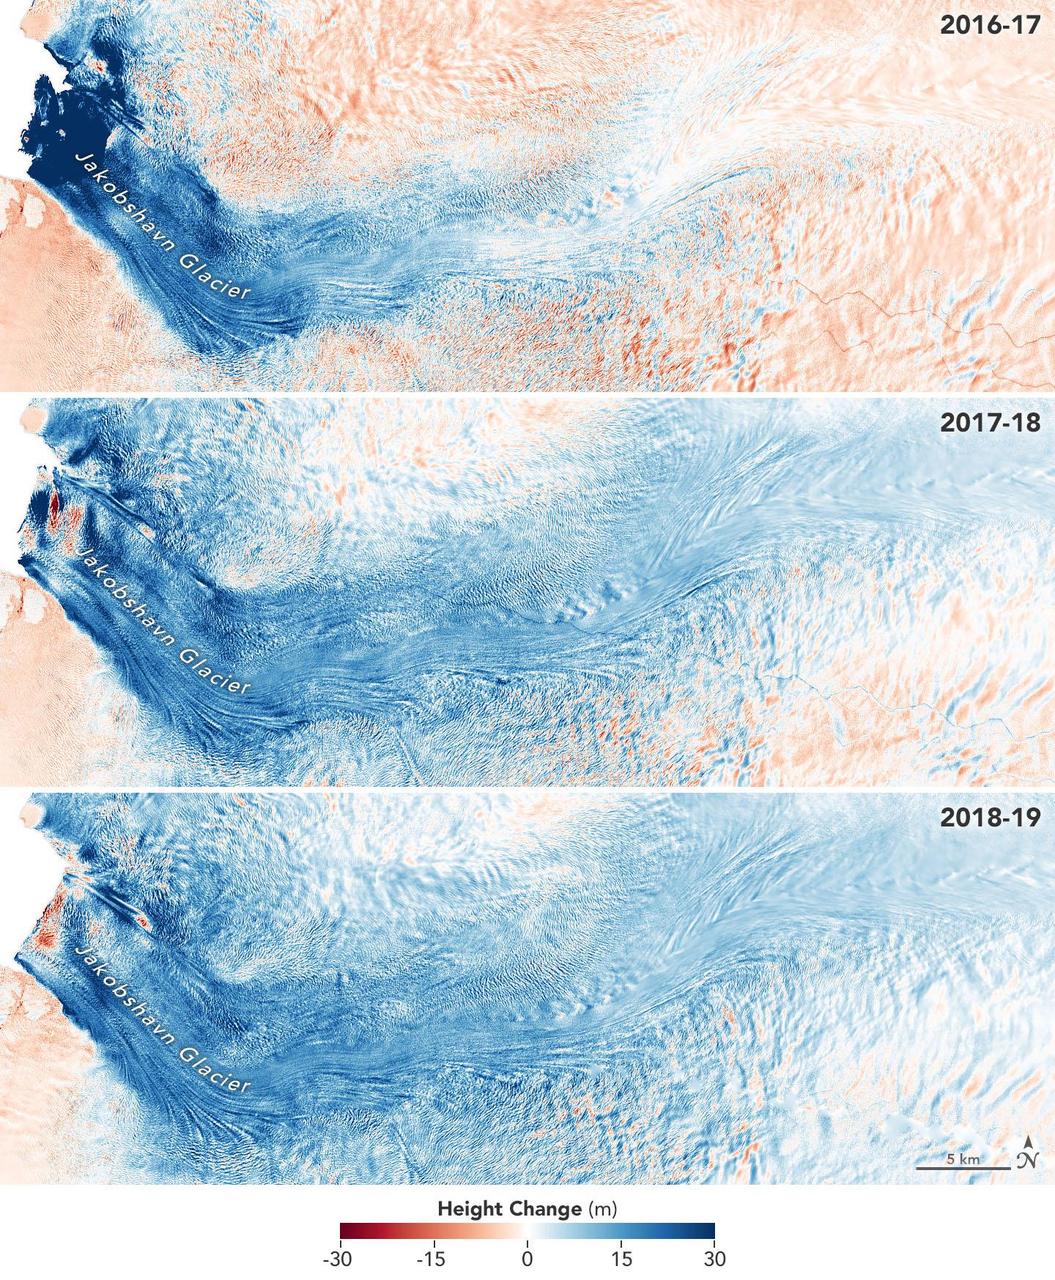
These images show the mass Greenland's Jakobshavn Glacier has gained from 2016-17, 2017-18 and 2018-19. Areas with the most growth — about 33 yards (30 meters) — are shown in dark blue. Red areas represent thinning. The images were produced using GLISTIN-A radar data as part of NASA's Ocean's Melting Greenland (OMG) mission. https://photojournal.jpl.nasa.gov/catalog/PIA23147
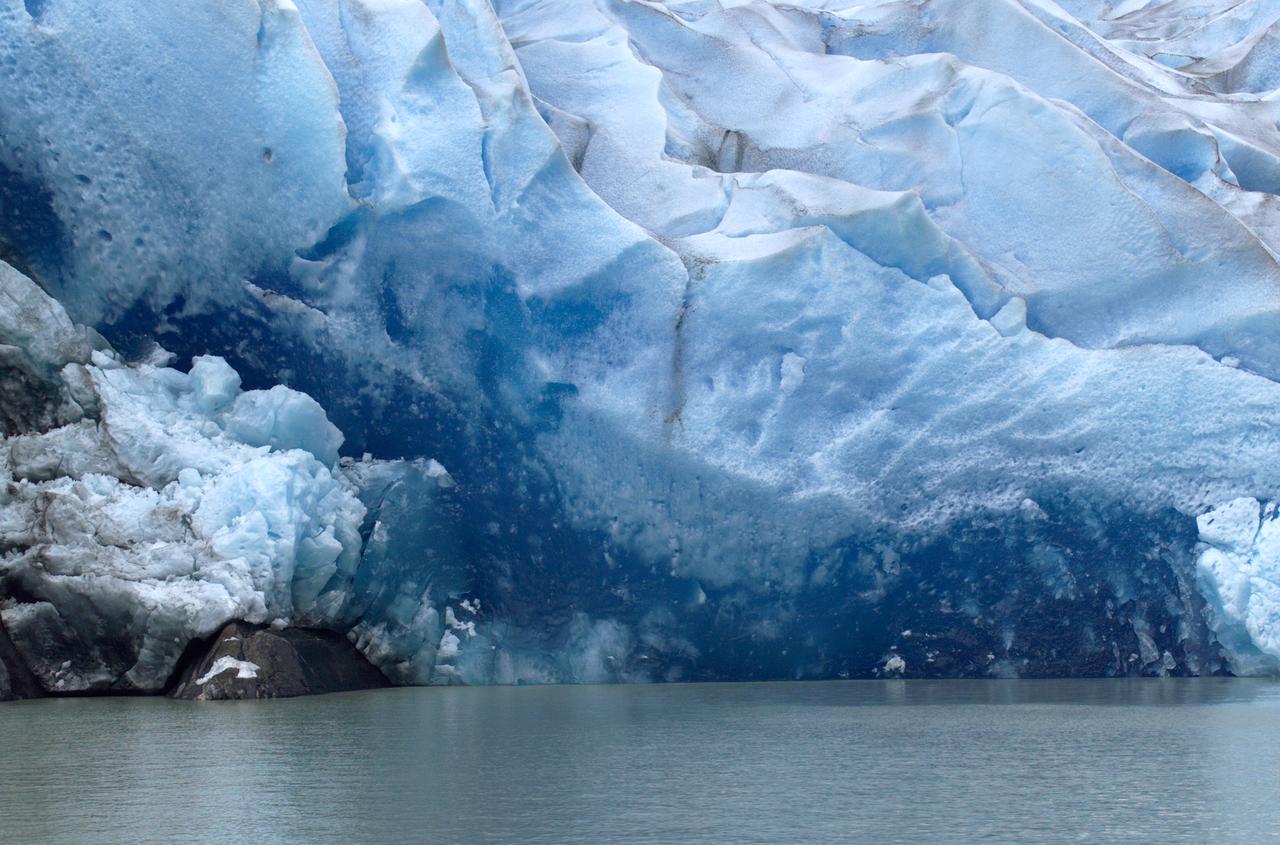
Close-up view of Grey Glacier from Lago Grey (Grey Lake), taken during NASA's AirSAR 2004 campaign in Chile. AirSAR 2004 is a three-week expedition in Central and South America by an international team of scientists that is using an all-weather imaging tool, called the Airborne Synthetic Aperture Radar (AirSAR), located onboard NASA's DC-8 airborne laboratory. Scientists from many parts of the world are combining ground research with NASA's AirSAR technology to improve and expand on the quality of research they are able to conduct. Founded in 1959, Torres del Paine National Park encompasses 450,000 acres in the Patagonia region of Chile. This region is being studied by NASA using a DC-8 equipped with an Airborne Synthetic Aperture Radar (AirSAR) developed by scientists from NASA’s Jet Propulsion Laboratory. This is a very sensitive region that is important to scientists because the temperature has been consistently rising causing a subsequent melting of the region’s glaciers. AirSAR will provide a baseline model and unprecedented mapping of the region. This data will make it possible to determine whether the warming trend is slowing, continuing or accelerating. AirSAR will also provide reliable information on ice shelf thickness to measure the contribution of the glaciers to sea level.
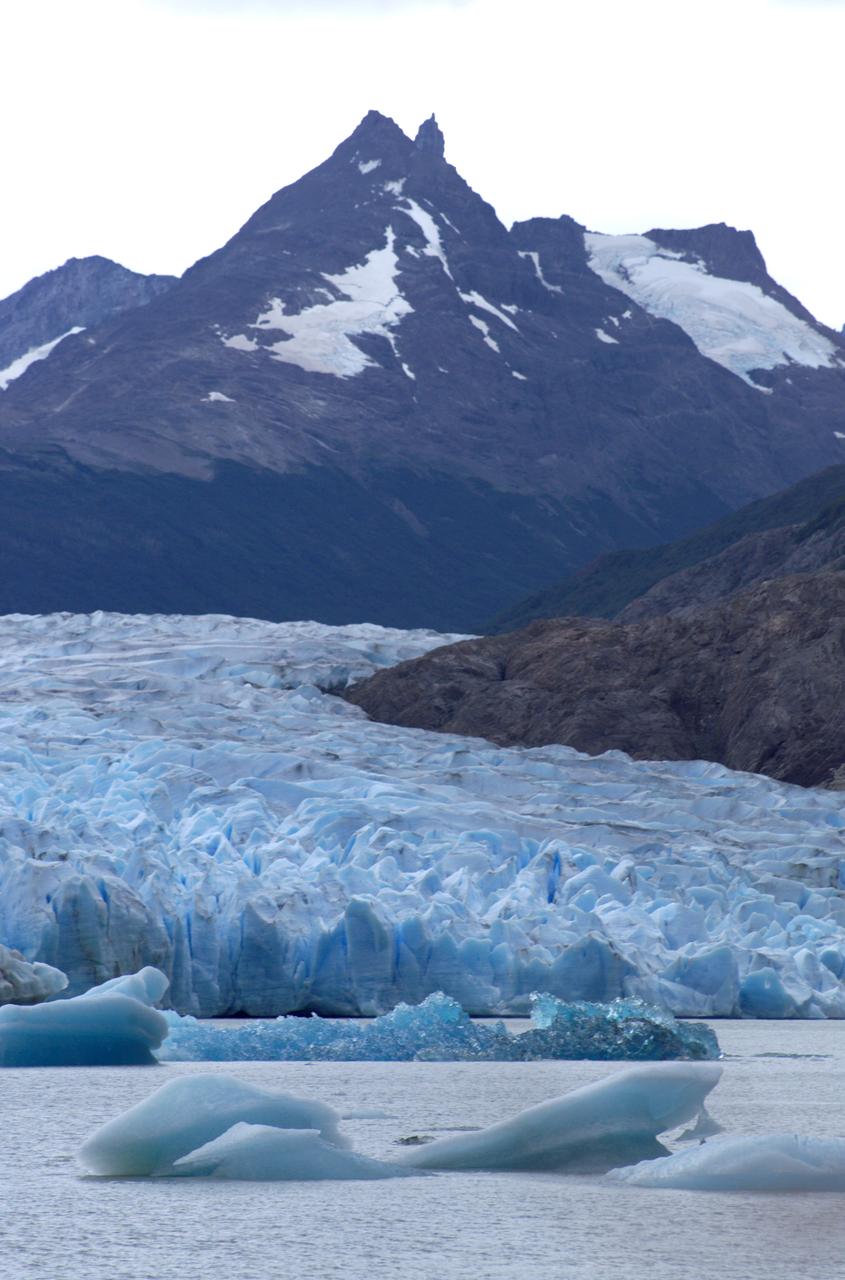
Glacier Grey in front of the Cuernos del Paine mountains, photographed from Lago Grey (Grey Lake) during NASA's AirSAR 2004 campaign in Chile. AirSAR 2004 is a three-week expedition in Central and South America by an international team of scientists that is using an all-weather imaging tool, called the Airborne Synthetic Aperture Radar (AirSAR), located onboard NASA's DC-8 airborne laboratory. Scientists from many parts of the world are combining ground research with NASA's AirSAR technology to improve and expand on the quality of research they are able to conduct. Founded in 1959, Torres del Paine National Park encompasses 450,000 acres in the Patagonia region of Chile. This region is being studied by NASA using a DC-8 equipped with an Airborne Synthetic Aperture Radar (AirSAR) developed by scientists from NASA’s Jet Propulsion Laboratory. This is a very sensitive region that is important to scientists because the temperature has been consistently rising causing a subsequent melting of the region’s glaciers. AirSAR will provide a baseline model and unprecedented mapping of the region. This data will make it possible to determine whether the warming trend is slowing, continuing or accelerating. AirSAR will also provide reliable information on ice shelf thickness to measure the contribution of the glaciers to sea level.
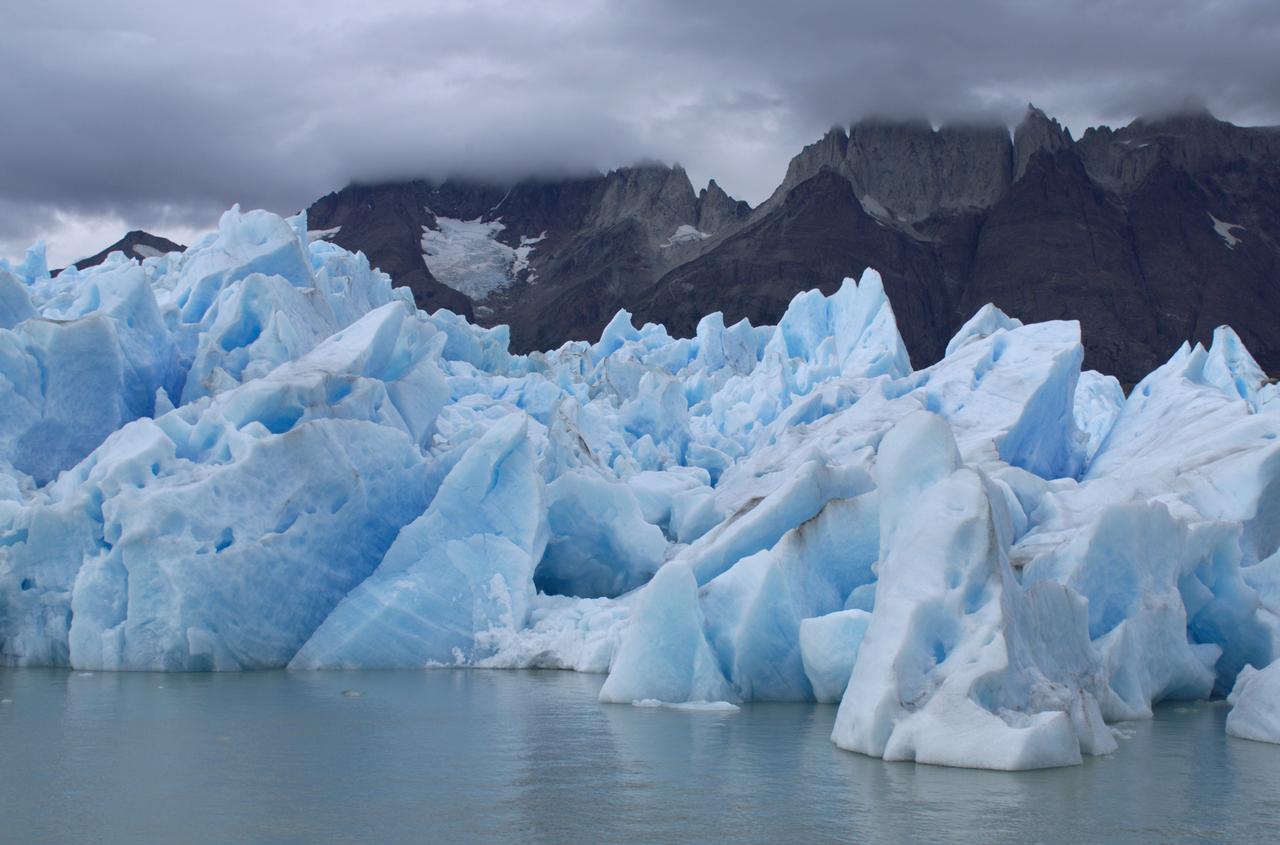
View of Glacier Grey from Lago Grey (Grey Lake), with the Cuernos del Paine mountains in the background, seen during NASA's AirSAR 2004 campaign in Chile. AirSAR 2004 is a three-week expedition in Central and South America by an international team of scientists that is using an all-weather imaging tool, called the Airborne Synthetic Aperture Radar (AirSAR), located onboard NASA's DC-8 airborne laboratory. Scientists from many parts of the world are combining ground research with NASA's AirSAR technology to improve and expand on the quality of research they are able to conduct. Founded in 1959, Torres del Paine National Park encompasses 450,000 acres in the Patagonia region of Chile. This region is being studied by NASA using a DC-8 equipped with an Airborne Synthetic Aperture Radar (AirSAR) developed by scientists from NASA’s Jet Propulsion Laboratory. This is a very sensitive region that is important to scientists because the temperature has been consistently rising causing a subsequent melting of the region’s glaciers. AirSAR will provide a baseline model and unprecedented mapping of the region. This data will make it possible to determine whether the warming trend is slowing, continuing or accelerating. AirSAR will also provide reliable information on ice shelf thickness to measure the contribution of the glaciers to sea level.
ISS020-E-010018 (15 June 2009) --- Canadian Space Agency astronaut Robert Thirsk and Japan Aerospace Exploration Agency (JAXA) astronaut Koichi Wakata (partially out of frame at right), both Expedition 20 flight engineers, work with the General Laboratory Active Cryogenic ISS Experiment Refrigerator (GLACIER) in the Destiny laboratory of the International Space Station.
The College Fjord with its glaciers was imaged by ASTER on June 24, 2000. This image covers an area 20 kilometers (13 miles) wide and 24 kilometers (15 miles) long in three bands of the reflected visible and infrared wavelength region. College Fjord is located in Prince Williams Sound, east of Seward, Alaska. Vegetation is in red, and snow and ice are white and blue. Ice bergs calved off of the glaciers can be seen as white dots in the water. At the head of the fjord, Harvard Glacier (left) is one of the few advancing glaciers in the area; dark streaks on the glacier are medial moraines: rock and dirt that indicate the incorporated margins of merging glaciers. Yale Glacier to the right is retreating, exposing (now vegetated) bedrock where once there was ice. On the west edge of the fjord, several small glaciers enter the water. This fjord is a favorite stop for cruise ships plying Alaska's inland passage. This image is located at 61.2 degrees north latitude and 147.7 degrees west longitude. http://photojournal.jpl.nasa.gov/catalog/PIA02664

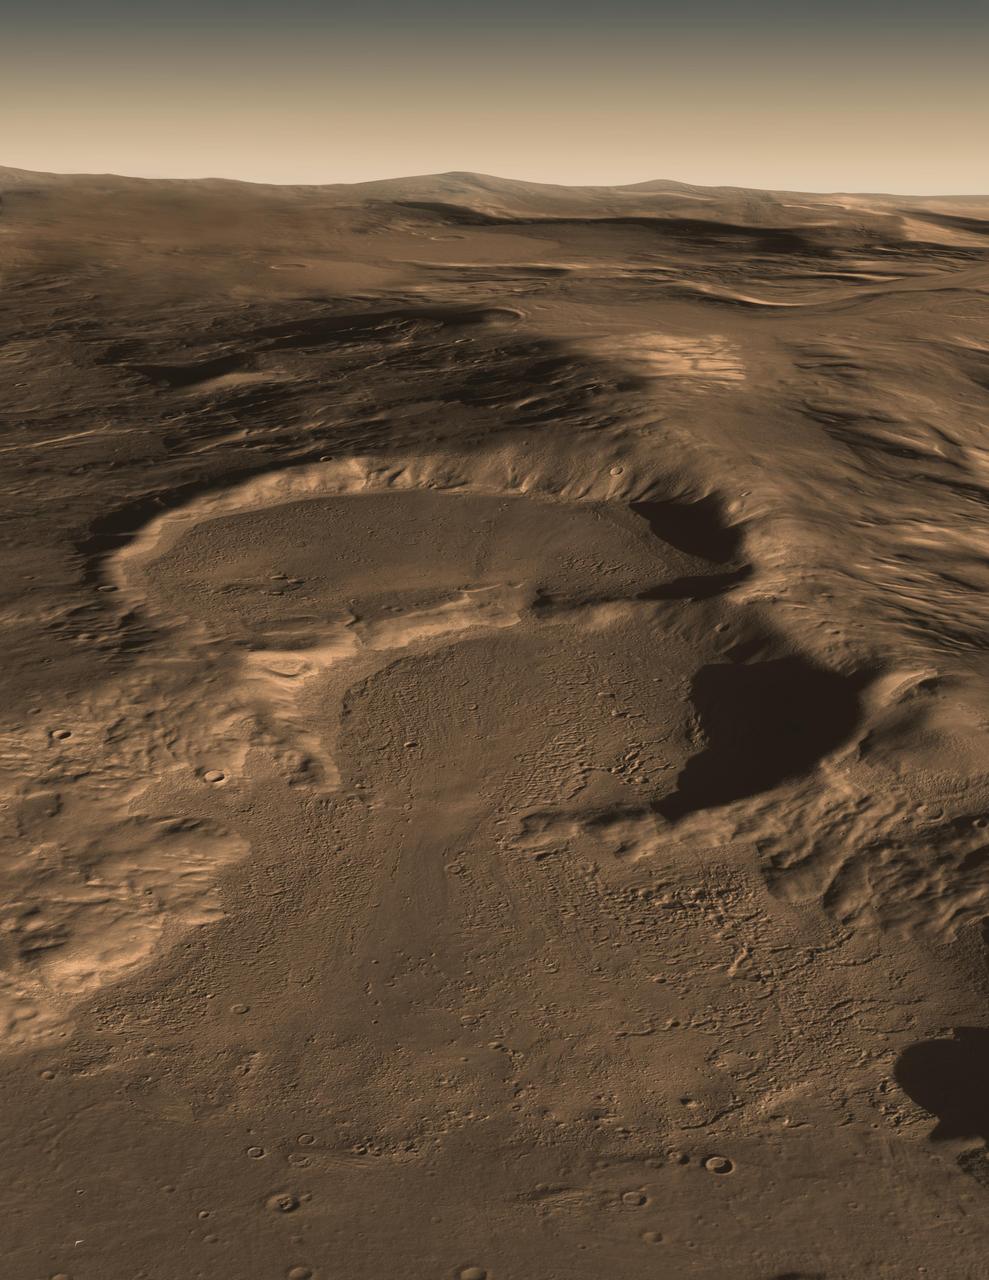
These U-shaped ridges along this crater's interior wall provide clues to an ice-rich past. The curved, scalloped ridges, called moraines, are made up of rocks that the glacier collected as it moved downslope. Even after the ice disappears, the glacial moraines remain, marking the furthest extent (or end) of the glacier. The parallel linear ridges on the wall may mark past levels of the glacier. Although glaciers move slowly, ice is a very powerful way to modify the surface of a planet. https://photojournal.jpl.nasa.gov/catalog/PIA24918
This computer graphic image shows three craters in the eastern Hellas region of Mars containing concealed glaciers detected by radar.
On March 31, the P-3 departed Thule, Greenland. IceBridge teams flew a science transit flight to Kangerlussaq, Greenland, where missions will be based for the next several weeks before returning to Thule. Along the route, instruments surveyed several targets of opportunity including two ground tracks of the Ice, Cloud and land Elevation Satellite (ICESat) and several glaciers (Rink, Kangerdlugssuaq, Jakobshavn and Russell), turning up great data and spectacular views. March 29 was another perfect day for a land ice flight. The P-3 flew between deep canyons and over glaciers along the northwest coast of Greenland. But before the start of land ice flights, IceBridge reached a key milestone over sea ice. On March 28, IceBridge flew its eighth sea ice flight marking the completion of all high- and medium-priority sea ice missions planned from Thule. Among the sea ice missions was a science transit back from Fairbanks to Thule on March 25, during which the P-3 surveyed in complete darkness. Researchers watched the scanning pattern of the green lasers on the sea ice below and the beautiful Aurora Borealis above. To learn more about Ice Bridge go to: <a href="http://www.nasa.gov/mission_pages/icebridge/news/spr11/index.html" rel="nofollow">www.nasa.gov/mission_pages/icebridge/news/spr11/index.html</a> <b><a href="http://www.nasa.gov/centers/goddard/home/index.html" rel="nofollow">NASA Goddard Space Flight Center</a></b> enables NASA’s mission through four scientific endeavors: Earth Science, Heliophysics, Solar System Exploration, and Astrophysics. Goddard plays a leading role in NASA’s accomplishments by contributing compelling scientific knowledge to advance the Agency’s mission. <b>Follow us on <a href="http://twitter.com/NASA_GoddardPix" rel="nofollow">Twitter</a></b> <b>Join us on <a href="http://www.facebook.com/pages/Greenbelt-MD/NASA-Goddard/395013845897?ref=tsd" rel="nofollow">Facebook</a></b>
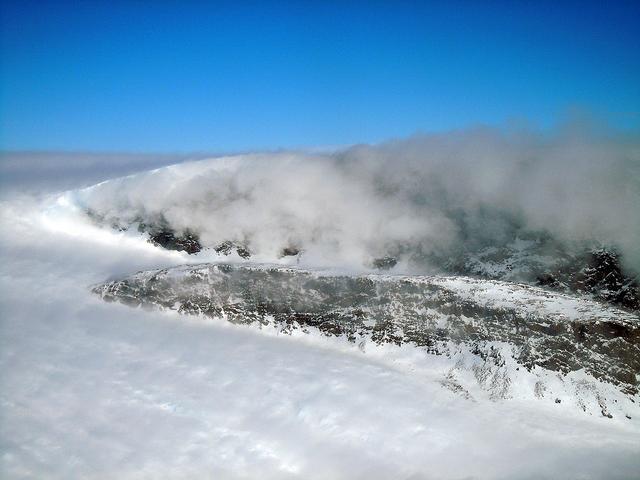
On April 11, 2011, IceBridge finally got the clear weather necessary to fly over glaciers in southeast Greenland, but with clear skies came winds of up to 70 knots. What looks like clouds is actually wind-blown snow. The data could help scientists to evaluate the impact of wind-blown snow on satellite-based laser altimetry measurements. Operation IceBridge, now in its third year, makes annual campaigns in the Arctic and Antarctic where science flights monitor glaciers, ice sheets and sea ice. Credit: NASA/GSFC/Michael Studinger To learn more about Ice Bridge go to: <a href="http://www.nasa.gov/mission_pages/icebridge/news/spr11/index.html" rel="nofollow">www.nasa.gov/mission_pages/icebridge/news/spr11/index.html</a> <b><a href="http://www.nasa.gov/centers/goddard/home/index.html" rel="nofollow">NASA Goddard Space Flight Center</a></b> enables NASA’s mission through four scientific endeavors: Earth Science, Heliophysics, Solar System Exploration, and Astrophysics. Goddard plays a leading role in NASA’s accomplishments by contributing compelling scientific knowledge to advance the Agency’s mission. <b>Follow us on <a href="http://twitter.com/NASA_GoddardPix" rel="nofollow">Twitter</a></b> <b>Join us on <a href="http://www.facebook.com/pages/Greenbelt-MD/NASA-Goddard/395013845897?ref=tsd" rel="nofollow">Facebook</a></b>
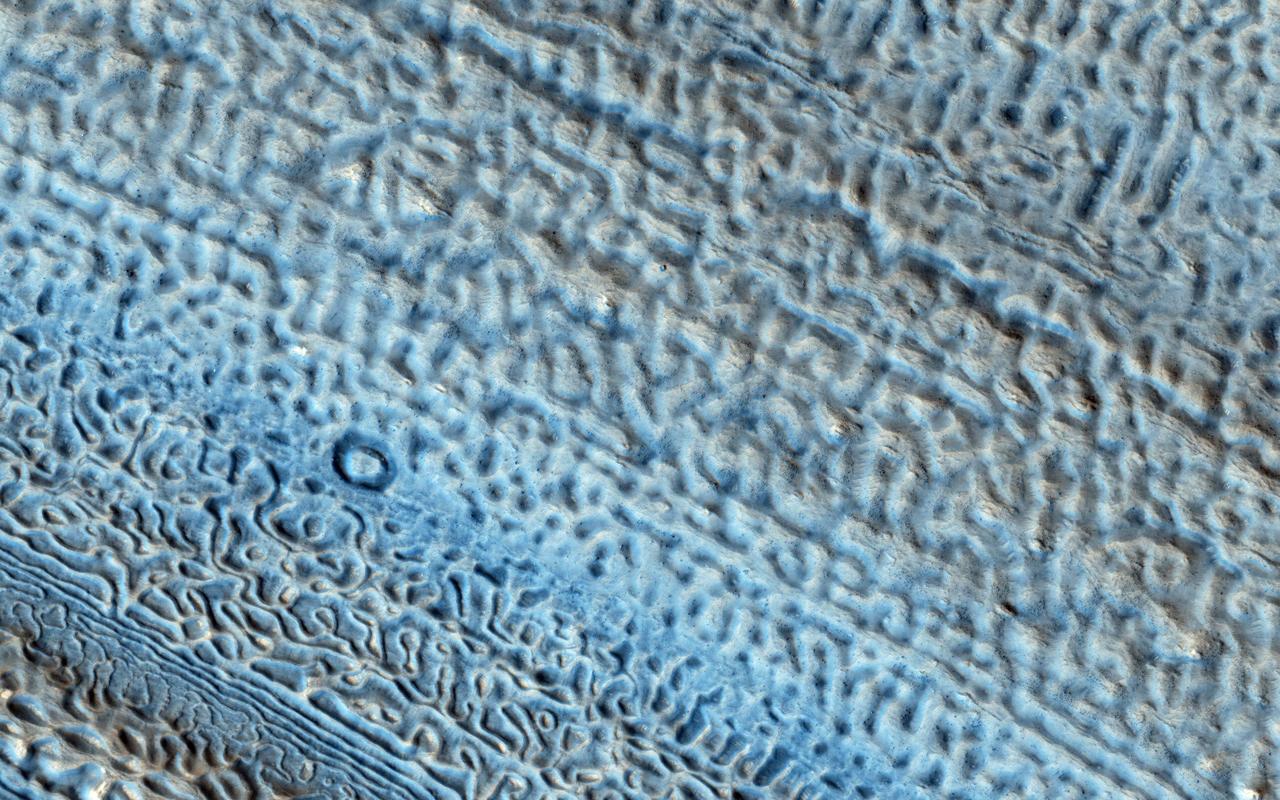
The rotational axis of Mars is currently tilted by about 25 degrees, very similar to that of the Earth (at 23.4 degrees). However, while Earth's axial tilt (also known as "obliquity") tends to change very slightly over time (almost 3 degrees in 40,000 year-cycles), the obliquity of Mars is much more chaotic and varies widely from 0 to almost 60 degrees! The fact that it is currently similar to that of the Earth is merely a coincidence. Currently, water-ice is stable on the Martian surface only in the polar regions. However, during times of "high obliquity," that stability shifts towards the equatorial regions. We see evidence for recent periods of high obliquity on Mars in the form of features common in the mid-latitude regions, which planetary scientists call "viscous flow features," "lobate debris aprons," or "lineated valley fills." These are all scientifically conservative ways of describing features on Mars that resemble mountain glaciers on Earth. We now know from radar observations, particularly using the SHARAD instrument on board the Mars Reconnaissance Orbiter, that these features are really composed of mixtures of pure ice and dust, and as a result, many scientists have started using the term "glacier-like forms" (GLF) to describe some of them. The main reason that these feature are still present for us to observe nowadays-despite the inhospitable conditions for water ice in these latitudes-is that these "glaciers" are covered by thin layers of dust, which protect them from the atmosphere of Mars and prevents, or significantly slows down, the loss of ice through sublimation to the atmosphere. However, if we were to take a look at this image of a "lobate debris apron," we will see that some areas show numerous depressions, which suggests that these areas have lost some of the ice creating these "deflation features." In addition, if we zoom in on one of these depressions, we will see surface polygonal patterns, which are common in cold regions on Earth (such as Alaska, northern Canada, and Siberia) and are indicators of shallow sub-surface water-ice. http://photojournal.jpl.nasa.gov/catalog/PIA21065
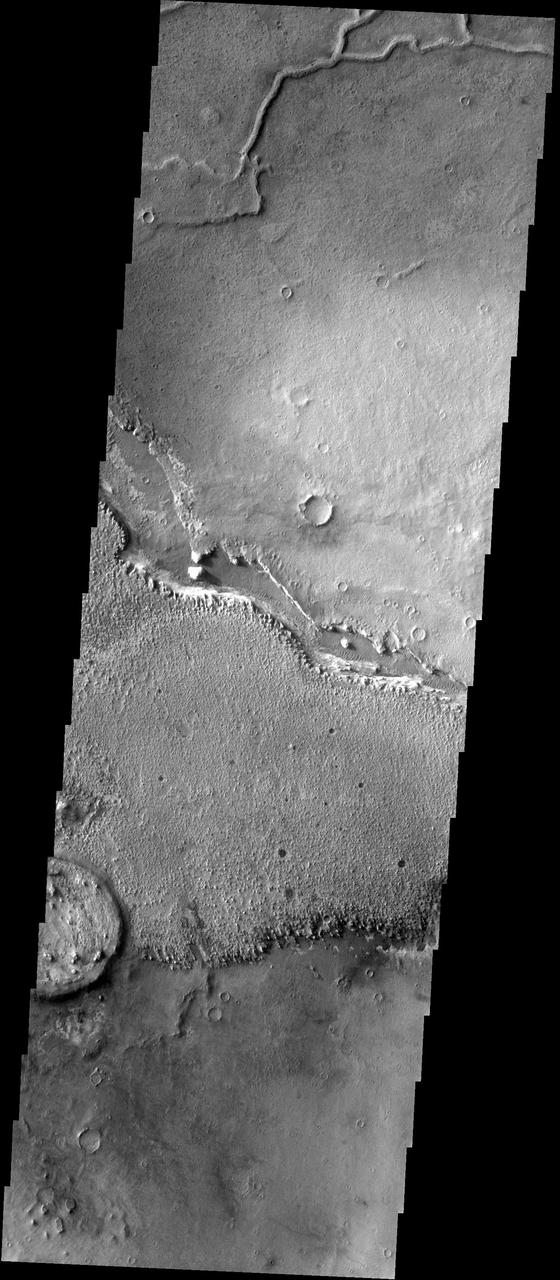
This type of feature is termed an inverted channel. One theory of how these features form is that rocky debris accumulates in channels of flowing water beneath glaciers
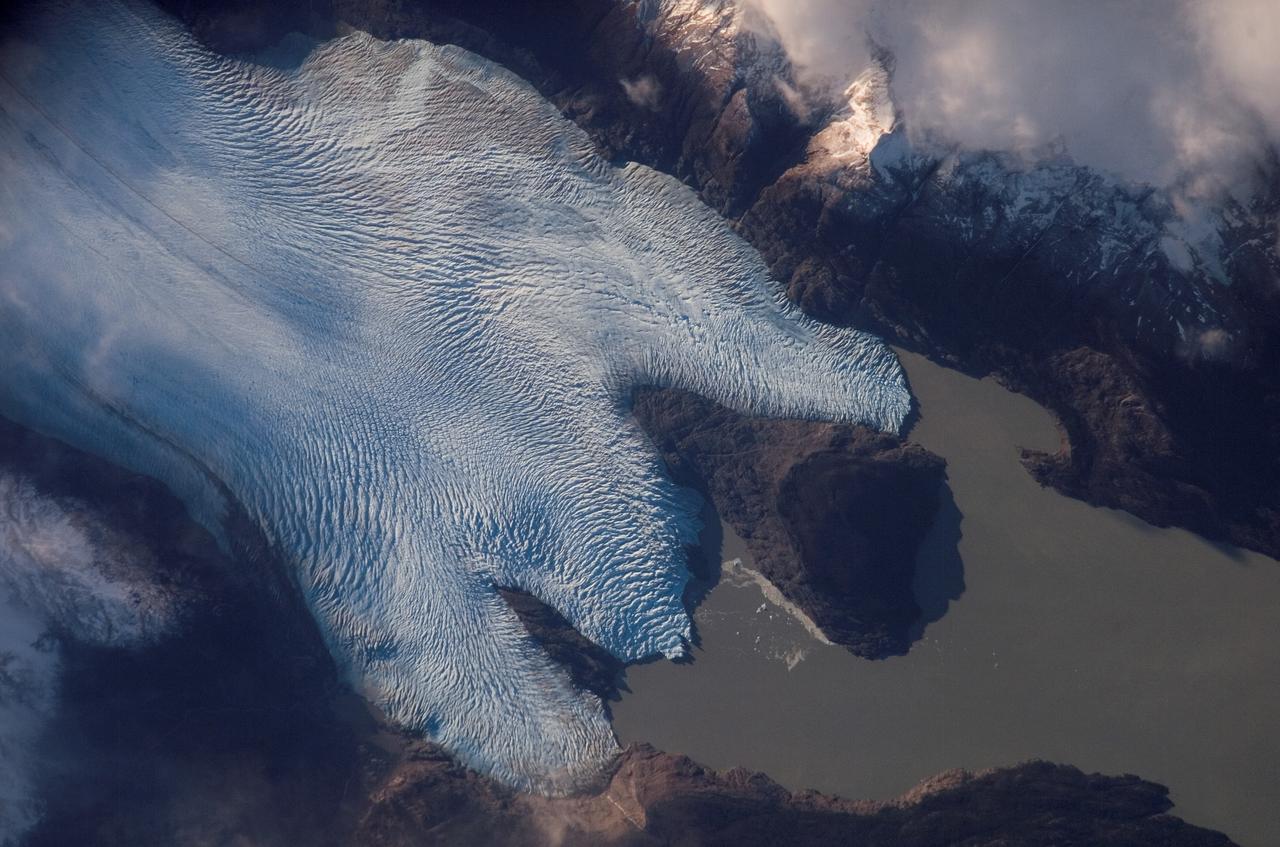
ISS015-E-10699 (4 June 2007) --- Grey Glacier is featured in this image photographed by an Expedition 15 crewmember on the International Space Station. The Southern Patagonian ice field of Chile and Argentina hosts several spectacular glaciers -- including Grey Glacier located in the Torres del Paine National Park in Chile. This glacier, which has a measured total area of 270 square kilometers and length of 28 kilometers (1996 measurements), begins in the Patagonian Andes Mountains to the west and terminates in three distinct lobes into Grey Lake. This view captures a striking blue coloration of the glacier -- this is due to absorption of visible red wavelengths, and scattering of light in the blue wavelengths as it is transmitted through the ice. Certain portions of the glacier visible in the image are indeed grey. Linear grey-brown moraines are accumulations of soil and rock debris that form along the edges of a glacier as it flows downhill across the landscape (much like a bulldozer blade). Glaciers flowing down-slope through adjacent feeder valleys ultimately meet, and debris entrained along their sides becomes concentrated in the central portion of the resulting single large glacier -- much as smaller streams of water join to form a single large river. Three of these medial moraines are visible in the ice mass at center left. Grey-brown patches of debris from adjacent mountainsides color the surface of the easternmost lobe of the glacier (top). Several crevasse fields are visible in the image. The crevasses -- each a small canyon in the ice - form as a result of stress between the slower- and faster-moving ice within the glacier. The crevasse patterns of Grey Glacier are complex, perhaps due to the three-lobed nature of its terminus, or end, into Grey Lake. The rugged surface of the glacier is also demonstrated by the jagged shadows cast onto the surface of the lake.
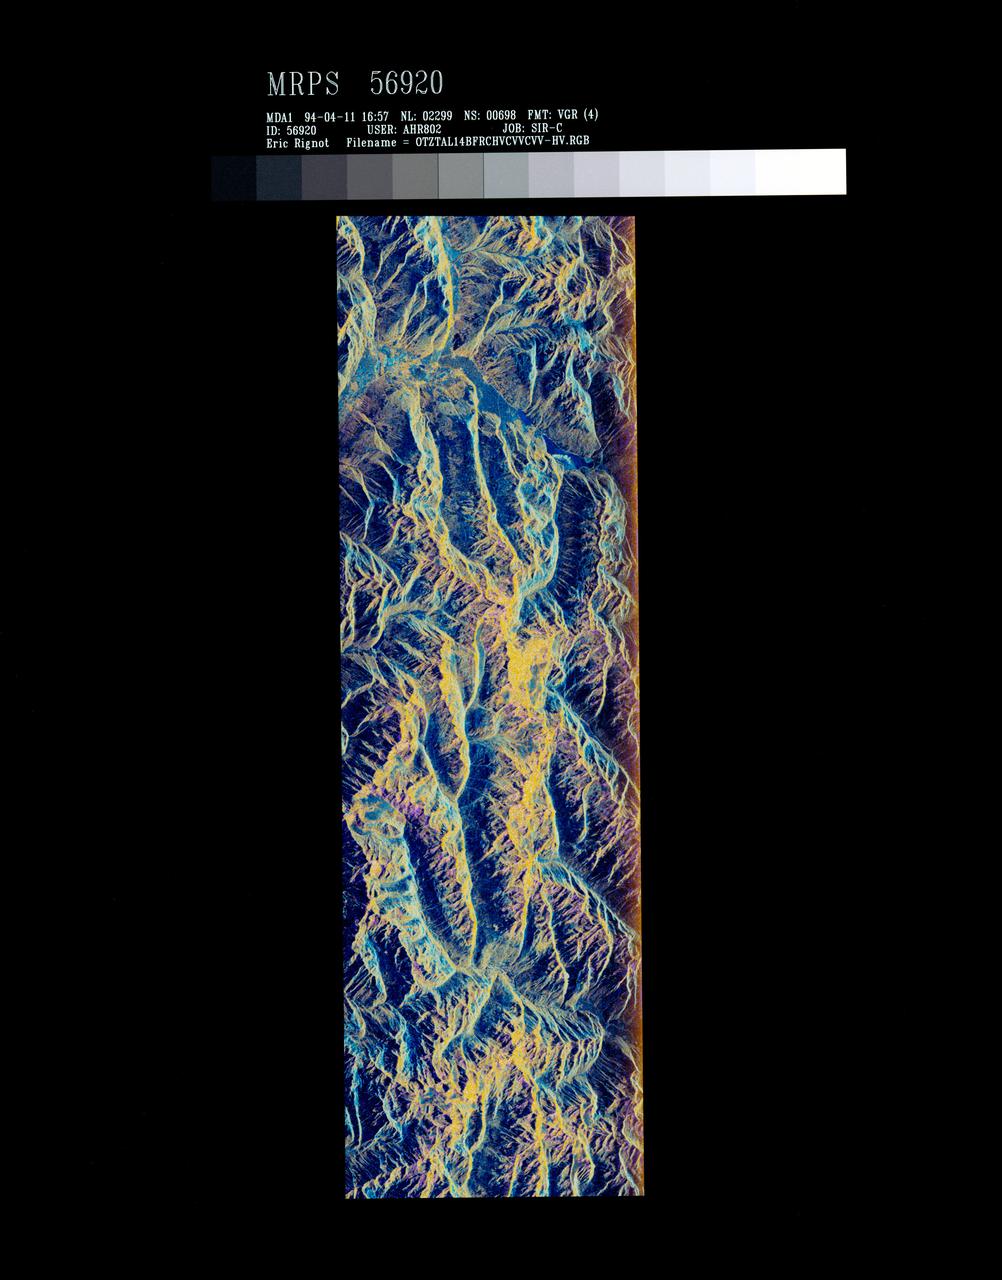
STS059-S-072 (13 April 1994) --- This image is a false-color composite of Oetztal, Austria located in the Central Alps, centered at 46.8 degrees north latitude, and 10.70 degrees east longitude, at the border between Switzerland (top), Italy (left) and Austria (right and bottom). The area shown is 50 kilometers (30 miles) south of Innsbruck, Austria. This image was acquired by the Spaceborne Imaging Radar-C and X-Band Synthetic Aperture Radar (SIR-C/X-SAR) aboard the Space Shuttle Endeavour on its 14th orbit. Oetztal is a SIR-C/X-SAR hydrology supersite. Approximately one quarter of this image is covered by glaciers, the largest of which, Gepatschferner, is visible as a triangular yellow patch in the center of the scene. The summits of the main peaks reach elevations between 3,500 and 3,768 meters (11,500 and 12,362 feet) above sea level. The tongues of the glaciers are descending from elevated plateaus down into narrow valleys which were formed during the last ice age. This color image was produced in C-Band using multi-polarization information (Red=CHV, Green=CVV, Blue=CVV/CHV). The blue areas are lakes (Gepatsch Dam at center right; Lake Muta at top right) and glacier ice. The yellow areas are slopes facing the radar and areas of dry snow. Purple corresponds to slopes facing away from the radar. Yellow in the valley bottom corresponds to tree covered areas. There is 30 to 50 centimeters (12 to 20 inches) of dry, fresh snow on the glaciers, and about 10 centimeters (4 inches) in the valley at the city of Vent, Austria (center). At these data were taken, the weather was cold, with snow and thick fog. The entire area would appear white to an optical sensor because it is all covered under a winter snowpack. Researchers are interested in Oetztal because knowing how glaciers shrink and grow over time is an important indication of climatic change. SIR-C/X-SAR is part of NASA's Mission to Planet Earth (MTPE). SIR-C/X-SAR radars illuminate Earth with microwaves allowing detailed observations at any time, regardless of weather or sunlight conditions. SIR-C/X-SAR uses three microwave wavelengths: L-Band (24 cm), C-Band (6 cm), and X-Band (3 cm). The multi-frequency data will be used by the international scientific community to better understand the global environment and how it is changing. The SIR-C/X-SAR data, complemented by aircraft and ground studies, will give scientists clearer insights into those environmental changes which are caused by nature and those changes which are induced by human activity. SIR-C was developed by NASA's Jet Propulsion Laboratory (JPL). X-SAR was developed by the Dornire and Alenia Spazio Companies for the German Space Agency, Deutsche Agentur fuer Raumfahrtangelegenheiten (DARA), and the Italian Space Agency, Agenzia Spaziale Italiana (ASI). JPL Photo ID: P-43890
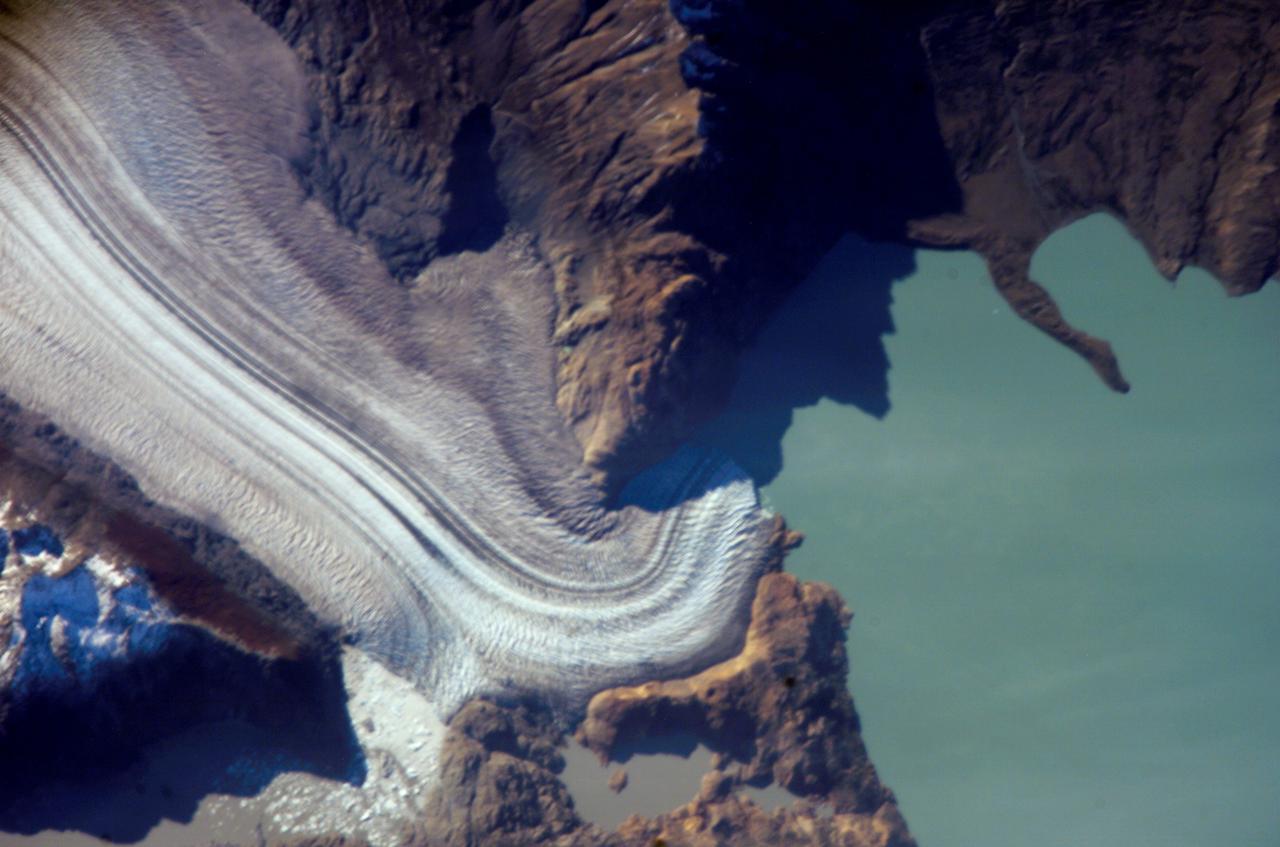
ISS013-E-06947 (12 April 2006) --- Viedma Glacier, Argentina is featured in this image photographed by an Expedition 13 crewmember on the International Space Station. The ice fields of Patagonia, located at the southern end of South America, are the largest masses of ice in the temperate Southern Hemisphere (approximately 55,000 square kilometers in area). The ice fields contain numerous valley glaciers that terminate in melt-water-fed lakes. These are known as "calving" glaciers, as they lose mass by collapse of large ice chunks from the terminus--or end--of the glacier. These newly separated chunks of ice are then free to float away, much like ice cubes in a punch bowl. The Patagonian glaciers are closely monitored using remotely sensed data as they respond to regional climate change. Visual comparison of time series of images is typically performed to quantify change in ice extent and position. The terminus of the Viedma Glacier, approximately two kilometers across where it enters Lake Viedma, is shown in this image. Moraines are accumulations of soil and rock debris that form along the sides and front of a glacier as it flows across the landscape (much like a bulldozer). Independent valley glaciers can merge together as they flow down-slope, and the moraines become entrained in the center of the new ice mass. These medial moraines are visible as dark parallel lines within the white central mass of the glacier (image center and left). Crevasses - oriented roughly perpendicular to the medial moraines - are also visible in the grey-brown ice along the sides of the glacier. According to scientists, the canyon-like crevasses form as a result of stress between the slower moving ice along the valley sides and the more rapidly moving ice in the center of the glacier. Calving of ice from the southwestern fork of the glacier terminus is visible at image lower left.
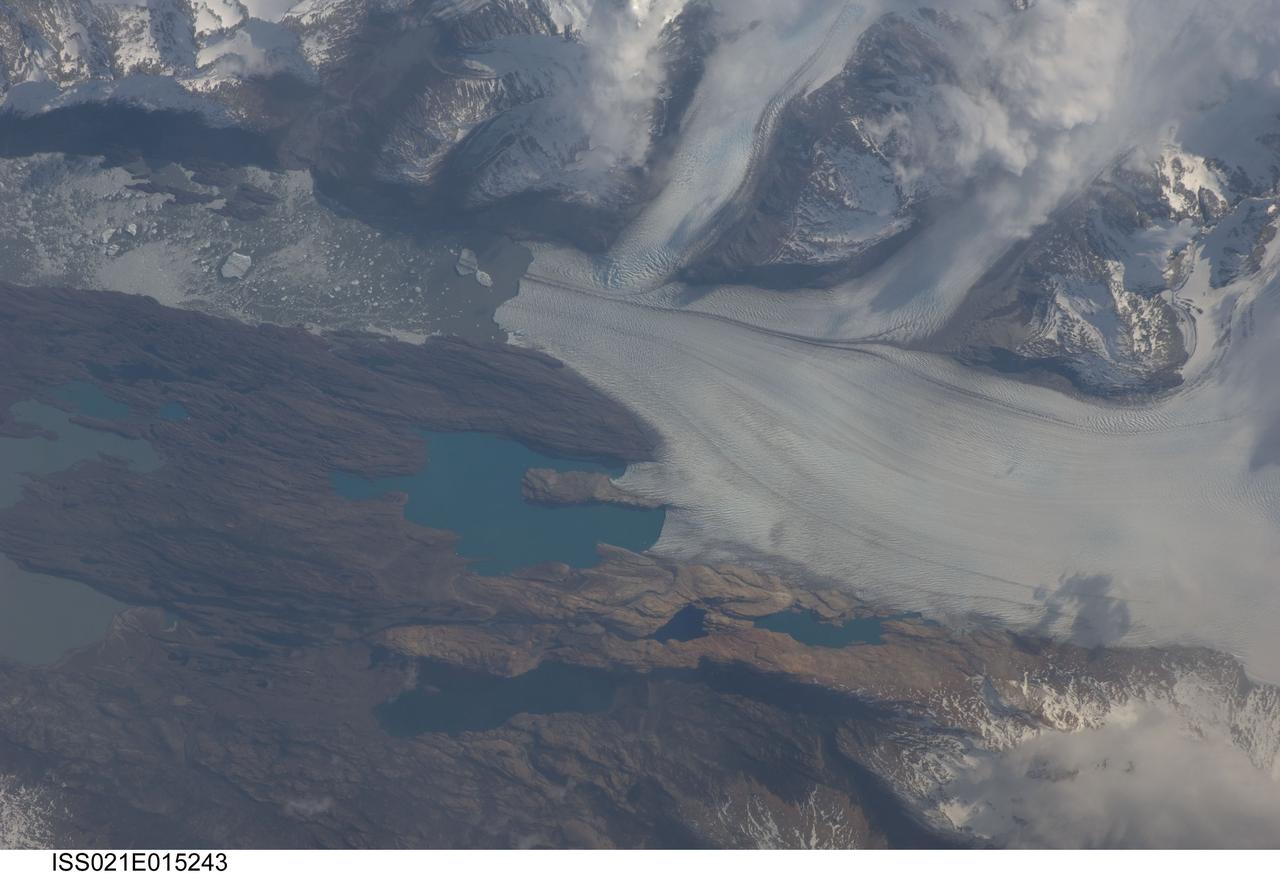
ISS021-E-015243 (25 Oct. 2009) --- Upsala Glacier, Argentina is featured in this image photographed by an Expedition 21 crew member on the International Space Station. The Southern Patagonian Ice Field of Argentina and Chile hosts some of the most spectacular glaciers in the world, and is second only to Antarctica in size. This detailed photograph illustrates the terminus of Upsala Glacier, located on the eastern side of the ice field. This glacier is the third largest in the Southern Patagonian Ice Field and, like most other glaciers in the region, has experienced significant retreat over the past century. This image was taken during spring in the Southern Hemisphere, and calving of icebergs ? release of chunks of ice from the glacier terminus as it enters the waters of Lake Argentina - is visible at left. Two icebergs are of particular interest, as they retain fragments of the moraine that forms a dark line along the upper surface of the glacier. Moraines of the type visible in this image are formed from coarse rock and soil debris that accumulates along the front and sides of a flowing glacier; much like a bulldozer blade pushes material in front of it. When two glaciers merge together (center), debris in moraines along their edges can now form a medial moraine that is drawn out along the upper surface of the new ice mass. These moraines can be carried intact to the terminus and included in icebergs that then float away, dropping the coarse debris as the iceberg melts. While the icebergs produced by Upsala Glacier do not reach an ocean, there are many current glaciers ? as well as glaciers and ice sheets that existed in the geologic past ? capable of producing ocean-going icebergs. This process is thought to be recorded in the geologic record as layers or lenses of coarse, land-derived sediments within finer grained sea floor sediments that are located far from any current (or former) coastline.
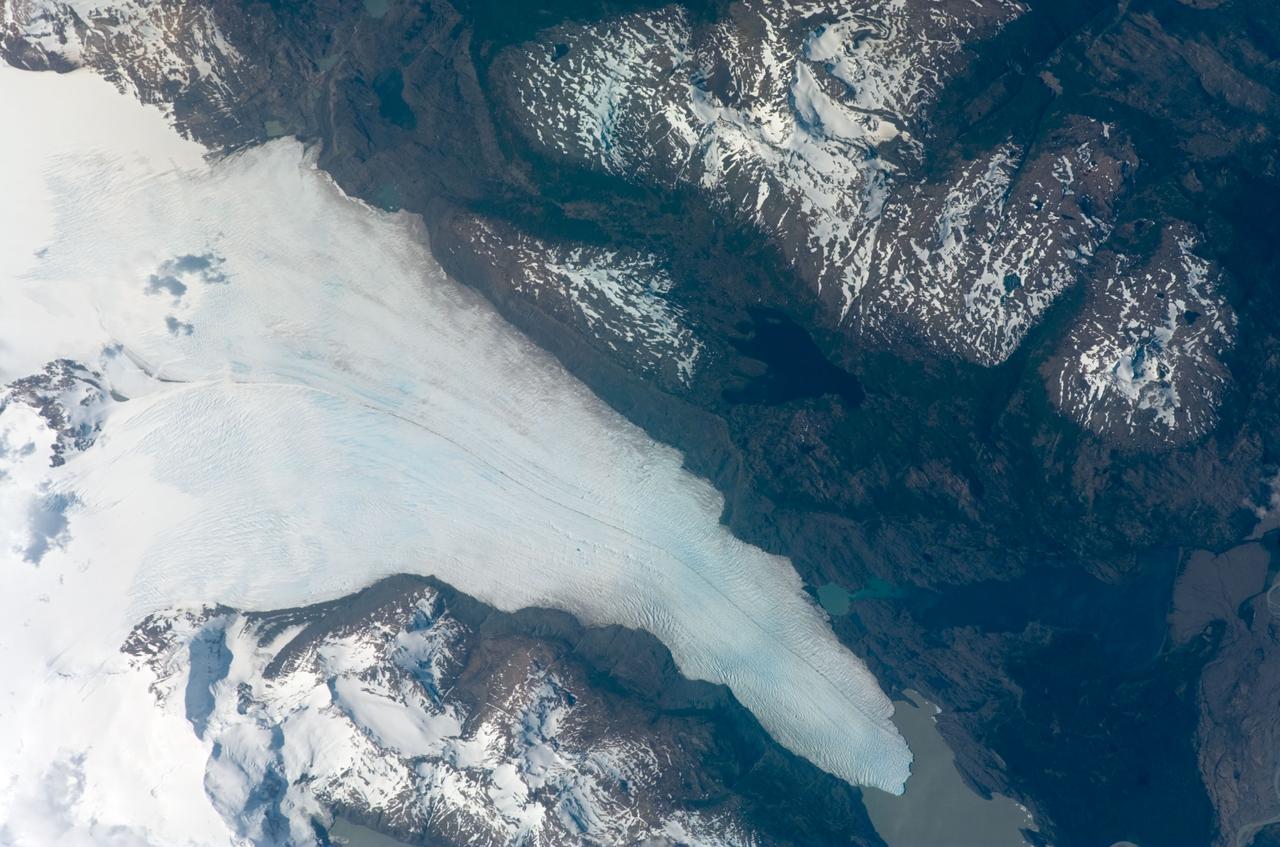
ISS016-E-012047 (22 Nov. 2007) --- Tyndall Glacier, located in the Torres del Paine National Park in Chile, is featured in this image photographed by an Expedition 16 crewmember on the International Space Station. This glacier, which has a measured total area of 331 square kilometers and length of 32 kilometers (1996 measurements), begins in the Patagonian Andes Mountains to the west and terminates in Lago Geikie. A medial moraine is visible in the center of the glacier, extending along its length (center left). These accumulations of soil and rock debris form along the edges of a glacier as it flows downhill across the landscape (much like a snowplow builds ridges of snow along the roadside). Glaciers flowing downslope through adjacent feeder valleys merge when they encounter each other, and debris entrained along their sides becomes concentrated in the central portion of the new combined ice mass -- much as small streams join to form a river. Crevasse fields are also visible in the image. The crevasses -- small, but potentially quite deep fissures -- form as a result of stress between slower- and faster-moving ice within the glacier. Crevasse fields on Tyndall Glacier are most evident near rock promontories extending into the glacier -- causing the ice to slow as it flows around the obstruction.
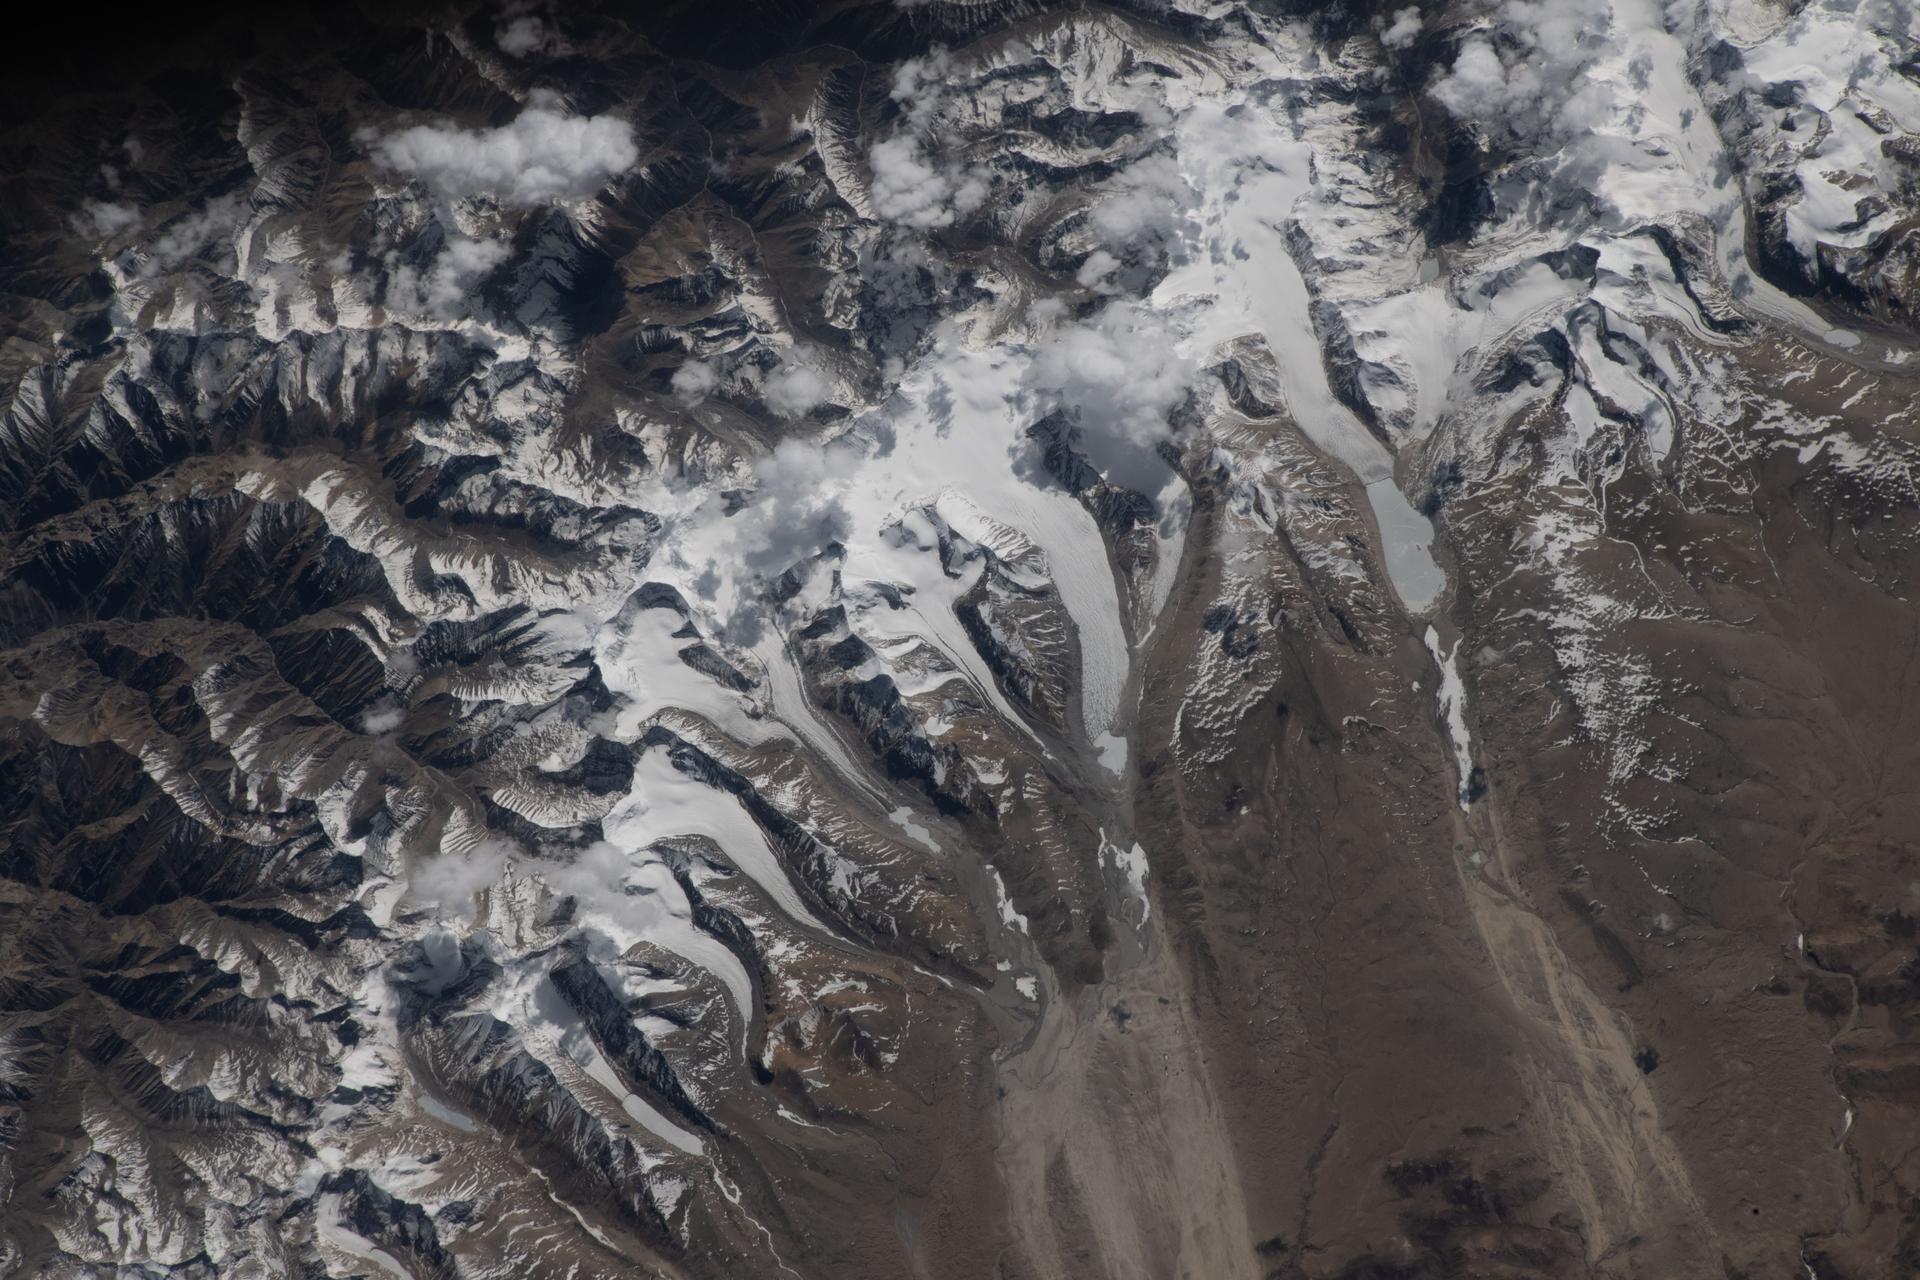
iss074e0603582 (May 20, 2026) --- The Himalayas separate Nepal from China in this photograph from the International Space Station as it orbited 259 miles above the western Tibetan Plateau. Glaciers—slow‑moving rivers of ice that carve paths into mountainsides—flow downhill from the Himalayas’ northern slopes onto China's Tibetan Plateau. Credit: NASA/Jessica Meir
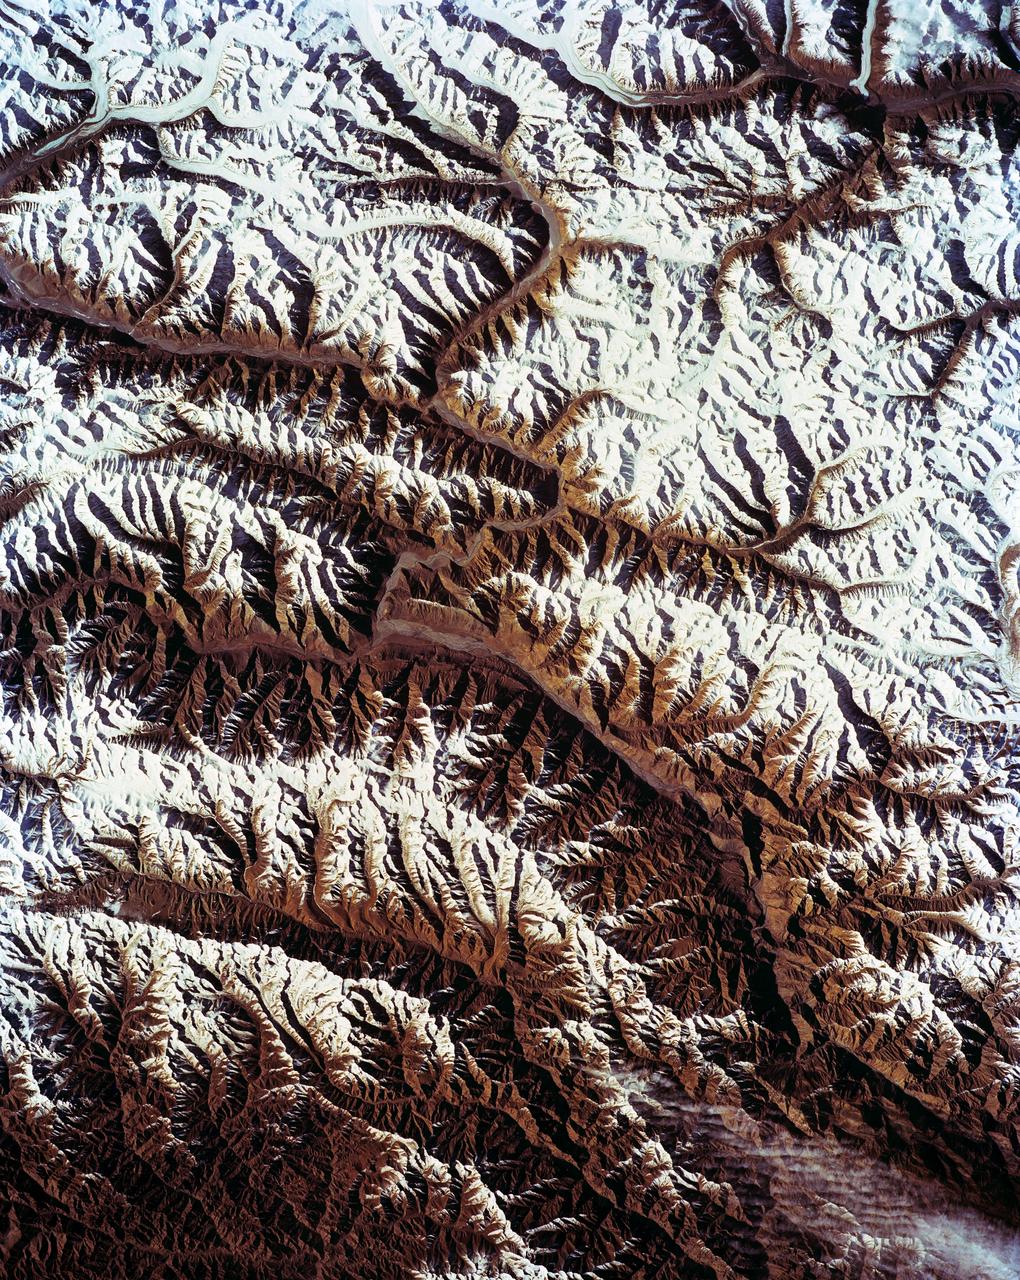
STS-56 Earth observation shows of some of the highest mountain peaks in the world taken from Discovery, Orbiter Vehicle (OV) 103, as it passed over India and China. The top of the view shows one of the snow and ice-covered massifs in the great Karakorum Range of north India. A star-shaped peak at top left reaches 23,850 feet. Glaciers can be seen in valleys at these high elevations. The international border between India to the south (top) and China (bottom) snakes left to right along a river near the top of the scene, then veers into the muntains at top left. Larger valleys, despite their elevation (all in excess of 14,000 feet), are occupied by transport routes joining points in India, China and the southern republics of the CIS. The ancient Silk Route between China and the Middle East lies not far to the north (outside the bottom of the frame).
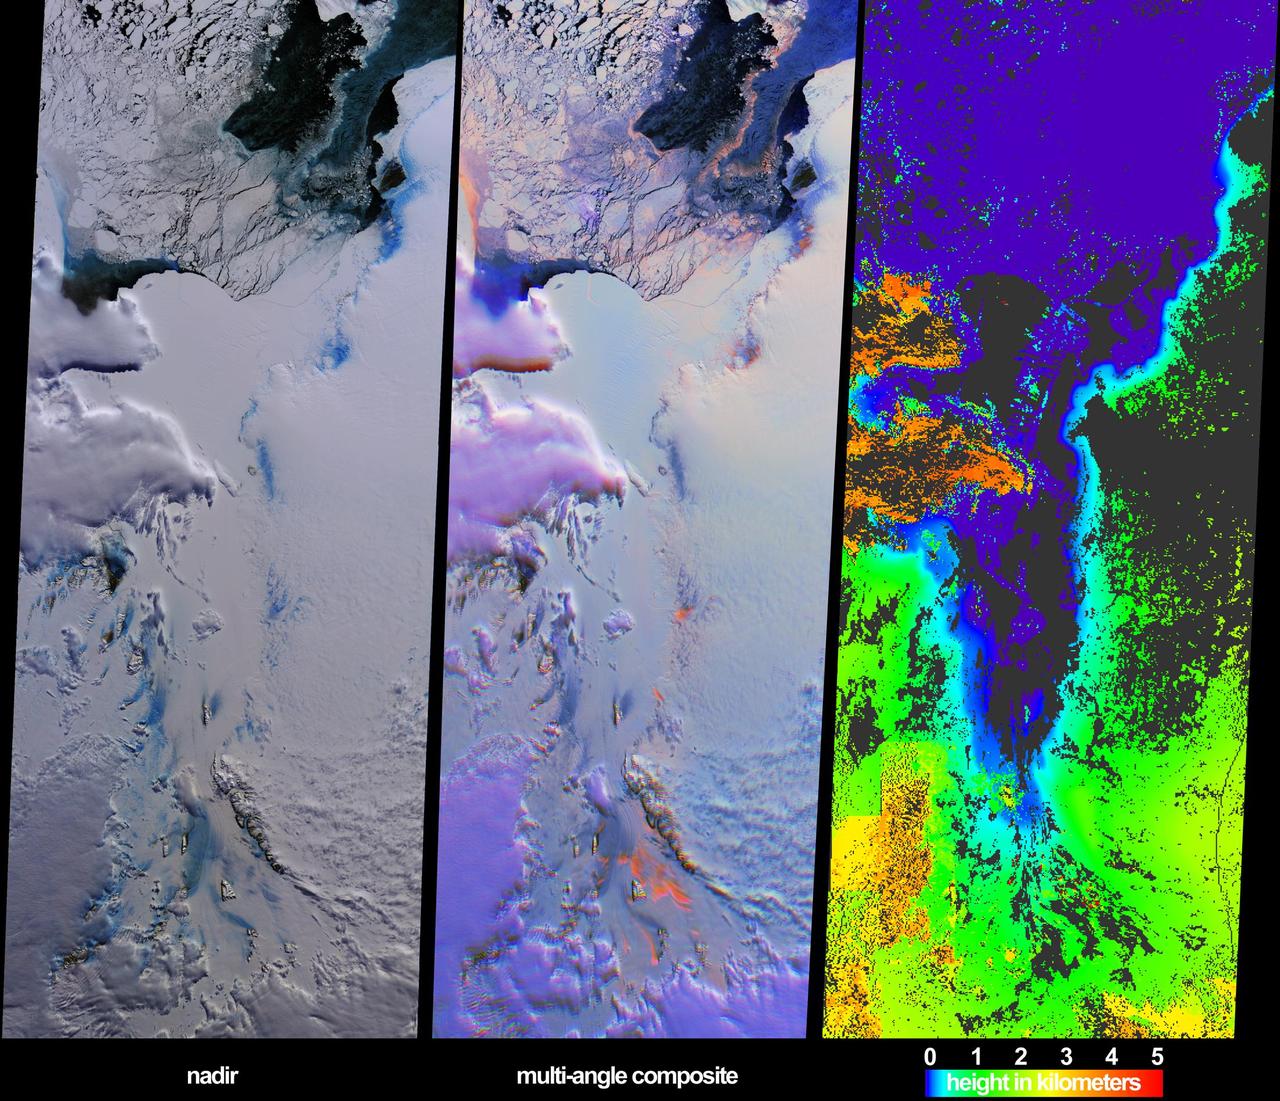
These views from NASA Terra spacecraft illustrate ice surface textures and cloud-top heights over the Amery Ice Shelf/Lambert Glacier system in East Antarctica on October 25, 2002.
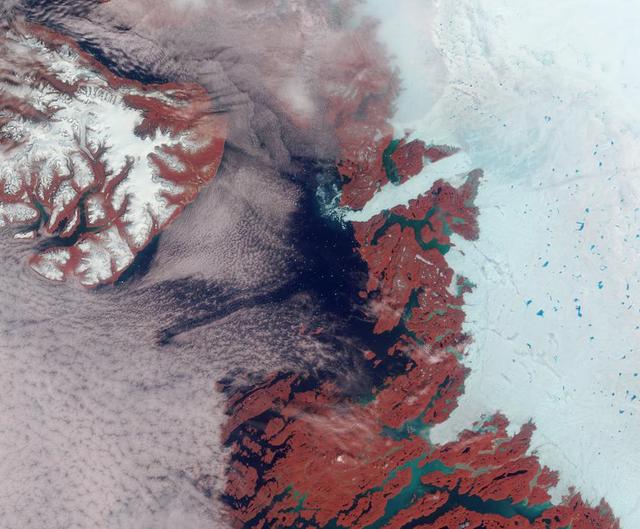
Vibrant reds, emerald greens, brilliant whites, and pastel blues adorn this view of the area surrounding the Jakobshavn Glacier on the western coast of Greenland captured by NASA Terra spacecraft on June 18, 2003.

Acquired by NASA Terra spacecraft, this image shows the west coast of Greenland, one of Earth premiere incubators for icebergs -- large blocks of land ice that break off from glaciers or ice shelves and float in the ocean.
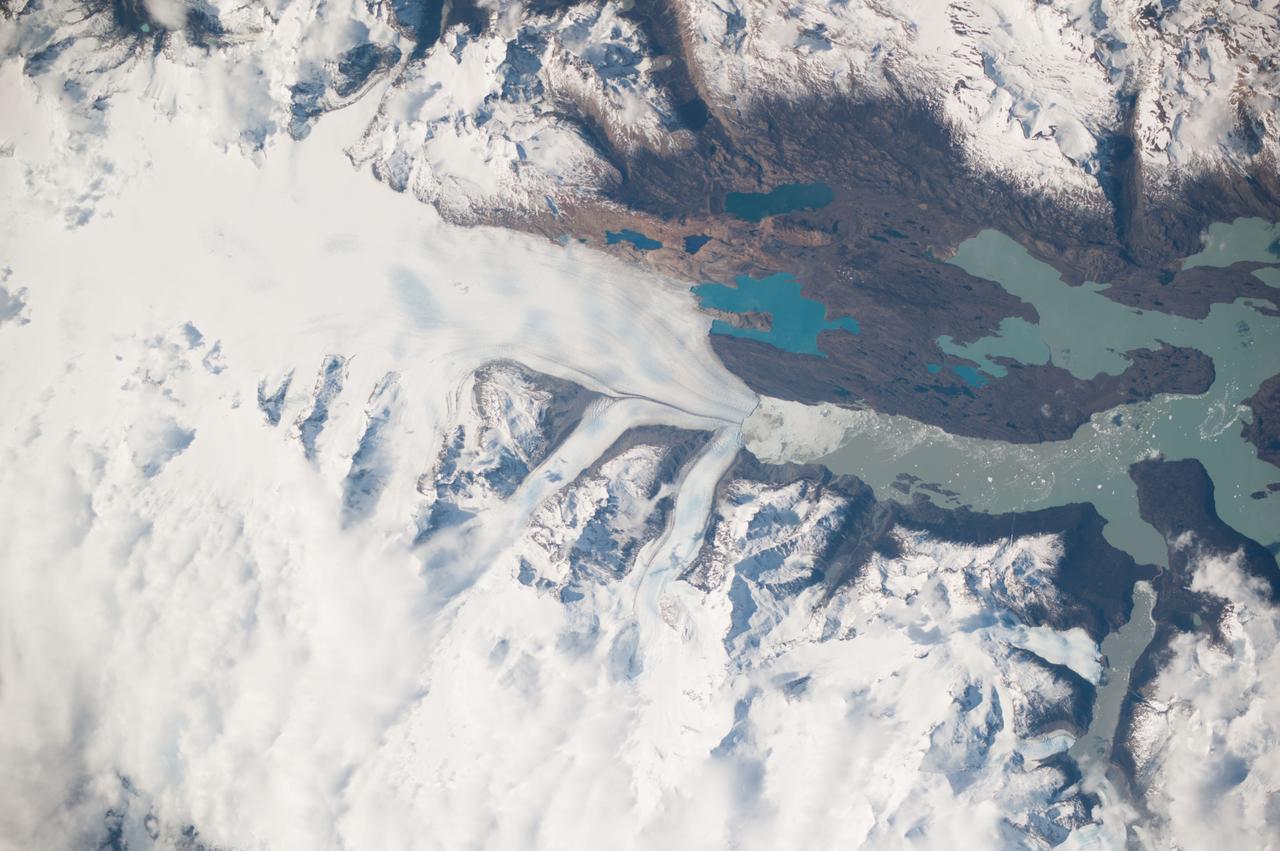
ISS037-E-005104 (2 Oct. 2013) --- Upsala Glacier Retreat and Patagonia Icefield are featured in this image photographed by an Expedition 37 crew member on the International Space Station. This photograph highlights the snout of the Upsala Glacier (49.88S 73.3W) on the Argentine side of the North Patagonian Icefield. Ice flow in this glacier (white mass, left) is from the north (left). Dark lines of rocky moraine within the ice give a sense of the slow ice flow from left to right. A smaller side glacier joins Upsala at the present-day ice front—the wall from which masses of ice periodically collapse into Lake Argentino. In this image the 2.75-kilometer-long wall casts a thin, dark shadow. The surface of Lake Argentino is whitened by a mass of ice debris from a recent collapse of the ice wall. Larger icebergs that have calved appear as white dots on the lake surface at right. Remotely sensed data, including detailed astronaut images such as this, have recorded the position of the ice front over the years. Even though the ice actually flows slowly southward, comparison of this October 2013 image with older data (not shown) indicates that the ice wall of the glacier has moved backwards—upstream—an average of 3.6 kilometers since early 2002. This so-called “retreat” is believed by scientists to indicate local climatic warming in this part of South America. The warming not only causes the ice front to retreat but more importantly, causes overall thinning of the glacier ice mass, as a study of 63 glaciers in Patagonia has shown is now a general trend (Rignot et al. 2003). Ice-front retreat is now known to be related to volumetric loss due to melting. Water color is related to glacier flow. Lake Argentino receives most of the ice from the glacier and thus also receives most of the “rock flour” (rocks ground to white powder by the ice scraping against the rock floor of the valley) from underneath the glacier. Glacial flour turns the lake water a gray-green hue in this image. The darker blue of the smaller lakes (top) indicates that they are receiving much less rock flour.
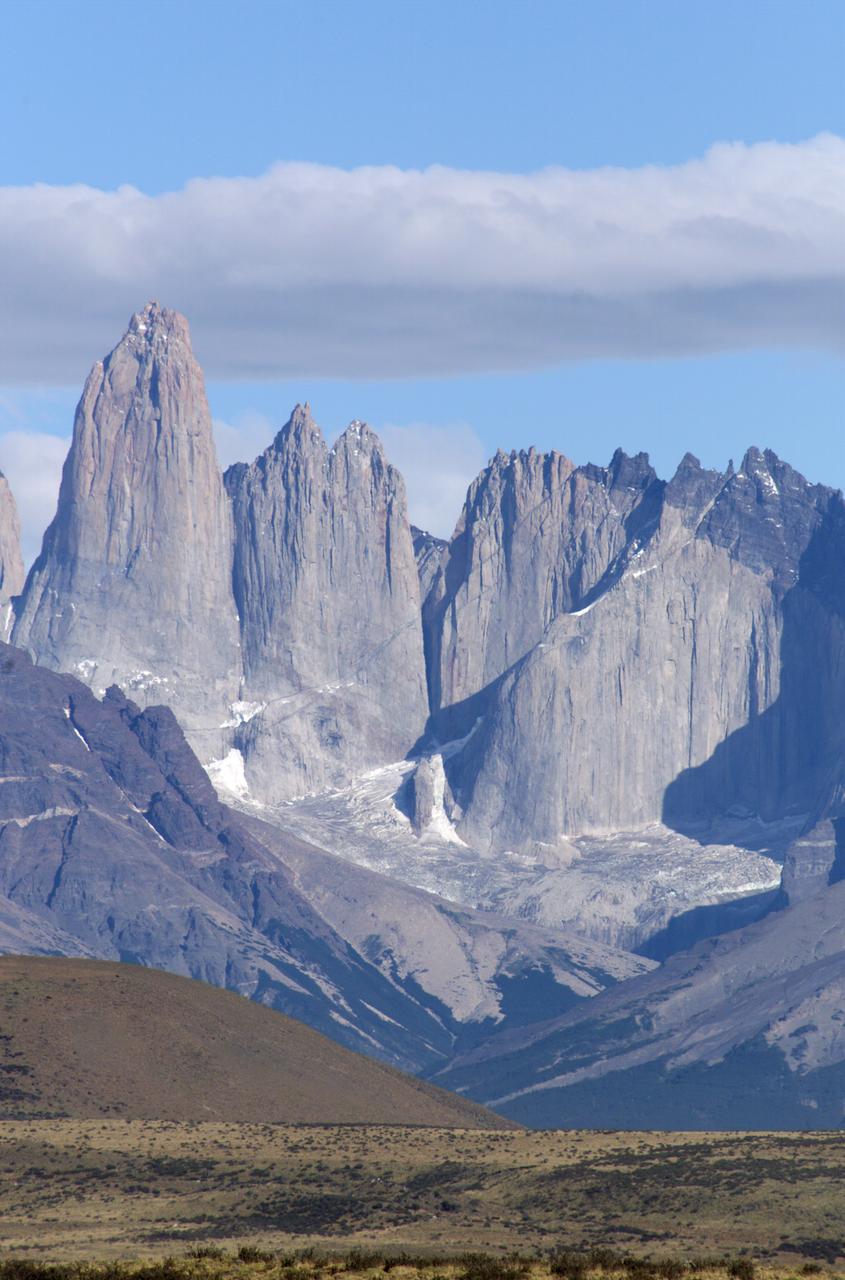
The Cuernos del Paine mountains in Torres del Paine National Park in Chile, photographed during NASA's AirSAR 2004 campaign. AirSAR 2004 is a three-week expedition in Central and South America by an international team of scientists that is using an all-weather imaging tool, called the Airborne Synthetic Aperture Radar (AirSAR), located onboard NASA's DC-8 airborne laboratory. Scientists from many parts of the world are combining ground research with NASA's AirSAR technology to improve and expand on the quality of research they are able to conduct. Founded in 1959, Torres del Paine National Park encompasses 450,000 acres in the Patagonia region of Chile. This region is being studied by NASA using a DC-8 equipped with an Airborne Synthetic Aperture Radar (AirSAR) developed by scientists from NASA’s Jet Propulsion Laboratory. This is a very sensitive region that is important to scientists because the temperature has been consistently rising causing a subsequent melting of the region’s glaciers. AirSAR will provide a baseline model and unprecedented mapping of the region. This data will make it possible to determine whether the warming trend is slowing, continuing or accelerating. AirSAR will also provide reliable information on ice shelf thickness to measure the contribution of the glaciers to sea level.
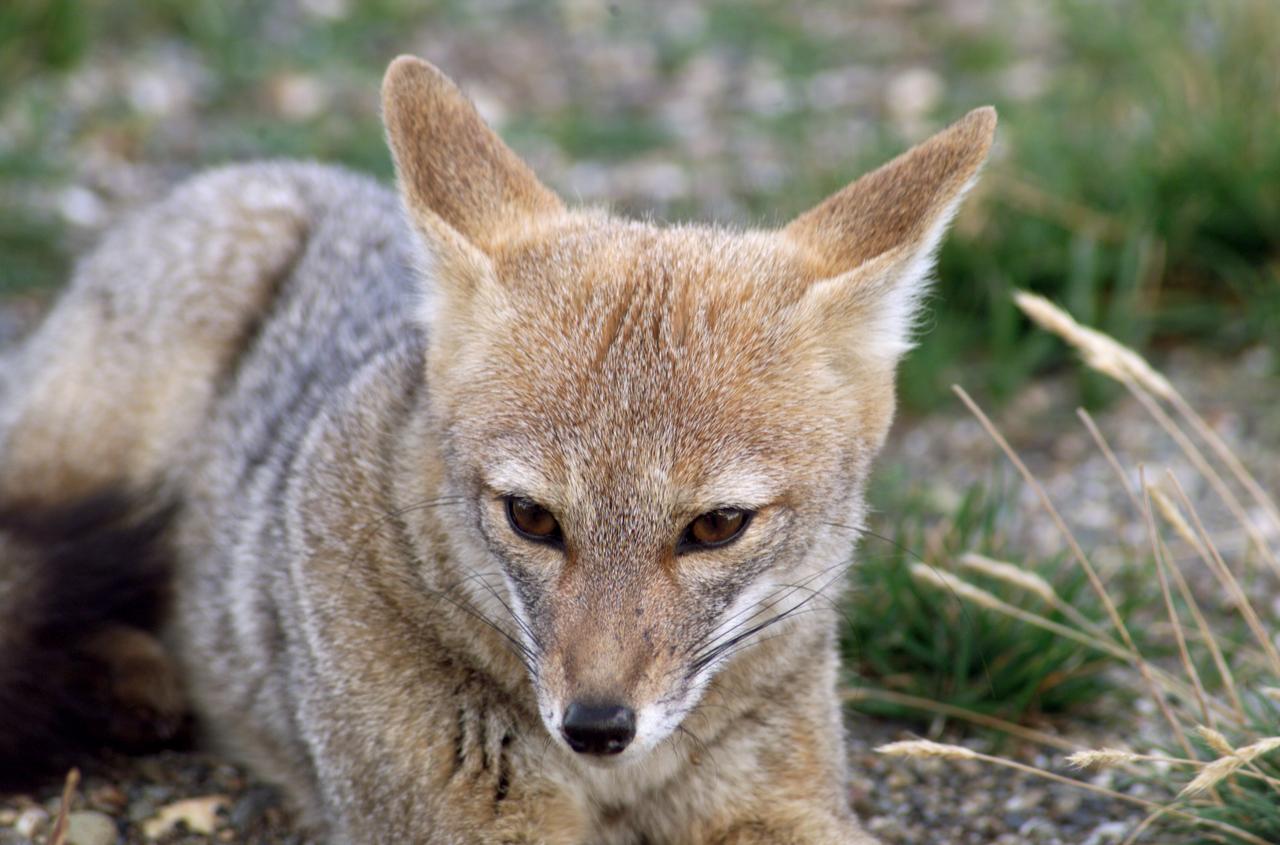
A fox at Torres del Paine National Park in Chile during NASA's AirSAR 2004 campaign. AirSAR 2004 is a three-week expedition in Central and South America by an international team of scientists that is using an all-weather imaging tool, called the Airborne Synthetic Aperture Radar (AirSAR), located onboard NASA's DC-8 airborne laboratory. Scientists from many parts of the world are combining ground research with NASA's AirSAR technology to improve and expand on the quality of research they are able to conduct. Founded in 1959, Torres del Paine National Park encompasses 450,000 acres in the Patagonia region of Chile. This region is being studied by NASA using a DC-8 equipped with an Airborne Synthetic Aperture Radar (AirSAR) developed by scientists from NASA’s Jet Propulsion Laboratory. This is a very sensitive region that is important to scientists because the temperature has been consistently rising causing a subsequent melting of the region’s glaciers. AirSAR will provide a baseline model and unprecedented mapping of the region. This data will make it possible to determine whether the warming trend is slowing, continuing or accelerating. AirSAR will also provide reliable information on ice shelf thickness to measure the contribution of the glaciers to sea level.
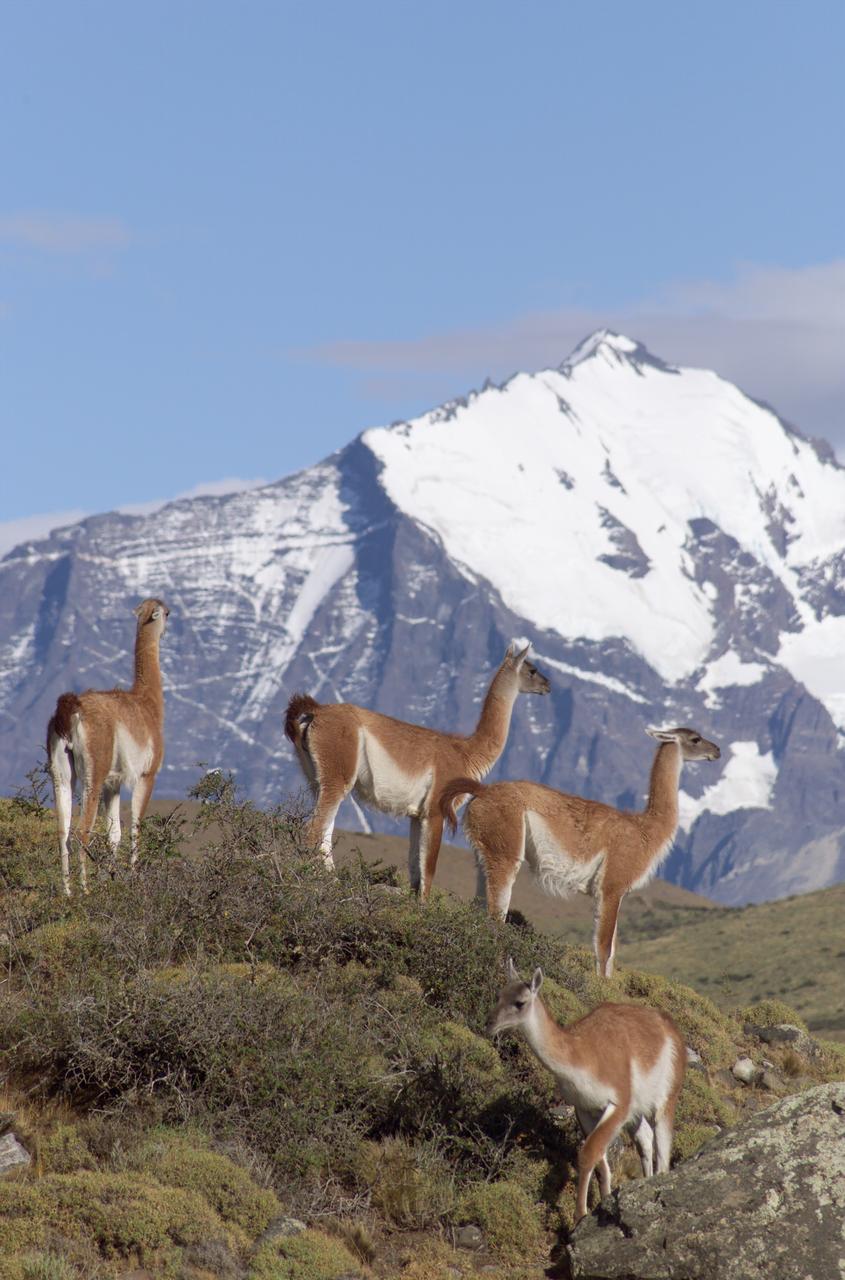
The Cuernos del Paine mountains in Torres del Paine National Park in Chile provide a backdrop to a herd of guanacos during NASA's AirSAR 2004 campaign. AirSAR 2004 is a three-week expedition in Central and South America by an international team of scientists that is using an all-weather imaging tool, called the Airborne Synthetic Aperture Radar (AirSAR), located onboard NASA's DC-8 airborne laboratory. Scientists from many parts of the world are combining ground research with NASA's AirSAR technology to improve and expand on the quality of research they are able to conduct. Founded in 1959, Torres del Paine National Park encompasses 450,000 acres in the Patagonia region of Chile. This region is being studied by NASA using a DC-8 equipped with an Airborne Synthetic Aperture Radar (AirSAR) developed by scientists from NASA’s Jet Propulsion Laboratory. This is a very sensitive region that is important to scientists because the temperature has been consistently rising causing a subsequent melting of the region’s glaciers. AirSAR will provide a baseline model and unprecedented mapping of the region. This data will make it possible to determine whether the warming trend is slowing, continuing or accelerating. AirSAR will also provide reliable information on ice shelf thickness to measure the contribution of the glaciers to sea level.
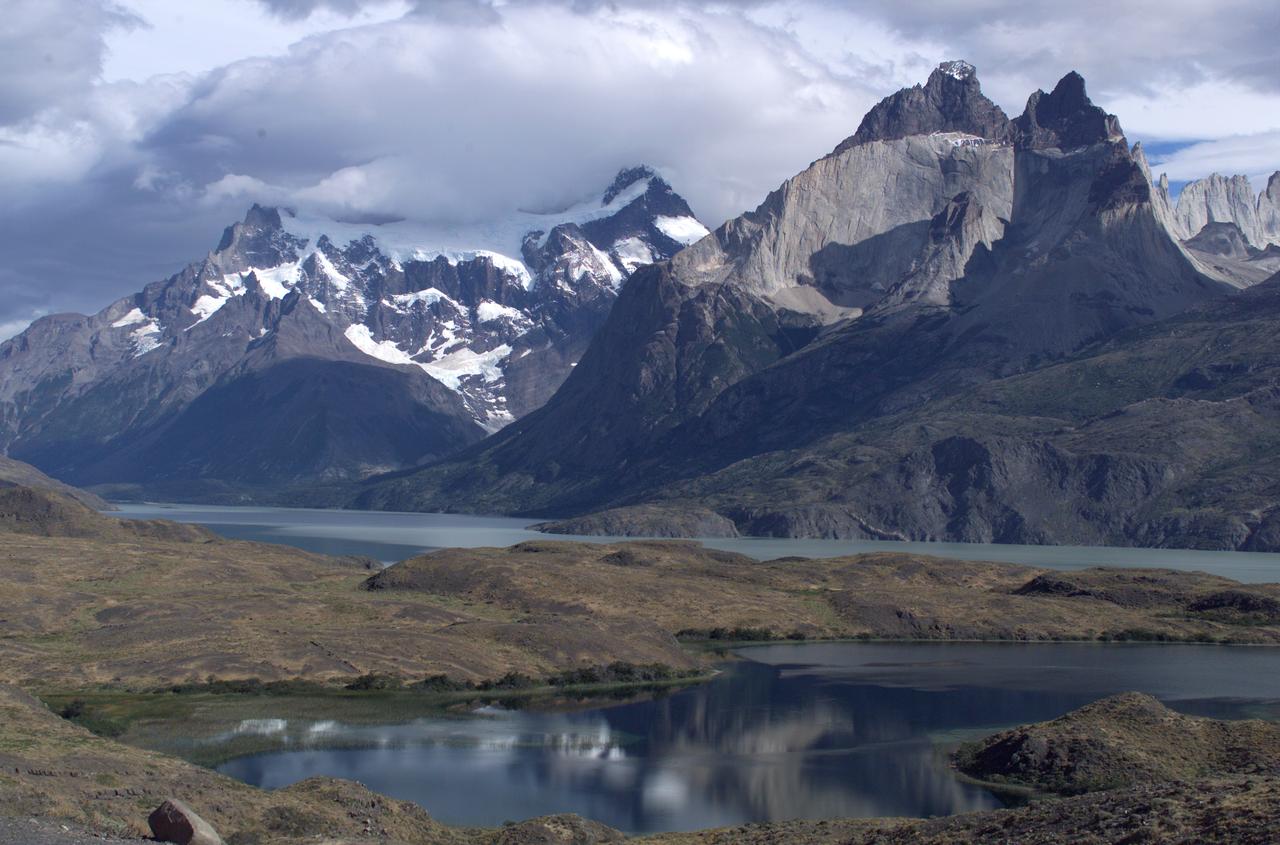
The Cuernos del Paine mountains in Torres del Paine National Park, Chile, during NASA's AirSAR 2004 campaign. AirSAR 2004 is a three-week expedition in Central and South America by an international team of scientists that is using an all-weather imaging tool, called the Airborne Synthetic Aperture Radar (AirSAR), located onboard NASA's DC-8 airborne laboratory. Scientists from many parts of the world are combining ground research with NASA's AirSAR technology to improve and expand on the quality of research they are able to conduct. Founded in 1959, Torres del Paine National Park encompasses 450,000 acres in the Patagonia region of Chile. This region is being studied by NASA using a DC-8 equipped with an Airborne Synthetic Aperture Radar (AirSAR) developed by scientists from NASA’s Jet Propulsion Laboratory. This is a very sensitive region that is important to scientists because the temperature has been consistently rising causing a subsequent melting of the region’s glaciers. AirSAR will provide a baseline model and unprecedented mapping of the region. This data will make it possible to determine whether the warming trend is slowing, continuing or accelerating. AirSAR will also provide reliable information on ice shelf thickness to measure the contribution of the glaciers to sea level.
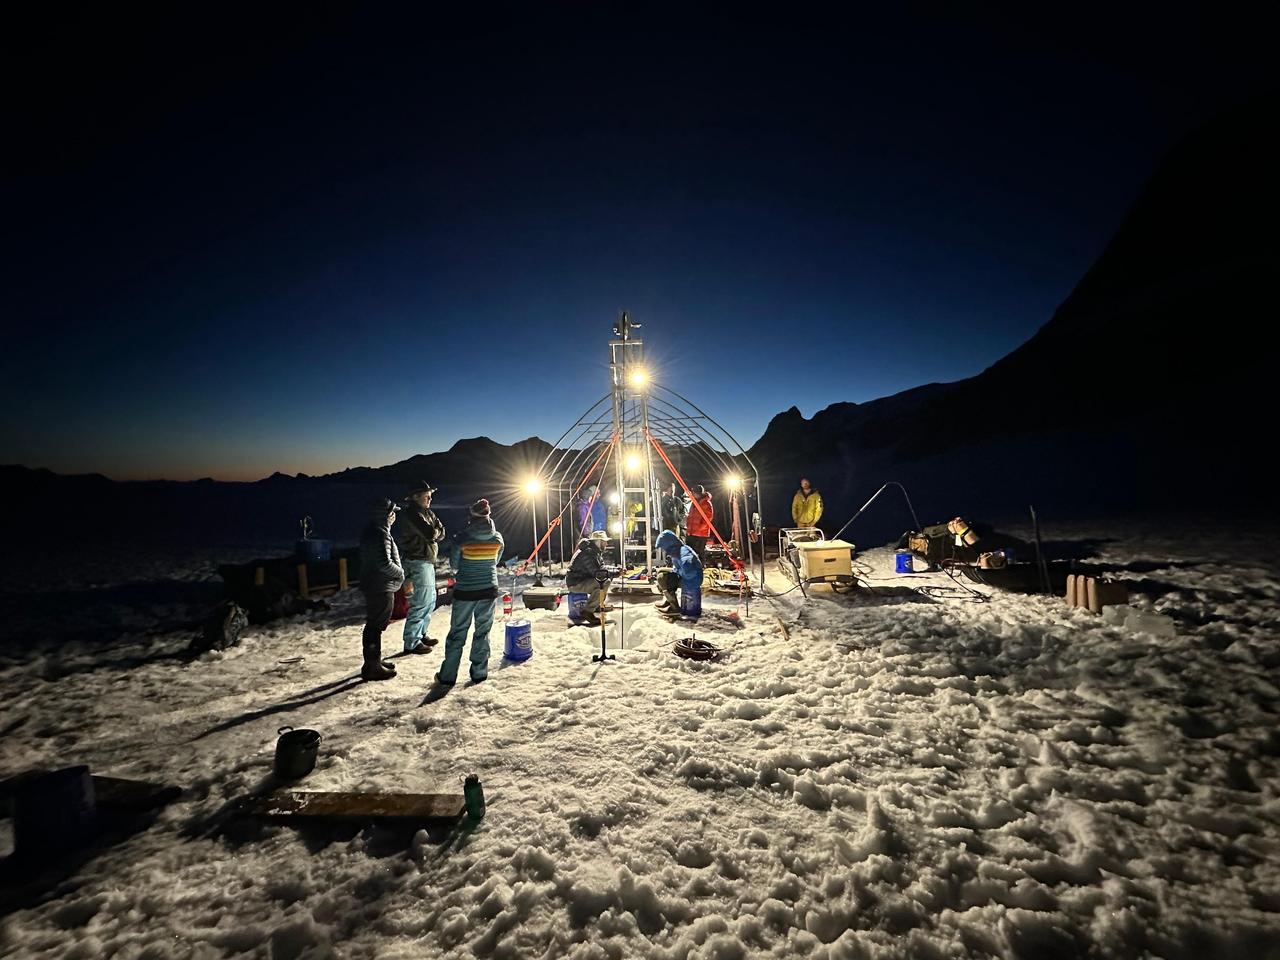
A group of researchers from NASA's Jet Propulsion Laboratory and other institutions spent two weeks on a glacier in Alaska in July 2023 for a project called ORCAA (Ocean Worlds Reconnaissance and Characterization of Astrobiological Analogs). Known as an analog mission, the project is working to answer science questions and test technology in preparation for a potential future mission to explore the surface or subsurface of icy moons like Jupiter's Europa and Saturn's Enceladus. Working at the Juneau Icefield, in coordination with the Juneau Icefield Research Project, the team used a hot-water drill to make a narrow hole in the glacier, melting its way progressively deeper. After three days, the drill reached bedrock, 890 feet (272 meters) below the surface. Science instruments were then sent down the borehole to take a variety of measurements and characterize the water environment. In 2025, the ORCAA team will return to the icefield and target a subglacial lake (a body of water inside the glacier) that has similarities to a reservoir scientists believe exists a few kilometers beneath the icy surface of Europa. ORCAA is funded by NASA's Planetary Science and Technology from Analog Research (PSTAR) program. https://photojournal.jpl.nasa.gov/catalog/PIA26345
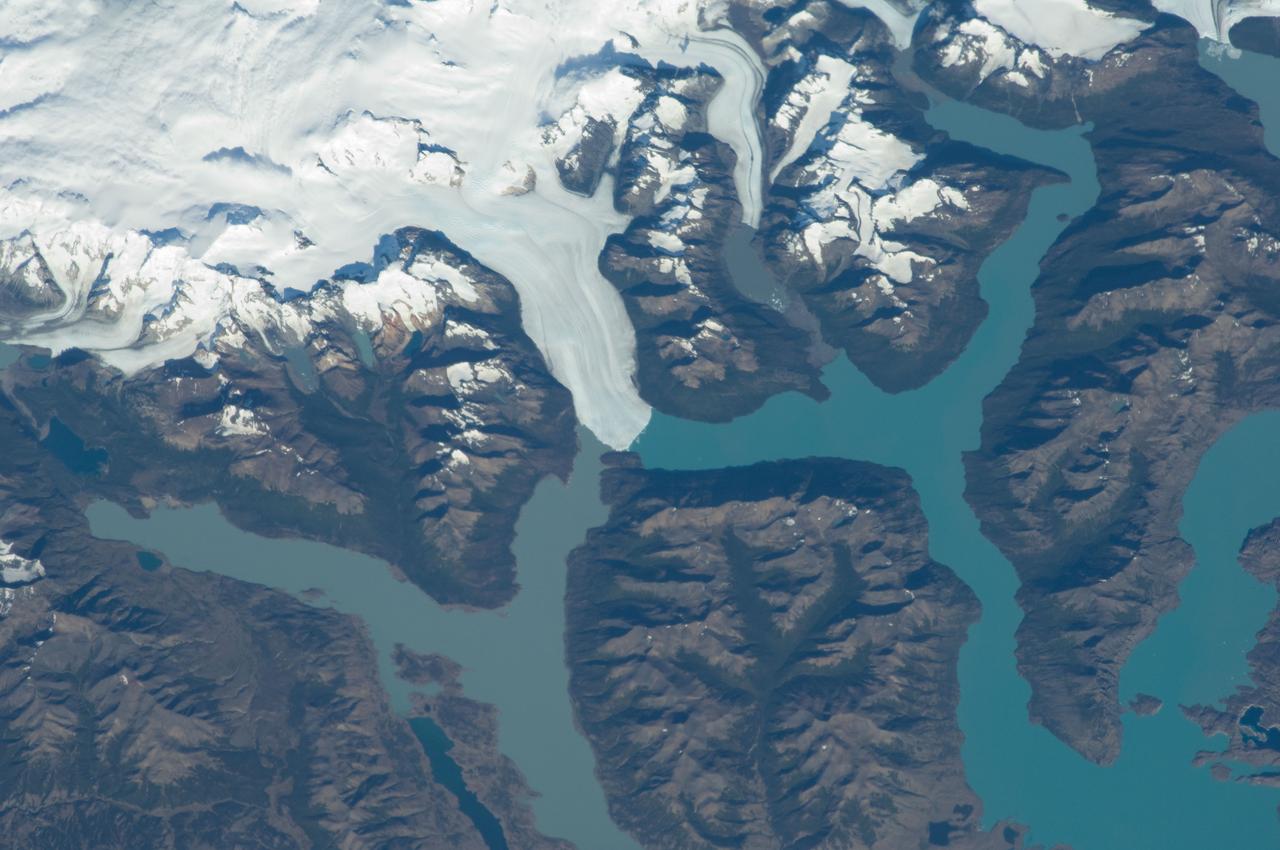
ISS030-E-091253 (21 Feb. 2012) --- Perito Moreno Glacier near Lake Argentino, Argentina is featured in this image photographed by an Expedition 30 crew member on the International Space Station. The largest glacier tongue in this image is known as the Perito Moreno Glacier (center). It descends from the Southern Patagonian Icefield (top) at great altitudes (greater than 2,100 meters, 6,825 feet) in the southern Andes Mountains, down into the water and warmer altitudes of Lake Argentino at approximately 180 meters above sea level. The glacier is 30 kilometers long (image width represents approximately 60 kilometers on the ground). Perito Moreno is one of the largest glaciers in Patagonia, and is perhaps the most famous for the fact that it periodically cuts off the major southern arm (known as Brazo Rico) of Lake Argentino completely from the rest of the lake. This is because the glacier advances right across the lake until it meets the opposite shoreline. The ice tongue is “grounded” (meaning that it is not floating, as occurs at the termini of glaciers and ice shelves where they enter the sea), thus forming a natural dam which prevents the lake water on either side from circulating, which in turn causes muddier, “milkier” water to concentrate in Brazo Rico. Sub-ice water, flows under the ice, not only carrying the mud into the lake but also helping lubricate the glacier’s downhill movement. Because of its effect as a dam, meltwater from the south raises water levels in Brazo Rico by as much as 30 meters above the level of the water in Lago Argentino. The great pressure of this higher water ultimately causes the ice tongue to rupture catastrophically, in a great natural spectacle. The last rupture took place in March 2012. The process then repeats, on average every four to five years, as the glacier starts to grow back towards the opposite shoreline. The repeatability of the rupture has contributed to the event becoming a major tourist attraction in the region.
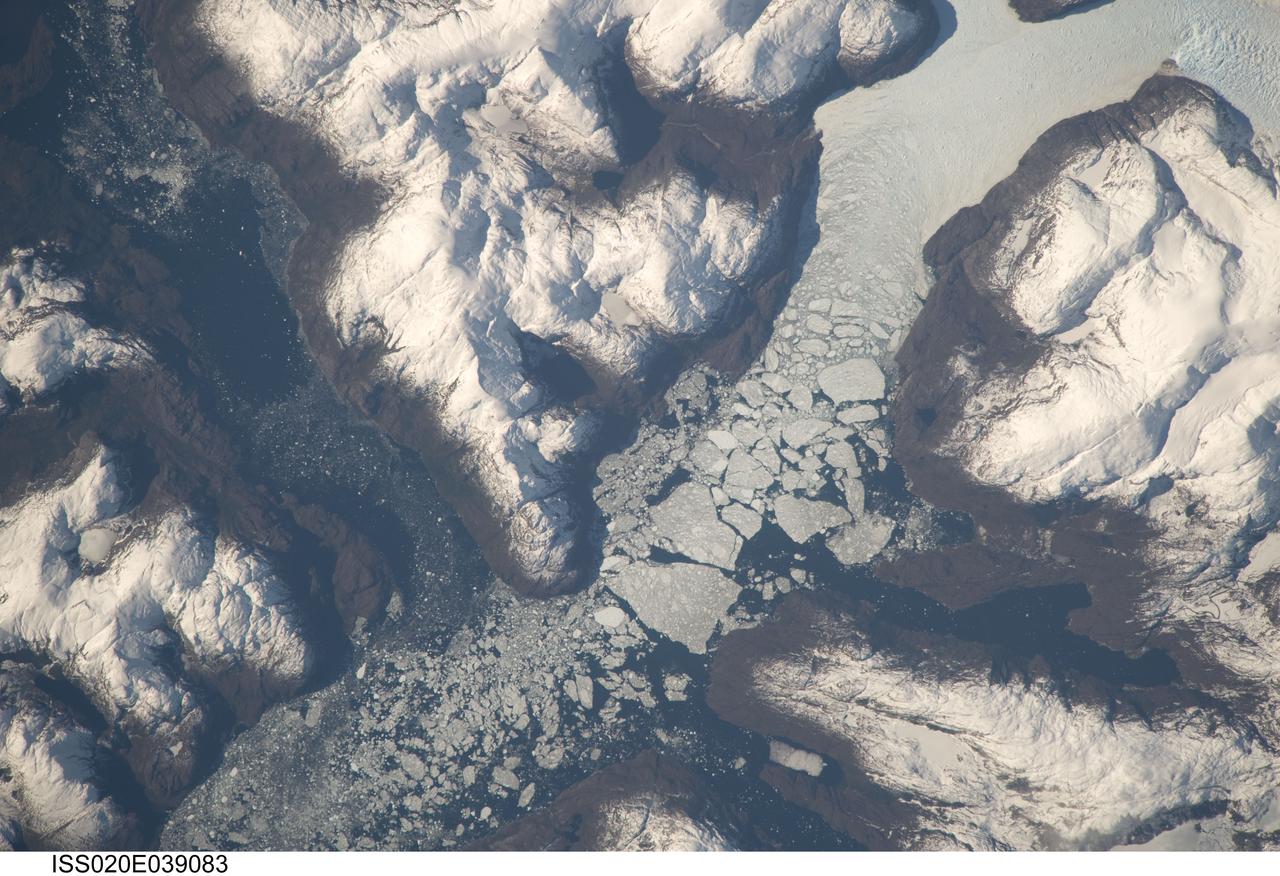
ISS020-E-039083 (6 Sept. 2009) --- Glacier outlet in the Southern Patagonian Ice Field of Chile is featured in this image photographed by an Expedition 20 crew member on the International Space Station. The Southern Patagonian Ice Field of Chile and Argentina hosts a spectacular array of glaciers and associated glacial features within the southern Andes Mountains. Glaciers flowing downhill on the eastern side of the mountains have outlets into several large freshwater lakes. On the western side of the mountains, glaciers release ice into the Pacific Ocean via an intricate network of fjords. Fjords are steep valleys originally cut by glaciers during periods of lower sea level that are now inundated. As glaciers flow into the fjord, ice at the front of the glacier begins to break off and form icebergs that can float out to sea ? a process known as calving. This detailed photograph shows the merged outlet of Penguin Glacier and HPS 19 into a fjord carved into the snow-covered mountains of the southern Andes. The designation HPS stands for Hielo Patagonico Sur (e.g. Southern Patagonian Ice field) and is used to identify glaciers that have no other geographic name. Ice flowing into the fjord begins to break up at center, forming numerous icebergs ? the largest visible in this image is approximately 2 kilometers in width. The large ice masses visible at center have a coarse granular appearance due to variable snow cover, and mixing and refreezing of ice fragments prior to floating free.
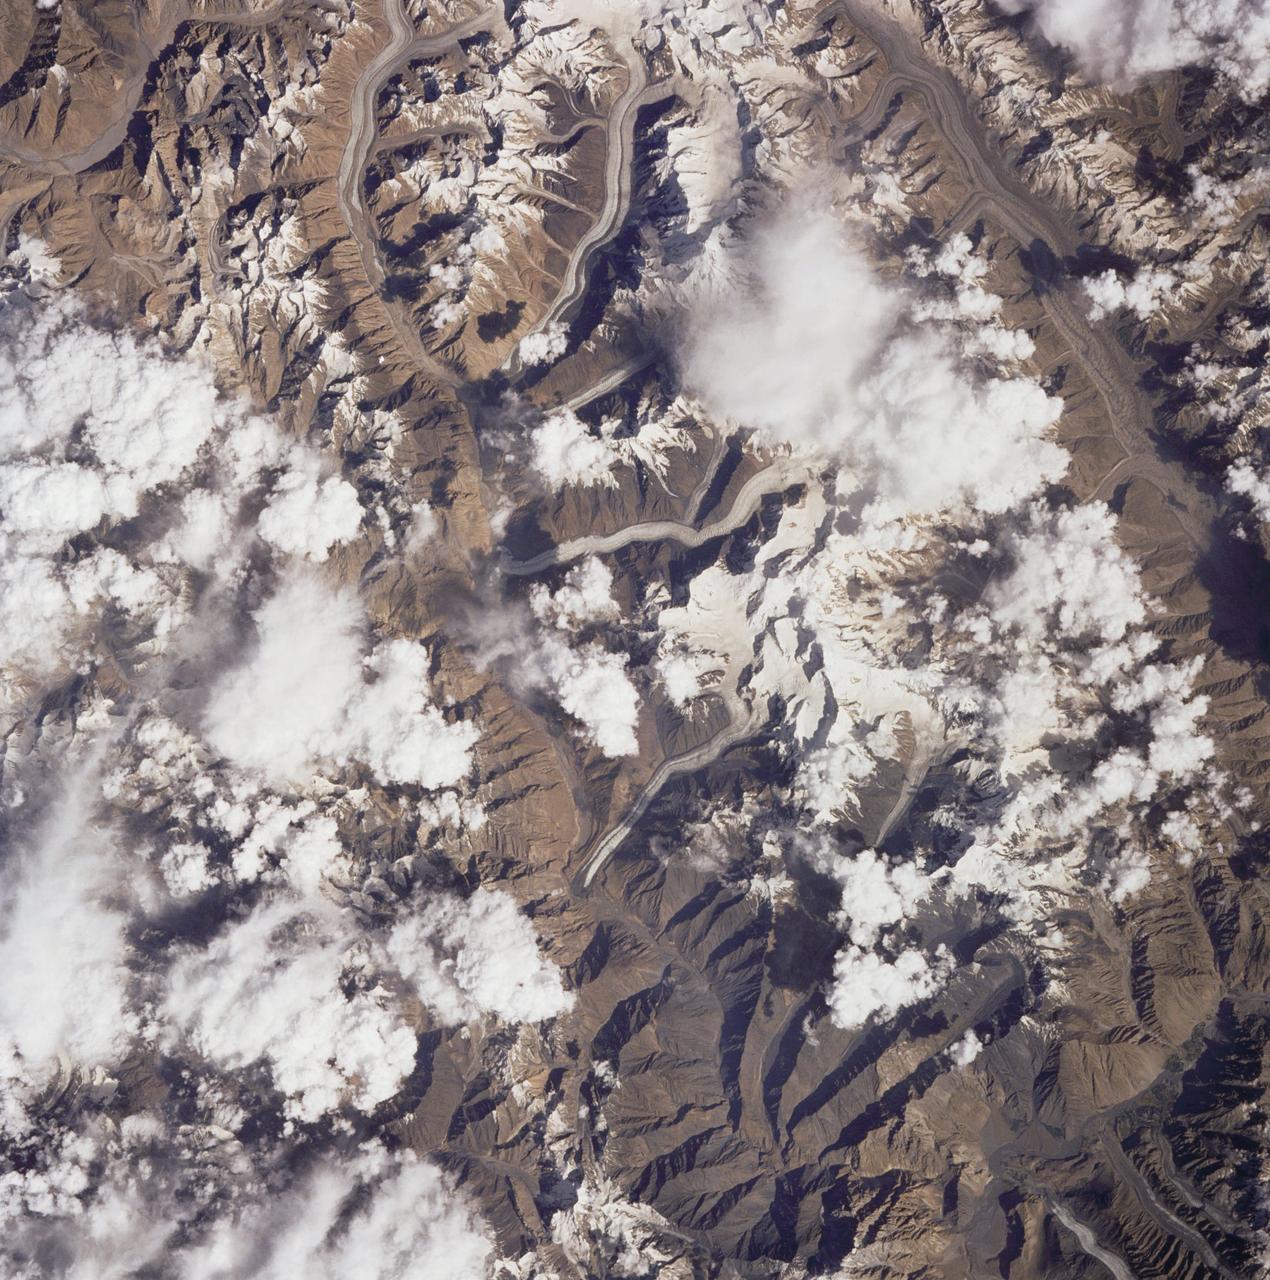
51F-40-017 (29 July-6 Aug 1985) --- The great peaks and massive system of glaciers of the Karakoram Range of northern Pakistan are seen in this unique photo. The area is just of the west of Mount Godwin-Austen with peaks up to 26,000 feet. The Hispar Glacier is at the lower right.