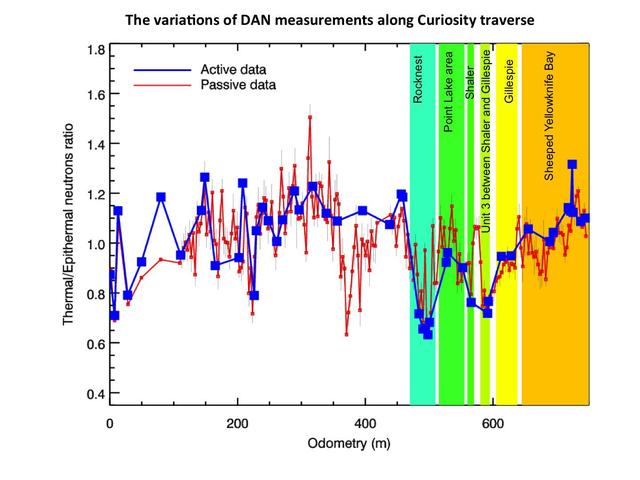
This chart graphs measurements made by the Dynamic Albedo of Neutrons DAN instrument on NASA Mars rover Curiosity against the distance the rover has driven, in meters.
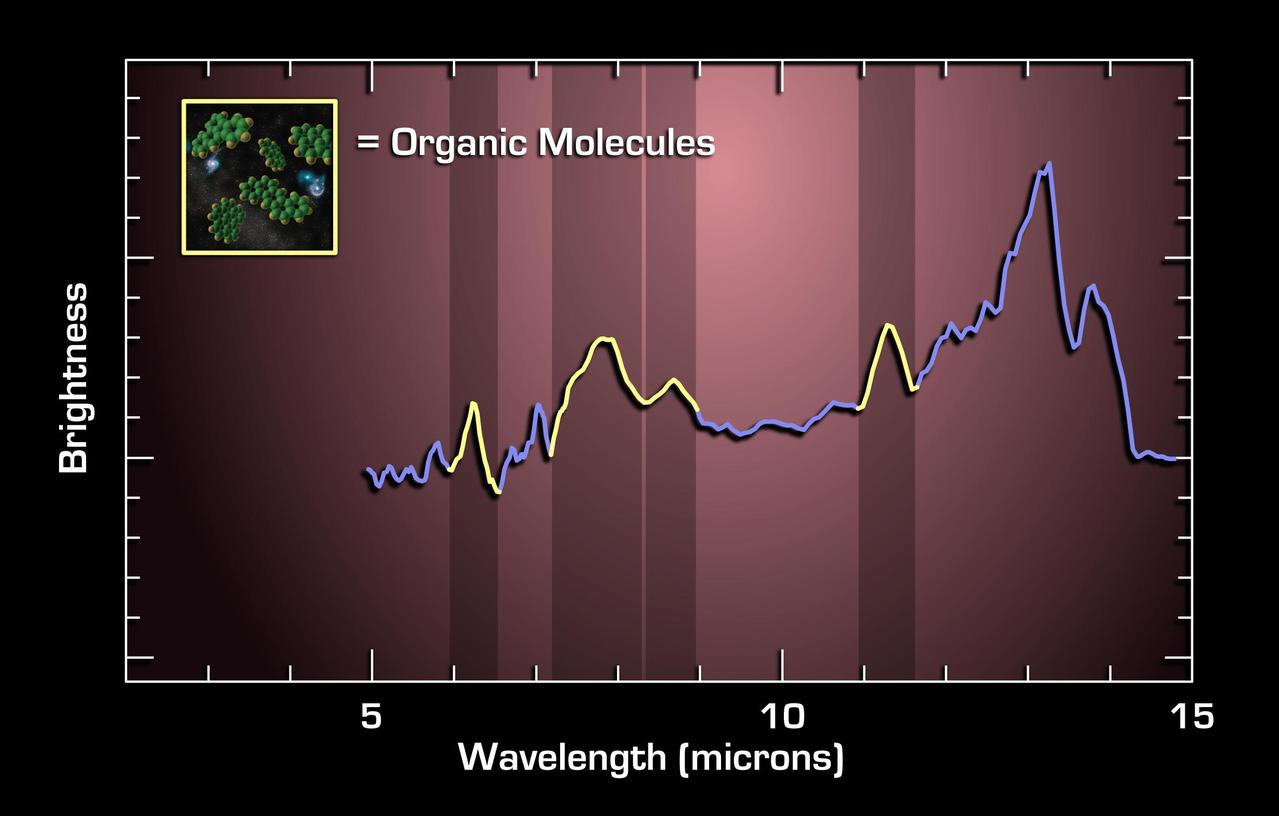
This graph, or spectrum, from NASA Spitzer Space Telescope, charts light from a faraway galaxy located 10 billion light years from Earth. It tracks mid-infrared light from an extremely luminous galaxy when the universe was only 1/4 of its current age.

Materials with a smaller mean atomic mass, such as lithium (Li) hydride and polyethylene, make the best radiation shields for astronauts. The materials have a higher density of nuclei and are better able to block incoming radiation. Also, they tend to produce fewer and less dangerous secondary particles after impact with incoming radiation.

S96-13558 (26 Aug 1996) --- Cosmonaut Aleksandr Y. Kaleri, Mir-22 flight engineer.

S96-13559 --- Leopold Eyharts represents France's space agency (CNES) as a member of the Mir-25 crew.
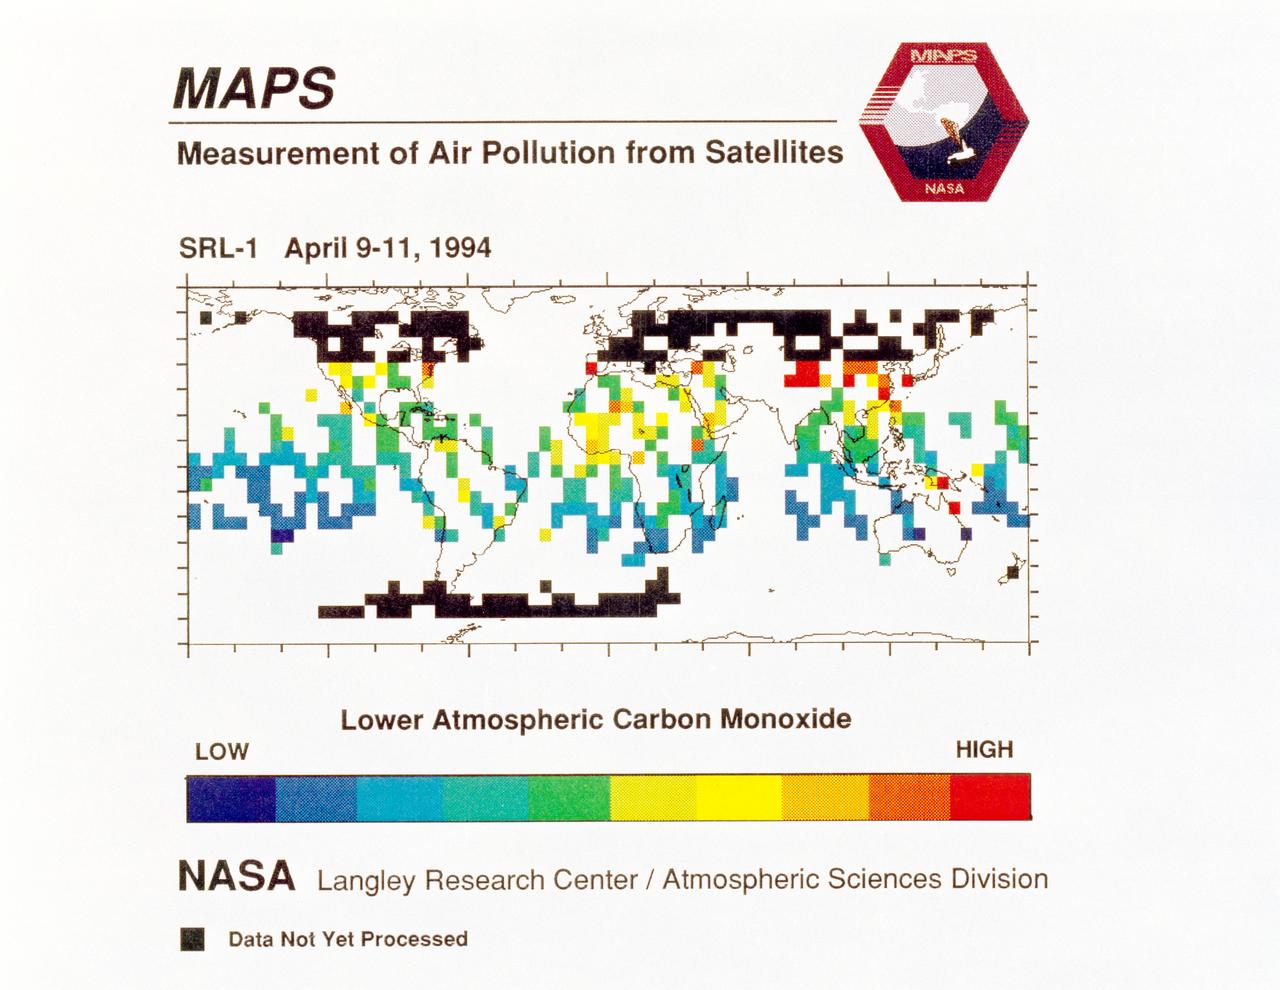
STS059-S-040 (12 April 1994) --- STS-59's MAPS (Measurement of Air Pollution from Satellites) experiment is sending real-time data that provides the most comprehensive view of carbon monoxide concentrations on Earth ever recorded. This computer image shows a summary of "quick look" data obtained by the MAPS instrument during its first days of operations as part of the Space Shuttle Endeavour's SRL-1 payload. This data will be processed using more sophisticated techniques following the flight. The color red indicates areas with the highest levels of carbon monoxide. These Northern Hemisphere springtime carbon monoxide values are generally significantly higher than the values found in the Southern Hemisphere. This is in direct contrast to the data obtained by the MAPS experiment during November 1981 and October 1984, i.e. during Northern Hemisphere fall. The astronauts aboard Endeavour have seen fires in most of the areas showing higher carbon monoxide values (China, Eastern Australia, and equatorial Africa). The relationship between the observed fires and the higher carbon monoxide values will be investigated following SRL-1 by combining the MAPS data with meteorological data, surface imagery, and Space Shuttle hand-held photographs. By the end of SRL-1, MAPS will have acquired data over most of the globe between 57 degrees north and 57 degrees south latitudes. The entire data set will be carefully analyzed using sophisticated post-flight data processing techniques. The data will then be applied in a variety of scientific studies concerning chemistry and transport processes in the atmosphere. The MAPS experiment measures the carbon monoxide in the lower atmosphere. This gas is produced both as a result of natural processes and as a result of human activities. The primary human resources of carbon monoxide are automobiles and industry and the burning of plant materials. The primary natural source is the interaction of sunlight with naturally occurring ozone and water vapor. The strength of all of these sources changes seasonally.
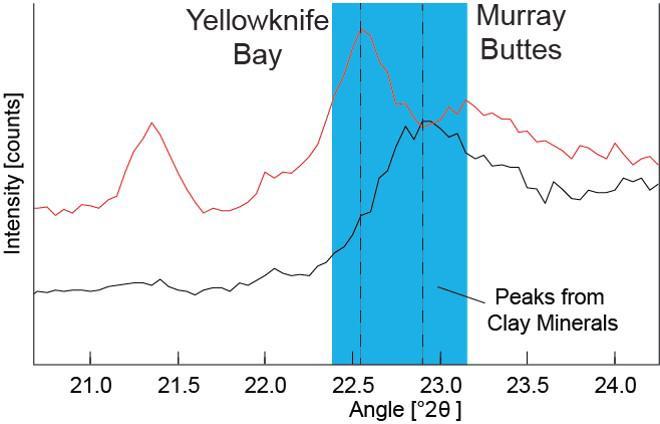
Data graphed here from the Chemistry and Camera (CheMin) instrument on NASA's Mars Curiosity rover show a difference between clay minerals in powder drilled from mudstone outcrops at two locations in Mars' Gale Crater: "Yellowknife Bay" and "Murray Buttes." CheMin's X-ray diffraction analysis reveals information about the crystalline structure of minerals in the rock. The intensity peaks marked with dotted vertical lines in this chart indicate that the crystalline structure of the two sites' clay minerals differs. The difference can be tied to a compositional difference in the clay minerals, as depicted in a diagram at PIA21148. The Yellowknife Bay site is on the floor of Gale Crater. The Murray Buttes site is on lower Mount Sharp, the layered mound in the center of the crater. http://photojournal.jpl.nasa.gov/catalog/PIA21147
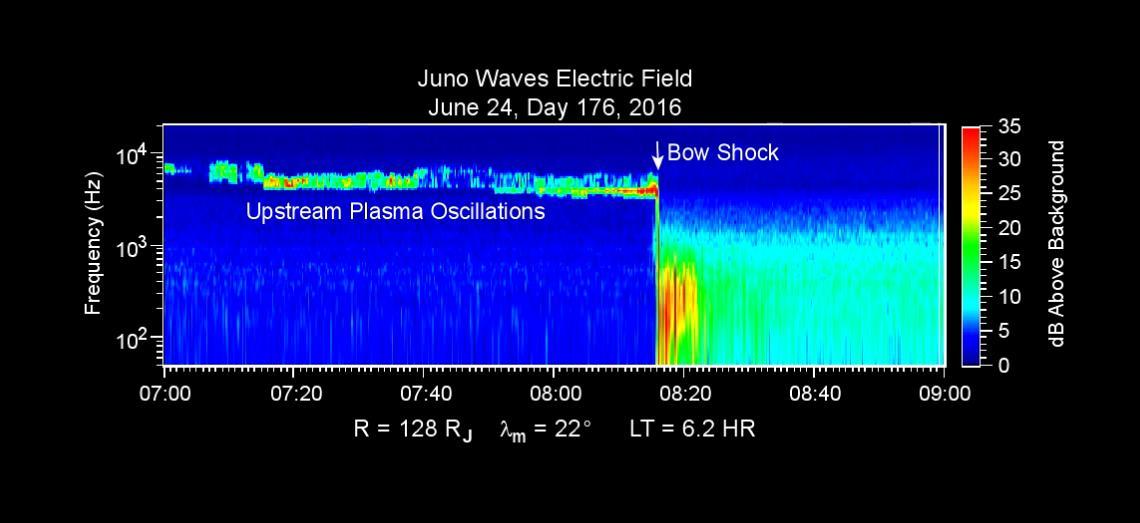
This chart presents data that the Waves investigation on NASA's Juno spacecraft recorded as the spacecraft crossed the bow shock just outside of Jupiter's magnetosphere on June 24, 2016, while approaching Jupiter. Audio accompanies the animation, with volume and pitch correlated to the amplitude and frequency of the recorded waves. The graph is a frequency-time spectrogram with color coding to indicate wave amplitudes as a function of wave frequency (vertical axis, in hertz) and time (horizontal axis, with a total elapsed time of two hours). During the hour before Juno reached the bow shock, the Waves instrument was detecting mainly plasma oscillations just below 10,000 hertz (10 kilohertz). The frequency of these oscillations is related to the local density of electrons; the data yield an estimate of approximately one electron per cubic centimeter (about 16 per cubic inch) in this region just outside Jupiter's bow shock. The broadband burst of noise marked "Bow Shock" is the region of turbulence where the supersonic solar wind is heated and slowed by encountering the Jovian magnetosphere. The shock is analogous to a sonic boom generated in Earth's atmosphere by a supersonic aircraft. The region after the shock is called the magnetosheath. The vertical bar to the right of the chart indicates the color coding of wave amplitude, in decibels (dB) above the background level detected by the Waves instrument. Each step of 10 decibels marks a tenfold increase in wave power. When Juno collected these data, the distance from the spacecraft to Jupiter was about 5.56 million miles (8.95 million kilometers), indicated on the chart as 128 times the radius of Jupiter. Jupiter's magnetic field is tilted about 10 degrees from the planet's axis of rotation. The note of 22 degrees on the chart indicates that at the time these data were recorded, the spacecraft was 22 degrees north of the magnetic-field equator. The "LT" notation is local time on Jupiter at the longitude of the planet directly below the spacecraft, with a value of 6.2 indicating approximately dawn. http://photojournal.jpl.nasa.gov/catalog/PIA20753
This chart presents data that the Waves investigation on NASA's Juno spacecraft recorded as the spacecraft crossed the bow shock just outside of Jupiter's magnetosphere on June 24, 2016, while approaching Jupiter. Audio accompanies the animation, with volume and pitch correlated to the amplitude and frequency of the recorded waves. The graph is a frequency-time spectrogram with color coding to indicate wave amplitudes as a function of wave frequency (vertical axis, in hertz) and time (horizontal axis, with a total elapsed time of two hours). During the hour before Juno reached the bow shock, the Waves instrument was detecting mainly plasma oscillations just below 10,000 hertz (10 kilohertz). The frequency of these oscillations is related to the local density of electrons; the data yield an estimate of approximately one electron per cubic centimeter (about 16 per cubic inch) in this region just outside Jupiter's bow shock. The broadband burst of noise marked "Bow Shock" is the region of turbulence where the supersonic solar wind is heated and slowed by encountering the Jovian magnetosphere. The shock is analogous to a sonic boom generated in Earth's atmosphere by a supersonic aircraft. The region after the shock is called the magnetosheath. The vertical bar to the right of the chart indicates the color coding of wave amplitude, in decibels (dB) above the background level detected by the Waves instrument. Each step of 10 decibels marks a tenfold increase in wave power. When Juno collected these data, the distance from the spacecraft to Jupiter was about 5.56 million miles (8.95 million kilometers), indicated on the chart as 128 times the radius of Jupiter. Jupiter's magnetic field is tilted about 10 degrees from the planet's axis of rotation. The note of 22 degrees on the chart indicates that at the time these data were recorded, the spacecraft was 22 degrees north of the magnetic-field equator. The "LT" notation is local time on Jupiter at the longitude of the planet directly below the spacecraft, with a value of 6.2 indicating approximately dawn. http://photojournal.jpl.nasa.gov/catalog/PIA20753