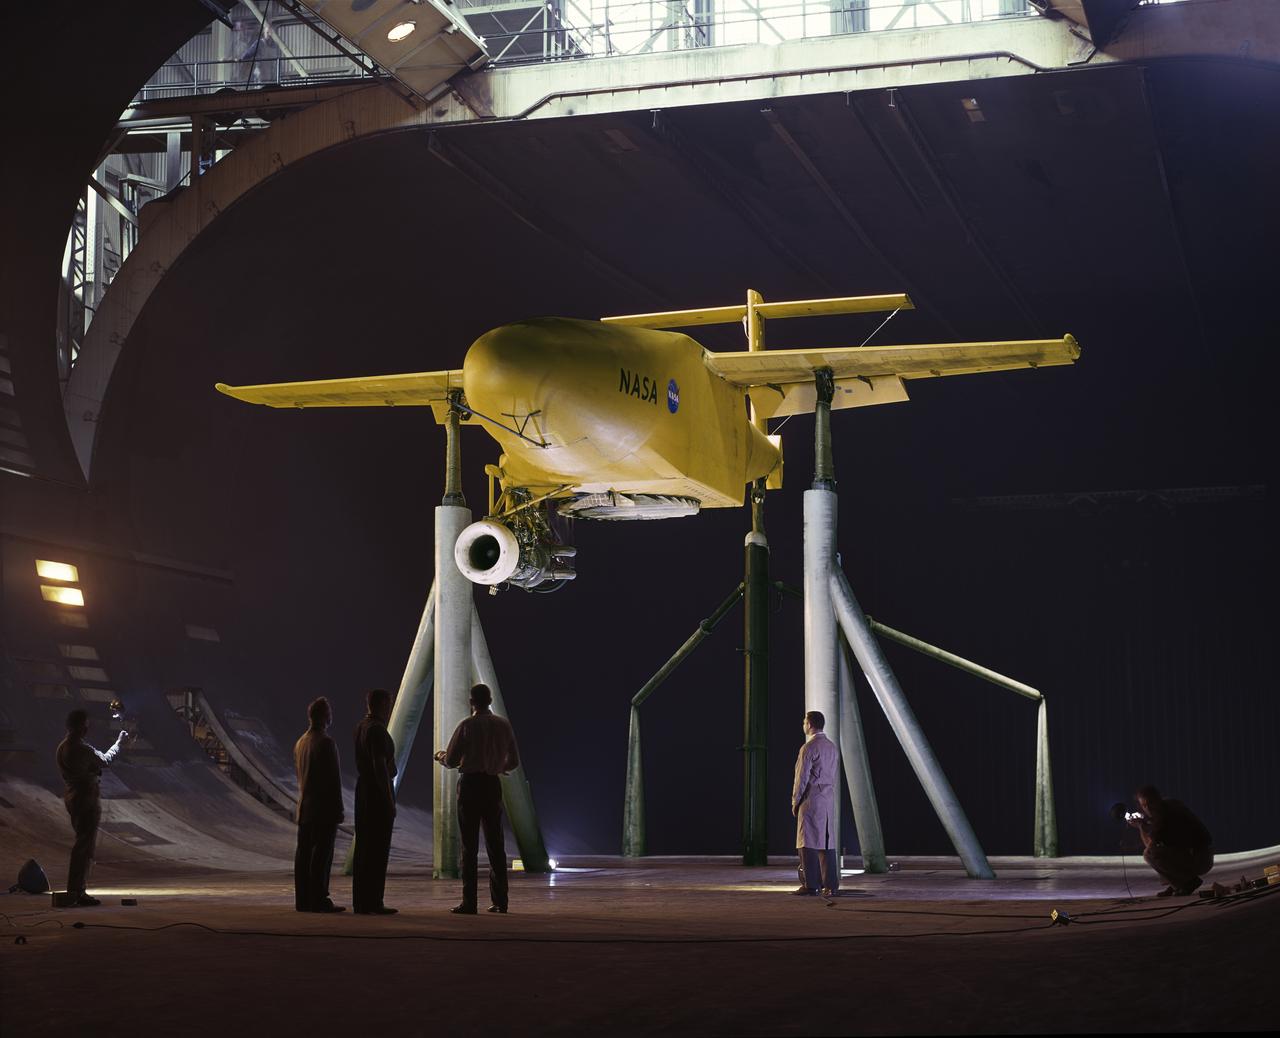
3/4 Low front view of fuselage and fan. Showing jet engine hanging below. Lift fan powered by jet exhaust. General Aerodynamic Characteristics of a Research Model with High Disk Loading Direct Lifting Fan Mounted in Fuselage
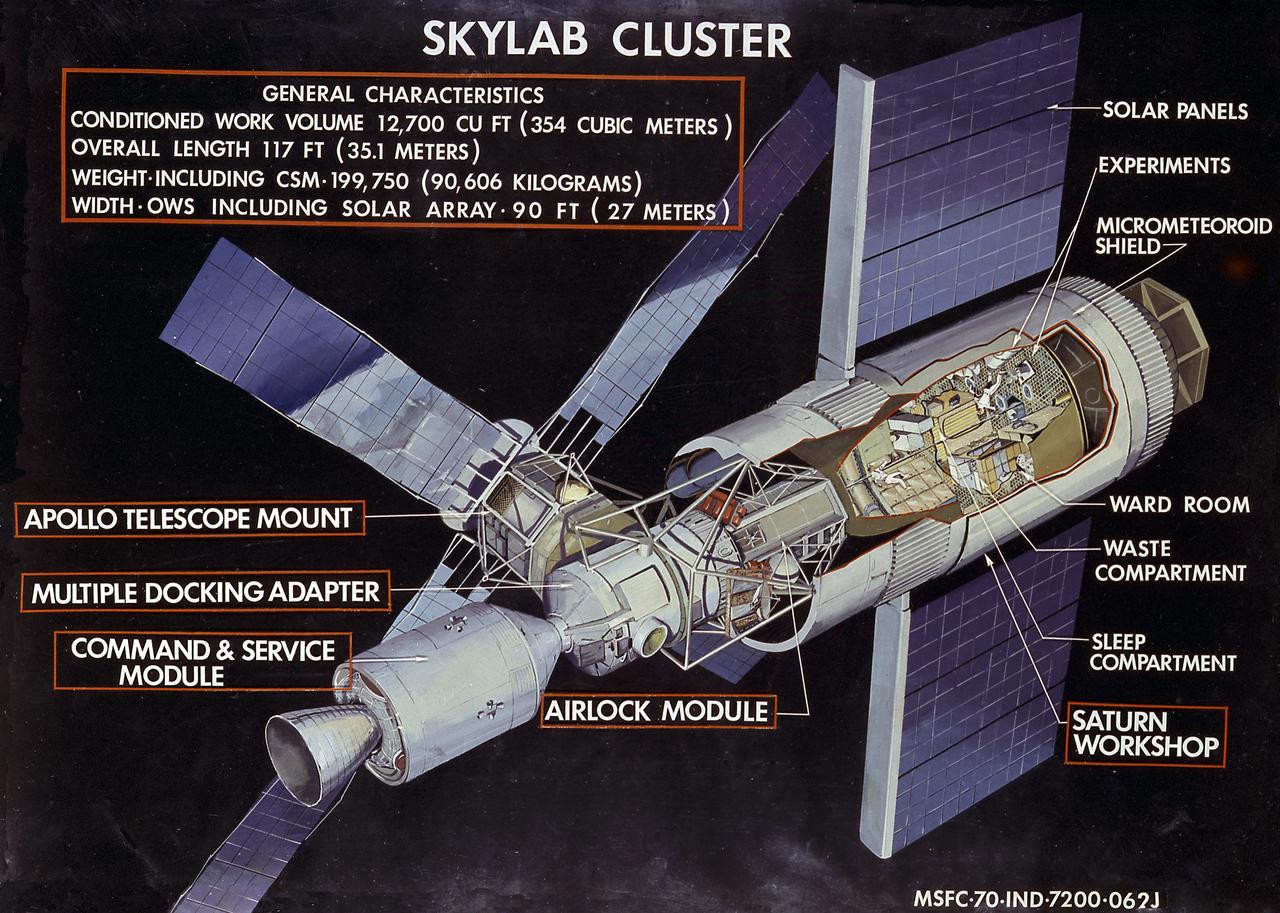
This illustration shows general characteristics of the Skylab with callouts of its major components. In an early effort to extend the use of Apollo for further applications, NASA established the Apollo Applications Program (AAP) in August of 1965. The AAP was to include long duration Earth orbital missions during which astronauts would carry out scientific, technological, and engineering experiments in space by utilizing modified Saturn launch vehicles and the Apollo spacecraft. Established in 1970, the Skylab Program was the forerurner of the AAP. The goals of the Skylab were to enrich our scientific knowledge of the Earth, the Sun, the stars, and cosmic space; to study the effects of weightlessness on living organisms, including man; to study the effects of the processing and manufacturing of materials utilizing the absence of gravity; and to conduct Earth resource observations. The Skylab also conducted 19 selected experiments submitted by high school students. Skylab's 3 different 3-man crews spent up to 84 days in Earth orbit. The Marshall Space Flight Center (MSFC) had responsibility for developing and integrating most of the major components of the Skylab: the Orbital Workshop (OWS), Airlock Module (AM), Multiple Docking Adapter (MDA), Apollo Telescope Mount (ATM), Payload Shroud (PS), and most of the experiments. MSFC was also responsible for providing the Saturn IB launch vehicles for three Apollo spacecraft and crews and a Saturn V launch vehicle for the Skylab.
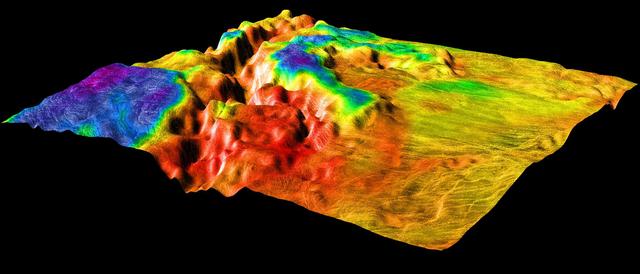
This perspective view of Venus, generated by computer from NASA Magellan data and color-coded with emissivity, shows the boundary between the lowland plains and characteristic Venusian highland terrain in Ovda Region. http://photojournal.jpl.nasa.gov/catalog/PIA00311
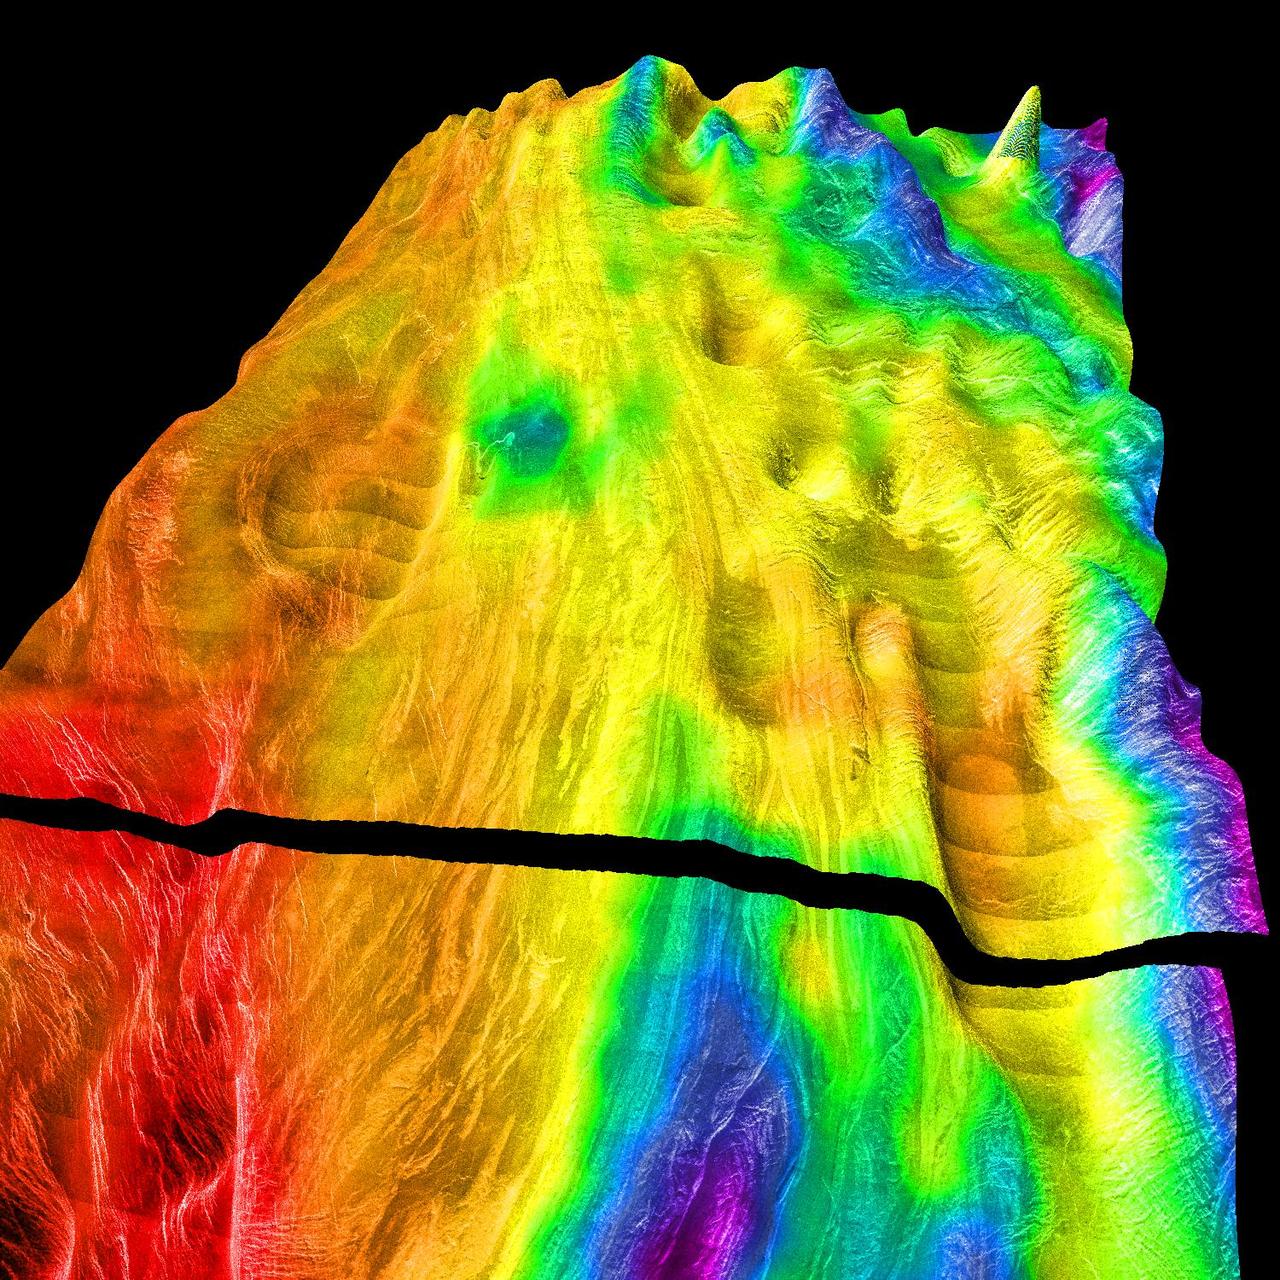
This perspective view of Venus, generated by computer from NASA Magellan data and color-coded with emissivity, shows the boundary between the lowland plains and characteristic Venusian highland terrain in Ovda Regio. http://photojournal.jpl.nasa.gov/catalog/PIA00309
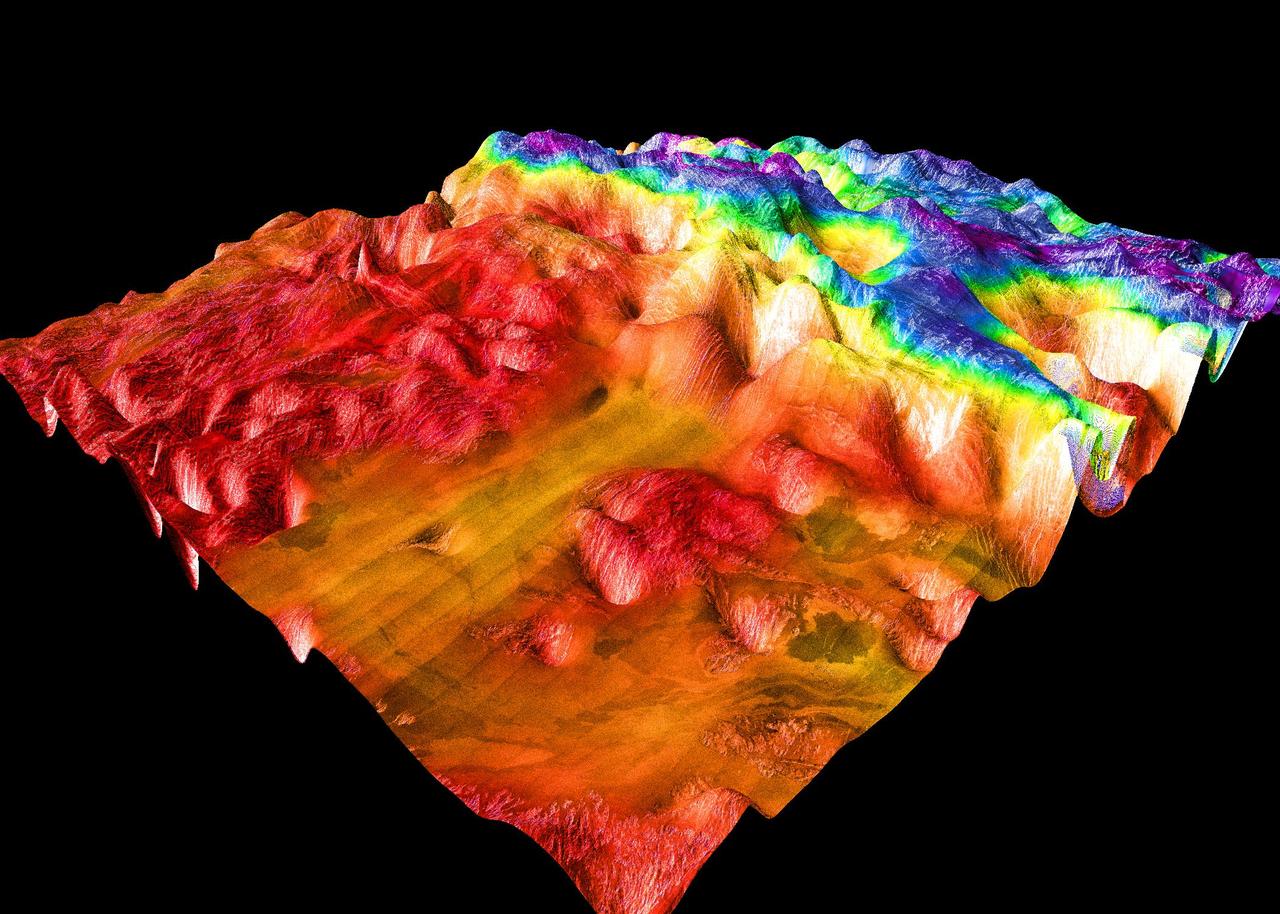
This perspective view of Venus, generated by computer from NASA Magellan data and color-coded with emissivity, shows the boundary between the lowland plains and characteristic Venusian highland terrain in Ovda Regio. http://photojournal.jpl.nasa.gov/catalog/PIA00310
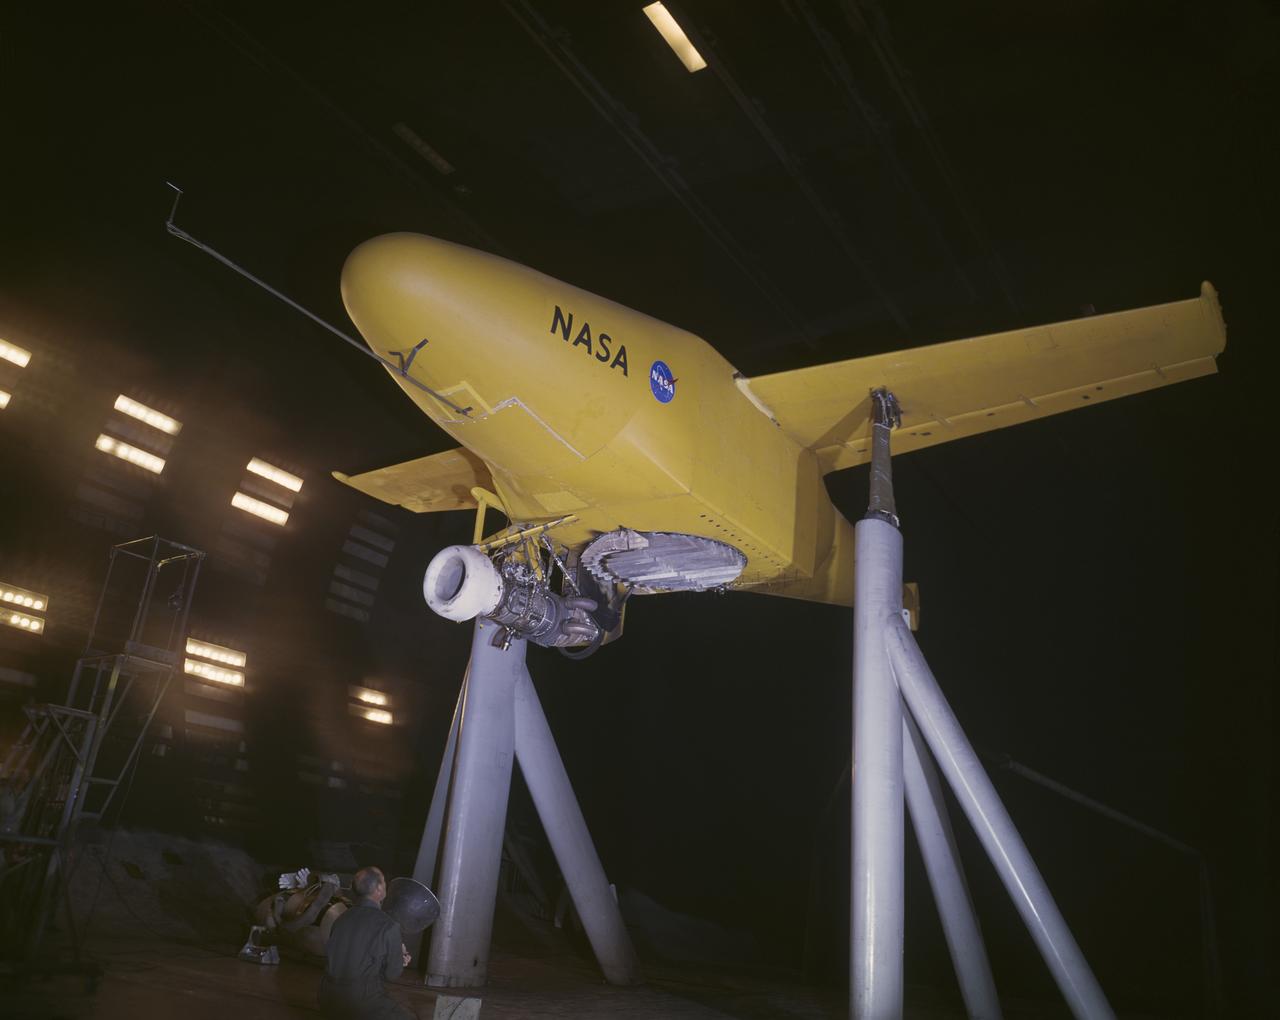
3/4 Low front view of fuselage and fan. Showing jet engine hanging below. Lift fan powered by jet exhaust.
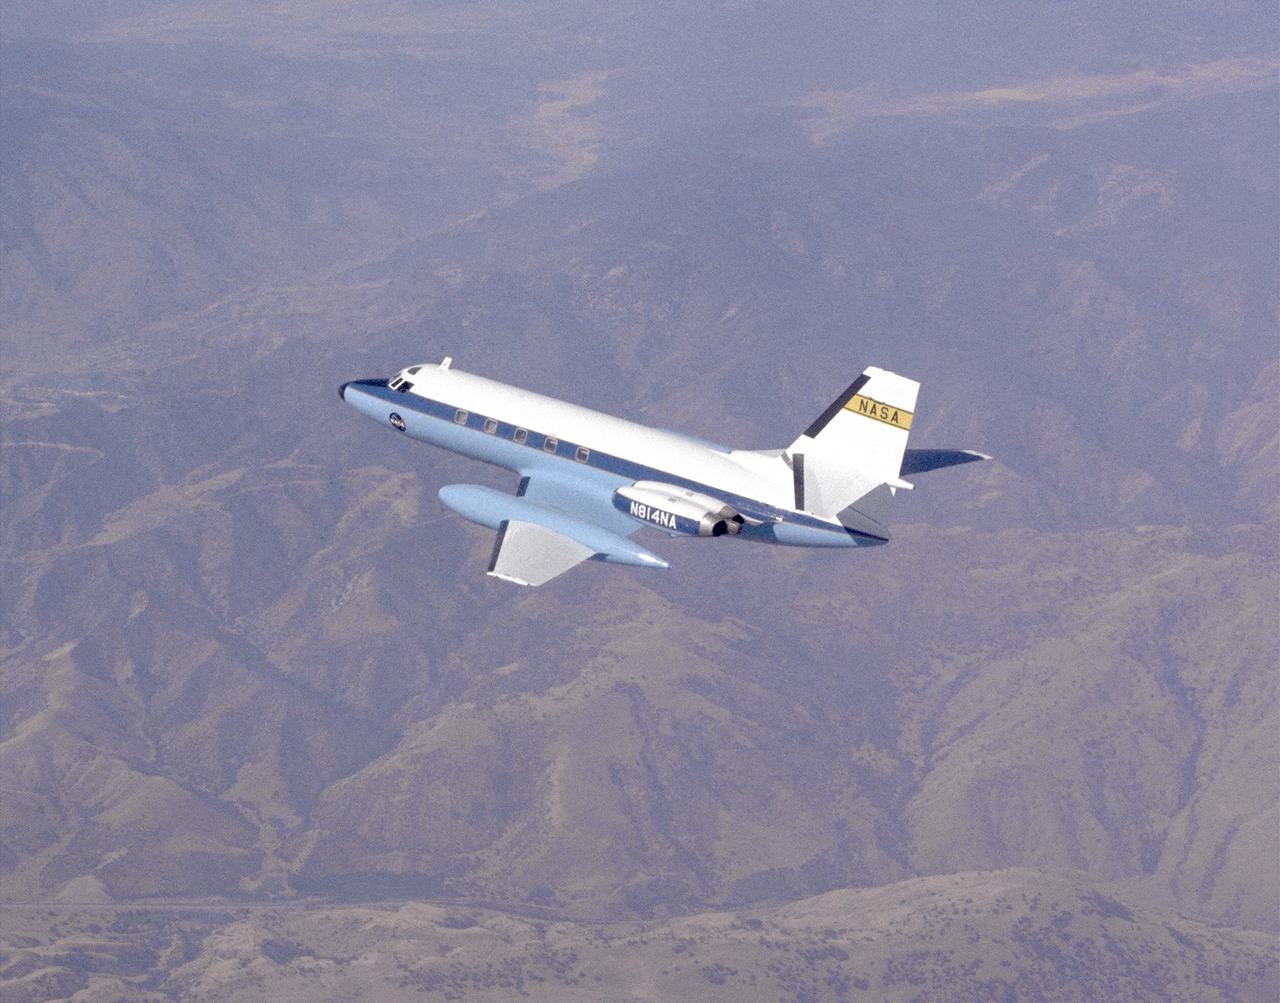
The C-140 JetStar was reconfigured as the General Purpose Airborne Simulator (GPAS) to simulate the flight characteristics of other aircraft. The JetStar was used for research for supersonic transports, general aviation aircraft, and as a training support aircraft for the Space Shuttle Approach and Landing tests at Dryden Flight Research Center (under different names) at Edwards, CA, in 1977. One of the engineers on the GPAS program was Ken Szalai, who later became Dryden's director from 1990 to August 1998.
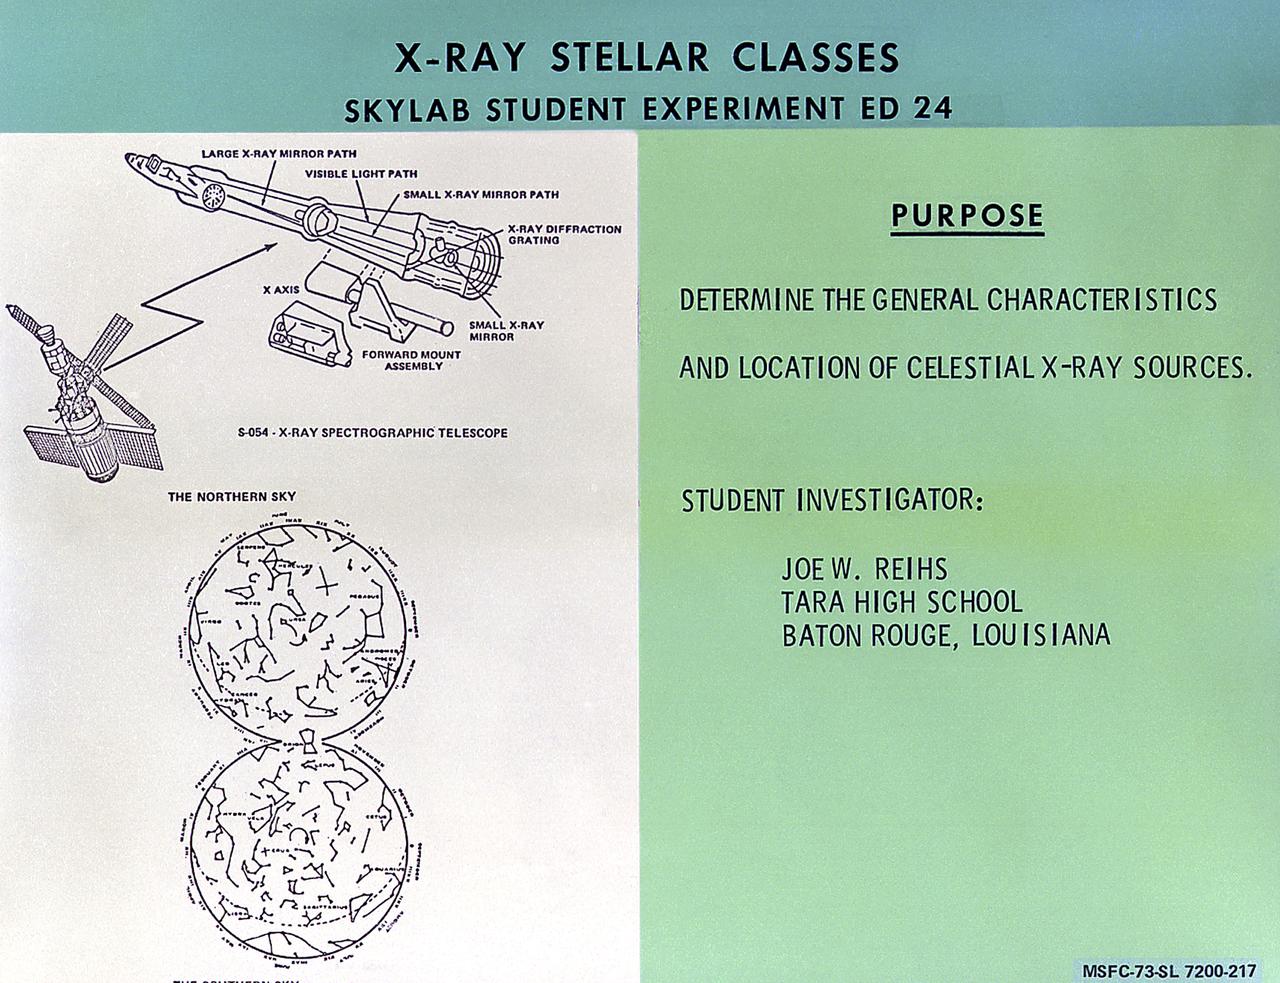
This chart describes the Skylab student experiment X-Ray Stellar Classes, proposed by Joe Reihs of Baton Rouge, Louisiana. This experiment utilized Skylab's X-Ray Spectrographic Telescope to observe and determine the general characteristics and location of x-ray sources. In March 1972, NASA and the National Science Teachers Association selected 25 experiment proposals for flight on Skylab. Science advisors from the Marshall Space Flight Center aided and assisted the students in developing the proposals for flight on Skylab.
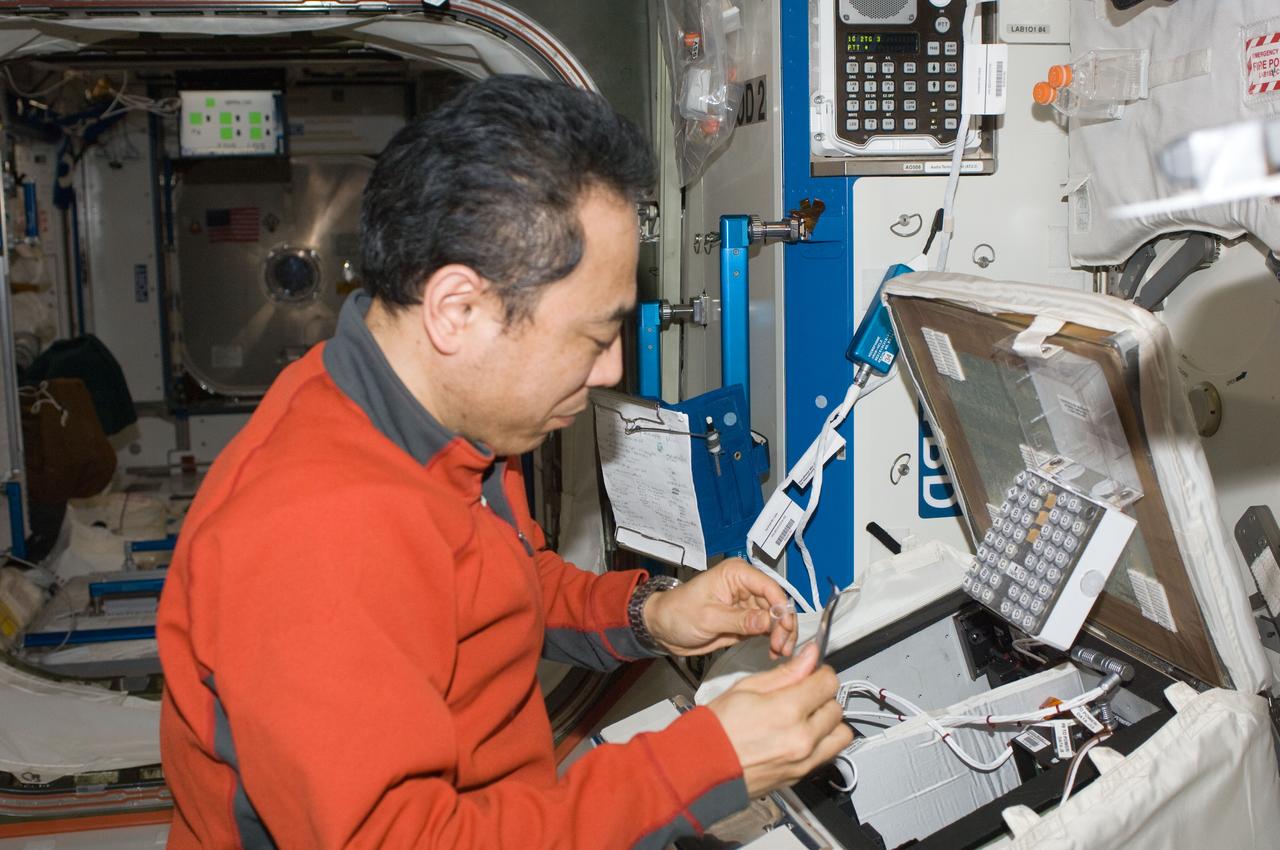
ISS029-E-011813 (29 Sept. 2011) --- In the International Space Station?s Destiny laboratory, Japan Aerospace Exploration Agency astronaut Satoshi Furukawa, Expedition 29 flight engineer, services the Science Insert 5/Plant Habitat (CSI-05 PHAB) in the Commercial Generic Bioprocessing Apparatus (CGBA-5). The CSI-05 plant experiment focuses on characteristics associated with successful germination in space.
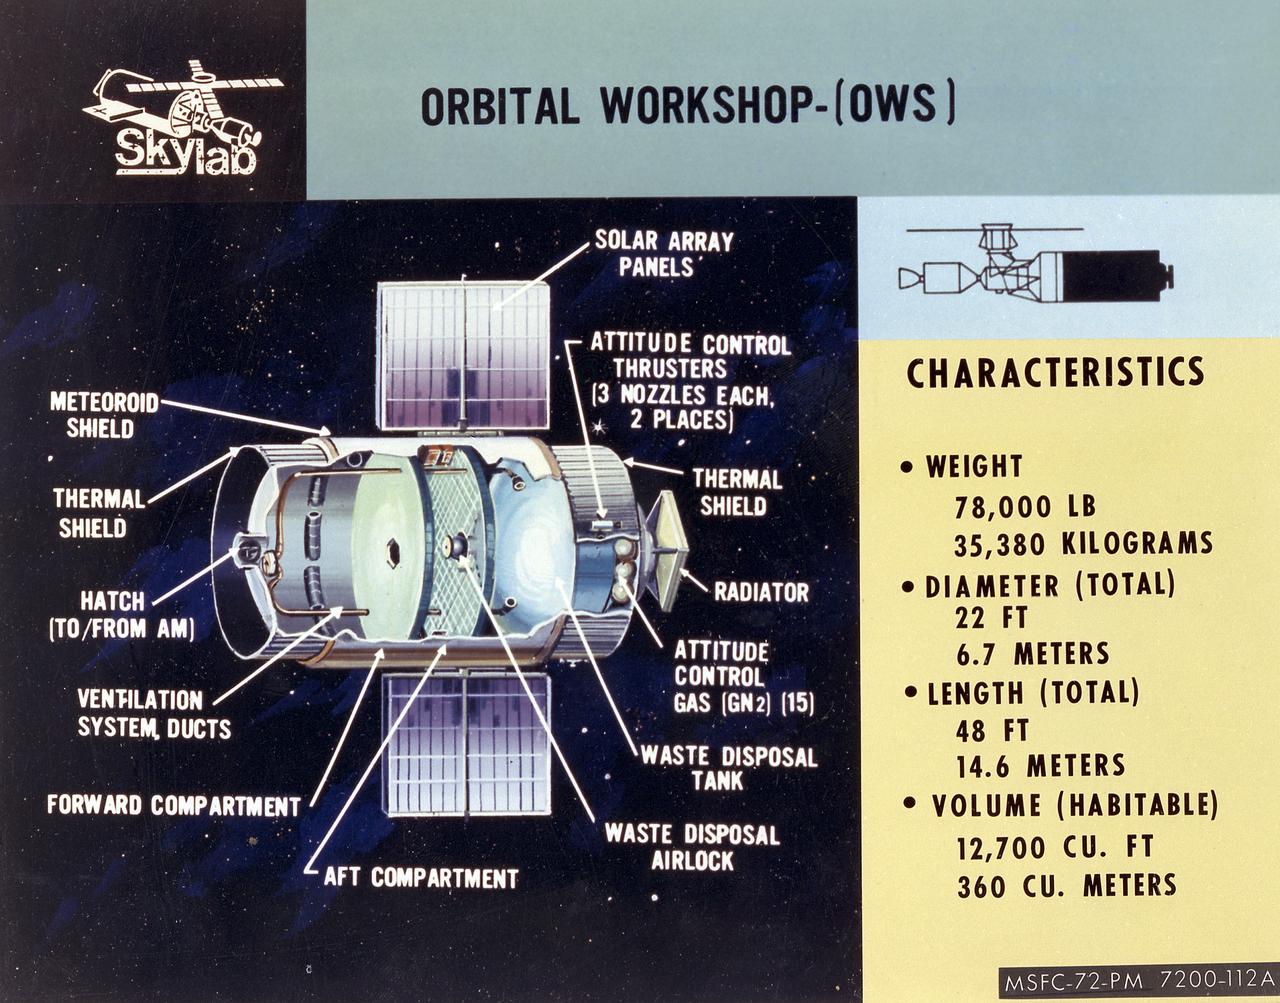
This cutaway illustration shows the characteristics and basic elements of the Skylab Orbiter Workshop (OWS). The OWS was divided into two major compartments. The lower level provided crew accommodations for sleeping, food preparation and consumption, hygiene, waste processing and disposal, and performance of certain experiments. The upper level consisted of a large work area and housed water storage tanks, a food freezer, storage vaults for film, scientific airlocks, mobility and stability experiment equipment, and other experimental equipment. The compartment below the crew quarters was a container for liquid and solid waste and trash accumulated throughout the mission. A solar array, consisting of two wings covered on one side with solar cells, was mounted outside the workshop to generate electrical power to augment the power generated by another solar array mounted on the solar observatory. Thrusters were provided at one end of the workshop for short-term control of the attitude of the space station.
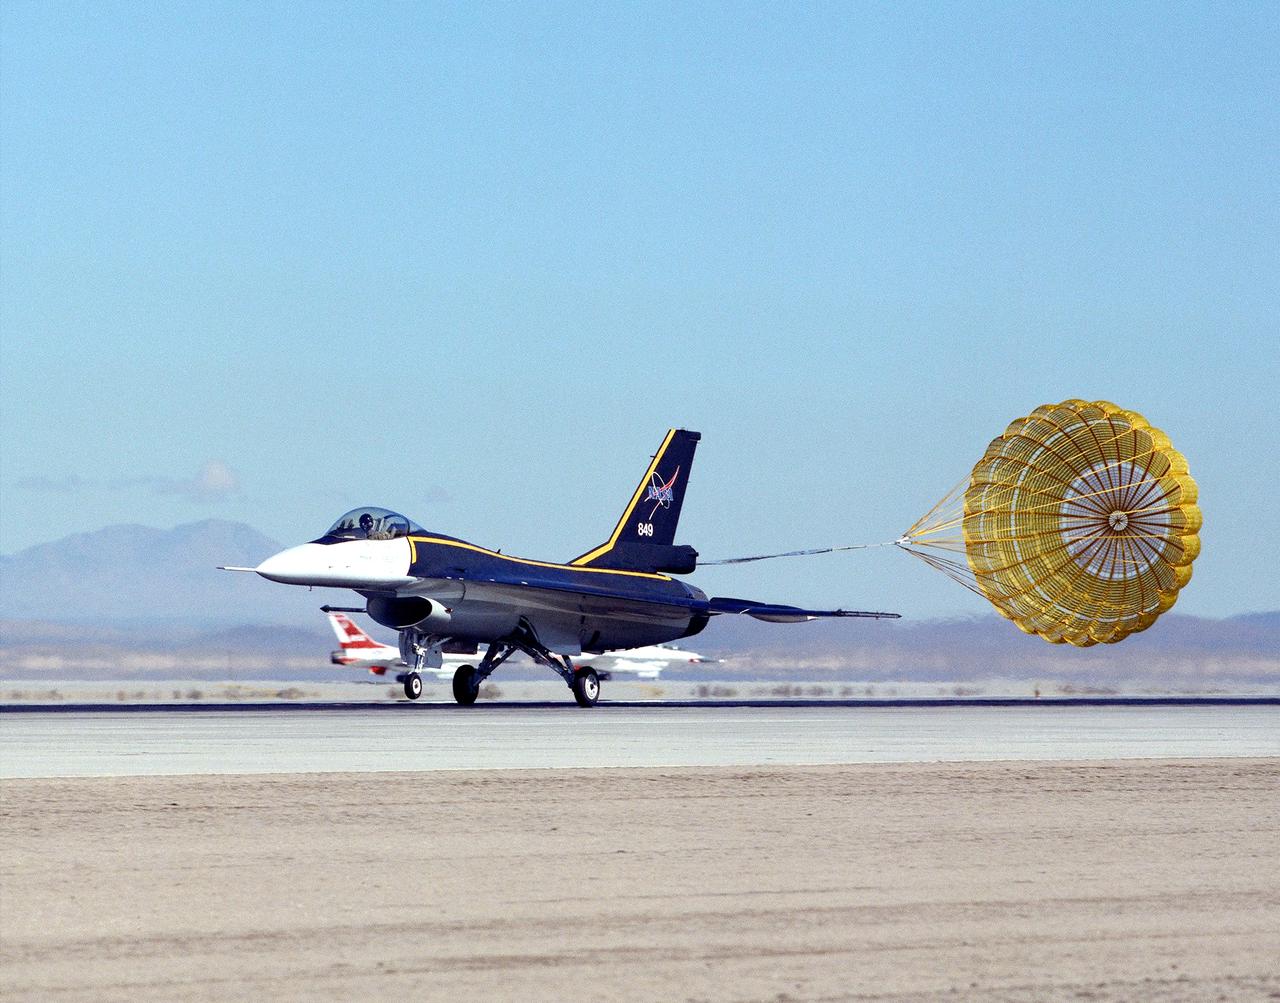
NASA's single-seat F-16XL makes a drag chute landing at the Dryden Flight Research Center, Edwards, California. The aircraft was most recently used in the Cranked-Arrow Wing Aerodynamics Project (CAWAP) to test boundary layer pressures and distribution. Previously it had been used in a program to investigate the characteristics of sonic booms for NASA's High Speed Research Program. Data from the program will be used in the development of a high speed civilian transport. During the series of sonic boom research flights, the F-16XL was used to probe the shock waves being generated by a NASA SR-71 and record their shape and intensity.
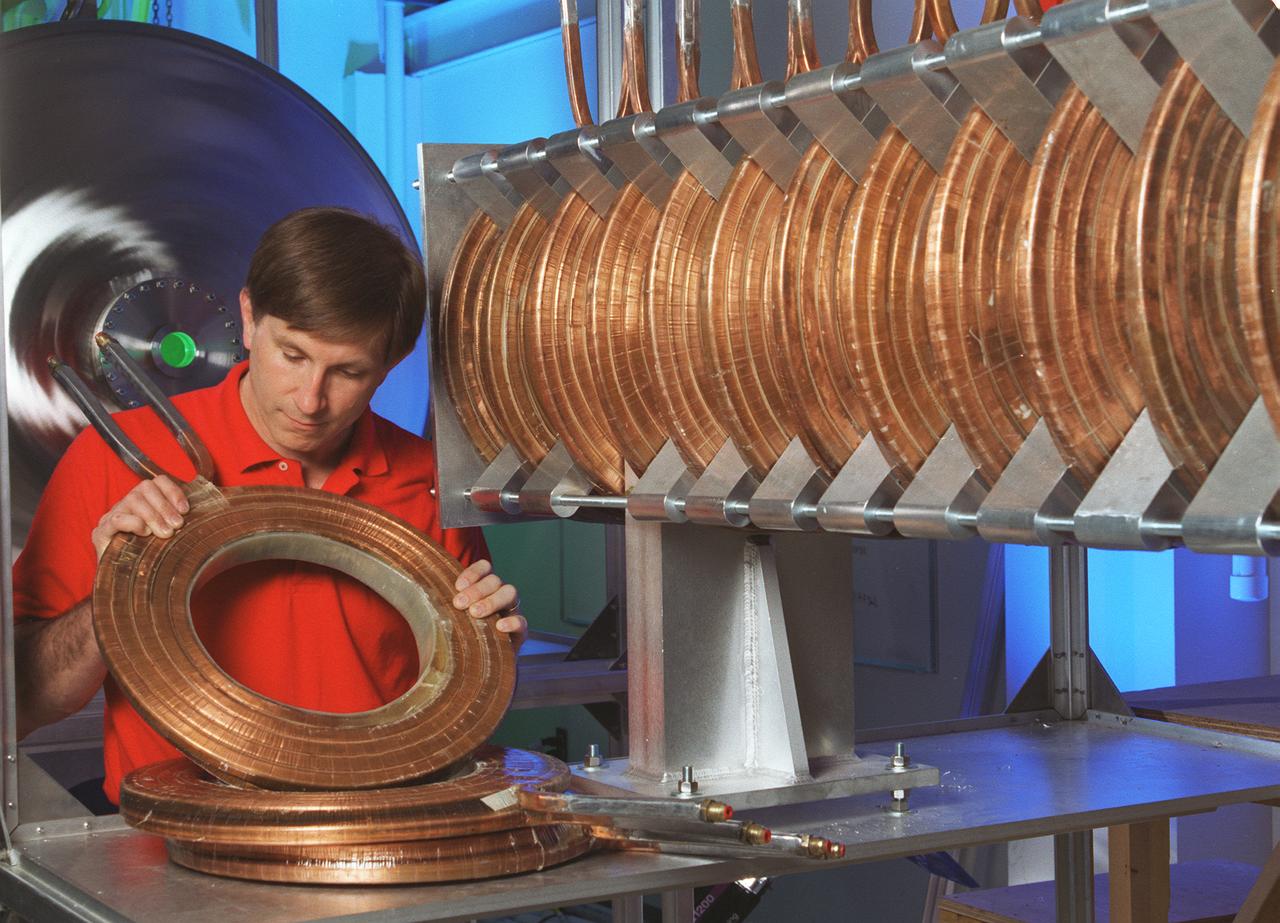
The Gasdynamic Mirror, or GDM, is an example of a magnetic mirror-based fusion propulsion system. Its design is primarily consisting of a long slender solenoid surrounding a vacuum chamber that contains plasma. The bulk of the fusion plasma is confined by magnetic field generated by a series of toroidal-shaped magnets in the center section of the device. the purpose of the GDM Fusion Propulsion Experiment is to confirm the feasibility of the concept and to demonstrate many of the operational characteristics of a full-size plasma can be confined within the desired physical configuration and still reman stable. This image shows an engineer from Propulsion Research Technologies Division at Marshall Space Flight Center inspecting solenoid magnets-A, an integrate part of the Gasdynamic Mirror Fusion Propulsion Engine Experiment.
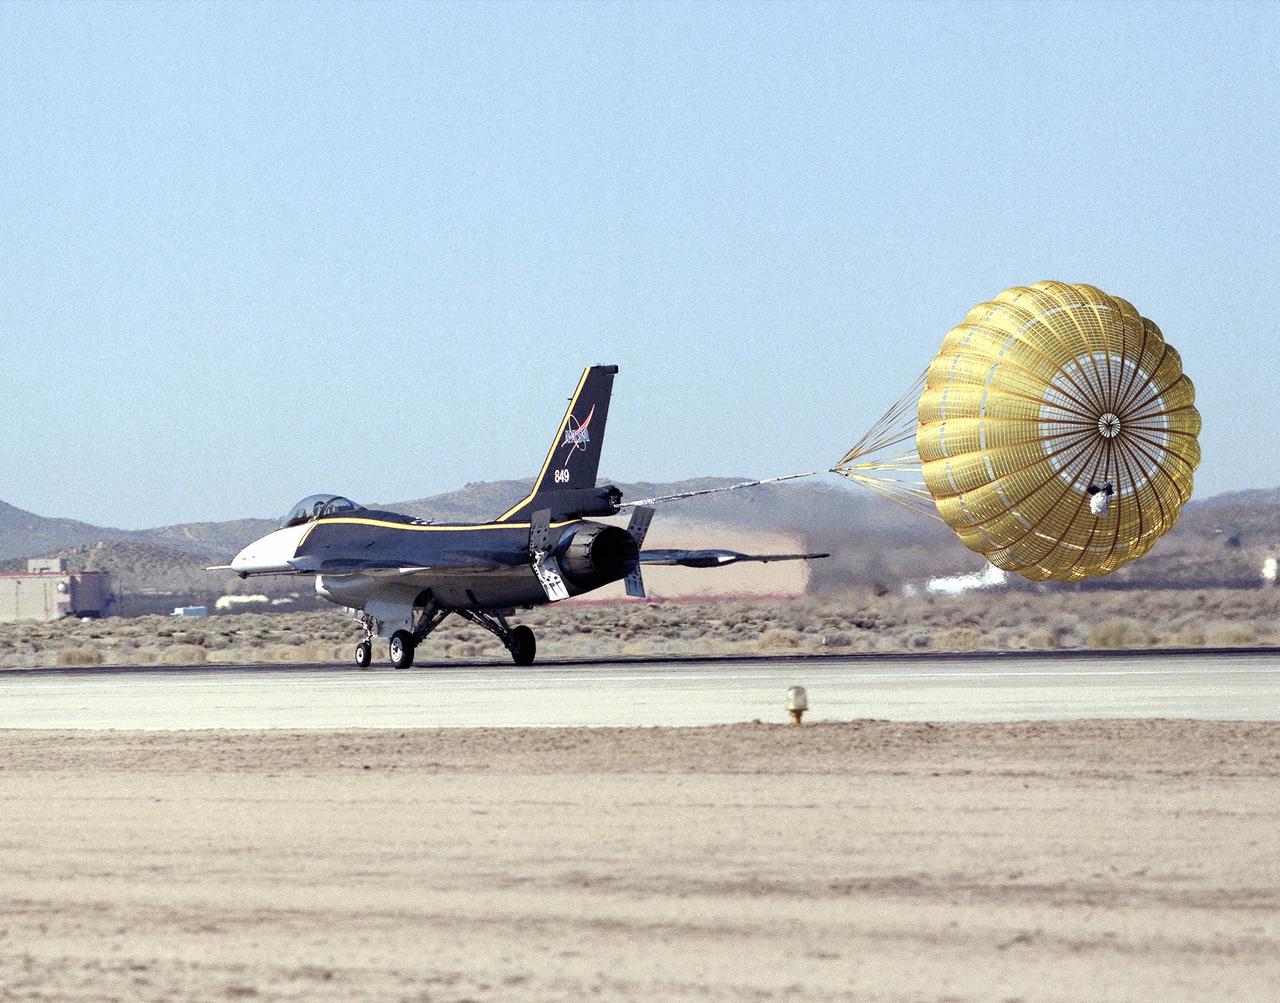
NASA's single-seat F-16XL makes a drag chute landing on the runway at Edwards Air Force Base in California's Mojave Desert. The aircraft was most recently used in the Cranked-Arrow Wing Aerodynamics Project (CAWAP) to test boundary layer pressures and distribution. Previously it had been used in a program to investigate the characteristics of sonic booms for NASA's High Speed Research Program. Data from the program will be used in the development of a high speed civilian transport. During the series of sonic boom research flights, the F-16XL was used to probe the shock waves being generated by a NASA SR-71 and record their shape and intensity.

ISS013-E-75141 (2 Sept. 2006) --- Erg Oriental, Algeria is featured in this image photographed by an Expedition 13 crewmember onboard the International Space Station. One of the main interests of rainless regions like the Sahara Desert to landscape science is that the work of flowing water--mainly streams and rivers--becomes less important than the work of wind. According to scientists, over millennia, and if enough sand is available, winds can generate dunes of enormous size, arranged in regular patterns. Long, generally north-south trending linear dunes stretch across much of northeast Algeria covering a vast tract (approximately 140,000 kilometers square) of the Sahara Desert known as the Erg Oriental. Erg means dune sea in Arabic, and the term has been adopted into modern geology. Spanning this image diagonally are a series of two kilometer-wide linear dunes, comprised of red sand, from a point on the southwest margin of the erg (center point 28.9N 4.8W). The dune chains are more than 100 meters high. The "streets" between the dunes are grayer areas free of sand. Linear dune chains are usually generated roughly parallel with the dominant winds. It also seems to be true that linear dunes are built by stronger winds. This detailed view shows that smaller dunes, known as star dunes, are built on top of the linear dunes. By contrast, star dunes seem to form in weak wind regimes, with winds from different directions in each season -- resulting in characteristic "arms" snaking away from a central point. Some scientists therefore think the dunes in this image were generated in two earlier climatic phases, different from that of today. (1) During a phase when winds were stronger and dominantly from one direction (the south), major linear sand masses accumulated. (2) Later, when wind strengths declined, the star dunes formed. Modern features--known as wind streaks--on the edge of the present erg (not shown), younger than either the linear or star dunes, show that present-day sand-moving winds blow from the southwest.
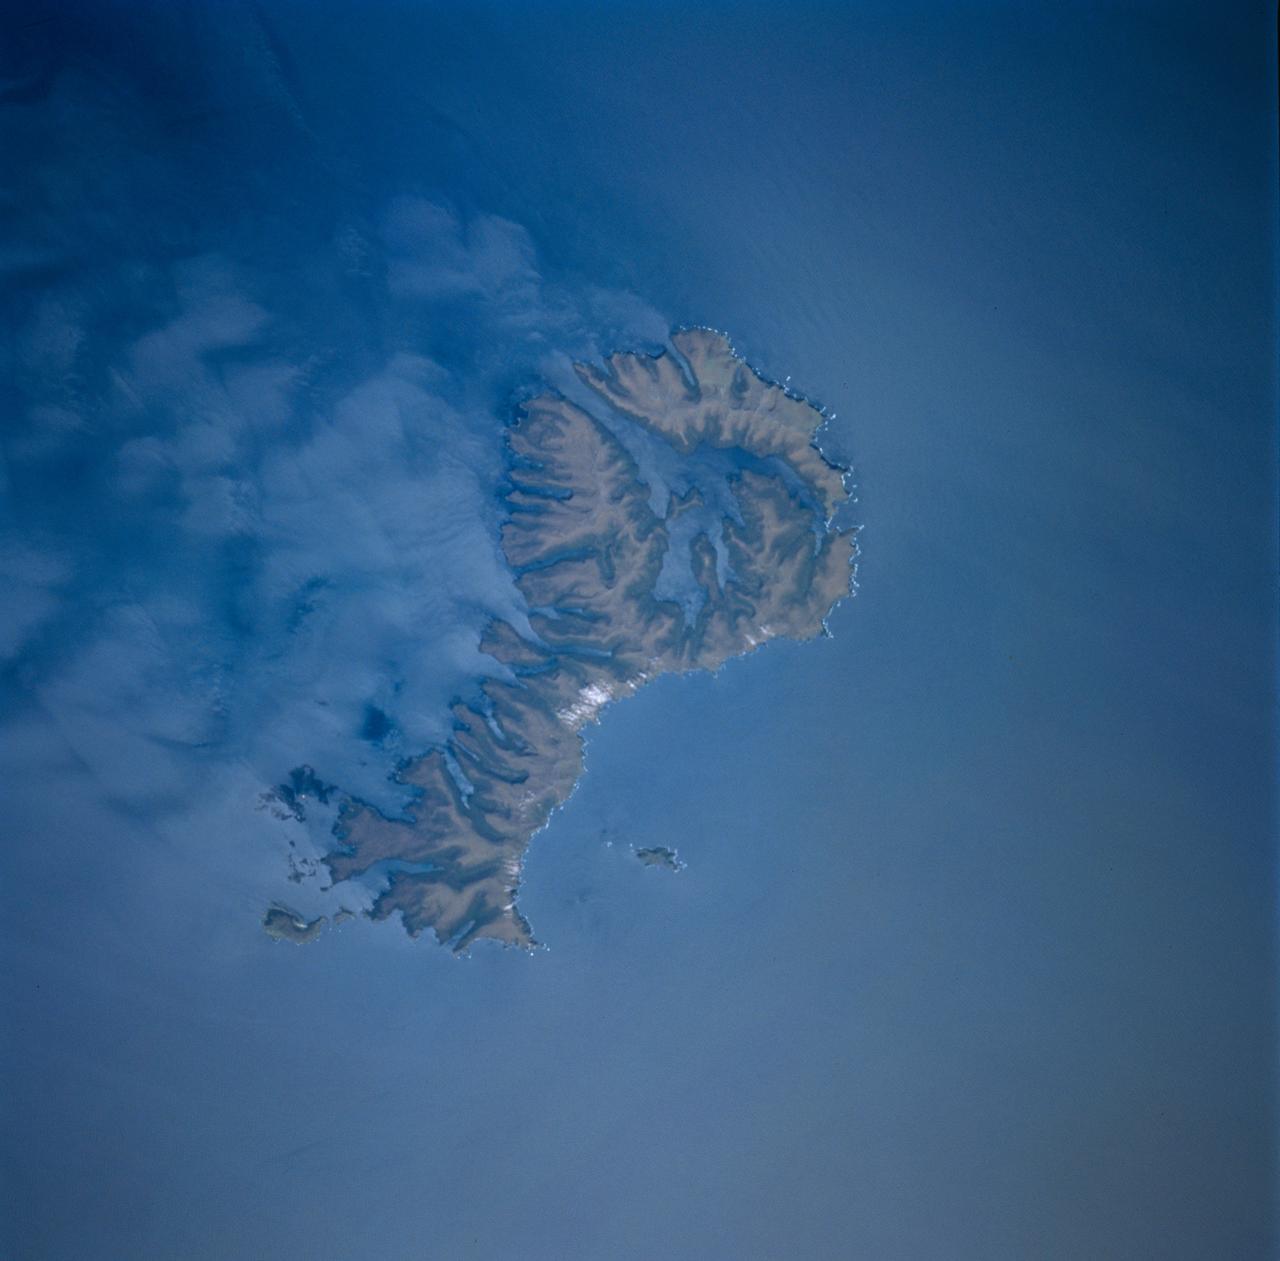
STS089-743-004 (22-31 Jan. 1998) --- This picture showing Auckland Island, New Zealand was photographed with a 70mm handheld camera from the Earth-orbiting space shuttle Endeavour. A spectacular occurrence of internal waves in the ocean is visible in the wake of the island. These waves can be generated by currents or, in some cases, wind across the island. In this case, the observation was that these waves were visible after the sunglint disappeared, suggesting current generated effects. If so, the circum-polar current that moves west-east around Antarctica would generate the scalloped appearance in the water east of the island. There is characteristically very little surface expression to these waves so they would not be noticed by a ship in this region. Fundamental processes of oceanic circulation and interaction are poorly understood. These shots help oceanographers model the dynamics of the open ocean and work out mixing models for ocean layer and ocean-air interaction (important for modeling CO2 budget, for example). The long linear valleys and bays have been excavated by glaciers cutting into this long-extinct volcano. This island is located on the submerged Campbell Plateau, which is an area almost as large as the exposed land of South Island, New Zealand. Scientists report that the plateau was submerged when New Zealand, Antarctica and Australia separated "around 75 million years ago." This could be viewed as one of the tallest mountains on the plateau. Usually the weather in this area is bad so this photo opportunity was considered a "great catch." Photo credit: NASA
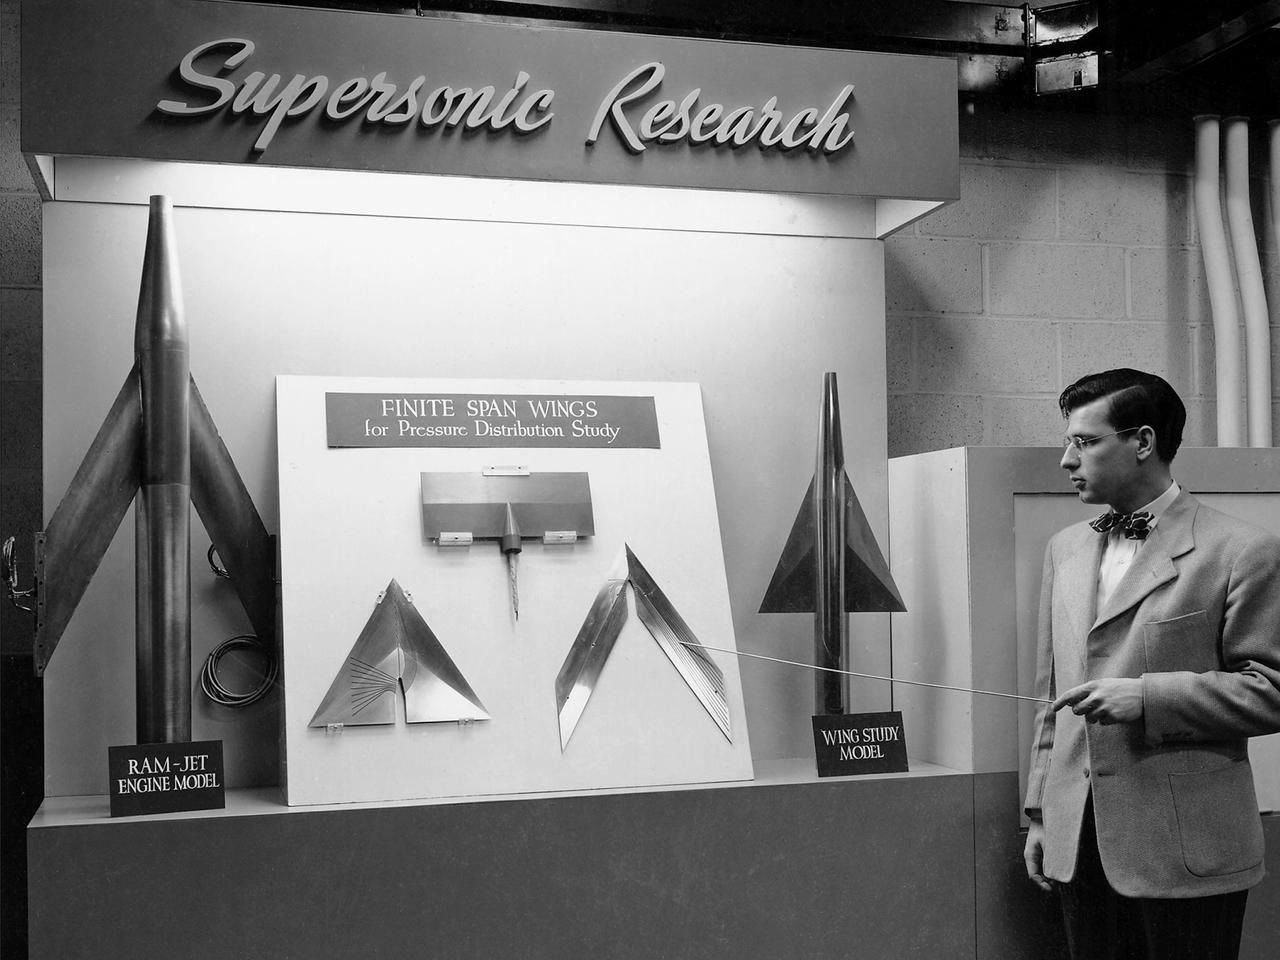
On March 22, 1946, 250 members of the Institute of Aeronautical Science toured the NACA’s Aircraft Engine Research Laboratory. NACA Chairman Jerome Hunsaker and Secretary John Victory were on hand to brief the attendees in the Administration Building before the visited the lab’s test facilities. At each of the twelve stops, researchers provided brief presentations on their work. Topics included axial flow combustors, materials for turbine blades, engine cooling, icing prevention, and supersonic flight. The laboratory reorganized itself in October 1945 as World War II came to an end to address newly emerging technologies such as the jet engine, rockets, and high-speed flight. While design work began on what would eventually become the 8- by 6-Foot Supersonic Wind Tunnel, NACA Lewis quickly built several small supersonic tunnels. These small facilities utilized the Altitude Wind Tunnel’s massive air handling equipment to generate high-speed airflow. The display seen in this photograph was set up in the building that housed the first of these wind tunnels. Eventually the building would contain three small supersonic tunnels, referred to as the “stack tunnels” because of the vertical alignment. The two other tunnels were added to this structure in 1949 and 1951. The small tunnels were used until the early 1960s to study the aerodynamic characteristics of supersonic inlets and exits.
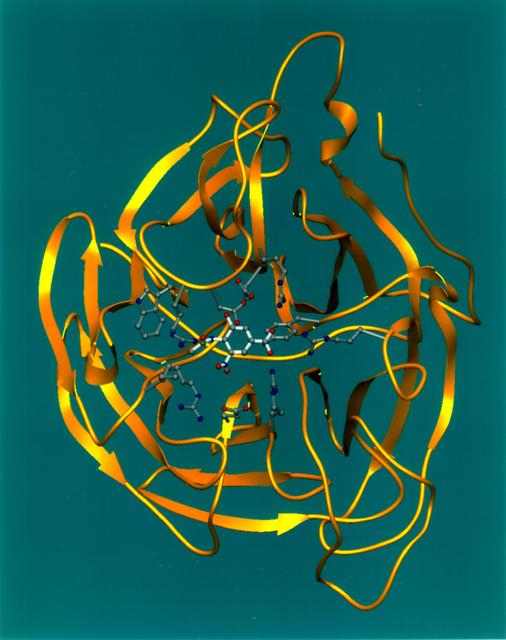
Ribbons is a program developed at UAB used worldwide to graphically depict complicated protein structures in a simplified format. The program uses sophisticated computer systems to understand the implications of protein structures. The Influenza virus remains a major causative agent for a large number of deaths among the elderly and young children and huge economic losses due to illness. Finding a cure will have a general impact both on the basic research of viral pathologists of fast evolving infectious agents and clinical treatment of influenza virus infection. The reproduction process of all strains of influenza are dependent on the same enzyme neuraminidase. Shown here is a segmented representation of the neuraminidase inhibitor compound sitting inside a cave-like contour of the neuraminidase enzyme surface. This cave-like formation present in every neuraminidase enzyme is the active site crucial to the flu's ability to infect. The space-grown crystals of neuraminidase have provided significant new details about the three-dimensional characteristics of this active site thus allowing researchers to design drugs that fit tighter into the site. Principal Investigator: Dr. Larry DeLucas

National Aeronautics and Space Administration (NASA) researcher John Carpenter inspects an aircraft model with a four-fan thrust reverser which would be studied in the 9- by 15-Foot Low Speed Wind Tunnel at the Lewis Research Center. Thrust reversers were introduced in the 1950s as a means for slowing high-speed jet aircraft during landing. Engineers sought to apply the technology to Vertical and Short Takeoff and Landing (VSTOL) aircraft in the 1970s. The new designs would have to take into account shorter landing areas, noise levels, and decreased thrust levels. A balance was needed between the thrust reverser’s efficiency, its noise generation, and the engine’s power setting. This model underwent a series of four tests in the 9- by 15-foot tunnel during April and May 1974. The model, with a high-wing configuration and no tail, was equipped with four thrust-reverser engines. The investigations included static internal aerodynamic tests on a single fan/reverser, wind tunnel isolated fan/reverser thrust tests, installation effects on a four-fan airplane model in a wind tunnel, and single reverser acoustic tests. The 9-by 15 was built inside the return leg of the 8- by 6-Foot Supersonic Wind Tunnel in 1968. The facility generates airspeeds from 0 to 175 miles per hour to evaluate the aerodynamic performance and acoustic characteristics of nozzles, inlets, and propellers, and investigate hot gas re-ingestion of advanced VSTOL concepts. John Carpenter was a technician in the Wind Tunnels Service Section of the Test Installations Division.
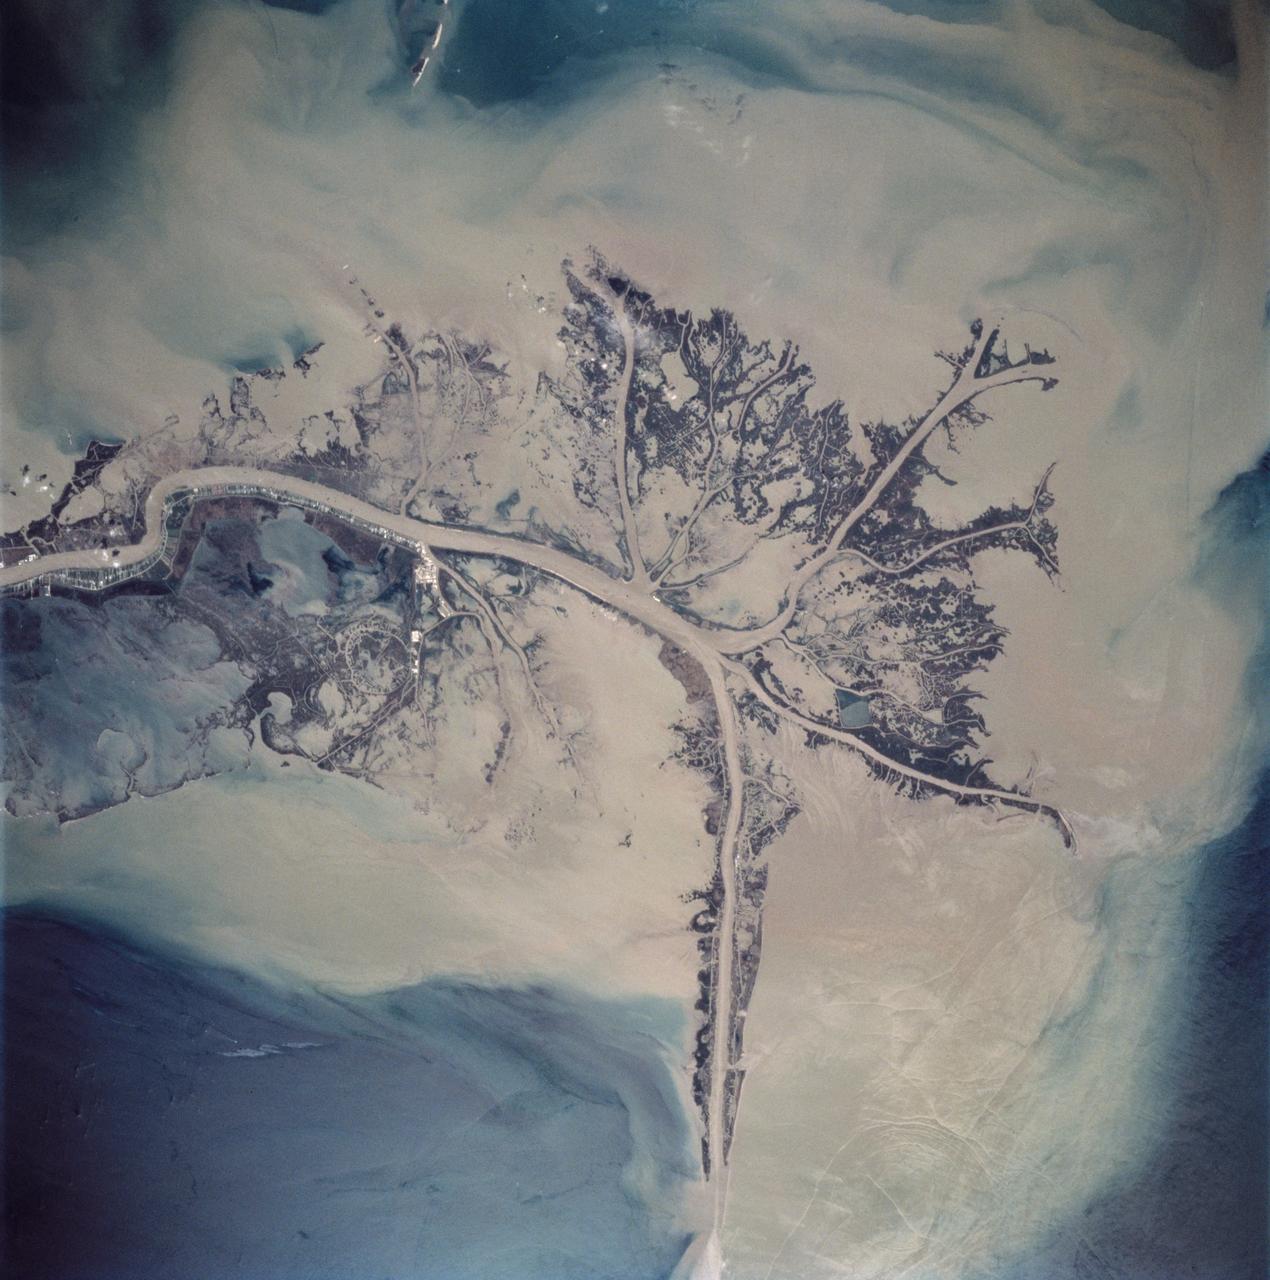
STS062-85-021 (4-18 March 1994) --- The Mississippi River is the largest river system in North America. Its delta is a typical example of the bird's foot class of river deltas. It drains nearly 3 1/2 million square kilometers of real estate and is estimated to carry 2.4 billion kilograms (more than 500 million tons) of sand, silt, and clay to the Gulf of Mexico annually. Most of this sediment is deposited as a delta at the mouth of the river where the velocity of the river water is slowed and its ability to transport sediment is accordingly diminished. Continued deposition at such a site progrades the delta or extends it seaward into the Gulf as much as 150 meters each year until such time as a flooding episode finds a shorter more efficient channel to deliver sediment-laden river waters to the Gulf. At that time the old delta is abandoned and the river begins to build a new delta. In time, compaction of the sediment in the old delta causes it to subside forming first marshes, then bays. This and the modifying effects of coastal waves eventually allow the sea to reclaim much of the temporary land area of the delta. This sequence has repeated itself over and over again at the Mississippi Delta. In this photograph, the present day active Balize delta is shown. According to NASA scientists it is the youngest of the recent delta lobes having begun its seaward pro-gradation only some 600 - 800 years ago. The main channel of the river is 2 kilometers wide and 30 - 40 meters deep. Natural levees here are almost 1 kilometer wide and 3 to 4 meters above sea level. Along the active distributaries of the lower delta, natural levees are less than 100 meters wide and generally less than 0.5 meters above sea level. The bird's foot appearance of deltas such as this is characteristic of low coastal energy conditions - that is, low levels of tidal fluctuation and generally low wave energy. The interdistributary bays are extremely shallow, usually less than a few meters, and contain brackish to normal marine waters except during times of flooding, when fresh water fills the bays. Sedimentation within the bays is very slow, occurring only during flood periods. Along the west side of the river, a highway has been built southeastward to Venice.
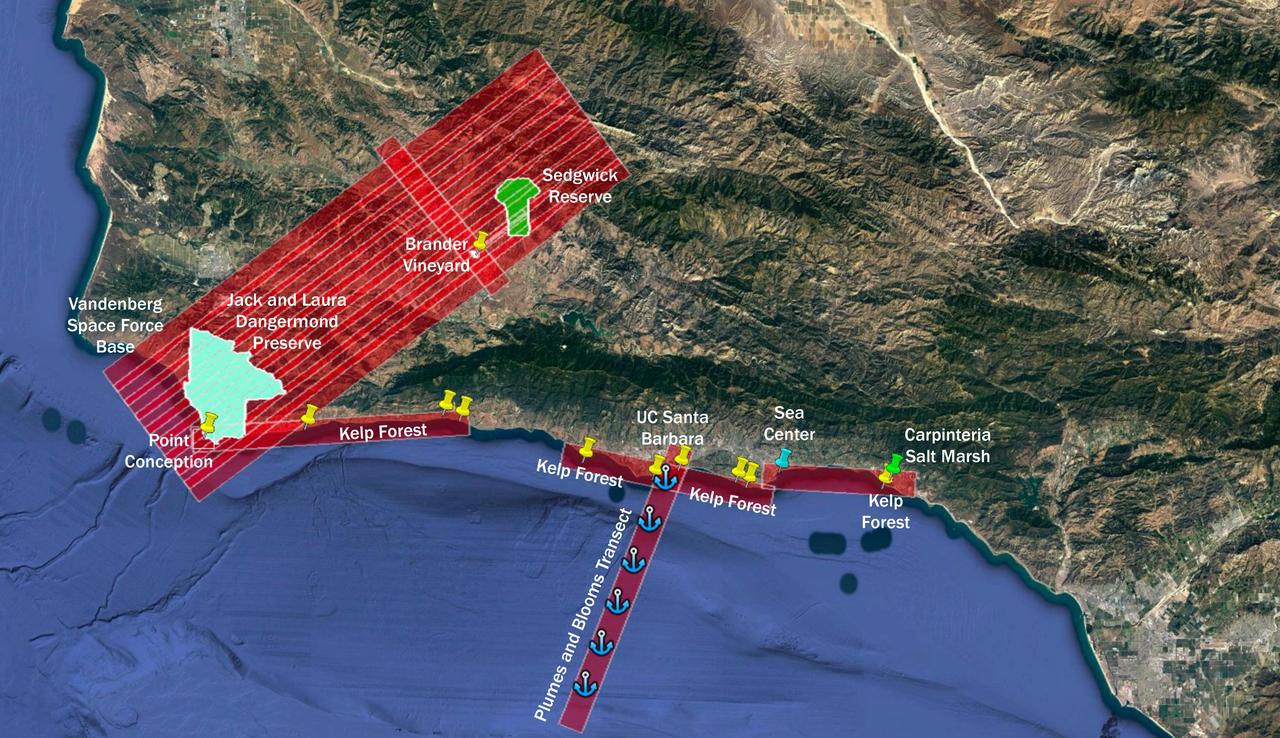
The Surface Biology and Geology High-Frequency Time Series (SHIFT) campaign employs a research plane carrying the AVIRIS-NG (Airborne Visible/Infrared Imaging Spectrometer-Next Generation) instrument. From late February to late May 2022, the plane is collecting spectral data of land and aquatic plant communities over a 640-square-mile (1,656-square-kilometer) study area in Santa Barbara County and the nearby ocean. SHIFT is jointly led by NASA's Jet Propulsion Laboratory, the University of California, Santa Barbara (UCSB), and The Nature Conservancy. The aerial portion of SHIFT flies on an approximately weekly basis over the study area, which includes the Jack and Laura Dangermond Preserve, owned by The Nature Conservancy, and the Sedgwick Reserve, operated by UCSB. SHIFT combines the ability of airborne science instruments to gather data over widespread areas with the more concentrated observations scientists conduct in the field to study the functional characteristics, health, and resilience of plant communities. The sampling and analysis done by researchers on the ground and in the ocean is intended to validate data taken by AVIRIS-NG and help scientists design data collection and processing algorithms for NASA's proposed Surface Biology and Geology (SBG) mission, which would launch no earlier than 2028. The data is also intended to support the research and conservation objectives of The Nature Conservancy, which owns the Dangermond Preserve, and UCSB, which operates the Sedgwick Reserve, another nature preserve within the study area. More than 60 scientists from institutions around the U.S. have indicated they intend to use the SHIFT data in their research. https://photojournal.jpl.nasa.gov/catalog/PIA25144
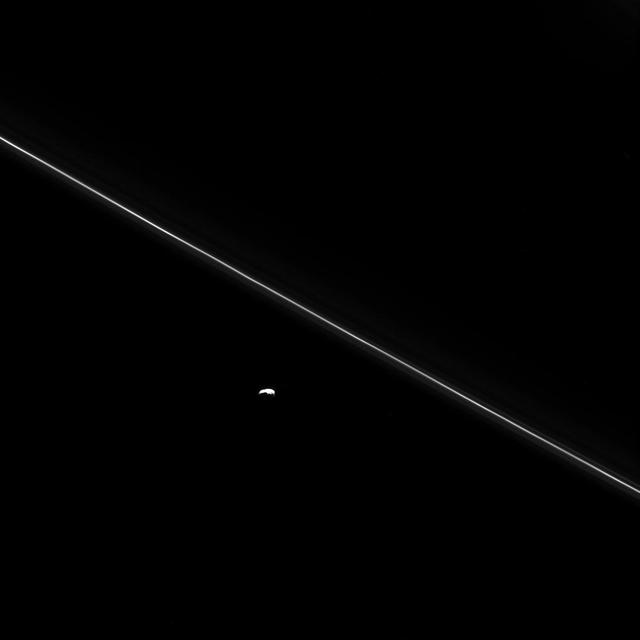
As Cassini hurtled toward its fatal encounter with Saturn, the spacecraft turned to catch this final look at Saturn's moon Pandora next to the thin line of the F ring. Over the course of its mission, Cassini helped scientists understand that Pandora plays a smaller role than they originally thought in shaping the narrow ring. When Cassini arrived at Saturn, many thought that Pandora and Prometheus worked together to shepherd the F ring between them, confining it and sculpting its unusual braided and kinked structures. However, data from Cassini show that the gravity of the two moons together actually stirs the F ring into a chaotic state, generating the "gap and streamer" structure. Recent models, supported by Cassini images, suggest that it is Prometheus alone, not Pandora, that confines the bulk of the F ring, aided by the particular characteristics of its orbit. Prometheus establishes stable locations for F ring material where the moon's own gravitational resonances are least cluttered by the perturbing influence of its sibling satellite, Pandora. This view looks toward the sunlit side of the rings from about 28 degrees above the ringplane. The image was taken in visible light with the Cassini spacecraft narrow-angle camera on Sept. 14, 2017. The view was obtained at a distance of approximately 360,000 miles (577,000 kilometers) from Pandora and at a Sun-Pandora-spacecraft, or phase, angle of 119 degrees. Image scale is about 2.2 miles (3.5 kilometers) per pixel. The Cassini spacecraft ended its mission on Sept. 15, 2017. https://photojournal.jpl.nasa.gov/catalog/PIA21355

A Republic F-84 Thunderjet dramatically modified at the NASA Lewis Research Center to investigate the use of slotted nozzles to reduce exhaust noise. The F-84 was a single-seat fighter-bomber powered by an Allison J35 turbojet. It was the Air Force’s first post-World War II tactical aircraft and was used extensively in the Korean War. The laboratory had acquired the aircraft in 1954 and modified it in order to demonstrate the reverse thruster. The tail end of the aircraft was then removed for a series of large nozzle investigations. Lewis researchers launched an extensive program in the mid-1950s to develop methods of reducing engine noise as the airline industry was preparing to introduce the first turbojet-powered passenger aircraft. The early NACA investigations determined that the primary source of noise was the mixing of the engine’s hot exhaust with the cool surrounding air. Lewis researchers studied many different nozzles designed to facilitate this mixing. Nozzles with elongated exit sections, as seen in this photograph, produced lower noise levels. These long slot nozzles were also considered for Short Take-off and Landing aircraft because their long flat surfaces provided lift. In 1958 Lewis tested several full-scale slot nozzles on the F-84. The researchers, led by Willard Cole, sought to determine the noise-generation characteristics for nozzles having large a width-to-height ratio. The nozzle in this photograph has a 100 to 1 width-to-height ratio. Cole determined that the experimental nozzles produced the same levels of sound as the standard nozzle, but the changes in the directional noise were substantial.
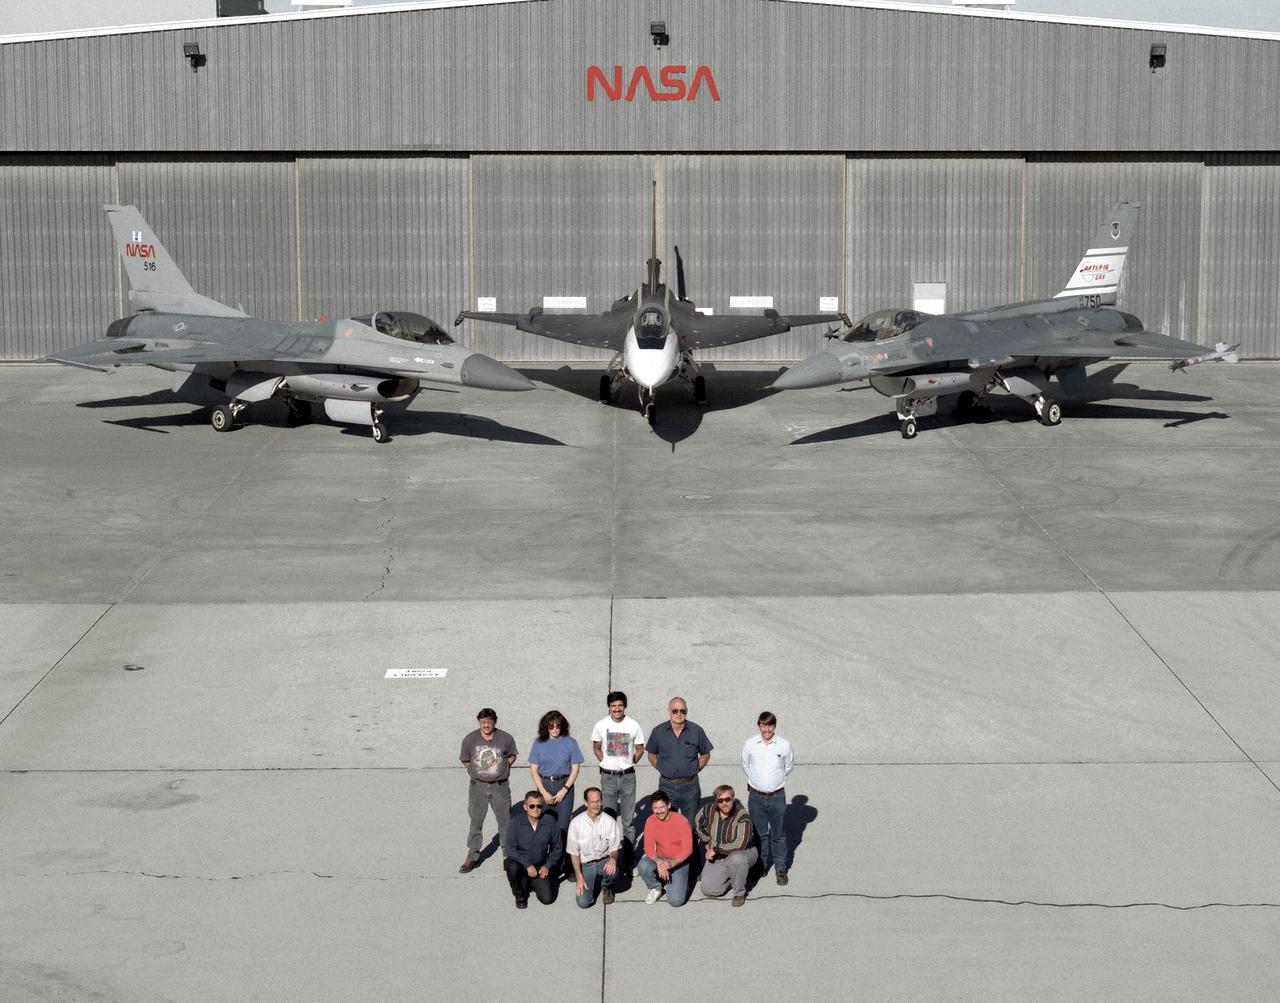
The support crew for the F-16A, the F-16XL no. 1, and the F-16 AFTI are, top row, left to right: Randy Weaver; mechanic, Susan Ligon; mechanic, Bob Garcia; Crew Chief, Rich Kelly; mechanic, Dale Edminister; Avionics Technician. Bottom row, left to right, Art Cope; mechanic, John Huffman; Avionics Technician, Jaime Garcia; Avionics Technician, Don Griffith, Avionics Tech. Co-op student. The F-16A (NASA 516), the only civil registered F-16 in existence, was transferred to Dryden from Langley, and was primarily used in engine tests and for parts. It was subsequently transfered from Dryden. The single-seat F-16XL no. 1 (NASA 849) was most recently used in the Cranked-Arrow Wing Aerodynamics Project (CAWAP) to test boundary layer pressures and distribution. Previously it had been used in a program to investigate the characteristics of sonic booms for NASA's High Speed Research Program. Data from the program will be used in the development of a high speed civilian transport. During the series of sonic boom research flights, the F-16XL was used to probe the shock waves being generated by a NASA SR-71 and record their shape and intensity. The Advanced Fighter Technology Integration (AFTI) F-16 was used to develop and demonstrate technologies to improve navigation and a pilot's ability to find and destroy enemy ground targets day or night, including adverse weather. Earlier research in the joint NASA-Air Force AFTI F-16 program demonstrated voice actuated controls, helmet-mounted sighting and integration of forward-mounted canards with the standard flight control system to achieve uncoupled flight.
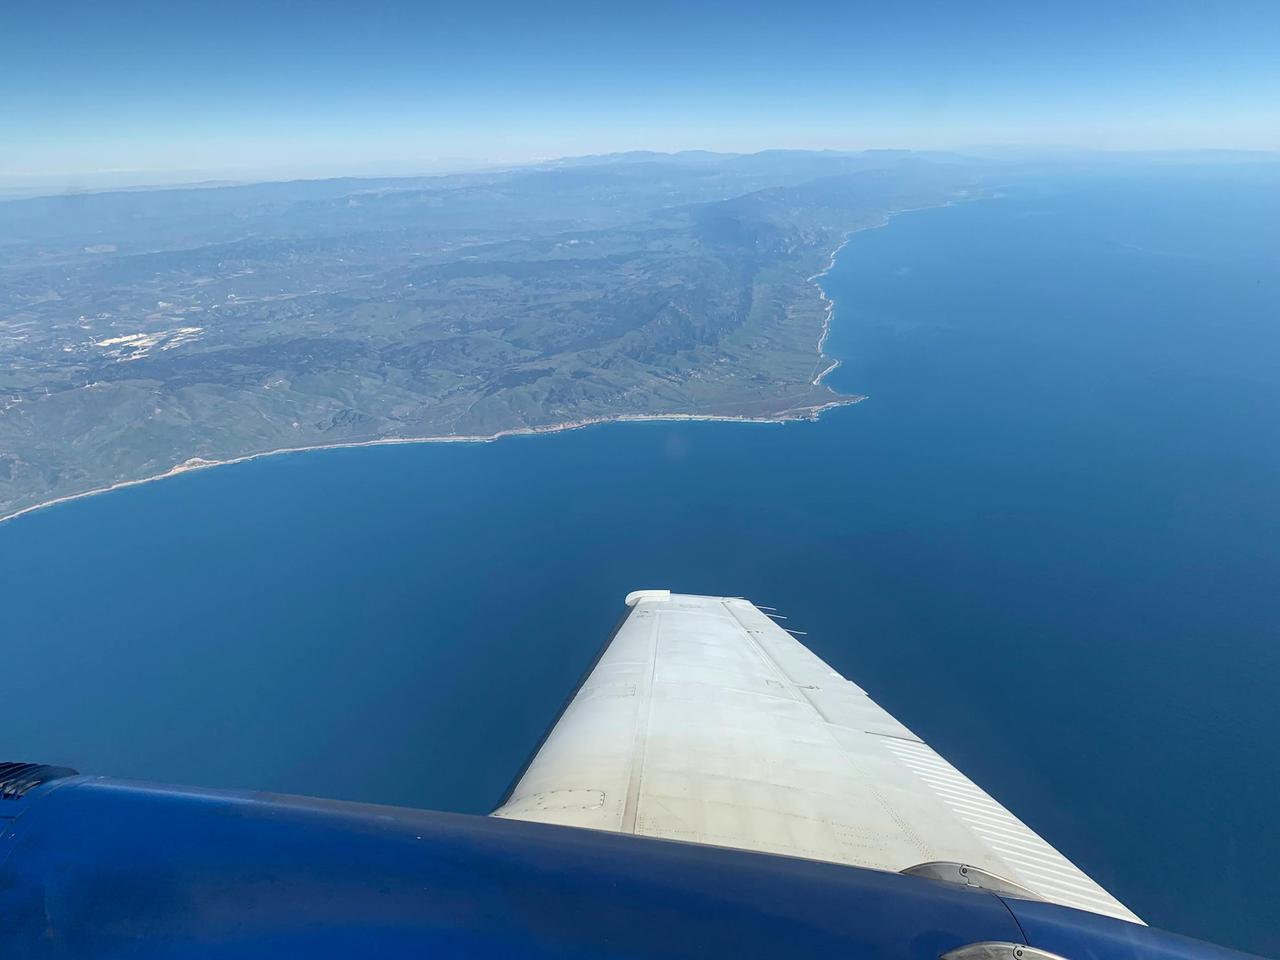
A research plane carrying the AVIRIS-NG (Airborne Visible/Infrared Imaging Spectrometer-Next Generation) instrument flies off the Central Coast of California near Point Conception and the Jack and Laura Dangermond Preserve on Feb. 24, 2022. The flight is part of the Surface Biology and Geology High-Frequency Time Series (SHIFT) campaign, which is jointly led by NASA's Jet Propulsion Laboratory, the University of California, Santa Barbara (UCSB), and The Nature Conservancy. Operating between late February and late May 2022, the aerial portion of SHIFT flies on an approximately weekly basis over a 640-square-mile (1,656-square-kilometer) study area in Santa Barbara County and the nearby ocean, collecting spectral data of plant communities it observes below. SHIFT combines the ability of airborne science instruments to gather data over widespread areas with the more concentrated observations scientists conduct in the field to study the functional characteristics, health, and resilience of plant communities. The sampling and analysis done by researchers on the ground and in the ocean is intended to validate data taken by AVIRIS-NG and help scientists design data collection and processing algorithms for NASA's proposed Surface Biology and Geology (SBG) mission, which would launch no earlier than 2028. The data is also intended to support the research and conservation objectives of The Nature Conservancy, which owns the Dangermond Preserve, and UCSB, which operates the Sedgwick Reserve, another nature preserve within the study area. More than 60 scientists from institutions around the U.S. have indicated they intend to use the SHIFT data in their research. AVIRIS-NG, which was designed at JPL, flies aboard Dynamic Aviation's King Air B-200. https://photojournal.jpl.nasa.gov/catalog/PIA25143
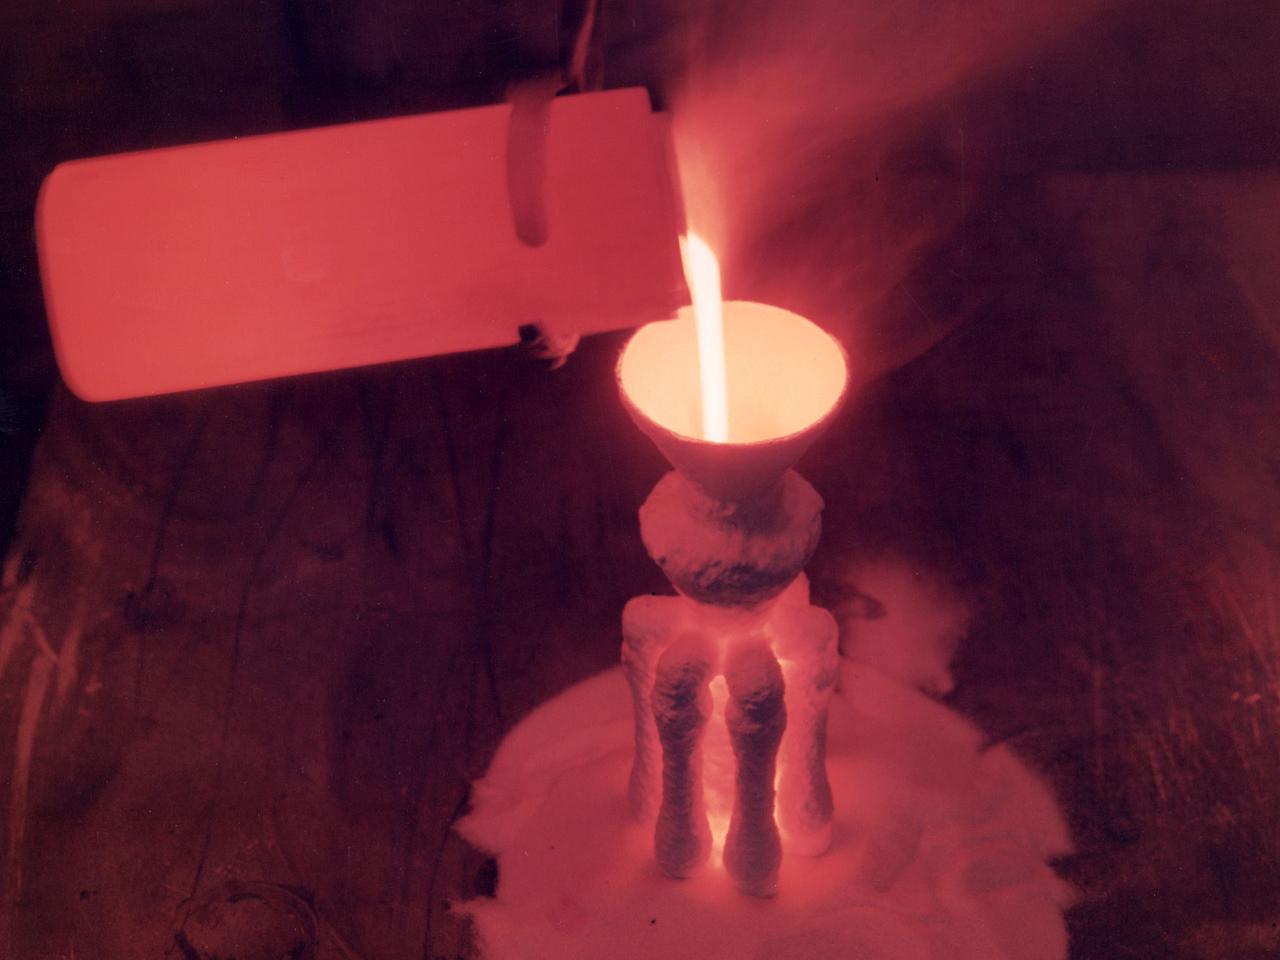
A nickel alloy developed at the National Aeronautics and Space Administration (NASA) Lewis Research Center being poured in a shop inside the Technical Services Building. Materials technology is an important element in the successful development of both advanced airbreathing and rocket propulsion systems. An array of dependable materials is needed to build different types of engines for operation in diverse environments. NASA Lewis began investigating the characteristics of different materials shortly after World War II. In 1949 the materials research group was expanded into its own division. The Lewis researchers studied and tested materials in environments that simulated the environment in which they would operate. Lewis created two programs in the early 1960s to create materials for new airbreathing engines. One concentrated on high-temperature alloys and the other on cooling turbine blades. William Klopp, Peter Raffo, Lester Rubenstein, and Walter Witzke developed Tungsten RHC, the highest strength metal at temperatures over 3500⁰ F. The men received an IR-100 Award for their efforts. Similarly a cobalt-tungsten alloy was developed by the Fatigue and Alloys Research Branch. The result was a combination of high temperature strength and magnetic properties that were applicable for generator rotor application. John Freche invented and patented a nickel alloy while searching for high temperature metals for aerospace use. NASA agreed to a three-year deal which granted Union Carbide exclusive use of the new alloy before it became public property.
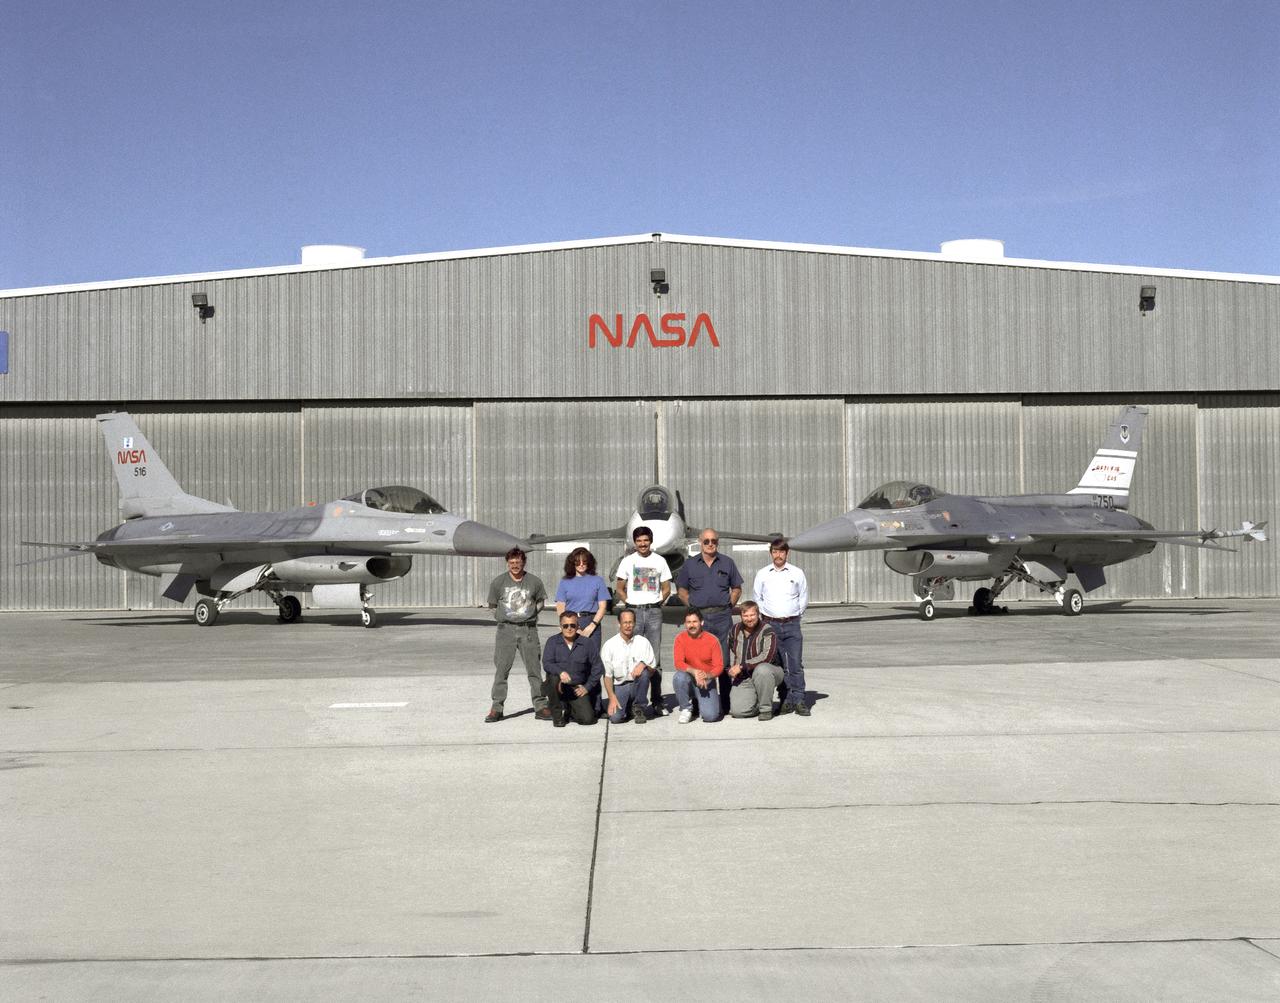
The support crew for the F-16A, the F-16XL no. 1, and the F-16 AFTI are, top row, left to right: Randy Weaver; mechanic, Susan Ligon; mechanic, Bob Garcia; Crew Chief, Rich Kelly; mechanic, Dale Edminister; Avionics Technician. Bottom row, left to right, Art Cope; mechanic, John Huffman; Avionics Technician, Jaime Garcia; Avionics Technician, Don Griffith, Avionics Tech. Co-op student. The F-16A (NASA 516), the only civil registered F-16 in existence, was transferred to Dryden from Langley, and was primarily used in engine tests and for parts. It was subsequently transfered from Dryden. The single-seat F-16XL no. 1 (NASA 849) was most recently used in the Cranked-Arrow Wing Aerodynamics Project (CAWAP) to test boundary layer pressures and distribution. Previously it had been used in a program to investigate the characteristics of sonic booms for NASA's High Speed Research Program. Data from the program will be used in the development of a high speed civilian transport. During the series of sonic boom research flights, the F-16XL was used to probe the shock waves being generated by a NASA SR-71 and record their shape and intensity. The Advanced Fighter Technology Integration (AFTI) F-16 was used to develop and demonstrate technologies to improve navigation and a pilot's ability to find and destroy enemy ground targets day or night, including adverse weather. Earlier research in the joint NASA-Air Force AFTI F-16 program demonstrated voice actuated controls, helmet-mounted sighting and integration of forward-mounted canards with the standard flight control system to achieve uncoupled flight.
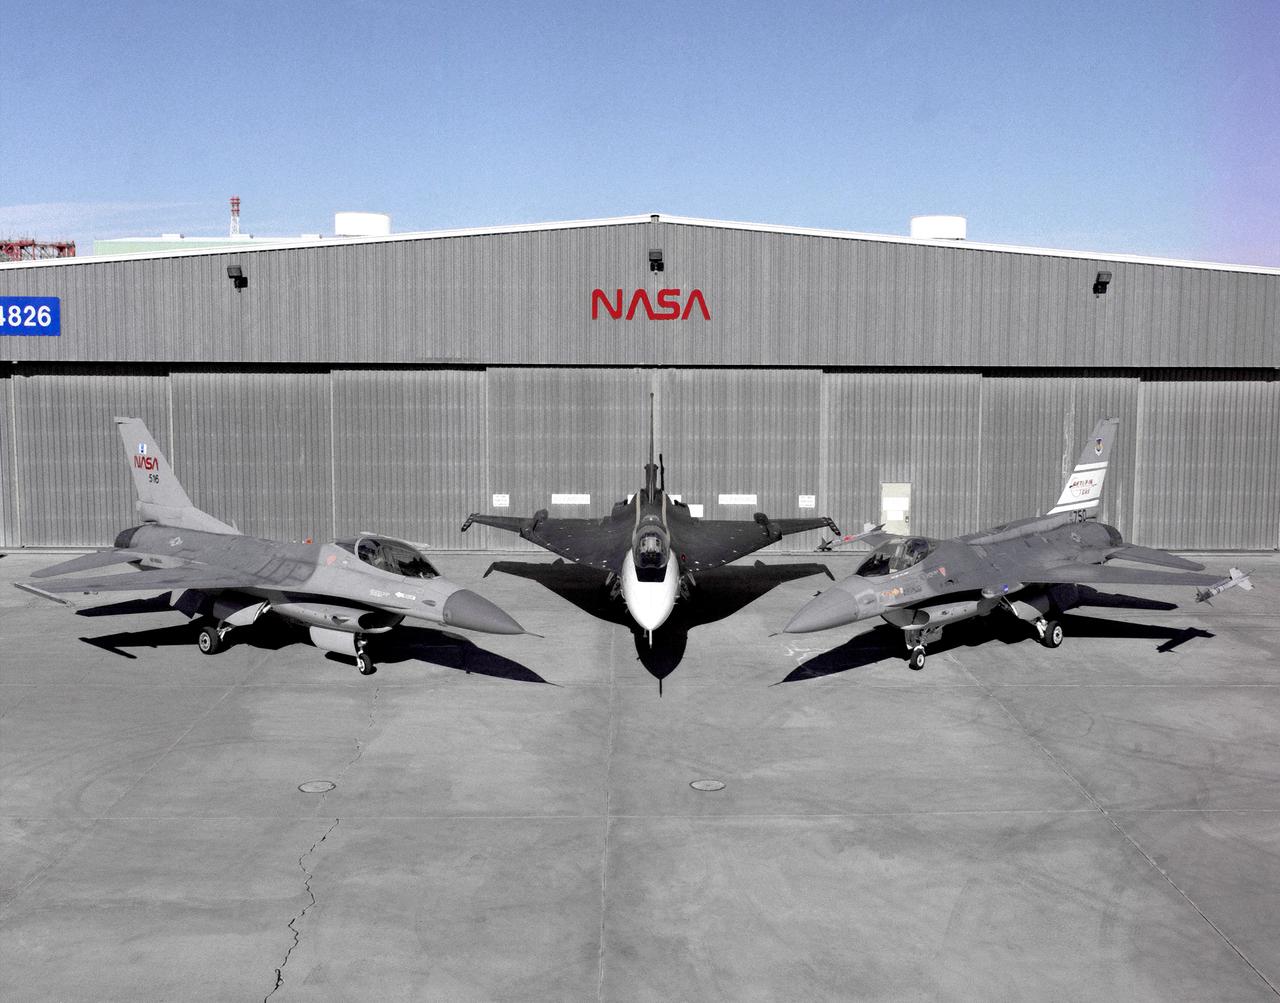
Photographed outside their hangar at the Dryden Flight Research Center, Edwards, California, part of Dryden's F-16 fleet is, left to right; an F-16A, the F-16XL no. 1, and the F-16 AFTI. The F-16A (NASA 516), the only civil registered F-16 in existence, was transferred to Dryden from Langley, and was primarily used in engine tests and for parts. It was subsequently transfered from Dryden. The single-seat F-16XL no. 1 (NASA 849) was most recently used in the Cranked-Arrow Wing Aerodynamics Project (CAWAP) to test boundary layer pressures and distribution. Previously it had been used in a program to investigate the characteristics of sonic booms for NASA's High Speed Research Program. Data from the program will be used in the development of a high speed civilian transport. During the series of sonic boom research flights, the F-16XL was used to probe the shock waves being generated by a NASA SR-71 and record their shape and intensity. The Advanced Fighter Technology Integration (AFTI) F-16 was used to develop and demonstrate technologies to improve navigation and a pilot's ability to find and destroy enemy ground targets day or night, including adverse weather. Earlier research in the joint NASA-Air Force AFTI F-16 program demonstrated voice actuated controls, helmet-mounted sighting and integration of forward-mounted canards with the standard flight control system to achieve uncoupled flight.

A NASA camera on the Deep Space Climate Observatory satellite has returned its first view of the entire sunlit side of Earth from one million miles away. This color image of Earth was taken by NASA’s Earth Polychromatic Imaging Camera (EPIC), a four megapixel CCD camera and telescope. The image was generated by combining three separate images to create a photographic-quality image. The camera takes a series of 10 images using different narrowband filters -- from ultraviolet to near infrared -- to produce a variety of science products. The red, green and blue channel images are used in these color images. The image was taken July 6, 2015, showing North and Central America. The central turquoise areas are shallow seas around the Caribbean islands. This Earth image shows the effects of sunlight scattered by air molecules, giving the image a characteristic bluish tint. The EPIC team is working to remove this atmospheric effect from subsequent images. Once the instrument begins regular data acquisition, EPIC will provide a daily series of Earth images allowing for the first time study of daily variations over the entire globe. These images, available 12 to 36 hours after they are acquired, will be posted to a dedicated web page by September 2015. The primary objective of DSCOVR, a partnership between NASA, the National Oceanic and Atmospheric Administration (NOAA) and the U.S. Air Force, is to maintain the nation’s real-time solar wind monitoring capabilities, which are critical to the accuracy and lead time of space weather alerts and forecasts from NOAA. For more information about DSCOVR, visit: <a href="http://www.nesdis.noaa.gov/DSCOVR/" rel="nofollow">www.nesdis.noaa.gov/DSCOVR/</a>
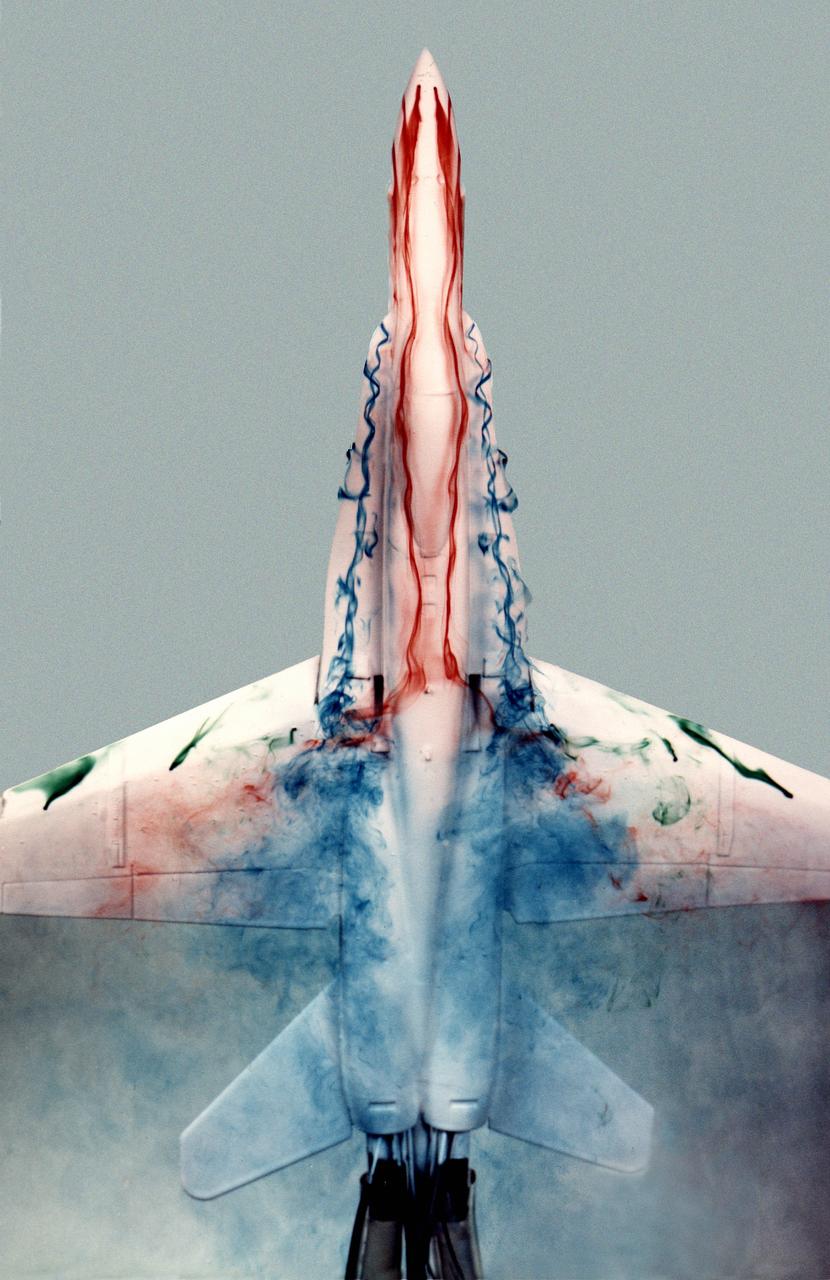
This image shows a plastic 1/48-scale model of an F-18 aircraft inside the "Water Tunnel" more formally known as the NASA Dryden Flow Visualization Facility. Water is pumped through the tunnel in the direction of normal airflow over the aircraft; then, colored dyes are pumped through tubes with needle valves. The dyes flow back along the airframe and over the airfoils highlighting their aerodynamic characteristics. The aircraft can also be moved through its pitch axis to observe airflow disruptions while simulating actual flight at high angles of attack. The Water Tunnel at NASA's Dryden Flight Research Center, Edwards, CA, became operational in 1983 when Dryden was a Flight Research Facility under the management of the Ames Research Center in Mountain View, CA. As a medium for visualizing fluid flow, water has played a significant role. Its use dates back to Leonardo da Vinci (1452-1519), the Renaissance Italian engineer, architect, painter, and sculptor. In more recent times, water tunnels have assisted the study of complex flows and flow-field interactions on aircraft shapes that generate strong vortex flows. Flow visualization in water tunnels assists in determining the strength of vortices, their location, and possible methods of controlling them. The design of the Dryden Water Tunnel imitated that of the Northrop Corporation's tunnel in Hawthorne, CA. Called the Flow Visualization Facility, the Dryden tunnel was built to assist researchers in understanding the aerodynamics of aircraft configured in such a way that they create strong vortex flows, particularly at high angles of attack. The tunnel provides results that compare well with data from aircraft in actual flight in another fluid-air. Other uses of the tunnel have included study of how such flight hardware as antennas, probes, pylons, parachutes, and experimental fixtures affect airflow. The facility has also been helpful in finding the best locations for emitting smoke from flight vehicles for flow vi
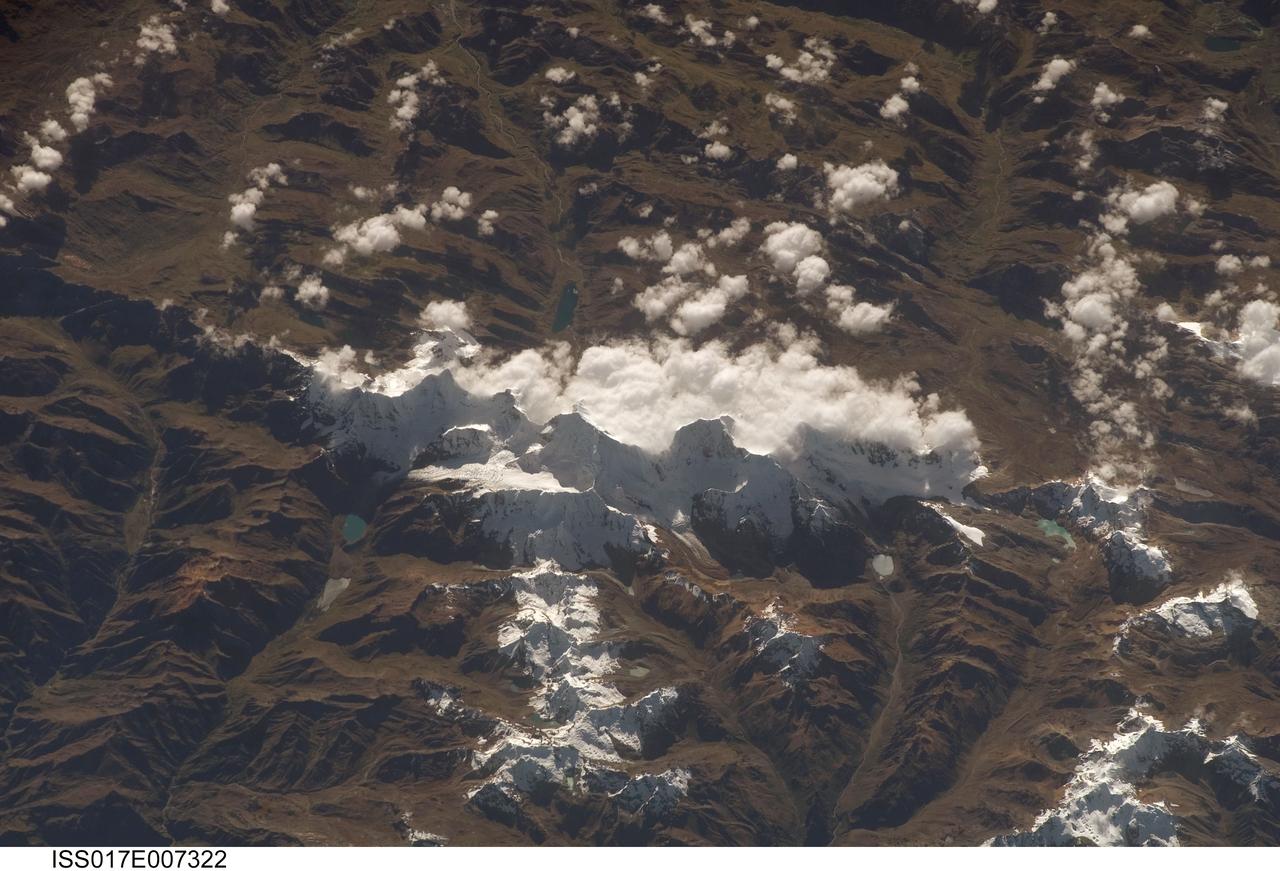
ISS017-E-007322 (17 May 2008) --- Cordillera Huayhuash in the Peruvian Andes is featured in this image photographed by an Expedition 17 crewmember on the International Space Station. This view was taken looking east as the station was flying approximately 100 kilometers off the Peruvian coast and shows Cordillera Huayhuash (pronounced Why-wash). Here clouds are banked up on the east side, snow covers all higher slopes and mountain peaks, and glaciers occupy lower slopes. This prominent but short mountain range (25 kilometers in length) boasts twenty peaks of remarkable steepness and ridge sharpness. Although only 100 kilometers from the coastline, six of the peaks reach above 6,000 meters (more than 19,500 feet), the highest of which is Nevado Yerupaja, Peru's second highest peak, variously estimated as 6,617 and 6,635 meters high. Generally considered the most spectacular peak in South America, Yerupaja is so steep that it has seldom been climbed. The best climbing approach is from the southwest, the face seen in this view. Yerupaja is locally known as El Carnicero (The Butcher) because of its blade-like ridges, features typical of mountains that have been heavily eroded by glacial ice. Other features created by the erosive effect of flowing ice are small glacial lakes, which often vary in color due to different amounts of fine mud being fed into them by meltwater from under the glaciers. According to scientists, during the ice ages the glaciers advanced many kilometers outward from the cordillera, occupying all the surrounding valley floors (all of which lie above 3,000 meters) producing the characteristic U-shaped valleys.
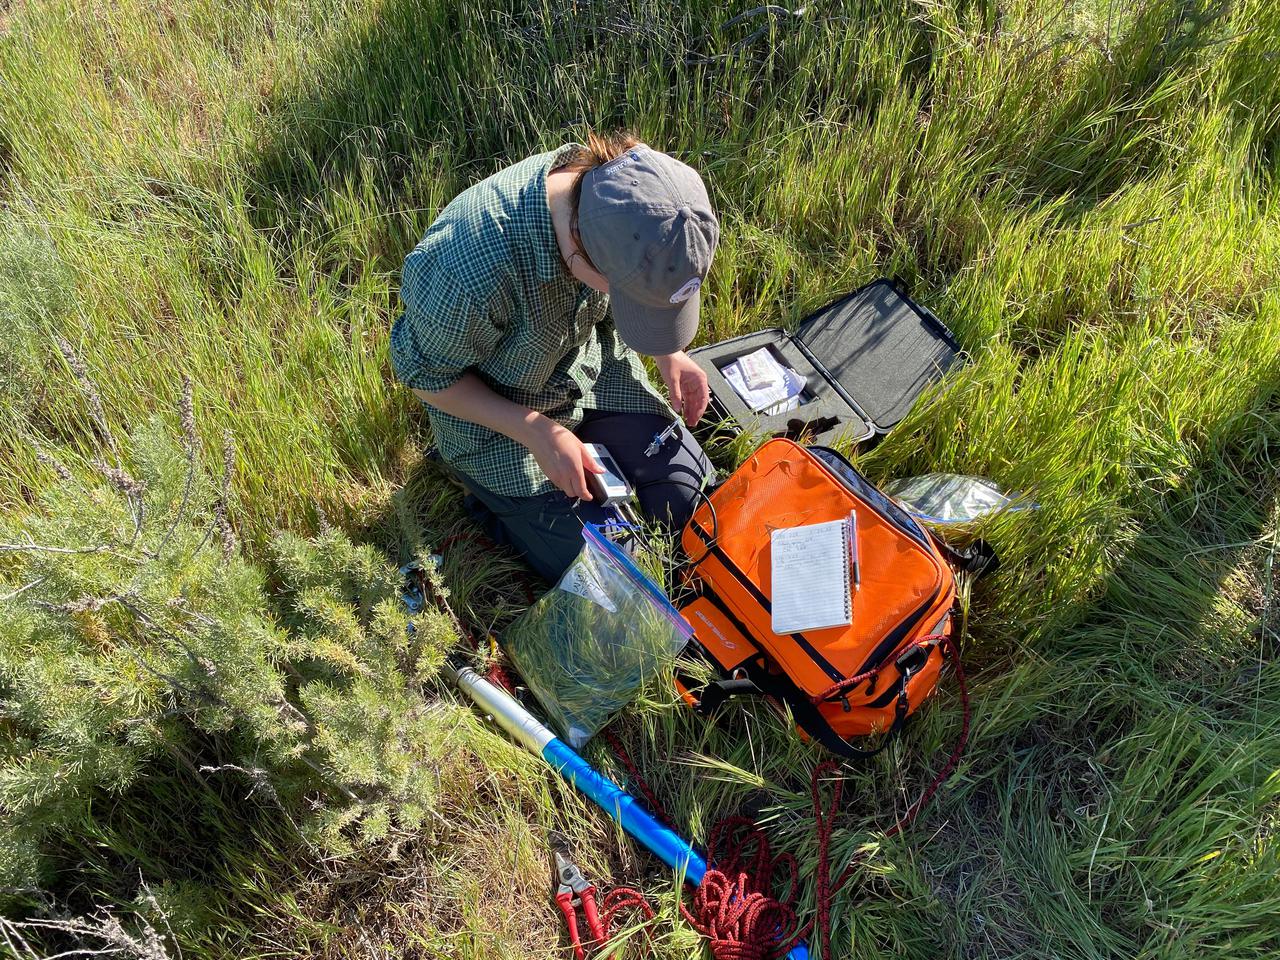
University of California, Santa Barbara (UCSB) student Piper Lovegreen calibrates a sensor to measure leaf chlorophyl content of vegetation at the Jack and Laura Dangermond Preserve in Santa Barbara County on March 23, 2022. Lovegreen is among the researchers working on the Surface Biology and Geology High-Frequency Time Series (SHIFT) campaign, which is jointly led by NASA's Jet Propulsion Laboratory, UCSB, and The Nature Conservancy. Operating between late February and late May 2022, SHIFT combines the ability of airborne science instruments to gather data over widespread areas with the more concentrated observations scientists conduct in the field to study the functional characteristics, health, and resilience of plant communities. The sampling and analysis done by researchers on the ground and in the ocean is intended to validate data taken by AVIRIS-NG (Airborne Visible/Infrared Imaging Spectrometer-Next Generation). The instrument, designed at JPL, is collecting spectral data of vegetation it observes during weekly flights in an aircraft over a 640-square-mile (1,656-square-kilometer) study area in Santa Barbara County and coastal Pacific waters. The campaign is a pathfinder for NASA's proposed Surface Biology and Geology (SBG) mission. SHIFT will help scientists design data collection and processing algorithms for that mission, which would launch no earlier than 2028. The SHIFT data is also intended to support the research and conservation objectives of The Nature Conservancy, which owns the Dangermond Preserve, and UCSB, which operates the Sedgwick Reserve, another nature preserve within the study area. More than 60 scientists from institutions around the U.S. have indicated they intend to use the SHIFT data in their research. https://photojournal.jpl.nasa.gov/catalog/PIA25142
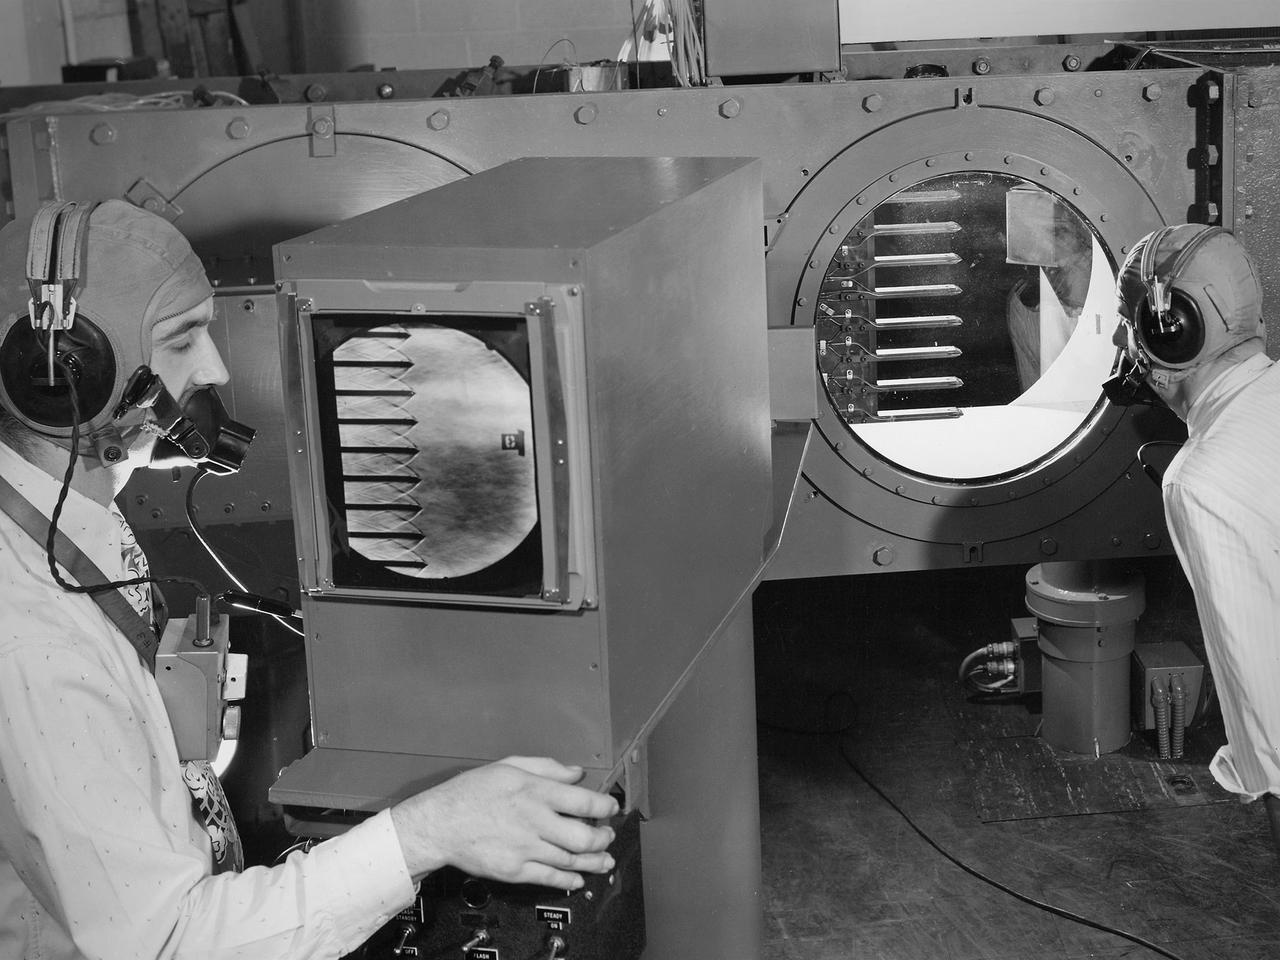
Engineers calibrate one of three small supersonic wind tunnels that were collectively referred to as the “Stack Tunnels” at the National Advisory Committee for Aeronautics (NACA) Lewis Flight Propulsion Laboratory. In late 1945 NACA Lewis reorganized its staff and began constructing a new wave of facilities to address high-speed flight and the turbojet and rocket technologies that emerged during World War II. While design work began on what would eventually become the 8- by 6-Foot Supersonic Wind Tunnel, NACA Lewis quickly built several small supersonic tunnels. These small facilities utilized the Altitude Wind Tunnel’s massive air handling equipment. Three of the small tunnels were built vertically on top of each other and thus were known as the Stack Tunnels. The first of the Stack Tunnels was an 18- by 18-inch tunnel that began operating in August 1945 at speeds up to Mach 1.91. The second tunnel, whose 24- by 24-inch test section is shown here, was added in 1949. It could generate air flows up to Mach 3.96. A third tunnel with an 18- by 18-inch test section began operating in 1951 with speeds up to Mach 3.05. The small tunnels were used until the early 1960s to study the aerodynamic characteristics of supersonic inlets and exits. The technician to the left in this photograph is operating a Schlieren camera to view the air flow dynamics inside the 24- by 24-inch test section. The technician on the right is viewing the pronged test article through the circular window. They are calibrating the tunnel and its equipment to prepare for the initial test runs.
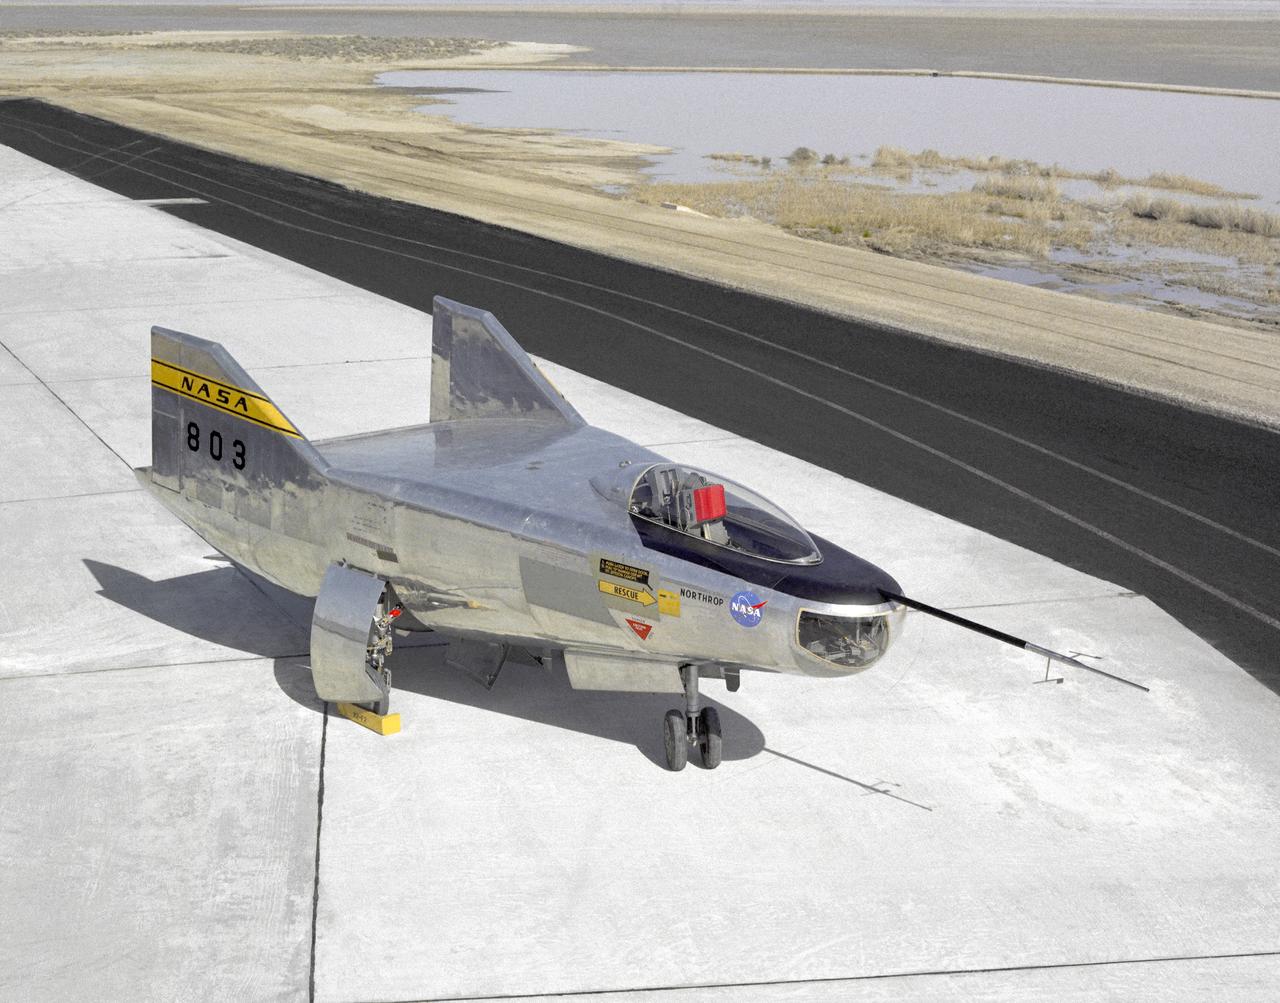
The M2-F2 Lifting Body is seen here on the ramp at the NASA Dryden Flight Research Center. The success of Dryden's M2-F1 program led to NASA's development and construction of two heavyweight lifting bodies based on studies at NASA's Ames and Langley research centers -- the M2-F2 and the HL-10, both built by the Northrop Corporation. The "M" refers to "manned" and "F" refers to "flight" version. "HL" comes from "horizontal landing" and 10 is for the tenth lifting body model to be investigated by Langley. The first flight of the M2-F2 -- which looked much like the "F1" -- was on July 12, 1966. Milt Thompson was the pilot. By then, the same B-52 used to air launch the famed X-15 rocket research aircraft was modified to also carry the lifting bodies. Thompson was dropped from the B-52's wing pylon mount at an altitude of 45,000 feet on that maiden glide flight. The M2-F2 weighed 4,620 pounds, was 22 feet long, and had a width of about 10 feet. On May 10, 1967, during the sixteenth glide flight leading up to powered flight, a landing accident severely damaged the vehicle and seriously injured the NASA pilot, Bruce Peterson. NASA pilots and researchers realized the M2-F2 had lateral control problems, even though it had a stability augmentation control system. When the M2-F2 was rebuilt at Dryden and redesignated the M2-F3, it was modified with an additional third vertical fin -- centered between the tip fins -- to improve control characteristics. The M2-F2/F3 was the first of the heavy-weight, entry-configuration lifting bodies. Its successful development as a research test vehicle answered many of the generic questions about these vehicles. NASA donated the M2-F3 vehicle to the Smithsonian Institute in December 1973. It is currently hanging in the Air and Space Museum along with the X-15 aircraft number 1, which was its hangar partner at Dryden from 1965 to 1969.
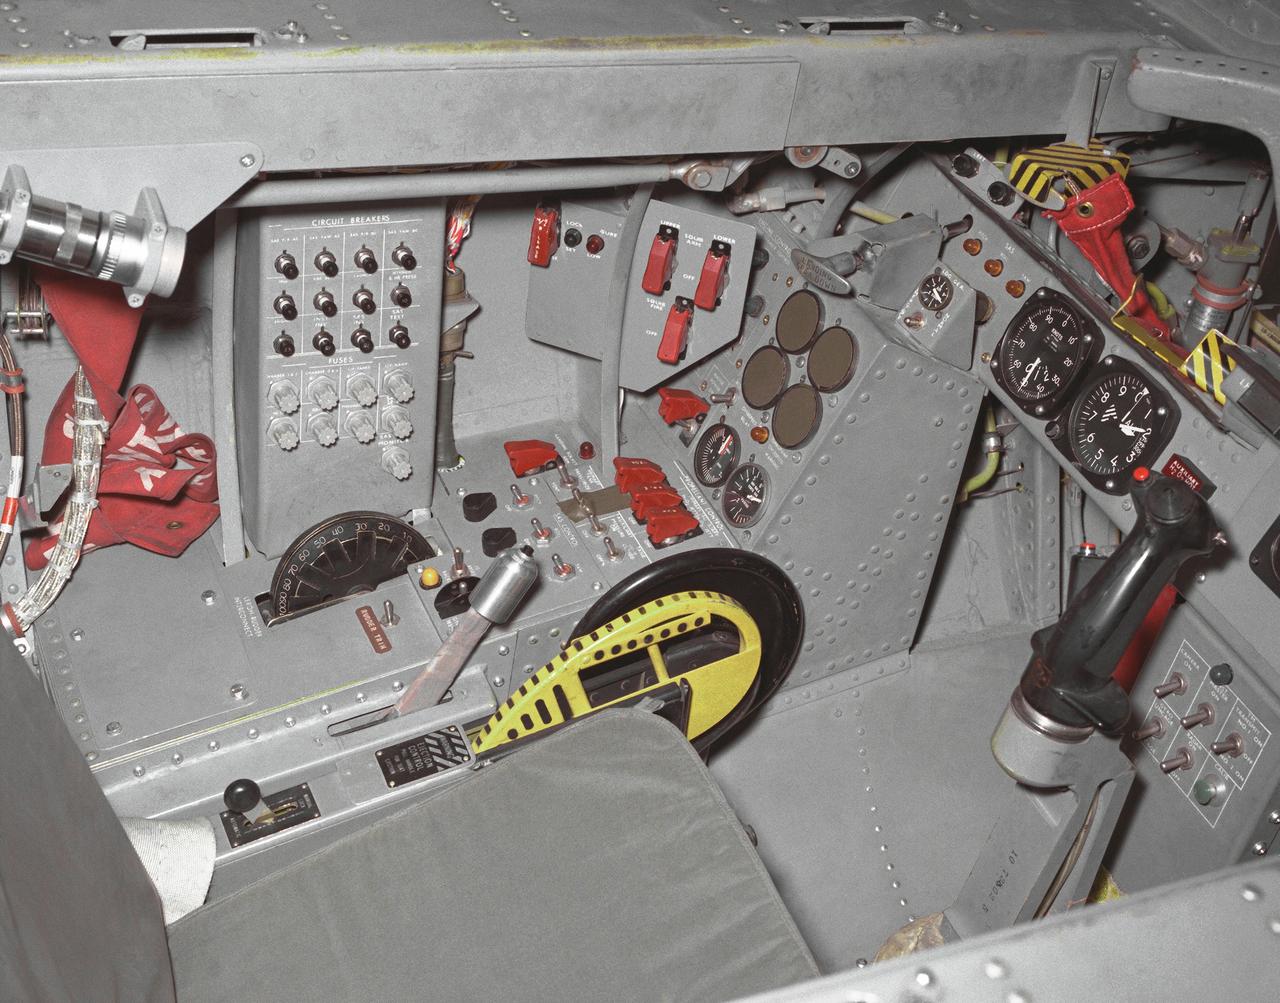
This photo shows the left side cockpit instrumentation panel of the M2-F2 Lifting Body. The success of Dryden's M2-F1 program led to NASA's development and construction of two heavyweight lifting bodies based on studies at NASA's Ames and Langley research centers -- the M2-F2 and the HL-10, both built by the Northrop Corporation. The "M" refers to "manned" and "F" refers to "flight" version. "HL" comes from "horizontal landing" and 10 is for the tenth lifting body model to be investigated by Langley. The first flight of the M2-F2 -- which looked much like the "F1" -- was on July 12, 1966. Milt Thompson was the pilot. By then, the same B-52 used to air launch the famed X-15 rocket research aircraft was modified to also carry the lifting bodies. Thompson was dropped from the B-52's wing pylon mount at an altitude of 45,000 feet on that maiden glide flight. The M2-F2 weighed 4,620 pounds, was 22 feet long, and had a width of about 10 feet. On May 10, 1967, during the sixteenth glide flight leading up to powered flight, a landing accident severely damaged the vehicle and seriously injured the NASA pilot, Bruce Peterson. NASA pilots and researchers realized the M2-F2 had lateral control problems, even though it had a stability augmentation control system. When the M2-F2 was rebuilt at Dryden and redesignated the M2-F3, it was modified with an additional third vertical fin -- centered between the tip fins -- to improve control characteristics. The M2-F2/F3 was the first of the heavy-weight, entry-configuration lifting bodies. Its successful development as a research test vehicle answered many of the generic questions about these vehicles. NASA donated the M2-F3 vehicle to the Smithsonian Institute in December 1973. It is currently hanging in the Air and Space Museum along with the X-15 aircraft number 1, which was its hangar partner at Dryden from 1965 to 1969.
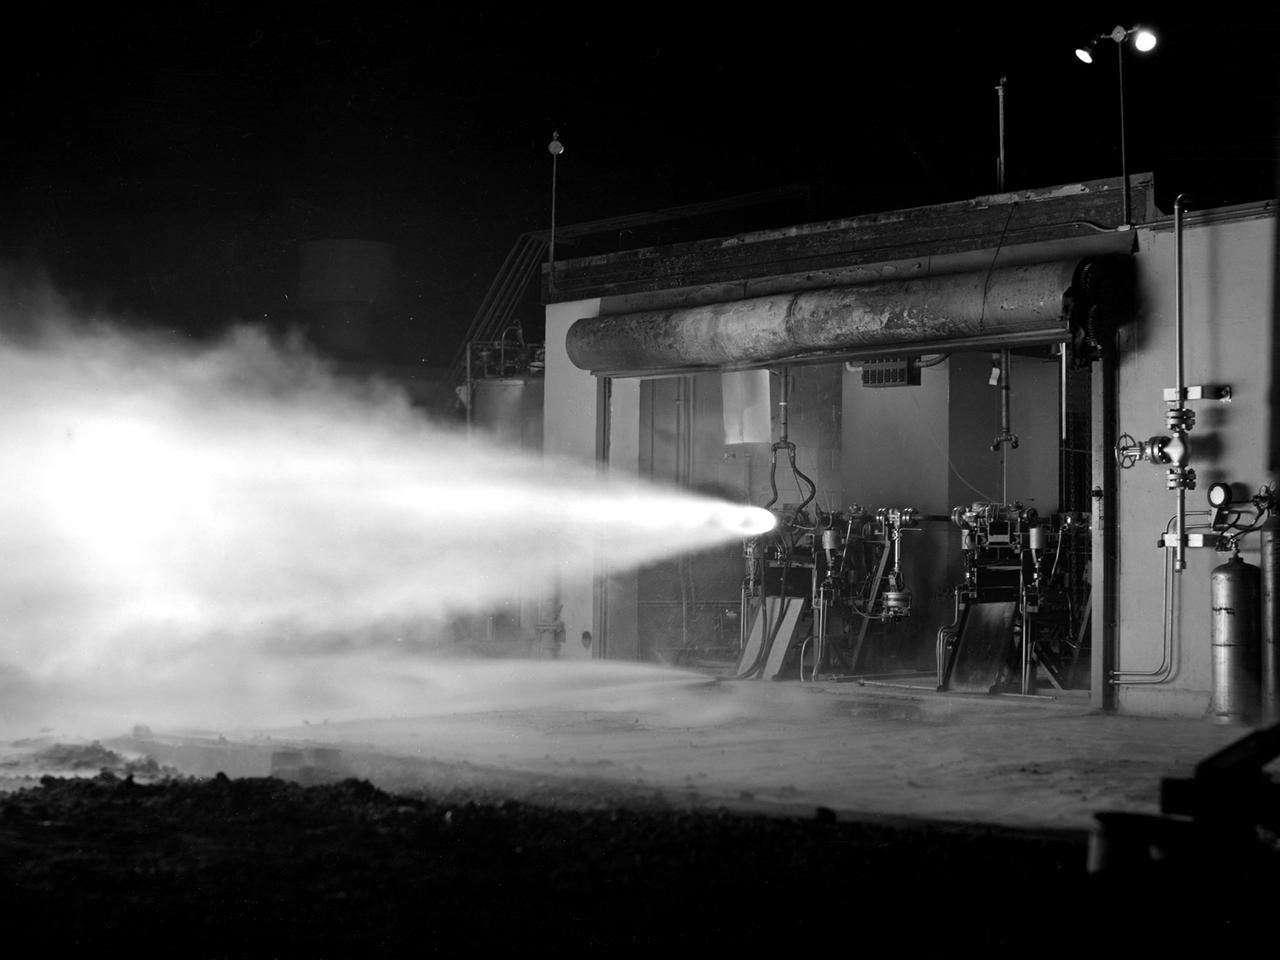
A rocket using high-energy propellant is fired from the Rocket Laboratory at the National Advisory Committee for Aeronautics (NACA) Lewis Flight Propulsion Laboratory. The Rocket Lab was a collection of ten one-story cinderblock test cells located behind earthen barriers at the western edge of the campus. The rocket engines tested there were comparatively small, but the Lewis researchers were able to study different configurations, combustion performance, and injectors and nozzle design. The rockets were generally mounted horizontally and fired, as seen in this photograph of Test Cell No. 22. A group of fuels researchers at Lewis refocused their efforts after World War II in order to explore high energy propellants, combustion, and cooling. Research in these three areas began in 1945 and continued through the 1960s. The group of rocket researches was not elevated to a division branch until 1952. The early NACA Lewis work led to the development of liquid hydrogen as a viable propellant in the late 1950s. Following the 1949 reorganization of the research divisions, the rocket group began working with high-energy propellants such as diborane, pentaborane, and hydrogen. The lightweight fuels offered high levels of energy but were difficult to handle and required large tanks. In late 1954, Lewis researchers studied the combustion characteristics of gaseous hydrogen in a turbojet combustor. Despite poor mixing of the fuel and air, it was found that the hydrogen yielded more than a 90-percent efficiency. Liquid hydrogen became the focus of Lewis researchers for the next 15 years.
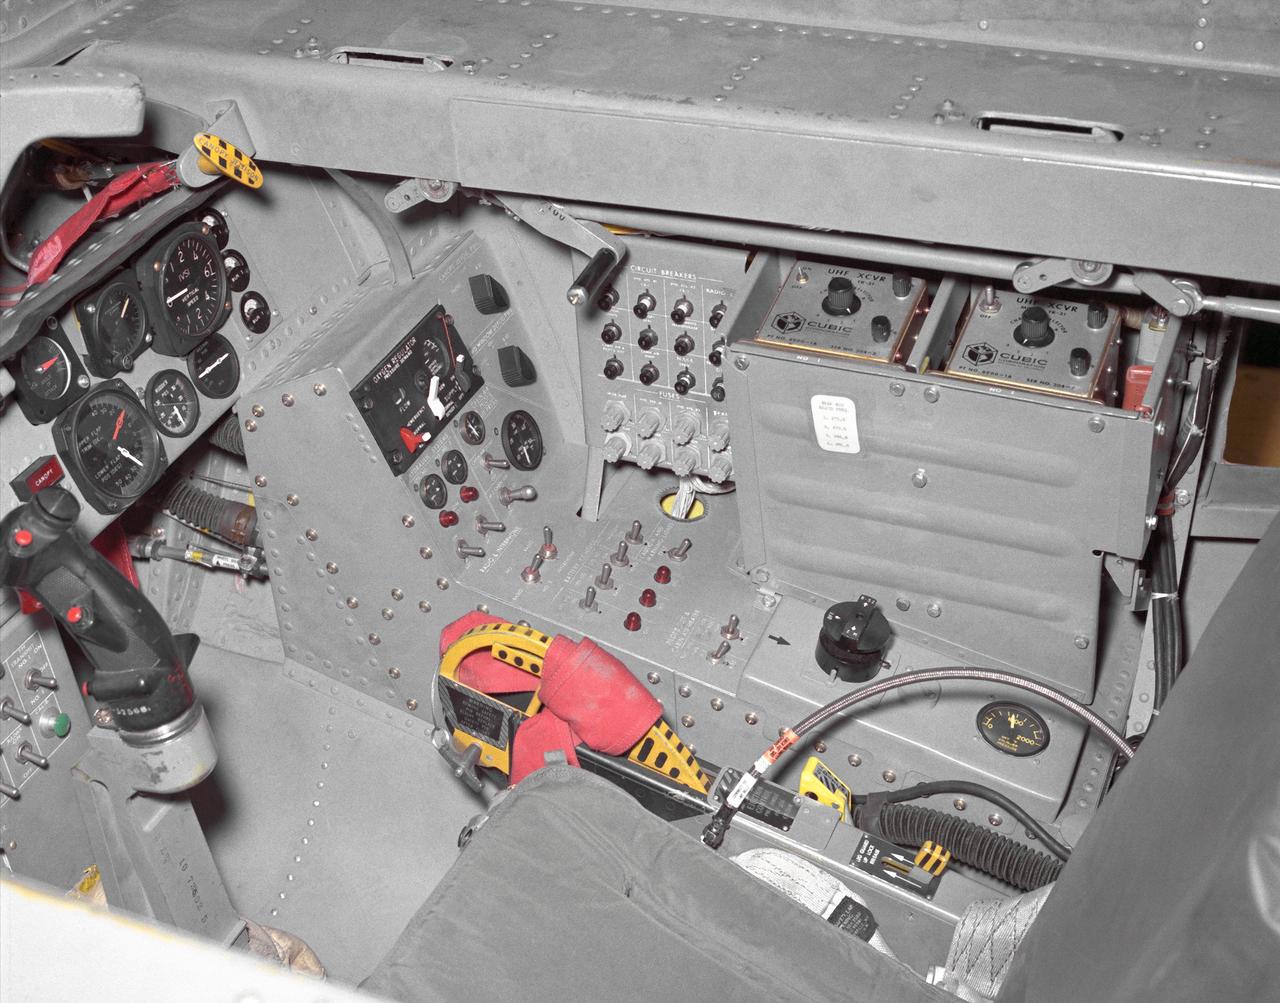
This photo shows the right side cockpit instrumentation panel of the M2-F2 Lifting Body. The success of Dryden's M2-F1 program led to NASA's development and construction of two heavyweight lifting bodies based on studies at NASA's Ames and Langley research centers -- the M2-F2 and the HL-10, both built by the Northrop Corporation. The "M" refers to "manned" and "F" refers to "flight" version. "HL" comes from "horizontal landing" and 10 is for the tenth lifting body model to be investigated by Langley. The first flight of the M2-F2 -- which looked much like the "F1" -- was on July 12, 1966. Milt Thompson was the pilot. By then, the same B-52 used to air launch the famed X-15 rocket research aircraft was modified to also carry the lifting bodies. Thompson was dropped from the B-52's wing pylon mount at an altitude of 45,000 feet on that maiden glide flight. The M2-F2 weighed 4,620 pounds, was 22 feet long, and had a width of about 10 feet. On May 10, 1967, during the sixteenth glide flight leading up to powered flight, a landing accident severely damaged the vehicle and seriously injured the NASA pilot, Bruce Peterson. NASA pilots and researchers realized the M2-F2 had lateral control problems, even though it had a stability augmentation control system. When the M2-F2 was rebuilt at Dryden and redesignated the M2-F3, it was modified with an additional third vertical fin -- centered between the tip fins -- to improve control characteristics. The M2-F2/F3 was the first of the heavy-weight, entry-configuration lifting bodies. Its successful development as a research test vehicle answered many of the generic questions about these vehicles. NASA donated the M2-F3 vehicle to the Smithsonian Institute in December 1973. It is currently hanging in the Air and Space Museum along with the X-15 aircraft number 1, which was its hangar partner at Dryden from 1965 to 1969.
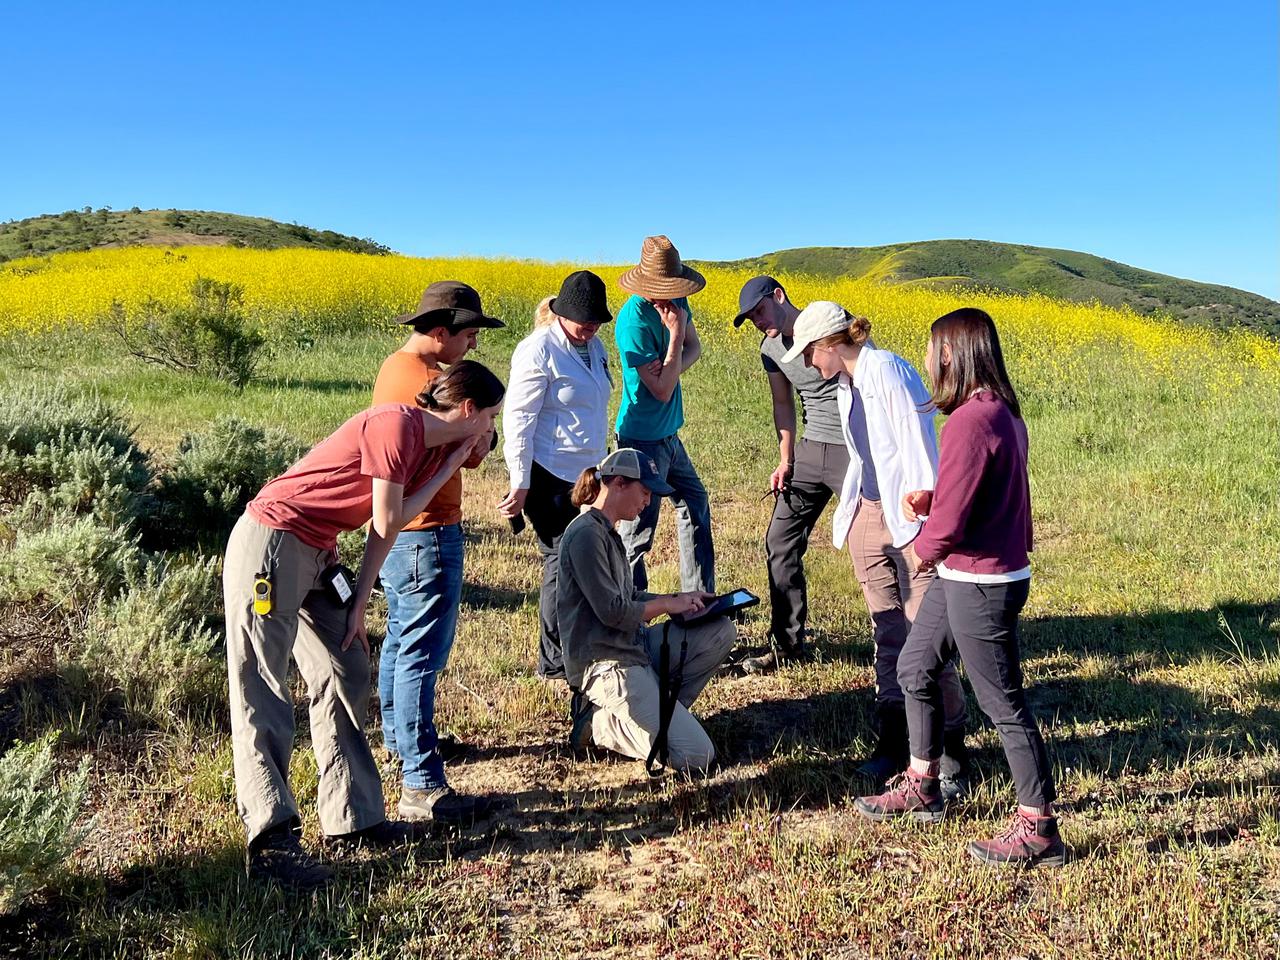
Dana Chadwick, a scientist in the water and ecosystems group at NASA's Jet Propulsion Laboratory, center, advises a field team of researchers from JPL; University of Wisconsin, Madison (UWM); University of California, Los Angeles (UCLA); University of Maryland, Baltimore County (UMBC); and University of California, Santa Barbara (UCSB) on vegetation-sampling locations at the Jack and Laura Dangermond Preserve in Santa Barbara County, California, on March 24, 2022. Chadwick and the team are working on the Surface Biology and Geology High-Frequency Time Series (SHIFT) campaign, which is jointly led by JPL, UCSB, and The Nature Conservancy. Chadwick is surrounded by, from left: Natalie Queally, a forest and wildlife ecology graduate student at UWM; Francisco Ochoa, a geography graduate student at UCLA; Petya Campbell, a research associate professor at UMBC and a research associate at NASA's Goddard Space Flight Center; Brendan Heberlein, a research intern at UWM; Renato Braghiere, a postdoctoral research scientist at JPL; Cassandra Nickles, a postdoctoral fellow at JPL; and Clare Saiki, a doctoral student at UCSB. Operating between late February and late May 2022, SHIFT combines the ability of airborne science instruments to gather data over widespread areas with the more concentrated observations scientists conduct in the field to study the functional characteristics, health, and resilience of plant communities. The sampling and analysis done by researchers on the ground and in the ocean is intended to validate data taken by AVIRIS-NG (Airborne Visible/Infrared Imaging Spectrometer-Next Generation). The instrument, designed at JPL, is collecting spectral data of vegetation it observes during weekly flights in an aircraft over a 640-square-mile (1,656-square-kilometer) study area in Santa Barbara County and coastal Pacific waters. The campaign is a pathfinder for NASA's proposed Surface Biology and Geology (SBG) mission. SHIFT will help scientists design data collection and processing algorithms for that mission, which would launch no earlier than 2028. The SHIFT data is also intended to support the research and conservation objectives of The Nature Conservancy, which owns the Dangermond Preserve, and UCSB, which operates the Sedgwick Reserve, another nature preserve within the study area. More than 60 scientists from institutions around the U.S. have indicated they intend to use the SHIFT data in their research. https://photojournal.jpl.nasa.gov/catalog/PIA25141

This composite image of the Jovian moon Io was generated using data collected by the JunoCam imager aboard NASA's Juno spacecraft during four separate flybys. The resolution of the images gets progressively better as the distance between spacecraft and moon decreases with each flyby. The image of the moon on the far left has a resolution 44 miles (71 kilometers) per pixel. It was taken on April 9, 2022, during Juno's 41st orbit of Jupiter (perijove 41, or PJ41), when the spacecraft flew past Io at a distance of about 66,000 miles (106,000 kilometers). Note the gray, roughly triangular patch at the terminator near the moon's center. Citizen scientist Björn Jónsson created this image using data from JunoCam. The center-left image was acquired on July 5, 2022, during Juno's 43rd orbit of Jupiter (PJ43) at a distance of 53,000 miles (86,000 kilometers). The resolution in this image has improved to 36 miles (58 kilometers) per pixel. In this view, more detail of the gray patch is seen (from a different perspective). Citizen scientist Jason Perry created this image using data from JunoCam. By the time the center-right image of Io was taken on Dec. 14, 2022, (PJ47), the distance between spacecraft and moon had decreased to 40,000 miles (64,000 kilometers), which increased the resolution to 27 miles (43 kilometers) per pixel. Here, the gray triangle appears as three distinct volcanoes with the central vents visible as dark spots in their centers. Characteristics of other nearby volcanoes also begin to stand out. Citizen scientist Mike Ravine created this image using data from JunoCam. The far-right image, taken during Juno's 49th flyby (PJ49) on March 1, 2023, shows that the spacecraft again approached the moon from a changed perspective, allowing different territory on Io's surface to be viewed. The triplet of volcanoes that make up the gray triangular patch are visible near the top of the image, and more detail of the volcanic terrain can be made out. The altitude at the time of closest approach was about 32,000 miles (51,500 kilometers), allowing resolution to increase to 22 miles (35 kilometers) per pixel. Citizen scientist Kevin M. Gill created this image using data from JunoCam. https://photojournal.jpl.nasa.gov/catalog/PIA25887
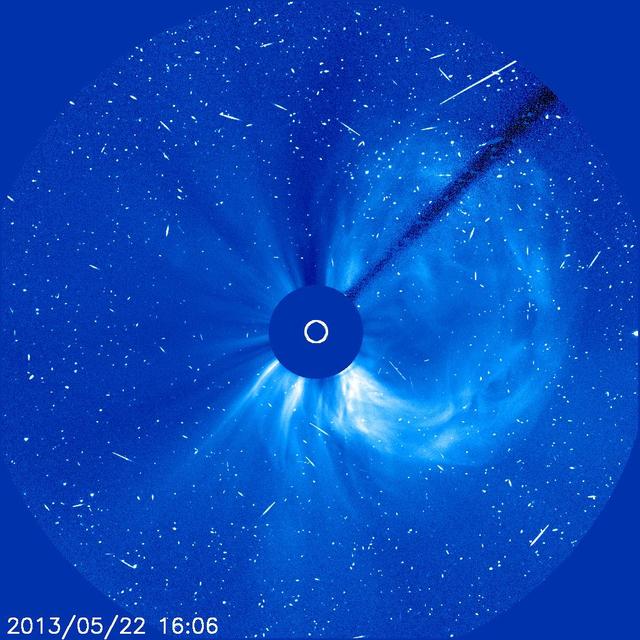
A solar flare associated with the coronal mass ejection seen in this image generated a flurry of fast-moving solar protons. As each one hits the CCD camera on SOHO, it produces a brief snow-like speckle in the image. Credit: NASA/SOHO CME WEEK: What To See in CME Images Two main types of explosions occur on the sun: solar flares and coronal mass ejections. Unlike the energy and x-rays produced in a solar flare – which can reach Earth at the speed of light in eight minutes – coronal mass ejections are giant, expanding clouds of solar material that take one to three days to reach Earth. Once at Earth, these ejections, also called CMEs, can impact satellites in space or interfere with radio communications. During CME WEEK from Sept. 22 to 26, 2014, we explore different aspects of these giant eruptions that surge out from the star we live with. When a coronal mass ejection blasts off the sun, scientists rely on instruments called coronagraphs to track their progress. Coronagraphs block out the bright light of the sun, so that the much fainter material in the solar atmosphere -- including CMEs -- can be seen in the surrounding space. CMEs appear in these images as expanding shells of material from the sun's atmosphere -- sometimes a core of colder, solar material (called a filament) from near the sun's surface moves in the center. But mapping out such three-dimensional components from a two-dimensional image isn't easy. Watch the slideshow to find out how scientists interpret what they see in CME pictures. The images in the slideshow are from the three sets of coronagraphs NASA currently has in space. One is on the joint European Space Agency and NASA Solar and Heliospheric Observatory, or SOHO. SOHO launched in 1995, and sits between Earth and the sun about a million miles away from Earth. The other two coronagraphs are on the two spacecraft of the NASA Solar Terrestrial Relations Observatory, or STEREO, mission, which launched in 2006. The two STEREO spacecraft are both currently viewing the far side of the sun. Together these instruments help scientists create a three-dimensional model of any CME as its journey unfolds through interplanetary space. Such information can show why a given characteristic of a CME close to the sun might lead to a given effect near Earth, or any other planet in the solar system...<b><a href="http://www.nasa.gov/audience/formedia/features/MP_Photo_Guidelines.html" rel="nofollow">NASA image use policy.</a></b> <b><a href="http://www.nasa.gov/centers/goddard/home/index.html" rel="nofollow">NASA Goddard Space Flight Center</a></b> enables NASA’s mission through four scientific endeavors: Earth Science, Heliophysics, Solar System Exploration, and Astrophysics. Goddard plays a leading role in NASA’s accomplishments by contributing compelling scientific knowledge to advance the Agency’s mission. <b>Follow us on <a href="http://twitter.com/NASAGoddardPix" rel="nofollow">Twitter</a></b> <b>Like us on <a href="http://www.facebook.com/pages/Greenbelt-MD/NASA-Goddard/395013845897?ref=tsd" rel="nofollow">Facebook</a></b> <b>Find us on <a href="http://instagram.com/nasagoddard?vm=grid" rel="nofollow">Instagram</a></b>
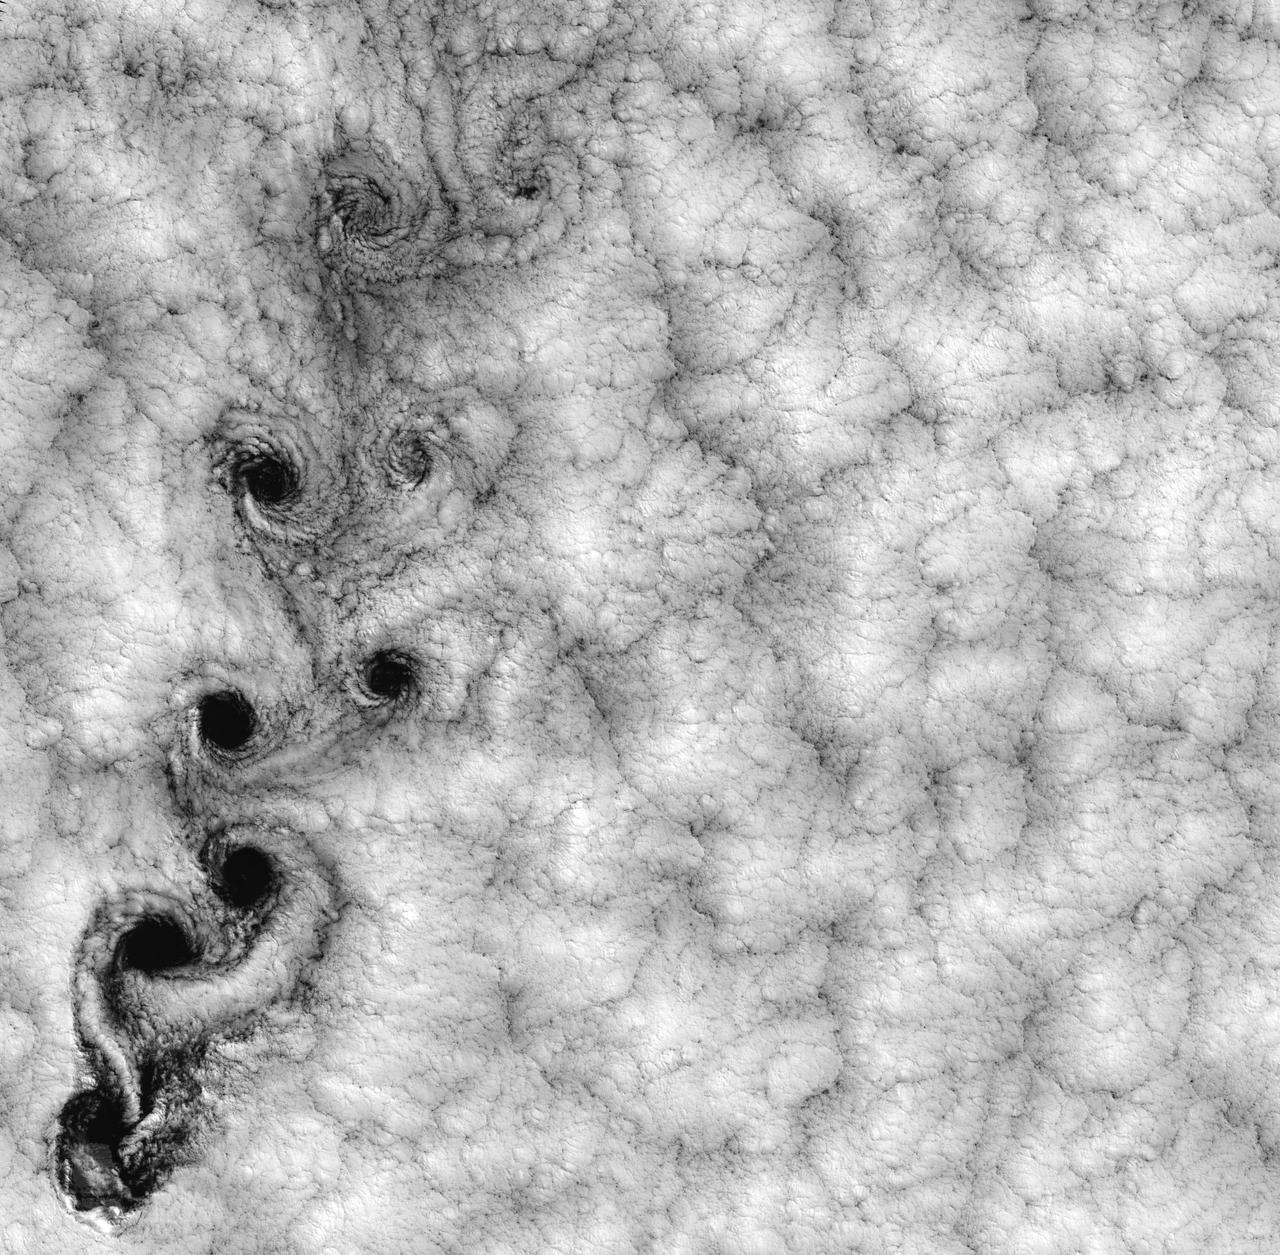
NASA image acquired September 15, 1999 This Landsat 7 image of clouds off the Chilean coast near the Juan Fernandez Islands (also known as the Robinson Crusoe Islands) on September 15, 1999, shows a unique pattern called a “von Karman vortex street.” This pattern has long been studied in the laboratory, where the vortices are created by oil flowing past a cylindrical obstacle, making a string of vortices only several tens of centimeters long. Study of this classic “flow past a circular cylinder” has been very important in the understanding of laminar and turbulent fluid flow that controls a wide variety of phenomena, from the lift under an aircraft wing to Earth’s weather. Here, the cylinder is replaced by Alejandro Selkirk Island (named after the true “Robinson Crusoe,” who was stranded here for many months in the early 1700s). The island is about 1.5 km in diameter, and rises 1.6 km into a layer of marine stratocumulus clouds. This type of cloud is important for its strong cooling of the Earth’s surface, partially counteracting the Greenhouse warming. An extended, steady equatorward wind creates vortices with clockwise flow off the eastern edge and counterclockwise flow off the western edge of the island. The vortices grow as they advect hundreds of kilometers downwind, making a street 10,000 times longer than those made in the laboratory. Observing the same phenomenon extended over such a wide range of sizes dramatizes the “fractal” nature of atmospheric convection and clouds. Fractals are characteristic of fluid flow and other dynamic systems that exhibit “chaotic” motions. Both clockwise and counter-clockwise vortices are generated by flow around the island. As the flow separates from the island’s leeward (away from the source of the wind) side, the vortices “swallow” some of the clear air over the island. (Much of the island air is cloudless due to a local “land breeze” circulation set up by the larger heat capacity of the waters surrounding the island.) The “swallowed” gulps of clear island air get carried along within the vortices, but these are soon mixed into the surrounding clouds. Landsat is unique in its ability to image both the small-scale eddies that mix clear and cloudy air, down to the 30 meter pixel size of Landsat, but also having a wide enough field-of-view, 180 km, to reveal the connection of the turbulence to large-scale flows such as the subtropical oceanic gyres. Landsat 7, with its new onboard digital recorder, has extended this capability away from the few Landsat ground stations to remote areas such as Alejandro Island, and thus is gradually providing a global dynamic picture of evolving human-scale phenomena. For more details on von Karman vortices, refer to <a href="http://climate.gsfc.nasa.gov/~cahalan" rel="nofollow">climate.gsfc.nasa.gov/~cahalan</a>. Image and caption courtesy Bob Cahalan, NASA GSFC Instrument: Landsat 7 - ETM+ Credit: NASA/GSFC/Landsat <b><a href="http://www.nasa.gov/centers/goddard/home/index.html" rel="nofollow">NASA Goddard Space Flight Center</a></b> enables NASA’s mission through four scientific endeavors: Earth Science, Heliophysics, Solar System Exploration, and Astrophysics. Goddard plays a leading role in NASA’s accomplishments by contributing compelling scientific knowledge to advance the Agency’s mission. <b>Follow us on <a href="http://twitter.com/NASA_GoddardPix" rel="nofollow">Twitter</a></b> <b>Join us on <a href="http://www.facebook.com/pages/Greenbelt-MD/NASA-Goddard/395013845897?ref=tsd" rel="nofollow">Facebook</a></b>
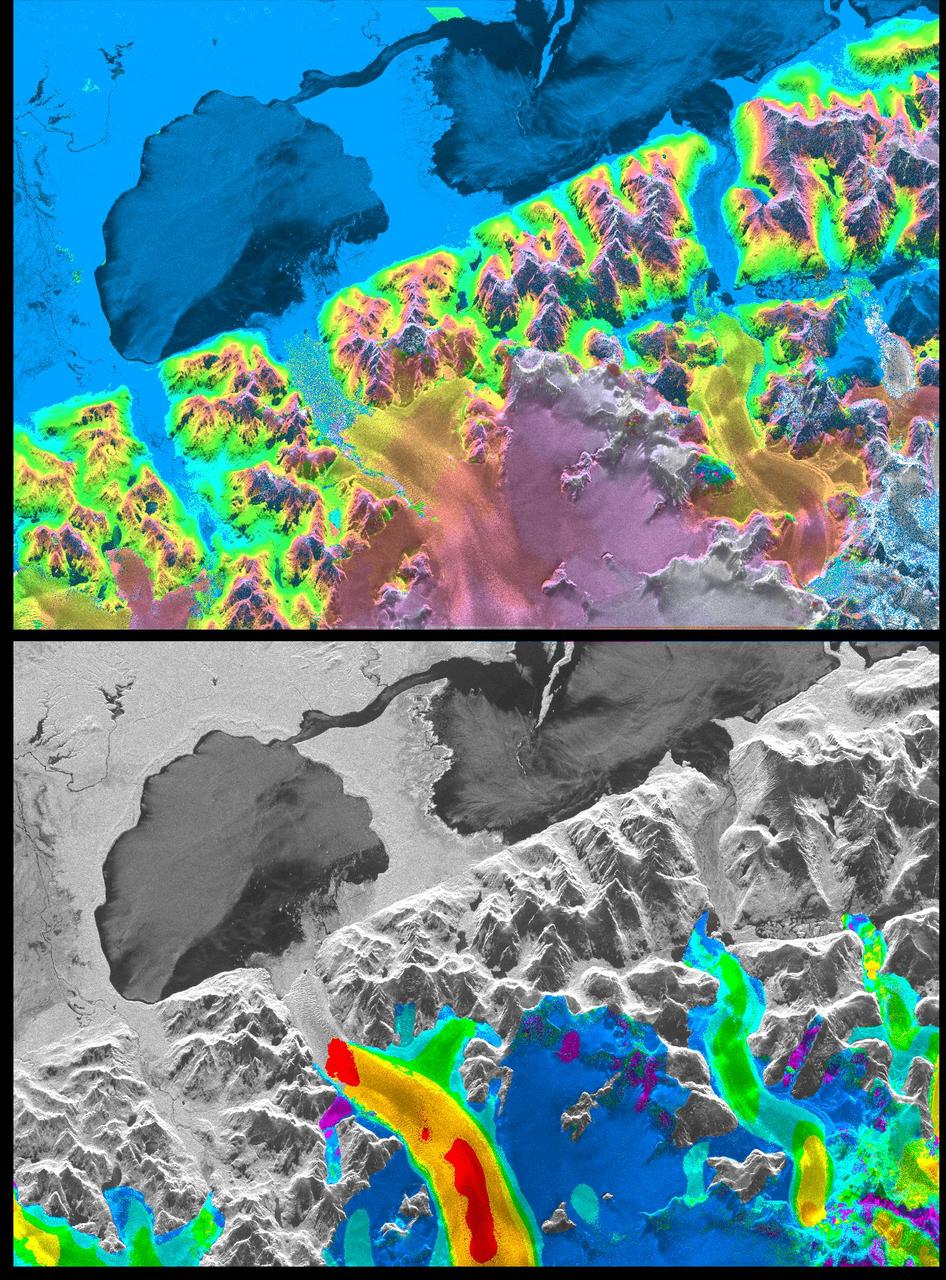
A NASA radar instrument has been successfully used to measure some of the fastest moving and most inaccessible glaciers in the world -- in Chile's huge, remote Patagonia ice fields -- demonstrating a technique that could produce more accurate predictions of glacial response to climate change and corresponding sea level changes. This image, produced with interferometric measurements made by the Spaceborne Imaging Radar-C and X-band Synthetic Aperture Radar (SIR-C/X-SAR) flown on the Space Shuttle last fall, has provided the first detailed measurements of the mass and motion of the San Rafael Glacier. Very few measurements have been made of the Patagonian ice fields, which are the world's largest mid-latitude ice masses and account for more than 60 percent of the Southern Hemisphere's glacial area outside of Antarctica. These features make the area essential for climatologists attempting to understand the response of glaciers on a global scale to changes in climate, but the region's inaccessibility and inhospitable climate have made it nearly impossible for scientists to study its glacial topography, meteorology and changes over time. Currently, topographic data exist for only a few glaciers while no data exist for the vast interior of the ice fields. Velocity has been measured on only five of the more than 100 glaciers, and the data consist of only a few single-point measurements. The interferometry performed by the SIR-C/X-SAR was used to generate both a digital elevation model of the glaciers and a map of their ice motion on a pixel-per-pixel basis at very high resolution for the first time. The data were acquired from nearly the same position in space on October 9, 10 and 11, 1994, at L-band frequency (24-cm wavelength), vertically transmitted and received polarization, as the Space Shuttle Endeavor flew over several Patagonian outlet glaciers of the San Rafael Laguna. The area shown in these two images is 50 kilometers by 30 kilometers (30 miles by 18 miles) in size and is centered at 46.6 degrees south latitude, 73.8 degrees west longitude. North is toward the upper right. The top image is a digital elevation model of the scene, where color and saturation represent terrain height (between 0 meters and 2,000 meters or up to 6,500 feet) and brightness represents radar backscatter. Low elevations are shown in blue and high elevations are shown in pink. The digital elevation map of the glacier surface has a horizontal resolution of 15 meters (50 feet) and a vertical resolution of 10 meters (30 feet). High-resolution maps like these acquired over several years would allow scientists to calculate directly long-term changes in the mass of the glacier. The bottom image is a map of ice motion parallel to the radar look direction only, which is from the top of the image. Purple indicates ice motion away from the radar at more than 6 centimeters per day; dark blue is ice motion toward or away at less than 6 cm per day; light blue is motion toward the radar of 6 cm to 20 cm (about 2 to 8 inches) per day; green is motion toward the radar of 20 cm to 45 cm (about 8 to 18 inches) per day; yellow is 45 cm to 85 cm (about 18 to 33 inches) per day; orange is 85 cm to 180 cm (about 33 to 71 inches) per day; red is greater than 180 cm (71 inches) per day. The velocity estimates are accurate to within 5 millimeters per day. The largest velocities are recorded on the San Rafael Glacier in agreement with previous work. Other outlet glaciers exhibit ice velocities of less than 1 meter per day. Several kilometers before its terminus, (left of center) the velocity of the San Rafael Glacier exceeds 10 meters (32 feet) per day, and ice motion cannot be estimated from the data. There, a revisit time interval of less than 12 hours would have been necessary to estimate ice motion from interferometry data. The results however demonstrate that the radar interferometry technique permits the monitoring of glacier characteristics unattainable by any other means. http://photojournal.jpl.nasa.gov/catalog/PIA01781