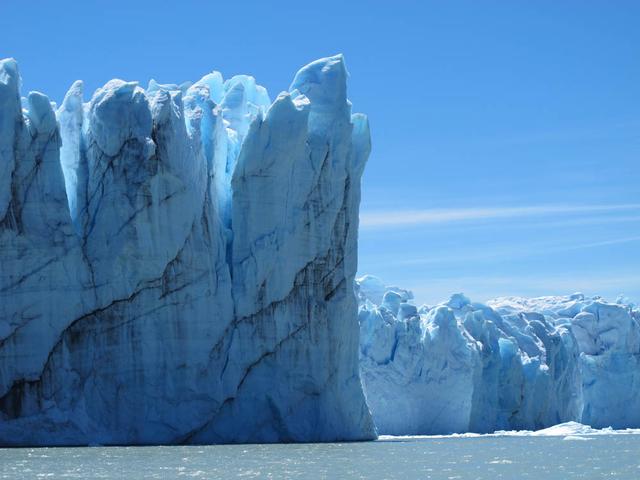
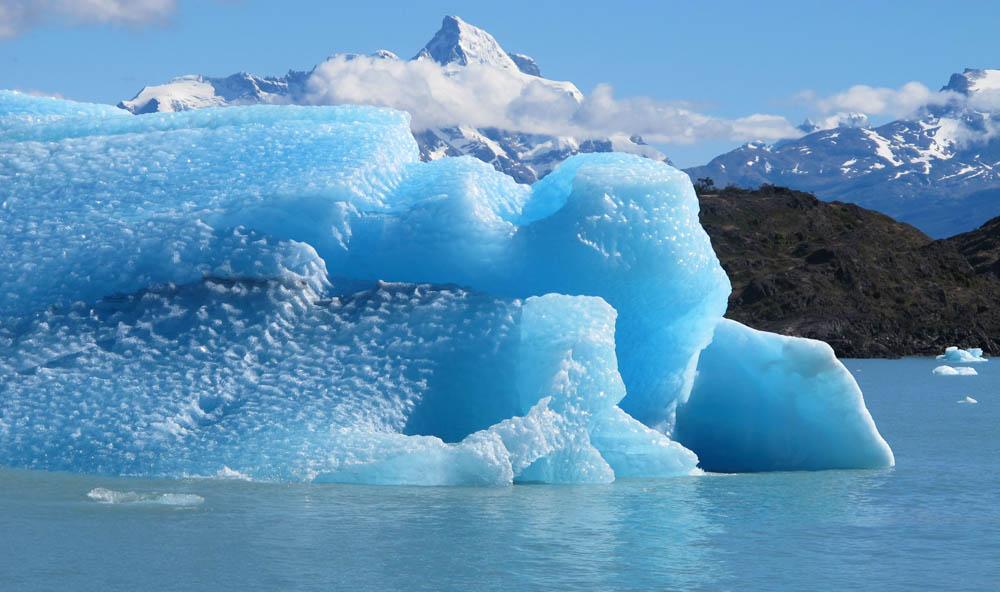
Calving front of the Perito Moreno Glacier (Argentina). Contrary to the majority of the glaciers from the southern Patagonian ice field, the Perito Moreno Glacier is currently stable. It is also one of the most visited glaciers in the world. To learn about the contributions of glaciers to sea level rise, visit: <a href="http://www.nasa.gov/topics/earth/features/glacier-sea-rise.html" rel="nofollow">www.nasa.gov/topics/earth/features/glacier-sea-rise.html</a> Credit: Etienne Berthier, Université de Toulouse <b><a href="http://www.nasa.gov/audience/formedia/features/MP_Photo_Guidelines.html" rel="nofollow">NASA image use policy.</a></b> <b><a href="http://www.nasa.gov/centers/goddard/home/index.html" rel="nofollow">NASA Goddard Space Flight Center</a></b> enables NASA’s mission through four scientific endeavors: Earth Science, Heliophysics, Solar System Exploration, and Astrophysics. Goddard plays a leading role in NASA’s accomplishments by contributing compelling scientific knowledge to advance the Agency’s mission. <b>Follow us on <a href="http://twitter.com/NASA_GoddardPix" rel="nofollow">Twitter</a></b> <b>Like us on <a href="http://www.facebook.com/pages/Greenbelt-MD/NASA-Goddard/395013845897?ref=tsd" rel="nofollow">Facebook</a></b> <b>Find us on <a href="http://instagram.com/nasagoddard?vm=grid" rel="nofollow">Instagram</a></b>
Calving front of the Perito Moreno Glacier (Argentina). Contrary to the majority of the glaciers from the southern Patagonian ice field, the Perito Moreno Glacier is currently stable. It is also one of the most visited glaciers in the world. To learn about the contributions of glaciers to sea level rise, visit: <a href="http://www.nasa.gov/topics/earth/features/glacier-sea-rise.html" rel="nofollow">www.nasa.gov/topics/earth/features/glacier-sea-rise.html</a> Credit: Etienne Berthier, Université de Toulouse <b><a href="http://www.nasa.gov/audience/formedia/features/MP_Photo_Guidelines.html" rel="nofollow">NASA image use policy.</a></b> <b><a href="http://www.nasa.gov/centers/goddard/home/index.html" rel="nofollow">NASA Goddard Space Flight Center</a></b> enables NASA’s mission through four scientific endeavors: Earth Science, Heliophysics, Solar System Exploration, and Astrophysics. Goddard plays a leading role in NASA’s accomplishments by contributing compelling scientific knowledge to advance the Agency’s mission. <b>Follow us on <a href="http://twitter.com/NASA_GoddardPix" rel="nofollow">Twitter</a></b> <b>Like us on <a href="http://www.facebook.com/pages/Greenbelt-MD/NASA-Goddard/395013845897?ref=tsd" rel="nofollow">Facebook</a></b> <b>Find us on <a href="http://instagram.com/nasagoddard?vm=grid" rel="nofollow">Instagram</a></b>
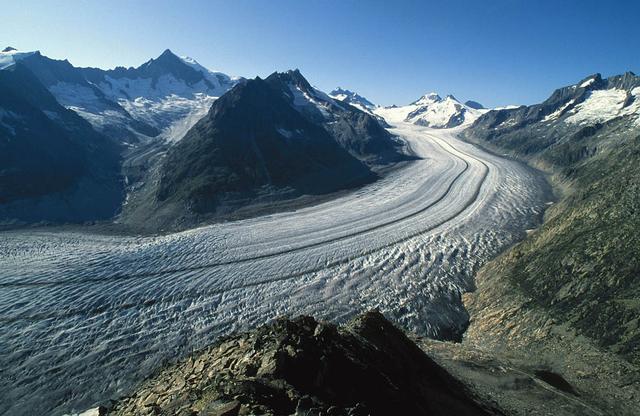
The Aletsch Glacier in Switzerland is the largest valley glacier in the Alps. Its volume loss since the middle of the 19th century is well-visible from the trimlines to the right of the image. To learn about the contributions of glaciers to sea level rise, visit: <a href="http://www.nasa.gov/topics/earth/features/glacier-sea-rise.html" rel="nofollow">www.nasa.gov/topics/earth/features/glacier-sea-rise.html</a> Credit: Frank Paul, University of Zurich <b><a href="http://www.nasa.gov/audience/formedia/features/MP_Photo_Guidelines.html" rel="nofollow">NASA image use policy.</a></b> <b><a href="http://www.nasa.gov/centers/goddard/home/index.html" rel="nofollow">NASA Goddard Space Flight Center</a></b> enables NASA’s mission through four scientific endeavors: Earth Science, Heliophysics, Solar System Exploration, and Astrophysics. Goddard plays a leading role in NASA’s accomplishments by contributing compelling scientific knowledge to advance the Agency’s mission. <b>Follow us on <a href="http://twitter.com/NASA_GoddardPix" rel="nofollow">Twitter</a></b> <b>Like us on <a href="http://www.facebook.com/pages/Greenbelt-MD/NASA-Goddard/395013845897?ref=tsd" rel="nofollow">Facebook</a></b> <b>Find us on <a href="http://instagram.com/nasagoddard?vm=grid" rel="nofollow">Instagram</a></b>
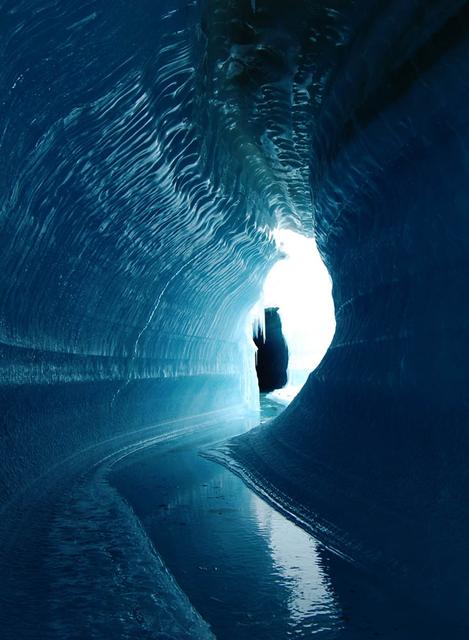
This ice cave in Belcher Glacier (Devon Island, Canada) was formed by melt water flowing within the glacier ice. To learn about the contributions of glaciers to sea level rise, visit: <a href="http://www.nasa.gov/topics/earth/features/glacier-sea-rise.html" rel="nofollow">www.nasa.gov/topics/earth/features/glacier-sea-rise.html</a> Credit: Angus Duncan, University of Saskatchewan <b><a href="http://www.nasa.gov/audience/formedia/features/MP_Photo_Guidelines.html" rel="nofollow">NASA image use policy.</a></b> <b><a href="http://www.nasa.gov/centers/goddard/home/index.html" rel="nofollow">NASA Goddard Space Flight Center</a></b> enables NASA’s mission through four scientific endeavors: Earth Science, Heliophysics, Solar System Exploration, and Astrophysics. Goddard plays a leading role in NASA’s accomplishments by contributing compelling scientific knowledge to advance the Agency’s mission. <b>Follow us on <a href="http://twitter.com/NASA_GoddardPix" rel="nofollow">Twitter</a></b> <b>Like us on <a href="http://www.facebook.com/pages/Greenbelt-MD/NASA-Goddard/395013845897?ref=tsd" rel="nofollow">Facebook</a></b> <b>Find us on <a href="http://instagram.com/nasagoddard?vm=grid" rel="nofollow">Instagram</a></b>
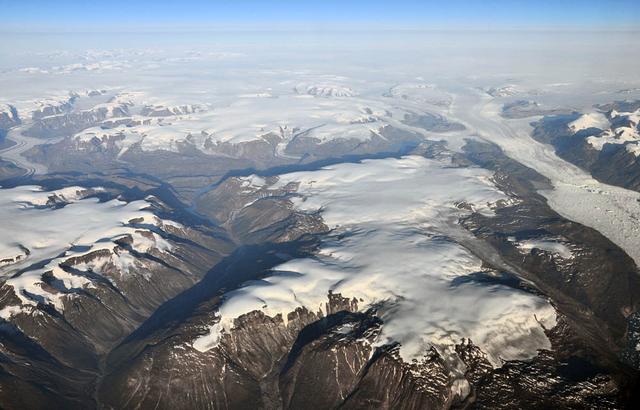
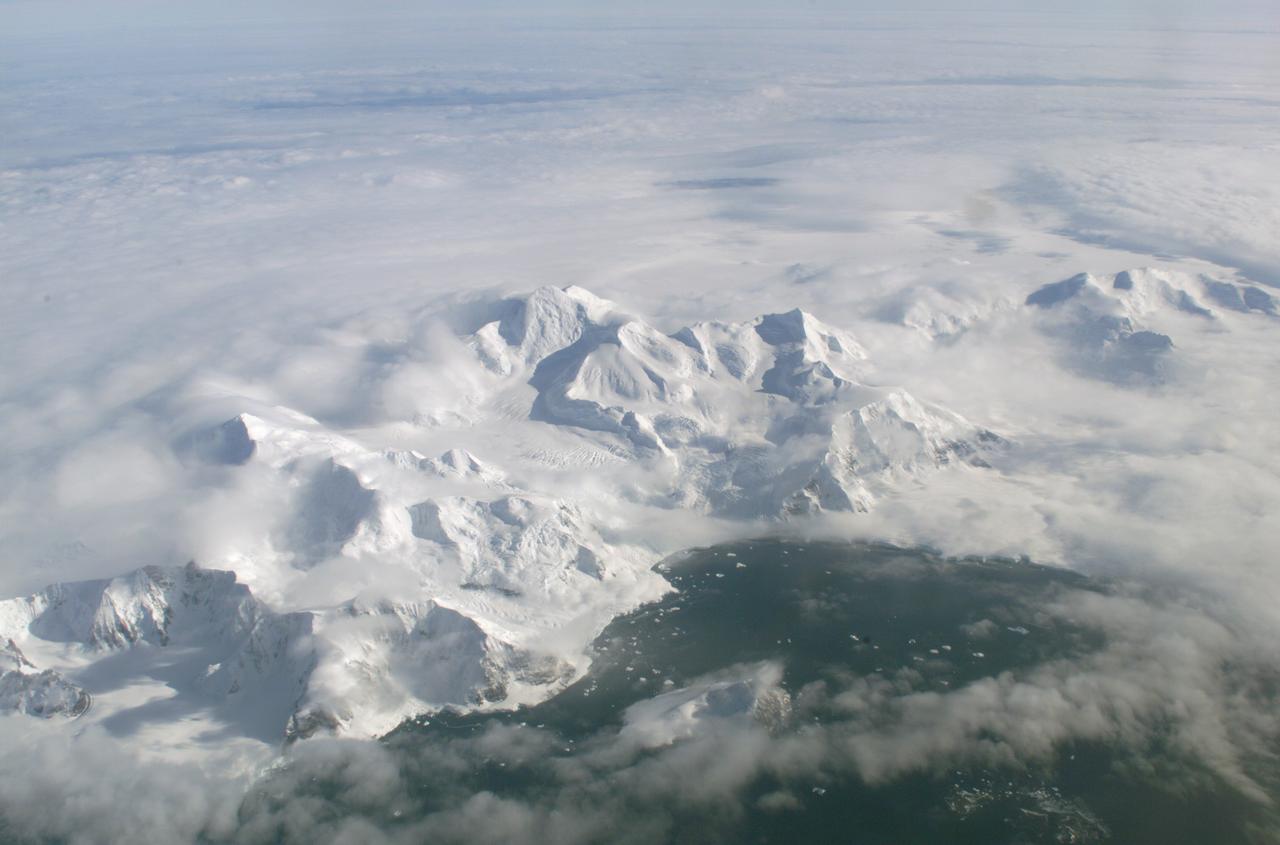
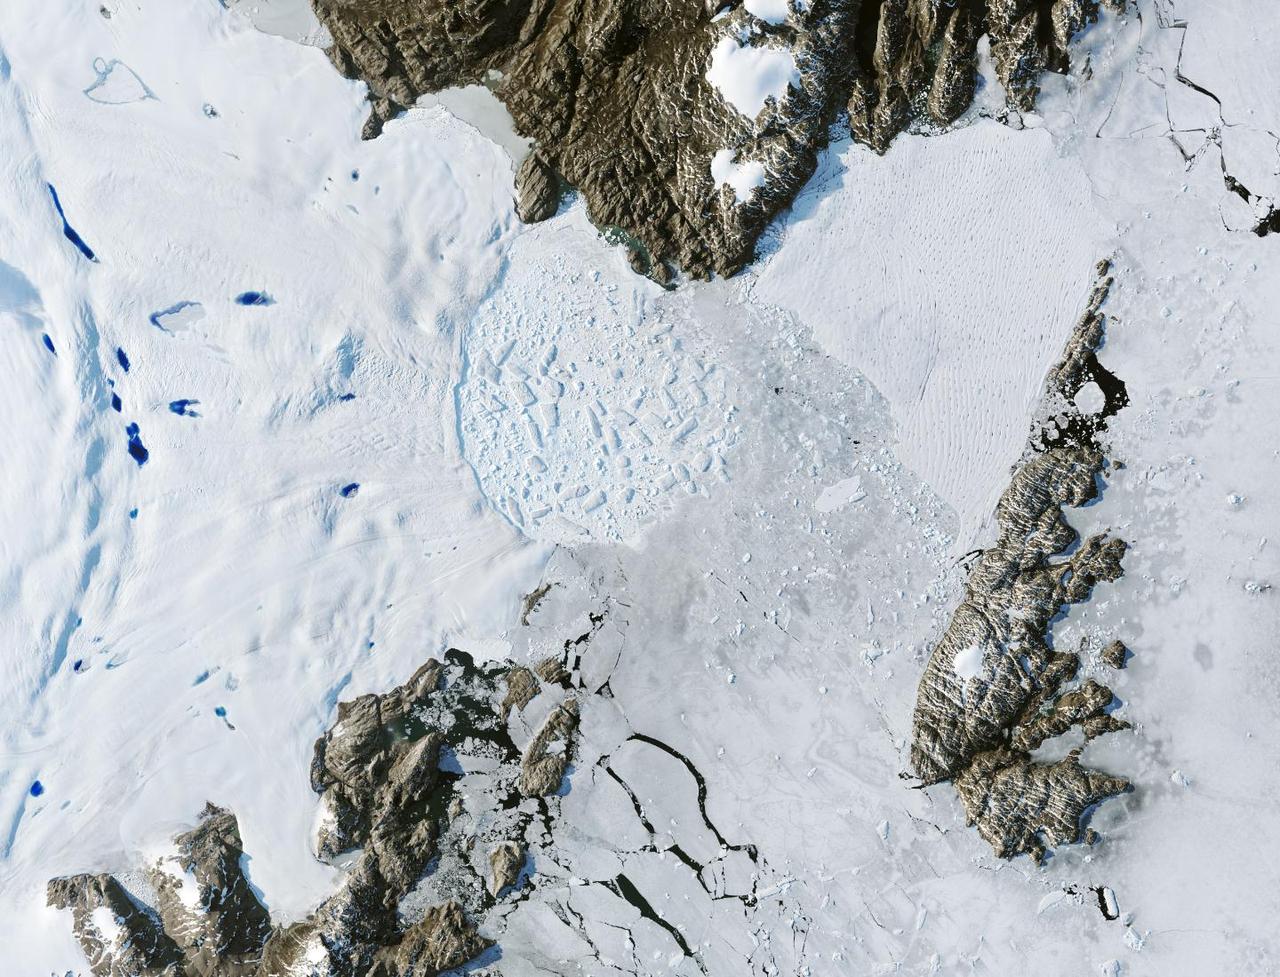
Peripheral glaciers and ice caps (isolated from the main ice sheet, which is seen in the upper right section of the image) in eastern Greenland. To learn about the contributions of glaciers to sea level rise, visit: <a href="http://www.nasa.gov/topics/earth/features/glacier-sea-rise.html" rel="nofollow">www.nasa.gov/topics/earth/features/glacier-sea-rise.html</a> Credit: Frank Paul, University of Zurich <b><a href="http://www.nasa.gov/audience/formedia/features/MP_Photo_Guidelines.html" rel="nofollow">NASA image use policy.</a></b> <b><a href="http://www.nasa.gov/centers/goddard/home/index.html" rel="nofollow">NASA Goddard Space Flight Center</a></b> enables NASA’s mission through four scientific endeavors: Earth Science, Heliophysics, Solar System Exploration, and Astrophysics. Goddard plays a leading role in NASA’s accomplishments by contributing compelling scientific knowledge to advance the Agency’s mission. <b>Follow us on <a href="http://twitter.com/NASA_GoddardPix" rel="nofollow">Twitter</a></b> <b>Like us on <a href="http://www.facebook.com/pages/Greenbelt-MD/NASA-Goddard/395013845897?ref=tsd" rel="nofollow">Facebook</a></b> <b>Find us on <a href="http://instagram.com/nasagoddard?vm=grid" rel="nofollow">Instagram</a></b>
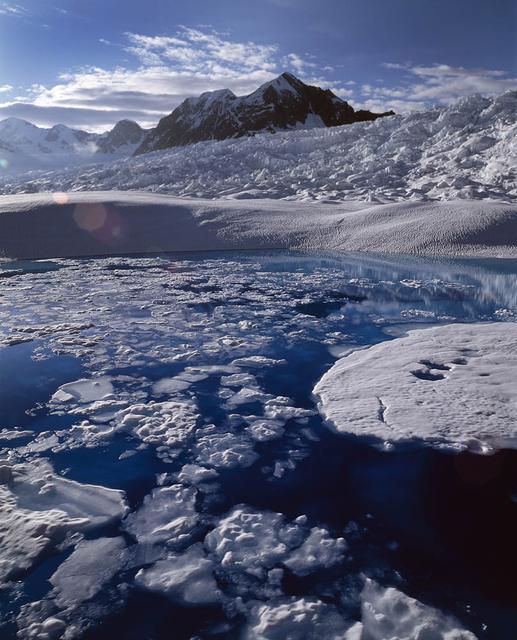
Melt water ponded at surface in the accumulation zone of Columbia Glacier, Alaska, in July 2008. To learn about the contributions of glaciers to sea level rise, visit: <a href="http://www.nasa.gov/topics/earth/features/glacier-sea-rise.html" rel="nofollow">www.nasa.gov/topics/earth/features/glacier-sea-rise.html</a> Credit: W. Tad Pfeffer, University of Colorado at Boulder <b><a href="http://www.nasa.gov/audience/formedia/features/MP_Photo_Guidelines.html" rel="nofollow">NASA image use policy.</a></b> <b><a href="http://www.nasa.gov/centers/goddard/home/index.html" rel="nofollow">NASA Goddard Space Flight Center</a></b> enables NASA’s mission through four scientific endeavors: Earth Science, Heliophysics, Solar System Exploration, and Astrophysics. Goddard plays a leading role in NASA’s accomplishments by contributing compelling scientific knowledge to advance the Agency’s mission. <b>Follow us on <a href="http://twitter.com/NASA_GoddardPix" rel="nofollow">Twitter</a></b> <b>Like us on <a href="http://www.facebook.com/pages/Greenbelt-MD/NASA-Goddard/395013845897?ref=tsd" rel="nofollow">Facebook</a></b> <b>Find us on <a href="http://instagram.com/nasagoddard?vm=grid" rel="nofollow">Instagram</a></b>
Small valley glacier exiting the Devon Island Ice Cap in Canada. To learn about the contributions of glaciers to sea level rise, visit: <a href="http://www.nasa.gov/topics/earth/features/glacier-sea-rise.html" rel="nofollow">www.nasa.gov/topics/earth/features/glacier-sea-rise.html</a> Credit: Alex Gardner, Clark University <b><a href="http://www.nasa.gov/audience/formedia/features/MP_Photo_Guidelines.html" rel="nofollow">NASA image use policy.</a></b> <b><a href="http://www.nasa.gov/centers/goddard/home/index.html" rel="nofollow">NASA Goddard Space Flight Center</a></b> enables NASA’s mission through four scientific endeavors: Earth Science, Heliophysics, Solar System Exploration, and Astrophysics. Goddard plays a leading role in NASA’s accomplishments by contributing compelling scientific knowledge to advance the Agency’s mission. <b>Follow us on <a href="http://twitter.com/NASA_GoddardPix" rel="nofollow">Twitter</a></b> <b>Like us on <a href="http://www.facebook.com/pages/Greenbelt-MD/NASA-Goddard/395013845897?ref=tsd" rel="nofollow">Facebook</a></b> <b>Find us on <a href="http://instagram.com/nasagoddard?vm=grid" rel="nofollow">Instagram</a></b>

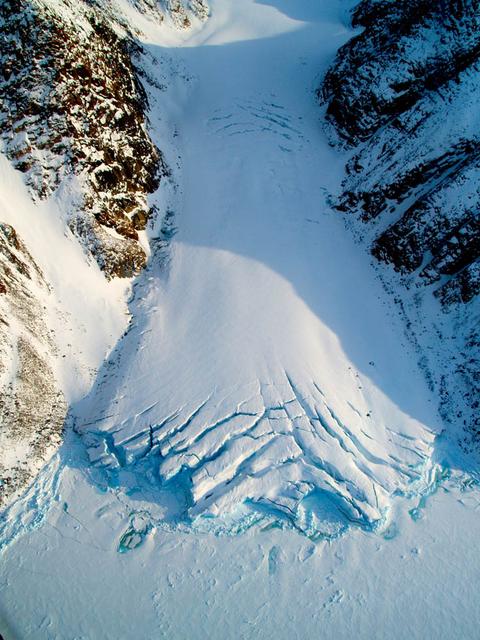
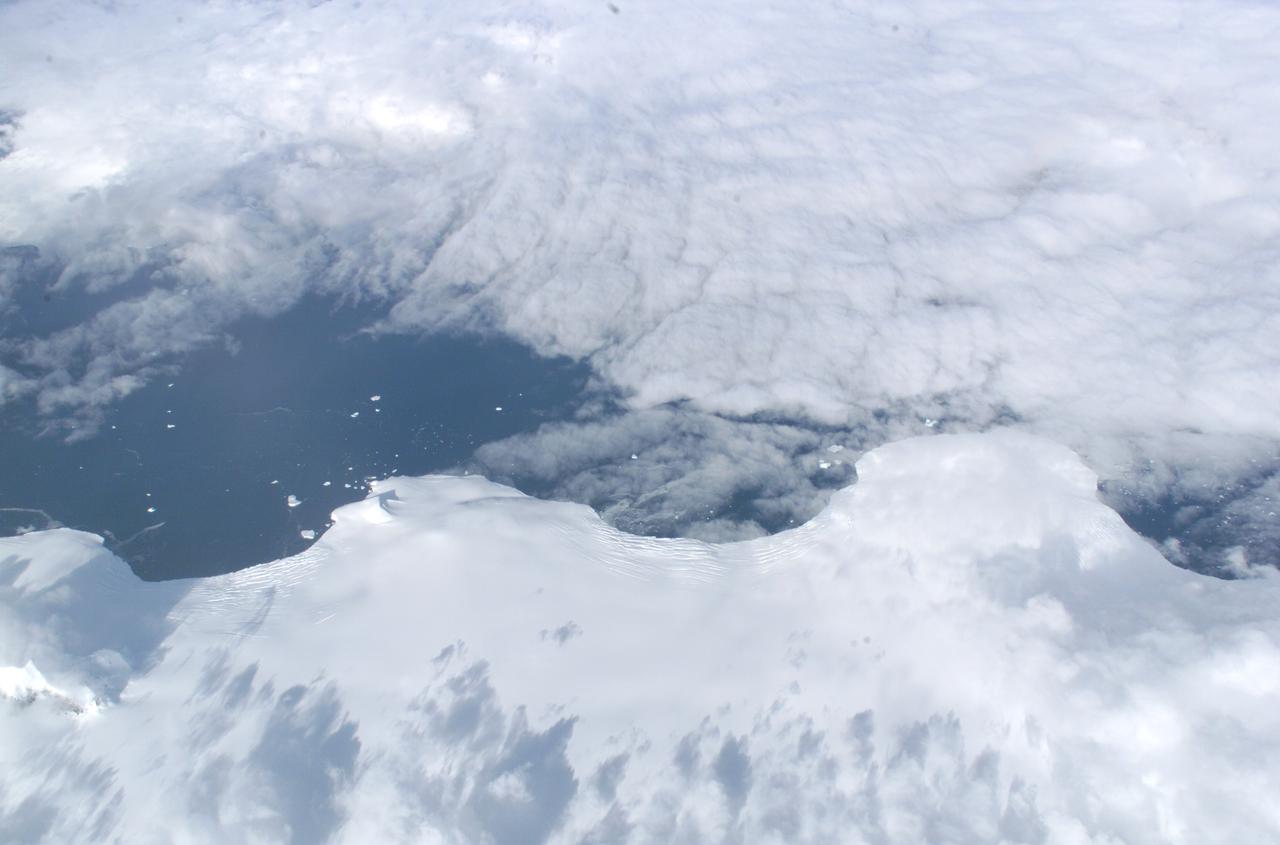
Aerial view of the Sverdrup Glacier, a river of ice that flows from the interior of the Devon Island Ice Cap (Canada) into the ocean. To learn about the contributions of glaciers to sea level rise, visit: <a href="http://www.nasa.gov/topics/earth/features/glacier-sea-rise.html" rel="nofollow">www.nasa.gov/topics/earth/features/glacier-sea-rise.html</a> Credit: Alex Gardner, Clark University <b><a href="http://www.nasa.gov/audience/formedia/features/MP_Photo_Guidelines.html" rel="nofollow">NASA image use policy.</a></b> <b><a href="http://www.nasa.gov/centers/goddard/home/index.html" rel="nofollow">NASA Goddard Space Flight Center</a></b> enables NASA’s mission through four scientific endeavors: Earth Science, Heliophysics, Solar System Exploration, and Astrophysics. Goddard plays a leading role in NASA’s accomplishments by contributing compelling scientific knowledge to advance the Agency’s mission. <b>Follow us on <a href="http://twitter.com/NASA_GoddardPix" rel="nofollow">Twitter</a></b> <b>Like us on <a href="http://www.facebook.com/pages/Greenbelt-MD/NASA-Goddard/395013845897?ref=tsd" rel="nofollow">Facebook</a></b> <b>Find us on <a href="http://instagram.com/nasagoddard?vm=grid" rel="nofollow">Instagram</a></b>
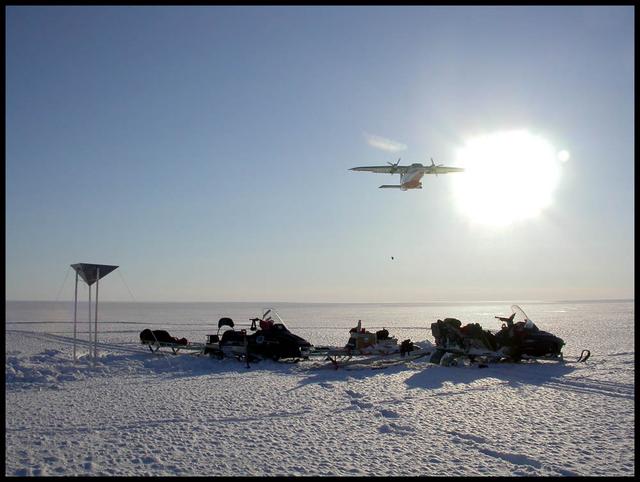
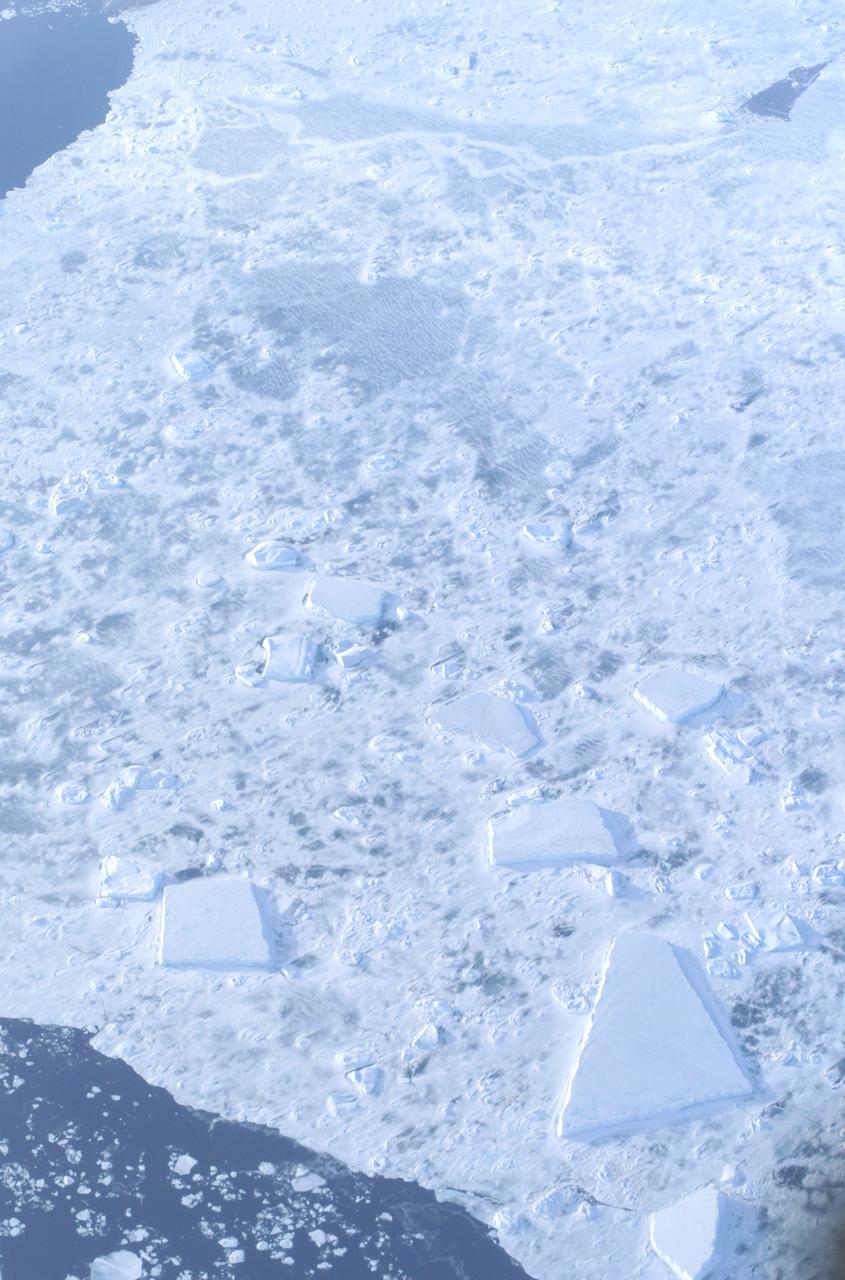
An airplane drops essential support on the Austfonna Ice Cap in Svalbard (Norwegian Arctic). The triangular structure is a corner reflector used as ground reference for airborne radar surveys. To learn about the contributions of glaciers to sea level rise, visit: <a href="http://www.nasa.gov/topics/earth/features/glacier-sea-rise.html" rel="nofollow">www.nasa.gov/topics/earth/features/glacier-sea-rise.html</a> Credit: Andrea Taurisano, Norwegian Polar Institute <b><a href="http://www.nasa.gov/audience/formedia/features/MP_Photo_Guidelines.html" rel="nofollow">NASA image use policy.</a></b> <b><a href="http://www.nasa.gov/centers/goddard/home/index.html" rel="nofollow">NASA Goddard Space Flight Center</a></b> enables NASA’s mission through four scientific endeavors: Earth Science, Heliophysics, Solar System Exploration, and Astrophysics. Goddard plays a leading role in NASA’s accomplishments by contributing compelling scientific knowledge to advance the Agency’s mission. <b>Follow us on <a href="http://twitter.com/NASA_GoddardPix" rel="nofollow">Twitter</a></b> <b>Like us on <a href="http://www.facebook.com/pages/Greenbelt-MD/NASA-Goddard/395013845897?ref=tsd" rel="nofollow">Facebook</a></b> <b>Find us on <a href="http://instagram.com/nasagoddard?vm=grid" rel="nofollow">Instagram</a></b>
Summit camp on top of the Austfonna Ice Cap in Svalbard (Norwegian Arctic). To learn about the contributions of glaciers to sea level rise, visit: <a href="http://www.nasa.gov/topics/earth/features/glacier-sea-rise.html" rel="nofollow">www.nasa.gov/topics/earth/features/glacier-sea-rise.html</a> Credit: Thorben Dunse, University of Oslo <b><a href="http://www.nasa.gov/audience/formedia/features/MP_Photo_Guidelines.html" rel="nofollow">NASA image use policy.</a></b> <b><a href="http://www.nasa.gov/centers/goddard/home/index.html" rel="nofollow">NASA Goddard Space Flight Center</a></b> enables NASA’s mission through four scientific endeavors: Earth Science, Heliophysics, Solar System Exploration, and Astrophysics. Goddard plays a leading role in NASA’s accomplishments by contributing compelling scientific knowledge to advance the Agency’s mission. <b>Follow us on <a href="http://twitter.com/NASA_GoddardPix" rel="nofollow">Twitter</a></b> <b>Like us on <a href="http://www.facebook.com/pages/Greenbelt-MD/NASA-Goddard/395013845897?ref=tsd" rel="nofollow">Facebook</a></b> <b>Find us on <a href="http://instagram.com/nasagoddard?vm=grid" rel="nofollow">Instagram</a></b>
Calving front of the Upsala Glacier (Argentina). This glacier has been thinning and retreating at a rapid rate during the last decades – from 2006 to 2010, it receded 43.7 yards (40 meters) per year. During summer 2012, large calving events prevented boat access to the glacier. To learn about the contributions of glaciers to sea level rise, visit: <a href="http://www.nasa.gov/topics/earth/features/glacier-sea-rise.html" rel="nofollow">www.nasa.gov/topics/earth/features/glacier-sea-rise.html</a> Credit: Etienne Berthier, Université de Toulouse <b><a href="http://www.nasa.gov/audience/formedia/features/MP_Photo_Guidelines.html" rel="nofollow">NASA image use policy.</a></b> <b><a href="http://www.nasa.gov/centers/goddard/home/index.html" rel="nofollow">NASA Goddard Space Flight Center</a></b> enables NASA’s mission through four scientific endeavors: Earth Science, Heliophysics, Solar System Exploration, and Astrophysics. Goddard plays a leading role in NASA’s accomplishments by contributing compelling scientific knowledge to advance the Agency’s mission. <b>Follow us on <a href="http://twitter.com/NASA_GoddardPix" rel="nofollow">Twitter</a></b> <b>Like us on <a href="http://www.facebook.com/pages/Greenbelt-MD/NASA-Goddard/395013845897?ref=tsd" rel="nofollow">Facebook</a></b> <b>Find us on <a href="http://instagram.com/nasagoddard?vm=grid" rel="nofollow">Instagram</a></b>
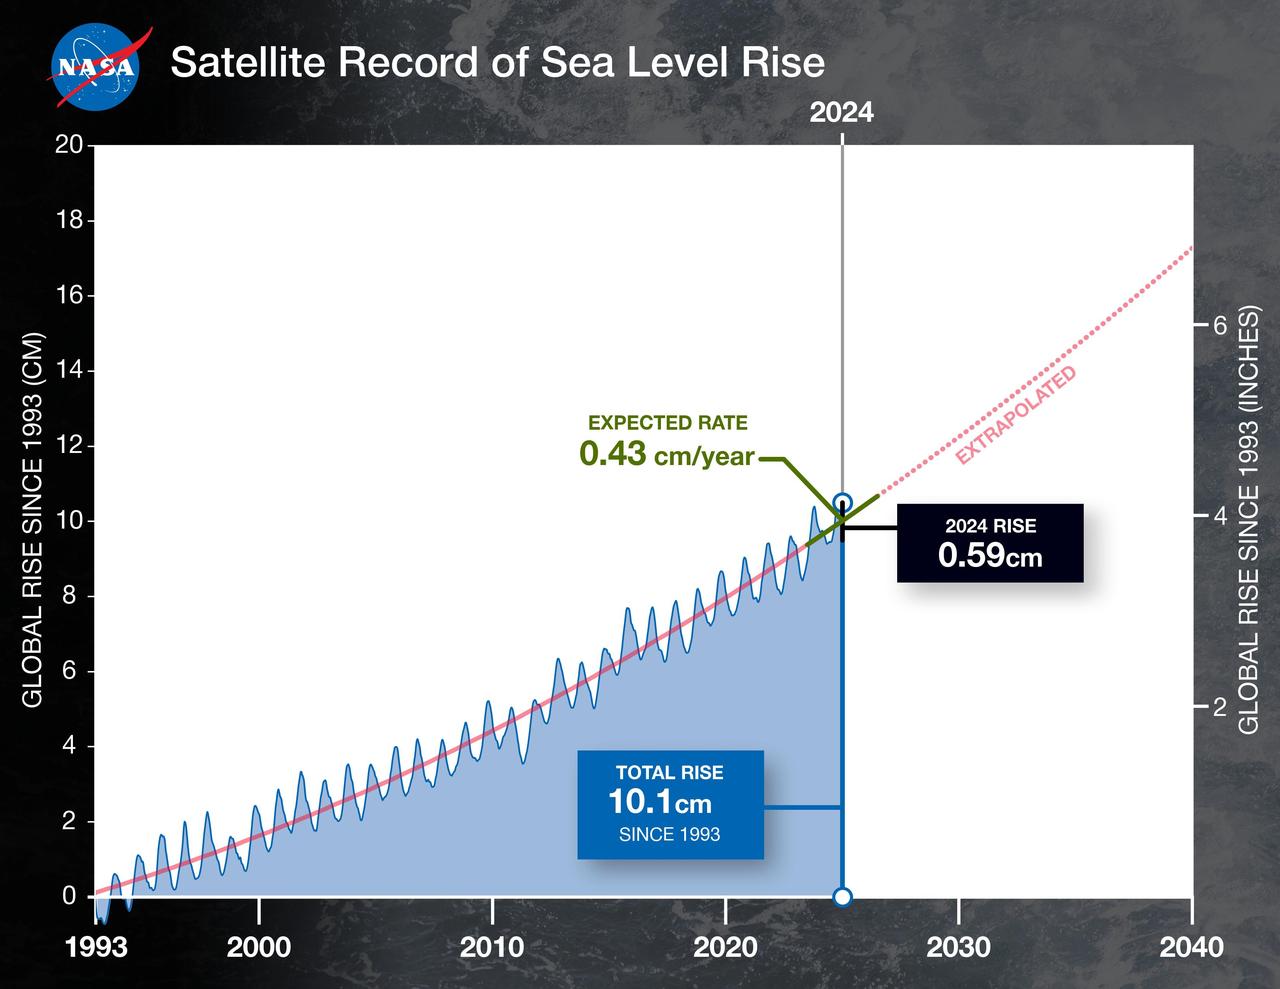
This graph shows the rise in global mean sea level from 1993 to 2024 based on data from a series of five international satellites. The solid red line indicates the trajectory of this increase, which has more than doubled over the three decades. The dotted red line projects future sea level rise. Global sea level rose faster than expected in 2024 due mostly to ocean water expanding as it warms, or thermal expansion. According to a NASA-led analysis, last year's rate of rise was 0.23 inches (0.59 centimeters) per year, compared to the expected rate of 0.17 inches (0.43 centimeters) per year. In recent years, about two-thirds of sea level rise was due to the addition of water from land into the ocean by melting ice sheets and glaciers. About a third came from thermal expansion of seawater. But in 2024, those contributions flipped, with two-thirds of sea level rise coming from thermal expansion. This NASA-led analysis is based on a sea level dataset featuring more than 30 years of satellite observations, starting with the U.S.-French TOPEX/Poseidon mission, which launched in 1992. The Sentinel-6 Michael Freilich mission, which launched in November 2020, is the latest in the series of satellites that have contributed to this sea level record. https://photojournal.jpl.nasa.gov/catalog/PIA26189
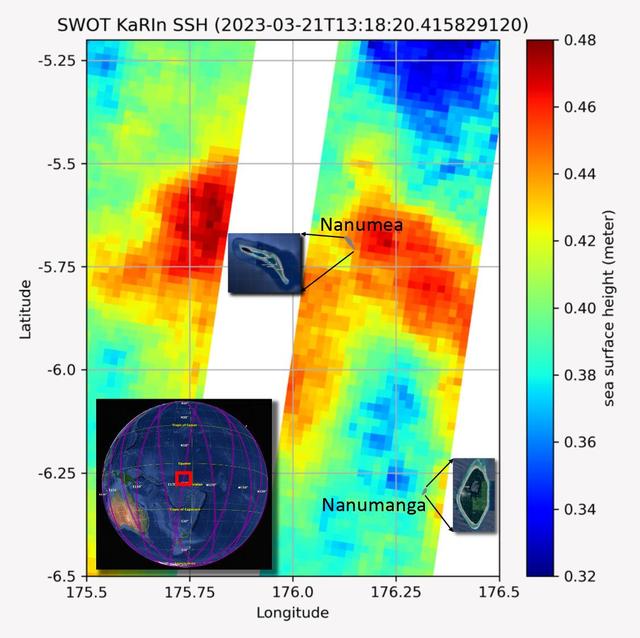
The recently launched Surface Water and Ocean Topography (SWOT) mission collected data on sea levels around two of the inhabited islands of Tuvalu, a nation in the South Pacific Ocean that has been threatened with sea level rise that substantially exceeds the global average. The image shows two areas of red that indicate higher than normal sea levels around two of Tuvalu's inhabited islands, Nanumanga and Nanumea. The higher sea levels were likely caused by internal tides or circular currents called eddies. The SWOT data illuminates for the first time these small ocean features that, when they occur on top of rising sea levels, can lead to episodic flooding along coastlines. The Tuvalu data was collected March 21, 2023. Rising seas are a direct consequence of climate change. On a global scale, the combination of warming ocean waters and ice melt from glaciers and ice sheets is leading to sea level rise that is occurring at an ever-increasing rate. The current rate of rise is more than 0.15 inches (4 millimeters) per year, an increase from 0.08 inches (2 millimeters) per year in 1993. This seemingly small increase holds great significance for coastal communities that have seen more than a century of persistent sea level rise. The gap between the average high tide and flooding conditions has narrowed, and coastal impacts driven by sea level rise have increased in frequency and severity in recent years. This is particularly true for low-lying island nations like Tuvalu, located about 620 miles (1,000 kilometers) north of Fiji. Sea level rise does not occur at the same rate everywhere across the globe, and can be exacerbated by natural ocean fluctuations that occur over time periods from years to decades. For Tuvalu, the amount of sea level rise has been substantially higher than the global average over the past three decades. The amount of rise, when coupled with Tuvalu's low land elevations, places the country increasingly under threat. In the near term, sea level rise will combine with naturally occurring ocean variability and storms to exacerbate events like coastal flooding. Monitoring and understanding sea level change is critical for Tuvalu and other low-lying island nations. Launched on Dec. 16, 2022, from Vandenberg Space Force Base in central California, SWOT collected the Tuvalu sea level data during a period of commissioning, calibration, and validation. Engineers are checking out the performance of the satellite's systems and science instruments before the planned start of science operations in summer 2023. https://photojournal.jpl.nasa.gov/catalog/PIA25777
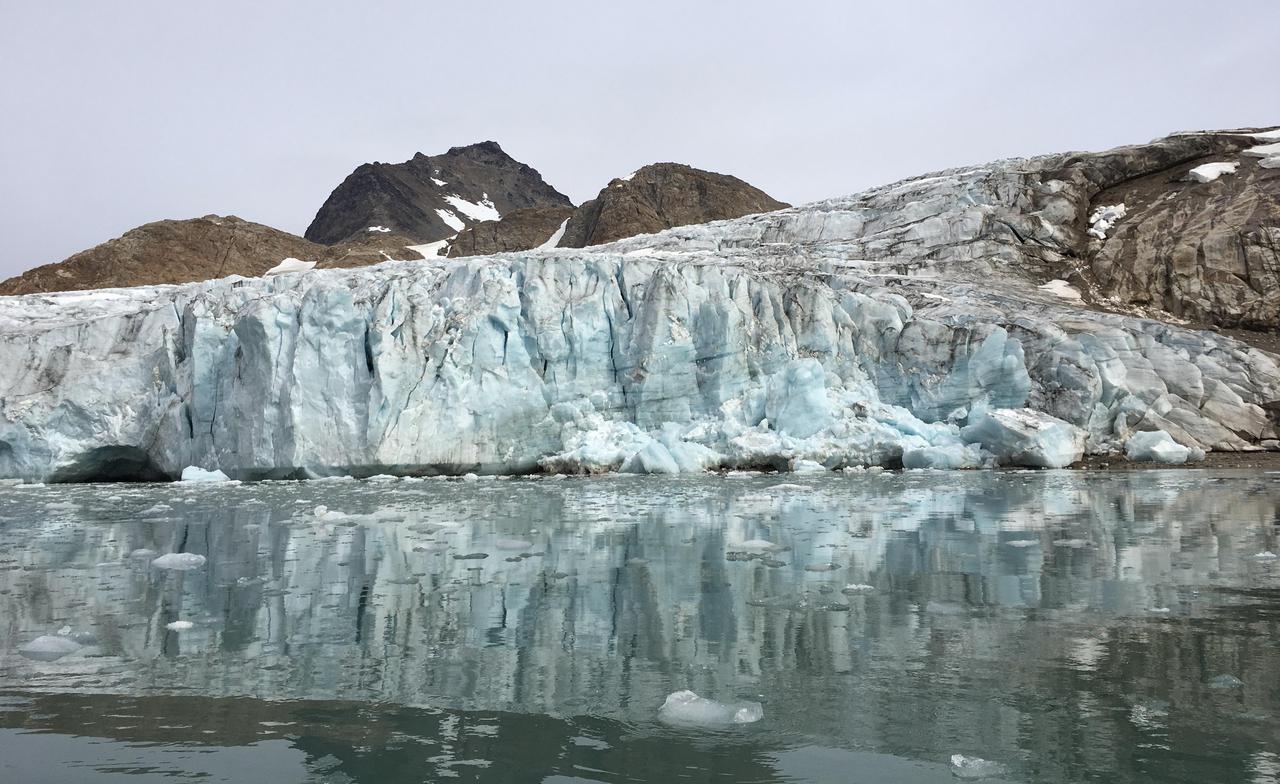
NASA's Oceans Melting Greenland airborne mission found that most of Greenland's glaciers that empty into the ocean are at greater risk of rapid ice loss than previously understood. OMG's six-year field campaign studied the ocean's role in glacial ice loss by gathering precise measurements of ocean depth, temperature, and salinity in front of more than 220 glaciers. The mission's goal was to clarify our understanding of sea level rise over the next 50 years. This photo of Apusiaajik Glacier was taken near Kulusuk, Greenland, on Aug. 26, 2018, during OMG's field operations. https://photojournal.jpl.nasa.gov/catalog/PIA24983
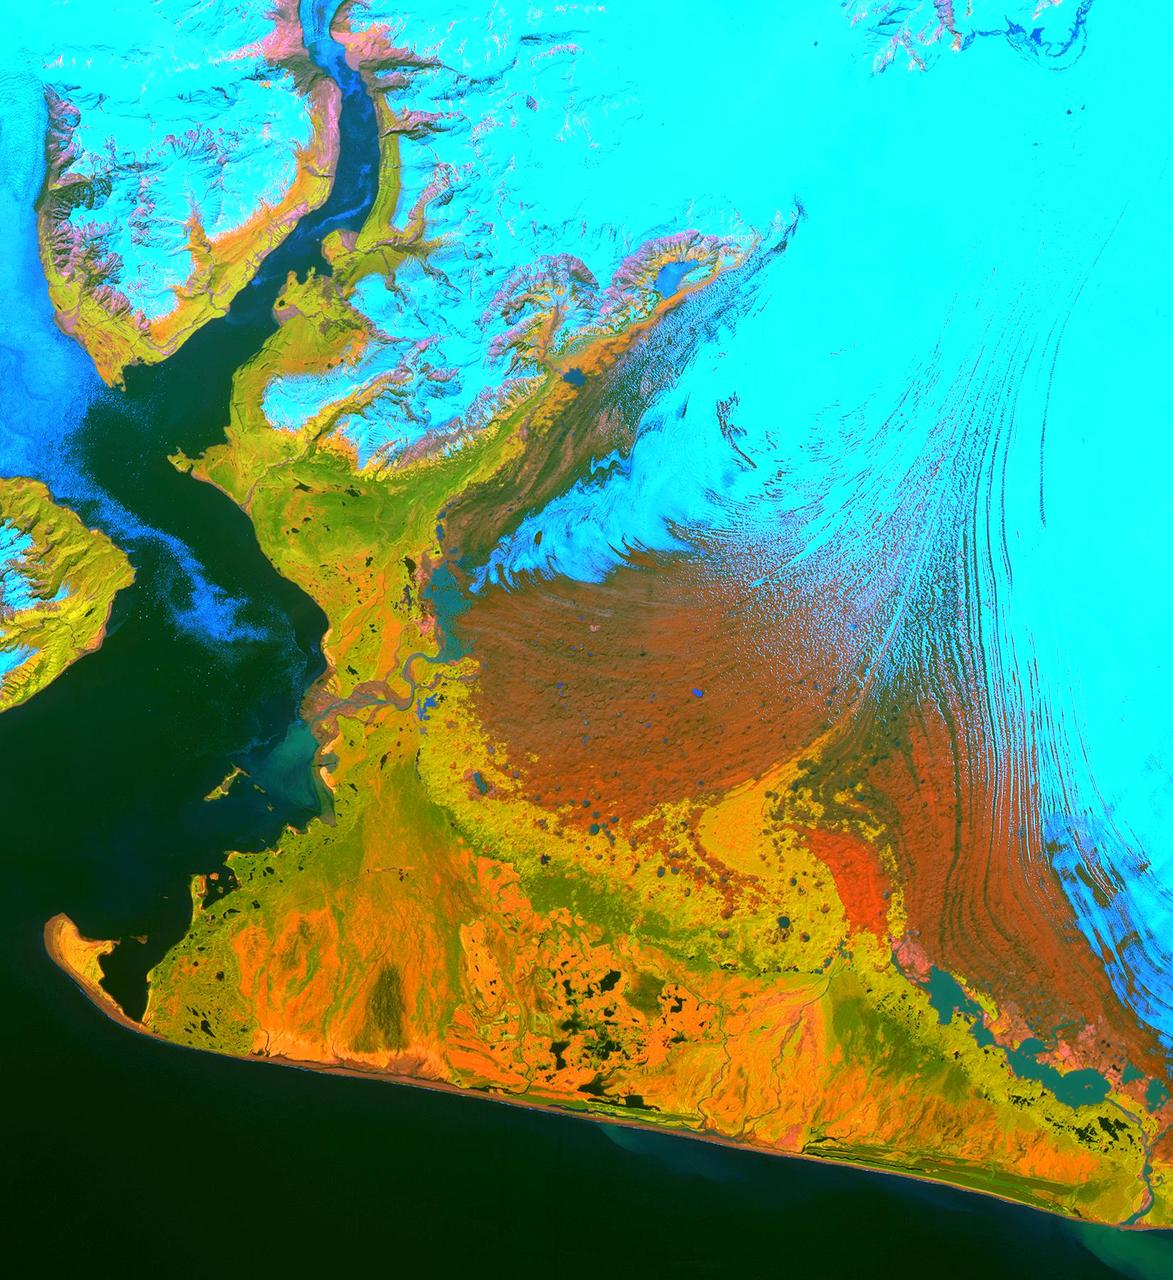
This image from the Advanced Spaceborne Thermal Emission and Reflection Radiometer (ASTER) instrument on NASA's Terra satellite covers an area of 55 by 40 kilometers (34 by 25 miles) over the southwest part of the Malaspina Glacier and Icy Bay in Alaska. The composite of infrared and visible bands results in the snow and ice appearing light blue, dense vegetation is yellow-orange and green, and less vegetated, gravelly areas are in orange. According to Dr. Dennis Trabant (U.S. Geological Survey, Fairbanks, Alaska), the Malaspina Glacier is thinning. Its terminal moraine protects it from contact with the open ocean; without the moraine, or if sea level rises sufficiently to reconnect the glacier with the ocean, the glacier would start calving and retreat significantly. ASTER data are being used to help monitor the size and movement of some 15,000 tidal and piedmont glaciers in Alaska. Evidence derived from ASTER and many other satellite and ground-based measurements suggests that only a few dozen Alaskan glaciers are advancing. The overwhelming majority of them are retreating. This ASTER image was acquired on June 8, 2001. With its 14 spectral bands from the visible to the thermal infrared wavelength region, and its high spatial resolution of 15 to 90 meters (about 50 to 300 feet), ASTER will image Earth for the next six years to map and monitor the changing surface of our planet. http://photojournal.jpl.nasa.gov/catalog/PIA03475
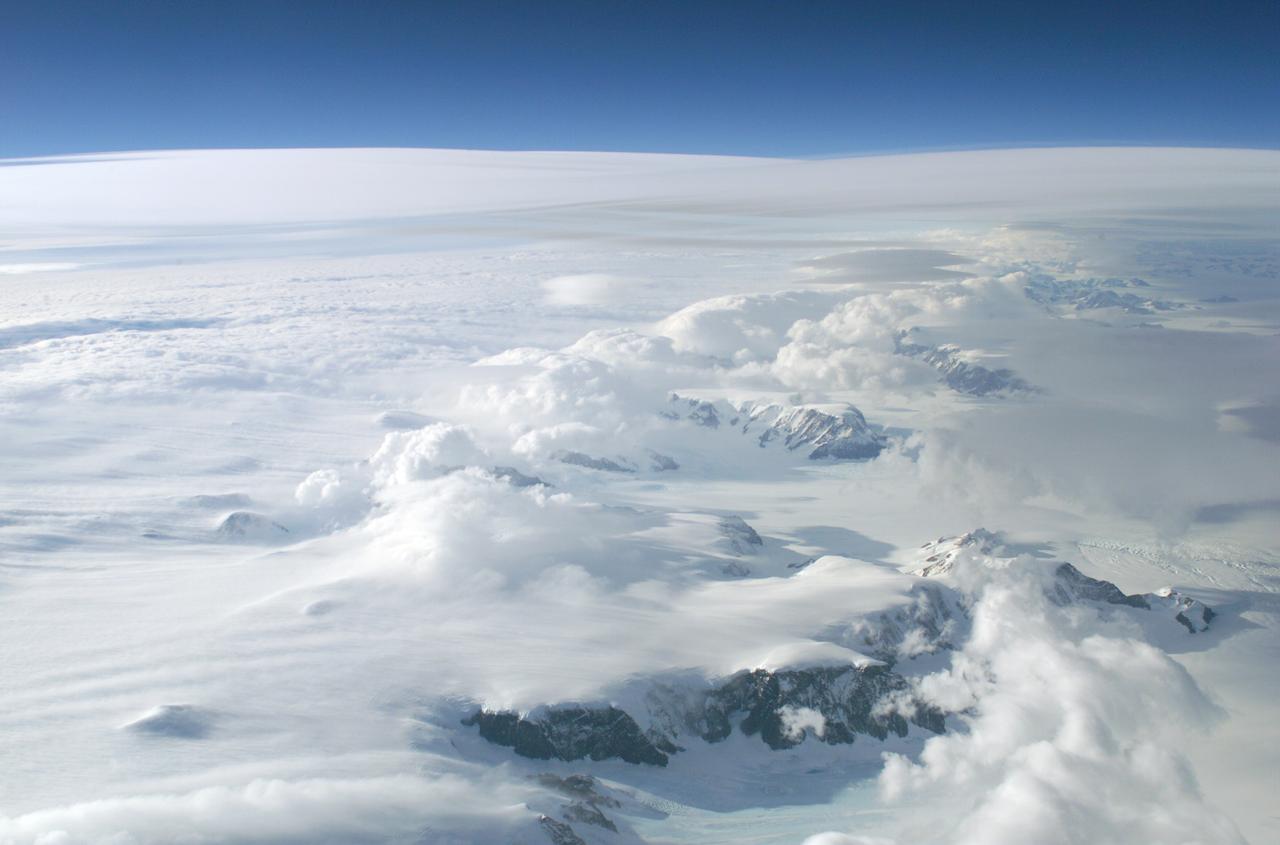
The Larsen Ice Shelf in Antarctica viewed from NASA's DC-8 aircraft during the AirSAR 2004 campaign. AirSAR 2004 is a three-week expedition in Central and South America by an international team of scientists that is using an all-weather imaging tool, called the Airborne Synthetic Aperture Radar (AirSAR), located onboard NASA's DC-8 airborne laboratory. Scientists from many parts of the world are combining ground research with NASA's AirSAR technology to improve and expand on the quality of research they are able to conduct. These photos are from the DC-8 aircraft while flying an AirSAR mission over Antarctica. The Antarctic Peninsula is more similar to Alaska and Patagonia than to the rest of the Antarctic continent. It is drained by fast glaciers, receives abundant precipitation, and melts significantly in the summer months. In recent decades, the Peninsula has experienced significant atmospheric warming (about 2 degrees C since 1950), which has triggered a vast and spectacular retreat of its floating ice shelves, glacier reduction, a decrease in permanent snow cover and a lengthening of the melt season. As a result, the contribution to sea level from this region could be rapid and substantial. With an area of 120,000 km, or ten times the Patagonia ice fields, the Peninsula could contribute as much as 0.4mm/yr sea level rise, which would be the largest single contribution to sea level from anywhere in the world. This region is being studied by NASA using a DC-8 equipped with the Airborne Synthetic Aperture Radar developed by scientists from NASA’s Jet Propulsion Laboratory. AirSAR will provide a baseline model and unprecedented mapping of the region. This data will make it possible to determine whether the warming trend is slowing, continuing or accelerating. AirSAR will also provide reliable information on ice shelf thickness to measure the contribution of the glaciers to sea level.
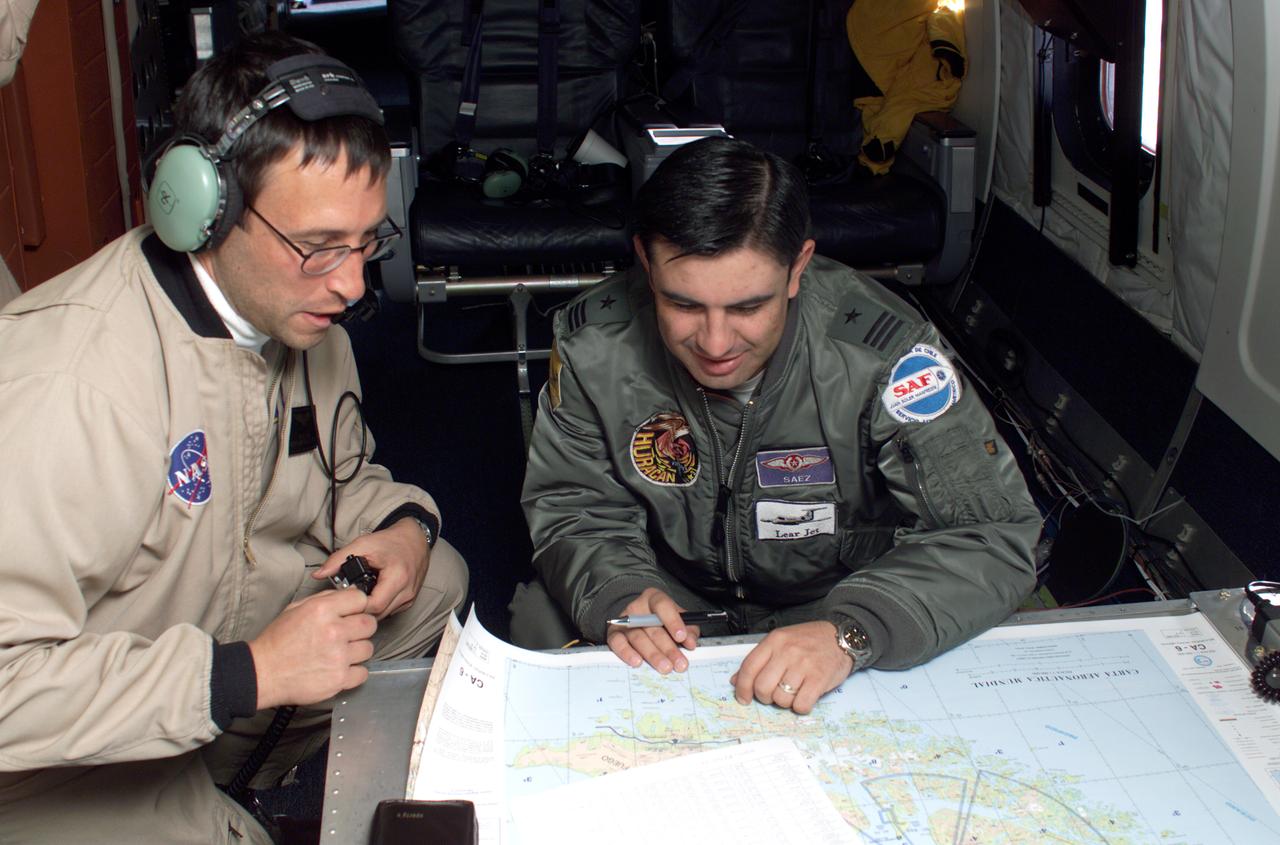
NASA DC-8 Mission Manager Walter Klein and Chilean Air Force Advisor Captain Saez review maps of the Antarctic Peninsula during an AirSAR 2004 mission. AirSAR 2004 is a three-week expedition in Central and South America by an international team of scientists that is using an all-weather imaging tool, called the Airborne Synthetic Aperture Radar (AirSAR), located onboard NASA's DC-8 airborne laboratory. Scientists from many parts of the world are combining ground research with NASA's AirSAR technology to improve and expand on the quality of research they are able to conduct. These photos are from the DC-8 aircraft while flying an AirSAR mission over Antarctica. The Antarctic Peninsula is more similar to Alaska and Patagonia than to the rest of the Antarctic continent. It is drained by fast glaciers, receives abundant precipitation, and melts significantly in the summer months. In recent decades, the Peninsula has experienced significant atmospheric warming (about 2 degrees C since 1950), which has triggered a vast and spectacular retreat of its floating ice shelves, glacier reduction, a decrease in permanent snow cover and a lengthening of the melt season. As a result, the contribution to sea level from this region could be rapid and substantial. With an area of 120,000 km, or ten times the Patagonia ice fields, the Peninsula could contribute as much as 0.4mm/yr sea level rise, which would be the largest single contribution to sea level from anywhere in the world. This region is being studied by NASA using a DC-8 equipped with the Airborne Synthetic Aperture Radar developed by scientists from NASA’s Jet Propulsion Laboratory. AirSAR will provide a baseline model and unprecedented mapping of the region. This data will make it possible to determine whether the warming trend is slowing, continuing or accelerating. AirSAR will also provide reliable information on ice shelf thickness to measure the contribution of the glaciers to sea level.
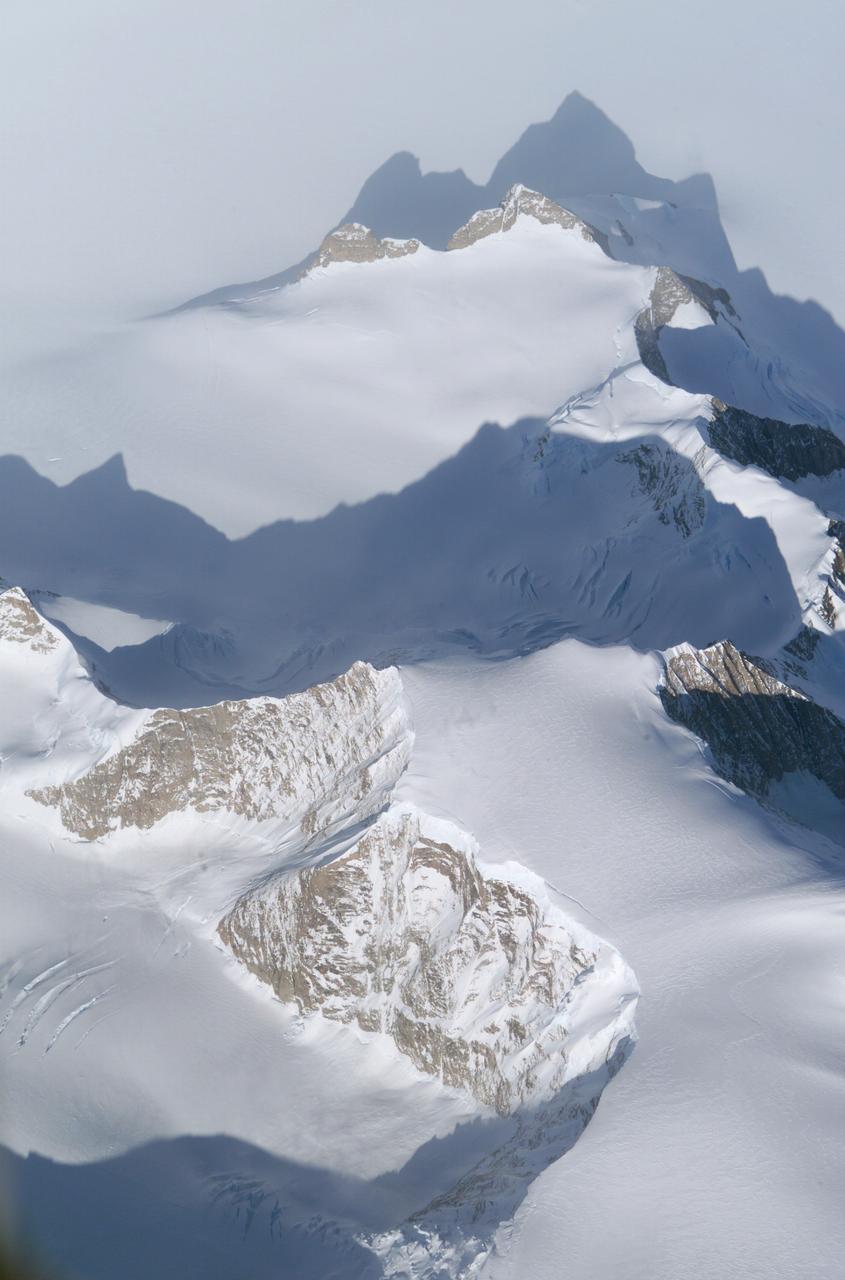
An AirSAR 2004 view from the DC-8 as it approaches the Larsen Ice Shelf, which is part of the Antarctic Peninsula. AirSAR 2004 is a three-week expedition in Central and South America by an international team of scientists that is using an all-weather imaging tool, called the Airborne Synthetic Aperture Radar (AirSAR), located onboard NASA's DC-8 airborne laboratory. Scientists from many parts of the world are combining ground research with NASA's AirSAR technology to improve and expand on the quality of research they are able to conduct. These photos are from the DC-8 aircraft while flying an AirSAR mission over Antarctica. The Antarctic Peninsula is more similar to Alaska and Patagonia than to the rest of the Antarctic continent. It is drained by fast glaciers, receives abundant precipitation, and melts significantly in the summer months. In recent decades, the Peninsula has experienced significant atmospheric warming (about 2 degrees C since 1950), which has triggered a vast and spectacular retreat of its floating ice shelves, glacier reduction, a decrease in permanent snow cover and a lengthening of the melt season. As a result, the contribution to sea level from this region could be rapid and substantial. With an area of 120,000 km, or ten times the Patagonia ice fields, the Peninsula could contribute as much as 0.4mm/yr sea level rise, which would be the largest single contribution to sea level from anywhere in the world. This region is being studied by NASA using a DC-8 equipped with the Airborne Synthetic Aperture Radar developed by scientists from NASA’s Jet Propulsion Laboratory. AirSAR will provide a baseline model and unprecedented mapping of the region. This data will make it possible to determine whether the warming trend is slowing, continuing or accelerating. AirSAR will also provide reliable information on ice shelf thickness to measure the contribution of the glaciers to sea level.

The Larsen Ice Shelf in Antarctica viewed from NASA's DC-8 aircraft during the AirSAR 2004 campaign. AirSAR 2004 is a three-week expedition in Central and South America by an international team of scientists that is using an all-weather imaging tool, called the Airborne Synthetic Aperture Radar (AirSAR), located onboard NASA's DC-8 airborne laboratory. Scientists from many parts of the world are combining ground research with NASA's AirSAR technology to improve and expand on the quality of research they are able to conduct. These photos are from the DC-8 aircraft while flying an AirSAR mission over Antarctica. The Antarctic Peninsula is more similar to Alaska and Patagonia than to the rest of the Antarctic continent. It is drained by fast glaciers, receives abundant precipitation, and melts significantly in the summer months. In recent decades, the Peninsula has experienced significant atmospheric warming (about 2 degrees C since 1950), which has triggered a vast and spectacular retreat of its floating ice shelves, glacier reduction, a decrease in permanent snow cover and a lengthening of the melt season. As a result, the contribution to sea level from this region could be rapid and substantial. With an area of 120,000 km, or ten times the Patagonia ice fields, the Peninsula could contribute as much as 0.4mm/yr sea level rise, which would be the largest single contribution to sea level from anywhere in the world. This region is being studied by NASA using a DC-8 equipped with an Airborne Synthetic Aperture Radar (AirSAR) developed by scientists from NASA’s Jet Propulsion Laboratory. AirSAR will provide a baseline model and unprecedented mapping of the region. This data will make it possible to determine whether the warming trend is slowing, continuing or accelerating. AirSAR will also provide reliable information on ice shelf thickness to measure the contribution of the glaciers to sea level.
The Larsen Ice Shelf in Antarctica viewed from NASA's DC-8 aircraft during the AirSAR 2004 campaign. AirSAR 2004 is a three-week expedition in Central and South America by an international team of scientists that is using an all-weather imaging tool, called the Airborne Synthetic Aperture Radar (AirSAR), located onboard NASA's DC-8 airborne laboratory. Scientists from many parts of the world are combining ground research with NASA's AirSAR technology to improve and expand on the quality of research they are able to conduct. These photos are from the DC-8 aircraft while flying an AirSAR mission over Antarctica. The Antarctic Peninsula is more similar to Alaska and Patagonia than to the rest of the Antarctic continent. It is drained by fast glaciers, receives abundant precipitation, and melts significantly in the summer months. In recent decades, the Peninsula has experienced significant atmospheric warming (about 2 degrees C since 1950), which has triggered a vast and spectacular retreat of its floating ice shelves, glacier reduction, a decrease in permanent snow cover and a lengthening of the melt season. As a result, the contribution to sea level from this region could be rapid and substantial. With an area of 120,000 km, or ten times the Patagonia ice fields, the Peninsula could contribute as much as 0.4mm/yr sea level rise, which would be the largest single contribution to sea level from anywhere in the world. This region is being studied by NASA using a DC-8 equipped with the Airborne Synthetic Aperture Radar developed by scientists from NASA’s Jet Propulsion Laboratory. AirSAR will provide a baseline model and unprecedented mapping of the region. This data will make it possible to determine whether the warming trend is slowing, continuing or accelerating. AirSAR will also provide reliable information on ice shelf thickness to measure the contribution of the glaciers to sea level.

The Larsen Ice Shelf in Antarctica viewed from NASA's DC-8 aircraft during the AirSAR 2004 campaign. AirSAR 2004 is a three-week expedition in Central and South America by an international team of scientists that is using an all-weather imaging tool, called the Airborne Synthetic Aperture Radar (AirSAR), located onboard NASA's DC-8 airborne laboratory. Scientists from many parts of the world are combining ground research with NASA's AirSAR technology to improve and expand on the quality of research they are able to conduct. These photos are from the DC-8 aircraft while flying an AirSAR mission over Antarctica. The Antarctic Peninsula is more similar to Alaska and Patagonia than to the rest of the Antarctic continent. It is drained by fast glaciers, receives abundant precipitation, and melts significantly in the summer months. In recent decades, the Peninsula has experienced significant atmospheric warming (about 2 degrees C since 1950), which has triggered a vast and spectacular retreat of its floating ice shelves, glacier reduction, a decrease in permanent snow cover and a lengthening of the melt season. As a result, the contribution to sea level from this region could be rapid and substantial. With an area of 120,000 km, or ten times the Patagonia ice fields, the Peninsula could contribute as much as 0.4mm/yr sea level rise, which would be the largest single contribution to sea level from anywhere in the world. This region is being studied by NASA using a DC-8 equipped with the Airborne Synthetic Aperture Radar developed by scientists from NASA’s Jet Propulsion Laboratory. AirSAR will provide a baseline model and unprecedented mapping of the region. This data will make it possible to determine whether the warming trend is slowing, continuing or accelerating. AirSAR will also provide reliable information on ice shelf thickness to measure the contribution of the glaciers to sea level.
The Larsen Ice Shelf in Antarctica viewed from NASA's DC-8 aircraft during the AirSAR 2004 campaign. AirSAR 2004 is a three-week expedition in Central and South America by an international team of scientists that is using an all-weather imaging tool, called the Airborne Synthetic Aperture Radar (AirSAR), located onboard NASA's DC-8 airborne laboratory. Scientists from many parts of the world are combining ground research with NASA's AirSAR technology to improve and expand on the quality of research they are able to conduct. These photos are from the DC-8 aircraft while flying an AirSAR mission over Antarctica. The Antarctic Peninsula is more similar to Alaska and Patagonia than to the rest of the Antarctic continent. It is drained by fast glaciers, receives abundant precipitation, and melts significantly in the summer months. In recent decades, the Peninsula has experienced significant atmospheric warming (about 2 degrees C since 1950), which has triggered a vast and spectacular retreat of its floating ice shelves, glacier reduction, a decrease in permanent snow cover and a lengthening of the melt season. As a result, the contribution to sea level from this region could be rapid and substantial. With an area of 120,000 km, or ten times the Patagonia ice fields, the Peninsula could contribute as much as 0.4mm/yr sea level rise, which would be the largest single contribution to sea level from anywhere in the world. This region is being studied by NASA using a DC-8 equipped with the Airborne Synthetic Aperture Radar developed by scientists from NASA’s Jet Propulsion Laboratory. AirSAR will provide a baseline model and unprecedented mapping of the region. This data will make it possible to determine whether the warming trend is slowing, continuing or accelerating. AirSAR will also provide reliable information on ice shelf thickness to measure the contribution of the glaciers to sea level.
The Larsen Ice Shelf in Antarctica viewed from NASA's DC-8 aircraft during the AirSAR 2004 campaign. AirSAR 2004 is a three-week expedition in Central and South America by an international team of scientists that is using an all-weather imaging tool, called the Airborne Synthetic Aperture Radar (AirSAR), located onboard NASA's DC-8 airborne laboratory. Scientists from many parts of the world are combining ground research with NASA's AirSAR technology to improve and expand on the quality of research they are able to conduct. These photos are from the DC-8 aircraft while flying an AirSAR mission over Antarctica. The Antarctic Peninsula is more similar to Alaska and Patagonia than to the rest of the Antarctic continent. It is drained by fast glaciers, receives abundant precipitation, and melts significantly in the summer months. In recent decades, the Peninsula has experienced significant atmospheric warming (about 2 degrees C since 1950), which has triggered a vast and spectacular retreat of its floating ice shelves, glacier reduction, a decrease in permanent snow cover and a lengthening of the melt season. As a result, the contribution to sea level from this region could be rapid and substantial. With an area of 120,000 km, or ten times the Patagonia ice fields, the Peninsula could contribute as much as 0.4mm/yr sea level rise, which would be the largest single contribution to sea level from anywhere in the world. This region is being studied by NASA using a DC-8 equipped with the Airborne Synthetic Aperture Radar developed by scientists from NASA’s Jet Propulsion Laboratory. AirSAR will provide a baseline model and unprecedented mapping of the region. This data will make it possible to determine whether the warming trend is slowing, continuing or accelerating. AirSAR will also provide reliable information on ice shelf thickness to measure the contribution of the glaciers to sea level.
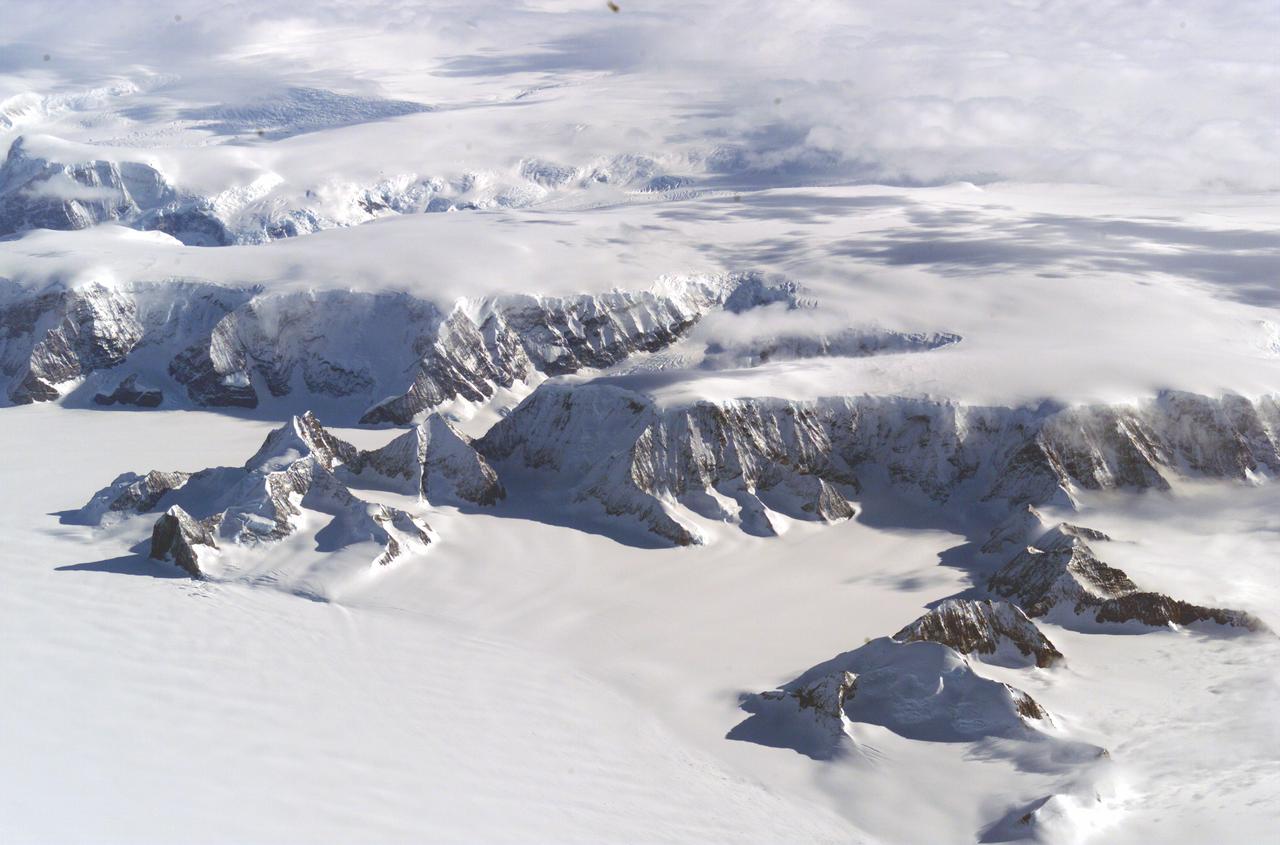
The Larsen Ice Shelf in Antarctica viewed from NASA's DC-8 aircraft during the AirSAR 2004 campaign. AirSAR 2004 is a three-week expedition in Central and South America by an international team of scientists that is using an all-weather imaging tool, called the Airborne Synthetic Aperture Radar (AirSAR), located onboard NASA's DC-8 airborne laboratory. Scientists from many parts of the world are combining ground research with NASA's AirSAR technology to improve and expand on the quality of research they are able to conduct. These photos are from the DC-8 aircraft while flying an AirSAR mission over Antarctica. The Antarctic Peninsula is more similar to Alaska and Patagonia than to the rest of the Antarctic continent. It is drained by fast glaciers, receives abundant precipitation, and melts significantly in the summer months. In recent decades, the Peninsula has experienced significant atmospheric warming (about 2 degrees C since 1950), which has triggered a vast and spectacular retreat of its floating ice shelves, glacier reduction, a decrease in permanent snow cover and a lengthening of the melt season. As a result, the contribution to sea level from this region could be rapid and substantial. With an area of 120,000 km, or ten times the Patagonia ice fields, the Peninsula could contribute as much as 0.4mm/yr sea level rise, which would be the largest single contribution to sea level from anywhere in the world. This region is being studied by NASA using a DC-8 equipped with the Airborne Synthetic Aperture Radar developed by scientists from NASA’s Jet Propulsion Laboratory. AirSAR will provide a baseline model and unprecedented mapping of the region. This data will make it possible to determine whether the warming trend is slowing, continuing or accelerating. AirSAR will also provide reliable information on ice shelf thickness to measure the contribution of the glaciers to sea level.
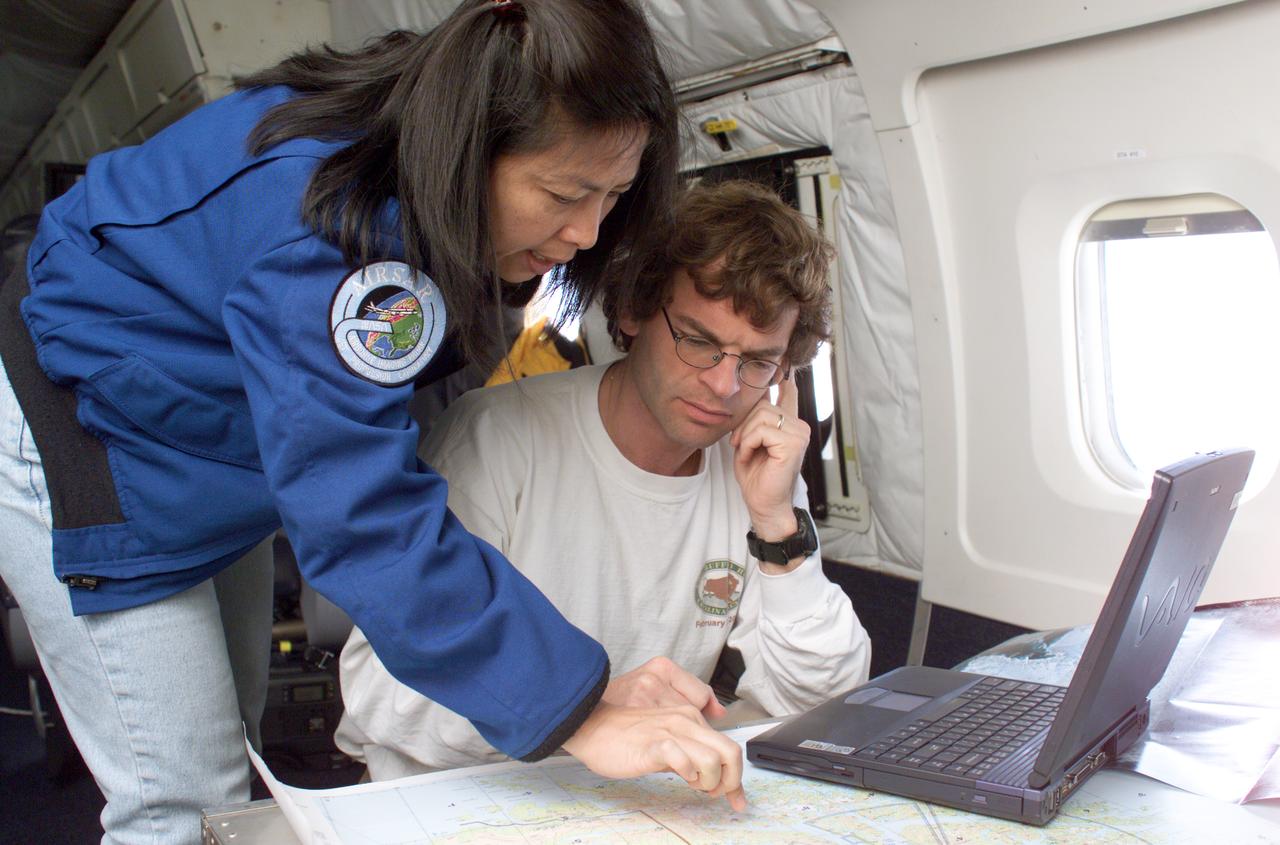
NASA JPL scientists Yunling Lou and Dr. Eric Rignot work on line selection while flying AirSAR missions over the Antarctic Peninsula. AirSAR 2004 is a three-week expedition in Central and South America by an international team of scientists that is using an all-weather imaging tool, called the Airborne Synthetic Aperture Radar (AirSAR), located onboard NASA's DC-8 airborne laboratory. Scientists from many parts of the world are combining ground research with NASA's AirSAR technology to improve and expand on the quality of research they are able to conduct. These photos are from the DC-8 aircraft while flying an AirSAR mission over Antarctica. The Antarctic Peninsula is more similar to Alaska and Patagonia than to the rest of the Antarctic continent. It is drained by fast glaciers, receives abundant precipitation, and melts significantly in the summer months. In recent decades, the Peninsula has experienced significant atmospheric warming (about 2 degrees C since 1950), which has triggered a vast and spectacular retreat of its floating ice shelves, glacier reduction, a decrease in permanent snow cover and a lengthening of the melt season. As a result, the contribution to sea level from this region could be rapid and substantial. With an area of 120,000 km, or ten times the Patagonia ice fields, the Peninsula could contribute as much as 0.4mm/yr sea level rise, which would be the largest single contribution to sea level from anywhere in the world. This region is being studied by NASA using a DC-8 equipped with the Airborne Synthetic Aperture Radar developed by scientists from NASA’s Jet Propulsion Laboratory. AirSAR will provide a baseline model and unprecedented mapping of the region. This data will make it possible to determine whether the warming trend is slowing, continuing or accelerating. AirSAR will also provide reliable information on ice shelf thickness to measure the contribution of the glaciers to sea level.
The Larsen Ice Shelf in Antarctica viewed from NASA's DC-8 aircraft during the AirSAR 2004 campaign. AirSAR 2004 is a three-week expedition in Central and South America by an international team of scientists that is using an all-weather imaging tool, called the Airborne Synthetic Aperture Radar (AirSAR), located onboard NASA's DC-8 airborne laboratory. Scientists from many parts of the world are combining ground research with NASA's AirSAR technology to improve and expand on the quality of research they are able to conduct. These photos are from the DC-8 aircraft while flying an AirSAR mission over Antarctica. The Antarctic Peninsula is more similar to Alaska and Patagonia than to the rest of the Antarctic continent. It is drained by fast glaciers, receives abundant precipitation, and melts significantly in the summer months. In recent decades, the Peninsula has experienced significant atmospheric warming (about 2 degrees C since 1950), which has triggered a vast and spectacular retreat of its floating ice shelves, glacier reduction, a decrease in permanent snow cover and a lengthening of the melt season. As a result, the contribution to sea level from this region could be rapid and substantial. With an area of 120,000 km, or ten times the Patagonia ice fields, the Peninsula could contribute as much as 0.4mm/yr sea level rise, which would be the largest single contribution to sea level from anywhere in the world. This region is being studied by NASA using a DC-8 equipped with the Airborne Synthetic Aperture Radar developed by scientists from NASA’s Jet Propulsion Laboratory. AirSAR will provide a baseline model and unprecedented mapping of the region. This data will make it possible to determine whether the warming trend is slowing, continuing or accelerating. AirSAR will also provide reliable information on ice shelf thickness to measure the contribution of the glaciers to sea level.
Satellite images from 2022 (Main image) and 1985 (Figure A) capture the retreat of Jakobshavn Isbrae, a glacier on Greenland's western coast, as icebergs broke off its edge over nearly four decades. In a recent study in Nature, researchers from NASA's Jet Propulsion Laboratory in Southern California calculated that Jakobshavn lost an estimated 97 billion tons (88 billion metric tons) of ice in the period between the two images. The earlier image was taken by the Thematic Mapper instrument on the Landsat 5 satellite on Sept. 5, 1985, while the later image was captured by the Operational Land Imager on the Landsat 8 satellite on Sept. 4, 2022. Of the 207 glaciers analyzed in the study, Jakobshavn lost the second most ice mass, trailing only Zachariae Isstrom, a glacier in northeast Greenland. The study took a comprehensive look at glacial retreat around the edges of the entire Greenland Ice Sheet from 1985 to 2022 and found that 179 glaciers retreated significantly since 1985, 27 held steady, and just one advanced slightly. The study found that overall the ice sheet shed about 1,140 billion tons (1,034 billion metric tons) of ice from 1985 to 2022, one-fifth more mass than previously estimated, as icebergs fell into the ocean at an accelerating rate. Most of the ice loss came from below sea level, in fjords on Greenland's periphery. Once occupied by ancient glacial ice, many of these deep coastal valleys have filled with seawater – meaning the ice that broke off made little net contribution to sea level. But the loss likely accelerated the movement of ice flowing down from higher elevations, which in turn added to sea level rise. It also added previously unaccounted-for fresh water to the North Atlantic Ocean, which could have impacts on global ocean currents. https://photojournal.jpl.nasa.gov/catalog/PIA26117

Chilean Air Force Captain Saez and Dr. Tom Mace, DFRC Director of Airborne Sciences, discuss airborne science during a DC-8 ferry flight from Santiago to Punta Arenas, Chile. AirSAR 2004 is a three-week expedition by an international team of scientists that uses an all-weather imaging tool, called the Airborne Synthetic Aperture Radar (AirSAR) which is located onboard NASA's DC-8 airborne laboratory. Scientists from many parts of the world including NASA's Jet Propulsion Laboratory are combining ground research done in several areas in Central and South America with NASA's AirSAR technology to improve and expand on the quality of research they are able to conduct. In South America and Antarctica, AirSAR collected imagery and data to help determine the contribution of Southern Hemisphere glaciers to sea level rise due to climate change. In Patagonia, researchers found this contribution had more than doubled from 1995 to 2000, compared to the previous 25 years. AirSAR data will make it possible to determine whether that trend is continuing or accelerating. AirSAR will also provide reliable information on ice shelf thickness to measure the contribution of the glaciers to sea level.

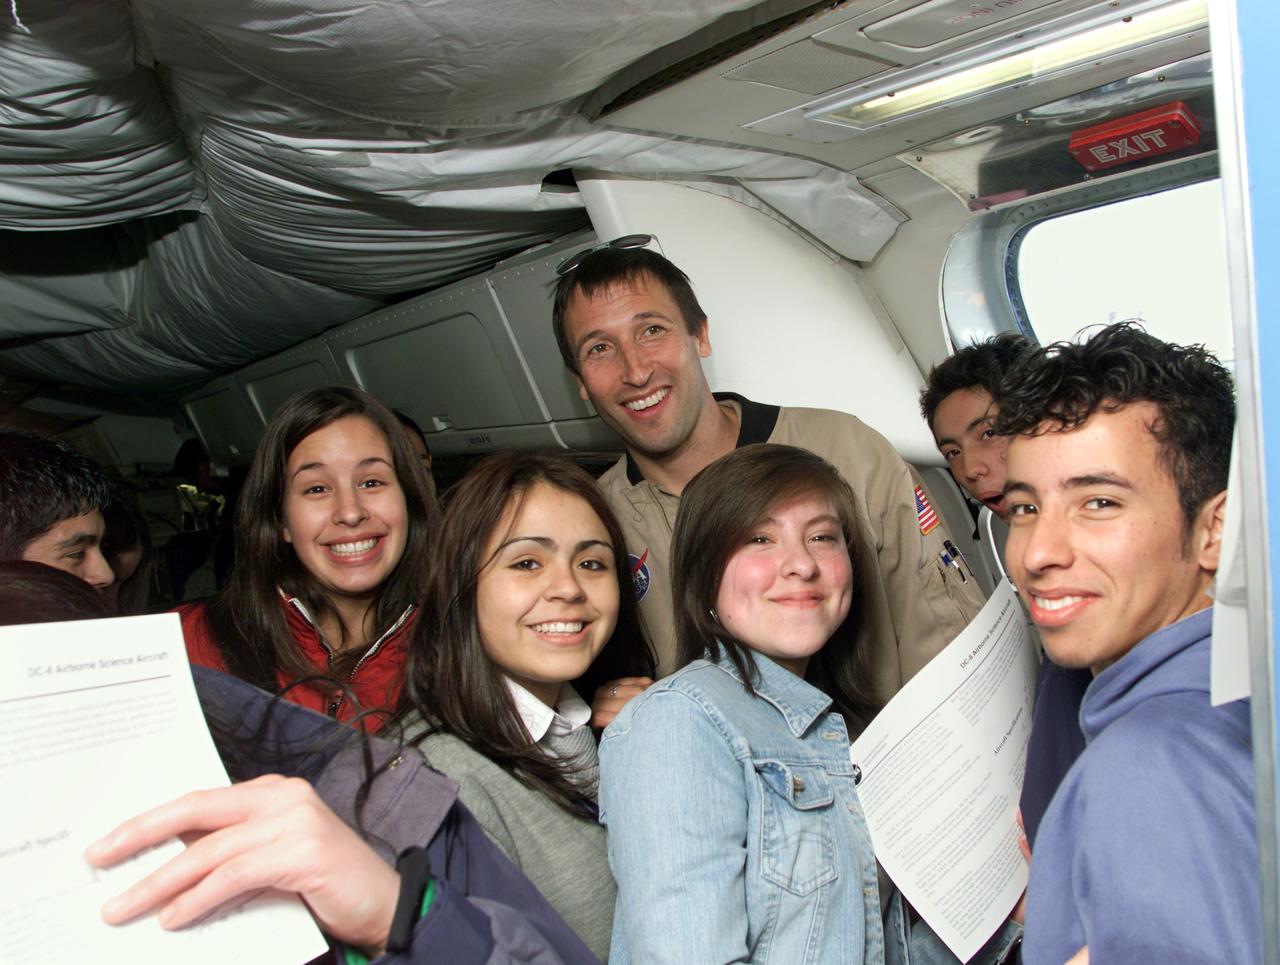
JPL scientist Dr. David Imel and U.S. Air Force Colonel Gwen Linde, the Defense Department Attache Officer assigned to the Chilean Embassy, lead Chilean students on a tour of the DC-8 aircraft at Carlos Ibanez del Campo International Airport in Punta Arenas, Chile. AirSAR 2004 is a three-week expedition by an international team of scientists that is using an all-weather imaging tool, called the Airborne Synthetic Aperture Radar (AirSAR) which is located onboard NASA's DC-8 airborne laboratory. Scientists from many parts of the world including NASA's Jet Propulsion Laboratory are combining ground research done in several areas in Central and South America with NASA's AirSAR technology to improve and expand on the quality of research they are able to conduct. In South America and Antarctica, AirSAR will collect imagery and data to help determine the contribution of Southern Hemisphere glaciers to sea level rise due to climate change. In Patagonia, researchers found this contribution had more than doubled from 1995 to 2000, compared to the previous 25 years. AirSAR data will make it possible to determine whether that trend is decreasing, continuing or accelerating. AirSAR will also provide reliable information on ice shelf thickness to measure the contribution of the glaciers to sea level.
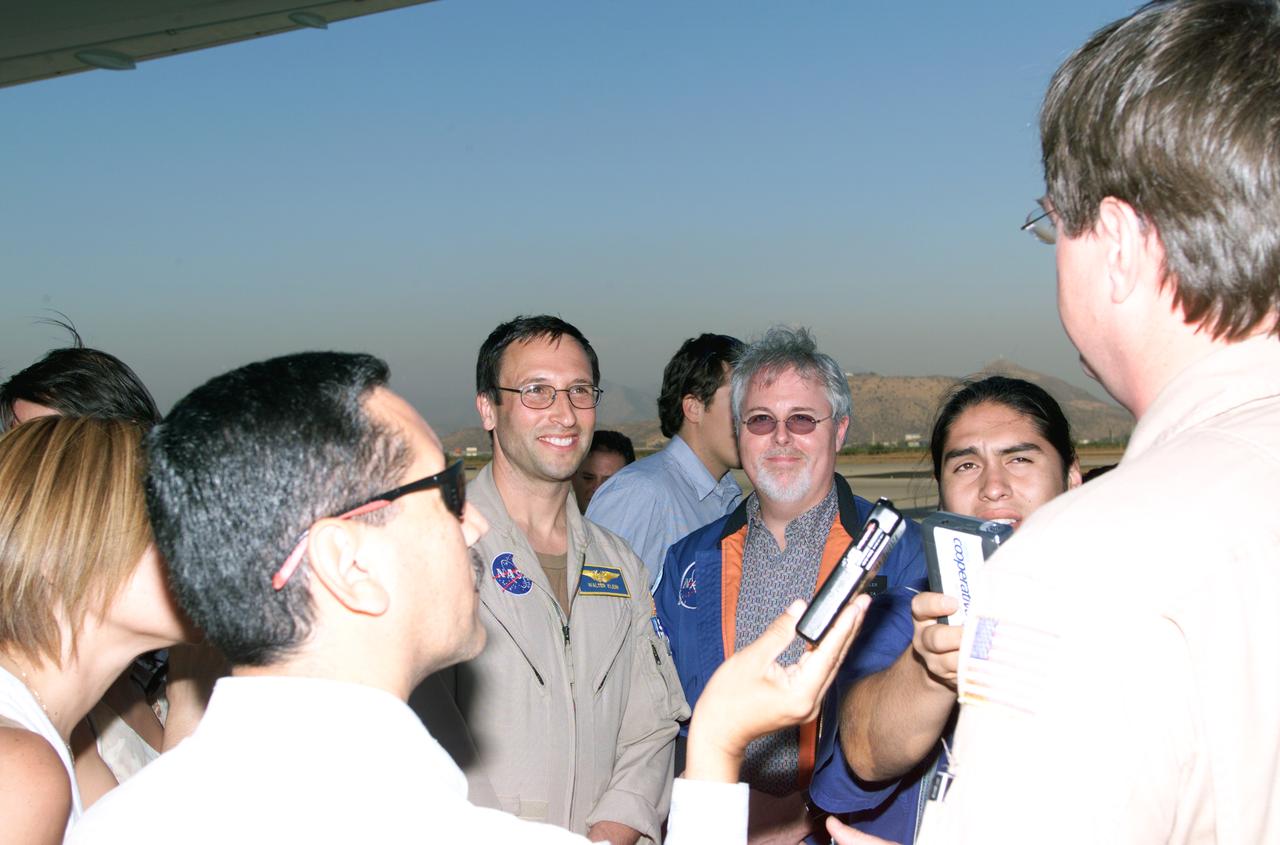
L to R; NASA Dryden Mission Manager Walter Klein (in tan flight suit), JPL AirSAR Scientist Tim Miller, and Mission Manager David Bushman briefing press in Santiago, Chile, for NASA's AirSAR 2004 mission. AirSAR 2004 is a three-week expedition by an international team of scientists that uses an all-weather imaging tool, called the Airborne Synthetic Aperture Radar (AirSAR) which is located onboard NASA's DC-8 airborne laboratory. Scientists from many parts of the world including NASA's Jet Propulsion Laboratory are combining ground research done in several areas in Central and South America with NASA's AirSAR technology to improve and expand on the quality of research they are able to conduct. In South America and Antarctica, AirSAR collected imagery and data to help determine the contribution of Southern Hemisphere glaciers to sea level rise due to climate change. In Patagonia, researchers found this contribution had more than doubled from 1995 to 2000, compared to the previous 25 years. AirSAR data will make it possible to determine whether that trend is continuing or accelerating. AirSAR will also provide reliable information on ice shelf thickness to measure the contribution of the glaciers to sea level.
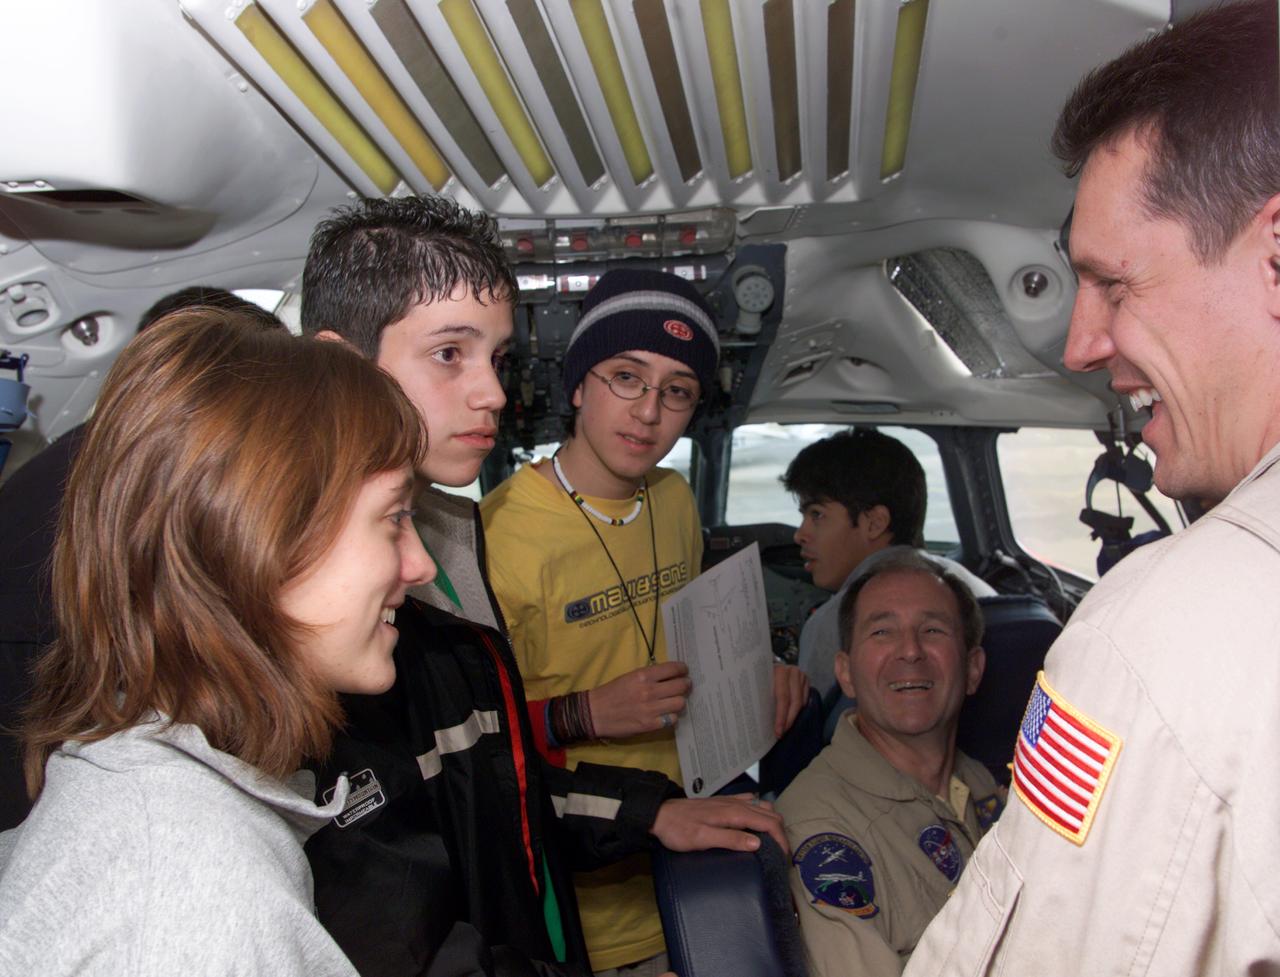
NASA DC-8 Pilots Craig Bomben and Bill Brockett explain the DC-8 cockpit to Chilean students onboard the DC-8 aircraft at Carlos Ibanez del Campo International Airport in Punta Arenas, Chile. AirSAR 2004 is a three-week expedition by an international team of scientists that is using an all-weather imaging tool, called the Airborne Synthetic Aperture Radar (AirSAR) which is located onboard NASA's DC-8 airborne laboratory. Scientists from many parts of the world including NASA's Jet Propulsion Laboratory are combining ground research done in several areas in Central and South America with NASA's AirSAR technology to improve and expand on the quality of research they are able to conduct. In South America and Antarctica, AirSAR will collect imagery and data to help determine the contribution of Southern Hemisphere glaciers to sea level rise due to climate change. In Patagonia, researchers found this contribution had more than doubled from 1995 to 2000, compared to the previous 25 years. AirSAR data will make it possible to determine whether that trend is decreasing, continuing or accelerating. AirSAR will also provide reliable information on ice shelf thickness to measure the contribution of the glaciers to sea level.
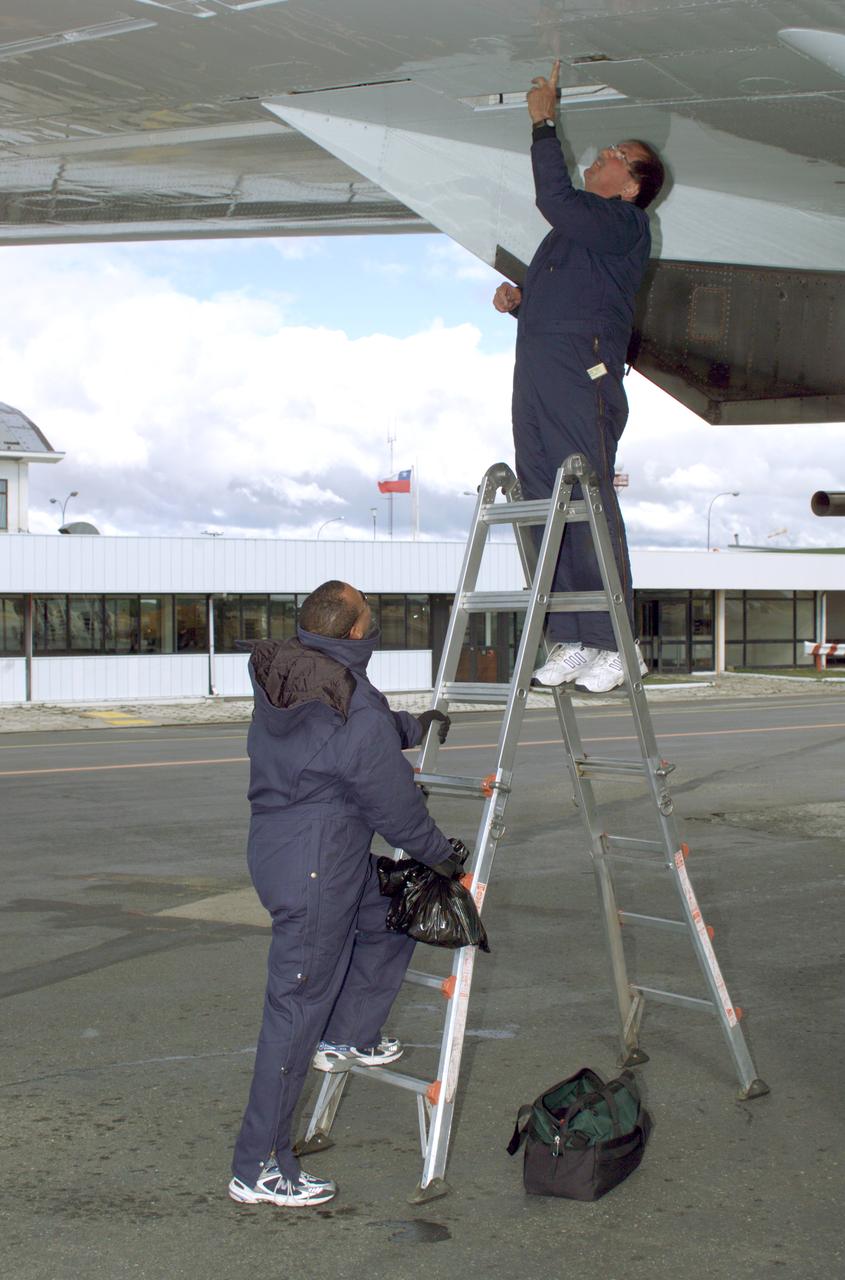
NASA DC-8 Ground Support Technicians Mark Corlew and Mike Lakowski perform routine maintenance on the aircraft at Carlos Ibanez del Campo International Airport in Punta Arenas, Chile. AirSAR 2004 is a three-week expedition by an international team of scientists that is using an all-weather imaging tool, called the Airborne Synthetic Aperture Radar (AirSAR) which is located onboard NASA's DC-8 airborne laboratory. Scientists from many parts of the world including NASA's Jet Propulsion Laboratory are combining ground research done in several areas in Central and South America with NASA's AirSAR technology to improve and expand on the quality of research they are able to conduct. In South America and Antarctica, AirSAR will collect imagery and data to help determine the contribution of Southern Hemisphere glaciers to sea level rise due to climate change. In Patagonia, researchers found this contribution had more than doubled from 1995 to 2000, compared to the previous 25 years. AirSAR data will make it possible to determine whether that trend is decreasing, continuing or accelerating. AirSAR will also provide reliable information on ice shelf thickness to measure the contribution of the glaciers to sea level.
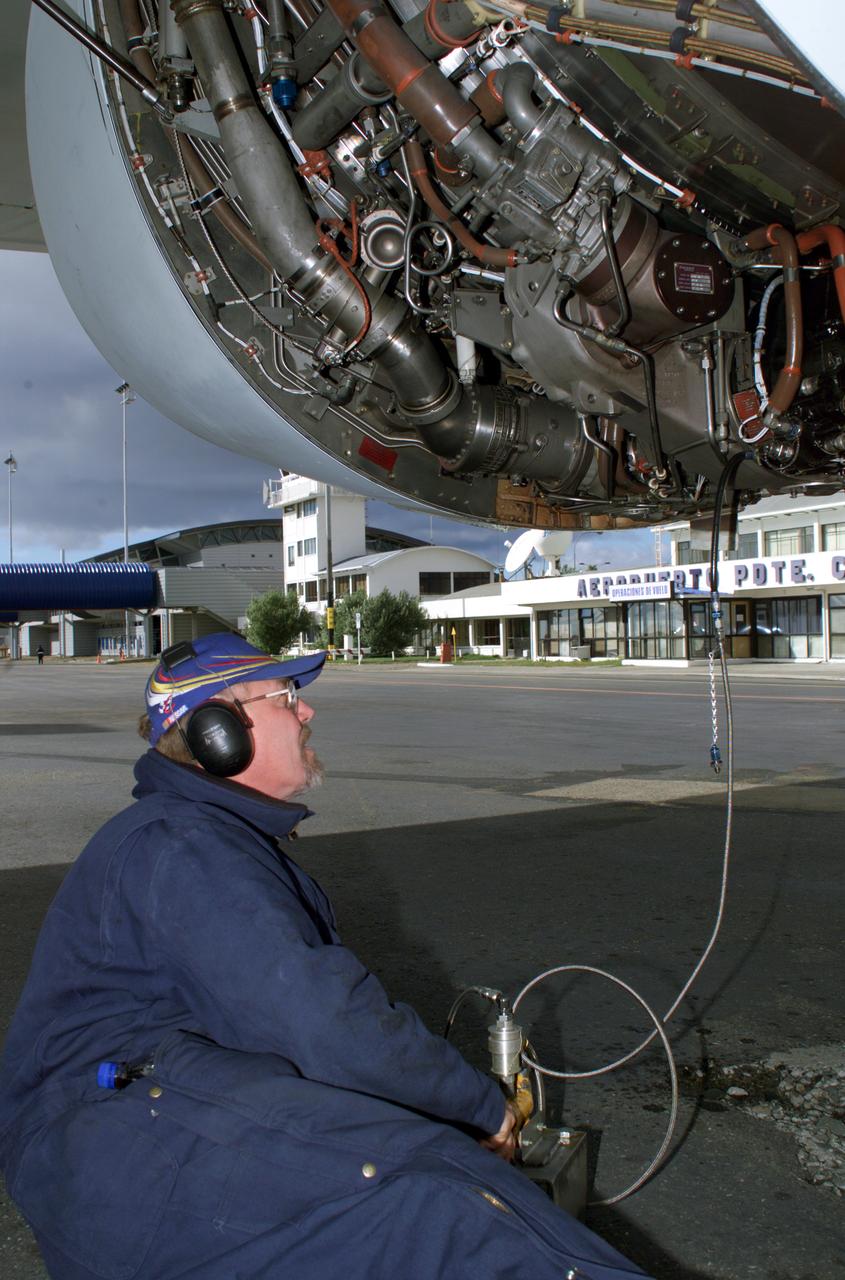
NASA DC-8 Ground Support Technician Joe Niquette performs routine maintenance on the DC-8 aircraft at Carlos Ibanez del Campo International Airport in Punta Arenas, Chile. AirSAR 2004 is a three-week expedition by an international team of scientists that is using an all-weather imaging tool, called the Airborne Synthetic Aperture Radar (AirSAR) which is located onboard NASA's DC-8 airborne laboratory. Scientists from many parts of the world including NASA's Jet Propulsion Laboratory are combining ground research done in several areas in Central and South America with NASA's AirSAR technology to improve and expand on the quality of research they are able to conduct. In South America and Antarctica, AirSAR will collect imagery and data to help determine the contribution of Southern Hemisphere glaciers to sea level rise due to climate change. In Patagonia, researchers found this contribution had more than doubled from 1995 to 2000, compared to the previous 25 years. AirSAR data will make it possible to determine whether that trend is decreasing, continuing or accelerating. AirSAR will also provide reliable information on ice shelf thickness to measure the contribution of the glaciers to sea level.
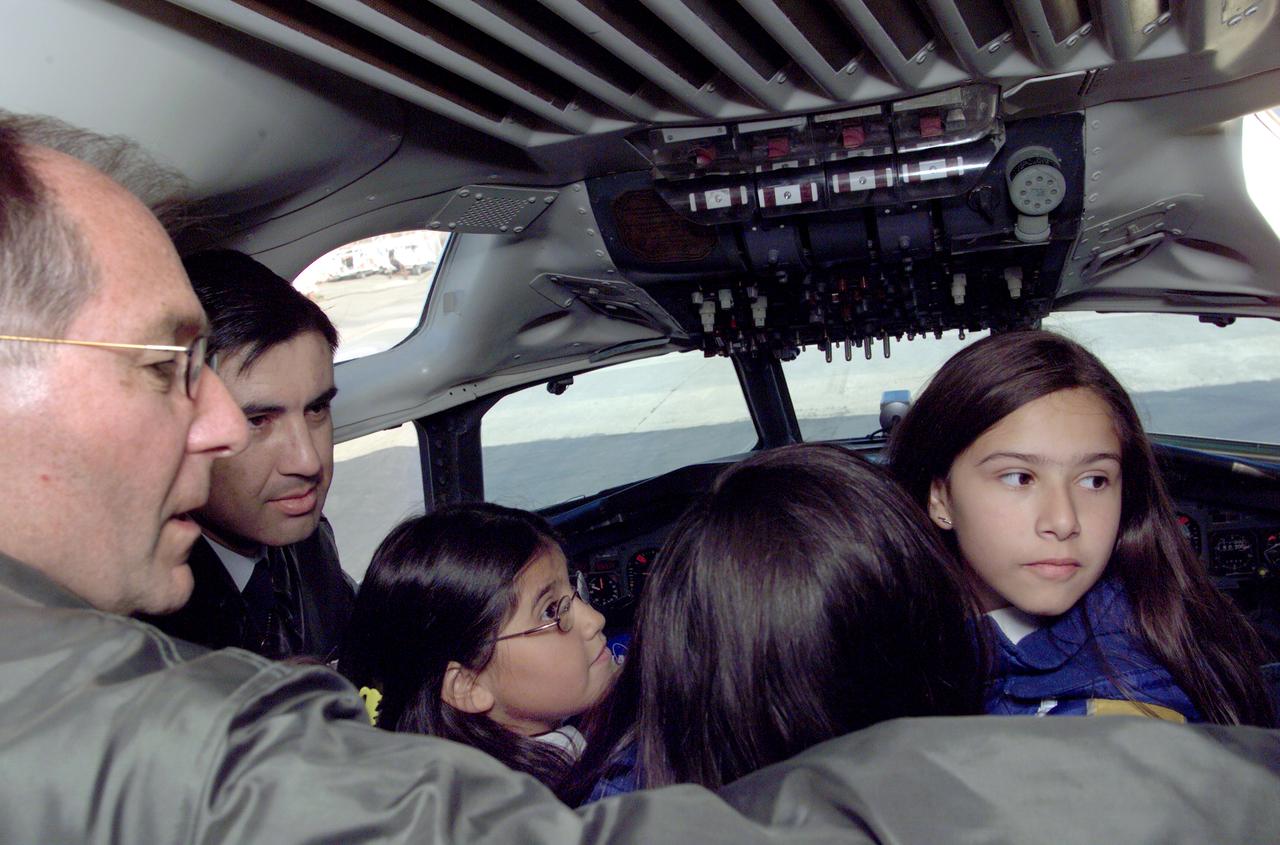
Pilot Bill Brockett (left) and Chilean Air Force Captain Saez with school children in the cockpit of NASA Dryden's DC-8 flying laboratory. Brockett explained NASA's AirSAR 2004 mission in Chile. AirSAR 2004 is a three-week expedition by an international team of scientists that uses an all-weather imaging tool, called the Airborne Synthetic Aperture Radar (AirSAR) which is located onboard NASA's DC-8 airborne laboratory. Scientists from many parts of the world including NASA's Jet Propulsion Laboratory are combining ground research done in several areas in Central and South America with NASA's AirSAR technology to improve and expand on the quality of research they are able to conduct. In South America and Antarctica, AirSAR collected imagery and data to help determine the contribution of Southern Hemisphere glaciers to sea level rise due to climate change. In Patagonia, researchers found this contribution had more than doubled from 1995 to 2000, compared to the previous 25 years. AirSAR data will make it possible to determine whether that trend is continuing or accelerating. AirSAR will also provide reliable information on ice shelf thickness to measure the contribution of the glaciers to sea level.

Dr. Tom Mace, NASA DFRC Director of Airborne Sciences, talks with a student from Punta Arenas, Chile, during a tour of the DC-8 aircraft while it was in the country supporting the AirSAR 2004 campaign. AirSAR 2004 is a three-week expedition by an international team of scientists that uses an all-weather imaging tool, called the Airborne Synthetic Aperture Radar (AirSAR) which is located onboard NASA's DC-8 airborne laboratory. Scientists from many parts of the world including NASA's Jet Propulsion Laboratory are combining ground research done in several areas in Central and South America with NASA's AirSAR technology to improve and expand on the quality of research they are able to conduct. In South America and Antarctica, AirSAR collected imagery and data to help determine the contribution of Southern Hemisphere glaciers to sea level rise due to climate change. In Patagonia, researchers found this contribution had more than doubled from 1995 to 2000, compared to the previous 25 years. AirSAR data will make it possible to determine whether that trend is continuing or accelerating. AirSAR will also provide reliable information on ice shelf thickness to measure the contribution of the glaciers to sea level.

NASA Dryden Mission Manager Walter Klein poses with school children that visited the DC-8 during AirSAR 2004 in Punta Arenas, Chile. AirSAR 2004 is a three-week expedition by an international team of scientists that uses an all-weather imaging tool, called the Airborne Synthetic Aperture Radar (AirSAR) which is located onboard NASA's DC-8 airborne laboratory. Scientists from many parts of the world including NASA's Jet Propulsion Laboratory are combining ground research done in several areas in Central and South America with NASA's AirSAR technology to improve and expand on the quality of research they are able to conduct. In South America and Antarctica, AirSAR collected imagery and data to help determine the contribution of Southern Hemisphere glaciers to sea level rise due to climate change. In Patagonia, researchers found this contribution had more than doubled from 1995 to 2000, compared to the previous 25 years. AirSAR data will make it possible to determine whether that trend is continuing or accelerating. AirSAR will also provide reliable information on ice shelf thickness to measure the contribution of the glaciers to sea level.

NASA Dryden Mission Manager Walter Klein talks with school children from Punta Arenas, Chile, during a tour of the DC-8 aircraft while it was in the country supporting the AirSAR 2004 campaign. AirSAR 2004 is a three-week expedition by an international team of scientists that uses an all-weather imaging tool, called the Airborne Synthetic Aperture Radar (AirSAR) which is located onboard NASA's DC-8 airborne laboratory. Scientists from many parts of the world including NASA's Jet Propulsion Laboratory are combining ground research done in several areas in Central and South America with NASA's AirSAR technology to improve and expand on the quality of research they are able to conduct. In South America and Antarctica, AirSAR collected imagery and data to help determine the contribution of Southern Hemisphere glaciers to sea level rise due to climate change. In Patagonia, researchers found this contribution had more than doubled from 1995 to 2000, compared to the previous 25 years. AirSAR data will make it possible to determine whether that trend is continuing or accelerating. AirSAR will also provide reliable information on ice shelf thickness to measure the contribution of the glaciers to sea level.
NASA DC-8 Mission Manager Walter Klein poses with a group of Chilean Students onboard the aircraft at Carlos Ibanez del Campo International Airport in Punta Arenas, Chile. AirSAR 2004 is a three-week expedition by an international team of scientists that is using an all-weather imaging tool, called the Airborne Synthetic Aperture Radar (AirSAR) which is located onboard NASA's DC-8 airborne laboratory. Scientists from many parts of the world including NASA's Jet Propulsion Laboratory are combining ground research done in several areas in Central and South America with NASA's AirSAR technology to improve and expand on the quality of research they are able to conduct. In South America and Antarctica, AirSAR will collect imagery and data to help determine the contribution of Southern Hemisphere glaciers to sea level rise due to climate change. In Patagonia, researchers found this contribution had more than doubled from 1995 to 2000, compared to the previous 25 years. AirSAR data will make it possible to determine whether that trend is decreasing, continuing or accelerating. AirSAR will also provide reliable information on ice shelf thickness to measure the contribution of the glaciers to sea level.

School children from Punta Arenas, Chile, talk with Dr. David Imel, an AirSAR scientist from NASA JPL, during AirSAR 2004. AirSAR 2004 is a three-week expedition by an international team of scientists that uses an all-weather imaging tool, called the Airborne Synthetic Aperture Radar (AirSAR) which is located onboard NASA's DC-8 airborne laboratory. Scientists from many parts of the world including NASA's Jet Propulsion Laboratory are combining ground research done in several areas in Central and South America with NASA's AirSAR technology to improve and expand on the quality of research they are able to conduct. In South America and Antarctica, AirSAR collected imagery and data to help determine the contribution of Southern Hemisphere glaciers to sea level rise due to climate change. In Patagonia, researchers found this contribution had more than doubled from 1995 to 2000, compared to the previous 25 years. AirSAR data will make it possible to determine whether that trend is continuing or accelerating. AirSAR will also provide reliable information on ice shelf thickness to measure the contribution of the glaciers to sea level.
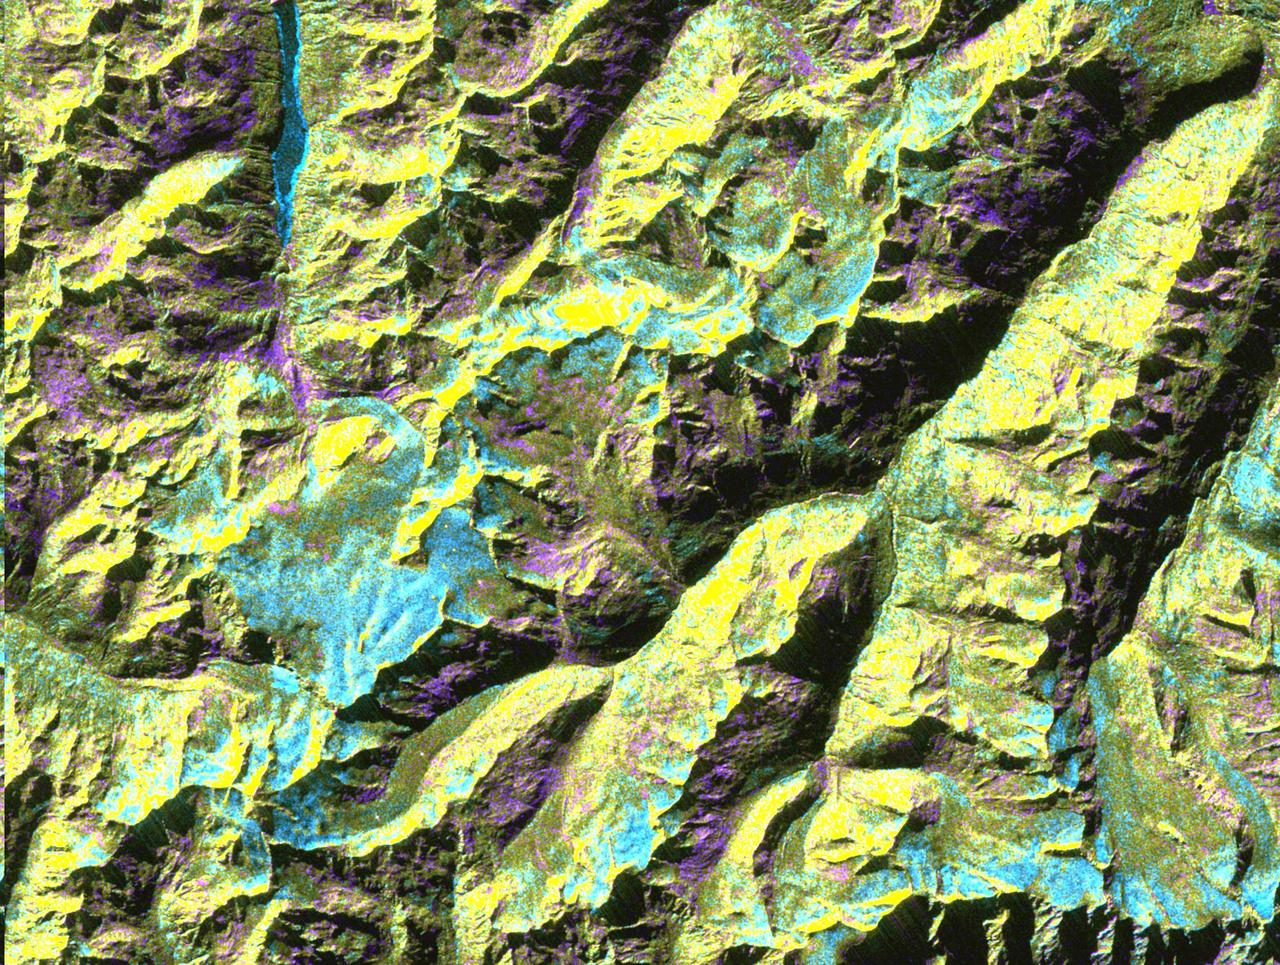
This is a digital elevation model that was geometrically coded directly onto an X-band seasonal change image of the Oetztal supersite in Austria. The image is centered at 46.82 degrees north latitude and 10.79 degrees east longitude. This image is located in the Central Alps at the border between Switzerland, Italy and Austria, 50 kilometers (31 miles) southwest of Innsbruck. It was acquired by the Spaceborne Imaging Radar-C/X-band Synthetic Aperture aboard the space shuttle Endeavour on April 14, 1994 and on October 5, 1994. It was produced by combining data from these two different data sets. Data obtained in April is green; data obtained in October appears in red and blue, and was used as an enhancement based on the ratio of the two data sets. Areas with a decrease in backscatter from April to October appear in light blue (cyan), such as the large Gepatschferner glacier seen at the left of the image center, and most of the other glaciers in this view. A light blue hue is also visible at the east border of the dark blue Lake Reschensee at the upper left side. This shows a significant rise in the water level. Magenta represents areas with an increase of backscatter from April 10 to October 5. Yellow indicates areas with high radar signal response during both passes, such as the mountain slopes facing the radar. Low radar backscatter signals refer to smooth surface (lakes) or radar grazing areas to radar shadow areas, seen in the southeast slopes. The area is approximately 29 kilometers by 21 kilometers (18 miles by 13.5 miles). The summit of the main peaks reaches elevations of 3,500 to 3,768 meters (xx feet to xx feet) above sea level. The test site's core area is the glacier region of Venter Valley, which is one of the most intensively studied areas for glacier research in the world. Research in Venter Valley (below center) includes studies of glacier dynamics, glacier-climate regions, snowpack conditions and glacier hydrology. About 25 percent of the core test site is covered by glaciers. Corner reflectors are set up for calibration. Five corner reflectors can be seen on the Gepatschferner and two can be seen on the Vernagtferner. http://photojournal.jpl.nasa.gov/catalog/PIA01760
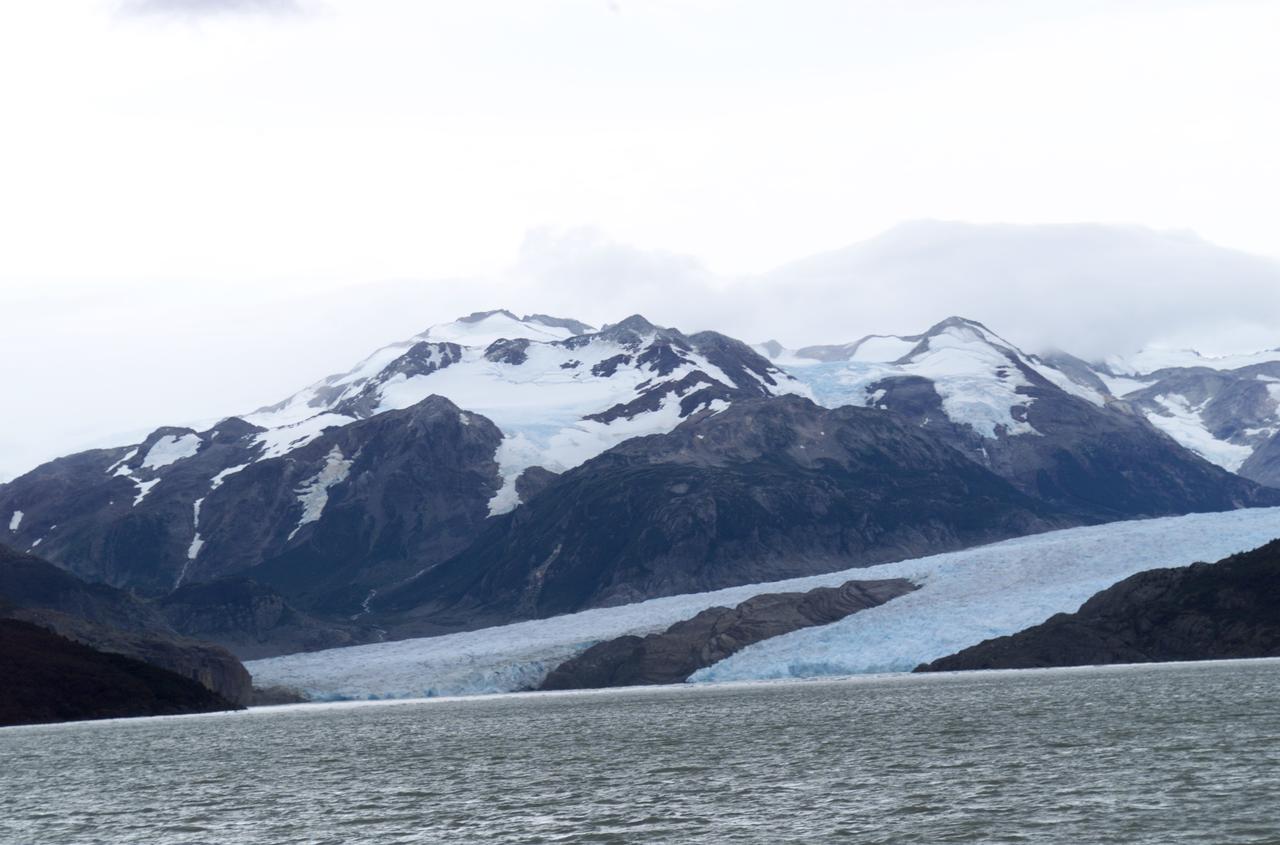
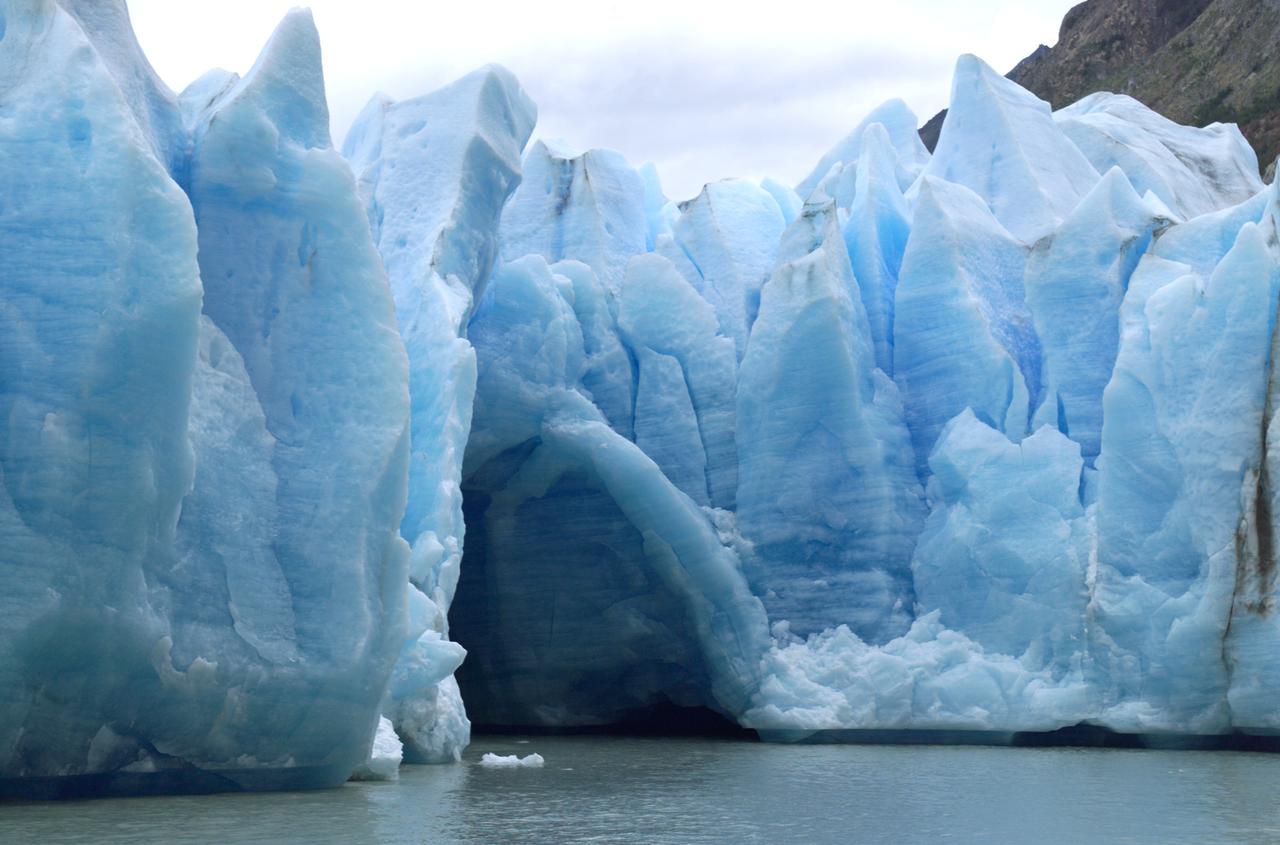
Glacier Grey view from Lago Grey (Grey Lake), photographed during NASA's AirSAR 2004 campaign in Chile. Land visible in this photo was covered by glacier just 6 years earlier. AirSAR 2004 is a three-week expedition in Central and South America by an international team of scientists that is using an all-weather imaging tool, called the Airborne Synthetic Aperture Radar (AirSAR), located onboard NASA's DC-8 airborne laboratory. Scientists from many parts of the world are combining ground research with NASA's AirSAR technology to improve and expand on the quality of research they are able to conduct. Founded in 1959, Torres del Paine National Park encompasses 450,000 acres in the Patagonia region of Chile. This region is being studied by NASA using a DC-8 equipped with an Airborne Synthetic Aperture Radar (AirSAR) developed by scientists from NASA’s Jet Propulsion Laboratory. This is a very sensitive region that is important to scientists because the temperature has been consistently rising causing a subsequent melting of the region’s glaciers. AirSAR will provide a baseline model and unprecedented mapping of the region. This data will make it possible to determine whether the warming trend is slowing, continuing or accelerating. AirSAR will also provide reliable information on ice shelf thickness to measure the contribution of the glaciers to sea level.
Satellite images from 2022 (Main image) and 1999 (Figure A) capture the retreat of Zachariae Isstrom, a glacier in northeast Greenland, as icebergs broke off its edge over the course of 23 years. In a recent study in Nature, researchers from NASA's Jet Propulsion Laboratory in Southern California calculated that Zachariae lost an estimated 176 billion tons (160 billion metric tons) of ice in the period between 1985 and 2022. That was the greatest mass lost for the period of any of the 207 glaciers analyzed in the paper. The earlier image was taken by the Enhanced Thematic Mapper Plus on the Landsat 7 satellite on Aug. 5, 1999, while the later image was captured by the Operational Land Imager on the Landsat 8 satellite on Aug. 22, 2022. The study took a comprehensive look at glacial retreat around the edges of the entire Greenland Ice Sheet from 1985 to 2022 and found that 179 glaciers retreated significantly since 1985, 27 held steady, and just one advanced slightly. The study found that overall the ice sheet shed about 1,140 billion tons (1,034 billion metric tons) of ice from 1985 to 2022, one-fifth more mass than previously estimated, as icebergs fell into the ocean at an accelerating rate. Most of the ice loss came from below sea level, in fjords on Greenland's periphery. Once occupied by ancient glacial ice, many of these deep coastal valleys have filled with seawater – meaning the ice that broke off made little net contribution to sea level. But the loss likely accelerated the movement of ice flowing down from higher elevations, which in turn added to sea level rise. It also added previously unaccounted-for fresh water to the North Atlantic Ocean, which could have impacts on global ocean currents. https://photojournal.jpl.nasa.gov/catalog/PIA26118
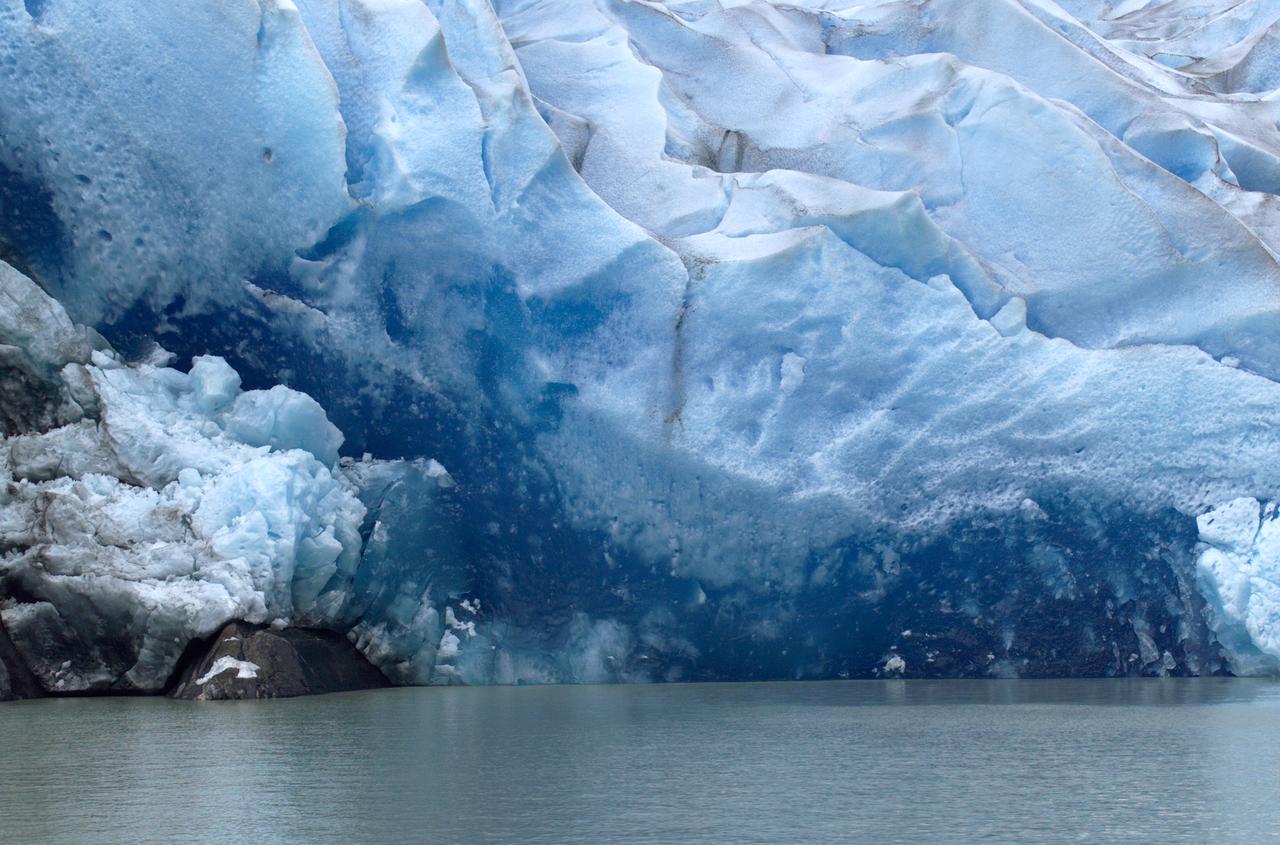
Close-up view of Grey Glacier from Lago Grey (Grey Lake), taken during NASA's AirSAR 2004 campaign in Chile. AirSAR 2004 is a three-week expedition in Central and South America by an international team of scientists that is using an all-weather imaging tool, called the Airborne Synthetic Aperture Radar (AirSAR), located onboard NASA's DC-8 airborne laboratory. Scientists from many parts of the world are combining ground research with NASA's AirSAR technology to improve and expand on the quality of research they are able to conduct. Founded in 1959, Torres del Paine National Park encompasses 450,000 acres in the Patagonia region of Chile. This region is being studied by NASA using a DC-8 equipped with an Airborne Synthetic Aperture Radar (AirSAR) developed by scientists from NASA’s Jet Propulsion Laboratory. This is a very sensitive region that is important to scientists because the temperature has been consistently rising causing a subsequent melting of the region’s glaciers. AirSAR will provide a baseline model and unprecedented mapping of the region. This data will make it possible to determine whether the warming trend is slowing, continuing or accelerating. AirSAR will also provide reliable information on ice shelf thickness to measure the contribution of the glaciers to sea level.
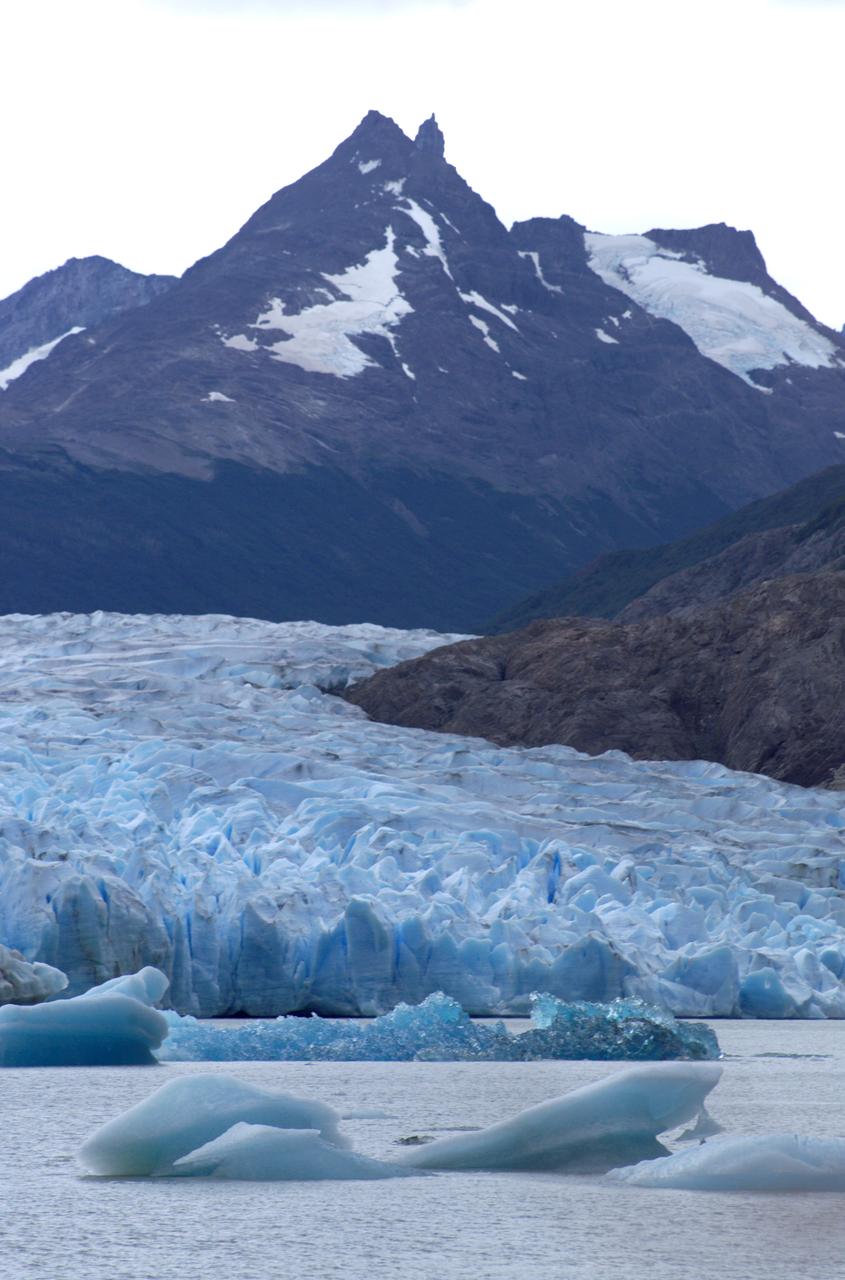
Glacier Grey in front of the Cuernos del Paine mountains, photographed from Lago Grey (Grey Lake) during NASA's AirSAR 2004 campaign in Chile. AirSAR 2004 is a three-week expedition in Central and South America by an international team of scientists that is using an all-weather imaging tool, called the Airborne Synthetic Aperture Radar (AirSAR), located onboard NASA's DC-8 airborne laboratory. Scientists from many parts of the world are combining ground research with NASA's AirSAR technology to improve and expand on the quality of research they are able to conduct. Founded in 1959, Torres del Paine National Park encompasses 450,000 acres in the Patagonia region of Chile. This region is being studied by NASA using a DC-8 equipped with an Airborne Synthetic Aperture Radar (AirSAR) developed by scientists from NASA’s Jet Propulsion Laboratory. This is a very sensitive region that is important to scientists because the temperature has been consistently rising causing a subsequent melting of the region’s glaciers. AirSAR will provide a baseline model and unprecedented mapping of the region. This data will make it possible to determine whether the warming trend is slowing, continuing or accelerating. AirSAR will also provide reliable information on ice shelf thickness to measure the contribution of the glaciers to sea level.
A cave in Glacier Grey in Torres del Paine National Park, seen during NASA's AirSAR 2004 campaign in Chile. AirSAR 2004 is a three-week expedition in Central and South America by an international team of scientists that is using an all-weather imaging tool, called the Airborne Synthetic Aperture Radar (AirSAR), located onboard NASA's DC-8 airborne laboratory. Scientists from many parts of the world are combining ground research with NASA's AirSAR technology to improve and expand on the quality of research they are able to conduct. Founded in 1959, Torres del Paine National Park encompasses 450,000 acres in the Patagonia region of Chile. This region is being studied by NASA using a DC-8 equipped with an Airborne Synthetic Aperture Radar (AirSAR) developed by scientists from NASA’s Jet Propulsion Laboratory. This is a very sensitive region that is important to scientists because the temperature has been consistently rising causing a subsequent melting of the region’s glaciers. AirSAR will provide a baseline model and unprecedented mapping of the region. This data will make it possible to determine whether the warming trend is slowing, continuing or accelerating. AirSAR will also provide reliable information on ice shelf thickness to measure the contribution of the glaciers to sea level.
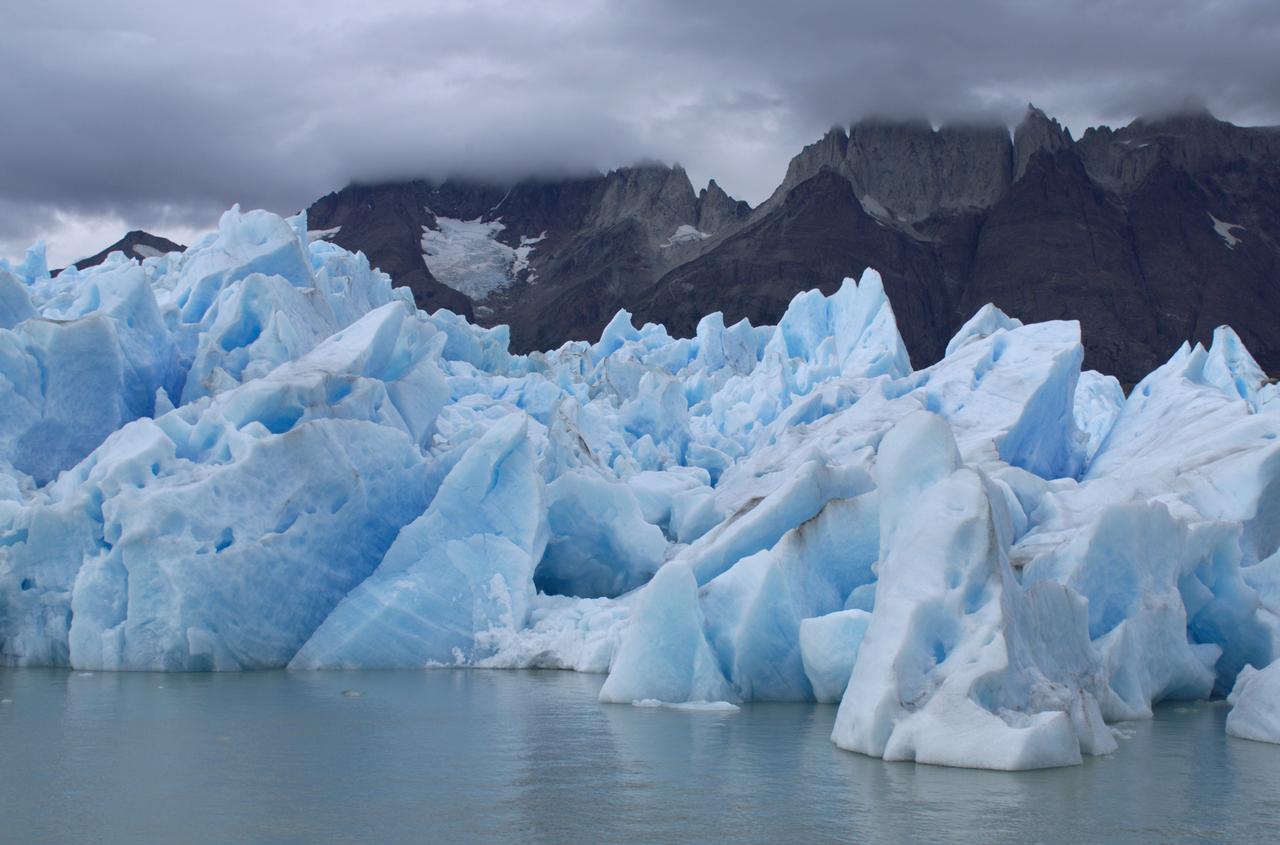
View of Glacier Grey from Lago Grey (Grey Lake), with the Cuernos del Paine mountains in the background, seen during NASA's AirSAR 2004 campaign in Chile. AirSAR 2004 is a three-week expedition in Central and South America by an international team of scientists that is using an all-weather imaging tool, called the Airborne Synthetic Aperture Radar (AirSAR), located onboard NASA's DC-8 airborne laboratory. Scientists from many parts of the world are combining ground research with NASA's AirSAR technology to improve and expand on the quality of research they are able to conduct. Founded in 1959, Torres del Paine National Park encompasses 450,000 acres in the Patagonia region of Chile. This region is being studied by NASA using a DC-8 equipped with an Airborne Synthetic Aperture Radar (AirSAR) developed by scientists from NASA’s Jet Propulsion Laboratory. This is a very sensitive region that is important to scientists because the temperature has been consistently rising causing a subsequent melting of the region’s glaciers. AirSAR will provide a baseline model and unprecedented mapping of the region. This data will make it possible to determine whether the warming trend is slowing, continuing or accelerating. AirSAR will also provide reliable information on ice shelf thickness to measure the contribution of the glaciers to sea level.
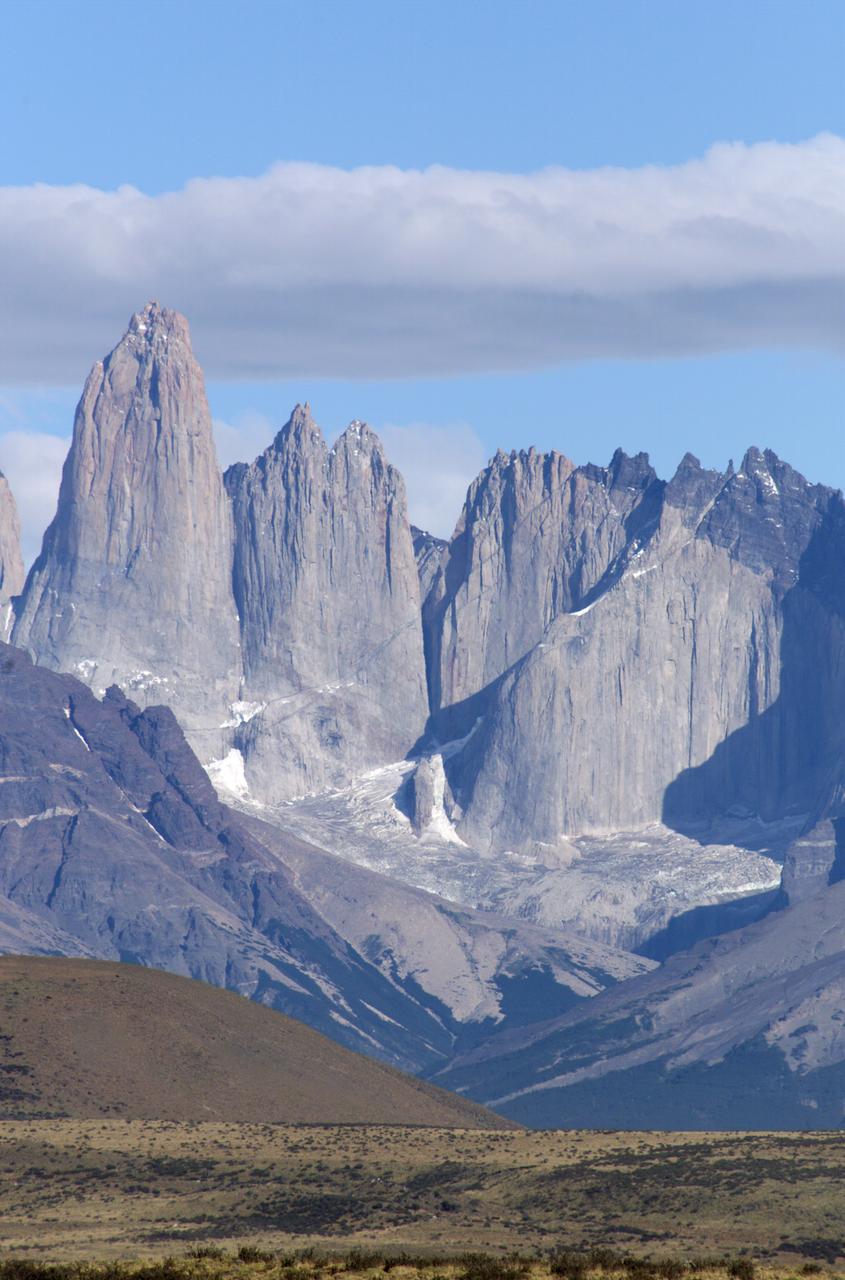
The Cuernos del Paine mountains in Torres del Paine National Park in Chile, photographed during NASA's AirSAR 2004 campaign. AirSAR 2004 is a three-week expedition in Central and South America by an international team of scientists that is using an all-weather imaging tool, called the Airborne Synthetic Aperture Radar (AirSAR), located onboard NASA's DC-8 airborne laboratory. Scientists from many parts of the world are combining ground research with NASA's AirSAR technology to improve and expand on the quality of research they are able to conduct. Founded in 1959, Torres del Paine National Park encompasses 450,000 acres in the Patagonia region of Chile. This region is being studied by NASA using a DC-8 equipped with an Airborne Synthetic Aperture Radar (AirSAR) developed by scientists from NASA’s Jet Propulsion Laboratory. This is a very sensitive region that is important to scientists because the temperature has been consistently rising causing a subsequent melting of the region’s glaciers. AirSAR will provide a baseline model and unprecedented mapping of the region. This data will make it possible to determine whether the warming trend is slowing, continuing or accelerating. AirSAR will also provide reliable information on ice shelf thickness to measure the contribution of the glaciers to sea level.
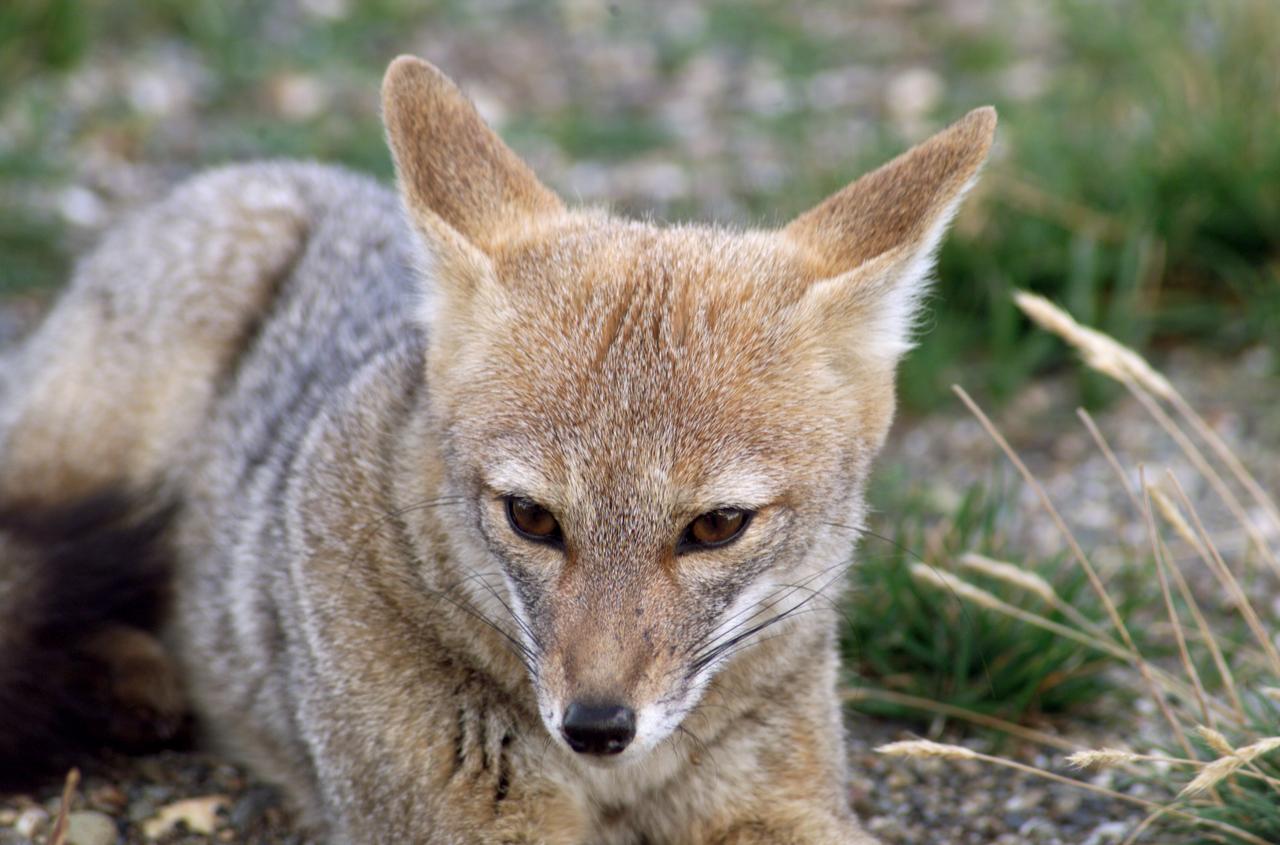
A fox at Torres del Paine National Park in Chile during NASA's AirSAR 2004 campaign. AirSAR 2004 is a three-week expedition in Central and South America by an international team of scientists that is using an all-weather imaging tool, called the Airborne Synthetic Aperture Radar (AirSAR), located onboard NASA's DC-8 airborne laboratory. Scientists from many parts of the world are combining ground research with NASA's AirSAR technology to improve and expand on the quality of research they are able to conduct. Founded in 1959, Torres del Paine National Park encompasses 450,000 acres in the Patagonia region of Chile. This region is being studied by NASA using a DC-8 equipped with an Airborne Synthetic Aperture Radar (AirSAR) developed by scientists from NASA’s Jet Propulsion Laboratory. This is a very sensitive region that is important to scientists because the temperature has been consistently rising causing a subsequent melting of the region’s glaciers. AirSAR will provide a baseline model and unprecedented mapping of the region. This data will make it possible to determine whether the warming trend is slowing, continuing or accelerating. AirSAR will also provide reliable information on ice shelf thickness to measure the contribution of the glaciers to sea level.
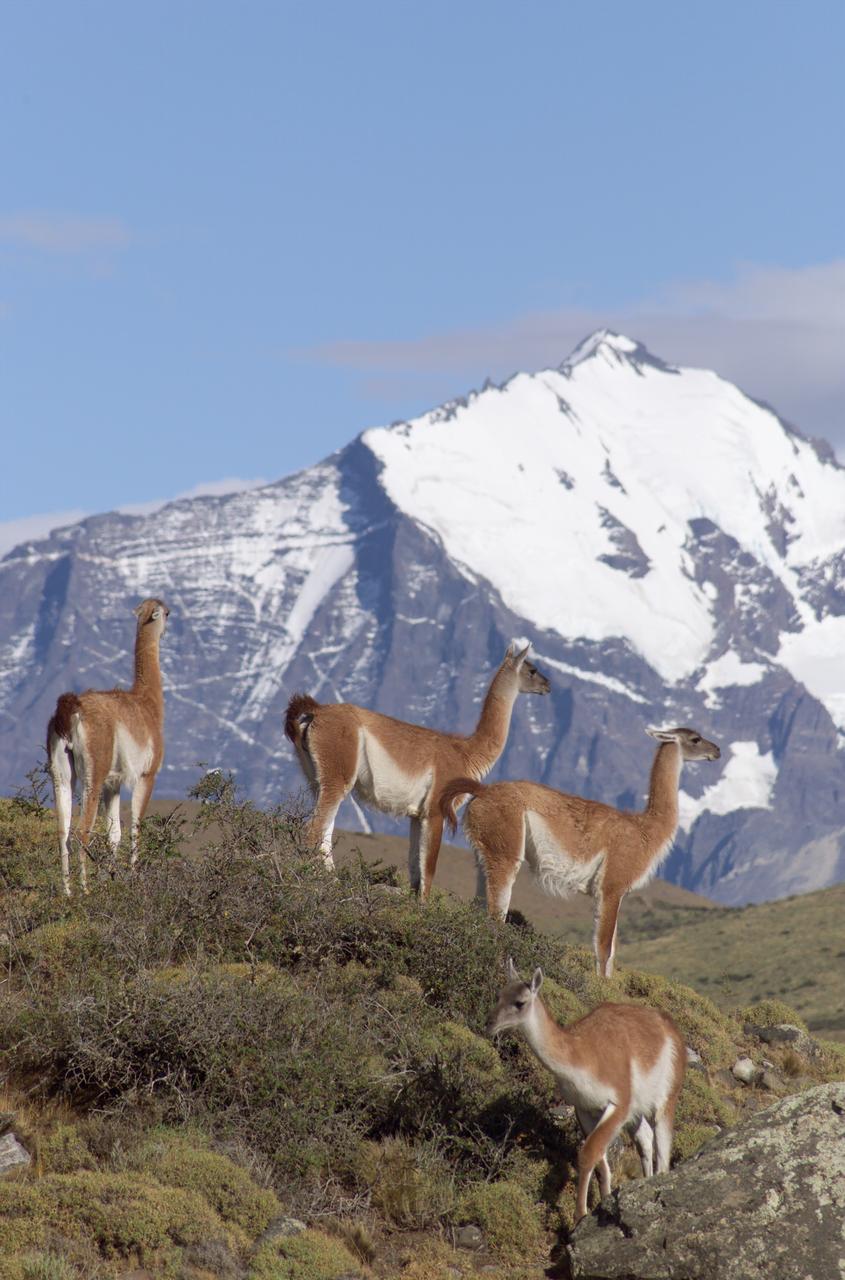
The Cuernos del Paine mountains in Torres del Paine National Park in Chile provide a backdrop to a herd of guanacos during NASA's AirSAR 2004 campaign. AirSAR 2004 is a three-week expedition in Central and South America by an international team of scientists that is using an all-weather imaging tool, called the Airborne Synthetic Aperture Radar (AirSAR), located onboard NASA's DC-8 airborne laboratory. Scientists from many parts of the world are combining ground research with NASA's AirSAR technology to improve and expand on the quality of research they are able to conduct. Founded in 1959, Torres del Paine National Park encompasses 450,000 acres in the Patagonia region of Chile. This region is being studied by NASA using a DC-8 equipped with an Airborne Synthetic Aperture Radar (AirSAR) developed by scientists from NASA’s Jet Propulsion Laboratory. This is a very sensitive region that is important to scientists because the temperature has been consistently rising causing a subsequent melting of the region’s glaciers. AirSAR will provide a baseline model and unprecedented mapping of the region. This data will make it possible to determine whether the warming trend is slowing, continuing or accelerating. AirSAR will also provide reliable information on ice shelf thickness to measure the contribution of the glaciers to sea level.
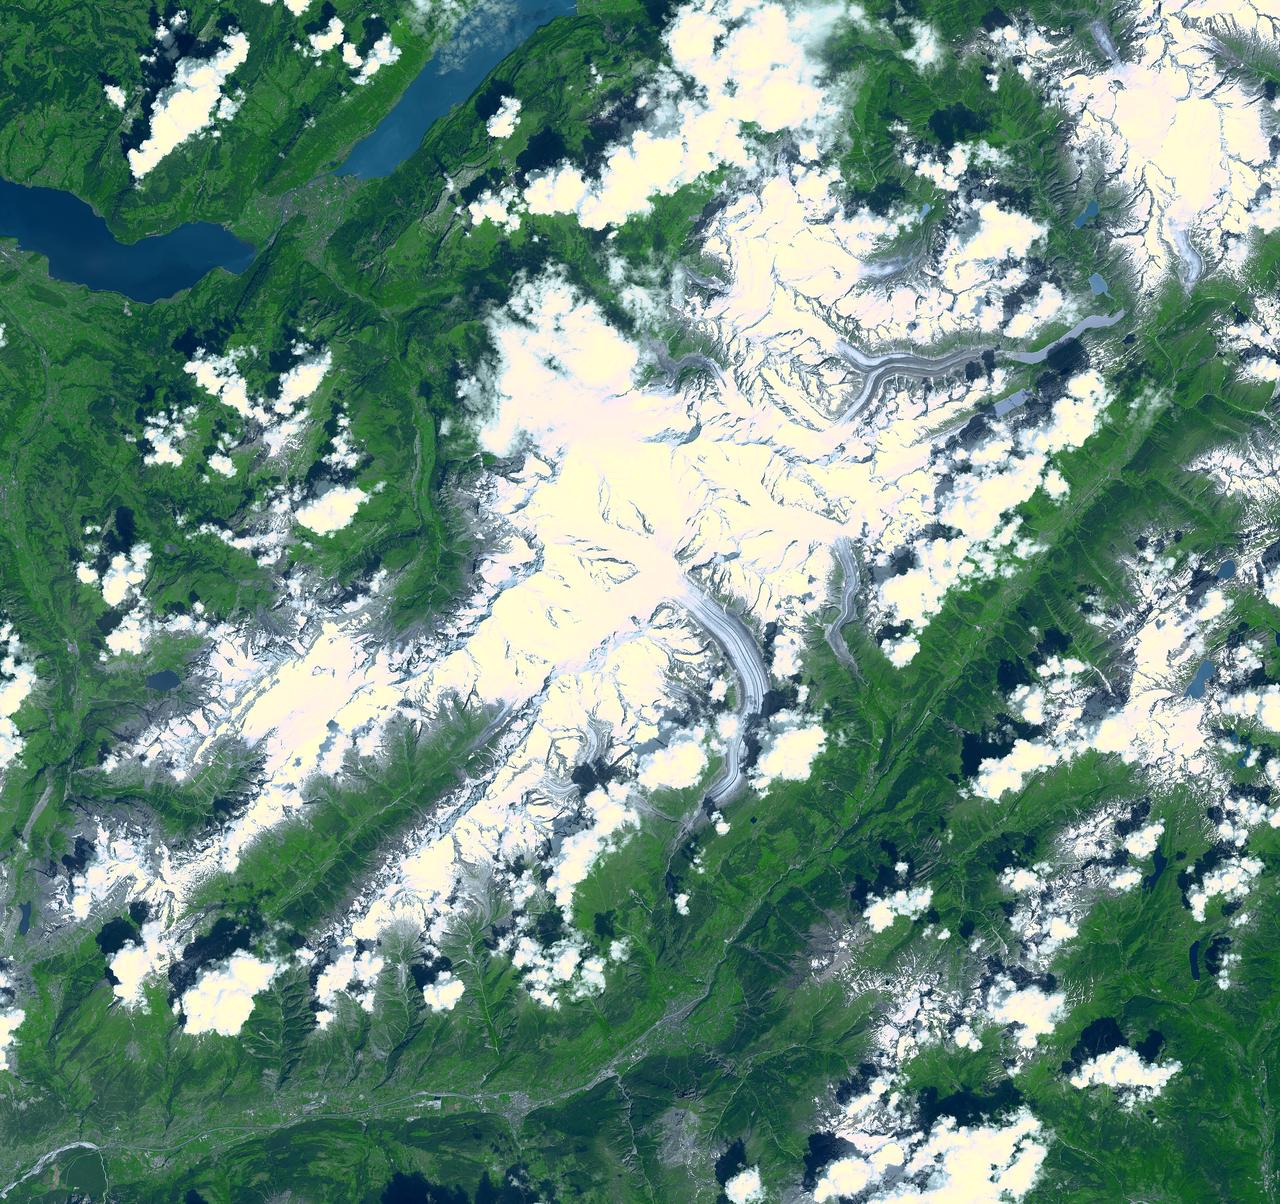
Aletsch Glacier, the largest glacier of Europe, covers more than 120 square kilometers (more than 45 square miles) in southern Switzerland. At its eastern extremity lies a glacierlake, Mdrjelensee (2,350 meters/7,711 feet above sea level). To the west rises Aletschhorn (4,195 meters/13,763 feet), which was first climbed in 1859. The Rhone River flows along the southern flank of the mountains. This image was acquired on July 23, 2001 by the Advanced Spaceborne Thermal Emission and Reflection Radiometer (ASTER) on NASA's Terra satellite. With its 14 spectral bands from the visible to the thermal infrared wavelength region, and its high spatial resolution of 15 to 90 meters (about 50 to 300 feet), ASTER will image Earth for the next 6 years to map and monitor the changing surface of our planet. ASTER is one of five Earth-observing instruments launched December 18, 1999, on NASA's Terra satellite. The instrument was built by Japan's Ministry of Economy, Trade and Industry. A joint U.S./Japan science team is responsible for validation and calibration of the instrument and the data products. http://photojournal.jpl.nasa.gov/catalog/PIA03857
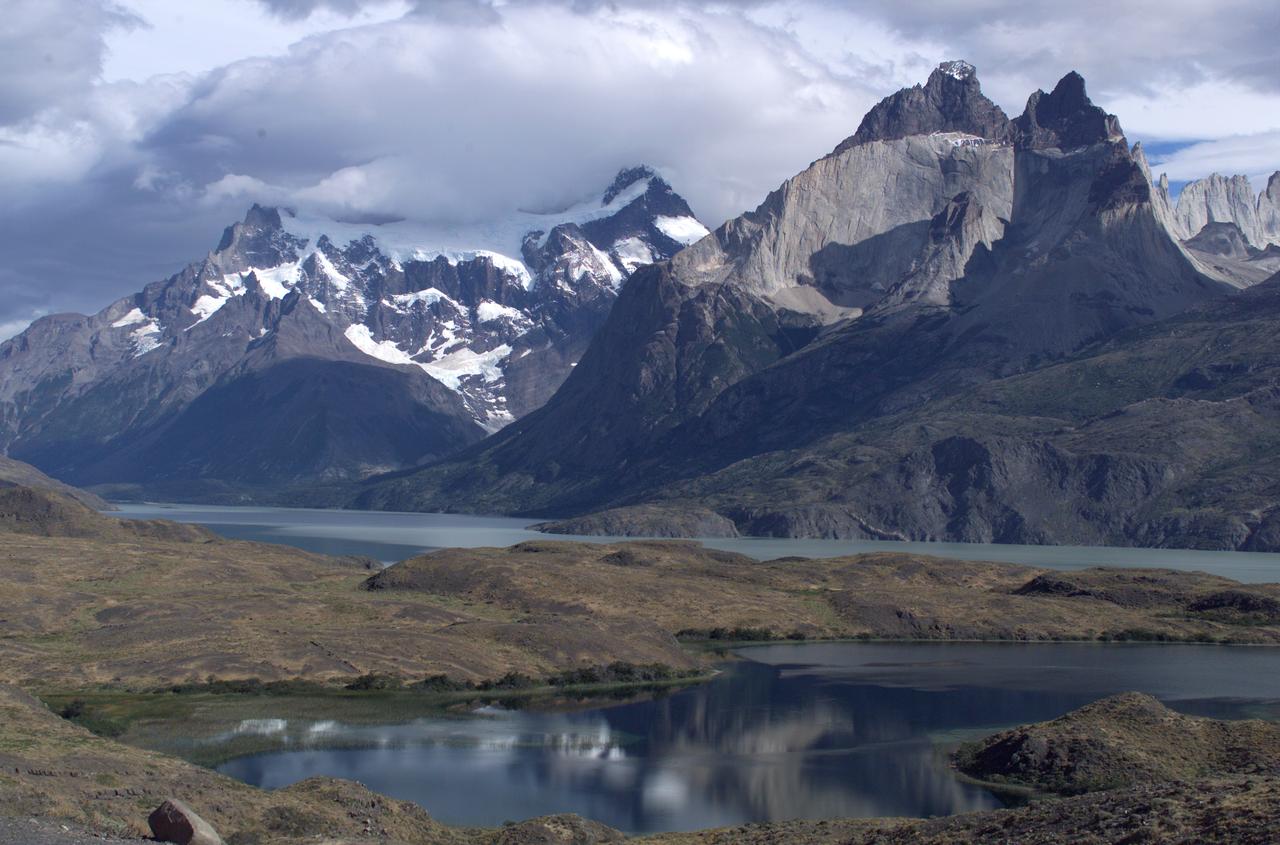
The Cuernos del Paine mountains in Torres del Paine National Park, Chile, during NASA's AirSAR 2004 campaign. AirSAR 2004 is a three-week expedition in Central and South America by an international team of scientists that is using an all-weather imaging tool, called the Airborne Synthetic Aperture Radar (AirSAR), located onboard NASA's DC-8 airborne laboratory. Scientists from many parts of the world are combining ground research with NASA's AirSAR technology to improve and expand on the quality of research they are able to conduct. Founded in 1959, Torres del Paine National Park encompasses 450,000 acres in the Patagonia region of Chile. This region is being studied by NASA using a DC-8 equipped with an Airborne Synthetic Aperture Radar (AirSAR) developed by scientists from NASA’s Jet Propulsion Laboratory. This is a very sensitive region that is important to scientists because the temperature has been consistently rising causing a subsequent melting of the region’s glaciers. AirSAR will provide a baseline model and unprecedented mapping of the region. This data will make it possible to determine whether the warming trend is slowing, continuing or accelerating. AirSAR will also provide reliable information on ice shelf thickness to measure the contribution of the glaciers to sea level.
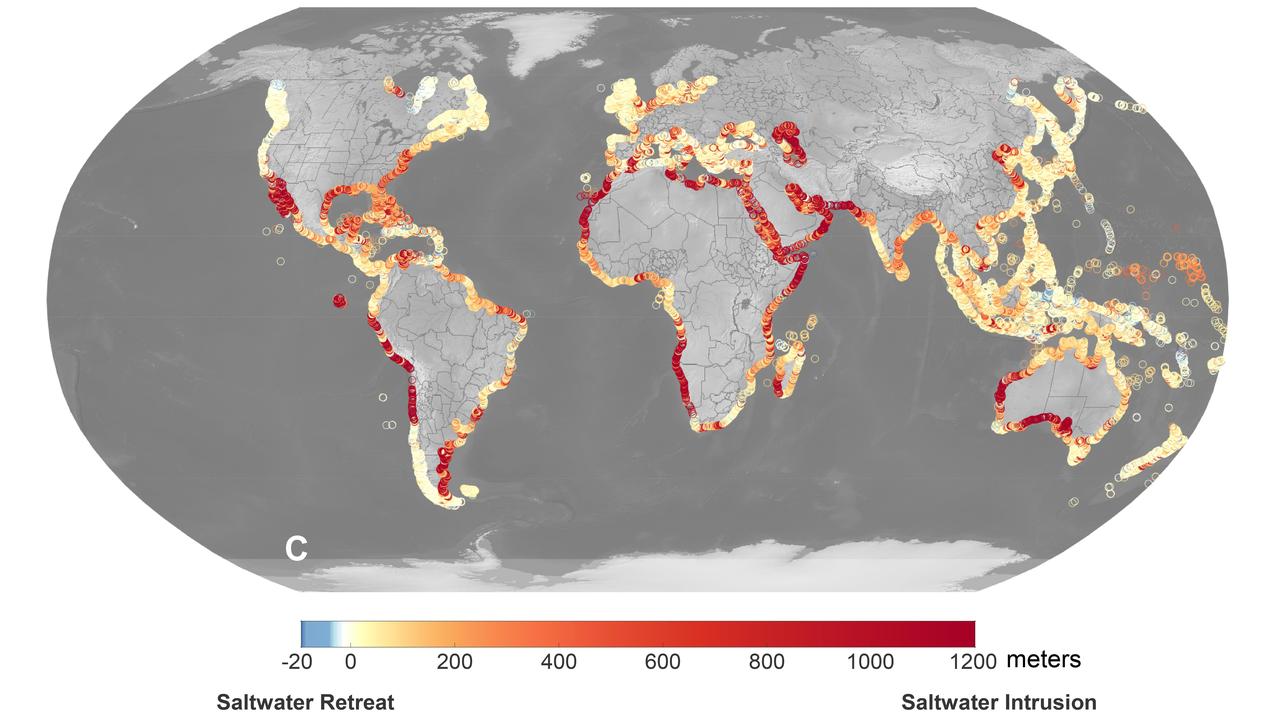
A recent study led by researchers at NASA's Jet Propulsion Laboratory in Southern California that seawater will infiltrate underground fresh water supplies in about 77% of coastal watersheds around the world by the year 2100, as illustrated in this graphic. Called saltwater intrusion, the phenomenon will result from the combined effects of sea level rise and slower replenishment of groundwater supplies due to warmer, drier regional climates, according to the study, which was funded by NASA and the U.S. Department of Defense and published in Geophysical Research Letters in November 2024. In the graphic, areas that the study projected will experience the most severe saltwater intrusion are marked with red, while the few areas that will experience the opposite phenomenon, called saltwater retreat, are marked with blue. Saltwater intrusion happens deep below coastlines, where two masses of water naturally run up against each other. Rainfall on land replenishes, or recharges, fresh water in coastal aquifers (essentially, underground rock and dirt that hold water), which tends to flow underground toward the ocean. Meanwhile, seawater, backed by the pressure of the ocean, tends to push inland. Although there's some mixing in the transition zone where the two meet, the balance of opposing forces typically keeps the water fresh on one side and salty on the other. Spurred by melting ice sheets and glaciers, sea level rise is causing coastlines to migrate inland and increasing the force pushing underground salt water landward. At the same time, slower groundwater recharge resulting from reduced rainfall and warmer weather patterns is weakening the force behind the fresh water in some areas. Saltwater intrusion can render water in coastal aquifers undrinkable and useless for irrigation. It can also harm ecosystems and damage infrastructure. https://photojournal.jpl.nasa.gov/catalog/PIA26491
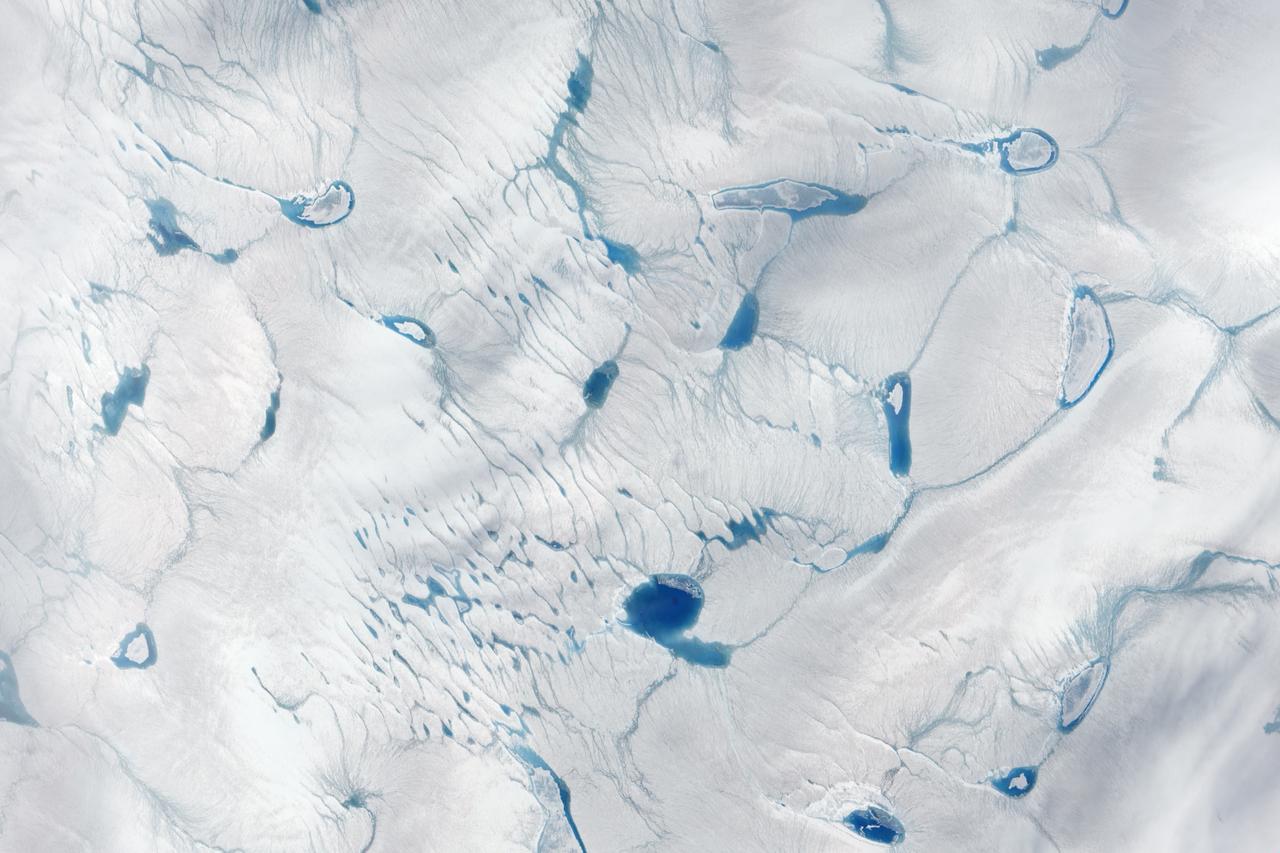
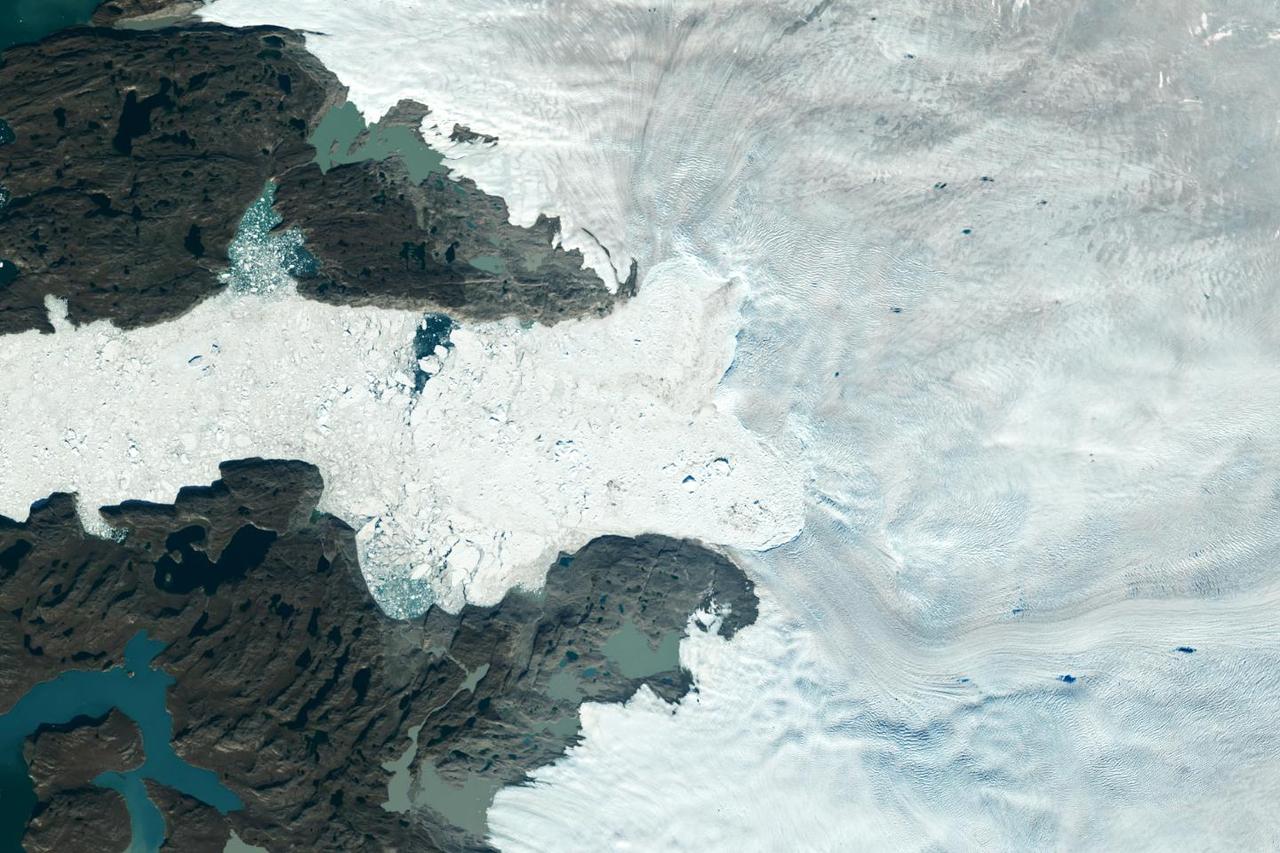
On June 15, 2016, the Advanced Land Imager (ALI) on NASA’s Earth Observing-1 satellite acquired a natural-color image of an area just inland from the coast of southwestern Greenland (120 kilometers southeast of Ilulisat and 500 kilometers north-northeast of Nuuk). According to Marco Tedesco, a professor at Columbia University’s Lamont Doherty Earth Observatory, melting in this area began relatively early in April but was not sustained. It started up again in May and grew into the watery June scene pictured above. Surface melt can directly contribute to sea level rise via runoff. It can also force its way through crevasses to the base of a glacier, temporarily speeding up ice flow and indirectly contributing to sea level rise. Also, ponding of meltwater can “darken” the ice sheet’s surface and lead to further melting. Read more: <a href="https://earthobservatory.nasa.gov/IOTD/view.php?id=88288" rel="nofollow">earthobservatory.nasa.gov/IOTD/view.php?id=88288</a> Credit: NASA Earth Observatory image by Jesse Allen, using EO-1 ALI data provided courtesy of the NASA EO-1 team <b><a href="http://www.nasa.gov/audience/formedia/features/MP_Photo_Guidelines.html" rel="nofollow">NASA image use policy.</a></b> <b><a href="http://www.nasa.gov/centers/goddard/home/index.html" rel="nofollow">NASA Goddard Space Flight Center</a></b> enables NASA’s mission through four scientific endeavors: Earth Science, Heliophysics, Solar System Exploration, and Astrophysics. Goddard plays a leading role in NASA’s accomplishments by contributing compelling scientific knowledge to advance the Agency’s mission. <b>Follow us on <a href="http://twitter.com/NASAGoddardPix" rel="nofollow">Twitter</a></b> <b>Like us on <a href="http://www.facebook.com/pages/Greenbelt-MD/NASA-Goddard/395013845897?ref=tsd" rel="nofollow">Facebook</a></b> <b>Find us on <a href="http://instagrid.me/nasagoddard/?vm=grid" rel="nofollow">Instagram</a></b>
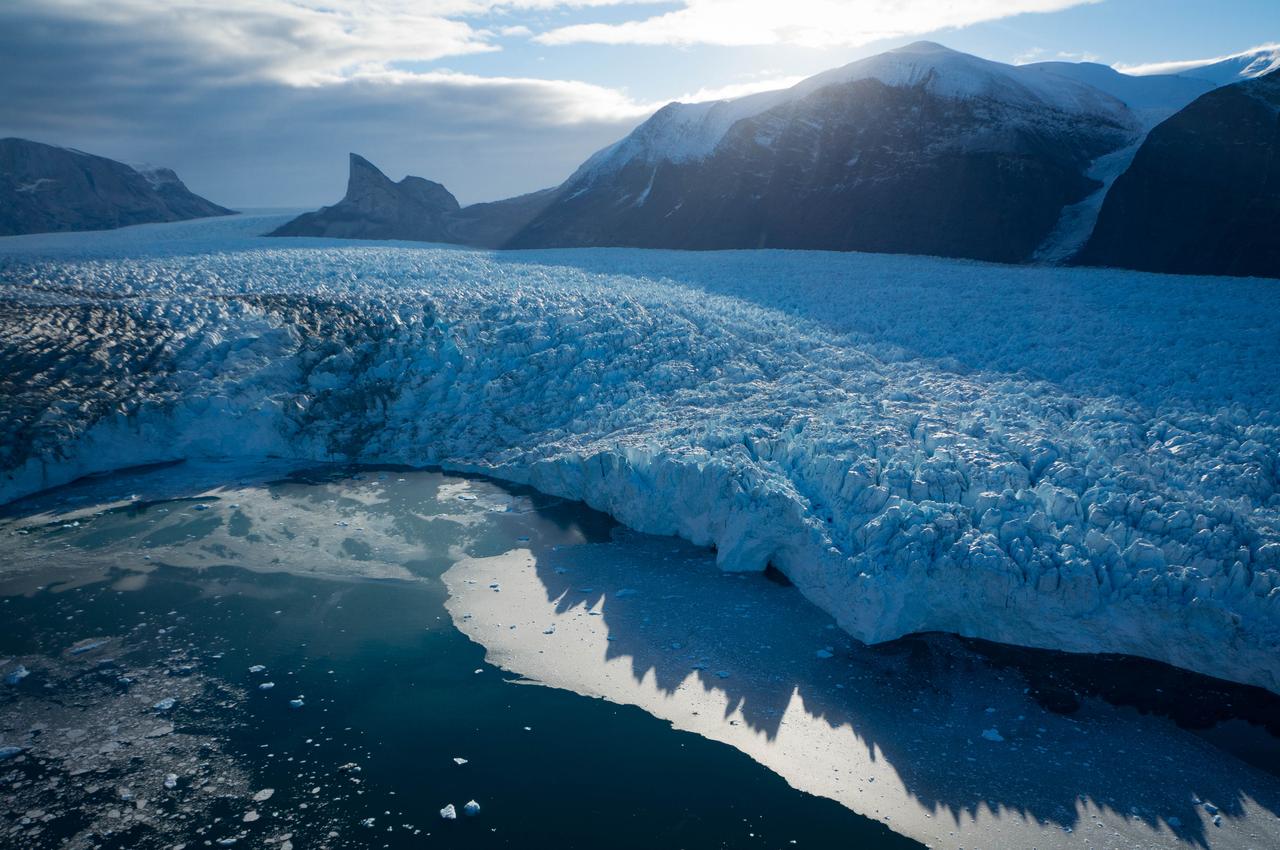
A new NASA-funded study has identified which glaciers in West Greenland are most susceptible to thinning in the coming decades by analyzing how they’re shaped. The research could help predict how much the Greenland Ice Sheet will contribute to future sea level rise in the next century, a number that currently ranges from inches to feet. “There are glaciers that popped up in our study that flew under the radar until now,” said lead author Denis Felikson, a graduate research assistant at The University of Texas Institute for Geophysics (UTIG) and a Ph.D. student in The University of Texas Department of Aerospace Engineering and Engineering Mechanics. Felikson’s study was published in Nature Geoscience on April 17. Read more: <a href="https://go.nasa.gov/2pJJwNA" rel="nofollow">go.nasa.gov/2pJJwNA</a> Caption: Terminus of Kangerlugssuup Sermerssua glacier in west Greenland Photo credit: Denis Felikson, Univ. of Texas <b><a href="http://www.nasa.gov/audience/formedia/features/MP_Photo_Guidelines.html" rel="nofollow">NASA image use policy.</a></b> <b><a href="http://www.nasa.gov/centers/goddard/home/index.html" rel="nofollow">NASA Goddard Space Flight Center</a></b> enables NASA’s mission through four scientific endeavors: Earth Science, Heliophysics, Solar System Exploration, and Astrophysics. Goddard plays a leading role in NASA’s accomplishments by contributing compelling scientific knowledge to advance the Agency’s mission. <b>Follow us on <a href="http://twitter.com/NASAGoddardPix" rel="nofollow">Twitter</a></b> <b>Like us on <a href="http://www.facebook.com/pages/Greenbelt-MD/NASA-Goddard/395013845897?ref=tsd" rel="nofollow">Facebook</a></b> <b>Find us on <a href="http://instagrid.me/nasagoddard/?vm=grid" rel="nofollow">Instagram</a></b>
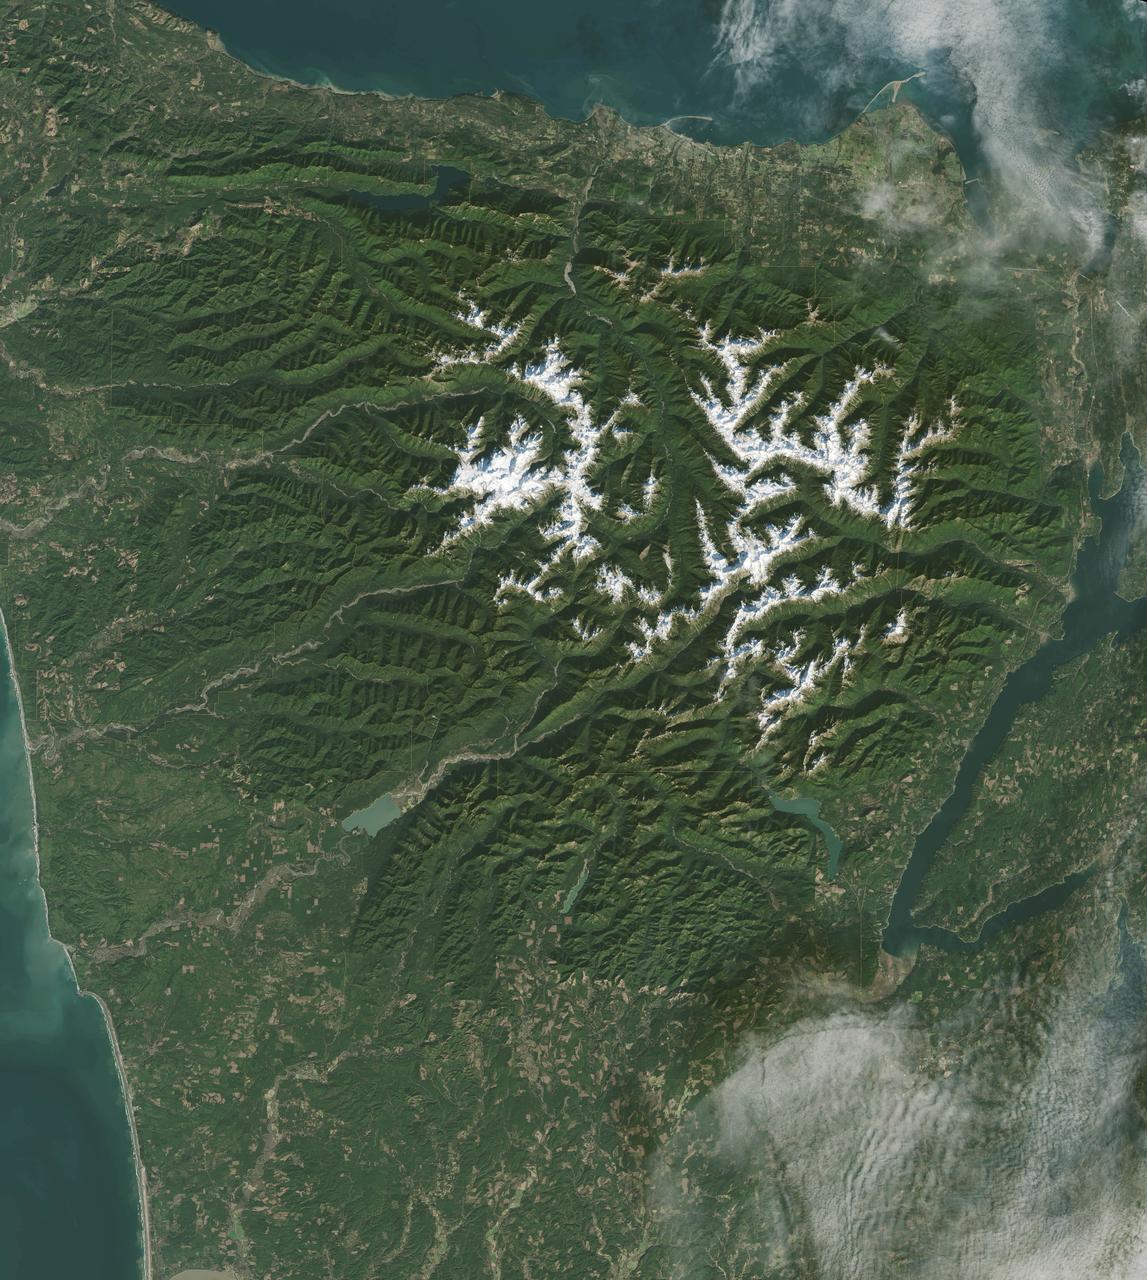
It has to be one of America’s most diverse national park landscapes. If you walked from west to east across Olympic National Park, you would start at the rocky Pacific shoreline, move into rare temperate rainforests and lush river valleys, ascend glaciers and rugged mountain peaks, and then descend into a comparatively dry rain shadow and alpine forest. From the beach to the top of Mount Olympus, you would rise 7,980 feet (2430 meters) above sea level. Situated on the Olympic Peninsula in northwestern Washington, these lands were first set aside as a national monument in 1909 by Theodore Roosevelt. Twenty-nine years later, his cousin Franklin officially established Olympic National Park. International institutions have also made a case for treasuring this land, as the area was declared an International Biosphere Reserve in 1976 and a World Heritage Site in 1981. The park encompasses nearly 923,000 acres of wild lands, including 60 named glaciers, 73 miles of coast, and 3,000 miles of rivers and streams. Read more: <a href="http://go.nasa.gov/2bRmzSJ" rel="nofollow">go.nasa.gov/2bRmzSJ</a> Credit: NASA/Landsat8 <b><a href="http://www.nasa.gov/audience/formedia/features/MP_Photo_Guidelines.html" rel="nofollow">NASA image use policy.</a></b> <b><a href="http://www.nasa.gov/centers/goddard/home/index.html" rel="nofollow">NASA Goddard Space Flight Center</a></b> enables NASA’s mission through four scientific endeavors: Earth Science, Heliophysics, Solar System Exploration, and Astrophysics. Goddard plays a leading role in NASA’s accomplishments by contributing compelling scientific knowledge to advance the Agency’s mission. <b>Follow us on <a href="http://twitter.com/NASAGoddardPix" rel="nofollow">Twitter</a></b> <b>Like us on <a href="http://www.facebook.com/pages/Greenbelt-MD/NASA-Goddard/395013845897?ref=tsd" rel="nofollow">Facebook</a></b> <b>Find us on <a href="http://instagrid.me/nasagoddard/?vm=grid" rel="nofollow">Instagram</a></b>
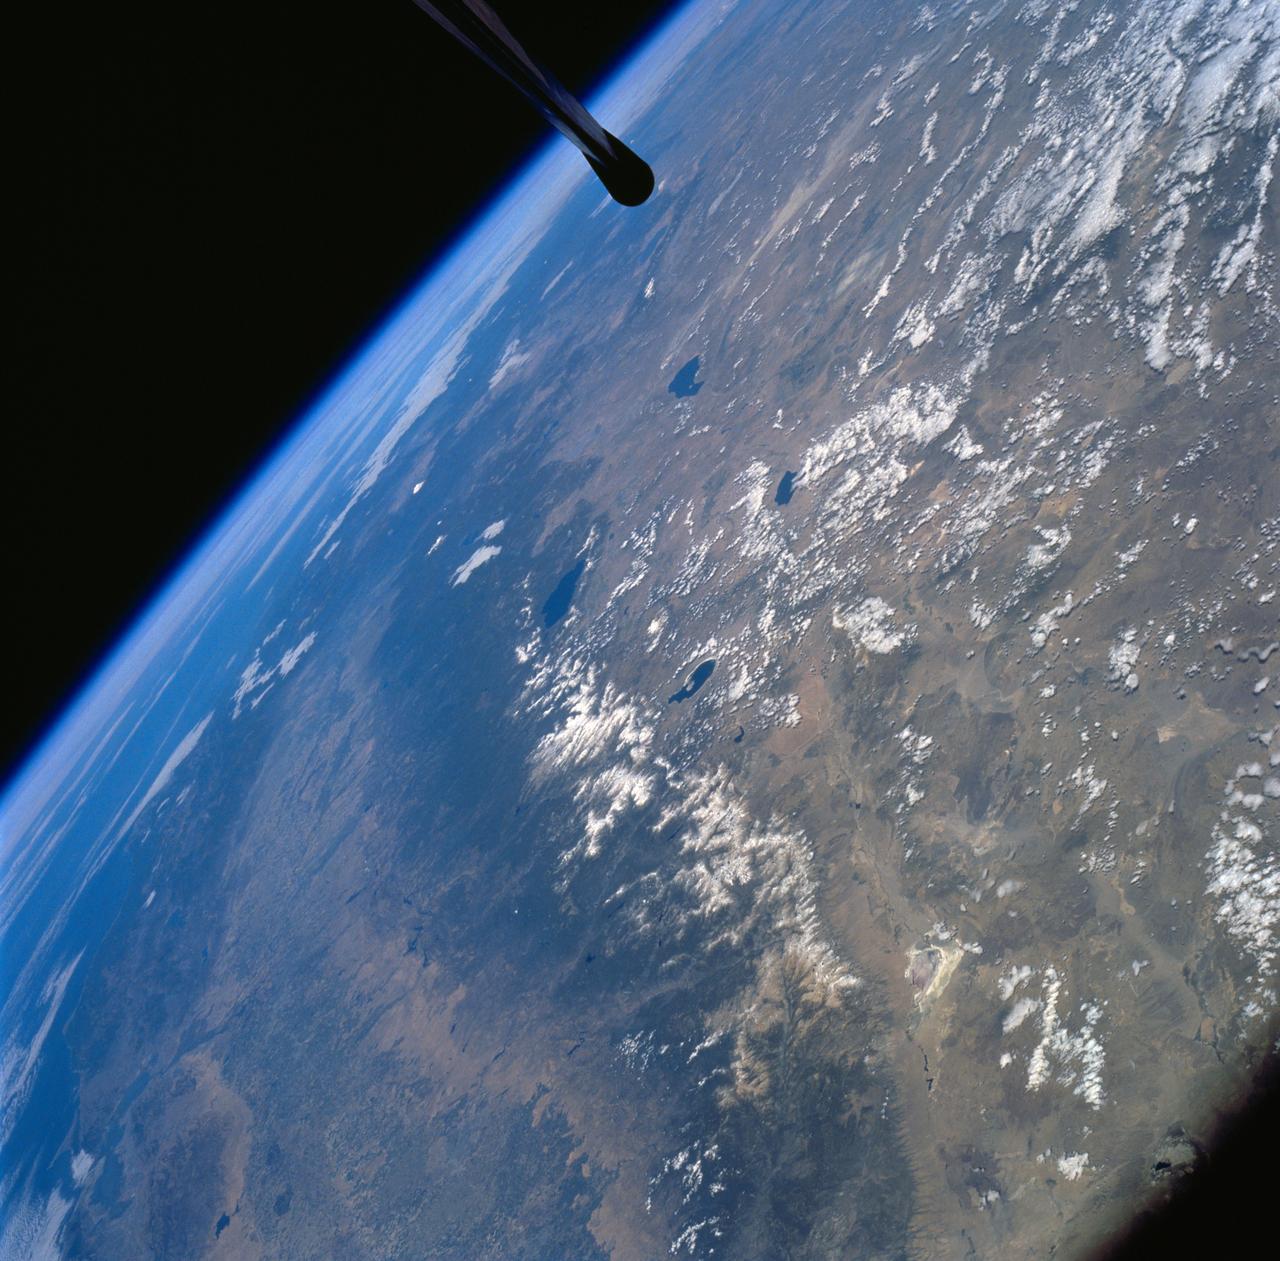
STS058-72-004 (18 Oct-1 Nov 1993) --- The Sierra Nevada Mountain Range can be seen in this north-looking high oblique view taken in October, 1993, by the STS-58 crew. Visible in the view to the west of the Sierra Nevada are the San Joaquin and Sacramento Valleys of central California. The San Francisco/Oakland Bay Area can be seen to the west of the valley at the extreme left of the photograph. To the east or right of the Sierra Nevada, the basin and Range Region of central and northern Nevada is visible. Mono Lake, Lake Tahoe and Pyramid Lake are also visible in this scene. The long northwest/southeast trending Walker Lane Shear Zone, which lies just to the east (right) of the Sierra Nevada is also visible. Near the top of the view (near the horizon), the snow covered volcanic peak Mount Shasta can be seen. Over 645 kilometers (400 miles) long and from 65 to 130 kilometers (40 to 80 miles) wide, the Sierra Nevada have many peaks in excess of 3,300 meters (11,000 feet) above sea level. A titled fault block in structure (the largest in the United States) and shaped by glaciers during the last ice age over 12,000 years ago, the Sierra Nevada eastern front rises sharply from the Great Basin of Nevada, while its western slope descends gradually to the hills bordering the Central Valley of California. Snow-fed streams supply much of the irrigation water to the Central Valley and to western Nevada and also generate hydroelectricity. Recent above normal precipitation (snowfall) of the last two years has helped in alleviating the drought conditions that had prevailed throughout most of California in the mid and late 1980's and early 1990's.