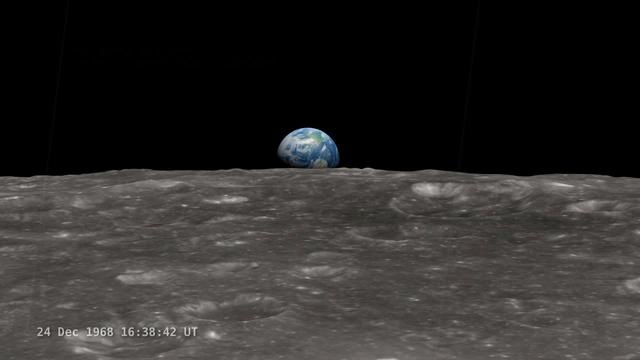
<b>Join NASA's Google+ Hangout on Friday, December 20th 2:00 - 3:00 PM (EST) at <a href="http://go.nasa.gov/18S2TbC" rel="nofollow">go.nasa.gov/18S2TbC</a> </b> It was 45 years ago, on December 24, 1968 when Apollo 8 astronauts captured 'Earthrise' – the first color photograph of Earth taken by a person in lunar orbit. NASA announces a new simulation of the events leading to the creation of 'Earthrise,' one of the iconic photographs of the 20th Century – Earth seen from the moon captured by the crew of Apollo 8. This new simulation allows anyone to virtually ride with the astronauts and experience the awe they felt at the vista in front of them. Apollo 8 Commander Frank Borman and crew members William A. Anders and James A. Lovell photographed the stunning scene as their spacecraft orbited the moon on December 24, 1968. The new computer simulation was created using data from NASA's Lunar Reconnaissance Orbiter, or LRO, spacecraft and includes details not seen in the previous visualization released last year. Participants in this Hangout include: * John Keller, project scientist for the Lunar Reconnaissance Orbiter project * Ernie Wright, project lead with the Scientific Visualization Studio at NASA Goddard Space Flight Center * Andrew Chaikin, space historian, author of the book A Man on the Moon "This will also be the first time we've released a video that's synchronized with the onboard audio recording of the astronauts,", says Ernie Wright. "The new visualization tells us not only what time the photos were taken, but also exactly which way the spacecraft was pointing and therefore which window each photo was taken from." Earthrise is the cover photo of TIME's Great Images of the 20th Century and is among photos on the cover of LIFE's 100 Photographs That Changed the World. <b><a href="http://www.nasa.gov/audience/formedia/features/MP_Photo_Guidelines.html" rel="nofollow">NASA image use policy.</a></b> <b><a href="http://www.nasa.gov/centers/goddard/home/index.html" rel="nofollow">NASA Goddard Space Flight Center</a></b> enables NASA’s mission through four scientific endeavors: Earth Science, Heliophysics, Solar System Exploration, and Astrophysics. Goddard plays a leading role in NASA’s accomplishments by contributing compelling scientific knowledge to advance the Agency’s mission. <b>Follow us on <a href="http://twitter.com/NASA_GoddardPix" rel="nofollow">Twitter</a></b> <b>Like us on <a href="http://www.facebook.com/pages/Greenbelt-MD/NASA-Goddard/395013845897?ref=tsd" rel="nofollow">Facebook</a></b> <b>Find us on <a href="http://instagram.com/nasagoddard?vm=grid" rel="nofollow">Instagram</a></b>
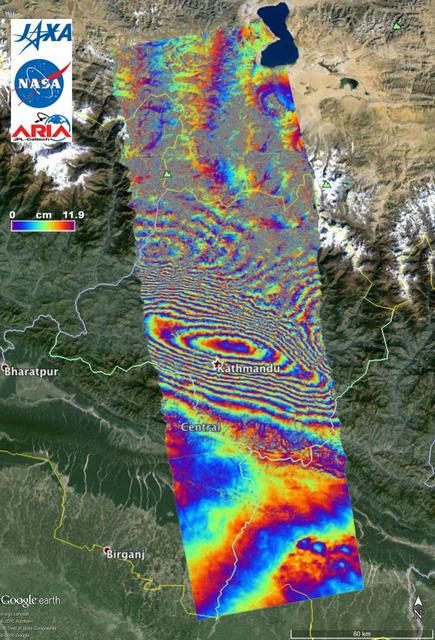
NASA and its partners are contributing important observations and expertise to the ongoing response to the April 25, 2015, magnitude 7.8 Gorkha earthquake in Nepal. The quake was the strongest to occur in that area since the 1934 Nepal-Bihar magnitude 8.0 event and caused significant regional damage and a humanitarian crisis. Scientists with the Advanced Rapid Imaging and Analysis project (ARIA), a collaboration between NASA's Jet Propulsion Laboratory, Pasadena, California, and the California Institute of Technology in Pasadena, analyzed interferometric synthetic aperture radar images from the PALSAR-2 instrument on the ALOS-2 satellite operated by the Japan Aerospace Exploration Agency (JAXA) to calculate a map of the deformation of Earth's surface caused by the quake. This false-color map shows the amount of permanent surface movement caused almost entirely by the earthquake, as viewed by the satellite, during a 70-day interval between two ALOS-2 images, acquired February 21 and May 2, 2015. In the map, surface displacements are seen as color contours (or "fringes"), where each color cycle represents 4.7 inches (11.9 centimeters) of surface motion. The contours show the land around Kathmandu has moved toward the satellite by up to 4.6 feet (1.4 meter), or 5.2 feet (1.6 meters) if we assume purely vertical motion. Areas without the color contours have snow or heavy vegetation that affects the radar measurements. Scientists use these maps to build detailed models of the fault and associated land movements to better understand the impact on future earthquake activity. The PALSAR-2 data were provided by JAXA through the Committee on Earth Observation Satellite (CEOS) in support of the response effort. The background image is from Google Earth. http://photojournal.jpl.nasa.gov/catalog/PIA19383
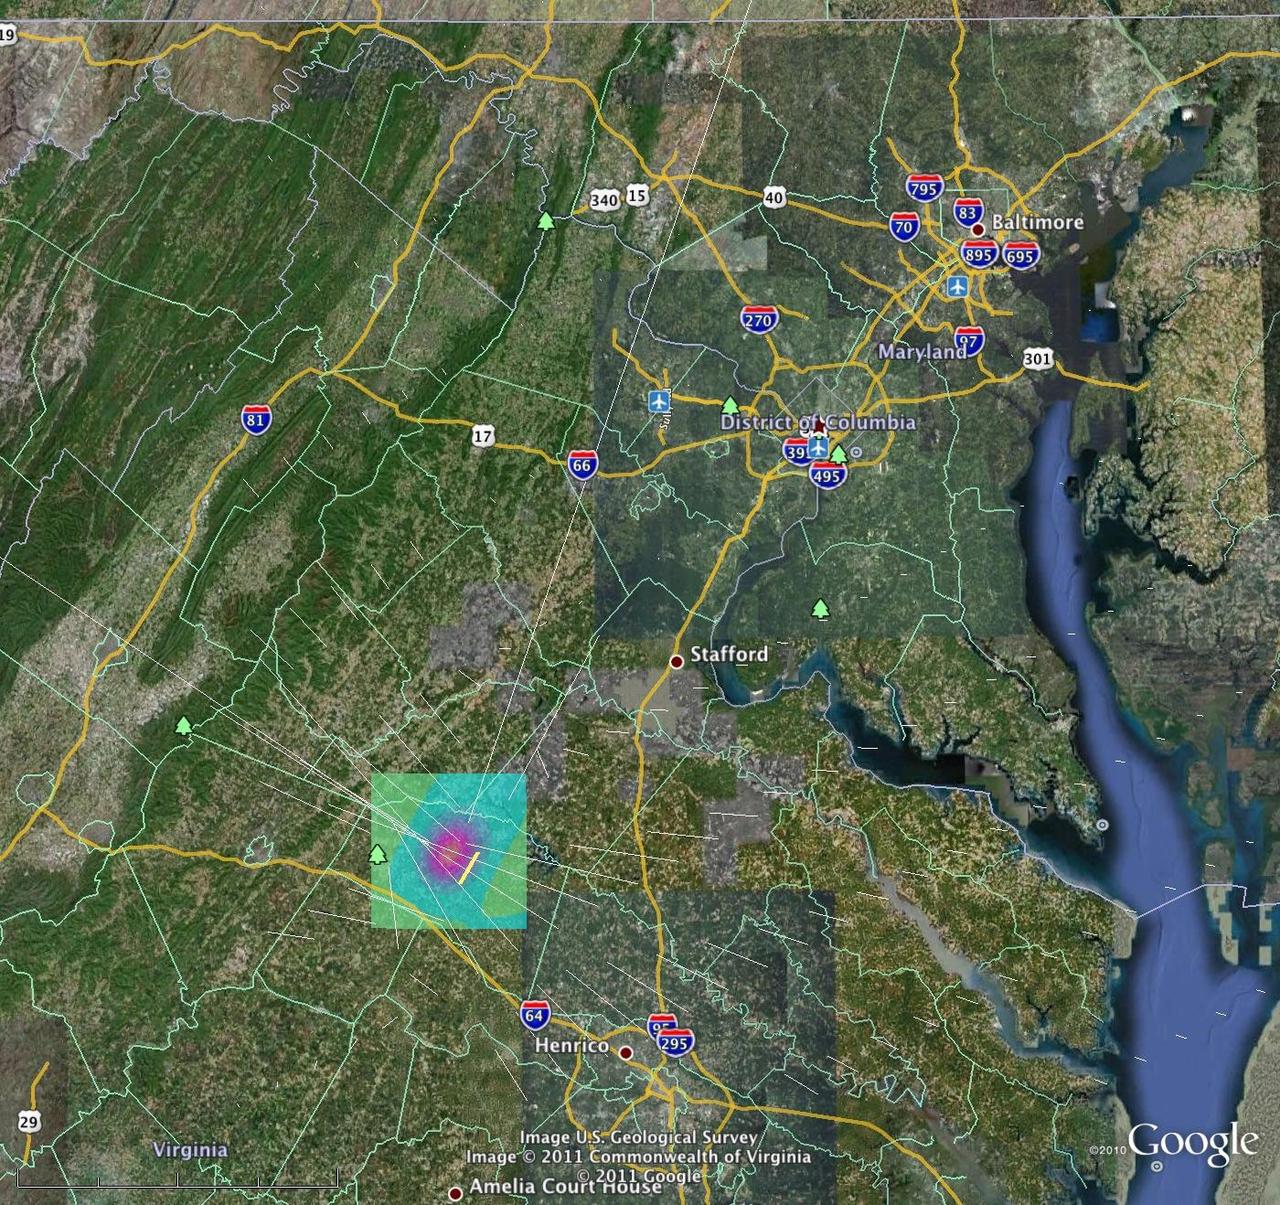
A magnitude 5.8 earthquake in Mineral, Va. was widely felt up and down the East Coast of the United States. This computer model is a QuakeSim model image overlaid on a Google Earth image.

Michael Weiss-Malik, Product Manager for Moon in Google Earth, Google, Inc., speaks during a press conference, Monday, July 20, 2009, announcing the launch of Moon in Google Earth, an immersive 3D atlas of the Moon, accessible within Google Earth 5.0, Monday, July 20, 2009, at the Newseum in Washington. Photo Credit: (NASA/Bill Ingalls)

Brian McLendon, VP of Engineering, Google, Inc., speaks during a press conference, Monday, July 20, 2009, announcing the launch of Moon in Google Earth, an immersive 3D atlas of the Moon, accessible within Google Earth 5.0, Monday, July 20, 2009, at the Newseum in Washington. Photo Credit: (NASA/Bill Ingalls)

Tiffany Montague, Technical Program Manager for NASA and Google Lunar X PRIZE, Google, Inc., speaks during a press conference, Monday, July 20, 2009, announcing the launch of Moon in Google Earth, an immersive 3D atlas of the Moon, accessible within Google Earth 5.0, Monday, July 20, 2009, at the Newseum in Washington. Photo Credit: (NASA/Bill Ingalls)
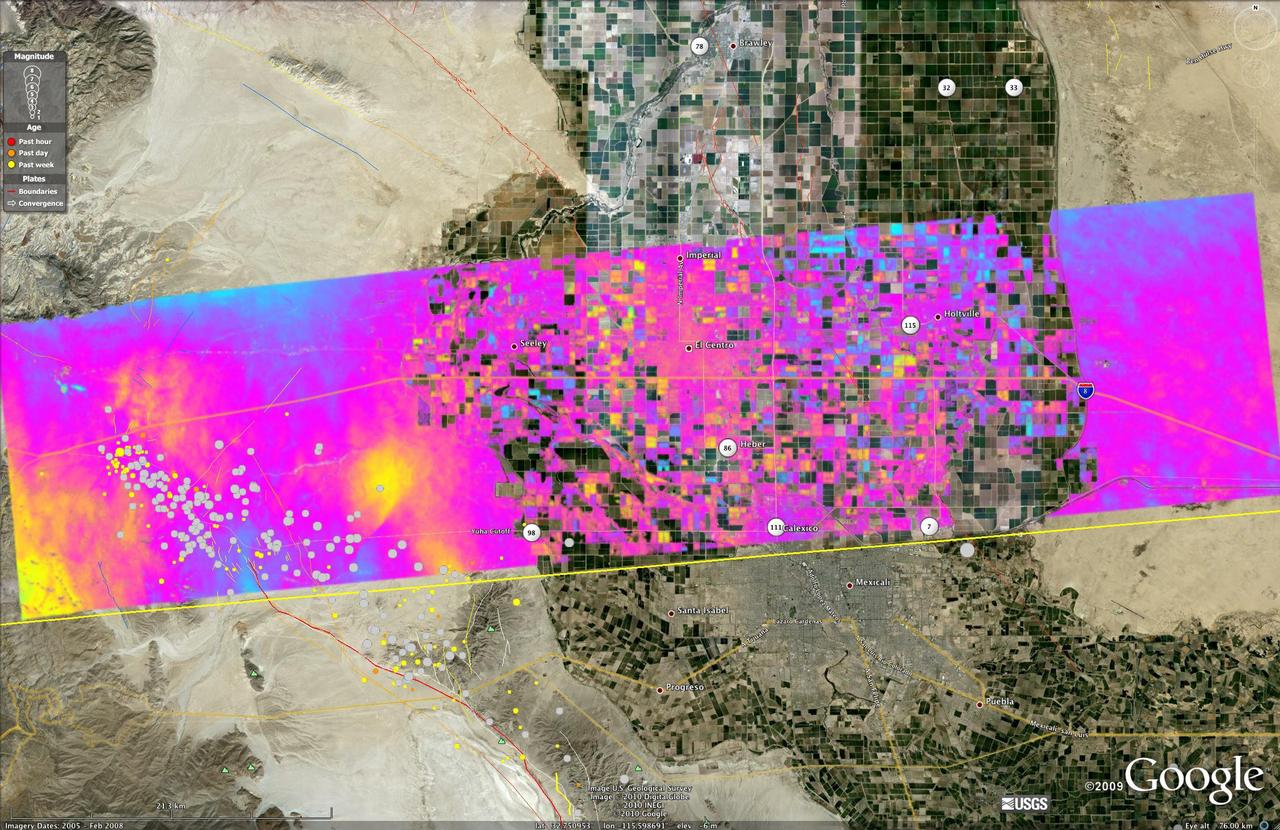
This image shows a UAVSAR interferogram swath overlaid atop a Google Earth image. New NASA airborne radar images show the continuing deformation in Earth surface resulting from the magnitude 7.2 temblor in Baja California on April 4, 2010.

Alan Eustace, Senior VP of Engineering and Research, Google, Inc., speaks during a press conference, Monday, July 20, 2009, announcing the launch of Moon in Google Earth, an immersive 3D atlas of the Moon, accessible within Google Earth 5.0, Monday, July 20, 2009, at the Newseum in Washington. Photo Credit: (NASA/Bill Ingalls)

Buzz Aldrin, the second man to walk on the moon, speaks during a press conference, Monday, July 20, 2009, announcing the launch of Moon in Google Earth, an immersive 3D atlas of the Moon, accessible within Google Earth 5.0, Monday, July 20, 2009, at the Newseum in Washington. Photo Credit: (NASA/Bill Ingalls)

Andrew Chaikin, author of "A Man on the Moon" speaks during a press conference, Monday, July 20, 2009, announcing the launch of Moon in Google Earth, an immersive 3D atlas of the Moon, accessible within Google Earth 5.0, Monday, July 20, 2009, at the Newseum in Washington. Photo Credit: (NASA/Bill Ingalls)

Andrew Chaikin, author of "A Man on the Moon" speaks during a press conference, Monday, July 20, 2009, announcing the launch of Moon in Google Earth, an immersive 3D atlas of the Moon, accessible within Google Earth 5.0, Monday, July 20, 2009, at the Newseum in Washington. Photo Credit: (NASA/Bill Ingalls)

NASA Deputy Administrator Lori Garver, speaks during a press conference, Monday, July 20, 2009, announcing the launch of Moon in Google Earth, an immersive 3D atlas of the Moon, accessible within Google Earth 5.0, Monday, July 20, 2009, at the Newseum in Washington. Photo Credit: (NASA/Bill Ingalls)

Buzz Aldrin, the second man to walk on the moon, speaks during a press conference, Monday, July 20, 2009, announcing the launch of Moon in Google Earth, an immersive 3D atlas of the Moon, accessible within Google Earth 5.0, Monday, July 20, 2009, at the Newseum in Washington. Photo Credit: (NASA/Bill Ingalls)

Yoshinori Yoshimura, a respresentative from the Japan Aerospace Exploration Agency (JAXA), speaks during a press conference, Monday, July 20, 2009, announcing the launch of Moon in Google Earth, an immersive 3D atlas of the Moon, accessible within Google Earth 5.0, Monday, July 20, 2009, at the Newseum in Washington. Photo Credit: (NASA/Bill Ingalls)

Miles O'Brien, former chief science and tech correspondent for CNN, speaks during a press conference, Monday, July 20, 2009, announcing the launch of Moon in Google Earth, an immersive 3D atlas of the Moon, accessible within Google Earth 5.0, Monday, July 20, 2009, at the Newseum in Washington. Photo Credit: (NASA/Bill Ingalls)

Miles O'Brien, former chief science and tech correspondent for CNN, speaks during a press conference, Monday, July 20, 2009, announcing the launch of Moon in Google Earth, an immersive 3D atlas of the Moon, accessible within Google Earth 5.0, Monday, July 20, 2009, at the Newseum in Washington. Photo Credit: (NASA/Bill Ingalls)

Apollo 11 astronaut Buzz Aldrin, the second man to walk on the Moon, speaks during a press conference, Monday, July 20, 2009, announcing the launch of Moon in Google Earth, an immersive 3D atlas of the Moon, accessible within Google Earth 5.0, Monday, July 20, 2009, at the Newseum in Washington. Photo Credit: (NASA/Bill Ingalls)

Apollo 11 astronaut Buzz Aldrin, the second man to walk on the Moon, speaks during a press conference, Monday, July 20, 2009, announcing the launch of Moon in Google Earth, an immersive 3D atlas of the Moon, accessible within Google Earth 5.0, Monday, July 20, 2009, at the Newseum in Washington. Photo Credit: (NASA/Bill Ingalls)

Miles O'Brien, former chief science and tech correspondent for CNN, speaks during a press conference, Monday, July 20, 2009, announcing the launch of Moon in Google Earth, an immersive 3D atlas of the Moon, accessible within Google Earth 5.0, Monday, July 20, 2009, at the Newseum in Washington. Photo Credit: (NASA/Bill Ingalls)

Sam Choi and Naiara Pinto observe Google Earth overlaid with in almost real time what the synthetic aperture radar is mapping from the C-20A aircraft. Researchers were in the sky and on the ground to take measurements of plant mass, distribution of trees, shrubs and ground cover and the diversity of plants and how much carbon is absorbed by them.
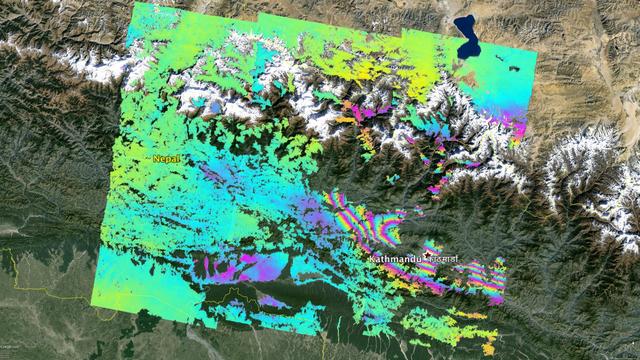
NASA and its partners are contributing important observations and expertise to the ongoing response to the April 25, 2015, magnitude 7.8 Gorkha earthquake in Nepal. The quake was the strongest to occur in that area since the 1934 Nepal-Bihar magnitude 8.0 event and caused significant regional damage and a humanitarian crisis. Scientists with the Advanced Rapid Imaging and Analysis project (ARIA), a collaboration between NASA's Jet Propulsion Laboratory, Pasadena, California, and the California Institute of Technology in Pasadena, analyzed interferometric synthetic aperture radar images from the European Union's Copernicus Sentinel-1A satellite, operated by the European Space Agency and also available from the Alaska Satellite Facility (https://www.asf.alaska.edu), to calculate a map of the deformation of Earth's surface caused by the quake. This false-color map shows the amount of permanent surface movement caused almost entirely by the earthquake, as viewed by the satellite, during a 12-day interval between two Sentinel-1 images acquired on April 17 and April 29, 2015. In the map, surface displacements are seen as color contours (or "fringes"), where each color cycle represents 8 inches (20 centimeters) of surface motion. The contours show the land around Kathmandu has moved upward by more than 40 inches (1 meter). Areas without the color contours have snow or heavy vegetation that affects the radar measurements. Scientists use these maps to build detailed models of the fault and associated land movements to better understand the impact on future earthquake activity. The background image is from Google Earth. The map contains Copernicus data (2015). http://photojournal.jpl.nasa.gov/catalog/PIA19535

NASA Deputy Administrator Lori Garver participates in a live "We The Geeks" Google+ Hangout hosted by the White House to talk about asteroids, Friday, May 31, 2013 at NASA Headquarters in Washington. An asteroid nearly three kilometers wide will pass by the Earth today at 3.6 million miles away. Garver is joined in the conversation by Bill Nye, Executive Director, Planetary Society; Ed Lu, former astronaut and CEO, B612 Foundation; Peter Diamandis, Co-Founder and Co-Chairman, Planetary Resources and Jose Luis Galache, Astronomer at the International Astronomical Unions's Minor Planet Center. Photo Credit: (NASA/Carla Cioffi)
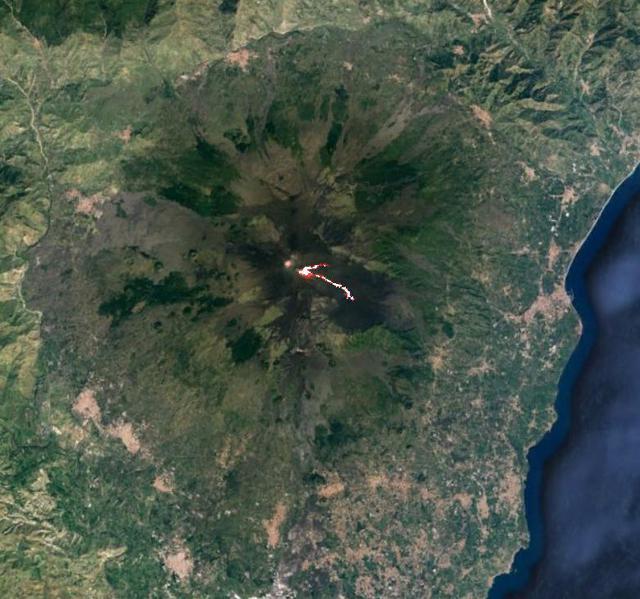
Mt. Etna, Italy erupted Tuesday, February 16, 2021, sending rivers of lava down the southeast flank of the volcano, and spewing ashes and volcanic stones over nearby villages. Sicily's Catania Airport was temporarily closed due to an ash plume that rose to 3700 m altitude. The ASTER nighttime thermal infrared data shows the extent of the active lava flows, draped over an older Google Earth image. The image was acquired February 17, 2021, covers an area of 38 by 39 km, and is located at 37.8 degrees north, 15 degrees east. https://photojournal.jpl.nasa.gov/catalog/PIA24417

NASA Deputy Administrator Lori Garver participates in a live "We The Geeks" Google+ Hangout hosted by the White House to talk about asteroids, Friday, May 31, 2013 at NASA Headquarters in Washington. An asteroid nearly three kilometers wide will pass by the Earth today at 3.6 million miles away. Garver is joined in the conversation by Bill Nye, Executive Director, Planetary Society; Ed Lu, former astronaut and CEO, B612 Foundation; Peter Diamandis, Co-Founder and Co-Chairman, Planetary Resources and Jose Luis Galache, Astronomer at the International Astronomical Unions's Minor Planet Center. Photo Credit: (NASA/Carla Cioffi)
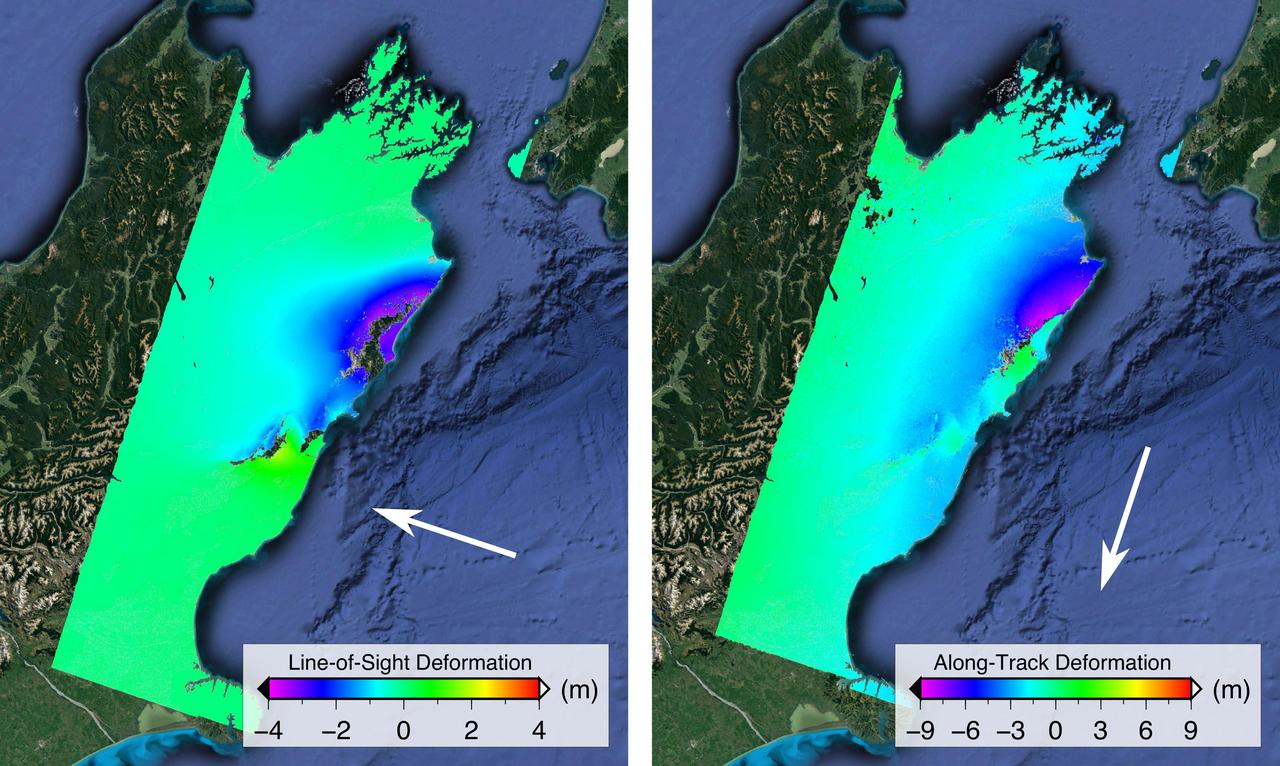
NASA and its partners are contributing important observations and expertise to the ongoing response to the Nov. 14, 2016, magnitude 7.8 Kaikoura earthquake in New Zealand. This shallow earthquake was so complex and unusual, it is likely to change how scientists think about earthquake hazards in plate boundary zones around the world. Scientists with the Advanced Rapid Imaging and Analysis project (ARIA), a collaboration between NASA's Jet Propulsion Laboratory, Pasadena, California, and Caltech in Pasadena, analyzed interferometric synthetic aperture radar images from the PALSAR-2 instrument on the ALOS-2 satellite operated by the Japan Aerospace Exploration Agency (JAXA) to calculate maps of the deformation of Earth's surface caused by the quake. Two maps show motion of the surface in two different directions. Each false-color map shows the amount of permanent surface movement caused almost entirely by the earthquake, as viewed by the satellite, during a 28-day interval between two ALOS-2 wide-swath images acquired on Oct. 18 and Nov. 15, 2016. In these two new maps made from the wide-swath images, the colors of the surface displacements are proportional to the surface motion. The wide-swath images cover the entire 106-mile (170-kilometer) length of the complex set of earthquake ruptures. The arrows show the direction of the radar motion measurement. In the left image, the blue and purple tones show the areas where the land around the Kaikoura peninsula in the Marlborough region of New Zealand's South Island has moved toward the satellite by up to 13.2 feet (4 meters), both eastward and upward. In the right image, the blue and purple tones show the areas that moved to the north by up to 30 feet (9 meters) and green tones show the area that moved to the south. The sharp line of color change is across the Kekerengu Fault, which had the largest amount of motion in the earthquake. Field studies found maximum rupture at the surface was measured at 39 feet (12 meters) of horizontal displacement. Several other faults have sharp color changes due to smaller amounts of motion, with a total of at least 12 faults rupturing in this single large earthquake. Areas without color have snow, heavy vegetation or open water that prevents the radar measurements from being coherent between satellite images – a required condition to measure ground displacement. Scientists use these maps to build detailed models of the fault slip at depth and associated land movements to better understand the impact on future earthquake activity. The PALSAR-2 data were provided by JAXA through the Committee on Earth Observation Satellites (CEOS) and through scientific research projects. The background image is from Google Earth. http://photojournal.jpl.nasa.gov/catalog/PIA21210
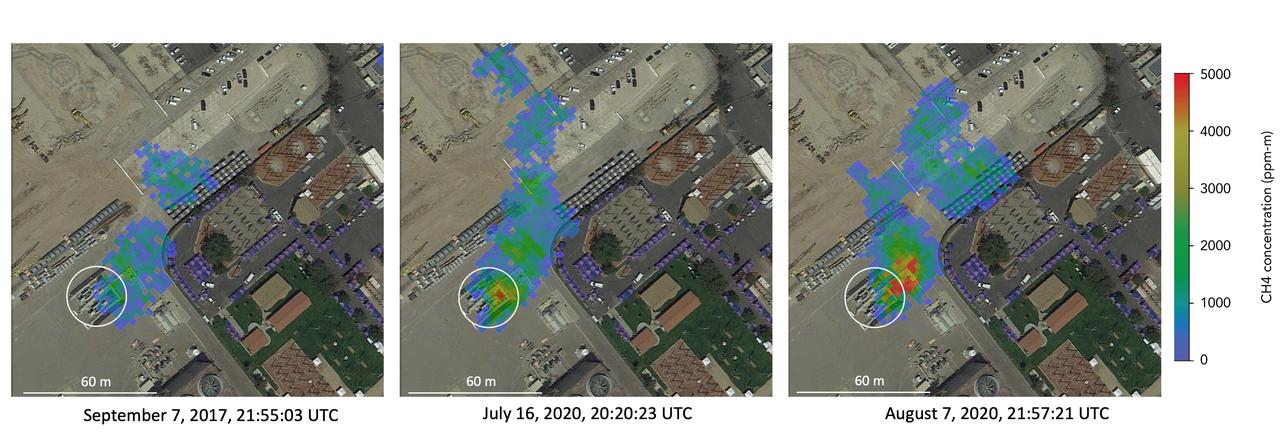
Atmospheric methane is a potent greenhouse gas and an important contributor to air quality. Future instruments on orbiting satellites can help improve our understanding of important methane emission sources. NASA conducts periodic methane studies using the next-generation Airborne Visible/Infrared Imaging Spectrometer (AVIRIS-NG) instrument. These studies are determining the locations and magnitudes of the largest methane emission sources across California, including those associated with landfills, refineries, dairies, wastewater treatment plants, oil and gas fields, power plants, and natural gas infrastructure. These three images show concentrations of methane in a natural gas plume relative to background air measured by AVIRIS-NG, overlaid on true-color land surface images (source: Google Earth). The aircraft was flying at an altitude of about 10,000 feet (3,000 meters) above ground level and the AVIRIS-NG image pixels are each about 10 feet (3 meters) across. The plume shape varies with changing emission rate, wind speed and direction. The methane plume originates from a compressor — circled in each image — at Valley Generating Station, a natural gas-fired power plant near Los Angeles. The color scale indicates the concentration of methane in each pixel relative to background methane concentrations in the surrounding atmosphere. The plume was initially detected by a single overflight in September 2017 but assumed at the time to be due to normal operations (intermittent venting). The plume was detected by AVIRIS-NG again on six flights in July-August 2020. https://photojournal.jpl.nasa.gov/catalog/PIA24019

Our solar system now is tied for most number of planets around a single star, with the recent discovery of an eighth planet circling Kepler-90, a Sun-like star 2,545 light years from Earth. The planet was discovered in data from NASA's Kepler Space Telescope. The newly-discovered Kepler-90i -- a sizzling hot, rocky planet that orbits its star once every 14.4 days -- was found using machine learning from Google. Machine learning is an approach to artificial intelligence in which computers "learn." In this case, computers learned to identify planets by finding in Kepler data instances where the telescope recorded changes in starlight caused by planets beyond our solar system, known as exoplanets. https://photojournal.jpl.nasa.gov/catalog/PIA22192
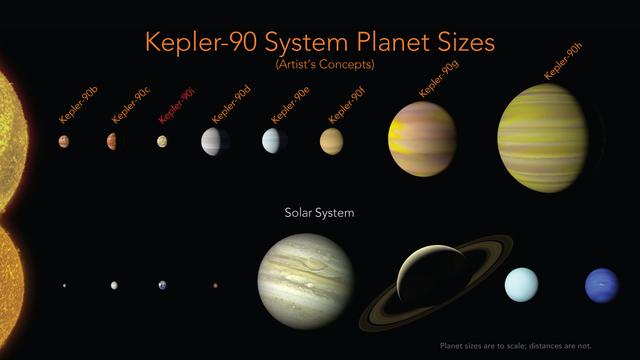
Our solar system now is tied for most number of planets around a single star, with the recent discovery of an eighth planet circling Kepler-90, a Sun-like star 2,545 light years from Earth. The planet was discovered in data from NASA's Kepler Space Telescope. This artist's concept depicts the Kepler-90 system compared with our own solar system. The newly-discovered Kepler-90i -- a sizzling hot, rocky planet that orbits its star once every 14.4 days -- was found using machine learning from Google. Machine learning is an approach to artificial intelligence in which computers "learn." In this case, computers learned to identify planets by finding in Kepler data instances where the telescope recorded changes in starlight caused by planets beyond our solar system, known as exoplanets. https://photojournal.jpl.nasa.gov/catalog/PIA22193
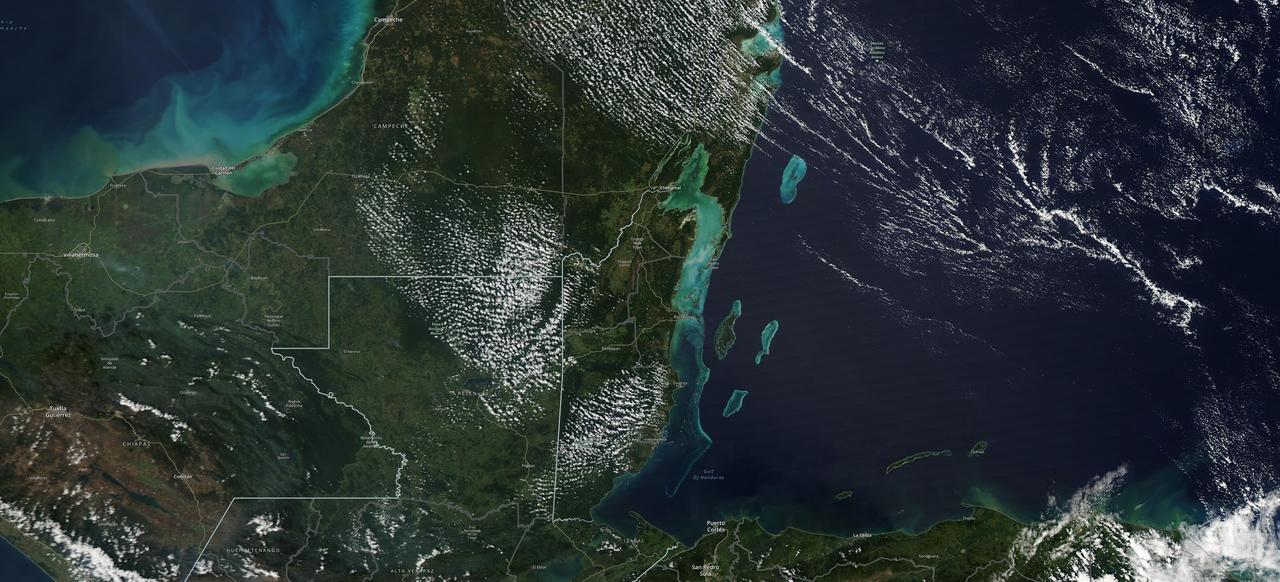
The Moderate Resolution Imaging Spectroradiometer (MODIS) instrument aboard NASA's Aqua satellite captured this image of the Yucatán Peninsula on Feb. 3, 2022. At the center is Belize, a country whose Caribbean coast is home to the Belize Barrier Reef Reserve System, which encompasses a vibrant network of marine environments that supports thousands of animal and plant species and drives Belize's largest industry, tourism. The barrier reef system is among about 1,200 UNESCO World Heritage sites around the world. In a paper published in November 2022 in Frontiers in Remote Sensing, researchers used data from Aqua MODIS to rank 24 protected marine areas off the Belizean coast based on the risks coral face from murky water and rising temperatures. The research also outlined how researchers at NASA's Jet Propulsion Laboratory in Southern California and counterparts in Belize used free, cloud-based data on Google Earth Engine in their analysis. Analyzing imagery from 2002 to 2022, researchers developed a coral vulnerability index – a score between 2 and 12 that characterizes the risk to coral, with higher scores signifying greater risk. Their findings could help management authorities protect the reefs from human impacts such as development, overfishing, pollution, and climate change. https://photojournal.jpl.nasa.gov/catalog/PIA25861
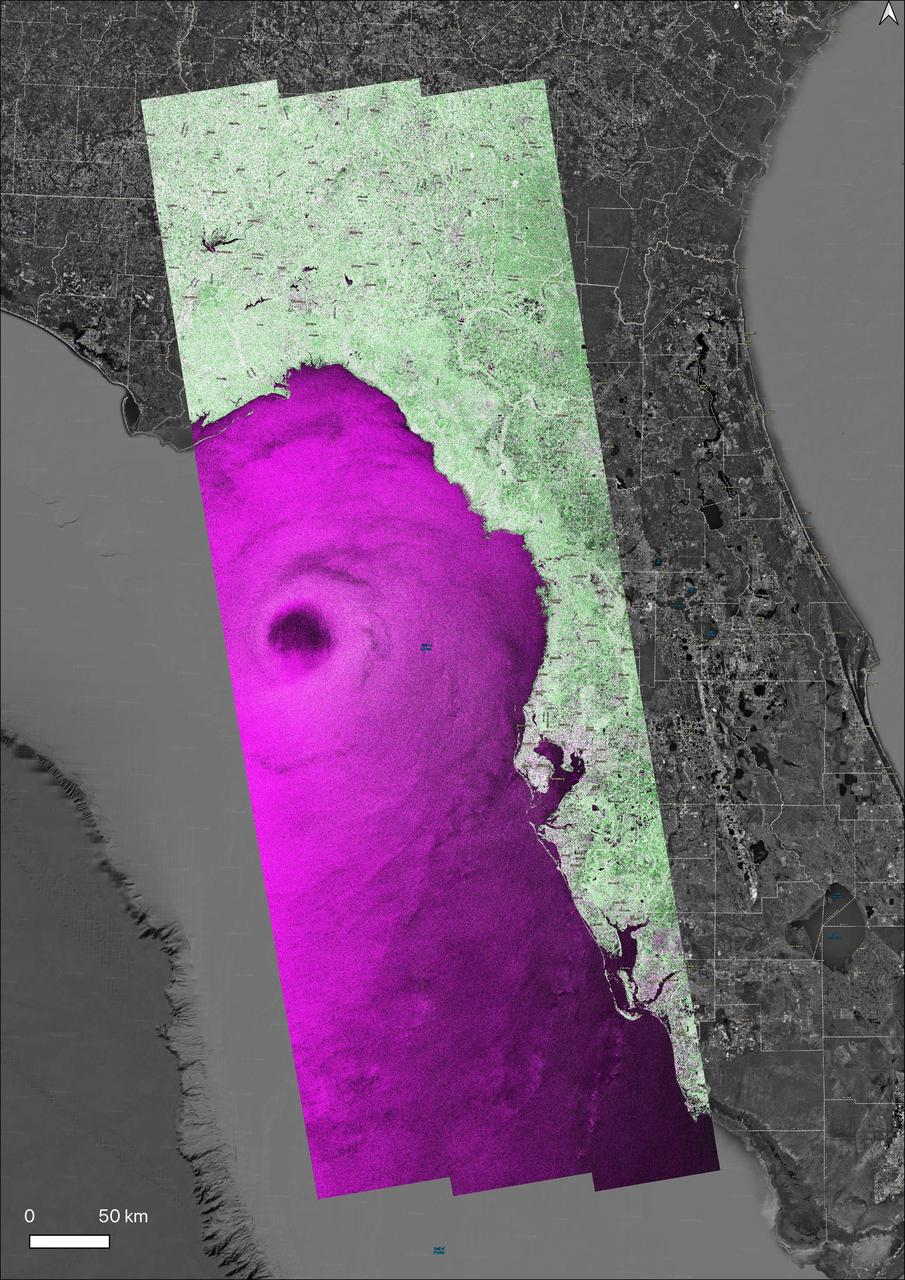
NASA's Observational Products for End-Users from Remote Sensing Analysis (OPERA) project generated a radar image of Hurricane Helene on Friday, Sept. 26, 2024, at 7:38 p.m. local time, as the storm approached the Florida coast. One of the largest storms to develop in the Gulf of Mexico in the last century, Helene made landfall as a Category 4 hurricane in the Big Bend area of Florida at about 11:10 p.m. The data shown in the image is from the synthetic aperture radar (SAR) instrument on the Copernicus Sentinel-1A satellite, operated by the European Space Agency (ESA), and processed by OPERA into a data product called OPERA RTC-S1. The OPERA RTC-S1 image was converted to a false color image. In this color scale, vegetated areas appear green, urban areas appear white/pink, calm water appears black, and rough water appears purple or magenta. The eye of the hurricane can be clearly seen as a large dark patch in the Gulf of Mexico. The OPERA RTC-S1 image was superimposed on a Google Earth satellite background shown in grayscale and the ESRI Boundaries Places layer. https://photojournal.jpl.nasa.gov/catalog/PIA26414
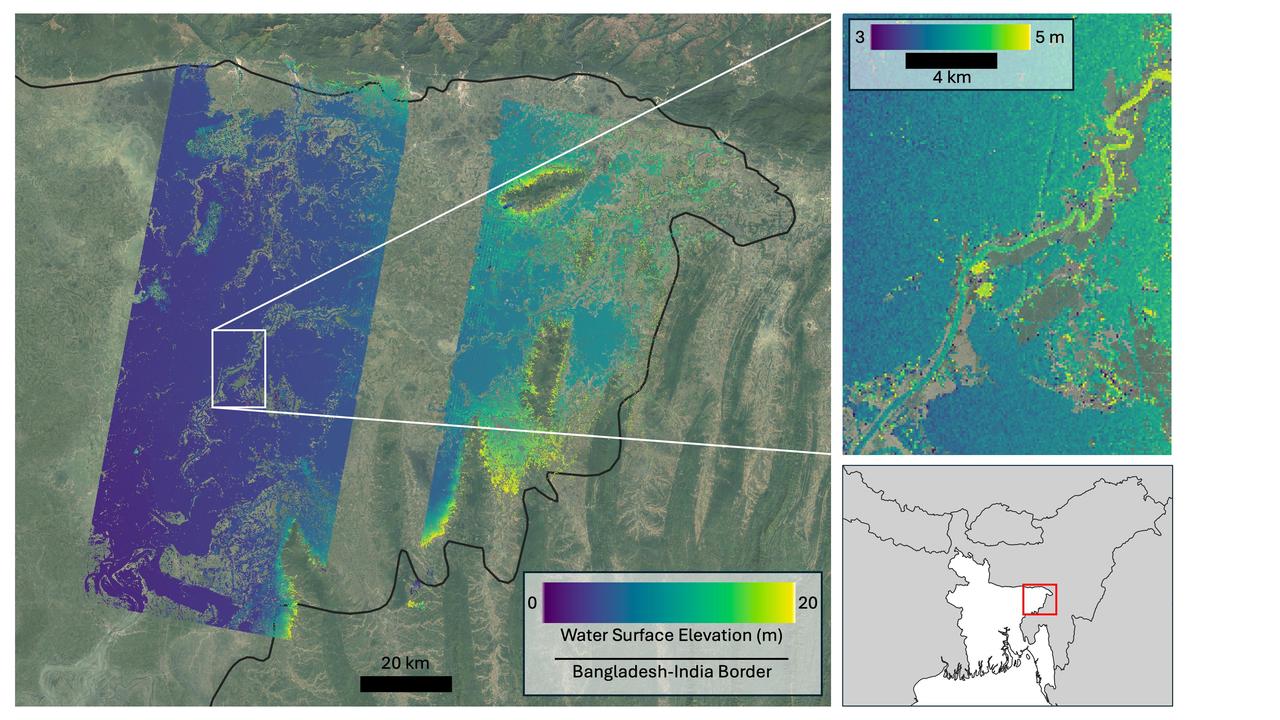
Flooding from monsoon rains covers a wide region of northeast Bangladesh near the India border in this Oct. 8, 2023, image showing data from the U.S.-French Surface Water and Ocean Topography (SWOT) satellite. Around that time, heavy monsoon rains affected various parts of Bangladesh, including the region depicted here, home to Sylhet, the country's fifth-largest city (population approximately 700,000). Sylhet and surrounding areas experienced substantial flooding. The SWOT data, overlaid on a standard Google Earth image, shows the precise surface elevation of the floodwaters. The vast majority of the land area within the region imaged by SWOT is flooded. In the main image at left, dark blue indicates waters just above sea level, while yellow represents 65 feet (20 meters) above sea level. The inset at top right zooms in on a section of the Kalni River, a tributary of one of Bangladesh's three major rivers, the Meghna. The main channel of the Kalni is about 650 feet (200 meters) wide. In the inset at top right, dark blue indicates water about 10 feet (3 meters) above sea level and yellow is used for waters about 16 feet (5 meters) above sea level. The zoomed-in data can be used to determine the slope of the river, which tells hydrologists how fast water flows through it and off a landscape. The water surface elevations depicted are higher in the top right of the inset than they are in the bottom left. The data also shows the elevation of the river is generally greater than that of water in the floodplain around it, telling hydrologists that water is likely flowing from the river into the floodplain. Each pixel in the image represents an area that is about 330 feet by 330 feet (100 meters by 100 meters). The image shows data from SWOT's Ka-band Radar Interferometer (KaRIn) instrument antennas, which don't cover a 12-mile-wide (20-kilometer-wide) strip right underneath the satellite. For that gap, a separate instrument collects water surface elevation data that isn't shown here. Bangladesh is a low-lying, generally flat country that chronically suffers from two types of flooding. Monsoon rains cause rivers that flow into Bangladesh from neighboring countries, especially India, to flood. And flash flooding occurs during the pre-monsoon season and can damage agricultural crops if not forecast with sufficient warning. While the use of satellite altimetry and precipitation in models has shown some promise for flood forecasting in Bangladesh, forecasting both types of flooding with sufficient lead time has remained challenging due to a lack of timely, high-spatial-resolution information on water elevation. SWOT is the first satellite to provide this information over entire regions, enabling improved forecasts and filling the data gap when places like Bangladesh become inundated. The Bangladesh Water Development Board, which is in charge of national flood forecasting and management, is now exploring how to incorporate SWOT water elevation information into its flood inundation forecasting system. Since shortly after launch in December 2022, SWOT has been measuring the height of nearly all water on Earth's surface, developing one of the most detailed, comprehensive views yet of the planet's oceans and freshwater lakes and rivers. The mission science team makes measurements using the KaRIn instrument. With two antennas spread 33 feet (10 meters) apart on a boom, KaRIn produces a pair of data swaths as it circles the globe, bouncing radar pulses off water surfaces to collect surface-height information. https://photojournal.jpl.nasa.gov/catalog/PIA26343
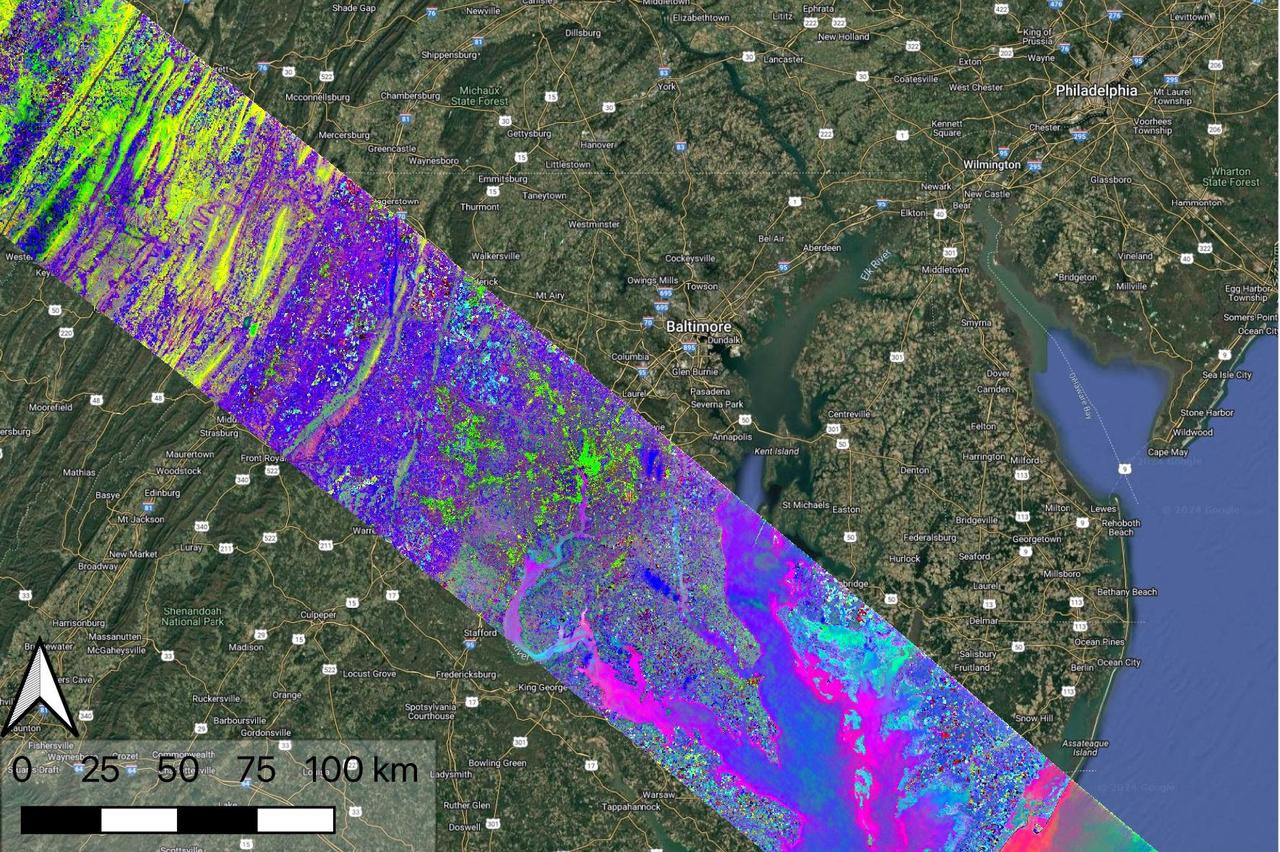
Data collected by NASA's Earth Surface Mineral Dust Source Investigation (EMIT) on April 23, 2024, indicates the location of a variety of planet communites across a swath of the mid-Atlantic United States. Overlain on a Google base map, each color represents a different type of natural biome or agricultural land. Hyperspectral data such as this is being analyzed in a range of NASA-funded research projects looking at the distribution and traits of plant communities, including agricultural crops. EMIT, installed on the International Space Station in 2022, was originally tasked with mapping minerals over Earth's desert regions to help determine the cooling and heating effects that dust can have on regional and global climate. Since early 2024 the instrument has been on an extended mission in which its data is being used in research on a diverse range of topics including agricultural practices, snow hydrology, wildflower blooming, phytoplankton and carbon dynamics in inland waters, ecosystem biodiversity, and functional traits of forests. Imaging spectrometers like EMIT detect the light reflected from Earth and then separate visible and infrared light into hundreds of wavelength bands. Scientists use patterns of reflection and absorption at different wavelengths to determine the composition of whatever the instrument is observing. EMIT is laying the groundwork for NASA's future Surface Biology and Geology-Visible Shortwave Infrared satellite mission. SBG-VSWIR will cover Earth's land and coasts more frequently than EMIT, with finer spatial resolution. https://photojournal.jpl.nasa.gov/catalog/PIA26418
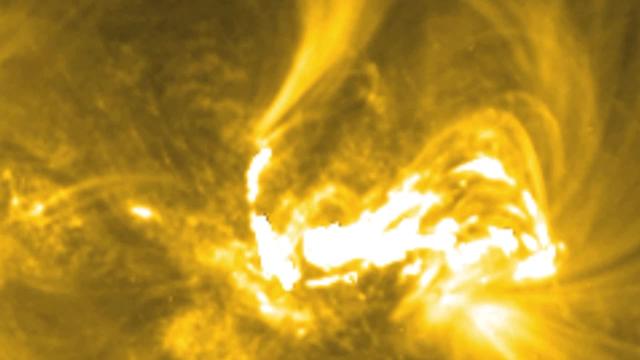
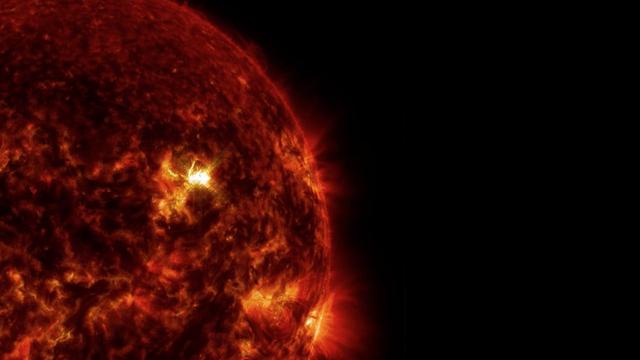
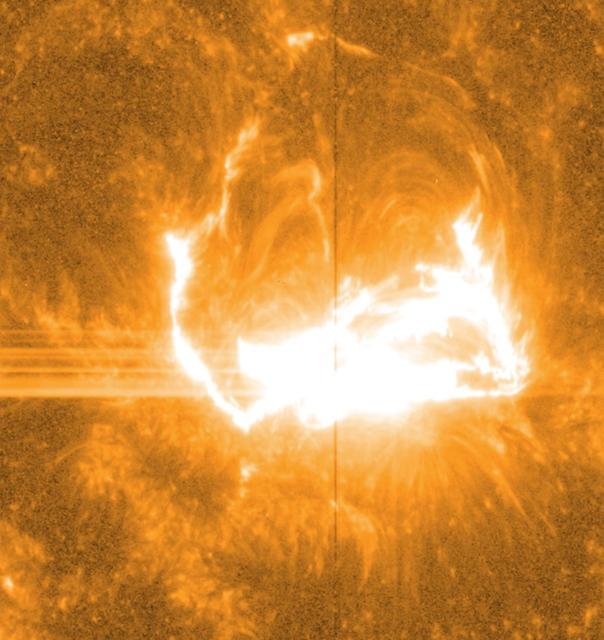
On March 29, 2014 the sun released an X-class flare. It was observed by NASA's Interface Region Imaging Spectrograph, or IRIS; NASA's Solar Dynamics Observatory, or SDO; NASA's Reuven Ramaty High Energy Solar Spectroscopic Imager, or RHESSI; the Japanese Aerospace Exploration Agency's Hinode; and the National Solar Observatory's Dunn Solar Telescope located at Sacramento Peak in New Mexico. To have a record of such an intense flare from so many observatories is unprecedented. Such research can help scientists better understand what catalyst sets off these large explosions on the sun. Perhaps we may even some day be able to predict their onset and forewarn of the radio blackouts solar flares can cause near Earth - blackouts that can interfere with airplane, ship and military communications. Read more: <a href="http://1.usa.gov/1kMDQbO" rel="nofollow">1.usa.gov/1kMDQbO</a> Join our Google+ Hangout on May 8 at 2:30pm EST: <a href="http://go.nasa.gov/1mwbBEZ" rel="nofollow">go.nasa.gov/1mwbBEZ</a> Credit: NASA Goddard <b><a href="http://www.nasa.gov/audience/formedia/features/MP_Photo_Guidelines.html" rel="nofollow">NASA image use policy.</a></b> <b><a href="http://www.nasa.gov/centers/goddard/home/index.html" rel="nofollow">NASA Goddard Space Flight Center</a></b> enables NASA’s mission through four scientific endeavors: Earth Science, Heliophysics, Solar System Exploration, and Astrophysics. Goddard plays a leading role in NASA’s accomplishments by contributing compelling scientific knowledge to advance the Agency’s mission. <b>Follow us on <a href="http://twitter.com/NASAGoddardPix" rel="nofollow">Twitter</a></b> <b>Like us on <a href="http://www.facebook.com/pages/Greenbelt-MD/NASA-Goddard/395013845897?ref=tsd" rel="nofollow">Facebook</a></b> <b>Find us on <a href="http://instagram.com/nasagoddard?vm=grid" rel="nofollow">Instagram</a></b>
A combination of many (but not all) of the datasets which observed this flare. -- On March 29, 2014 the sun released an X-class flare. It was observed by NASA's Interface Region Imaging Spectrograph, or IRIS; NASA's Solar Dynamics Observatory, or SDO; NASA's Reuven Ramaty High Energy Solar Spectroscopic Imager, or RHESSI; the Japanese Aerospace Exploration Agency's Hinode; and the National Solar Observatory's Dunn Solar Telescope located at Sacramento Peak in New Mexico. To have a record of such an intense flare from so many observatories is unprecedented. Such research can help scientists better understand what catalyst sets off these large explosions on the sun. Perhaps we may even some day be able to predict their onset and forewarn of the radio blackouts solar flares can cause near Earth - blackouts that can interfere with airplane, ship and military communications. Read more: <a href="http://1.usa.gov/1kMDQbO" rel="nofollow">1.usa.gov/1kMDQbO</a> Join our Google+ Hangout on May 8 at 2:30pm EST: <a href="http://go.nasa.gov/1mwbBEZ" rel="nofollow">go.nasa.gov/1mwbBEZ</a> Credit: NASA Goddard <b><a href="http://www.nasa.gov/audience/formedia/features/MP_Photo_Guidelines.html" rel="nofollow">NASA image use policy.</a></b> <b><a href="http://www.nasa.gov/centers/goddard/home/index.html" rel="nofollow">NASA Goddard Space Flight Center</a></b> enables NASA’s mission through four scientific endeavors: Earth Science, Heliophysics, Solar System Exploration, and Astrophysics. Goddard plays a leading role in NASA’s accomplishments by contributing compelling scientific knowledge to advance the Agency’s mission. <b>Follow us on <a href="http://twitter.com/NASAGoddardPix" rel="nofollow">Twitter</a></b> <b>Like us on <a href="http://www.facebook.com/pages/Greenbelt-MD/NASA-Goddard/395013845897?ref=tsd" rel="nofollow">Facebook</a></b> <b>Find us on <a href="http://instagram.com/nasagoddard?vm=grid" rel="nofollow">Instagram</a></b>
On March 29, 2014 the sun released an X-class flare. It was observed by NASA's Interface Region Imaging Spectrograph, or IRIS; NASA's Solar Dynamics Observatory, or SDO; NASA's Reuven Ramaty High Energy Solar Spectroscopic Imager, or RHESSI; the Japanese Aerospace Exploration Agency's Hinode; and the National Solar Observatory's Dunn Solar Telescope located at Sacramento Peak in New Mexico. To have a record of such an intense flare from so many observatories is unprecedented. Such research can help scientists better understand what catalyst sets off these large explosions on the sun. Perhaps we may even some day be able to predict their onset and forewarn of the radio blackouts solar flares can cause near Earth - blackouts that can interfere with airplane, ship and military communications. Read more: <a href="http://1.usa.gov/1kMDQbO" rel="nofollow">1.usa.gov/1kMDQbO</a> Join our Google+ Hangout on May 8 at 2:30pm EST: <a href="http://go.nasa.gov/1mwbBEZ" rel="nofollow">go.nasa.gov/1mwbBEZ</a> Credit: NASA Goddard <b><a href="http://www.nasa.gov/audience/formedia/features/MP_Photo_Guidelines.html" rel="nofollow">NASA image use policy.</a></b> <b><a href="http://www.nasa.gov/centers/goddard/home/index.html" rel="nofollow">NASA Goddard Space Flight Center</a></b> enables NASA’s mission through four scientific endeavors: Earth Science, Heliophysics, Solar System Exploration, and Astrophysics. Goddard plays a leading role in NASA’s accomplishments by contributing compelling scientific knowledge to advance the Agency’s mission. <b>Follow us on <a href="http://twitter.com/NASAGoddardPix" rel="nofollow">Twitter</a></b> <b>Like us on <a href="http://www.facebook.com/pages/Greenbelt-MD/NASA-Goddard/395013845897?ref=tsd" rel="nofollow">Facebook</a></b> <b>Find us on <a href="http://instagram.com/nasagoddard?vm=grid" rel="nofollow">Instagram</a></b>
Zoom in on the flare in ultraviolet (SDO/AIA), X-rays (Hinode) and gamma-rays (RHESSI) -- On March 29, 2014 the sun released an X-class flare. It was observed by NASA's Interface Region Imaging Spectrograph, or IRIS; NASA's Solar Dynamics Observatory, or SDO; NASA's Reuven Ramaty High Energy Solar Spectroscopic Imager, or RHESSI; the Japanese Aerospace Exploration Agency's Hinode; and the National Solar Observatory's Dunn Solar Telescope located at Sacramento Peak in New Mexico. To have a record of such an intense flare from so many observatories is unprecedented. Such research can help scientists better understand what catalyst sets off these large explosions on the sun. Perhaps we may even some day be able to predict their onset and forewarn of the radio blackouts solar flares can cause near Earth - blackouts that can interfere with airplane, ship and military communications. Read more: <a href="http://1.usa.gov/1kMDQbO" rel="nofollow">1.usa.gov/1kMDQbO</a> Join our Google+ Hangout on May 8 at 2:30pm EST: <a href="http://go.nasa.gov/1mwbBEZ" rel="nofollow">go.nasa.gov/1mwbBEZ</a> Credit: NASA Goddard <b><a href="http://www.nasa.gov/audience/formedia/features/MP_Photo_Guidelines.html" rel="nofollow">NASA image use policy.</a></b> <b><a href="http://www.nasa.gov/centers/goddard/home/index.html" rel="nofollow">NASA Goddard Space Flight Center</a></b> enables NASA’s mission through four scientific endeavors: Earth Science, Heliophysics, Solar System Exploration, and Astrophysics. Goddard plays a leading role in NASA’s accomplishments by contributing compelling scientific knowledge to advance the Agency’s mission. <b>Follow us on <a href="http://twitter.com/NASAGoddardPix" rel="nofollow">Twitter</a></b> <b>Like us on <a href="http://www.facebook.com/pages/Greenbelt-MD/NASA-Goddard/395013845897?ref=tsd" rel="nofollow">Facebook</a></b> <b>Find us on <a href="http://instagram.com/nasagoddard?vm=grid" rel="nofollow">Instagram</a></b>

With its sensor pod under its left wing, NASA's remotely piloted Ikhana unmanned aircraft cruises over California during the Western States Fire Mission.

With its thermal-infared sensor pod under its left wing, NASA's Ikhana unmanned aircraft cruises over California during the Western States Fire Mission.

NASA's Ikhana remotely piloted aircraft soars over smoky terrain during a wildfire imaging demonstration mission in the late summer of 2007.

Carrying its sensor pod, NASA's remotely piloted Ikhana unmanned aircraft banks away during a checkout flight in the Western States Fire Mission.
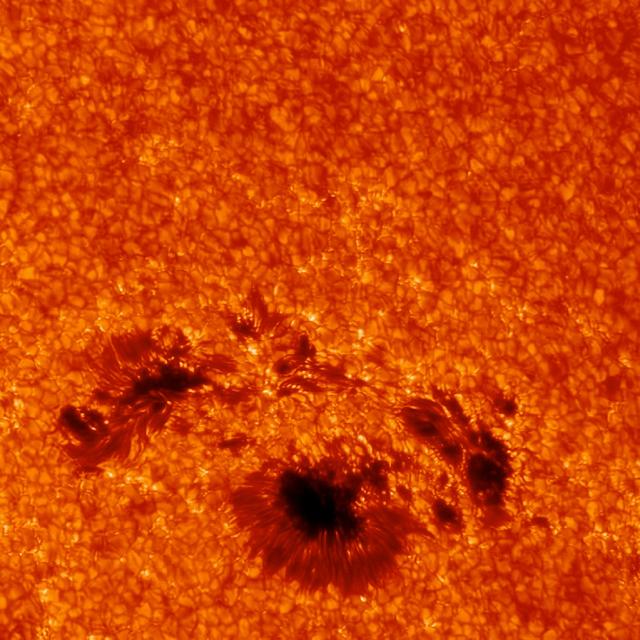
This close-up of the sunspot underneath the March 29, 2014, flare shows incredible detail. The image was captured by the G-band camera at Sacramento Peak in New Mexico. This instrument can focus on only a small area at once, but provide very high resolution. Ground-based telescope data can be hindered by Earth's atmosphere, which blocks much of the sun's ultraviolet and X-ray light, and causes twinkling even in the light it does allow through. As it happens, the March 29 flare occurred at a time of day in New Mexico that often results in the best viewing times from the ground. Credit: Kevin Reardon (National Solar Observatory), Lucia Kleint (BAER Institute) -- On March 29, 2014 the sun released an X-class flare. It was observed by NASA's Interface Region Imaging Spectrograph, or IRIS; NASA's Solar Dynamics Observatory, or SDO; NASA's Reuven Ramaty High Energy Solar Spectroscopic Imager, or RHESSI; the Japanese Aerospace Exploration Agency's Hinode; and the National Solar Observatory's Dunn Solar Telescope located at Sacramento Peak in New Mexico. To have a record of such an intense flare from so many observatories is unprecedented. Such research can help scientists better understand what catalyst sets off these large explosions on the sun. Perhaps we may even some day be able to predict their onset and forewarn of the radio blackouts solar flares can cause near Earth - blackouts that can interfere with airplane, ship and military communications. Read more: <a href="http://1.usa.gov/1kMDQbO" rel="nofollow">1.usa.gov/1kMDQbO</a> Join our Google+ Hangout on May 8 at 2:30pm EST: <a href="http://go.nasa.gov/1mwbBEZ" rel="nofollow">go.nasa.gov/1mwbBEZ</a> Credit: NASA Goddard <b><a href="http://www.nasa.gov/audience/formedia/features/MP_Photo_Guidelines.html" rel="nofollow">NASA image use policy.</a></b> <b><a href="http://www.nasa.gov/centers/goddard/home/index.html" rel="nofollow">NASA Goddard Space Flight Center</a></b> enables NASA’s mission through four scientific endeavors: Earth Science, Heliophysics, Solar System Exploration, and Astrophysics. Goddard plays a leading role in NASA’s accomplishments by contributing compelling scientific knowledge to advance the Agency’s mission. <b>Follow us on <a href="http://twitter.com/NASAGoddardPix" rel="nofollow">Twitter</a></b> <b>Like us on <a href="http://www.facebook.com/pages/Greenbelt-MD/NASA-Goddard/395013845897?ref=tsd" rel="nofollow">Facebook</a></b> <b>Find us on <a href="http://instagram.com/nasagoddard?vm=grid" rel="nofollow">Instagram</a></b>
The March 29, 2014, X-class flare appears as a bright light on the upper right in this image from SDO, showing light in the 304 Angstrom wavelength. This wavelength shows material on the sun in what's called the transition region, where the chromosphere transitions into the upper solar atmosphere, the corona. Some light of the flare is clearly visible, but the flare appears brighter in other images that show hotter temperature material. Credit: NASA/SDO/AIA -- On March 29, 2014 the sun released an X-class flare. It was observed by NASA's Interface Region Imaging Spectrograph, or IRIS; NASA's Solar Dynamics Observatory, or SDO; NASA's Reuven Ramaty High Energy Solar Spectroscopic Imager, or RHESSI; the Japanese Aerospace Exploration Agency's Hinode; and the National Solar Observatory's Dunn Solar Telescope located at Sacramento Peak in New Mexico. To have a record of such an intense flare from so many observatories is unprecedented. Such research can help scientists better understand what catalyst sets off these large explosions on the sun. Perhaps we may even some day be able to predict their onset and forewarn of the radio blackouts solar flares can cause near Earth - blackouts that can interfere with airplane, ship and military communications. Read more: <a href="http://1.usa.gov/1kMDQbO" rel="nofollow">1.usa.gov/1kMDQbO</a> Join our Google+ Hangout on May 8 at 2:30pm EST: <a href="http://go.nasa.gov/1mwbBEZ" rel="nofollow">go.nasa.gov/1mwbBEZ</a> <b><a href="http://www.nasa.gov/audience/formedia/features/MP_Photo_Guidelines.html" rel="nofollow">NASA image use policy.</a></b> <b><a href="http://www.nasa.gov/centers/goddard/home/index.html" rel="nofollow">NASA Goddard Space Flight Center</a></b> enables NASA’s mission through four scientific endeavors: Earth Science, Heliophysics, Solar System Exploration, and Astrophysics. Goddard plays a leading role in NASA’s accomplishments by contributing compelling scientific knowledge to advance the Agency’s mission. <b>Follow us on <a href="http://twitter.com/NASAGoddardPix" rel="nofollow">Twitter</a></b> <b>Like us on <a href="http://www.facebook.com/pages/Greenbelt-MD/NASA-Goddard/395013845897?ref=tsd" rel="nofollow">Facebook</a></b> <b>Find us on <a href="http://instagram.com/nasagoddard?vm=grid" rel="nofollow">Instagram</a></b>
Like almost all solar observatories, NASA's IRIS can provide images of different layers of the sun's atmosphere, which together create a whole picture of what's happening. This image shows light at a wavelength of 1400 Angstrom, which highlights material some 650 miles above the sun's surface. The vertical line in the middle shows the slit for IRIS's spectrograph, which can separate light into its many wavelengths to provide even more information about the temperature and velocity of material during a flare. Credit: NASA/IRIS/Goddard Space Flight Center -- On March 29, 2014 the sun released an X-class flare. It was observed by NASA's Interface Region Imaging Spectrograph, or IRIS; NASA's Solar Dynamics Observatory, or SDO; NASA's Reuven Ramaty High Energy Solar Spectroscopic Imager, or RHESSI; the Japanese Aerospace Exploration Agency's Hinode; and the National Solar Observatory's Dunn Solar Telescope located at Sacramento Peak in New Mexico. To have a record of such an intense flare from so many observatories is unprecedented. Such research can help scientists better understand what catalyst sets off these large explosions on the sun. Perhaps we may even some day be able to predict their onset and forewarn of the radio blackouts solar flares can cause near Earth - blackouts that can interfere with airplane, ship and military communications. Read more: <a href="http://1.usa.gov/1kMDQbO" rel="nofollow">1.usa.gov/1kMDQbO</a> Join our Google+ Hangout on May 8 at 2:30pm EST: <a href="http://go.nasa.gov/1mwbBEZ" rel="nofollow">go.nasa.gov/1mwbBEZ</a> Credit: NASA Goddard <b><a href="http://www.nasa.gov/audience/formedia/features/MP_Photo_Guidelines.html" rel="nofollow">NASA image use policy.</a></b> <b><a href="http://www.nasa.gov/centers/goddard/home/index.html" rel="nofollow">NASA Goddard Space Flight Center</a></b> enables NASA’s mission through four scientific endeavors: Earth Science, Heliophysics, Solar System Exploration, and Astrophysics. Goddard plays a leading role in NASA’s accomplishments by contributing compelling scientific knowledge to advance the Agency’s mission. <b>Follow us on <a href="http://twitter.com/NASAGoddardPix" rel="nofollow">Twitter</a></b> <b>Like us on <a href="http://www.facebook.com/pages/Greenbelt-MD/NASA-Goddard/395013845897?ref=tsd" rel="nofollow">Facebook</a></b> <b>Find us on <a href="http://instagram.com/nasagoddard?vm=grid" rel="nofollow">Instagram</a></b>
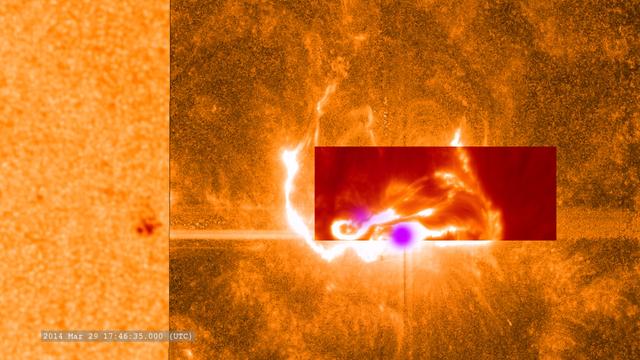
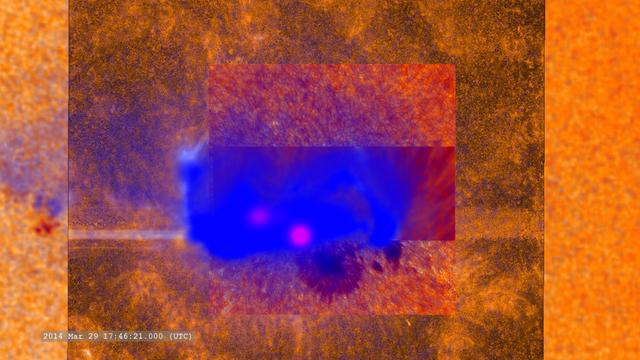
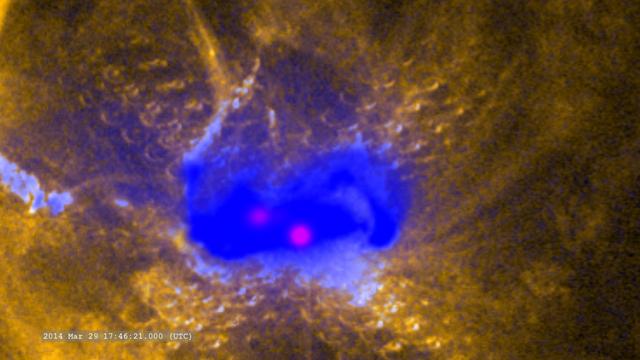
This combined image shows the March 29, 2014, X-class flare as seen through the eyes of different observatories. SDO is on the bottom/left, which helps show the position of the flare on the sun. The darker orange square is IRIS data. The red rectangular inset is from Sacramento Peak. The violet spots show the flare's footpoints from RHESSI. -- On March 29, 2014 the sun released an X-class flare. It was observed by NASA's Interface Region Imaging Spectrograph, or IRIS; NASA's Solar Dynamics Observatory, or SDO; NASA's Reuven Ramaty High Energy Solar Spectroscopic Imager, or RHESSI; the Japanese Aerospace Exploration Agency's Hinode; and the National Solar Observatory's Dunn Solar Telescope located at Sacramento Peak in New Mexico. To have a record of such an intense flare from so many observatories is unprecedented. Such research can help scientists better understand what catalyst sets off these large explosions on the sun. Perhaps we may even some day be able to predict their onset and forewarn of the radio blackouts solar flares can cause near Earth - blackouts that can interfere with airplane, ship and military communications. Read more: <a href="http://1.usa.gov/1kMDQbO" rel="nofollow">1.usa.gov/1kMDQbO</a> Join our Google+ Hangout on May 8 at 2:30pm EST: <a href="http://go.nasa.gov/1mwbBEZ" rel="nofollow">go.nasa.gov/1mwbBEZ</a> Credit: NASA Goddard <b><a href="http://www.nasa.gov/audience/formedia/features/MP_Photo_Guidelines.html" rel="nofollow">NASA image use policy.</a></b> <b><a href="http://www.nasa.gov/centers/goddard/home/index.html" rel="nofollow">NASA Goddard Space Flight Center</a></b> enables NASA’s mission through four scientific endeavors: Earth Science, Heliophysics, Solar System Exploration, and Astrophysics. Goddard plays a leading role in NASA’s accomplishments by contributing compelling scientific knowledge to advance the Agency’s mission. <b>Follow us on <a href="http://twitter.com/NASAGoddardPix" rel="nofollow">Twitter</a></b> <b>Like us on <a href="http://www.facebook.com/pages/Greenbelt-MD/NASA-Goddard/395013845897?ref=tsd" rel="nofollow">Facebook</a></b> <b>Find us on <a href="http://instagram.com/nasagoddard?vm=grid" rel="nofollow">Instagram</a></b>
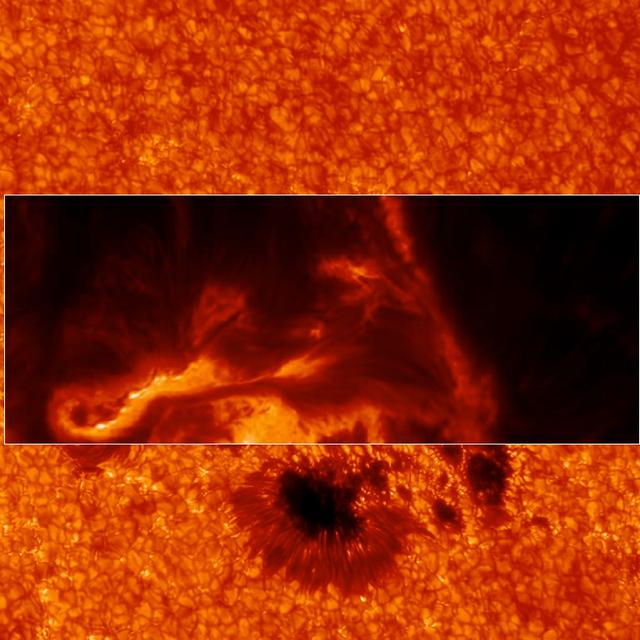
IBIS can focus in on different wavelengths of light, and so reveal different layers at different heights in the sun's lower atmosphere, the chromosphere. This image shows a region slightly higher than the former one. Credit: Lucia Kleint (BAER Institute), Paul Higgins (Trinity College Dublin, Ireland) -- On March 29, 2014 the sun released an X-class flare. It was observed by NASA's Interface Region Imaging Spectrograph, or IRIS; NASA's Solar Dynamics Observatory, or SDO; NASA's Reuven Ramaty High Energy Solar Spectroscopic Imager, or RHESSI; the Japanese Aerospace Exploration Agency's Hinode; and the National Solar Observatory's Dunn Solar Telescope located at Sacramento Peak in New Mexico. To have a record of such an intense flare from so many observatories is unprecedented. Such research can help scientists better understand what catalyst sets off these large explosions on the sun. Perhaps we may even some day be able to predict their onset and forewarn of the radio blackouts solar flares can cause near Earth - blackouts that can interfere with airplane, ship and military communications. Read more: <a href="http://1.usa.gov/1kMDQbO" rel="nofollow">1.usa.gov/1kMDQbO</a> Join our Google+ Hangout on May 8 at 2:30pm EST: <a href="http://go.nasa.gov/1mwbBEZ" rel="nofollow">go.nasa.gov/1mwbBEZ</a> Credit: NASA Goddard <b><a href="http://www.nasa.gov/audience/formedia/features/MP_Photo_Guidelines.html" rel="nofollow">NASA image use policy.</a></b> <b><a href="http://www.nasa.gov/centers/goddard/home/index.html" rel="nofollow">NASA Goddard Space Flight Center</a></b> enables NASA’s mission through four scientific endeavors: Earth Science, Heliophysics, Solar System Exploration, and Astrophysics. Goddard plays a leading role in NASA’s accomplishments by contributing compelling scientific knowledge to advance the Agency’s mission. <b>Follow us on <a href="http://twitter.com/NASAGoddardPix" rel="nofollow">Twitter</a></b> <b>Like us on <a href="http://www.facebook.com/pages/Greenbelt-MD/NASA-Goddard/395013845897?ref=tsd" rel="nofollow">Facebook</a></b> <b>Find us on <a href="http://instagram.com/nasagoddard?vm=grid" rel="nofollow">Instagram</a></b>
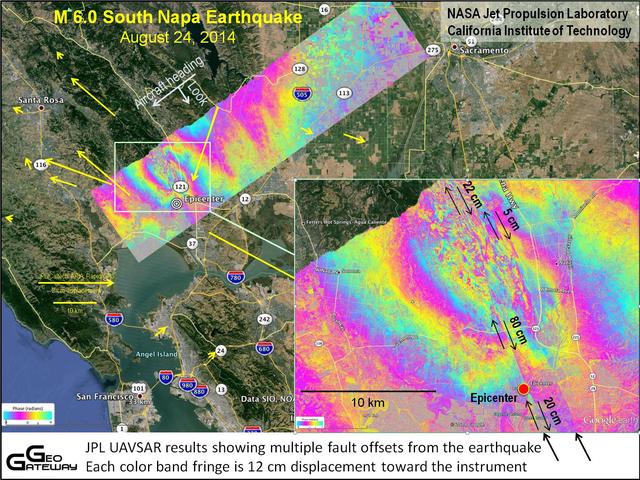
NASA UAVSAR studies ground deformation after a magnitude 6.0 South Napa earthquake on August 24, 2014.
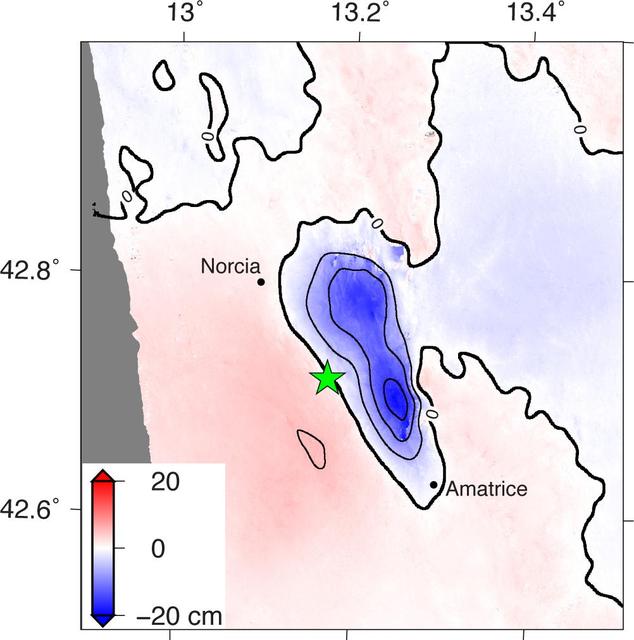
NASA and its partners are contributing observations and expertise to the ongoing response to the Aug. 23, 2016, magnitude 6.2 Amatrice earthquake in central Italy caused widespread building damage to several towns throughout the region. This earthquake was the strongest in that area since the 2009 earthquake that destroyed the city of L'Aquila. Scientists with the Advanced Rapid Imaging and Analysis project (ARIA), a collaboration between NASA's Jet Propulsion Laboratory, Pasadena, California, and the California Institute of Technology in Pasadena, analyzed interferometric synthetic aperture radar images from the PALSAR-2 instrument on the ALOS-2 satellite operated by the Japan Aerospace Exploration Agency (JAXA) to calculate a map of the deformation of Earth's surface caused by the quake. This false-color map shows the amount of permanent surface movement, as viewed by the satellite, during a seven-month interval between two ALOS-2 images acquired on Sept. 9, 2015 and Aug. 24, 2016. The movement was caused almost entirely by the earthquake. In this map, the colors of the surface displacements are proportional to the surface motion. The red and pink tones show the areas where the land moved toward the satellite by up to 2 inches (5 centimeters). The area with various shades of blue moved away from the satellite, mostly downward, by as much as 8 inches (20 centimeters). Contours on the surface motion are 2 inches (5 centimeters) The green star shows the epicenter where the earthquake started as located by the U.S. Geological Survey National Earthquake Information Center. Black dots show town locations. Scientists use these maps to build detailed models of the fault slip at depth and associated land movements to better understand the impact on future earthquake activity. The map shows the fault or faults that moved in the earthquake is about 14 miles (22 kilometers) long between Amatrice and Norcia and slopes to the west beneath the area that moved downward. The PALSAR-2 data were provided by JAXA through a science project. http://photojournal.jpl.nasa.gov/catalog/PIA20893

NASA data and expertise are providing valuable information for the ongoing response to the April 25, 2015, magnitude 7.8 Gorkha earthquake in Nepal.
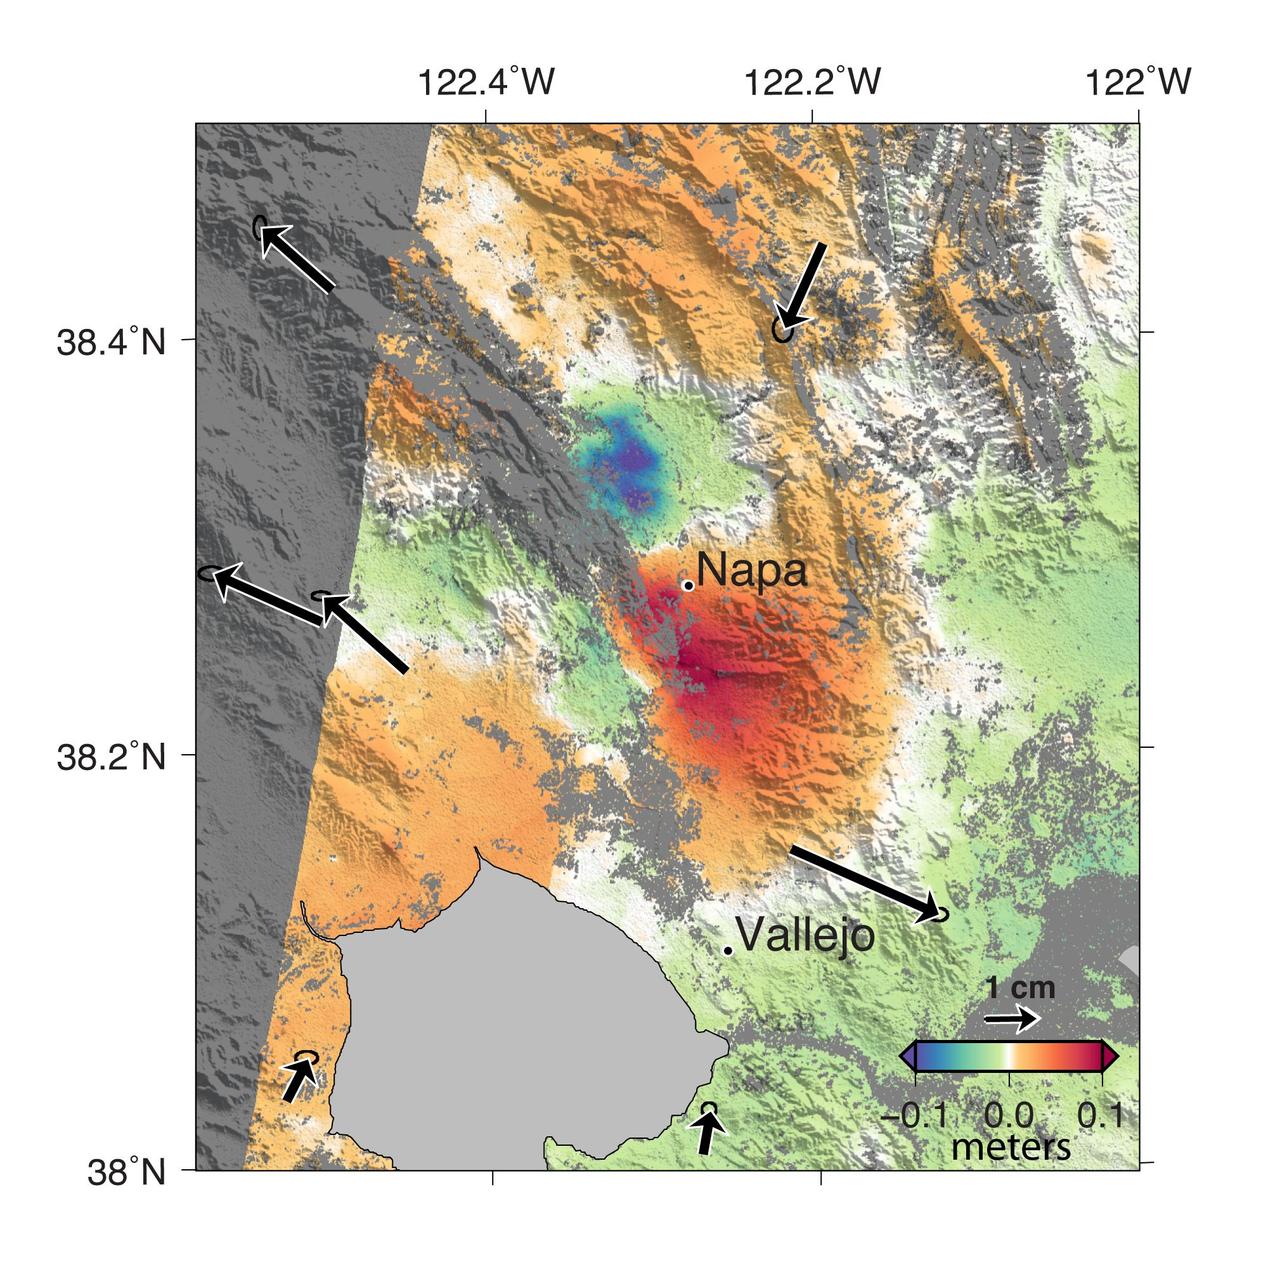
A magnitude 6.0 earthquake struck southern Napa county northeast of San Francisco, California, on Aug. 24, 2014. NASA satellite data reveal ground defomation.
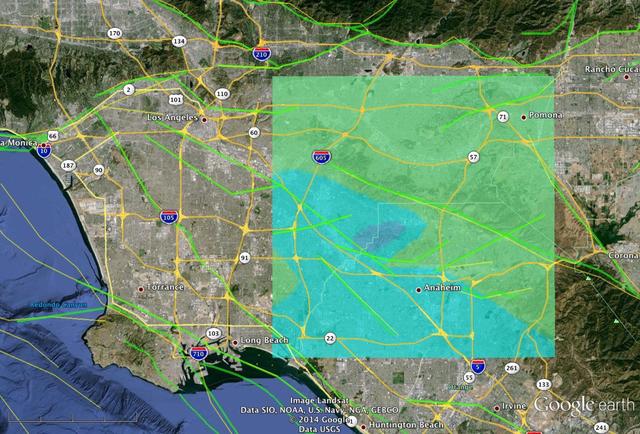
NASA Model Provides 3-D Look at L.A.-area 5.1 Quake
The Advanced Rapid Imaging and Analysis (ARIA) team at NASA's Jet Propulsion Laboratory in Pasadena, California, created this Flood Proxy Map depicting areas of Southeastern Texas that are likely flooded as a result of Hurricane Harvey, shown by light blue pixels. The map is derived from synthetic aperture radar amplitude images from the Japan Aerospace Exploration Agency's (JAXA) ALOS-2 PALSAR-2 satellite, taken before (July 30, 2017) and after (August 27, 2017) Hurricane Harvey made landfall. The map covers an area of 135 square miles (350 square kilometers). Each pixel measures about 538 square feet (50 square meters). Local ground observations provided anecdotal preliminary validation. This flood proxy map should be used as guidance to identify areas that are likely flooded, and may be less reliable over urban areas. ALOS-2 data were accessed through the International Charter. https://photojournal.jpl.nasa.gov/catalog/PIA21928
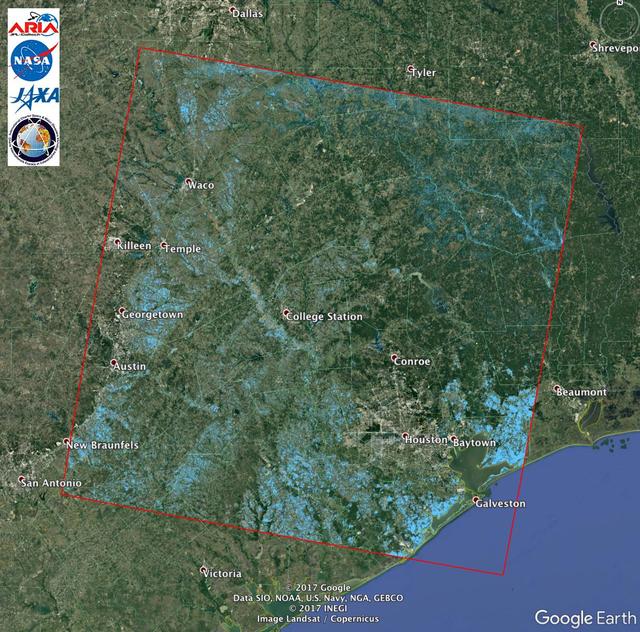
The Advanced Rapid Imaging and Analysis (ARIA) team at NASA's Jet Propulsion Laboratory in Pasadena, California, used synthetic aperture radar imagery from the Japan Aerospace Exploration Agency's (JAXA) ALOS-2 satellite to create this Flood Proxy Map depicting areas of Southeastern Texas that are likely flooded as a result of Hurricane Harvey (shown by light blue pixels). The map is derived images taken before (July 30, 2017) and after (Aug. 27, 2017) Hurricane Harvey made landfall. The map covers an area of 220 by 400 miles (350 by 640 kilometers). Each pixel measures about 55 yards (50 meters) across. Local ground observations provided anecdotal preliminary validation. The results are also cross-validated with ARIA Sentinel-1 flood proxy map v0.2. The map should be used as guidance, and may be less reliable over urban areas. ALOS-2 data were accessed through the International Charter. https://photojournal.jpl.nasa.gov/catalog/PIA21931
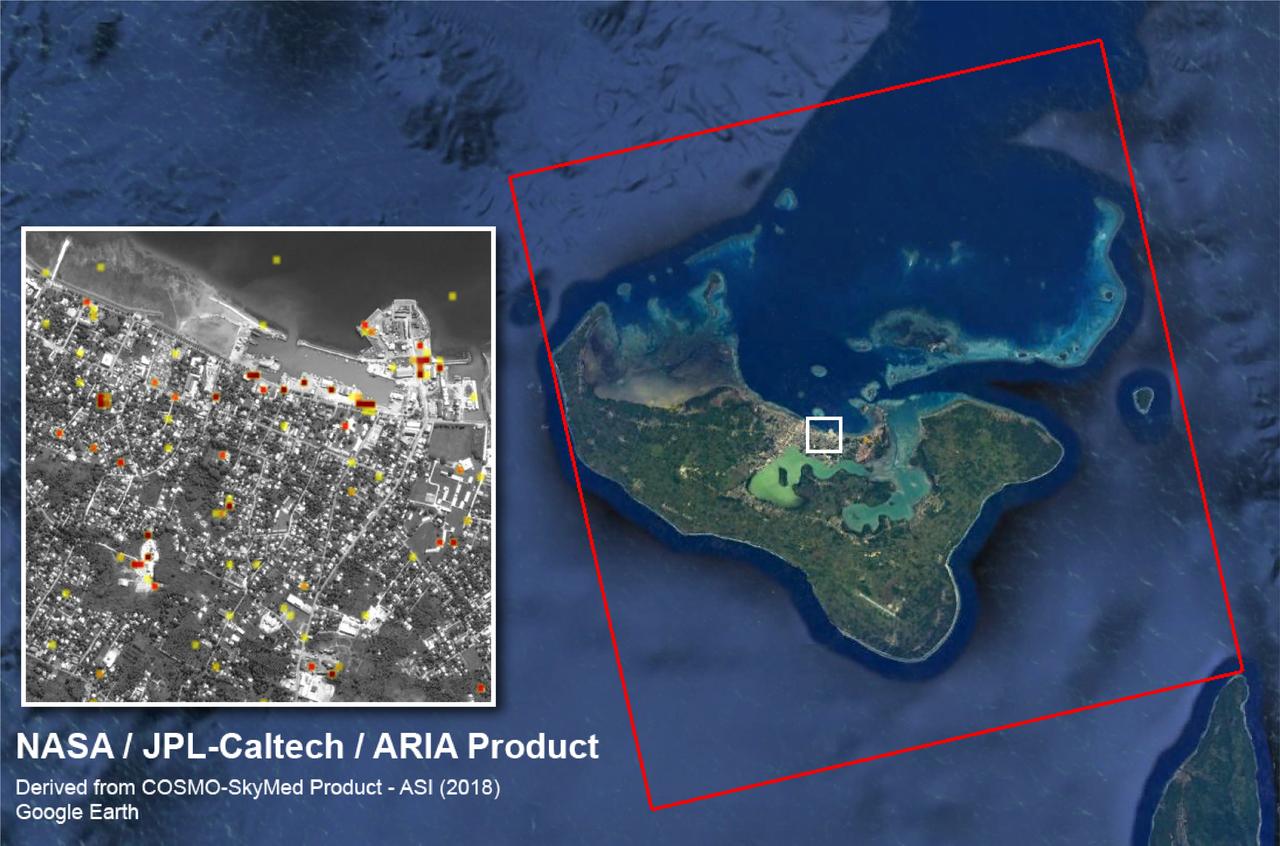
The Advanced Rapid Imaging and Analysis (ARIA) team at NASA's Jet Propulsion Laboratory created this Damage Proxy Map (DPM) of Tongatapu, the main island of Tonga, following the landfall of Cyclone Gita, a Category 4 storm that hit Tonga on Feb. 12-13, 2018. The map depicts areas that are likely damaged from the storm, shown by red and yellow pixels. The map was produced by comparing two pairs of interferometric synthetic aperture radar (InSAR) images from the COSMO-SkyMed satellites, operated by the Italian Space Agency (ASI). The pre- and post-cyclone images were acquired on Jan. 19 and Feb. 13, 2018, respectively. The later image was acquired just 4-1/2 hours after the peak damage by the cyclone. The map covers the entire island of Tongatapu (the 25-by-25-mile, or 40-by-40 kilometer SAR image footprint indicated with the large red polygon). Each pixel measures about 98 feet (30 meters) across. The color variation from yellow to red indicates increasingly more significant ground surface change. Preliminary validation of the SAR data was done by comparing them with high-resolution optical imagery acquired by DigitalGlobe. This Damage Proxy Map should be used as guidance to identify damaged areas and may be less reliable over vegetated and flooded areas. https://photojournal.jpl.nasa.gov/catalog/PIA22257
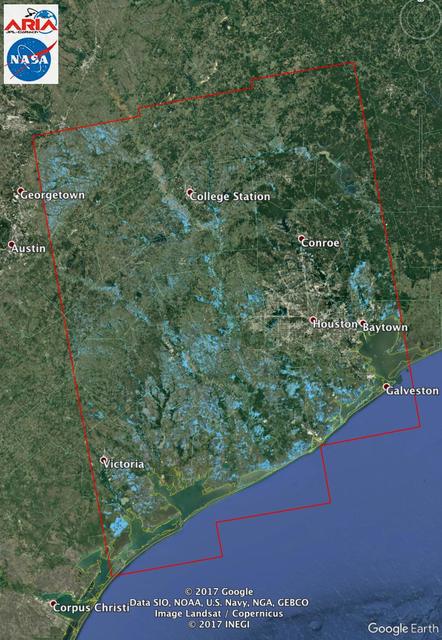
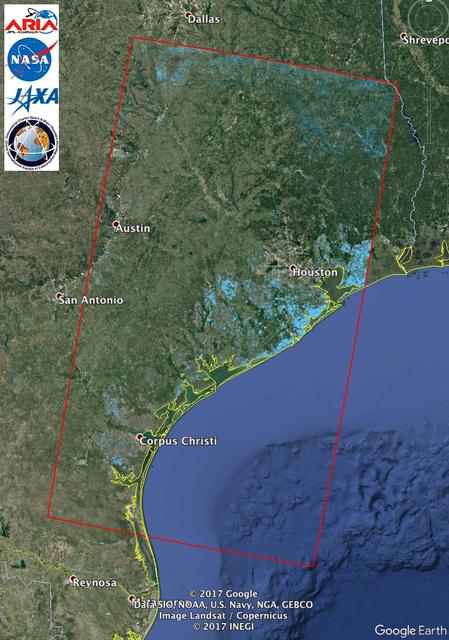
The Advanced Rapid Imaging and Analysis (ARIA) team at NASA's Jet Propulsion Laboratory in Pasadena, California, used synthetic aperture radar imagery from the European Space Agency's (ESA) Sentinel-1 satellite to create this Flood Proxy Map of Southeastern Texas, showing areas that are likely flooded as a result of Hurricane Harvey (light blue pixels). The images used to create the map were taken before (Aug. 5, 2017) and after (Aug. 29, 2017) Hurricane Harvey made landfall. The map covers an area of 155 by 211 miles (250 by 340 kilometers). Each pixel measures about 33 yards (30 meters) across. Local ground observations provided anecdotal preliminary validation. The results were also cross-validated with the ARIA ALOS-2 flood proxy map v0.2. The map should be used as guidance, and may be less reliable over urban areas. Sentinel-1 data were accessed through the Copernicus Open Access Hub. Contains modified Copernicus Sentinel data 2017. https://photojournal.jpl.nasa.gov/catalog/PIA21932
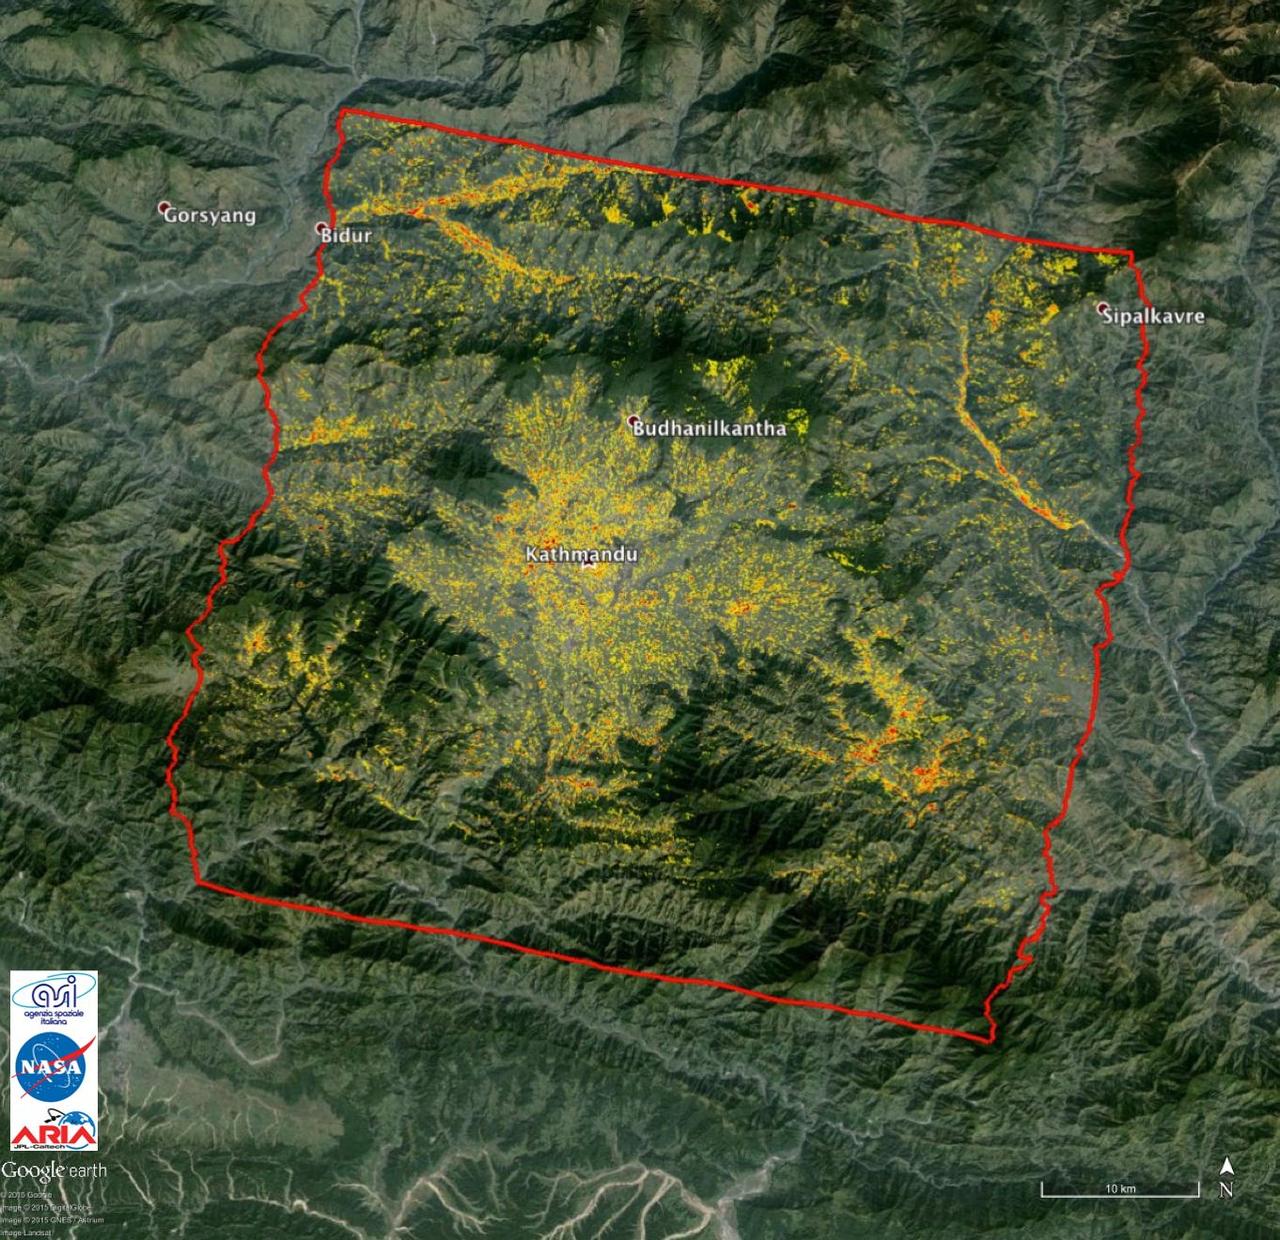
NASA data and expertise are providing valuable information for the ongoing response to the April 25, 2015, magnitude 7.8 Gorkha earthquake in Nepal.
NASA Dryden's Ikhana ground crewmen Gus Carreno and James Smith load the thermal-infrared imaging scanner pallet into the Ikhana's underwing payload pod.

With smoke from the Lake Arrowhead area fires streaming in the background, NASA's Ikhana unmanned aircraft heads out on a Southern California wildfires imaging mission.

The instruments that make up the Ames Autonomous Module Scanner (AMS) that provided precise thermal-infrared imaging during the Western States Fire Mission in 2007 are detailed in this photo of the AMS as mounted on Ikhana's pod tray. The large foil-covered foam-insulated box at left covers the pressure vessel containing the data system computers and other electronics. The round white-topped assembly is the scan head, including the scan mirror, folded telescope, blackbody references, spectrometer and detectors. Two pressure boxes visible at the forward end of the tray contain the Applanix POS/AV precision navigation subsystem (black) and the power distributor including circuit breakers and ancillary wiring, scan motor controller and the blackbody reference temperature controller (blue).

With smoke from the Lake Arrowhead area fires streaming in the background, NASA's Ikhana unmanned aircraft heads out on a Southern California wildfires imaging mission.

NASA Ames engineer Ted Hildum checks out the thermal-infrared scanner computer before it is loaded on NASA's Ikhana unmanned aircraft.
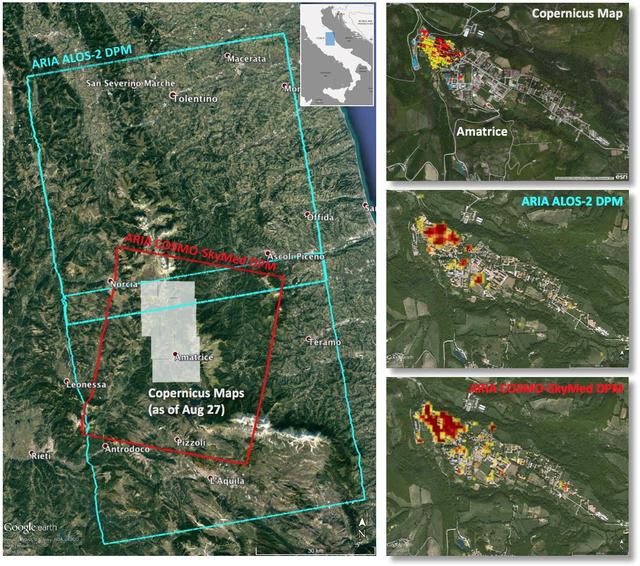
Italy earthquake. The quake has caused significant damage in the historic town of Amatrice. To assist in the disaster response efforts, scientists at NASA's Jet Propulsion Laboratory, Pasadena, California, and the California Institute of Technology in Pasadena, in collaboration with the Italian Space Agency (ASI), generated this image of the earthquake's hardest-hit region. The 40-by-75 mile (65-by-120 kilometer) Damage Proxy Map (DPM) was derived from two consecutive frames of the Japan Aerospace Exploration Agency's (JAXA's) L-band interferometric synthetic aperture radar (InSAR) data from the ALOS-2 satellite (cyan rectangles), and the 25-by-31 mile (40-by-50 kilometer) DPM was derived from InSAR data from the Agenzia Spaciale Italiana's (ASI's) X-band COSMO-SkyMed satellite (red rectangle). Both DPMs cover the historic town of Amatrice, revealing severe damage in the western side of the town (right panels). The time span of the data for the change is Jan. 27, 2016 to Aug. 24, 2016 for ALOS-2 and Aug. 20, 2016 to Aug. 28, 2016 for COSMO-SkyMed. Each pixel in the damage proxy map is about 100 feet (30 meters) across. The SAR data were processed by the Advanced Rapid Imaging and Analysis (ARIA) team at JPL and Caltech. The technique uses a prototype algorithm to rapidly detect surface changes caused by natural or human-produced damage. The assessment technique is most sensitive to destruction of the built environment. When the radar images areas with little to no destruction, its image pixels are transparent. Increased opacity of the radar image pixels reflects damage, with areas in red reflecting the heaviest damage to cities and towns. The color variations from yellow to red indicate increasingly more significant ground surface change. Preliminary validation was done by comparing the DPMs to a damage assessment map produced by the Copernicus Emergency Management Service, which is based on visual inspection of before and after high-resolution aerial imagery -- the extent indicated with gray boxes in the left panel. http://photojournal.jpl.nasa.gov/catalog/PIA20897