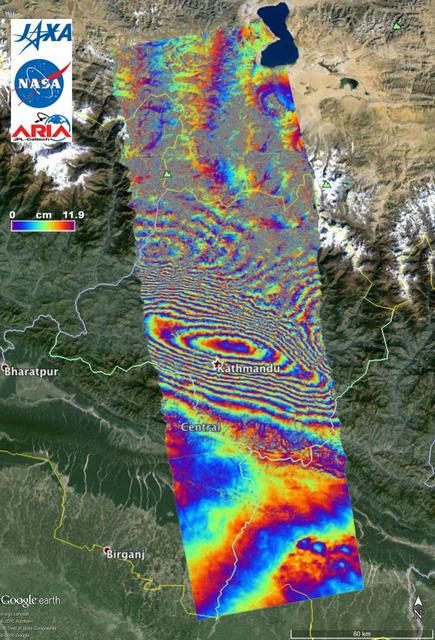
NASA and its partners are contributing important observations and expertise to the ongoing response to the April 25, 2015, magnitude 7.8 Gorkha earthquake in Nepal. The quake was the strongest to occur in that area since the 1934 Nepal-Bihar magnitude 8.0 event and caused significant regional damage and a humanitarian crisis. Scientists with the Advanced Rapid Imaging and Analysis project (ARIA), a collaboration between NASA's Jet Propulsion Laboratory, Pasadena, California, and the California Institute of Technology in Pasadena, analyzed interferometric synthetic aperture radar images from the PALSAR-2 instrument on the ALOS-2 satellite operated by the Japan Aerospace Exploration Agency (JAXA) to calculate a map of the deformation of Earth's surface caused by the quake. This false-color map shows the amount of permanent surface movement caused almost entirely by the earthquake, as viewed by the satellite, during a 70-day interval between two ALOS-2 images, acquired February 21 and May 2, 2015. In the map, surface displacements are seen as color contours (or "fringes"), where each color cycle represents 4.7 inches (11.9 centimeters) of surface motion. The contours show the land around Kathmandu has moved toward the satellite by up to 4.6 feet (1.4 meter), or 5.2 feet (1.6 meters) if we assume purely vertical motion. Areas without the color contours have snow or heavy vegetation that affects the radar measurements. Scientists use these maps to build detailed models of the fault and associated land movements to better understand the impact on future earthquake activity. The PALSAR-2 data were provided by JAXA through the Committee on Earth Observation Satellite (CEOS) in support of the response effort. The background image is from Google Earth. http://photojournal.jpl.nasa.gov/catalog/PIA19383
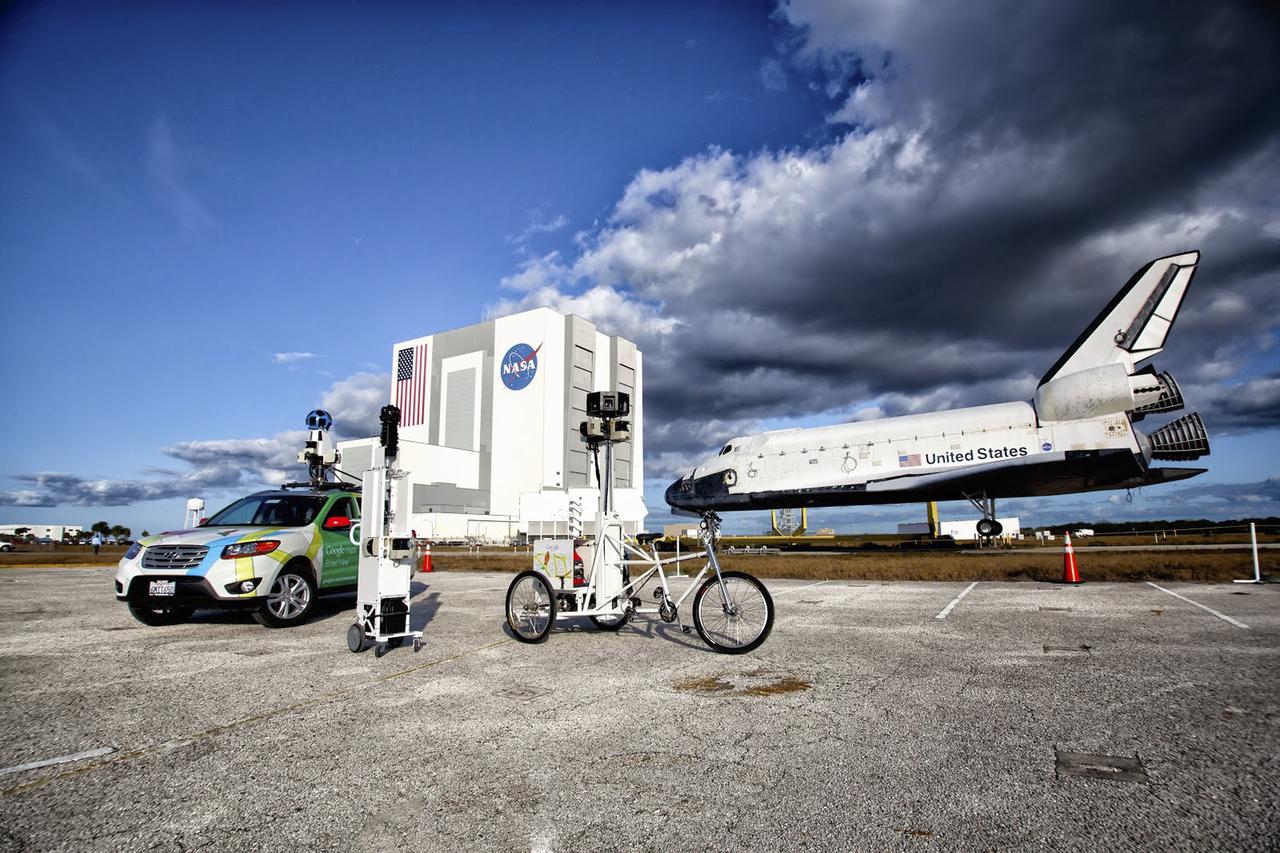
CAPE CANAVERAL, Fla. – Google used an assortment of vehicles to precisely map NASA's Kennedy Space Center in Florida to be featured on the company's map page. The work allows Internet users to see inside buildings at Kennedy as they were used during the space shuttle era. Google used a car, tricycle and pushcart to maneuver around the center and through some of its facilities. Photo credit: Google/Wendy Wang

CAPE CANAVERAL, Fla. – As seen on Google Maps, the massive F-1 engines of the Saturn V's first stage on display inside the Apollo/Saturn V Center at the Kennedy Space Center Visitor Complex. Each engine stands 19 feet tall with a diameter of more than 12 feet. The five engines on the first stage produced 7.5 million pounds of thrust at liftoff. The Saturn V was used to launch NASA's Apollo missions to the moon which saw 12 astronauts land and work on the lunar surface. Google precisely mapped Kennedy Space Center and some of its historical facilities for the company's map page. Photo credit: Google/Wendy Wang

CAPE CANAVERAL, Fla. – As seen on Google Maps, space shuttle Endeavour goes through transition and retirement processing in high bay 4 of the Vehicle Assembly Building at NASA's Kennedy Space Center. The spacecraft completed 25 missions beginning with its first flight, STS-49, in May 1992, and ending with STS-134 in May 2011. It helped construct the International Space Station in orbit and travelled more than 122 million miles in orbit during its career. The reaction control system pods in the shuttle's nose and aft section were removed for processing before Endeavour was put on public display at the California Science Center in Los Angeles. Google precisely mapped the space center and some of its historical facilities for the company's map page. The work allows Internet users to see inside buildings at Kennedy as they were used during the space shuttle era. Photo credit: Google/Wendy Wang
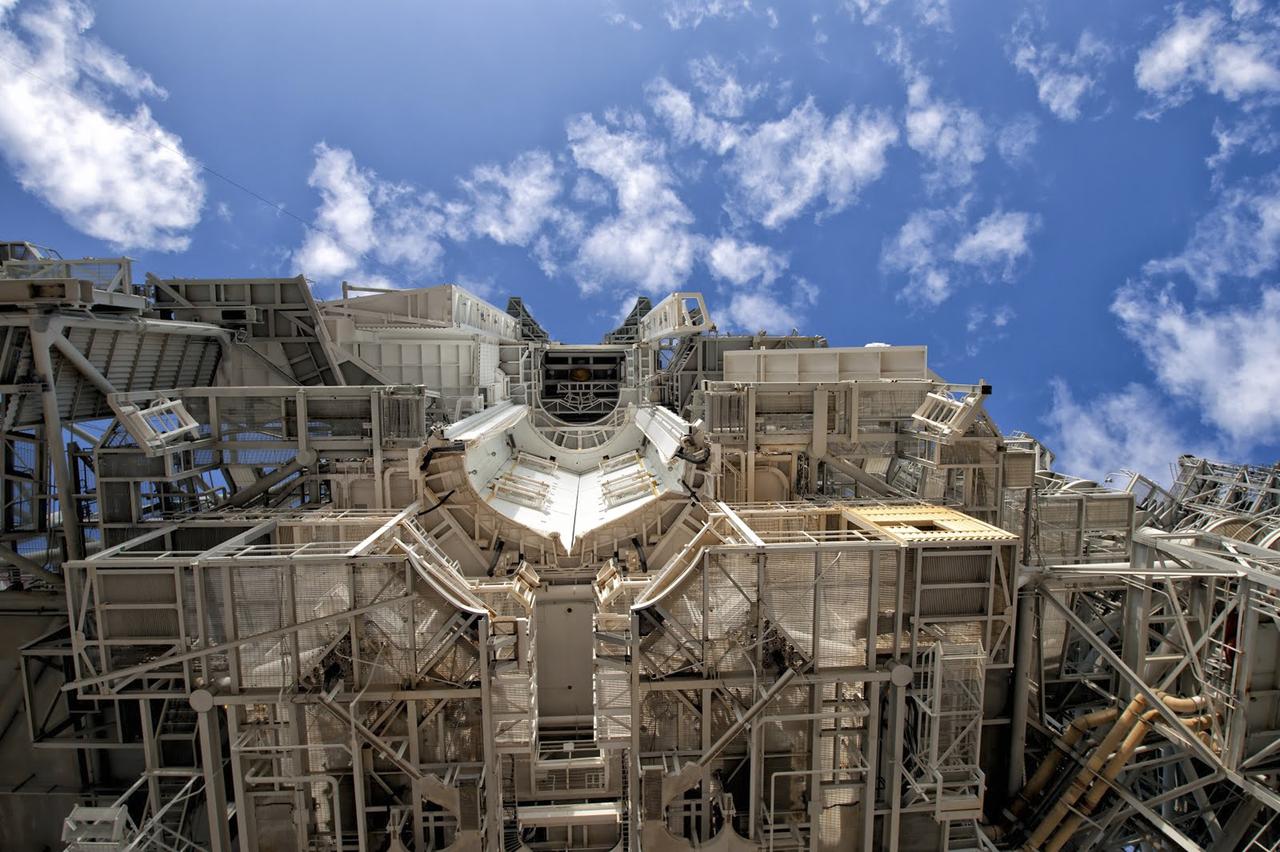
CAPE CANAVERAL, Fla. – As seen on Google Maps, the Rotating Service Structure at Launch Complex 39A at NASA's Kennedy Space Center housed space shuttle payloads temporarily so they could be loaded inside the 60-foot-long cargo bay of a shuttle before launch. The RSS, as the structure was known, was hinged to the Fixed Service Structure on one side and rolled on a rail on the other. As its name suggests, the enclosed facility would rotate into place around the shuttle as it stood at the launch pad. Once in place, the RSS protected the shuttle and its cargo. Google precisely mapped the space center and some of its historical facilities for the company's map page. The work allows Internet users to see inside buildings at Kennedy as they were used during the space shuttle era. Photo credit: Google/Wendy Wang
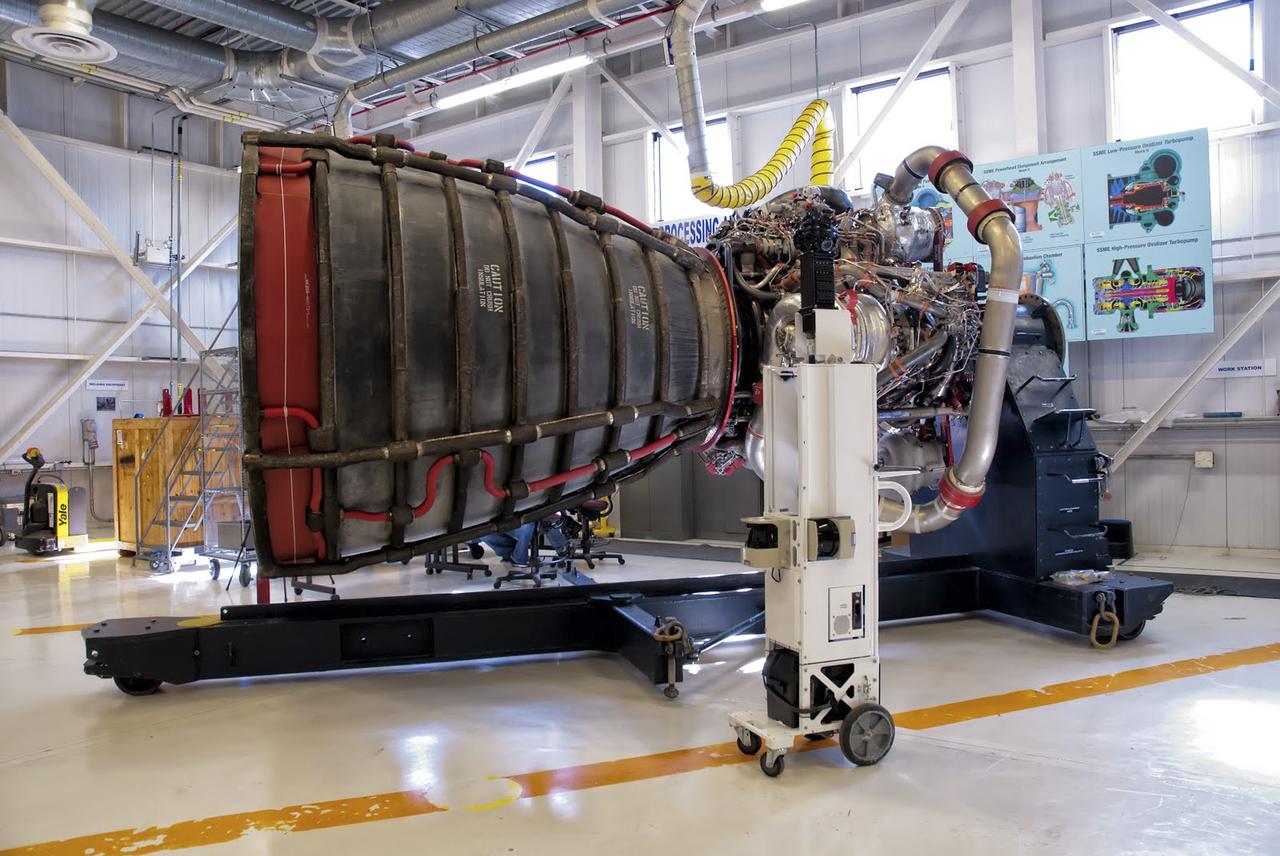
CAPE CANAVERAL, Fla. – As seen on Google Maps, a Space Shuttle Main Engine, or SSME, stands inside the Engine Shop at Orbiter Processing Facility 3 at NASA's Kennedy Space Center. Each orbiter used three of the engines during launch and ascent into orbit. The engines burn super-cold liquid hydrogen and liquid oxygen and each one produces 155,000 pounds of thrust. The engines, known in the industry as RS-25s, could be reused on multiple shuttle missions. They will be used again later this decade for NASA's Space Launch System rocket. Google precisely mapped the space center and some of its historical facilities for the company's map page. The work allows Internet users to see inside buildings at Kennedy as they were used during the space shuttle era. Photo credit: Google/Wendy Wang
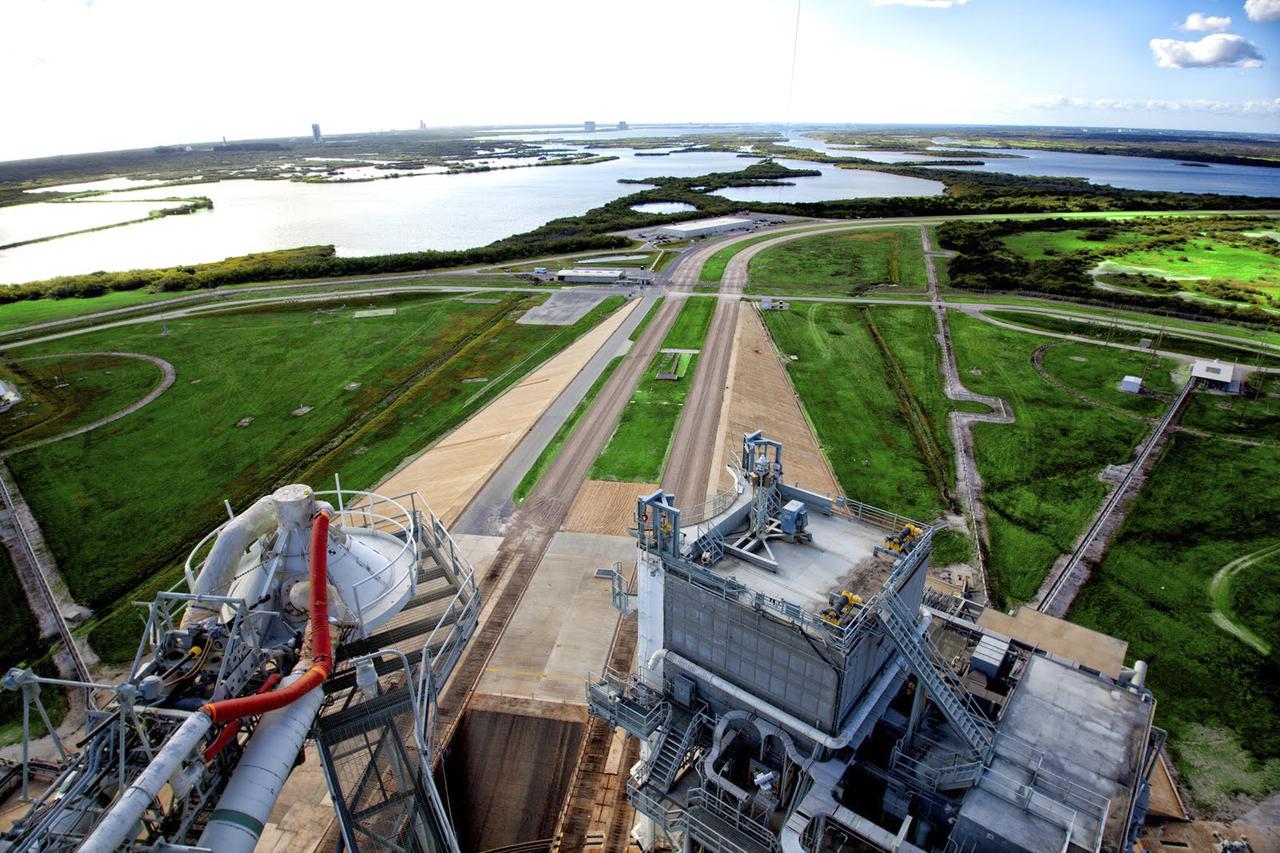
CAPE CANAVERAL, Fla. – As seen on Google Maps, the view from the top of the Fixed Service Structure at Launch Complex 39A at NASA's Kennedy Space Center. The FSS, as the structure is known, is 285 feet high and overlooks the Rotating Service Structure that was rolled into place when a space shuttle was at the pad. The path taken by NASA's massive crawler-transporters that carried the shuttle stack 3 miles from Vehicle Assembly Building are also visible leading up to the launch pad. In the distance are seen the launch pads and support structures at Cape Canaveral Air Force Station for the Atlas V, Delta IV and Falcon 9 rockets. Google precisely mapped the space center and some of its historical facilities for the company's map page. The work allows Internet users to see inside buildings at Kennedy as they were used during the space shuttle era. Photo credit: Google/Wendy Wang
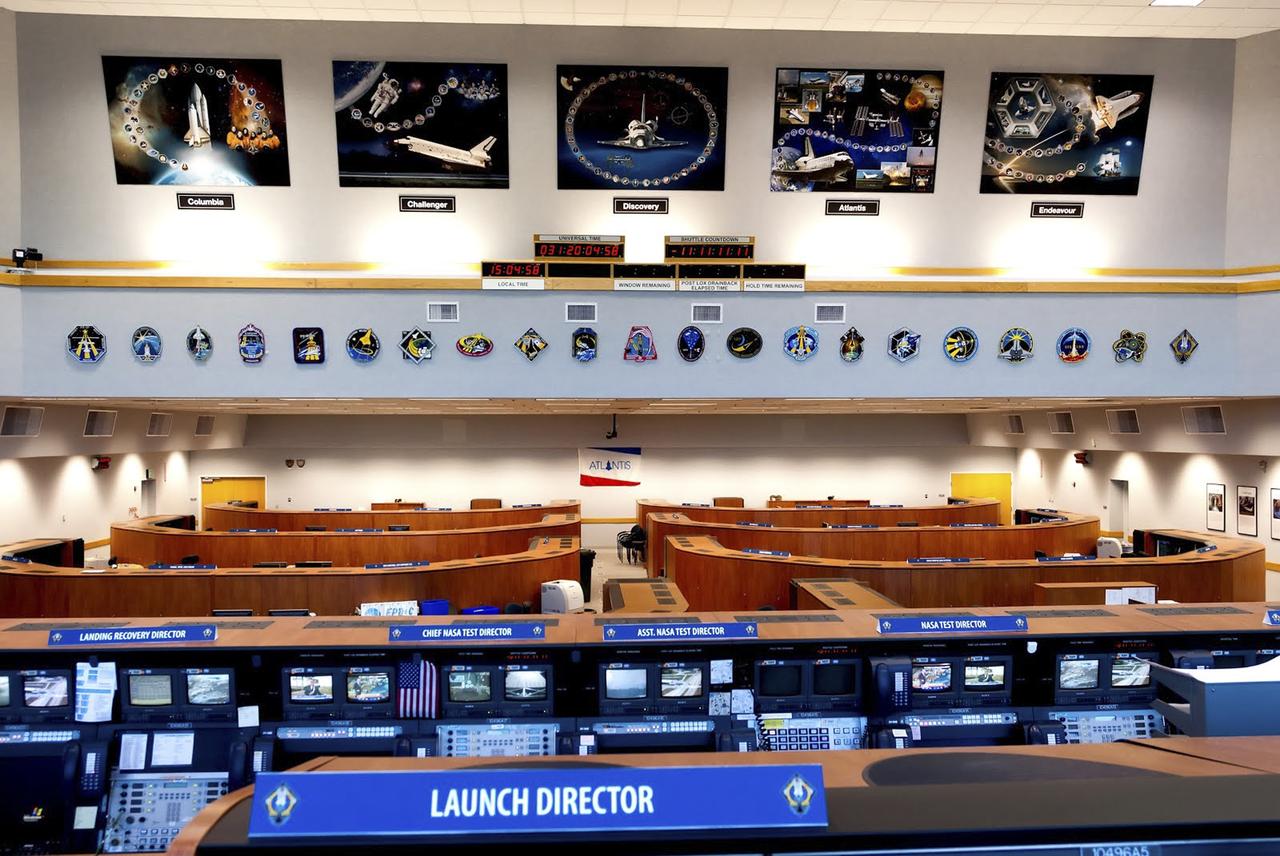
CAPE CANAVERAL, Fla. – As seen on Google Maps, Firing Room 4 inside the Launch Control Center at NASA's Kennedy Space Center was one of the four control rooms used by NASA and contractor launch teams to oversee a space shuttle countdown. This firing room was the most advanced of the control rooms used for shuttle missions and was the primary firing room for the shuttle's final series of launches before retirement. It is furnished in a more contemporary style with wood cabinets and other features, although it retains many of the computer systems the shuttle counted on to operate safely. Specialized operators worked at consoles tailored to keep track of the status of shuttle systems while the spacecraft was processed in the Orbiter Processing Facility, being stacked inside the Vehicle Assembly Building and standing at the launch pad before liftoff. The firing rooms, including 3, were also used during NASA's Apollo Program. Google precisely mapped the space center and some of its historical facilities for the company's map page. The work allows Internet users to see inside buildings at Kennedy as they were used during the space shuttle era. Photo credit: Google/Wendy Wang
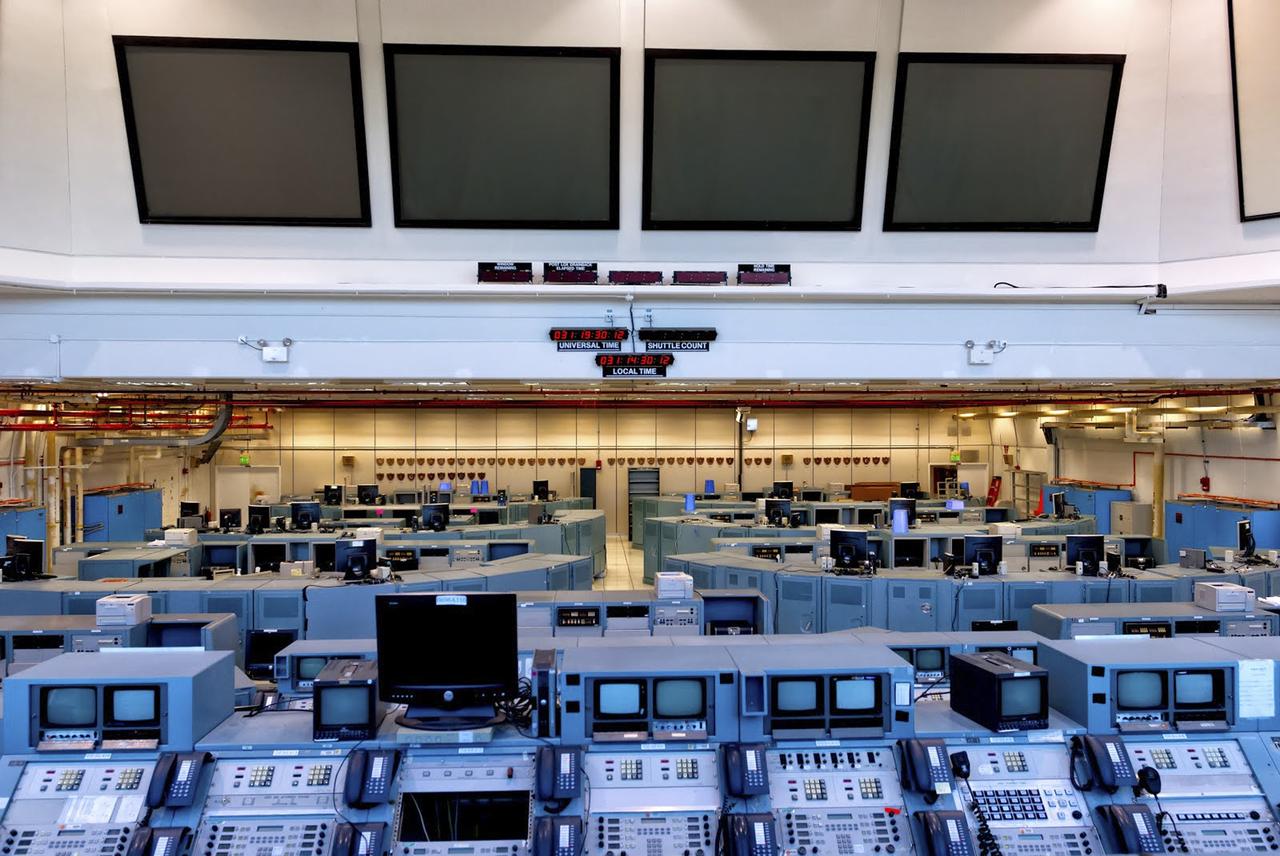
CAPE CANAVERAL, Fla. – As seen on Google Maps, Firing Room 3 inside the Launch Control Center at NASA's Kennedy Space Center was one of the four control rooms used by NASA and contractor launch teams to oversee a space shuttle countdown. This firing room is furnished in the classic style with the same metal computer cabinets and some of the same monitors in place when the first shuttle mission launched April 12, 1981. Specialized operators worked at consoles tailored to keep track of the status of shuttle systems while the spacecraft was processed in the Orbiter Processing Facility, being stacked inside the Vehicle Assembly Building and standing at the launch pad before liftoff. The firing rooms, including 3, were also used during NASA's Apollo Program. Google precisely mapped the space center and some of its historical facilities for the company's map page. The work allows Internet users to see inside buildings at Kennedy as they were used during the space shuttle era. Photo credit: Google/Wendy Wang

Sam Choi and Naiara Pinto observe Google Earth overlaid with in almost real time what the synthetic aperture radar is mapping from the C-20A aircraft. Researchers were in the sky and on the ground to take measurements of plant mass, distribution of trees, shrubs and ground cover and the diversity of plants and how much carbon is absorbed by them.
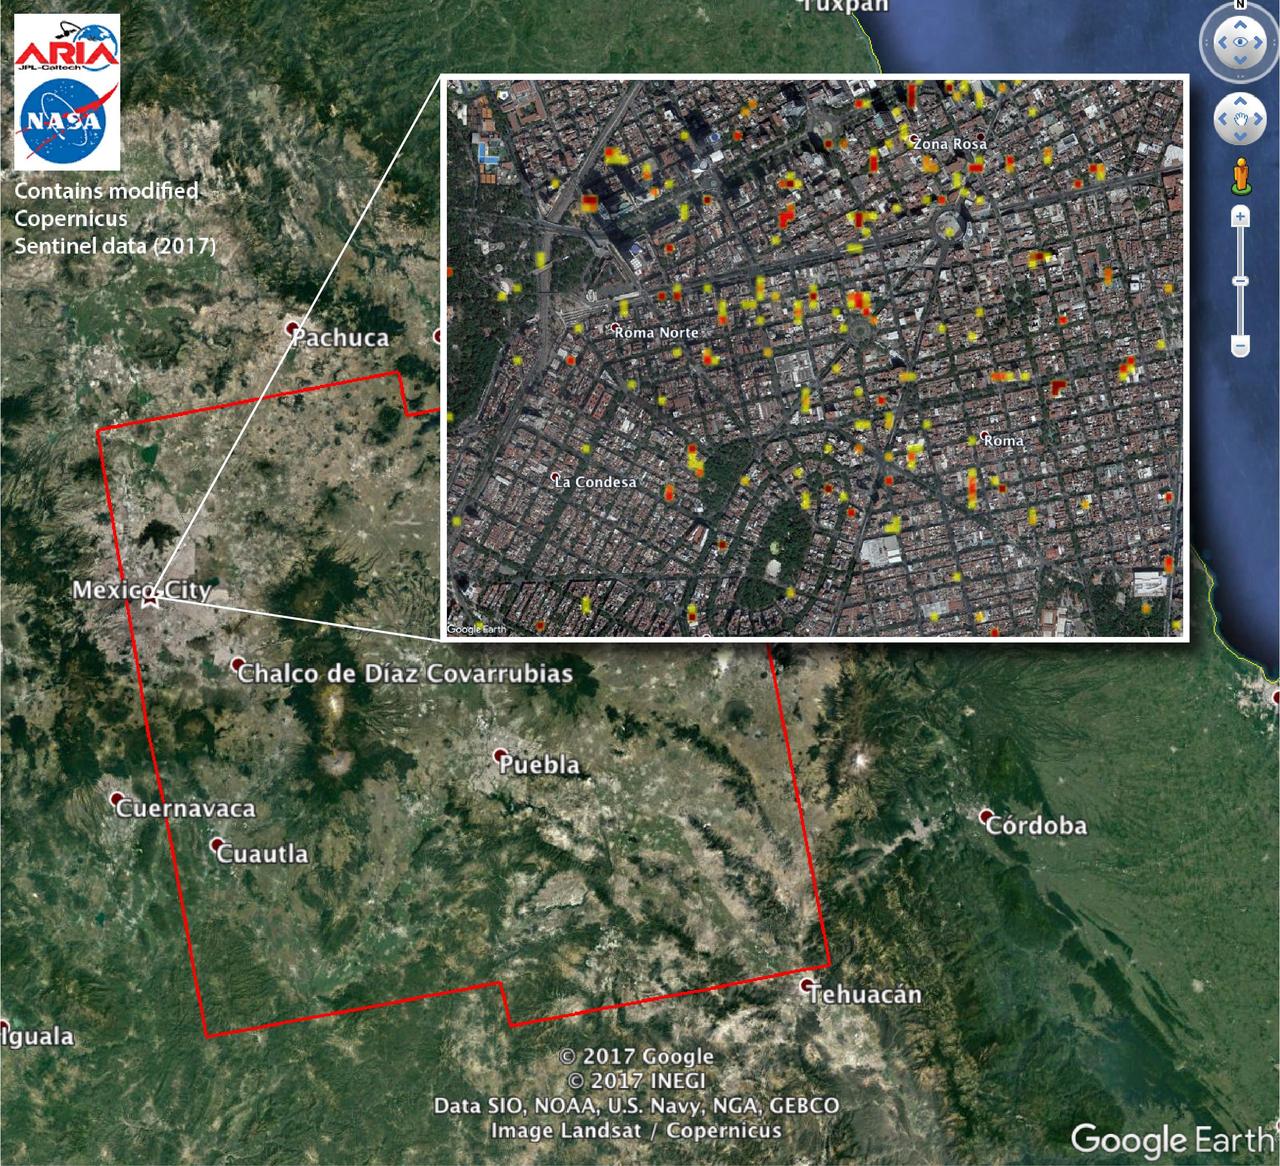
The Advanced Rapid Imaging and Analysis (ARIA) team at NASA's Jet Propulsion Laboratory in Pasadena, California, and Caltech, also in Pasadena, created this Damage Proxy Map (DPM) depicting areas of Central Mexico, including Mexico City, that are likely damaged (shown by red and yellow pixels) from the magnitude 7.1 Raboso earthquake of Sept. 19, 2017 (local time). The map is derived from synthetic aperture radar (SAR) images from the Copernicus Sentinel-1A and Sentinel-1B satellites, operated by the European Space Agency (ESA). The images were taken before (Sept. 8, 2017) and after (Sept. 20, 2017) the earthquake. The map covers an area of 109 by 106 miles (175 by 170 kilometers). Each pixel measures about 33 yards (30 meters) across. The color variation from yellow to red indicates increasingly more significant ground and building surface change. Preliminary validation was done by comparing the DPM to a crowd-sourced Google Map (https://www.google.com/maps/d/u/0/viewer?mid=1_-V97lbdgLFHpx-CtqhLWlJAnYY&ll=19.41452166501326%2C-99.16498240436704&z=16). This damage proxy map should be used as guidance to identify damaged areas, and may be less reliable over vegetated areas. Sentinel-1 data were accessed through the Copernicus Open Access Hub. The image contains modified Copernicus Sentinel data (2017), processed by ESA and analyzed by the NASA-JPL/Caltech ARIA team. This research was carried out at JPL under contract with NASA. https://photojournal.jpl.nasa.gov/catalog/PIA21963
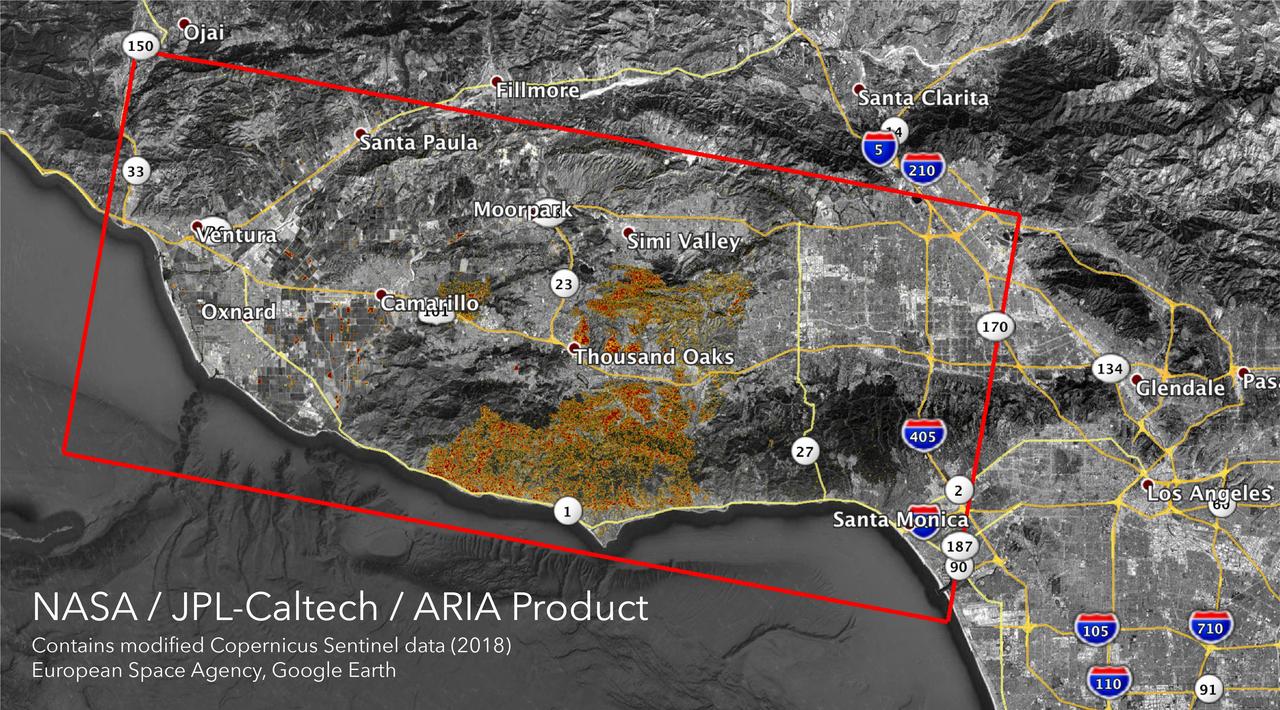
The Advanced Rapid Imaging and Analysis (ARIA) team at NASA's Jet Propulsion Laboratory in Pasadena, California, created these Damage Proxy Maps (DPMs) depicting areas in California likely damaged by the Woolsey and Camp Fires. They are derived from synthetic aperture radar (SAR) images from the Copernicus Sentinel-1 satellites, operated by the European Space Agency (ESA). The pre-event images for the Woolsey Fire in Southern California were taken before the fire on Oct. 30, 2018 and the post-event image was acquired during the fire on Nov. 11, 2018. The map covers an area of 50 miles x 25 miles (80 km x 40 km), indicated with the big red polygon. Each pixel measures about 33 yards x 33 yards (30 m x 30 m). The color variation from yellow to red indicates increasingly more significant ground surface change. The pre-event images for the Camp Fire in Northern California were taken on Nov. 4, 2018 and the post-event images were acquired during the fire on Nov. 10, 2018. The map covers an area of 55 miles x 48 miles (88 km x 77 km). As in the previous image, each pixel measures about 33 yards x 33 yards (30 m x 30 m). The color variation from yellow to red indicates increasingly more significant ground surface change. Preliminary validation for both maps was done by comparing approximate location data to Google's Crisismap. These damage proxy maps can be used as guidance to identify damaged areas with the understanding that they may be less reliable over vegetated areas including farmlands. For example, the scattered single colored pixels over vegetated areas may be false positives, and the lack of colored pixels over vegetated areas does not necessarily mean no damage. https://photojournal.jpl.nasa.gov/catalog/PIA22816
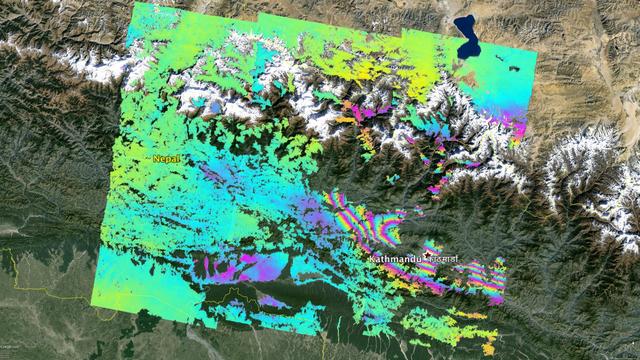
NASA and its partners are contributing important observations and expertise to the ongoing response to the April 25, 2015, magnitude 7.8 Gorkha earthquake in Nepal. The quake was the strongest to occur in that area since the 1934 Nepal-Bihar magnitude 8.0 event and caused significant regional damage and a humanitarian crisis. Scientists with the Advanced Rapid Imaging and Analysis project (ARIA), a collaboration between NASA's Jet Propulsion Laboratory, Pasadena, California, and the California Institute of Technology in Pasadena, analyzed interferometric synthetic aperture radar images from the European Union's Copernicus Sentinel-1A satellite, operated by the European Space Agency and also available from the Alaska Satellite Facility (https://www.asf.alaska.edu), to calculate a map of the deformation of Earth's surface caused by the quake. This false-color map shows the amount of permanent surface movement caused almost entirely by the earthquake, as viewed by the satellite, during a 12-day interval between two Sentinel-1 images acquired on April 17 and April 29, 2015. In the map, surface displacements are seen as color contours (or "fringes"), where each color cycle represents 8 inches (20 centimeters) of surface motion. The contours show the land around Kathmandu has moved upward by more than 40 inches (1 meter). Areas without the color contours have snow or heavy vegetation that affects the radar measurements. Scientists use these maps to build detailed models of the fault and associated land movements to better understand the impact on future earthquake activity. The background image is from Google Earth. The map contains Copernicus data (2015). http://photojournal.jpl.nasa.gov/catalog/PIA19535
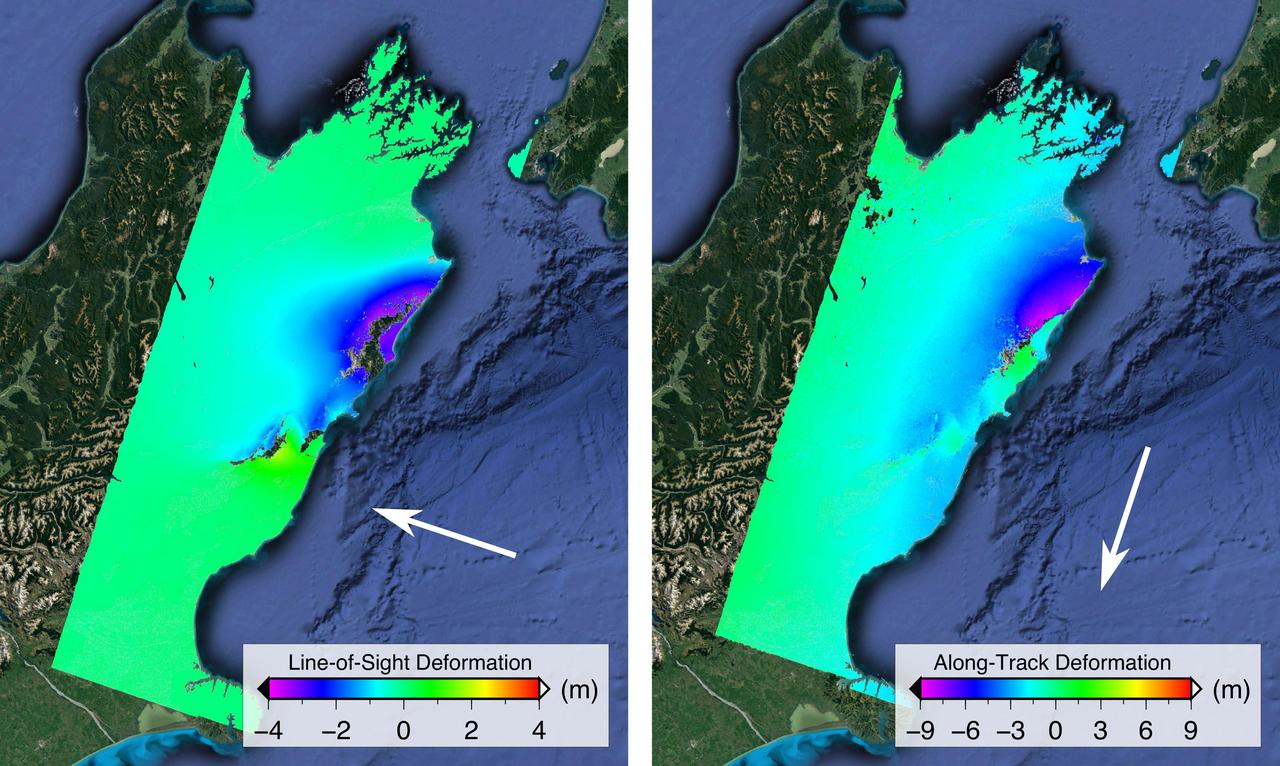
NASA and its partners are contributing important observations and expertise to the ongoing response to the Nov. 14, 2016, magnitude 7.8 Kaikoura earthquake in New Zealand. This shallow earthquake was so complex and unusual, it is likely to change how scientists think about earthquake hazards in plate boundary zones around the world. Scientists with the Advanced Rapid Imaging and Analysis project (ARIA), a collaboration between NASA's Jet Propulsion Laboratory, Pasadena, California, and Caltech in Pasadena, analyzed interferometric synthetic aperture radar images from the PALSAR-2 instrument on the ALOS-2 satellite operated by the Japan Aerospace Exploration Agency (JAXA) to calculate maps of the deformation of Earth's surface caused by the quake. Two maps show motion of the surface in two different directions. Each false-color map shows the amount of permanent surface movement caused almost entirely by the earthquake, as viewed by the satellite, during a 28-day interval between two ALOS-2 wide-swath images acquired on Oct. 18 and Nov. 15, 2016. In these two new maps made from the wide-swath images, the colors of the surface displacements are proportional to the surface motion. The wide-swath images cover the entire 106-mile (170-kilometer) length of the complex set of earthquake ruptures. The arrows show the direction of the radar motion measurement. In the left image, the blue and purple tones show the areas where the land around the Kaikoura peninsula in the Marlborough region of New Zealand's South Island has moved toward the satellite by up to 13.2 feet (4 meters), both eastward and upward. In the right image, the blue and purple tones show the areas that moved to the north by up to 30 feet (9 meters) and green tones show the area that moved to the south. The sharp line of color change is across the Kekerengu Fault, which had the largest amount of motion in the earthquake. Field studies found maximum rupture at the surface was measured at 39 feet (12 meters) of horizontal displacement. Several other faults have sharp color changes due to smaller amounts of motion, with a total of at least 12 faults rupturing in this single large earthquake. Areas without color have snow, heavy vegetation or open water that prevents the radar measurements from being coherent between satellite images – a required condition to measure ground displacement. Scientists use these maps to build detailed models of the fault slip at depth and associated land movements to better understand the impact on future earthquake activity. The PALSAR-2 data were provided by JAXA through the Committee on Earth Observation Satellites (CEOS) and through scientific research projects. The background image is from Google Earth. http://photojournal.jpl.nasa.gov/catalog/PIA21210
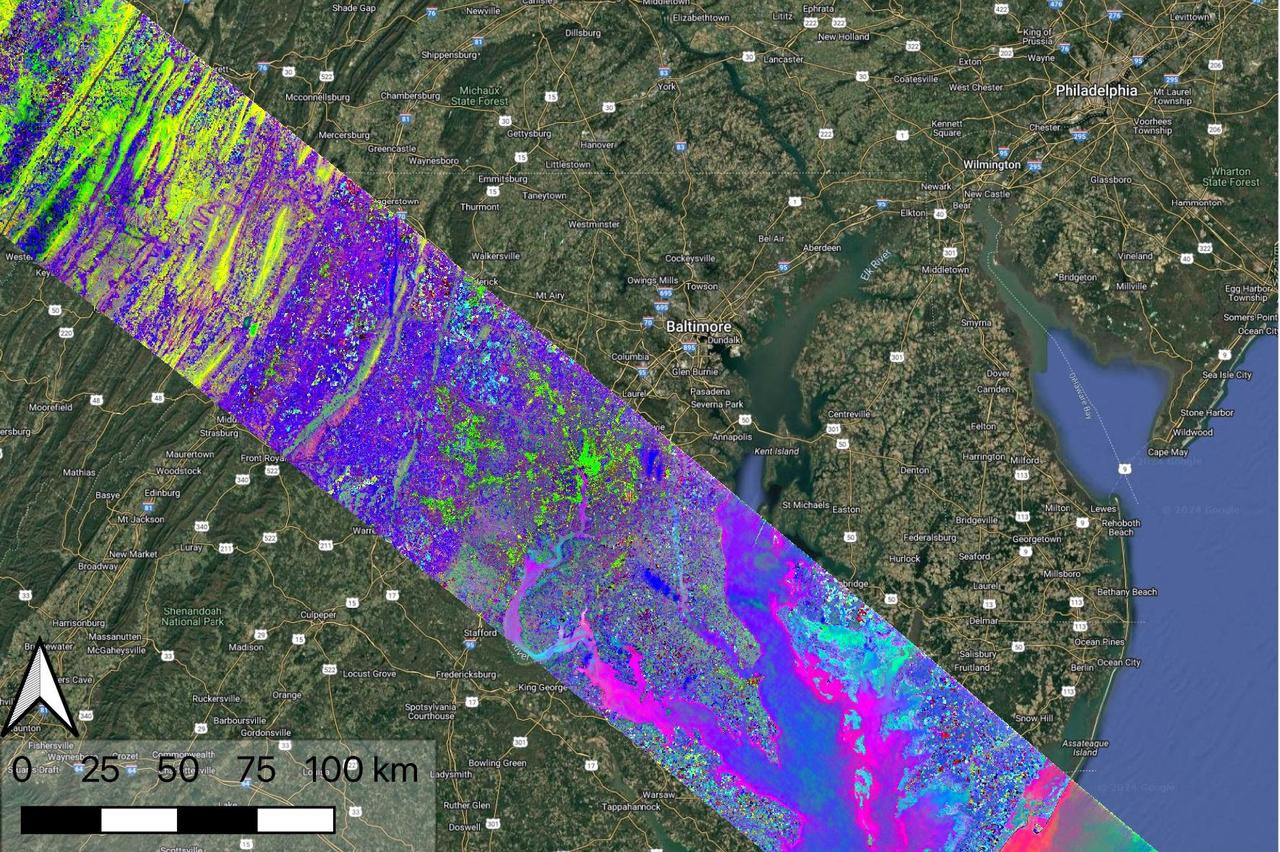
Data collected by NASA's Earth Surface Mineral Dust Source Investigation (EMIT) on April 23, 2024, indicates the location of a variety of planet communites across a swath of the mid-Atlantic United States. Overlain on a Google base map, each color represents a different type of natural biome or agricultural land. Hyperspectral data such as this is being analyzed in a range of NASA-funded research projects looking at the distribution and traits of plant communities, including agricultural crops. EMIT, installed on the International Space Station in 2022, was originally tasked with mapping minerals over Earth's desert regions to help determine the cooling and heating effects that dust can have on regional and global climate. Since early 2024 the instrument has been on an extended mission in which its data is being used in research on a diverse range of topics including agricultural practices, snow hydrology, wildflower blooming, phytoplankton and carbon dynamics in inland waters, ecosystem biodiversity, and functional traits of forests. Imaging spectrometers like EMIT detect the light reflected from Earth and then separate visible and infrared light into hundreds of wavelength bands. Scientists use patterns of reflection and absorption at different wavelengths to determine the composition of whatever the instrument is observing. EMIT is laying the groundwork for NASA's future Surface Biology and Geology-Visible Shortwave Infrared satellite mission. SBG-VSWIR will cover Earth's land and coasts more frequently than EMIT, with finer spatial resolution. https://photojournal.jpl.nasa.gov/catalog/PIA26418
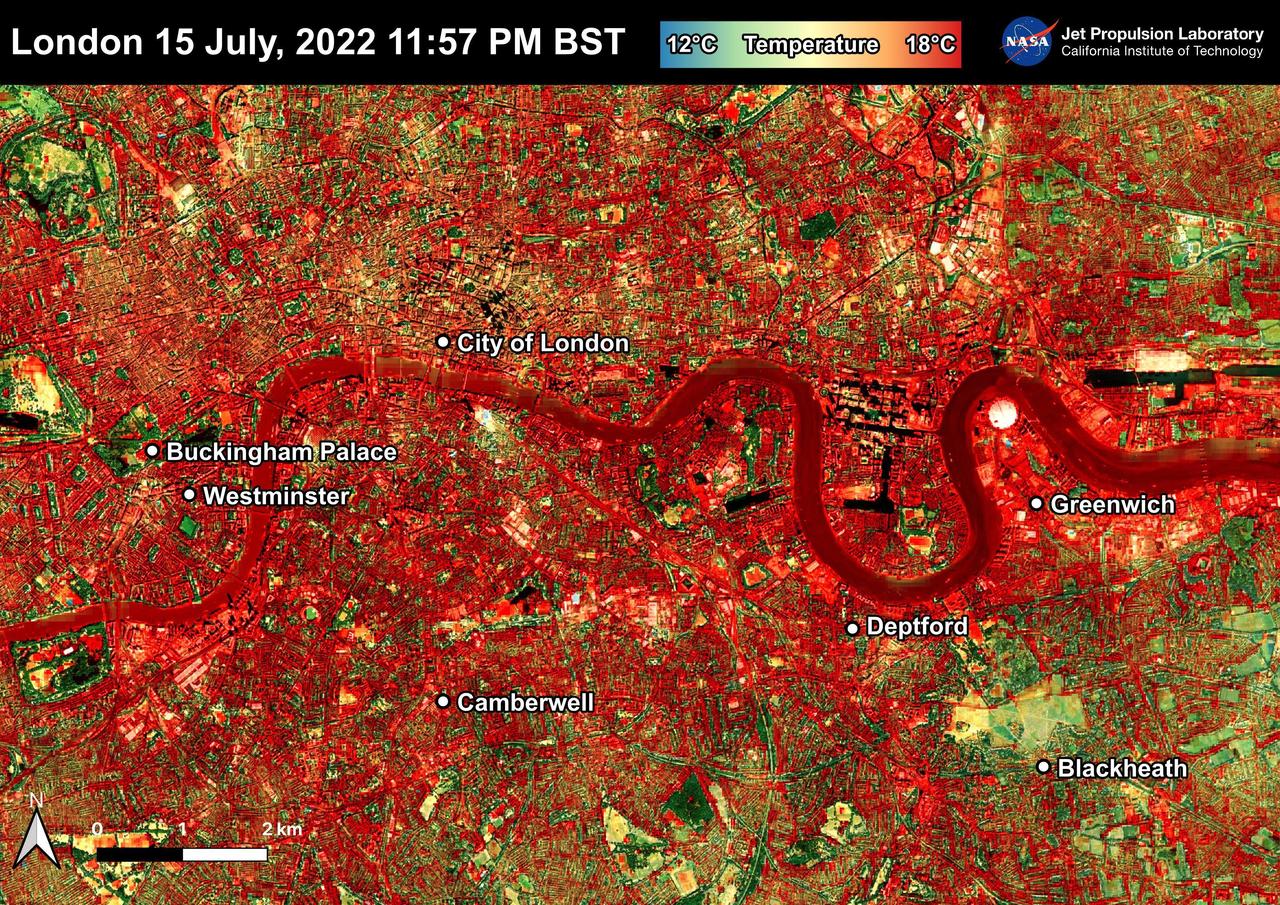
NASA's Ecosystem Spaceborne Thermal Radiometer Experiment on Space Station (ECOSTRESS) instrument recorded this image of ground surface temperatures in London and surrounding areas on July 15, 2022, just before midnight local time. It shows surface temperatures exceeding 68 degrees Fahrenheit (20 degrees Celsius) at 11:57 p.m. British Summer Time. Parts of Europe in mid-July experienced a record-breaking heat wave. The United Kingdom reaching its highest air temperature on record on July 19, 104.5 F (40.3 C) in Coningsby, about 110 miles (177 kilometers) north of London, which itself saw a high of 104.3 F (40.2 C) the same day. That evening, the overnight low was also a record-breaker: 78.4 F (25.8 C) at Kenley Airfield in Greater London. In this image, the red areas indicate hotter temperatures commonly associated with developed areas. These surfaces – roofs, paved streets, and other built structures – remain warm long after the sun sets. Blue and green areas indicate cooler areas commonly associated with parks and other natural land surfaces. Because this image was acquired at night, it shows bodies of water being warmer than the land surface. This is because water tends to change temperature more slowly, so its temperature stays elevated long after land surfaces have cooled down. Cities are usually warmer than open land with natural surfaces because of human activities as well as the materials used in building and construction. Streets are often the hottest part of the built environment due to asphalt paving. Dark-colored surfaces absorb more heat from the Sun than lighter-colored ones; asphalt absorbs up to 95% of solar radiation and retains the heat for hours into nighttime. This image overlays ECOSTRESS surface temperature data on a Google satellite map for context. ECOSTRESS measures the temperature of the ground, which is hotter than the air temperature during the daytime. The instrument launched to the space station in 2018. Its primary mission is to identify plants' thresholds for water use and water stress, giving insight into their ability to adapt to a warming climate. However, ECOSTRESS is also useful for documenting other heat-related phenomena, like patterns of heat absorption and retention. Its high-resolution images, with a pixel size of about 225 feet (70 meters) by 125 feet (38 meters), are a powerful tool for understanding our environment. https://photojournal.jpl.nasa.gov/catalog/PIA25423
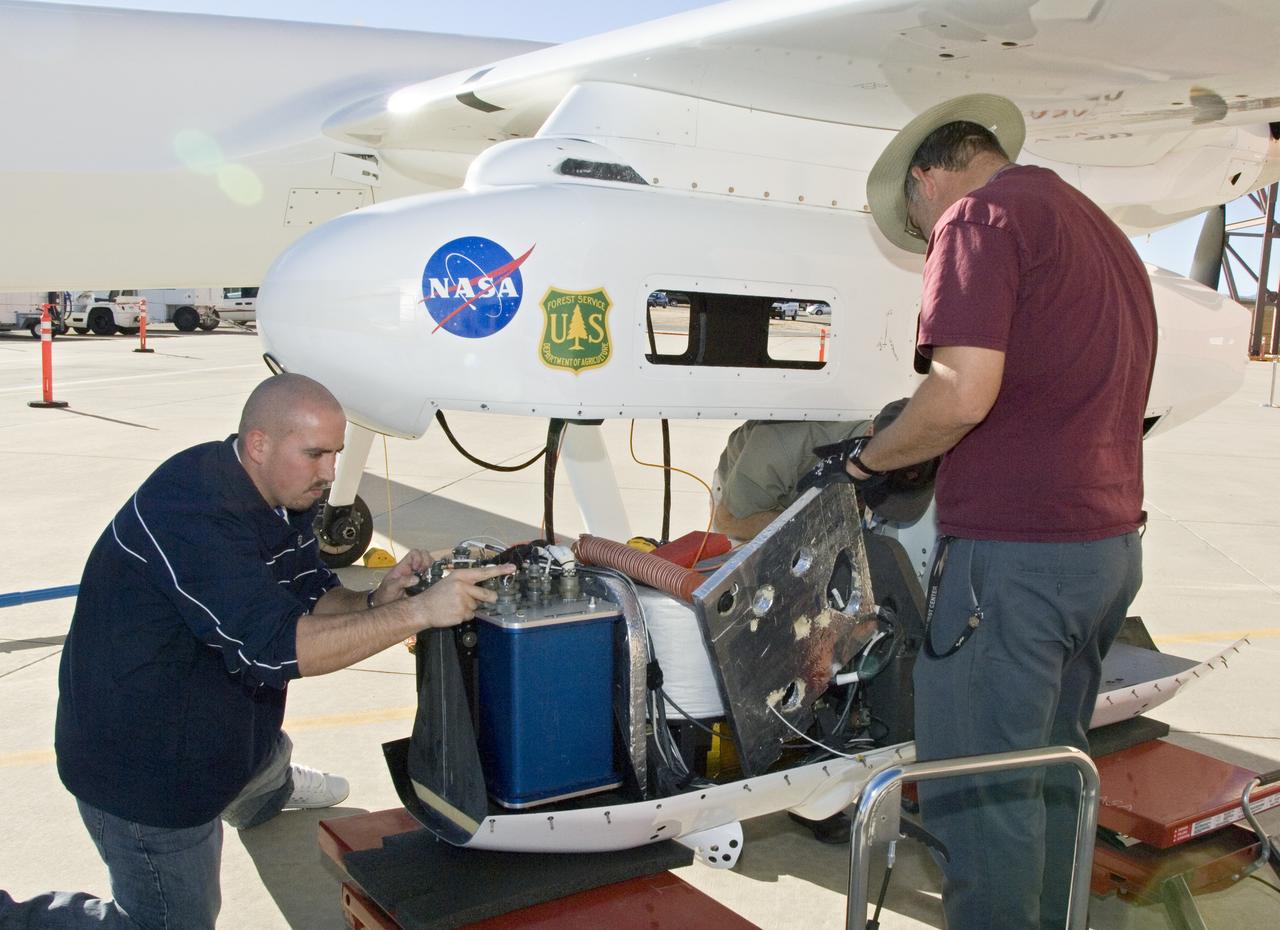
NASA Dryden's Ikhana ground crewmen Gus Carreno and James Smith load the thermal-infrared imaging scanner pallet into the Ikhana's underwing payload pod.

With smoke from the Lake Arrowhead area fires streaming in the background, NASA's Ikhana unmanned aircraft heads out on a Southern California wildfires imaging mission.

With smoke from the Lake Arrowhead area fires streaming in the background, NASA's Ikhana unmanned aircraft heads out on a Southern California wildfires imaging mission.
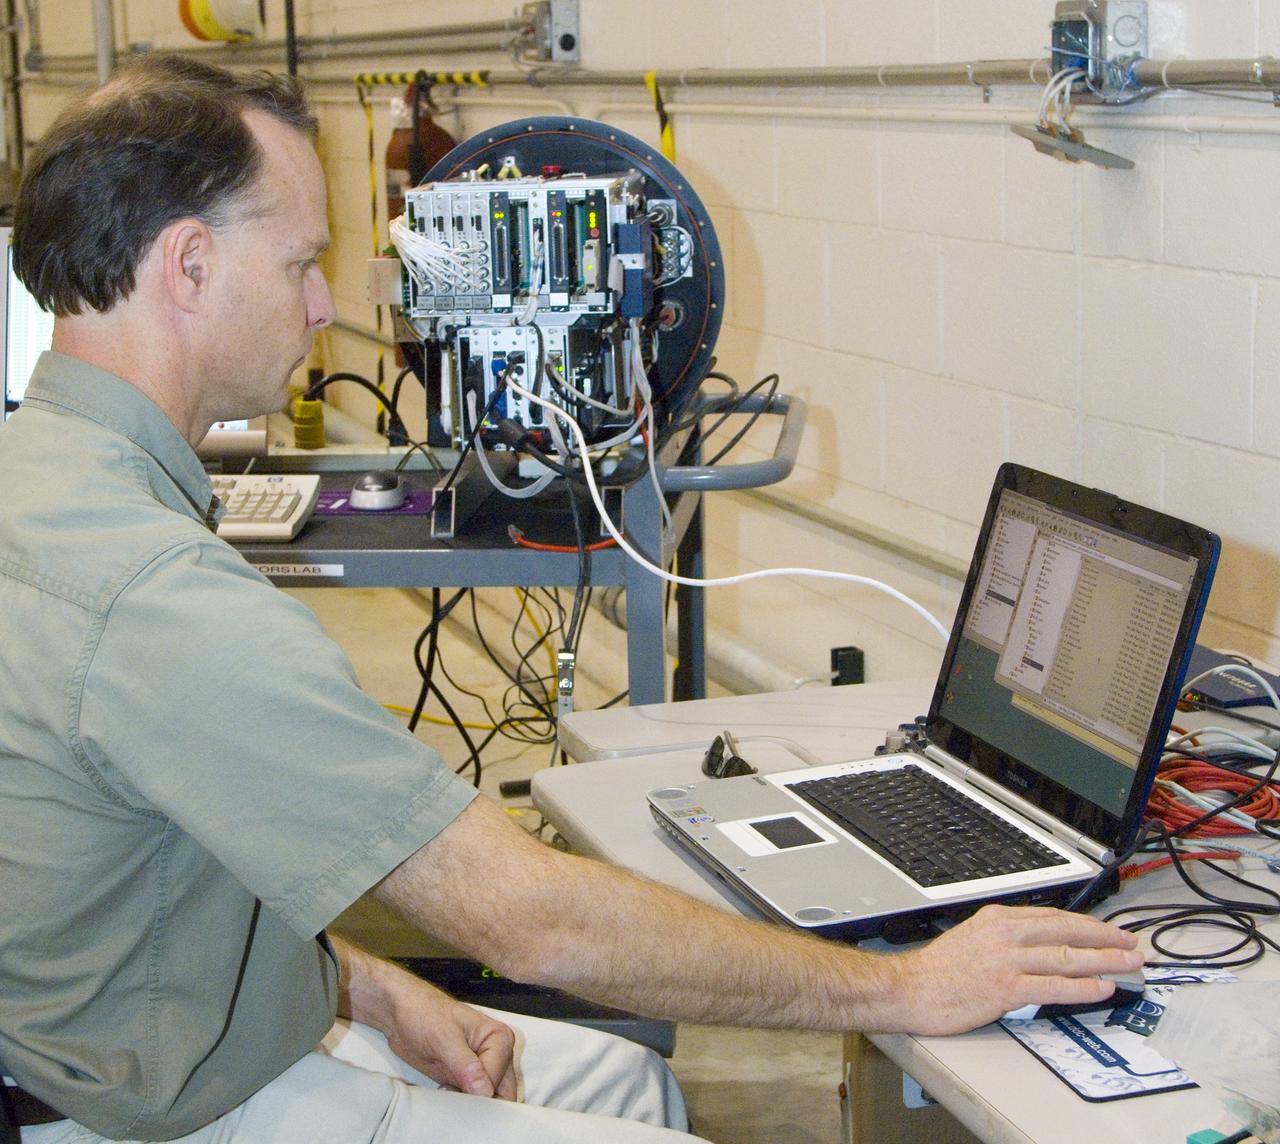
NASA Ames engineer Ted Hildum checks out the thermal-infrared scanner computer before it is loaded on NASA's Ikhana unmanned aircraft.