
STS040-77-045 (6 June 1991) --- This image, photographed on June 6, 1991, is an oblique view looking north-northeast and shows most of the Great Lakes region. Part of Columbia's cargo bay and the Spacelab Life Sciences (SLS-1) module are in the foreground. In the center of the image is Lake Michigan with Chicago clearly visible along the southwest shore. According to NASA photo experts studying the STS-40 imagery, this image shows several interesting meteorological phenomena. The difference in temperature between the warming land and the cold lake waters is illustrated by the low level clouds. The warming land surface results in rising air and the formation of clouds, while the lake waters are cold and result in the lakes remaining cloud free. Also visible is evidence of lake breezes developing around several of the lakes. This phenomena is also driven by the difference in temperature between the land and the water. Winds blowing off the lakes must travel 25 - 30 miles inland before it warms sufficiently to create clouds.
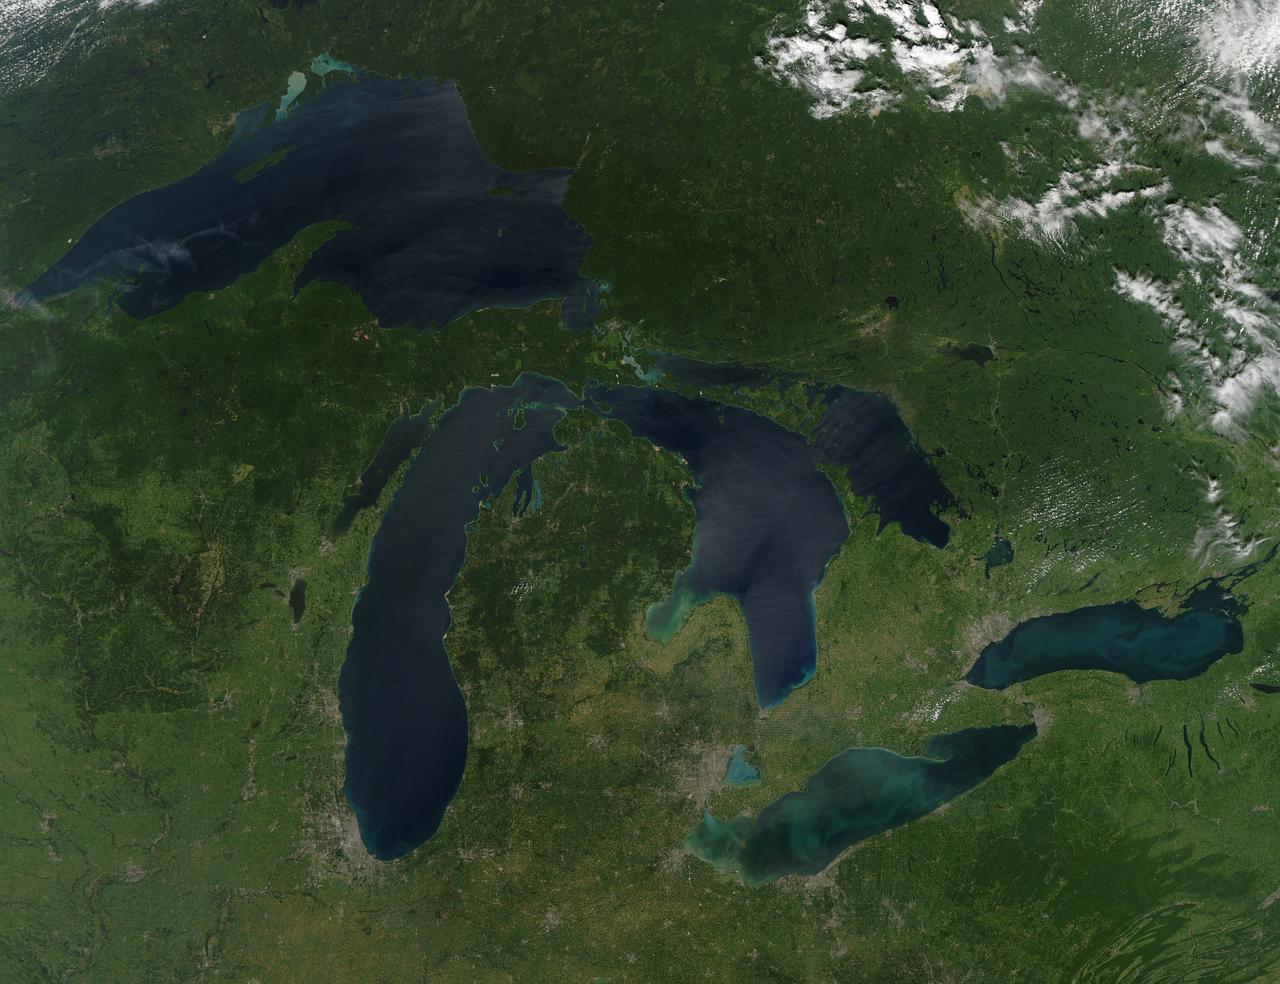
NASA image acquired August 28, 2010 Late August 2010 provided a rare satellite view of a cloudless summer day over the entire Great Lakes region. North Americans trying to sneak in a Labor Day weekend getaway on the lakes were hoping for more of the same. The Great Lakes comprise the largest collective body of fresh water on the planet, containing roughly 18 percent of Earth's supply. Only the polar ice caps contain more fresh water. The region around the Great Lakes basin is home to more than 10 percent of the population of the United States and 25 percent of the population of Canada. Many of those people have tried to escape record heat this summer by visiting the lakes. What they found, according to The Hamilton Spectator, was record-breaking water temperatures fueled by record-breaking air temperatures in the spring and summer. By mid-August, the waters of Lake Superior were 6 to 8°C (11 to 14°F) above normal. Lake Michigan set records at about 4°C (7°F) above normal. The other three Great Lakes – Huron, Erie, and Ontario -- were above normal temperatures, though no records were set. The image was gathered by the Moderate Resolution Imaging Spectroradiometer (MODIS) on NASA’s Aqua satellite at 1:30 p.m. Central Daylight Time (18:30 UTC) on August 28. Open water appears blue or nearly black. The pale blue and green swirls near the coasts are likely caused by algae or phytoplankton blooms, or by calcium carbonate (chalk) from the lake floor. The sweltering summer temperatures have produced an unprecedented bloom of toxic blue-green algae in western Lake Erie, according to the Cleveland Plain Dealer. NASA image by Jeff Schmaltz, MODIS Rapid Response Team, Goddard Space Flight Center. Caption by Mike Carlowicz. Instrument: Aqua - MODIS Click here to see more images from <b><a href="#//earthobservatory.nasa.gov/" rel="nofollow"> NASA Goddard’s Earth Observatory</a></b> <b><a href="http://www.nasa.gov/centers/goddard/home/index.html" rel="nofollow">NASA Goddard Space Flight Center</a></b> is home to the nation's largest organization of combined scientists, engineers and technologists that build spacecraft, instruments and new technology to study the Earth, the sun, our solar system, and the universe. <b>Follow us on <a href="http://twitter.com/NASA_GoddardPix" rel="nofollow">Twitter</a></b> <b>Join us on <a href="http://www.facebook.com/pages/Greenbelt-MD/NASA-Goddard/395013845897?ref=tsd" rel="nofollow">Facebook</a></b>

STS084-710-098 (15-24 May 1997) --- A rare view of the Great Lakes captured in one frame. The Great Lakes region is home to 8.5 million Canadians and 32.5 million Americans. At center is Lake Huron and Georgian Bay. Above Lake Huron and towards the horizon is Lake Michigan, the only Great Lake to be located entirely within the United States. To the right of Lake Michigan, and partially under clouds, is Lake Superior the second largest lake in the world after the Caspian Sea. Lake Erie is located to the left of Lake Huron. Next to Lake Erie is Lake Ontario. According to geologists, the Great Lakes were created by glacial processes that began about 1,000,000 years ago.
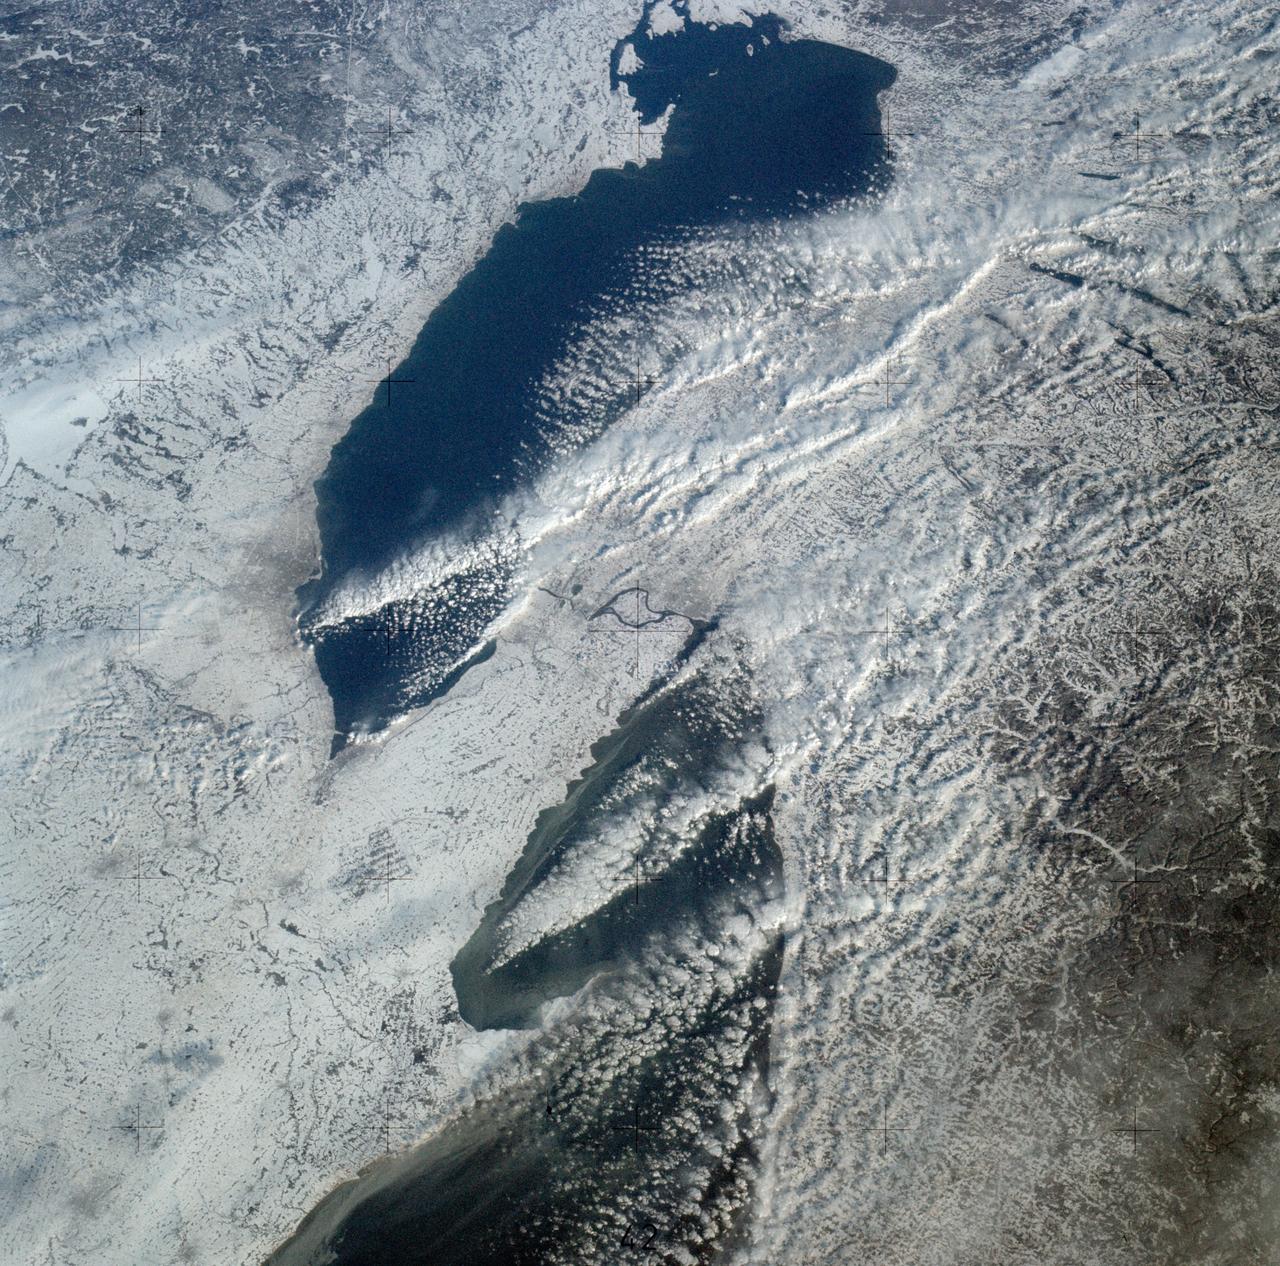
SL4-139-3989 (February 1974) --- An oblique view of a portion of the Great Lakes area as seen from the Skylab space station in Earth orbit. This picture was taken with a hand-held 70mm Hasselblad camera. Lake Erie is in the foreground; and Lake Ontario is in the background. The Niagara Falls area is in the center of the photograph. Portions of Pennsylvania, New York, and Ontario, Canada are visible, but under nearly complete snow cover. Major structural features, drainage patterns, road systems and the cities of Buffalo and Toronto are easily distinguished and actually enhanced by the snow. At the time this picture was taken, these two Great Lakes had no observable ice, although cloud formations partially mask the southern shores of the two bodies of water. James Barnes, a snow-pattern expert, will analyze Skylab photographs like this one to gain further knowledge of snow cover over land masses. Photo credit: NASA
ISS036-E-035635 (24 Aug. 2013) --- Plankton bloom and Lake Ontario are featured in this image photographed by an Expedition 36 crew member on the International Space Station. This photograph highlights a late summer plankton bloom visible throughout much of Lake Ontario (one of the Great Lakes, together with Michigan, Superior, Erie, and Huron). Cyanobacteria, or blue-green algae, can reach such large concentrations that they color the water to such an extent that the change is visible from orbit. Harmful algal blooms, or HABs, have been observed in all of the Great Lakes – particularly Lake Erie - and are associated with a variety of causative factors including changes in precipitation; drought; invasive species (quagga, zebra mussels, Asian carp); nutrient loading from runoff and sewage (nitrogen and phosphorus); and warmer average temperatures. In addition to reduced water quality and human health concerns, algal blooms can also lead to hypoxia (reduction of oxygen in the bottom waters) that kills large numbers of fish and other aquatic life. Lake Ontario, like the other Great Lakes Erie, Huron, and Superior is roughly divided between the USA and Canada. The USA side of Lake Ontario has its shoreline along the state of New York, while its Canadian shoreline lies within the province of Ontario. The city of Kingston, Ontario, is visible near the Saint Lawrence River outflow from the lake. Several other landscape features of New York State are visible in the image, including the Finger Lakes region to the west of Syracuse, NY (upper left). To the northeast of Syracuse, the dark wooded slopes of the Adirondack Mountains are visible at lower right. Patchy white cloud cover obscures much of the land surface to the west of Lake Ontario.
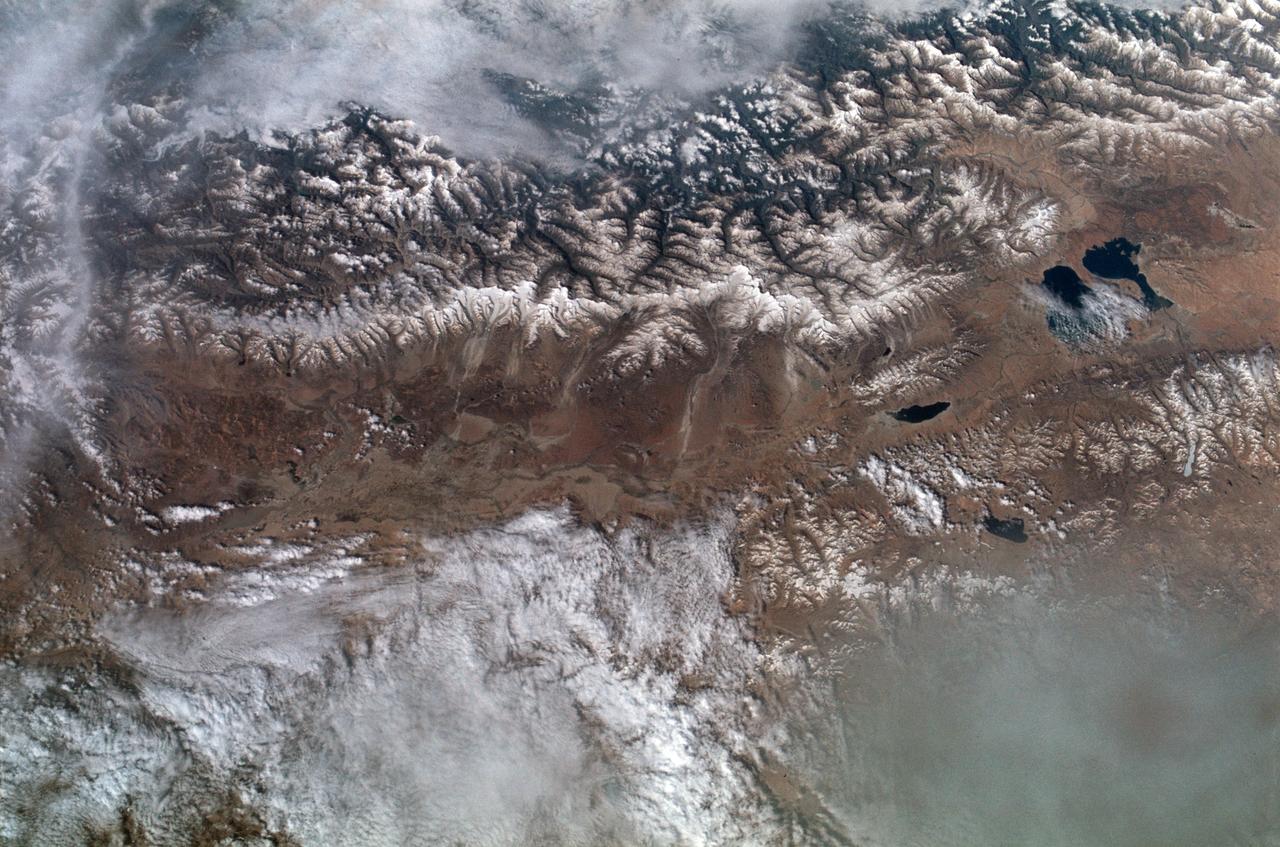
SL2-102-900 (22 June 1973) --- The Great Himalayan Mountain Range, India/Tibet (30.5N, 81.5E) is literally the top of the world where mountains soar to over 20,000 ft. effectively isolating Tibet from the rest of the world. The two lakes seen in the center of the image are the Laga Co and the Kunggyu Co located just inside the Tibet border. Although clouds and rainfall are rare in this region, snow is always present on the mountain peaks. Photo credit: NASA

ISS030-E-062540 (2 Feb. 2012) --- This nighttime image, photographed by one of the members of the Expedition 30 crew from the International Space Station, features the Greater Chicago Metropolitan Area strung along the southwest shore of Lake Michigan. The region is partially covered by clouds, probably low-hanging, or even fog. Meteorologists say there is a fine line between low thin clouds and fog. Fog is not common in the Great Lakes area this time of the year (usually too windy), but this has been an exceptionally mild winter. The faint gold line of airglow—caused by ultraviolet radiation exciting the gas molecules in the upper atmosphere—parallels the horizon or Earth limb. Minor auroral activity (Borealis) is visible in upper right.
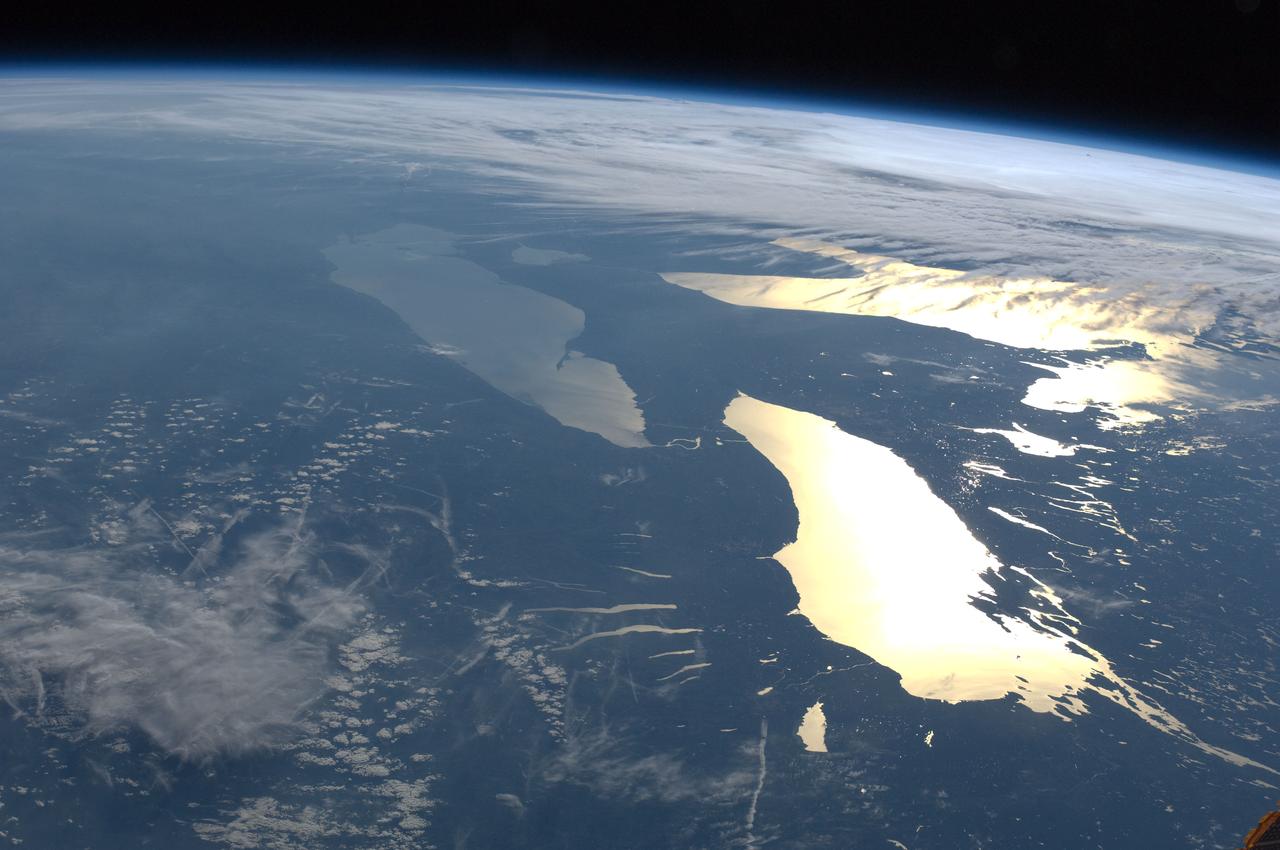
ISS031-E-123071 (14 June 2012) --- The Great Lakes in sunglint are featured in this image photographed by an Expedition 31 crew member on the International Space Station. From the vantage point of the space station, crew members observe many spectacular phenomena including aurora, noctilucent clouds, airglow, and sunglint on Earth?s water bodies. Sunglint is light reflected off of a water surface towards the observer such that it creates the appearance of a mirror-like surface. If the viewing and lighting conditions are ideal, that mirror-like surface can extend over very large areas, such as the entire surface of Lake Ontario (approximately 18,960 square kilometers). This photograph was taken while the space station was located over a point to the southeast of Nova Scotia (approximately 1,200 kilometers ground distance from the center point of the image). Lake Ontario, Lake Huron, the Finger Lakes of upstate New York, and numerous other bodies of water appear brilliantly lit by sunglint. To the west, Lake Erie is also highlighted by sunglint, but less light is being reflected back towards the observer resulting in a duller appearance. Much of central Canada is obscured by extensive cloud cover in the image, whereas a smaller grouping of clouds obscures the Appalachian range and Pennsylvania (lower left). The blue envelope of Earth?s atmosphere is visible above the curved limb, or horizon line that extends across the upper third of the image. Such panoramic views of the planet are readily taken through space station viewing ports with handheld digital cameras which allow the crew to take advantage of the full range of viewing angles.
![ISS040-E-093914 (14 Aug. 2014) --- One of the Expedition 40 crew members aboard the International Space Station, flying at an altitude of 219 nautical miles, recorded this oblique panorama of much of the eastern seaboard from the northern tip of New York's Long Island (loer right) southward into the Carolinas. Some of the Great Lakes would be visible in the background were it not for heavy cloud cover. [Note: After the change of command onboard the orbital outpost, the Expedition 41 crew members one month later took a night photograph (ISS041e016740) of this basic area along the Atlantic Coast, featuring night lights of a number of major cities.]](https://images-assets.nasa.gov/image/iss040e093914/iss040e093914~medium.jpg)
ISS040-E-093914 (14 Aug. 2014) --- One of the Expedition 40 crew members aboard the International Space Station, flying at an altitude of 219 nautical miles, recorded this oblique panorama of much of the eastern seaboard from the northern tip of New York's Long Island (loer right) southward into the Carolinas. Some of the Great Lakes would be visible in the background were it not for heavy cloud cover. [Note: After the change of command onboard the orbital outpost, the Expedition 41 crew members one month later took a night photograph (ISS041e016740) of this basic area along the Atlantic Coast, featuring night lights of a number of major cities.]

A Grumman OV-1B Mohawk maps Great Lakes’ ice flows for the National Aeronautics and Space Administration (NASA) Lewis Research Center in Cleveland, Ohio. The regular freezing of large portions of the Great Lakes during the winter frequently stalled the region’s shipping industry. Lewis developed two complementary systems to monitor the ice. The Side Looking Airborne Radar (SLAR) system used microwaves to measure the ice distribution, and electromagnetic systems employed noise modulation to determine the thickness of the ice. Once this dual system was in place, the information could be generated during a single pass of a research aircraft and quickly distributed to ship captains planning their routes. The SLAR was superior to aerial photography for this task because it was able to penetrate cloud cover. The SLAR system used pulsed microwaves to examine a band of ice or water on either side of the aircraft up to 31 miles wide. The Lewis ice mapping devices were first tested during the winter of 1972 and 1973. The system was installed on the tail of the Coast Guard’s OV-1B aircraft. An infrared thermal mapping instrument was installed on Lewis’ DC-3 to determine the ice temperature and estimate its thickness. The team created 160 ice charts that were sent to 28 ships and 2 icebreakers. Shipping was able to continue throughout the season for the first time that winter.
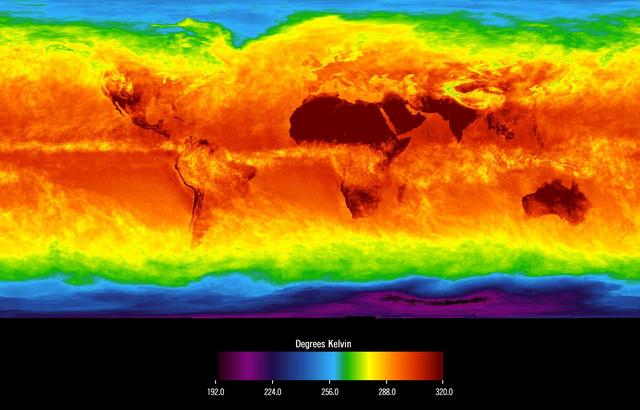
This image shows average temperatures in April, 2003, observed by AIRS at an infrared wavelength that senses either the Earth's surface or any intervening cloud. Similar to a photograph of the planet taken with the camera shutter held open for a month, stationary features are captured while those obscured by moving clouds are blurred. Many continental features stand out boldly, such as our planet's vast deserts, and India, now at the end of its long, clear dry season. Also obvious are the high, cold Tibetan plateau to the north of India, and the mountains of North America. The band of yellow encircling the planet's equator is the Intertropical Convergence Zone (ITCZ), a region of persistent thunderstorms and associated high, cold clouds. The ITCZ merges with the monsoon systems of Africa and South America. Higher latitudes are increasingly obscured by clouds, though some features like the Great Lakes, the British Isles and Korea are apparent. The highest latitudes of Europe and Eurasia are completely obscured by clouds, while Antarctica stands out cold and clear at the bottom of the image. http://photojournal.jpl.nasa.gov/catalog/PIA00427

NOAA's GOES-East satellite provided a look at the frigid eastern two-thirds of the U.S. on Jan. 7, 2015, that shows a blanket of northern snow, lake-effect snow from the Great Lakes and clouds behind the Arctic cold front. A visible picture captured at 1600 UTC (11 a.m. EST) showed the effects of the latest Arctic outbreak. The cold front that brought the Arctic air has moved as far south as Florida, and stretches back over the Gulf of Mexico and just west of Texas today. The image shows clouds behind the frontal boundary stretching from the Carolinas west over the Heartland. Farther north, a wide band of fallen snow covers the ground from New England west to Montana, with rivers appearing like veins. The GOES-East satellite image also shows wind-whipped lake-effect snows off the Great Lakes, blowing to the southeast. Meanwhile, Florida, the nation's warm spot appeared almost cloud-free. To create the image, NASA/NOAA's GOES Project used cloud data from NOAA's GOES-East satellite and overlaid it on a true-color image of land and ocean created by data from the Moderate Resolution Imaging Spectroradiometer, or MODIS, instrument that flies aboard NASA's Aqua and Terra satellites. Together, those data created the entire picture of the Arctic outbreak. The forecast from NOAA's National Weather Service Weather Prediction Center (WPC) calls for more snow along the Appalachian Mountains from Tennessee north to upstate New York. Snow is also expected to fall from New England west to Montana, and in eastern New Mexico and the Colorado Rockies. The WPC summary for Jan. 7 noted: Bitter cold will be felt from the western High Plains to the Mid-Atlantic and Northeast U.S. for the next few days. Widespread subzero overnight lows are forecast for the Dakotas, Upper Midwest, Great Lakes, and interior New England. Wind Chill Advisories and Warnings are in effect for many of these areas. GOES-East provides visible and infrared images over the eastern U.S. and the Atlantic Ocean from its fixed orbit in space. NOAA's GOES satellites provide the kind of continuous monitoring necessary for intensive data analysis. Geostationary describes an orbit in which a satellite is always in the same position with respect to the rotating Earth. This allows GOES to hover continuously over one position on Earth's surface, appearing stationary. As a result, GOES provide a constant vigil for the atmospheric triggers for severe weather conditions such as tornadoes, flash floods, hail storms and hurricanes. For updated information about the storm system, visit NOAA's NWS website: <a href="http://www.weather.gov" rel="nofollow">www.weather.gov</a> For more information about GOES satellites, visit: <a href="http://www.goes.noaa.gov/" rel="nofollow">www.goes.noaa.gov/</a> or goes.gsfc.nasa.gov/ Rob Gutro NASA's Goddard Space Flight Center, Greenbelt, Md. <b><a href="http://www.nasa.gov/audience/formedia/features/MP_Photo_Guidelines.html" rel="nofollow">NASA image use policy.</a></b> <b><a href="http://www.nasa.gov/centers/goddard/home/index.html" rel="nofollow">NASA Goddard Space Flight Center</a></b> enables NASA’s mission through four scientific endeavors: Earth Science, Heliophysics, Solar System Exploration, and Astrophysics. Goddard plays a leading role in NASA’s accomplishments by contributing compelling scientific knowledge to advance the Agency’s mission. <b>Follow us on <a href="http://twitter.com/NASAGoddardPix" rel="nofollow">Twitter</a></b> <b>Like us on <a href="http://www.facebook.com/pages/Greenbelt-MD/NASA-Goddard/395013845897?ref=tsd" rel="nofollow">Facebook</a></b> <b>Find us on <a href="http://instagram.com/nasagoddard?vm=grid" rel="nofollow">Instagram</a></b>
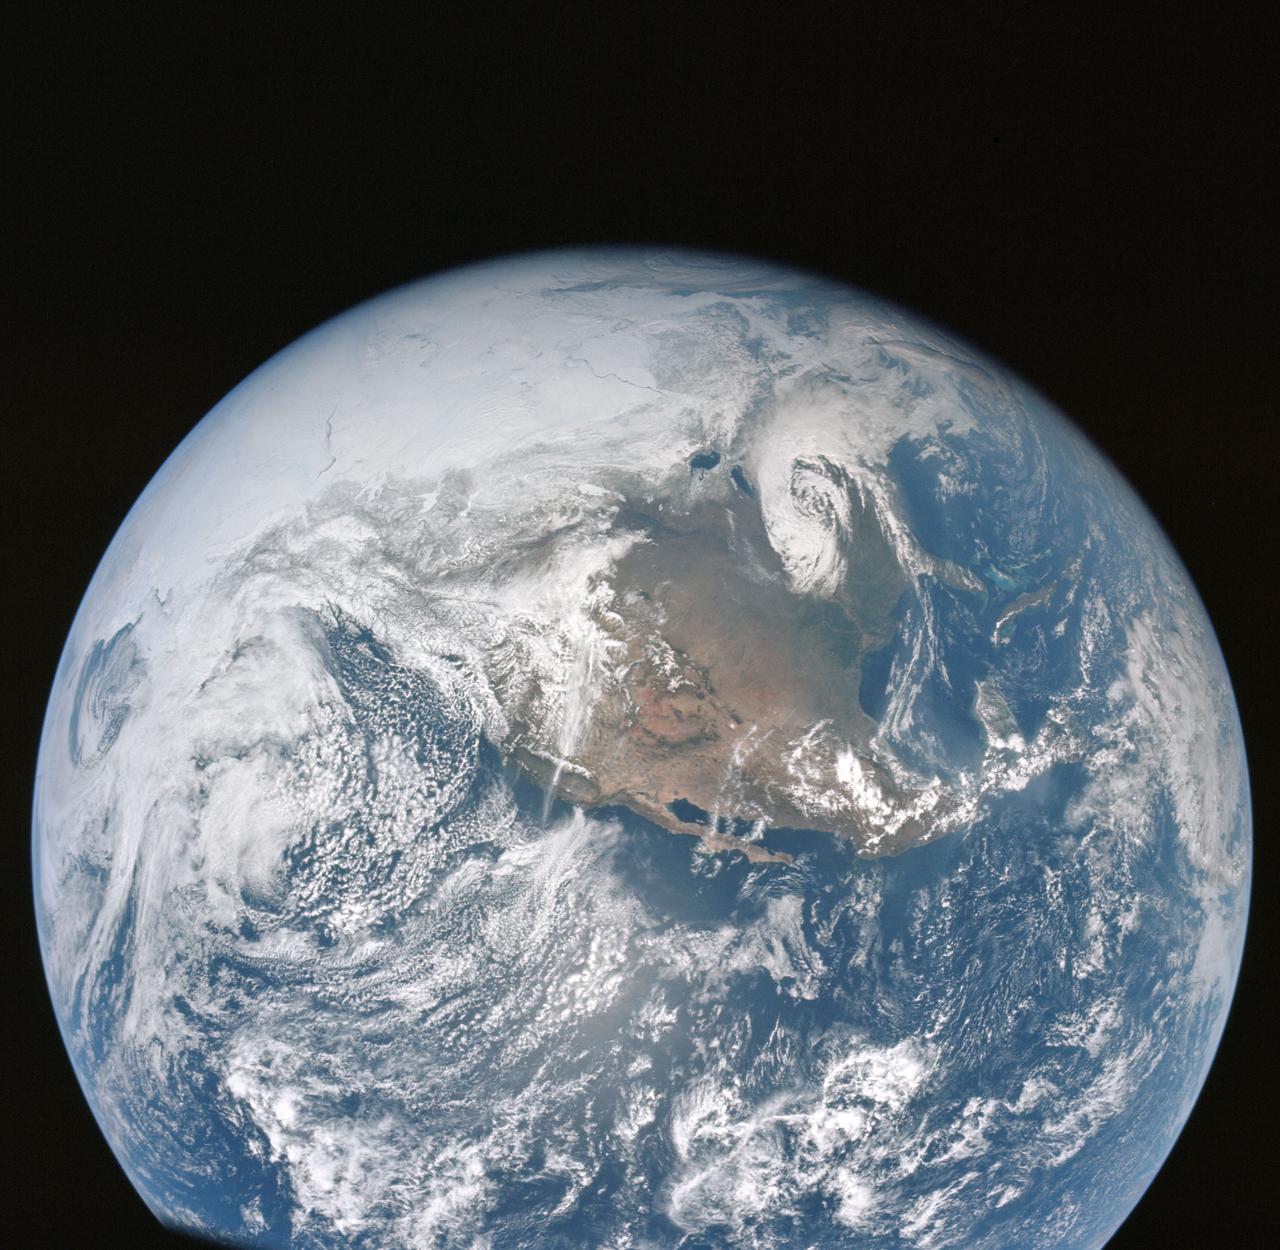
AS16-118-18880 (16 April 1972) --- A good view of Earth photographed about one hour after trans-lunar injection on April 16, 1972. Although there is much cloud cover, the United States in large part, most of Mexico and some of Central America are clearly visible. Note the Great Lakes (Michigan and Superior) and the Bahama Banks (note different shade of blue below Florida). While astronauts John W. Young, commander, and Charles M. Duke Jr., lunar module pilot, descended in the Lunar Module (LM) "Orion" to explore the Descartes highlands region of the moon, astronaut Thomas K. (Ken) Mattingly II, command module pilot, remained with the Command and Service Modules (CSM) "Casper" in lunar orbit.
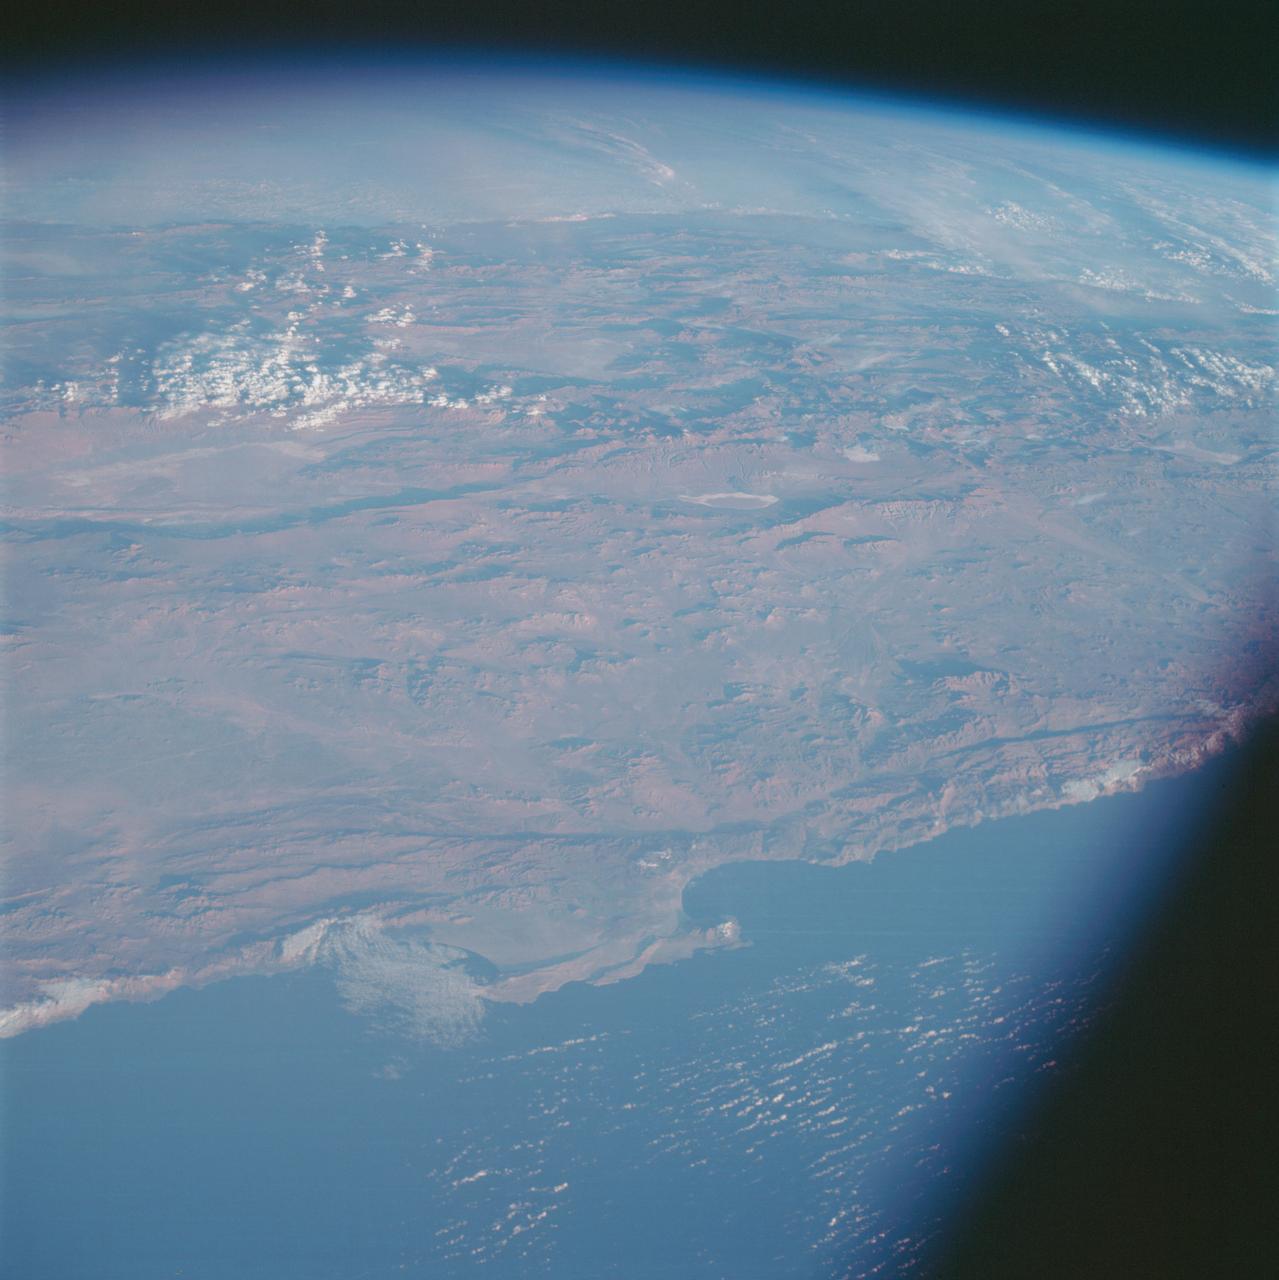
AS07-07-1826 (17 Oct. 1968) --- This view of South America was photographed from the Apollo 7 spacecraft during its 81st revolution of Earth from an altitude of 120 nautical miles. The port city of Antofagasta, Chile, is located in the half-moon shaped bay in the lower left portion of the picture. Beyond the coast is the Andean peak of Llullaillaco Volcano which rises 22,000 feet above sea level. At left center is the Chuquicamata copper mines located near Coloma. At the center of the photo, behind the large salt lake and atop a 19,000 foot high volcano, the countries of Bolivia, Argentina, and Chile meet at a common point. Below the clouds in the upper portion of the photo are the Great Plains known as the Gran Chaco.
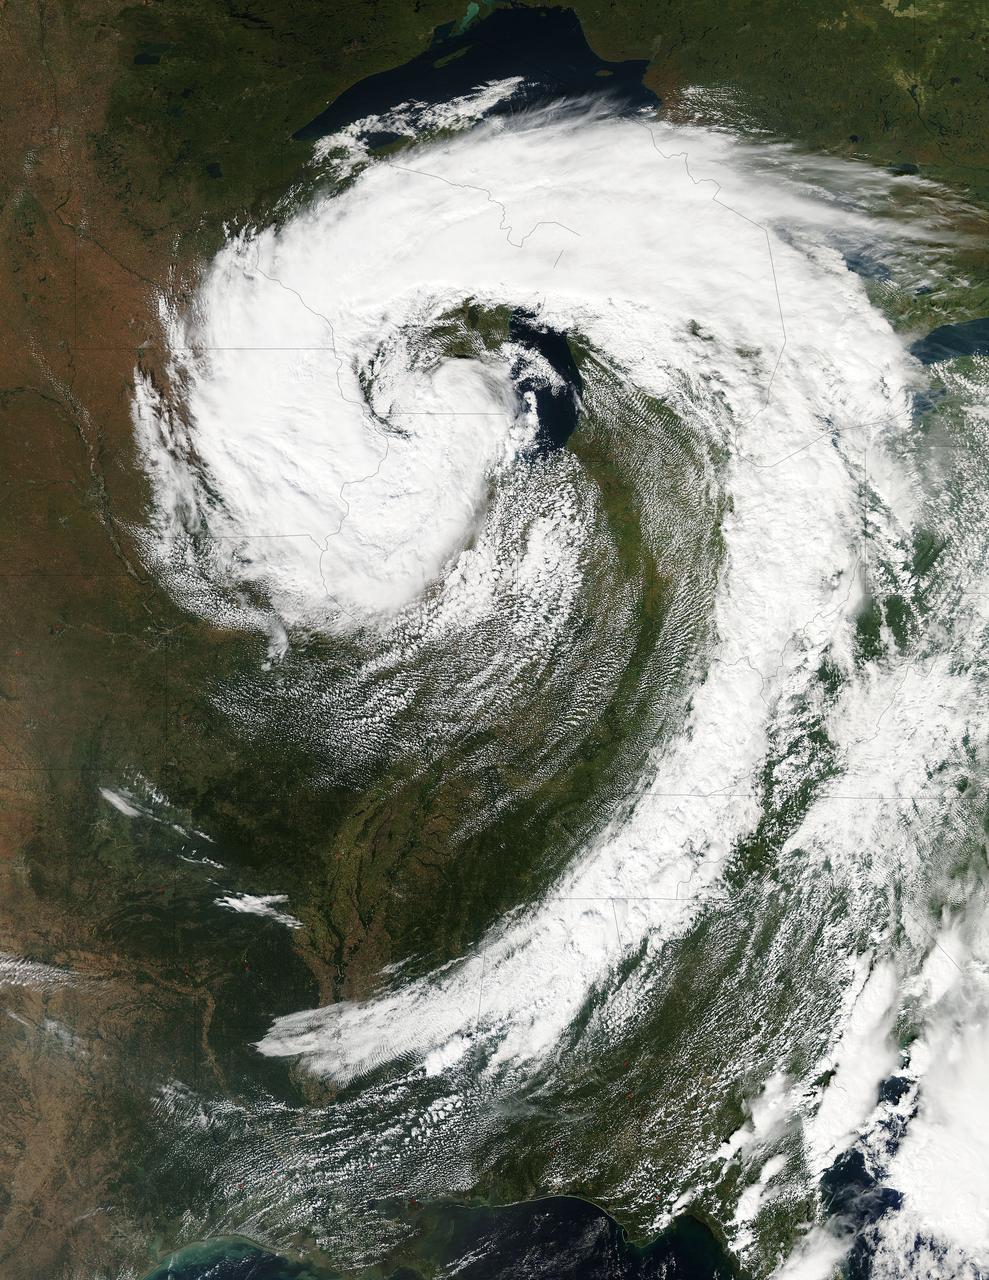
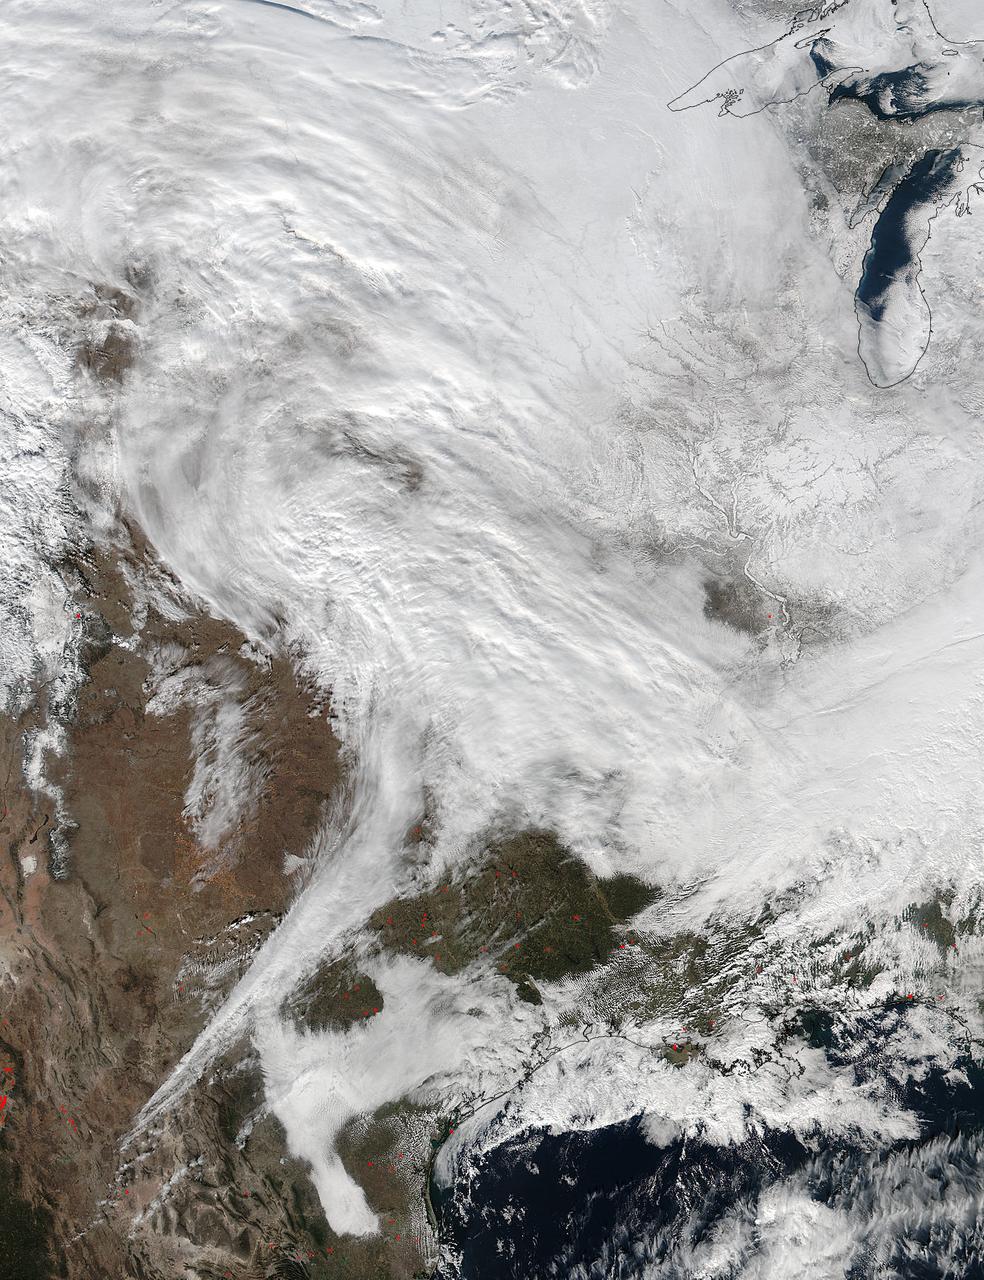
This visible image of the Great Lakes low pressure area was taken from the Moderate Resolution Imaging Spectroradiometer (MODIS) instrument on NASA's Aqua satellite. It was taken at 19:05 UTC (3:05 p.m. EDT) on Monday, Sept. 26, 2011. Credit: NASA Goddard MODIS Rapid Response Team Two Instruments on NASA's Aqua Satellite Catch the Pesky Great Lakes Low A low pressure area has been sitting over the Great Lakes region for about a week now, keeping the region and the U.S. northeast and Mid-Atlantic under cloud cover. NASA's Aqua satellite flew over head yesterday, Sept. 26, and captured two views of it from space. That low pressure area continues to spin counter-clockwise today over the Great Lakes. Its centered over northern Illinois and southeastern Wisconsin and is once again going to keep the region cloudy, cool and wet with showers. When the Aqua satellite passed overhead Monday afternoon at 3:05 p.m. EDT (Sept. 26) a detailed, clear image was captured from the Moderate Resolution Imaging Spectroradiometer (MODIS) instrument . The clouds from the low spread over Illinois, Wisconsin, parts of Iowa, northeastern Missouri, southeastern Minnesota, Michigan, Ohio, Indiana, Pennsylvania, Kentucky, Tennessee, Alabama, Mississippi, Georgia, and the northeastern and Mid-Atlantic states. A second visible image was captured by the Atmospheric Infrared Sounder (AIRS) instrument that also flies aboard NASA's Aqua satellite and showed the huge comma shape of the storm that spans the U.S. from its northern to southern borders. (seen here: <a href="http://www.flickr.com/photos/gsfc/6188946564">www.flickr.com/photos/gsfc/6188946564</a> ) According to the National Weather Service, the low will finally start moving to the east as an upper-atmospheric trough (an elongated area of low pressure) continues to strengthen and move into the upper Midwest. However, a ridge (elongated area) of high pressure will slow its move eastward, so it will be slow clearing this week in the northeastern and Mid-Atlantic U.S. Rob Gutro NASA's Goddard Space Flight Center <b><a href="http://www.nasa.gov/audience/formedia/features/MP_Photo_Guidelines.html" rel="nofollow">NASA image use policy.</a></b> <b><a href="http://www.nasa.gov/centers/goddard/home/index.html" rel="nofollow">NASA Goddard Space Flight Center</a></b> enables NASA’s mission through four scientific endeavors: Earth Science, Heliophysics, Solar System Exploration, and Astrophysics. Goddard plays a leading role in NASA’s accomplishments by contributing compelling scientific knowledge to advance the Agency’s mission. <b>Follow us on <a href="http://twitter.com/NASA_GoddardPix" rel="nofollow">Twitter</a></b> <b>Like us on <a href="http://www.facebook.com/pages/Greenbelt-MD/NASA-Goddard/395013845897?ref=tsd" rel="nofollow">Facebook</a></b> <b>Find us on <a href="http://instagrid.me/nasagoddard/?vm=grid" rel="nofollow">Instagram</a></b>
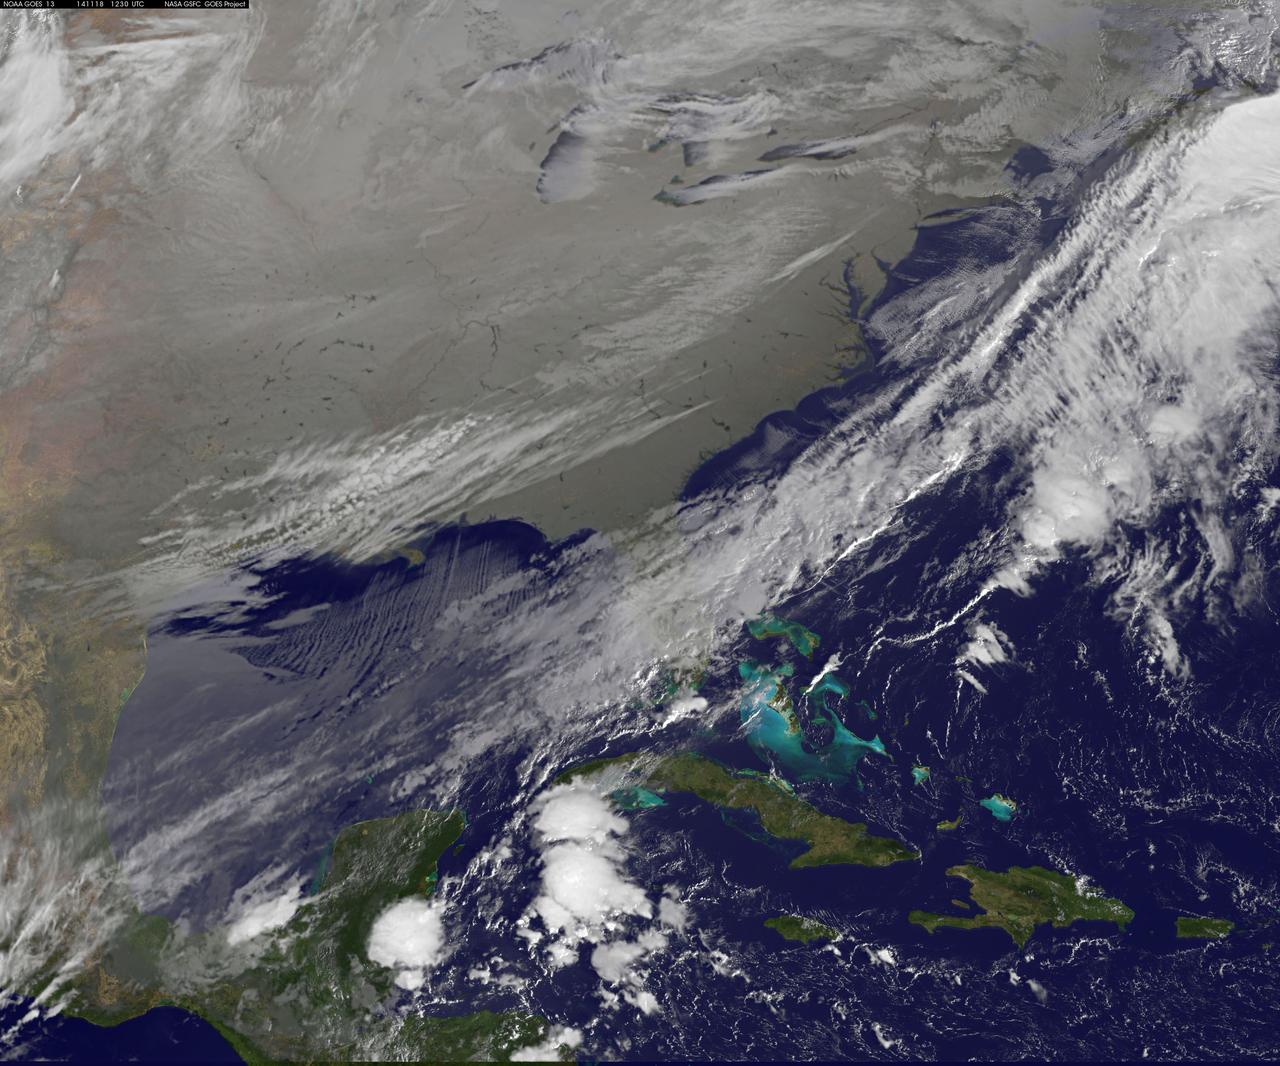
As icy cold Canadian air settled over the eastern two-thirds of the U.S. bringing snow and bitter cold, NOAA's GOES-East satellite captured this infrared view of what looks like a frozen blanket over the region. NOAA's GOES-East satellite provides visible and infrared images over the eastern U.S. and the Atlantic Ocean from its fixed orbit in space. In an infrared image taken on Nov. 18 at 12:30 UTC (7:30 a.m. EST), the cold air over the eastern and central U.S. appears to look like a blanket of white, but it's not all snow. Infrared data shows temperature, so although the eastern two-thirds of the U.S. appears to appear is if snow covers the ground, the blanket is in fact cold clouds. However, snow does lie under that blanket in the Upper Midwest, Ohio Valley, and Canada, where it will continue in those areas through Thursday, Nov. 20. "Dozens of lakes behind dams in the Southeast USA stand out as dark spots in a grey landscape," said Dennis Chesters of NASA/NOAA's GOES Project at NASA's Goddard Space Flight Center in Greenbelt, Md. "That is because we invert the display of infrared emission to make cold cloud tops appear white, frozen land grey, and warm water dark." NOAA's National Weather Service Weather Prediction Center said that the deep low pressure system pushing that polar air over the Eastern U.S. is centered over southeastern Canada. On Tuesday, Nov. 18, freeze and frost warnings stretch from the upper Great Lakes to Florida. Some areas in the Upper Great Lakes are forecast to receive over two feet of snow. Well below average temperatures are forecast to reach the Gulf Coast, with most of the Mid-Atlantic States barely getting above freezing Tuesday and Wednesday. In the Midwest, periods of lake effect snow are forecast to continue south and east of the Great Lakes through Wednesday. Read more: <a href="http://www.nasa.gov/content/goddard/satellite-view-of-the-us-wrapped-in-a-frozen-blanket/index.html#.VGuxFd6FzeN" rel="nofollow">www.nasa.gov/content/goddard/satellite-view-of-the-us-wra...</a> <b><a href="http://goes.gsfc.nasa.gov/" rel="nofollow">Credit: NOAA/NASA GOES Project</a></b> <b><a href="http://www.nasa.gov/audience/formedia/features/MP_Photo_Guidelines.html" rel="nofollow">NASA image use policy.</a></b> <b><a href="http://www.nasa.gov/centers/goddard/home/index.html" rel="nofollow">NASA Goddard Space Flight Center</a></b> enables NASA’s mission through four scientific endeavors: Earth Science, Heliophysics, Solar System Exploration, and Astrophysics. Goddard plays a leading role in NASA’s accomplishments by contributing compelling scientific knowledge to advance the Agency’s mission. <b>Follow us on <a href="http://twitter.com/NASAGoddardPix" rel="nofollow">Twitter</a></b> <b>Like us on <a href="http://www.facebook.com/pages/Greenbelt-MD/NASA-Goddard/395013845897?ref=tsd" rel="nofollow">Facebook</a></b> <b>Find us on <a href="http://instagram.com/nasagoddard?vm=grid" rel="nofollow">Instagram</a></b>
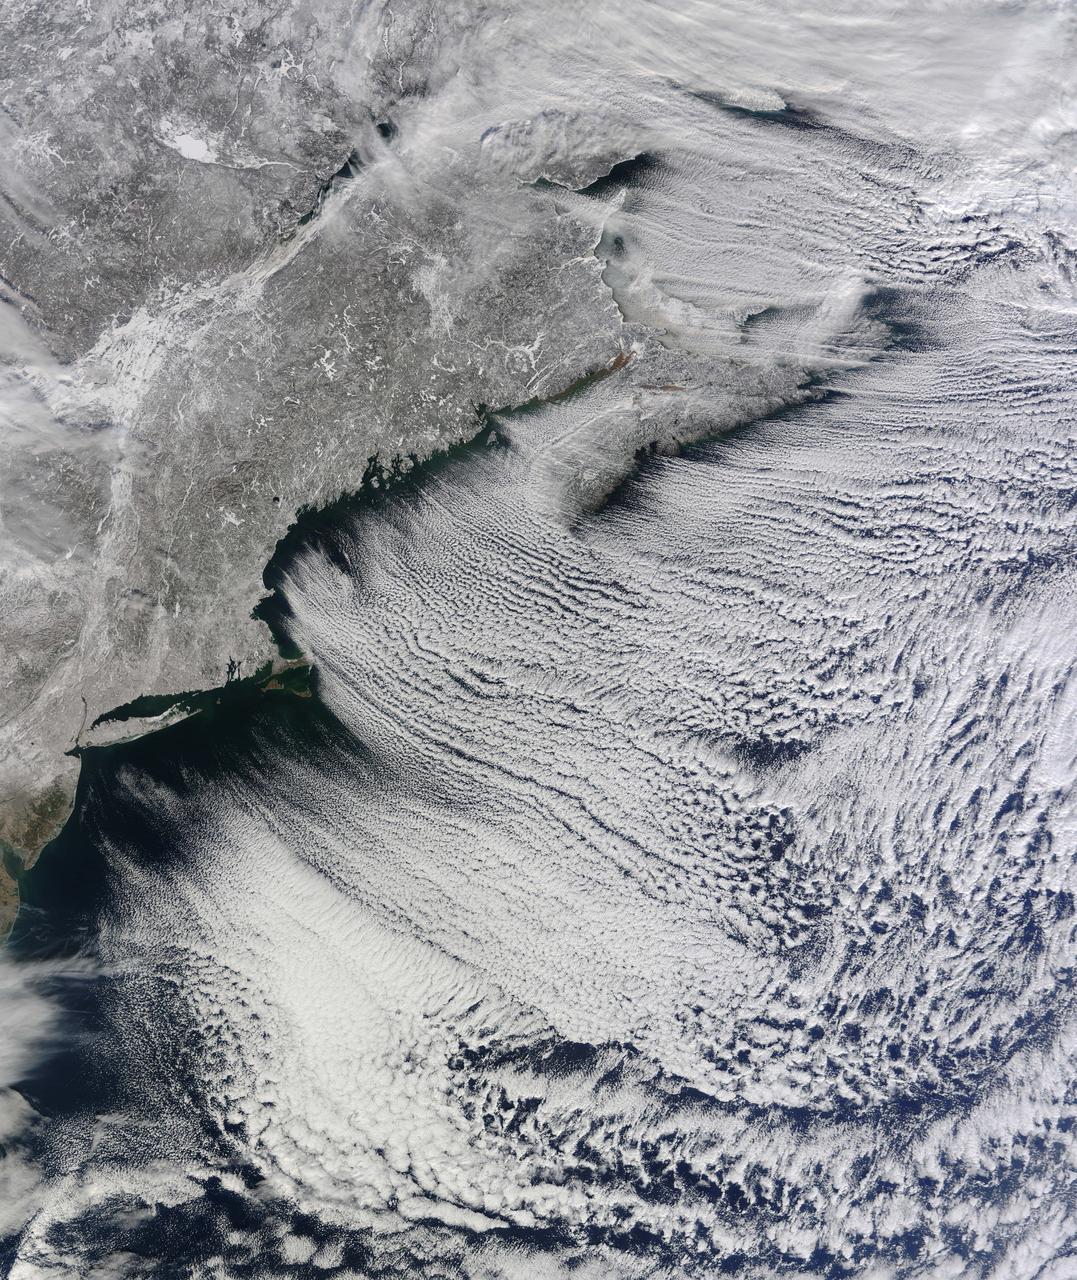
NASA image acquired January 24, 2011 What do you get when you mix below-freezing air temperatures, frigid northwest winds from Canada, and ocean temperatures hovering around 39 to 40 degrees Fahrenheit (4 to 5 degrees Celsius)? Paved highways of clouds across the skies of the North Atlantic. The Moderate Resolution Imaging Spectroradiometer (MODIS) on NASA’s Terra satellite collected this natural-color view of New England, the Canadian Maritimes, and coastal waters at 10:25 a.m. U.S. Eastern Standard Time on January 24, 2011. Lines of clouds stretch from northwest to southeast over the North Atlantic, while the relatively cloudless skies over land afford a peek at the snow that blanketed the Northeast just a few days earlier. Cloud streets form when cold air blows over warmer waters, while a warmer air layer—or temperature inversion—rests over top of both. The comparatively warm water of the ocean gives up heat and moisture to the cold air mass above, and columns of heated air—thermals—naturally rise through the atmosphere. As they hit the temperature inversion like a lid, the air rolls over like the circulation in a pot of boiling water. The water in the warm air cools and condenses into flat-bottomed, fluffy-topped cumulus clouds that line up parallel to the wind. Though they are easy to explain in a broad sense, cloud streets have a lot of mysteries on the micro scale. A NASA-funded researcher from the University of Wisconsin recently observed an unusual pattern in cloud streets over the Great Lakes. Cloud droplets that should have picked up moisture from the atmosphere and grown in size were instead shrinking as they moved over Lake Superior. Read more in an interview at What on Earth? NASA image by Jeff Schmaltz, MODIS Rapid Response Team, Goddard Space Flight Center. Caption by Michael Carlowicz. Instrument: Terra - MODIS Credit: <b><a href="http://www.earthobservatory.nasa.gov/" rel="nofollow"> NASA Earth Observatory</a></b> <b><a href="http://www.nasa.gov/centers/goddard/home/index.html" rel="nofollow">NASA Goddard Space Flight Center</a></b> enables NASA’s mission through four scientific endeavors: Earth Science, Heliophysics, Solar System Exploration, and Astrophysics. Goddard plays a leading role in NASA’s accomplishments by contributing compelling scientific knowledge to advance the Agency’s mission. <b>Follow us on <a href="http://twitter.com/NASA_GoddardPix" rel="nofollow">Twitter</a></b> <b>Join us on <a href="http://www.facebook.com/pages/Greenbelt-MD/NASA-Goddard/395013845897?ref=tsd" rel="nofollow">Facebook</a></b>
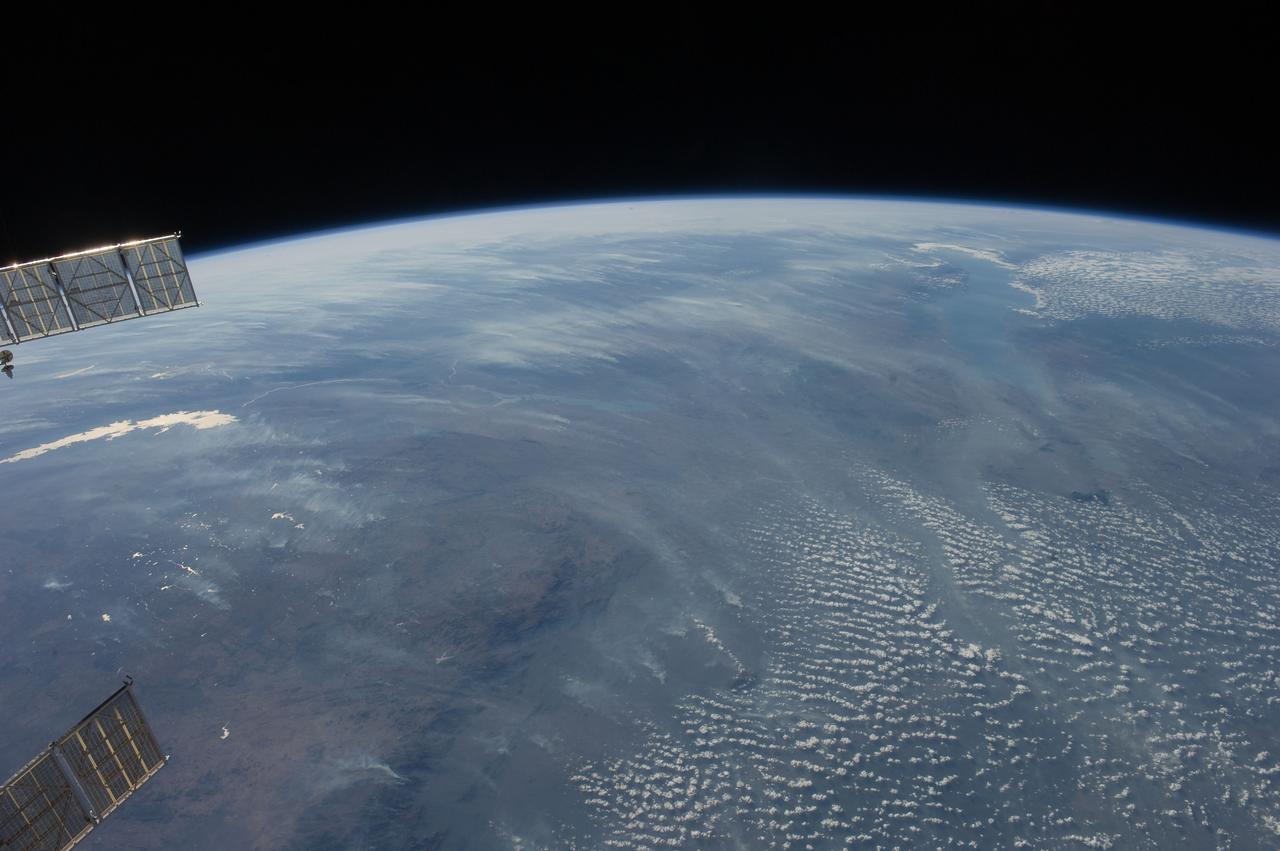
ISS028-E-018675 (23 July 2011) --- Biomass burning in southern Africa is featured in this image photographed by an Expedition 28 crew member on the International Space Station. A smoke pall of subcontinental proportions dominates this view of tropical southern Africa. In what has been described as the most fire-prone part of the world, numerous fires give rise to regional smoke palls every dry season. Fires are both natural and set by local people to clear woodland for agricultural fields. This recent, oblique, northwest-looking view taken in July 2011 at the end of the dry season shows the extent of the smoke on the African plateau?from central Zimbabwe (lower left) to northern Malawi more than 1,000 kilometers away (top right)?and in the wide coastal plains of the lower Zambezi River valley of Mozambique (lower right). Here smoke can be seen blowing inland (left to right), channeled up the Zambezi River valley and contributing to the pall on the plateau. The light gray smoke plumes contrast with higher altitude, brighter patchy cloud cover at lower right. The smoke palls obscure much surface detail, so that Lake Malawi, one of Africa?s Great Lakes, is barely visible, as is Lake Cahora Bassa, Africa?s fourth largest reservoir, in the Zambezi valley. The sun?s reflection off its surface (sunglint) makes Lake Kariba most prominent in the view at left. Kariba is the world?s largest artificial reservoir by volume, and is 220 kilometers long, giving a sense of the scale of the view. The steep, shadowed, mid-afternoon faces of the Inyanga Mountains on the Mozambique-Zimbabwe border protrude above the smoke layer at lower left. Solar panels extending from Russian spacecraft docked at the International Space Station are visible in the foreground at left.
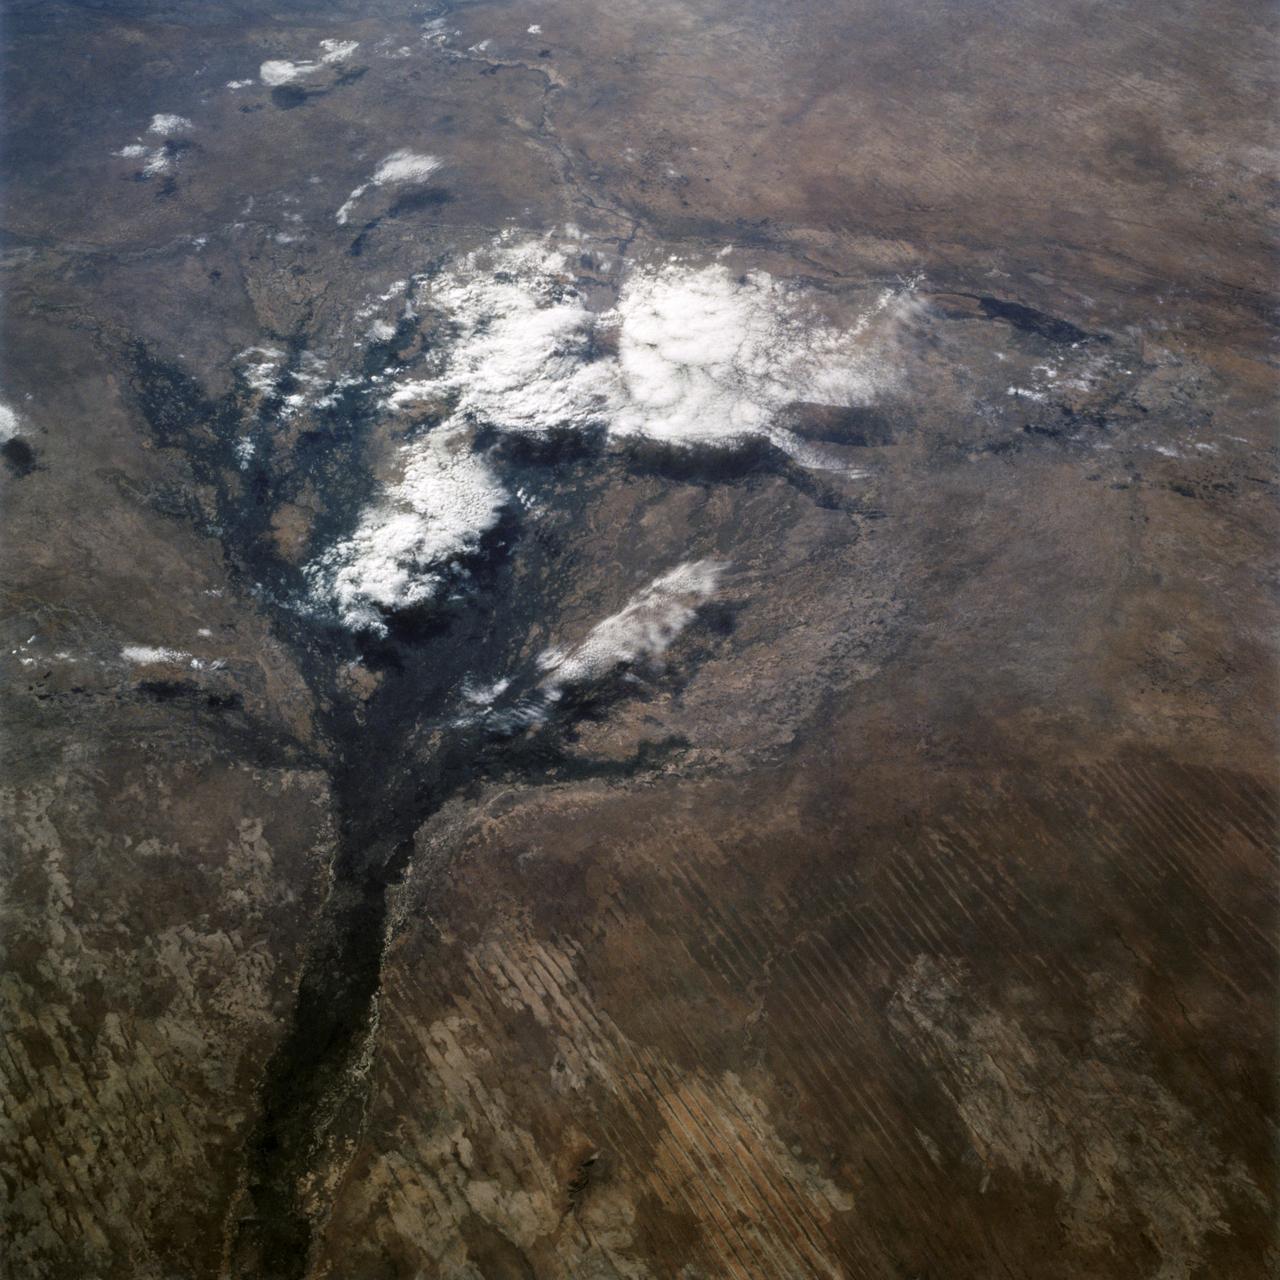
STS066-122-091 (3-14 Nov. 1994) --- This November 1994 view looking south-southeast shows clouds over the Okavango Delta area of northern Botswana. The Okavango is one of the wilder, less spoiled regions of Africa. The area still supports great herds of wild animals such as elephant, zebra and the cape buffalo. Despite conservation efforts from the stable government of Botswana, delta habitats are pressured. The Okavango River (lower left of view) brings water from the high, wet plateaus of Angola into the Kalahari Desert, and enormous inland basin. As a result of a series of small faults (upper center of the view) related to the African Rift System, the river is dammed up in the form of swampy inland delta. Here, water is consumed by evaporation, infiltration, and the swamp forests. Late summer floods take six months to slowly penetrate the 160 kilometer (95 miles) to the other end of the Delta. The visual patterns of the area are strongly linear: straight sand dunes occur in many places and can be seen across the bottom portion of the photograph. Numerous brush-fire scars produce a complex, straight-edged pattern over much of the lower portion of this view. Lake Ngami (upper right of view) was once permanently full as late as the middle 1800's. Changes in the climate of the area over the last 100 years has changed the size and shape of the inland delta.
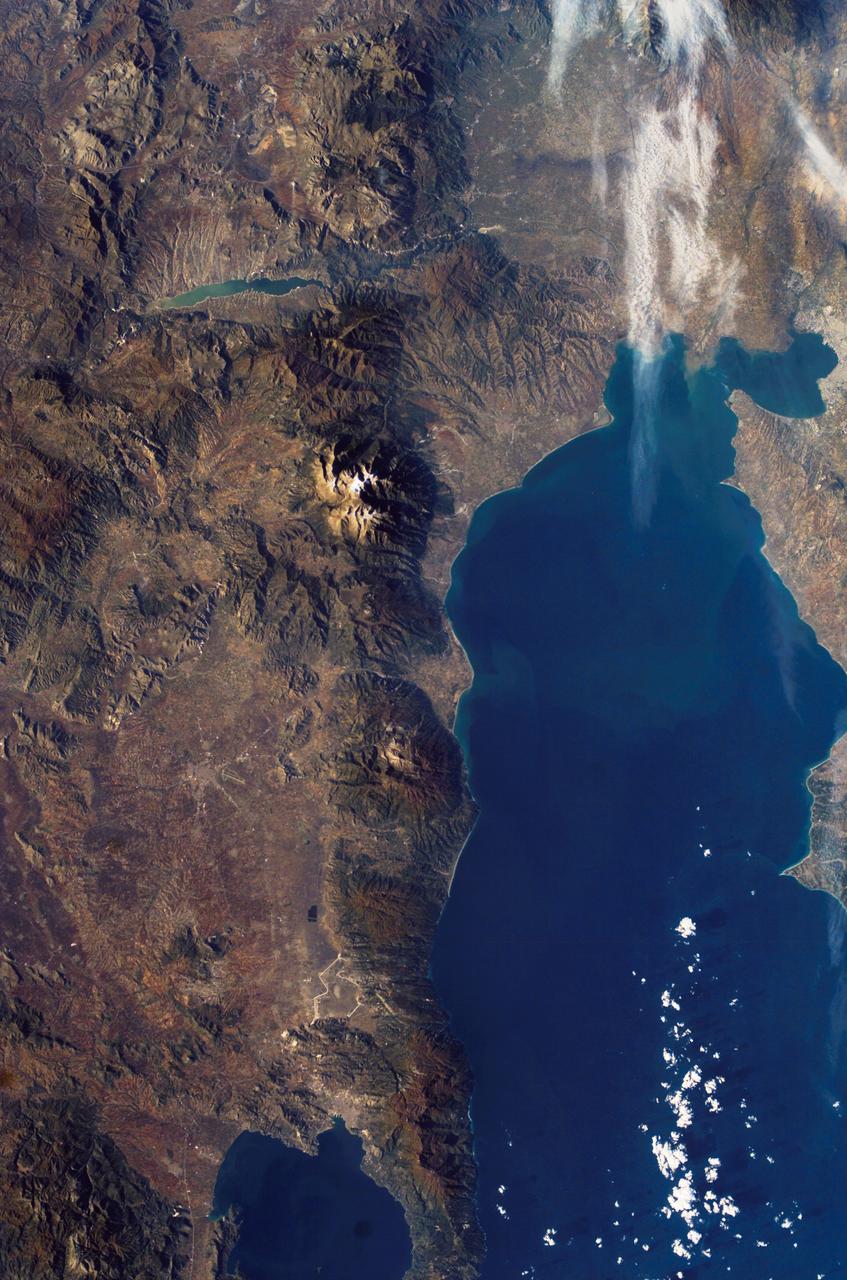
ISS010-E-08224 (22 November 2004) --- Mount Olympus, Greece is featured in this image photographed by an Expedition 10 crewmember on the International Space Station (ISS). Mount Olympus is the highest peak (2917 meters) in Greece, as well as the mountain chain that runs north into Bulgaria and south, via the Cyclades Islands, into Turkey. In this winter view, Olympus is the only peak with a dusting of snow—perhaps for this reason its name in classical Greek means “the luminous one.” In Greek mythology the peak was inhabited by the Twelve Olympians, the most famous gods of the ancient Greeks. North of Mount Olympus lies Macedonia, the homeland of Alexander the Great. Climbing the mountain is a favorite tourist activity today. The slopes of the peaks of Olympus and its neighboring peaks drop sheer into the Thermaikos Gulf, a northern arm of the Aegean Sea. White cirrus clouds obscure the shoreline near the city of Thessaloniki. This major port is spread along the shores of a small and well protected bay at the north end of the gulf. On the plains inland of the Olympus chain lie a lake, on the Aliakmon River, and the town of Larisa, at the focus point of a series of transport routes.
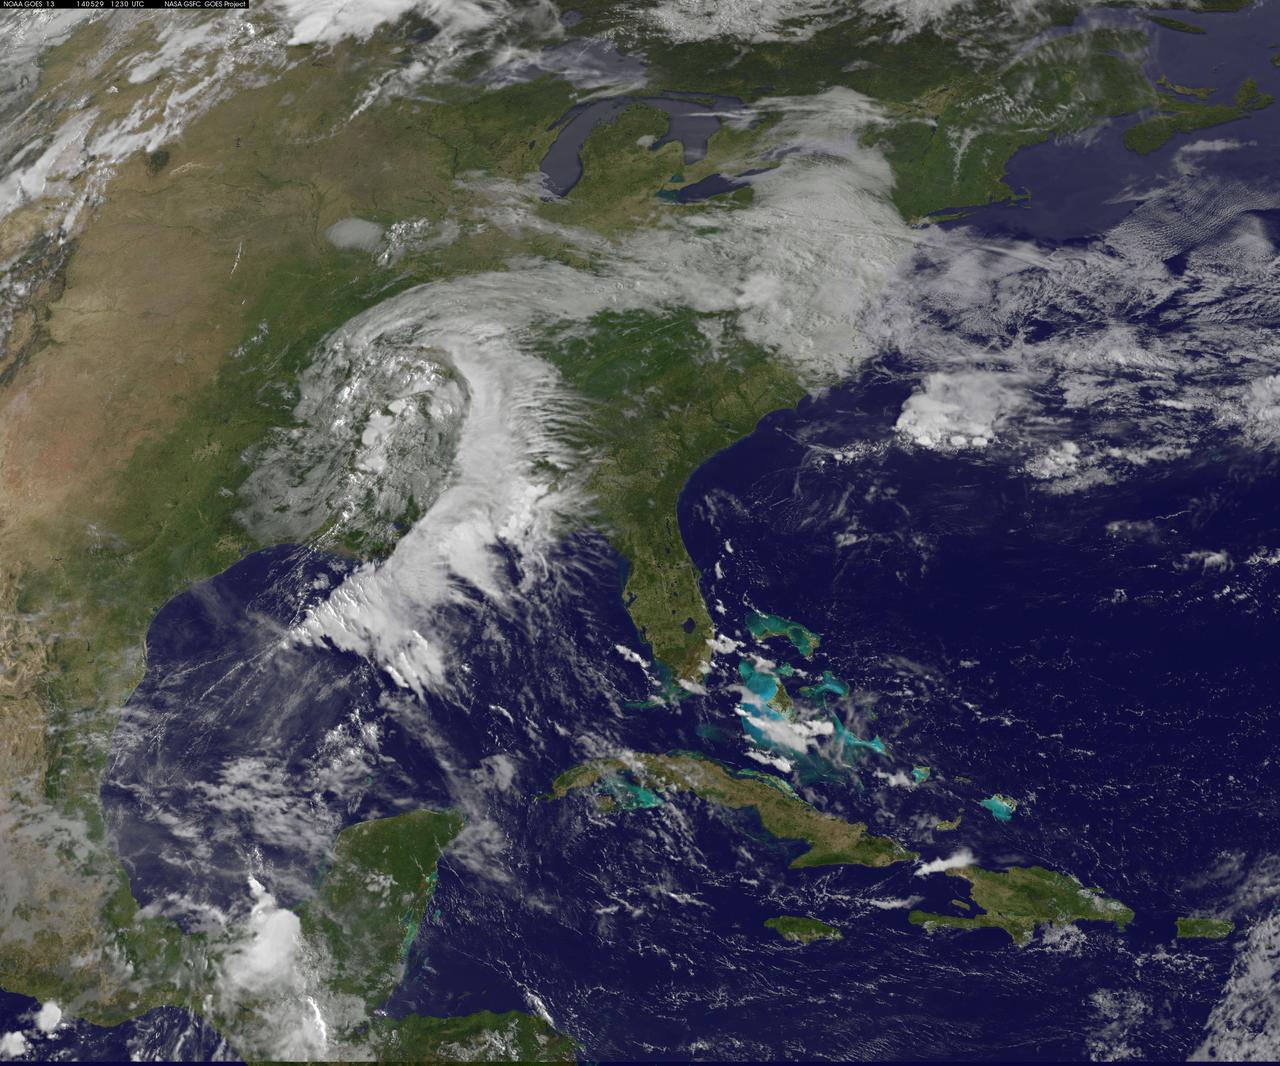
A "backdoor cold front" is bringing April temperatures to the U.S. northeast and Mid-Atlantic today, May 29. The backdoor cold front brings relief to the Mid-Atlantic after temperatures in Washington, D.C. hit 92F on Tuesday, May 27 and 88F on Wednesday, May 28 at Reagan National Airport, according to the National Weather Service (NWS). NWS forecasters expect the high temperature for May 29 to only reach 60F in the District of Columbia. NOAA's GOES-East satellite captured a view of the clouds associated with the backdoor cold front that stretch from southern Illinois to North Carolina. The National Weather Service forecast expects the backdoor cold front to bring showers to the Midwest, Northeast, and Mid-Atlantic today, May 29. According to the National Oceanic and Atmospheric Administration, a backdoor cold front is a cold front moving south or southwest along the Atlantic seaboard and Great Lakes; these are especially common during the spring months. This visible image was taken by NOAA's GOES-East satellite on May 29 at 12:30 UTC (8:30 a.m. EDT). The image was created at NASA/NOAA's GOES Project at NASA's Goddard Space Flight Center in Greenbelt, Maryland. In addition to the backdoor cold front clouds, the GOES-East image shows clouds circling around a low pressure area located in eastern Texas. That low pressure area is expected to bring rain from Texas eastward over the southeastern U.S. According to NOAA's National Weather Service, the slow-moving low pressure area in the Deep South "will bring heavy showers and thunderstorms from Louisiana to Alabama through Thursday. This area is already saturated from previous rainfall, so flash flooding will be possible." Image: NASA/NOAA GOES Project Caption: NASA Goddard/Rob Gutro

NOAA's GOES-14 satellite captured a visible image of a low pressure area that will affect the Mid-Atlantic, Ohio Valley and northeast over the next couple of days. The low pressure area, the rounded area of clouds near southern Louisiana, is now moving in a northerly direction from the Gulf coast, and will track northward to the Great Lakes, passing west of the Mid-Atlantic region and bringing clouds and showers. It's associated warm front will also move up the U.S. East coast bringing a surge of warmth before a cold front sweeps in from the west. The clouds draped across the Mid-Atlantic today, Oct. 1, are from an area of low pressure and trailing frontal boundary located over the Atlantic Ocean just off the North Carolina coast and stretching back to the Gulf low. The image was created at NASA's Goddard Space Flight Center in Greenbelt, Md. by the NASA GOES Project. Credit: NASA GOES Project <b><a href="http://www.nasa.gov/audience/formedia/features/MP_Photo_Guidelines.html" rel="nofollow">NASA image use policy.</a></b> <b><a href="http://www.nasa.gov/centers/goddard/home/index.html" rel="nofollow">NASA Goddard Space Flight Center</a></b> enables NASA’s mission through four scientific endeavors: Earth Science, Heliophysics, Solar System Exploration, and Astrophysics. Goddard plays a leading role in NASA’s accomplishments by contributing compelling scientific knowledge to advance the Agency’s mission. <b>Follow us on <a href="http://twitter.com/NASA_GoddardPix" rel="nofollow">Twitter</a></b> <b>Like us on <a href="http://www.facebook.com/pages/Greenbelt-MD/NASA-Goddard/395013845897?ref=tsd" rel="nofollow">Facebook</a></b> <b>Find us on <a href="http://instagrid.me/nasagoddard/?vm=grid" rel="nofollow">Instagram</a></b>

ISS017-E-013856 (19 Aug. 2008) --- Amazon River, Brazil is featured in this image photographed by an Expedition 17 crewmember on the International Space Station. This image shows the huge sunglint zone, common to oblique views from space, of the setting sun shining off the Amazon River and numerous lakes on its floodplain. About 150 kilometers of the sinuous Amazon course is shown here, as it appears about 1,000 kilometers from the Atlantic Ocean. The Uatuma River enters on the north side of the Amazon (top). A small side channel of the very large Madeira River enters the view from the left. Tupinambarama Island occupies the swampy wetlands between the Amazon and Madeira rivers. Sunglint images reveal great detail in waterbodies -- in this case the marked difference between the smooth outline of the Amazon and the jagged shoreline of the Uatuma River. The jagged shoreline results from valley sides being eroded in relatively hard rocks. The Uatuma River has since been dammed up by the sediment mass of the Amazon floodplain. Because the Amazon flows in its own soft sediment, its huge water discharge smooths the banks. Another dammed valley (known as a ria) is visible beneath the cirrus cloud of a storm (bottom). Although no smoke plumes from forest fires are visible in the view, two kinds of evidence show that there is smoke in the atmosphere. The coppery color of the sunglint is typically produced by smoke particles and other aerosols scattering yellow and red light. Second, a small patch of cloud (top right) casts a distinct shadow. The shadow, say scientists, is visible because so many particles in the surrounding sunlit parts of the atmosphere reflect light to the camera.
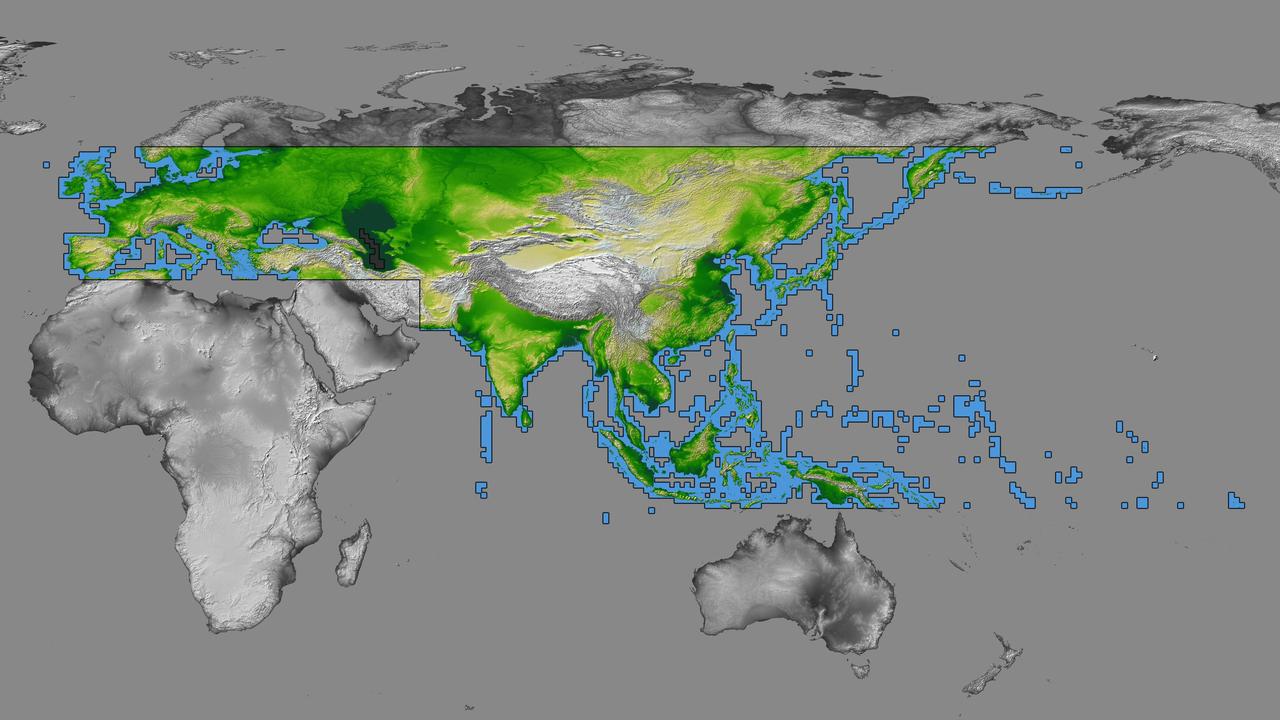
inal Caption Released with Image: The colored regions of this map show the extent of digital elevation data recently released by the Shuttle Radar Topography Mission (SRTM). This release includes data for most of Europe and Asia plus numerous islands in the Indian and Pacific Oceans. SRTM flew on board the Space Shuttle Endeavour in February 2000 and used an interferometric radar system to map the topography of Earth's landmass between latitudes 56 degrees south and 60 degrees north. The data were processed into geographic "tiles," each of which represents one by one degree of latitude and longitude. A degree of latitude measures 111 kilometers (69 miles) north-south, and a degree of longitude measures 111 kilometers or less east-west, decreasing away from the equator. The data are being released to the public on a continent-by-continent basis. This Eurasia segment includes 5,940 tiles, more than a third of the total data set. Previous releases covered North America and South America. Forthcoming releases will include Africa-Arabia and Australia plus an "Islands" release for those islands not included in the continental releases. Together these data releases constitute the world's first high-resolution, near-global elevation model. The resolution of the publicly released data is three arcseconds (1/1,200 of a degree of latitude and longitude), which is about 90 meters (295 feet). European coverage in the current data release stretches eastward from the British Isles and the Iberian Peninsula in the west, across the Alps and Carpathian Mountains, as well as the Northern European Plain, to the Ural and Caucasus Mountains bordering Asia. The Asian coverage includes a great diversity of landforms, including the Tibetan Plateau, Tarin Basin, Mongolian Plateau, and the mountains surrounding Lake Baikal, the world's deepest lake. Mt. Everest in the Himalayas, at 8,848 meters (29,029 feet) is the world's highest mountain. From India's Deccan Plateau, to Southeast Asia, coastal China, and Korea, various landforms place constraints upon land use planning for a great population. Volcanoes in the East Indies, the Philippines, Japan, and the Kamchatka Peninsula form the western part of the "Ring of Fire" around the Pacific Ocean. Many of these regions were previously very poorly mapped due to persistent cloud cover or the inaccessibility of the terrain. Digital elevation data, such as provided by SRTM, are particularly in high demand by scientists studying earthquakes, volcanism, and erosion patterns for use in mapping and modeling hazards to human habitation. But the shape of Earth's surface affects nearly every natural process and human endeavor that occurs there, so elevation data are used in a wide range of applications. In this index map color-coding is directly related to topographic height, with green at the lower elevations, rising through yellow and tan, to white at the highest elevations. The large, very dark green feature in western Asia is the Caspian Sea, which is below sea level. Blue areas on the map represent water within the mapped tiles, each of which includes shorelines or islands. http://photojournal.jpl.nasa.gov/catalog/PIA03398
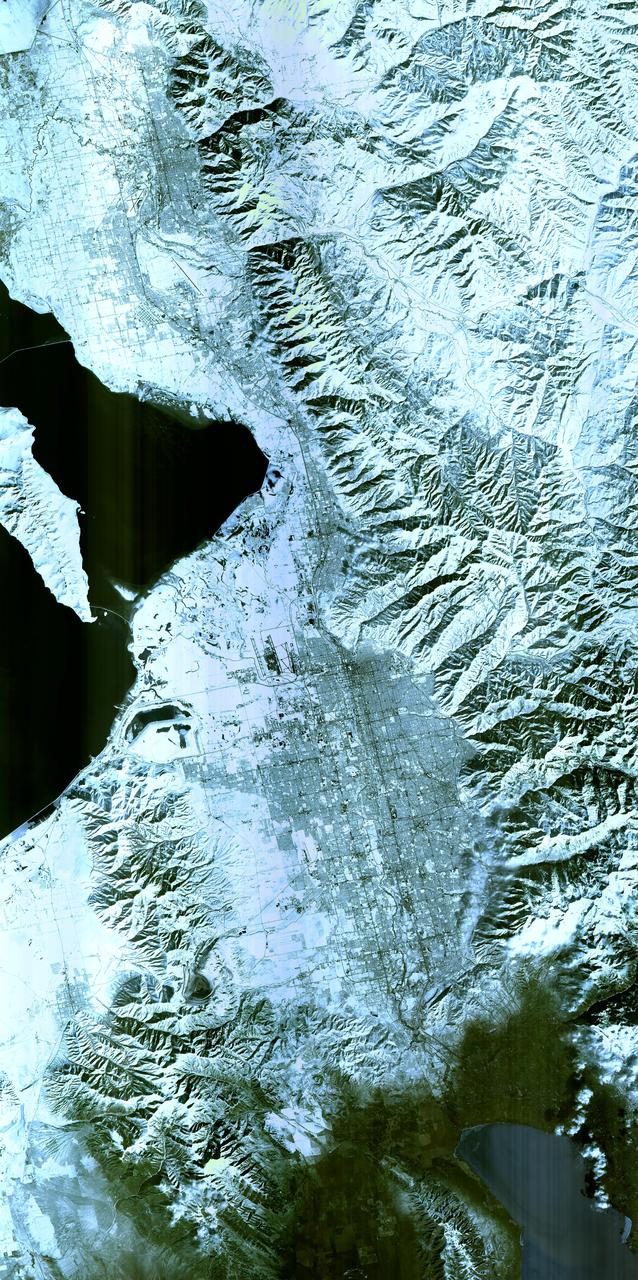
Salt Lake City, Utah, Winter 2001 The 2002 Winter Olympics are hosted by Salt Lake City at several venues within the city, in nearby cities, and within the adjacent Wasatch Mountains. This simulated natural color image presents a snowy, winter view of north central Utah that includes all of the Olympic sites. The image extends from Ogden in the north, to Provo in the south; and includes the snow-capped Wasatch Mountains and the eastern part of the Great Salt Lake. This image was acquired on February 8, 2001 by the Advanced Spaceborne Thermal Emission and Reflection Radiometer (ASTER) on NASA's Terra satellite. With its 14 spectral bands from the visible to the thermal infrared wavelength region, and its high spatial resolution of 15 to 90 meters (about 50 to 300 feet), ASTER will image Earth for the next 6 years to map and monitor the changing surface of our planet. ASTER is one of five Earth-observing instruments launched December 18,1999, on NASA's Terra satellite. The instrument was built by Japan's Ministry of Economy, Trade and Industry. A joint U.S./Japan science team is responsible for validation and calibration of the instrument and the data products. Dr. Anne Kahle at NASA's Jet Propulsion Laboratory, Pasadena, California, is the U.S. Science team leader; Bjorn Eng of JPL is the project manager. ASTER is the only high resolution imaging sensor on Terra. The Terra mission is part of NASA's Earth Science Enterprise, along-term research and technology program designed to examine Earth's land, oceans, atmosphere, ice and life as a total integrated system. The broad spectral coverage and high spectral resolution of ASTER will provide scientists in numerous disciplines with critical information for surface mapping, and monitoring dynamic conditions and temporal change. Example applications are: monitoring glacial advances and retreats; monitoring potentially active volcanoes; identifying crop stress; determining cloud morphology and physical properties; wetlands evaluation; thermal pollution monitoring; coral reef degradation; surface temperature mapping of soils and geology; and measuring surface heat balance. Image credit: NASA/GSFC/METI/ERSDAC/JAROS, and U.S./Japan ASTER Science Team Credit: <b><a href="http://www.earthobservatory.nasa.gov/" rel="nofollow"> NASA Earth Observatory</a></b> <b><a href="http://www.nasa.gov/audience/formedia/features/MP_Photo_Guidelines.html" rel="nofollow">NASA image use policy.</a></b> <b><a href="http://www.nasa.gov/centers/goddard/home/index.html" rel="nofollow">NASA Goddard Space Flight Center</a></b> enables NASA’s mission through four scientific endeavors: Earth Science, Heliophysics, Solar System Exploration, and Astrophysics. Goddard plays a leading role in NASA’s accomplishments by contributing compelling scientific knowledge to advance the Agency’s mission. <b>Follow us on <a href="http://twitter.com/NASAGoddardPix" rel="nofollow">Twitter</a></b> <b>Like us on <a href="http://www.facebook.com/pages/Greenbelt-MD/NASA-Goddard/395013845897?ref=tsd" rel="nofollow">Facebook</a></b> <b>Find us on <a href="http://instagram.com/nasagoddard?vm=grid" rel="nofollow">Instagram</a></b>
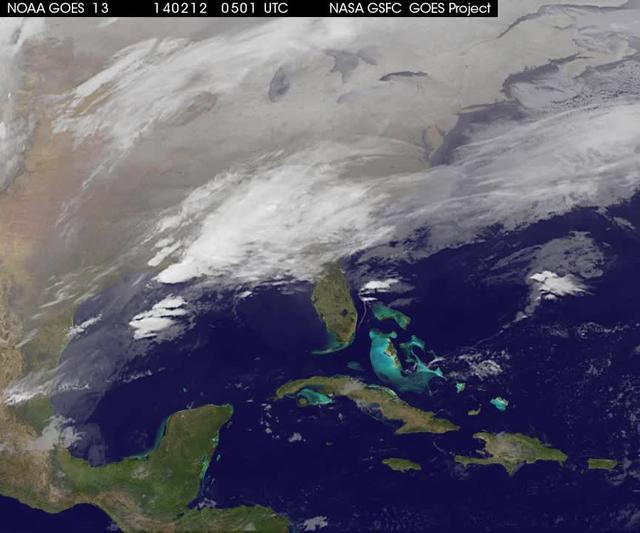
A new NASA video of NOAA's GOES satellite imagery shows three days of movement of the massive winter storm that stretches from the southern U.S. to the northeast. Visible and infrared imagery from NOAA's GOES-East or GOES-13 satellite from Feb. 10 at 1815 UTC/1:15 p.m. EST to Feb. 12 to 1845 UTC/1:45 p.m. EST were compiled into a video made by NASA/NOAA's GOES Project at NASA's Goddard Space Flight Center in Greenbelt, Md. In the video, viewers can see the development and movement of the clouds associated with the progression of the frontal system and related low pressure areas that make up the massive storm. The video also shows the snow covered ground over the Great Lakes region and Ohio Valley that stretches to northern New England. The clouds and fallen snow data from NOAA's GOES-East satellite were overlaid on a true-color image of land and ocean created by data from the Moderate Resolution Imaging Spectroradiometer or MODIS instrument that flies aboard NASA's Aqua and Terra satellites. On February 12 at 10 a.m. EST, NOAA's National Weather Service or NWS continued to issue watches and warnings from Texas to New England. Specifically, NWS cited Winter Storm Warnings and Winter Weather Advisories were in effect from eastern Texas eastward across the interior section of southeastern U.S. states and across much of the eastern seaboard including the Appalachians. Winter storm watches are in effect for portions of northern New England as well as along the western slopes of northern and central Appalachians. For updates on local forecasts, watches and warnings, visit NOAA's <a href="http://www.weather.gov" rel="nofollow">www.weather.gov</a> webpage. NOAA's Weather Prediction Center or WPC noted the storm is expected to bring "freezing rain spreading into the Carolinas, significant snow accumulations are expected in the interior Mid-Atlantic states tonight into Thursday and ice storm warnings and freezing rain advisories are in effect across much of central Georgia. GOES satellites provide the kind of continuous monitoring necessary for intensive data analysis. Geostationary describes an orbit in which a satellite is always in the same position with respect to the rotating Earth. This allows GOES to hover continuously over one position on Earth's surface, appearing stationary. As a result, GOES provide a constant vigil for the atmospheric "triggers" for severe weather conditions such as tornadoes, flash floods, hail storms and hurricanes. For updated information about the storm system, visit NOAA's WPC website; <a href="http://www.hpc.ncep.noaa.gov/" rel="nofollow">www.hpc.ncep.noaa.gov/</a> For more information about GOES satellites, visit: <a href="http://www.goes.noaa.gov/" rel="nofollow">www.goes.noaa.gov/</a> or <a href="http://goes.gsfc.nasa.gov/" rel="nofollow">goes.gsfc.nasa.gov/</a> Rob Gutro NASA's Goddard Space Flight Center <b><a href="http://goes.gsfc.nasa.gov/" rel="nofollow">Credit: NOAA/NASA GOES Project</a></b> <b><a href="http://www.nasa.gov/audience/formedia/features/MP_Photo_Guidelines.html" rel="nofollow">NASA image use policy.</a></b> <b><a href="http://www.nasa.gov/centers/goddard/home/index.html" rel="nofollow">NASA Goddard Space Flight Center</a></b> enables NASA’s mission through four scientific endeavors: Earth Science, Heliophysics, Solar System Exploration, and Astrophysics. Goddard plays a leading role in NASA’s accomplishments by contributing compelling scientific knowledge to advance the Agency’s mission. <b>Follow us on <a href="http://twitter.com/NASAGoddardPix" rel="nofollow">Twitter</a></b> <b>Like us on <a href="http://www.facebook.com/pages/Greenbelt-MD/NASA-Goddard/395013845897?ref=tsd" rel="nofollow">Facebook</a></b> <b>Find us on <a href="http://instagrid.me/nasagoddard/?vm=grid" rel="nofollow">Instagram</a></b>
On Jan. 20 at 2:30 p.m. EST the VIIRS instrument aboard NASA-NOAA's Suomi NPP captured this image of the winter storm moving through the central U.S. Credits: NASA Goddard Rapid Response The low pressure area from the Eastern Pacific Ocean moved into the western U.S. and tracked across the four corners region into Texas where NASA-NOAA's Suomi NPP satellite observed the clouds associated with the storm. The Visible Infrared Imaging Radiometer Suite (VIIRS) instrument aboard Suomi NPP satellite captured the visible image on January 20, 2016 at 19:30 UTC (2:30 p.m. EST) when the storm was over the central U.S. In the image, snow cover is visible in the Rockies and southern Great Lakes states. VIIRS collects visible and infrared imagery and global observations of land, atmosphere, cryosphere and oceans. That low pressure system located over the south central United States on Jan. 21 is expected to track east across the Tennessee Valley and will give way to a deepening coastal low pressure area. The National Weather Service said "This latter feature takes over and becomes a dominant force in setting up heavy snow bands over the Mid-Atlantic and very gusty winds." The storm system is expected to bring an increased risk of severe weather from far southeastern Texas across southern Louisiana/Mississippi, and into the far western Florida Panhandle on Thursday, Jan. 21. That threat for severe weather will move east as the low pressure area continues heading in that direction. The National Weather Service Weather Prediction Center in College Park, Maryland said "A potentially crippling winter storm is anticipated for portions of the mid-Atlantic Friday into early Saturday. Snowfall may approach two feet for some locations, including the Baltimore and Washington, D.C. metro areas. Farther north, there is uncertainty in snowfall for the New York City-to-Boston corridor. Farther south, significant icing is likely for portions of Kentucky and North Carolina." <b><a href="http://www.nasa.gov/audience/formedia/features/MP_Photo_Guidelines.html" rel="nofollow">NASA image use policy.</a></b> <b><a href="http://www.nasa.gov/centers/goddard/home/index.html" rel="nofollow">NASA Goddard Space Flight Center</a></b> enables NASA’s mission through four scientific endeavors: Earth Science, Heliophysics, Solar System Exploration, and Astrophysics. Goddard plays a leading role in NASA’s accomplishments by contributing compelling scientific knowledge to advance the Agency’s mission. <b>Follow us on <a href="http://twitter.com/NASAGoddardPix" rel="nofollow">Twitter</a></b> <b>Like us on <a href="http://www.facebook.com/pages/Greenbelt-MD/NASA-Goddard/395013845897?ref=tsd" rel="nofollow">Facebook</a></b> <b>Find us on <a href="http://instagram.com/nasagoddard?vm=grid" rel="nofollow">Instagram</a></b>