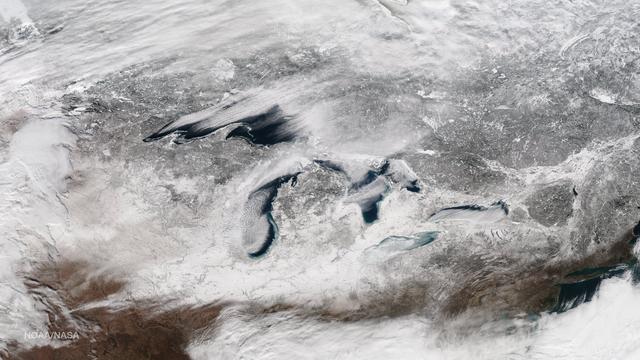
This image taken on January 13, 2015 from the Suomi NPP satellite's VIIRS instrument shows the Great Lakes and surrounding areas. The latest Great Lakes Surface Environmental Analysis (GLSEA) from the NOAA Great Lakes Environmental Research Laboratory shows total ice cover of 29.3% as of January 13th. Credit: NOAA/NASA/NPP Via <b><a href="www.nnvl.noaa.gov/" rel="nofollow"> NOAA Environmental Visualization Laboratory</a></b>
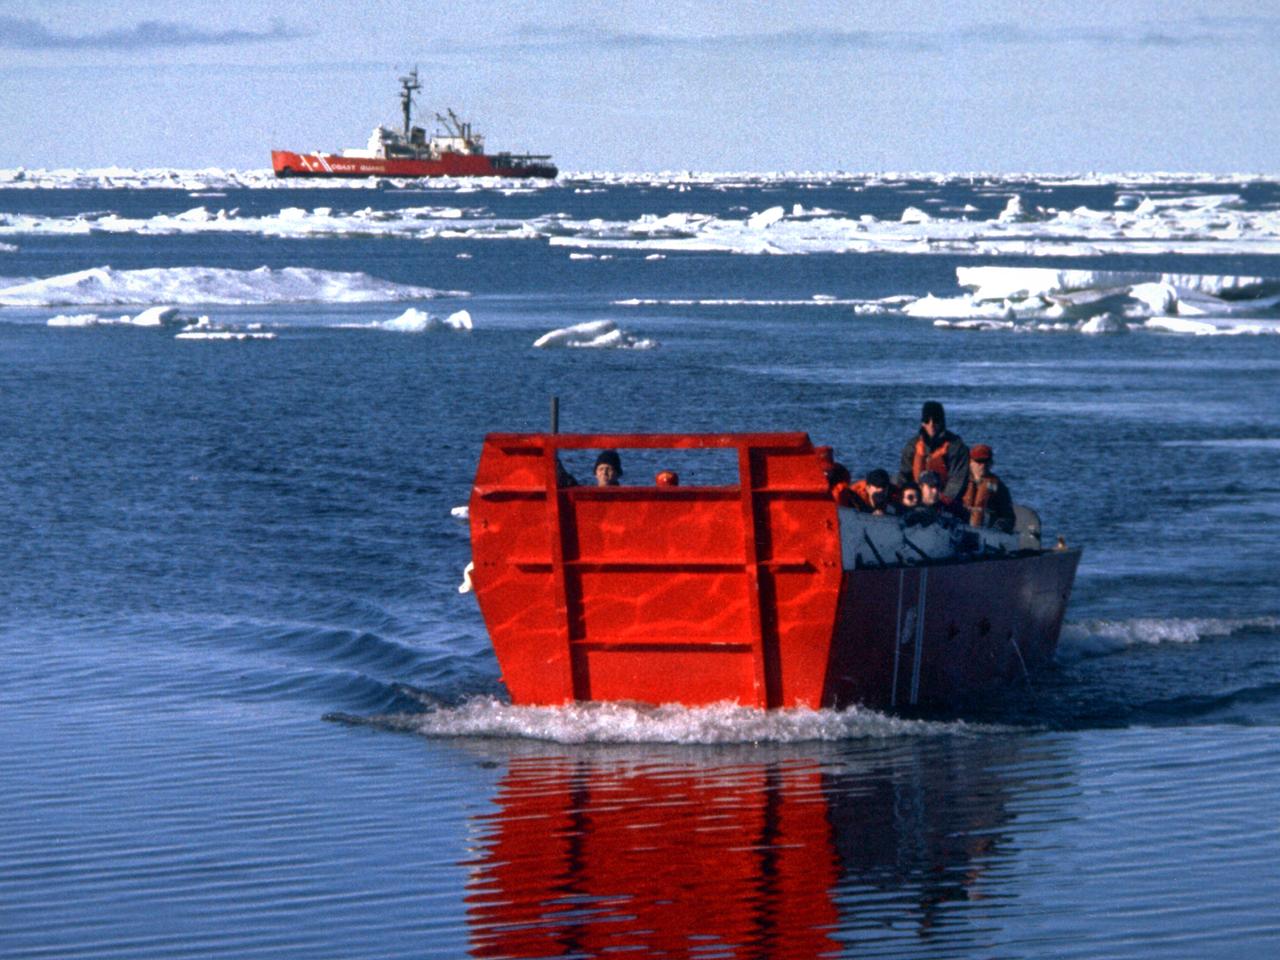
A group of Coast Guard seamen leave their ship to verify ice formations on the Great Lakes as part of an joint effort with the National Aeronautics and Space Administration (NASA) Lewis Research Center and the National Oceanic and Atmospheric Administration. The regular winter freezing of large portions of the Great Lakes stalled the shipping industry. Lewis began working on two complementary systems to monitor the ice. The Side Looking Airborne Radar (SLAR) system used microwaves to measure the ice distribution and electromagnetic systems used noise modulation to determine the thickness of the ice. The images were then transferred via satellite to the Coast Guard station. The Coast Guard then transmitted the pertinent images by VHF to the ship captains to help them select the best route. The Great Lakes ice mapping devices were first tested on NASA aircraft during the winter of 1972 and 1973. The pulsed radar system was transferred to the Coast Guard’s C-130 aircraft for the 1975 and 1976 winter. The SLAR was installed in the rear cargo door, and the small S-band antenna was mounted to the underside of the aircraft. Coast Guard flights began in January 1975 at an altitude of 11,000 feet. Early in the program, teams of guardsmen and NASA researchers frequently set out in boats to take samples and measurements of the ice in order to verify the radar information.
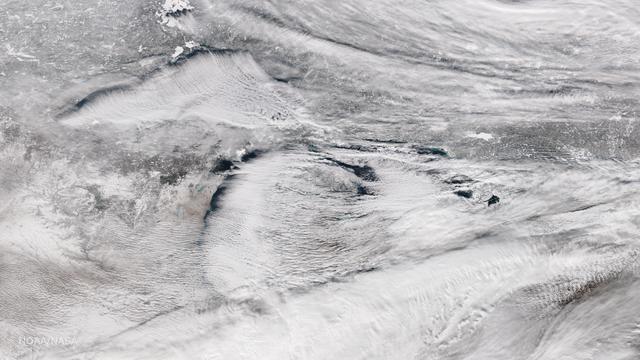
Bands of lake effect snow drift eastward from the western Great Lakes in this true-color image captured by the NOAA/NASA Suomi NPP satellite's Visible Infrared Imaging Radiometer Suite (VIIRS) instrument on January 5, 2017. National Weather Service forecasters expect light to moderate lake effect snow showers to continue throughout the day today and into Saturday (1/7). Lake-effect snow forms when cold air passes over the warmer waters of a lake. This causes some lake water to evaporate into the air and warm it. This warmer, wetter air rises and cools as it moves away from the lake. When it cools, it releases that moisture and, if it’s cold enough, that moisture turns into snow. Although true-color images like this may appear to be photographs of Earth, they aren't. They are created by combining data from the three color channels on the VIIRS instrument sensitive to the red, green and blue (or RGB) wavelengths of light into one composite image. In addition, data from several other channels are often also included to cancel out or correct atmospheric interference that may blur parts of the image. Credit: NOAA/NASA/Suomi NPP via NOAA's Environmental Visualization Laboratory
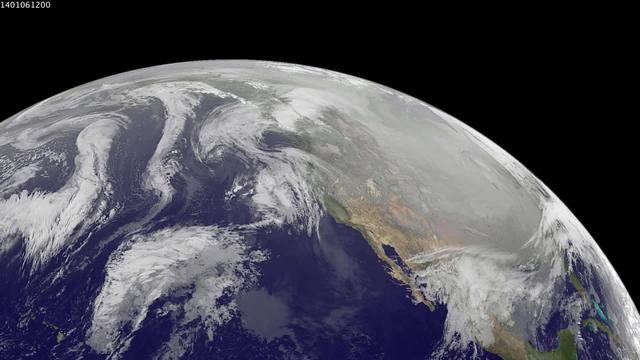
1-9 January 2014. The full-disk images every 3 hours from GOES-WEST capture the sweep of a polar vortex that emerged from the arctic at the beginning of the new year, pushing a blizzard into the northeastern USA on January 3, followed by extensive bitter cold (-20 F, windchill -50 F) around the Great Lakes, and single digit temperatures as far south as Atlanta, Georgia. This western viewpoint displays the persistent flow of arctic air from northern Alaska and Yukon into North America. <b><a href="http://goes.gsfc.nasa.gov/" rel="nofollow">Credit: NOAA/NASA GOES Project</a></b> <b><a href="http://www.nasa.gov/audience/formedia/features/MP_Photo_Guidelines.html" rel="nofollow">NASA image use policy.</a></b> <b><a href="http://www.nasa.gov/centers/goddard/home/index.html" rel="nofollow">NASA Goddard Space Flight Center</a></b> enables NASA’s mission through four scientific endeavors: Earth Science, Heliophysics, Solar System Exploration, and Astrophysics. Goddard plays a leading role in NASA’s accomplishments by contributing compelling scientific knowledge to advance the Agency’s mission. <b>Follow us on <a href="http://twitter.com/NASA_GoddardPix" rel="nofollow">Twitter</a></b> <b>Like us on <a href="http://www.facebook.com/pages/Greenbelt-MD/NASA-Goddard/395013845897?ref=tsd" rel="nofollow">Facebook</a></b> <b>Find us on <a href="http://instagram.com/nasagoddard?vm=grid" rel="nofollow">Instagram</a></b>
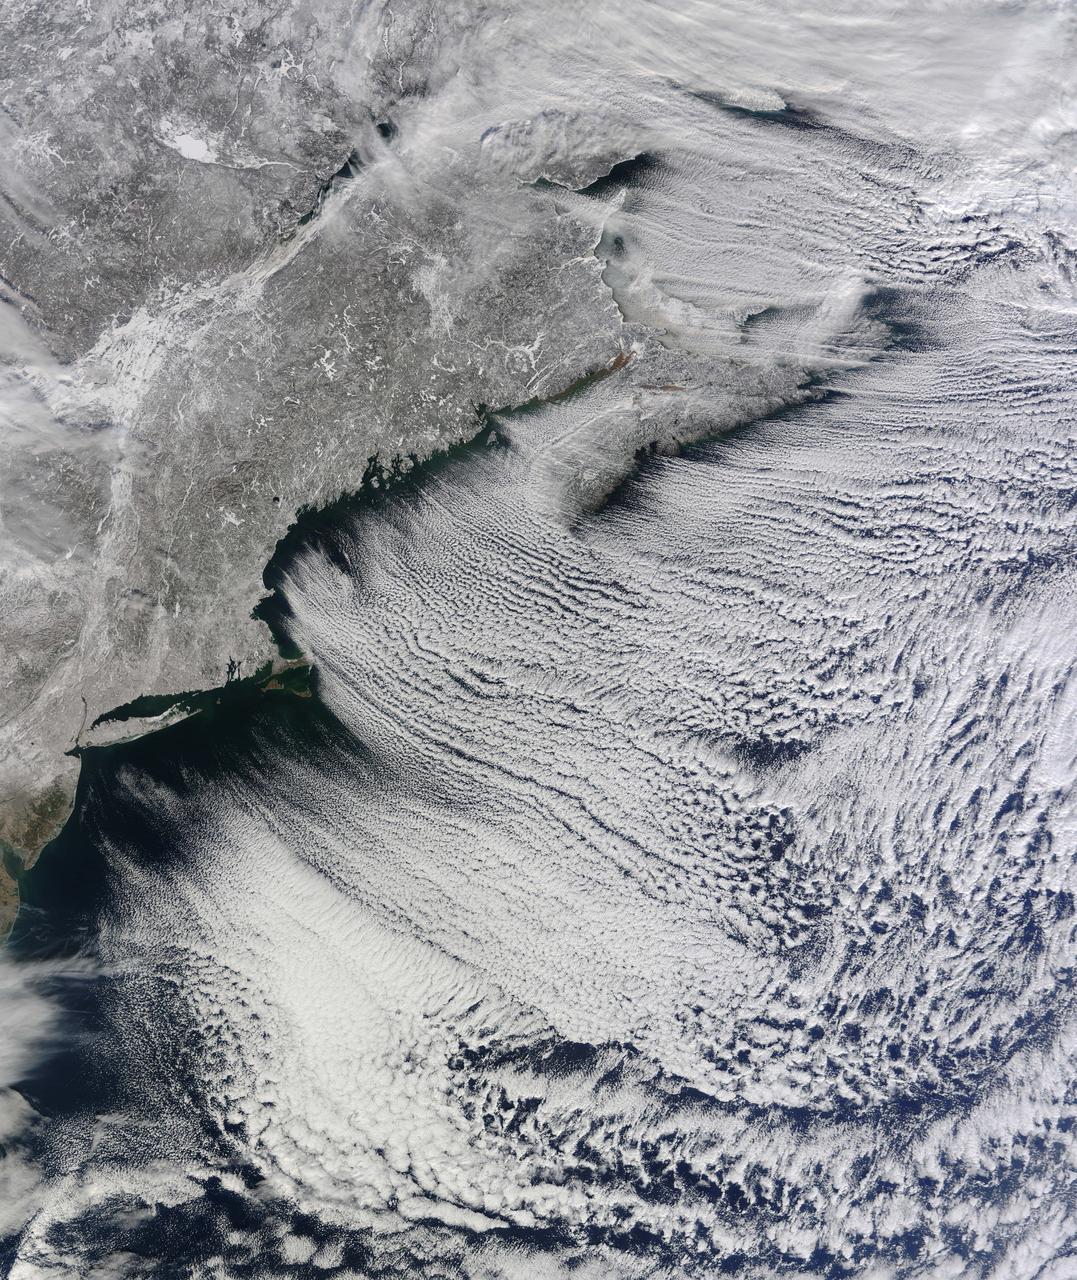
NASA image acquired January 24, 2011 What do you get when you mix below-freezing air temperatures, frigid northwest winds from Canada, and ocean temperatures hovering around 39 to 40 degrees Fahrenheit (4 to 5 degrees Celsius)? Paved highways of clouds across the skies of the North Atlantic. The Moderate Resolution Imaging Spectroradiometer (MODIS) on NASA’s Terra satellite collected this natural-color view of New England, the Canadian Maritimes, and coastal waters at 10:25 a.m. U.S. Eastern Standard Time on January 24, 2011. Lines of clouds stretch from northwest to southeast over the North Atlantic, while the relatively cloudless skies over land afford a peek at the snow that blanketed the Northeast just a few days earlier. Cloud streets form when cold air blows over warmer waters, while a warmer air layer—or temperature inversion—rests over top of both. The comparatively warm water of the ocean gives up heat and moisture to the cold air mass above, and columns of heated air—thermals—naturally rise through the atmosphere. As they hit the temperature inversion like a lid, the air rolls over like the circulation in a pot of boiling water. The water in the warm air cools and condenses into flat-bottomed, fluffy-topped cumulus clouds that line up parallel to the wind. Though they are easy to explain in a broad sense, cloud streets have a lot of mysteries on the micro scale. A NASA-funded researcher from the University of Wisconsin recently observed an unusual pattern in cloud streets over the Great Lakes. Cloud droplets that should have picked up moisture from the atmosphere and grown in size were instead shrinking as they moved over Lake Superior. Read more in an interview at What on Earth? NASA image by Jeff Schmaltz, MODIS Rapid Response Team, Goddard Space Flight Center. Caption by Michael Carlowicz. Instrument: Terra - MODIS Credit: <b><a href="http://www.earthobservatory.nasa.gov/" rel="nofollow"> NASA Earth Observatory</a></b> <b><a href="http://www.nasa.gov/centers/goddard/home/index.html" rel="nofollow">NASA Goddard Space Flight Center</a></b> enables NASA’s mission through four scientific endeavors: Earth Science, Heliophysics, Solar System Exploration, and Astrophysics. Goddard plays a leading role in NASA’s accomplishments by contributing compelling scientific knowledge to advance the Agency’s mission. <b>Follow us on <a href="http://twitter.com/NASA_GoddardPix" rel="nofollow">Twitter</a></b> <b>Join us on <a href="http://www.facebook.com/pages/Greenbelt-MD/NASA-Goddard/395013845897?ref=tsd" rel="nofollow">Facebook</a></b>

The GOES-East satellite captured a Midwestern wintertime "White Out" at 2015 UTC/3:15 p.m. EST on January 6, 2014. Blowing snow and intensely cold air created dangerous white-out conditions over the Midwest, particularly around the Great Lakes, where daytime temperatures averaged -20F with a wind chill near -50F. The GOES-East satellite is managed by NOAA. The image was created at NASA's GOES Project at NASA's Goddard Space Flight Center, Greenbelt, Md. Credit: NASA NOAA GOES Project, Dennis Chesters <b><a href="http://www.nasa.gov/audience/formedia/features/MP_Photo_Guidelines.html" rel="nofollow">NASA image use policy.</a></b> <b><a href="http://www.nasa.gov/centers/goddard/home/index.html" rel="nofollow">NASA Goddard Space Flight Center</a></b> enables NASA’s mission through four scientific endeavors: Earth Science, Heliophysics, Solar System Exploration, and Astrophysics. Goddard plays a leading role in NASA’s accomplishments by contributing compelling scientific knowledge to advance the Agency’s mission. <b>Follow us on <a href="http://twitter.com/NASA_GoddardPix" rel="nofollow">Twitter</a></b> <b>Like us on <a href="http://www.facebook.com/pages/Greenbelt-MD/NASA-Goddard/395013845897?ref=tsd" rel="nofollow">Facebook</a></b> <b>Find us on <a href="http://instagram.com/nasagoddard?vm=grid" rel="nofollow">Instagram</a></b>
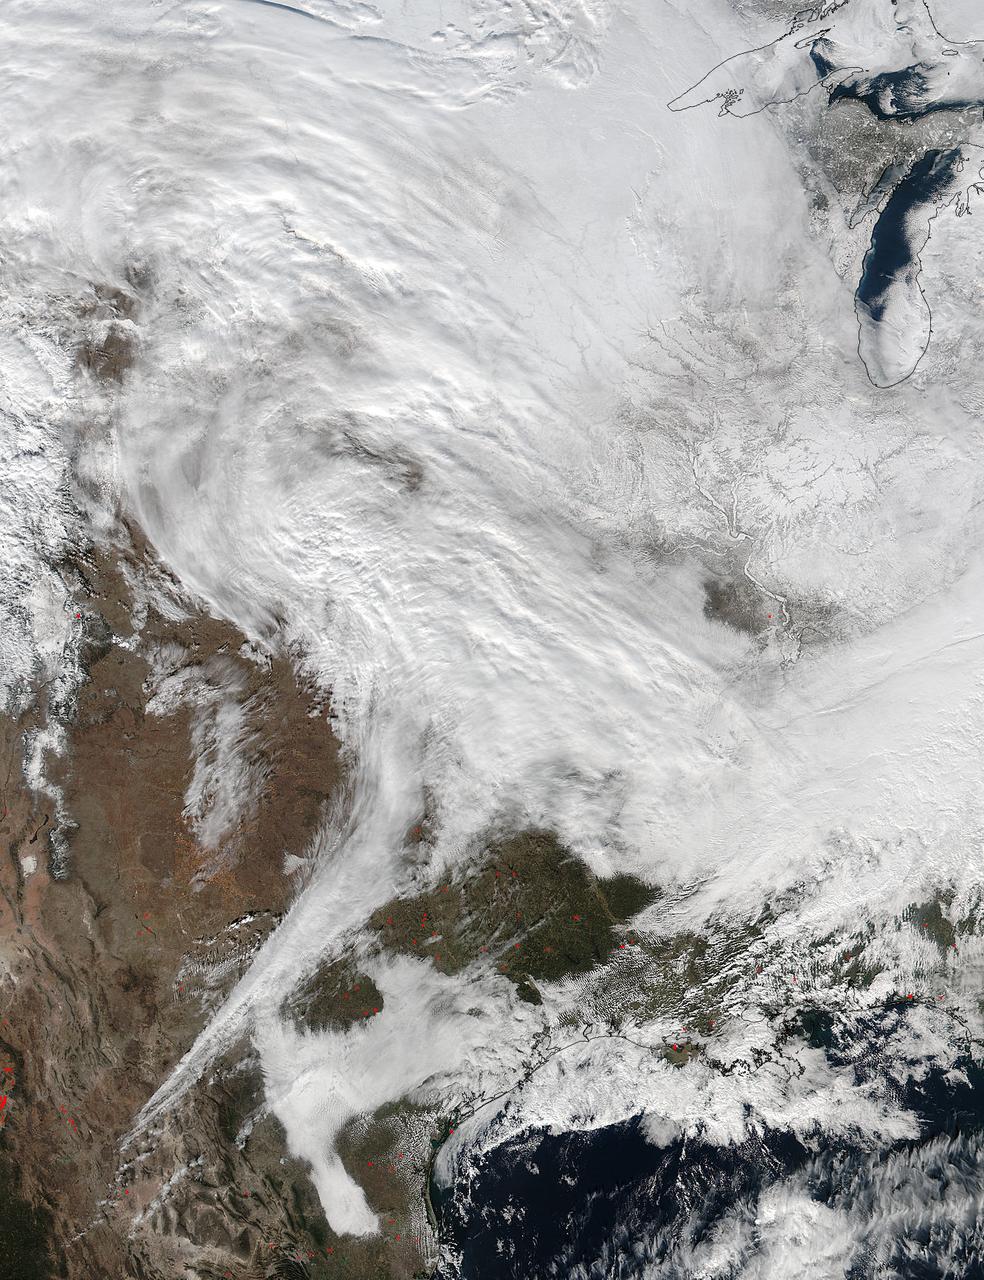
On Jan. 20 at 2:30 p.m. EST the VIIRS instrument aboard NASA-NOAA's Suomi NPP captured this image of the winter storm moving through the central U.S. Credits: NASA Goddard Rapid Response The low pressure area from the Eastern Pacific Ocean moved into the western U.S. and tracked across the four corners region into Texas where NASA-NOAA's Suomi NPP satellite observed the clouds associated with the storm. The Visible Infrared Imaging Radiometer Suite (VIIRS) instrument aboard Suomi NPP satellite captured the visible image on January 20, 2016 at 19:30 UTC (2:30 p.m. EST) when the storm was over the central U.S. In the image, snow cover is visible in the Rockies and southern Great Lakes states. VIIRS collects visible and infrared imagery and global observations of land, atmosphere, cryosphere and oceans. That low pressure system located over the south central United States on Jan. 21 is expected to track east across the Tennessee Valley and will give way to a deepening coastal low pressure area. The National Weather Service said "This latter feature takes over and becomes a dominant force in setting up heavy snow bands over the Mid-Atlantic and very gusty winds." The storm system is expected to bring an increased risk of severe weather from far southeastern Texas across southern Louisiana/Mississippi, and into the far western Florida Panhandle on Thursday, Jan. 21. That threat for severe weather will move east as the low pressure area continues heading in that direction. The National Weather Service Weather Prediction Center in College Park, Maryland said "A potentially crippling winter storm is anticipated for portions of the mid-Atlantic Friday into early Saturday. Snowfall may approach two feet for some locations, including the Baltimore and Washington, D.C. metro areas. Farther north, there is uncertainty in snowfall for the New York City-to-Boston corridor. Farther south, significant icing is likely for portions of Kentucky and North Carolina." <b><a href="http://www.nasa.gov/audience/formedia/features/MP_Photo_Guidelines.html" rel="nofollow">NASA image use policy.</a></b> <b><a href="http://www.nasa.gov/centers/goddard/home/index.html" rel="nofollow">NASA Goddard Space Flight Center</a></b> enables NASA’s mission through four scientific endeavors: Earth Science, Heliophysics, Solar System Exploration, and Astrophysics. Goddard plays a leading role in NASA’s accomplishments by contributing compelling scientific knowledge to advance the Agency’s mission. <b>Follow us on <a href="http://twitter.com/NASAGoddardPix" rel="nofollow">Twitter</a></b> <b>Like us on <a href="http://www.facebook.com/pages/Greenbelt-MD/NASA-Goddard/395013845897?ref=tsd" rel="nofollow">Facebook</a></b> <b>Find us on <a href="http://instagram.com/nasagoddard?vm=grid" rel="nofollow">Instagram</a></b>