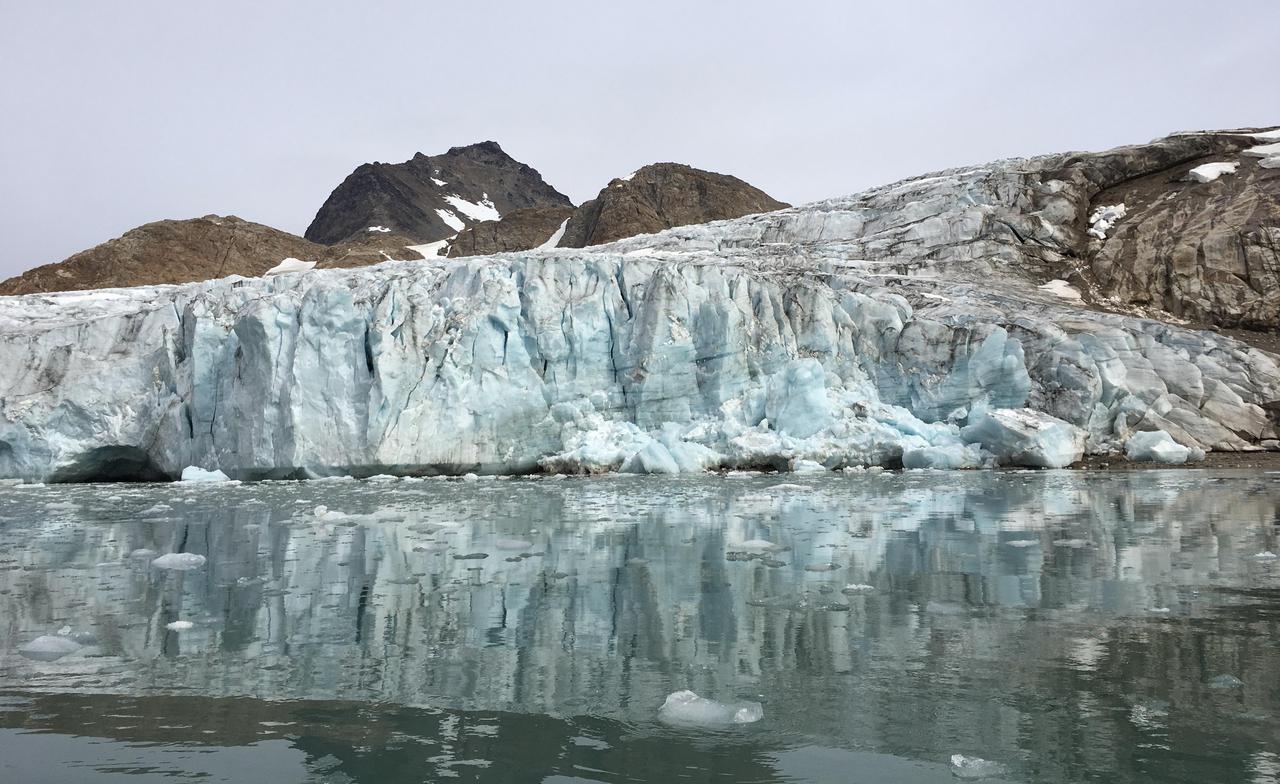
NASA's Oceans Melting Greenland airborne mission found that most of Greenland's glaciers that empty into the ocean are at greater risk of rapid ice loss than previously understood. OMG's six-year field campaign studied the ocean's role in glacial ice loss by gathering precise measurements of ocean depth, temperature, and salinity in front of more than 220 glaciers. The mission's goal was to clarify our understanding of sea level rise over the next 50 years. This photo of Apusiaajik Glacier was taken near Kulusuk, Greenland, on Aug. 26, 2018, during OMG's field operations. https://photojournal.jpl.nasa.gov/catalog/PIA24983
The first Norse settlement of Greenland was at Brattahlid (now Qassiarsuk), which yielded a radiocarbon date of about 1000. According to the sagas, it was also in the year 1000 that Leif Erikson left the settlement to explore the regions around Vinland, which is generally assumed to be Newfoundland. Norse settlements at their height had an estimated population of a few thousand. After 450 years, the settlements were all abandoned. Causes include: cumulative environmental damage; gradual climate change; conflicts with hostile neighbors; and loss of contact and support from Europe. The image was acquired June 13, 2016, covers an area of 30.9 by 27.7 km, and is located at 61.1 degrees north, 45.5 degrees west. http://photojournal.jpl.nasa.gov/catalog/PIA20996
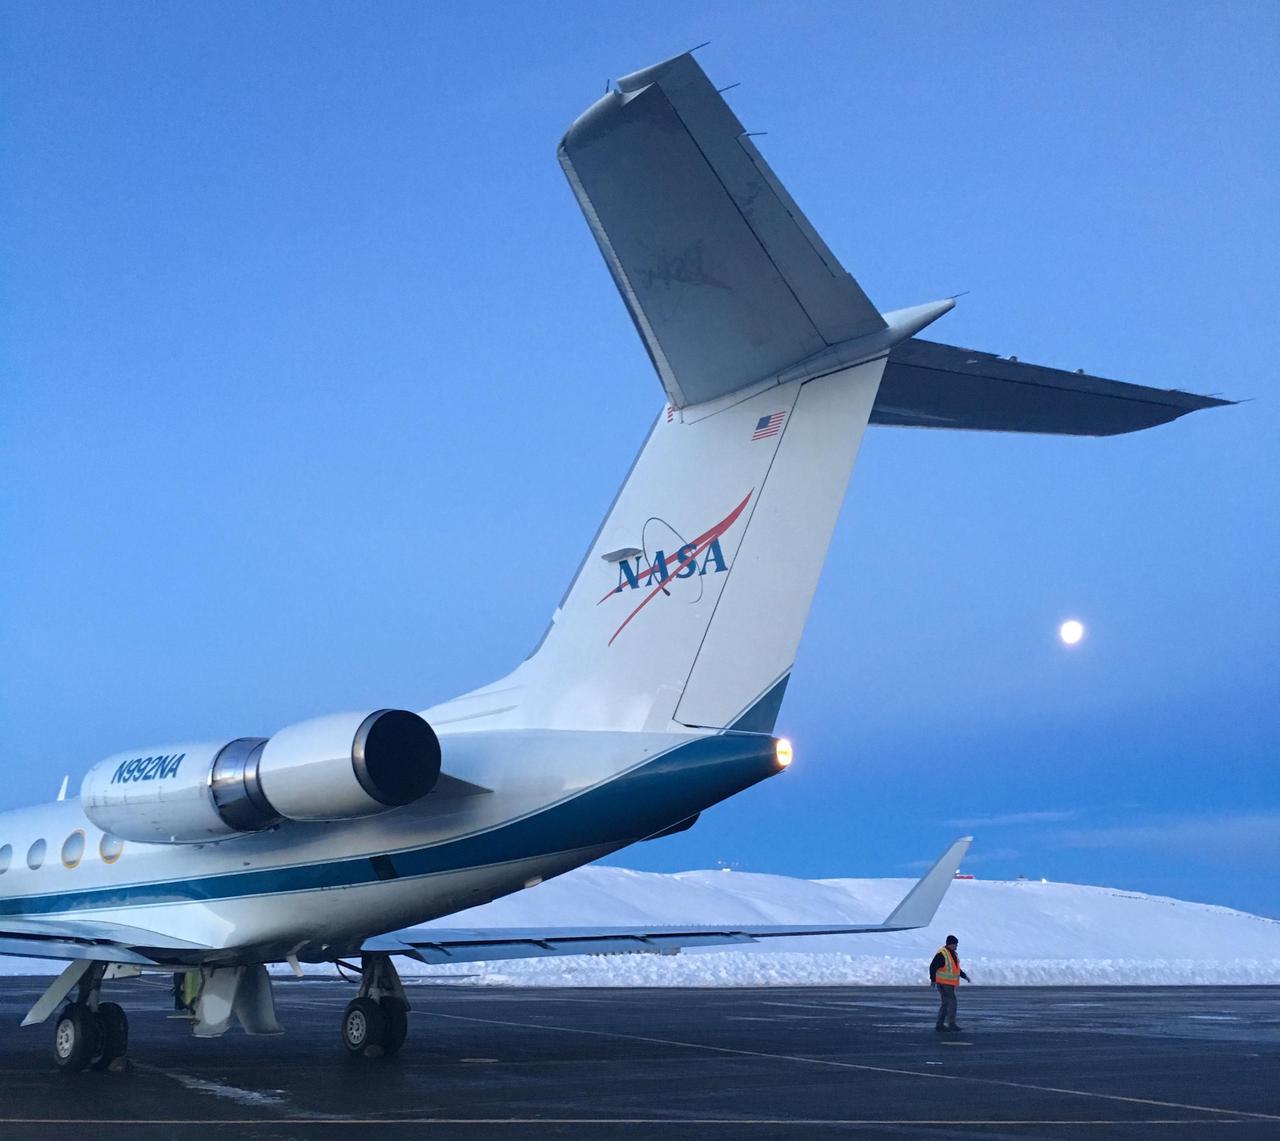
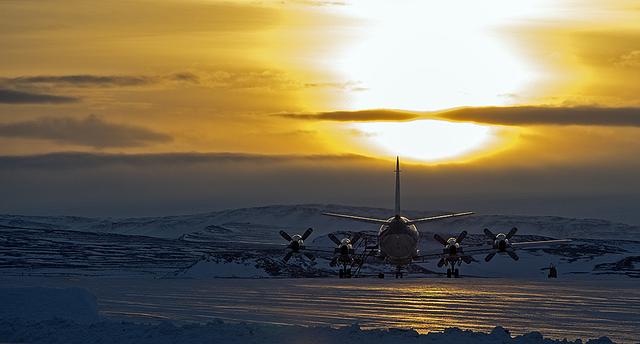
NASA's Gulfstream III was one of several research aircraft that NASA's Oceans Melting Greenland mission used during its six-year field campaign to record the temperature, salinity, and depth of the ocean around the entire island. OMG used airports in Greenland, Iceland, and Norway as bases for research flights. This image was taken at Thule Air Base, Greenland, on Sept. 18, 2016. https://photojournal.jpl.nasa.gov/catalog/PIA24984
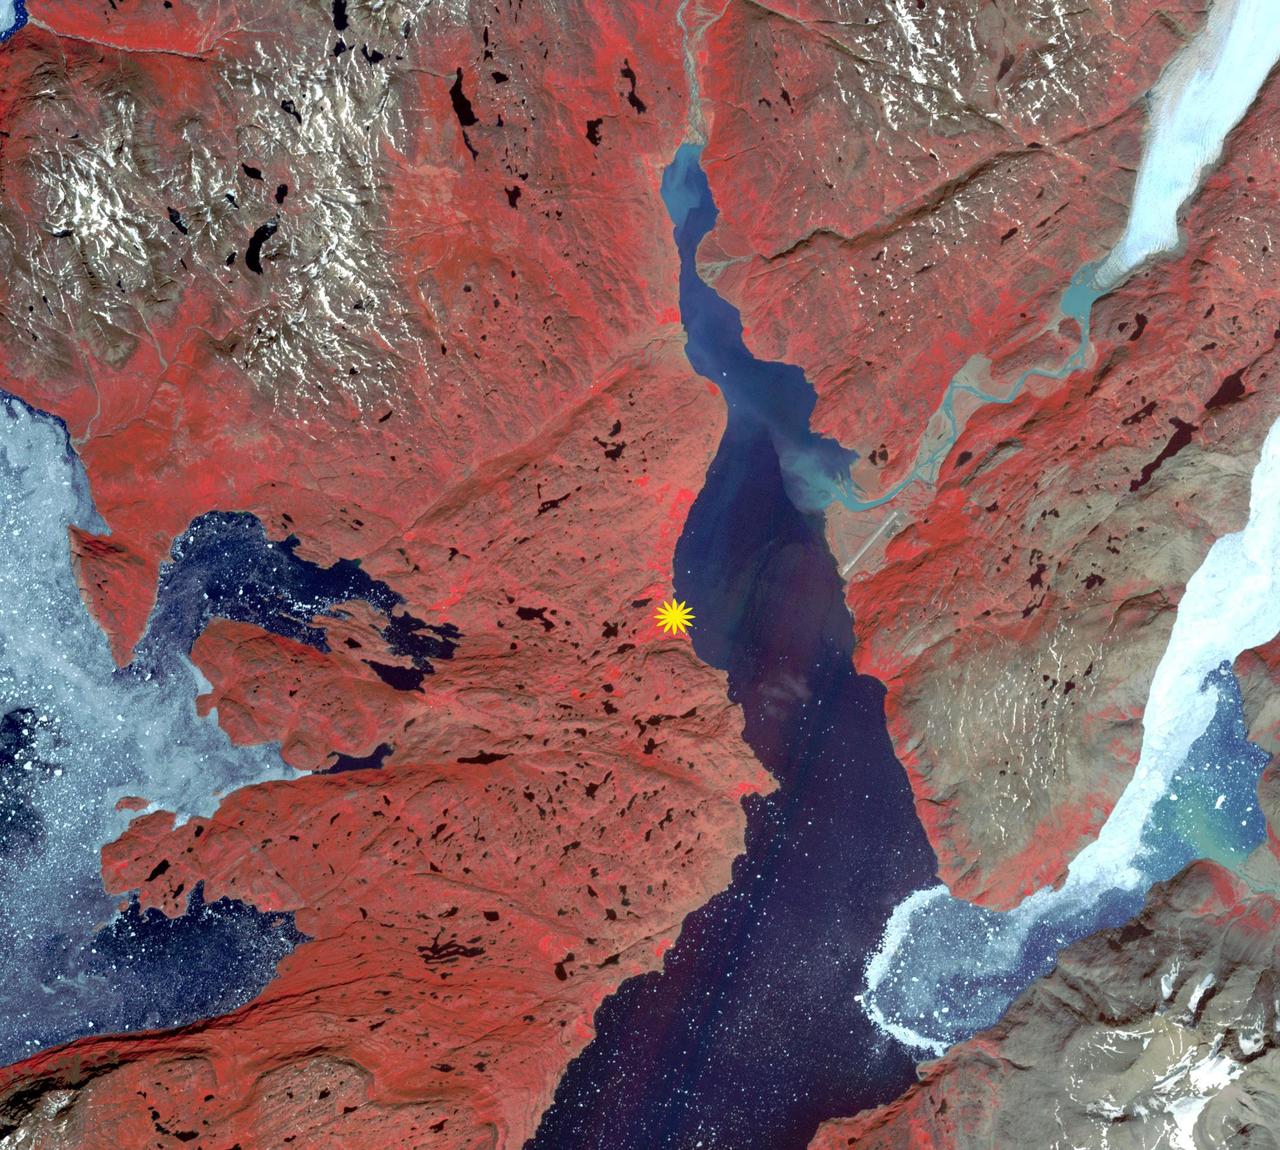
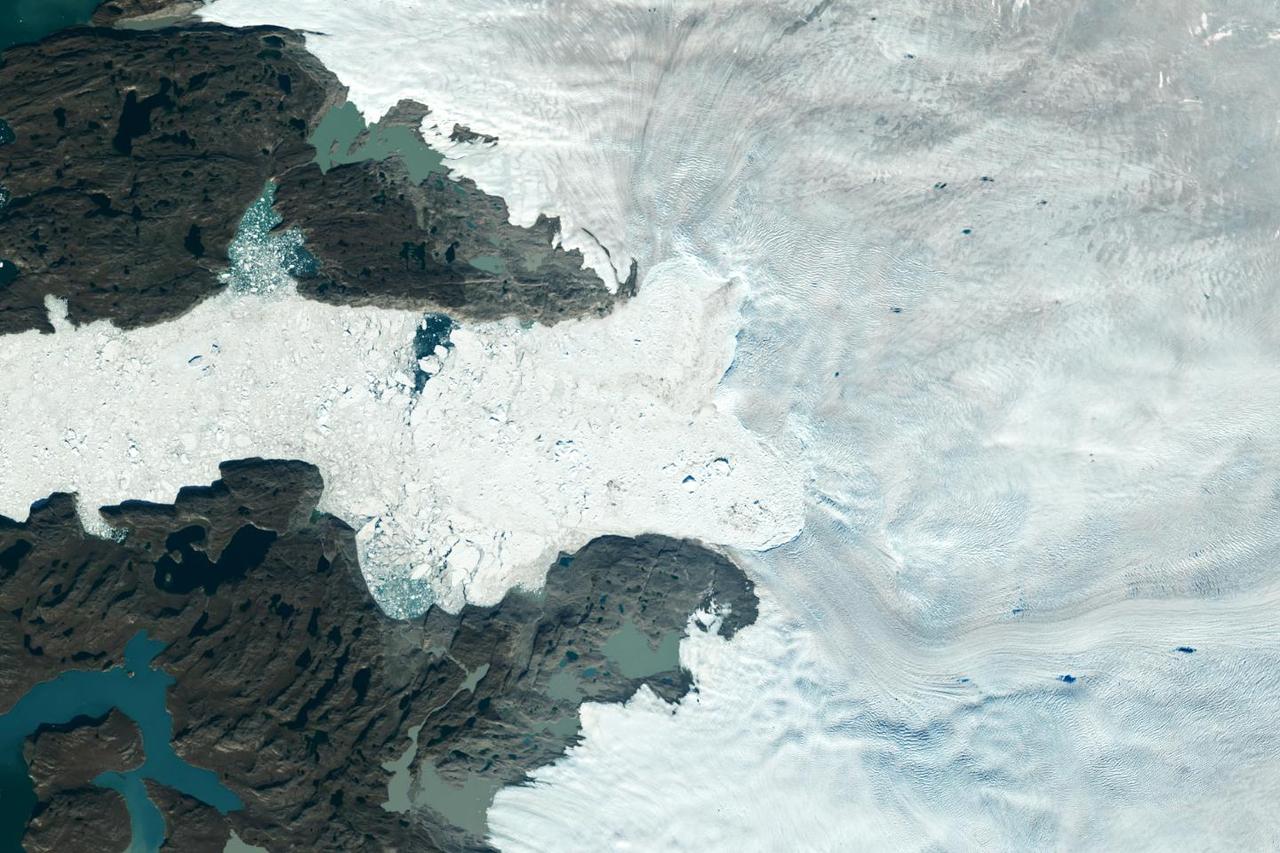
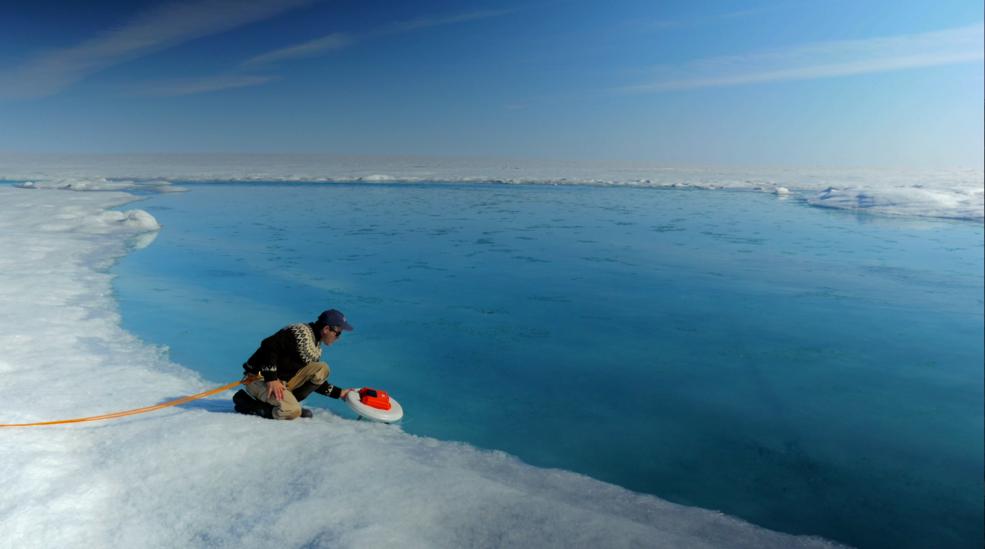
This image shows a region of the sea floor off the coast of northwest Greenland mapped as part of NASA Oceans Melting Greenland OMG mission. The data shown here will be used to understand the pathways by which warm water can reach glacier edges.
Frozen meltwater lake along the northeast Greenland coast, as seen from NASA's P-3B aircraft on May 7, 2012. Credit: NASA/Jim Yungel =========== IceBridge, a six-year NASA mission, is the largest airborne survey of Earth's polar ice ever flown. It will yield an unprecedented three-dimensional view of Arctic and Antarctic ice sheets, ice shelves and sea ice. These flights will provide a yearly, multi-instrument look at the behavior of the rapidly changing features of the Greenland and Antarctic ice. Data collected during IceBridge will help scientists bridge the gap in polar observations between NASA's Ice, Cloud and Land Elevation Satellite (ICESat) -- in orbit since 2003 -- and ICESat-2, planned for early 2016. ICESat stopped collecting science data in 2009, making IceBridge critical for ensuring a continuous series of observations. IceBridge will use airborne instruments to map Arctic and Antarctic areas once a year. IceBridge flights are conducted in March-May over Greenland and in October-November over Antarctica. Other smaller airborne surveys around the world are also part of the IceBridge campaign. To read more about IceBridge - Arctic 2012 go to: <a href="http://www.nasa.gov/mission_pages/icebridge/index.html" rel="nofollow">www.nasa.gov/mission_pages/icebridge/index.html</a> <b><a href="http://www.nasa.gov/audience/formedia/features/MP_Photo_Guidelines.html" rel="nofollow">NASA image use policy.</a></b> <b><a href="http://www.nasa.gov/centers/goddard/home/index.html" rel="nofollow">NASA Goddard Space Flight Center</a></b> enables NASA’s mission through four scientific endeavors: Earth Science, Heliophysics, Solar System Exploration, and Astrophysics. Goddard plays a leading role in NASA’s accomplishments by contributing compelling scientific knowledge to advance the Agency’s mission. <b>Follow us on <a href="http://twitter.com/NASA_GoddardPix" rel="nofollow">Twitter</a></b> <b>Like us on <a href="http://www.facebook.com/pages/Greenbelt-MD/NASA-Goddard/395013845897?ref=tsd" rel="nofollow">Facebook</a></b> <b>Find us on <a href="http://instagrid.me/nasagoddard/?vm=grid" rel="nofollow">Instagram</a></b>

As the northern hemisphere experiences the heat of summer, ice moves and melts in the Arctic waters and the far northern lands surrounding it. The Moderate Resolution Imaging Spectroradiometer (MODIS) aboard NASA’s Aqua satellite captured this true-color image of sea ice off Greenland on July 16, 2015. Large chunks of melting sea ice can be seen in the sea ice off the coast, and to the south spirals of ice have been shaped by the winds and currents that move across the Greenland Sea. Along the Greenland coast, cold, fresh melt water from the glaciers flows out to the sea, as do newly calved icebergs. Frigid air from interior Greenland pushes the ice away from the shoreline, and the mixing of cold water and air allows some sea ice to be sustained even at the height of summer. According to observations from satellites, 2015 is on track to be another low year for arctic summer sea ice cover. The past ten years have included nine of the lowest ice extents on record. The annual minimum typically occurs in late August or early September. The amount of Arctic sea ice cover has been dropping as global temperatures rise. The Arctic is two to three times more sensitive to temperature changes as the Earth as a whole. Credit: NASA/GSFC/Jeff Schmaltz/MODIS Land Rapid Response Team <b><a href="http://www.nasa.gov/audience/formedia/features/MP_Photo_Guidelines.html" rel="nofollow">NASA image use policy.</a></b> <b><a href="http://www.nasa.gov/centers/goddard/home/index.html" rel="nofollow">NASA Goddard Space Flight Center</a></b> enables NASA’s mission through four scientific endeavors: Earth Science, Heliophysics, Solar System Exploration, and Astrophysics. Goddard plays a leading role in NASA’s accomplishments by contributing compelling scientific knowledge to advance the Agency’s mission. <b>Follow us on <a href="http://twitter.com/NASAGoddardPix" rel="nofollow">Twitter</a></b> <b>Like us on <a href="http://www.facebook.com/pages/Greenbelt-MD/NASA-Goddard/395013845897?ref=tsd" rel="nofollow">Facebook</a></b> <b>Find us on <a href="http://instagrid.me/nasagoddard/?vm=grid" rel="nofollow">Instagram</a></b>
Nuuk or Gadthab is the capital and largest city of Greenland. It is located at the mouth of the Nuup Kangerlua inlet on the west coast of Greenland. This image was acquired August 2, 2004 by NASA Terra spacecraft.

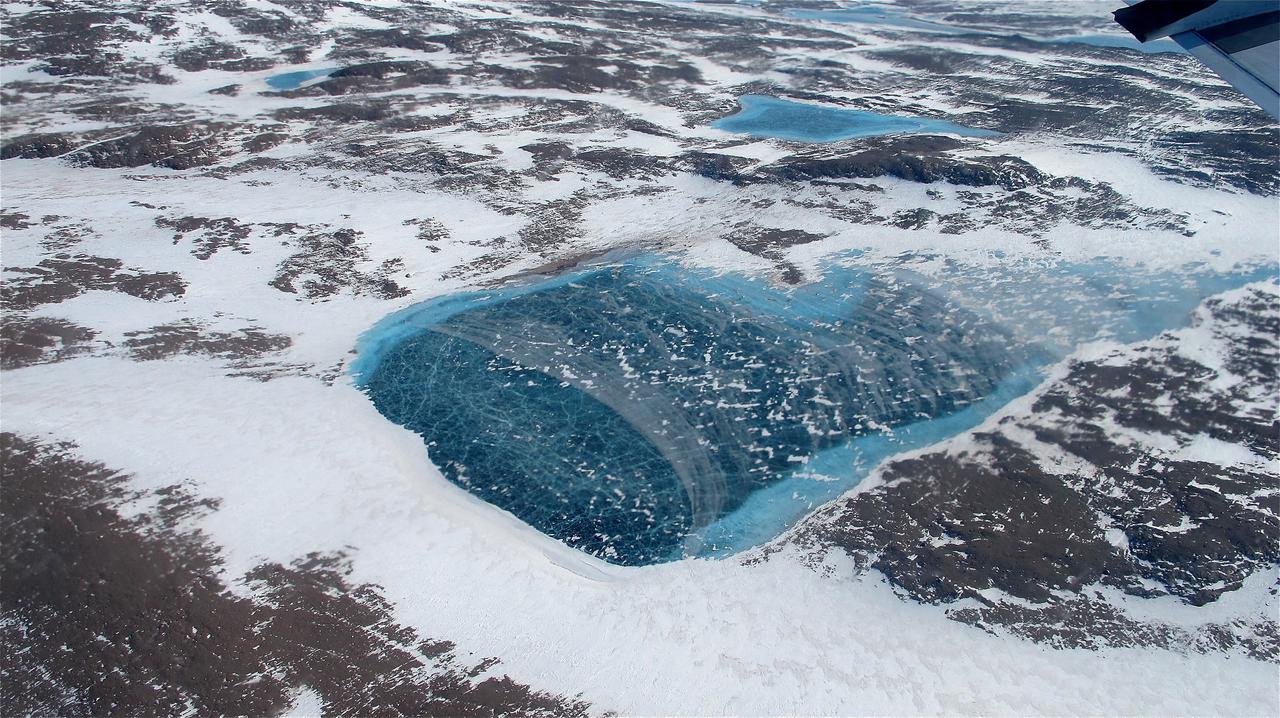
Scientists and crew with NASA’s Operation IceBridge, which makes annual aerial surveys of polar ice, are wrapping up their seventh campaign over the Arctic. In spring 2015, the team began using a different research aircraft—an adapted C-130 Hercules. They also added four new high-priority targets in the rapidly changing region of northeast Greenland. Many of the flights, however, were routine. And that’s exactly the point; making measurements over the same path each year provides continuity between NASA’s Ice, Cloud, and Land Elevation Satellite (ICESat) missions—the first of which ended in 2009 and the second of which is scheduled for launch in 2017. Repeat measurements show how a landscape changes over time. One area that has been surveyed repeatedly is northern Greenland’s Ryder Glacier. This photograph, taken during the IceBridge flight on May 6, 2015, shows a large moulin—dozens of meters across—atop this glacier. Moulins are holes in the ice sheet that drain melt water from the ice sheet’s surface to the bottom or out to the sea. Scientists are working to figure out what happens to melt water once it enters a moulin.
A northern Greenland glacier as seen by NASA's P-3B aircraft on May 3, 2012. Credit: Michael Studinger/NASA =========== IceBridge, a six-year NASA mission, is the largest airborne survey of Earth's polar ice ever flown. It will yield an unprecedented three-dimensional view of Arctic and Antarctic ice sheets, ice shelves and sea ice. These flights will provide a yearly, multi-instrument look at the behavior of the rapidly changing features of the Greenland and Antarctic ice. Data collected during IceBridge will help scientists bridge the gap in polar observations between NASA's Ice, Cloud and Land Elevation Satellite (ICESat) -- in orbit since 2003 -- and ICESat-2, planned for early 2016. ICESat stopped collecting science data in 2009, making IceBridge critical for ensuring a continuous series of observations. IceBridge will use airborne instruments to map Arctic and Antarctic areas once a year. IceBridge flights are conducted in March-May over Greenland and in October-November over Antarctica. Other smaller airborne surveys around the world are also part of the IceBridge campaign. To read more about IceBridge - Arctic 2012 go to: <a href="http://www.nasa.gov/mission_pages/icebridge/index.html" rel="nofollow">www.nasa.gov/mission_pages/icebridge/index.html</a> <b><a href="http://www.nasa.gov/audience/formedia/features/MP_Photo_Guidelines.html" rel="nofollow">NASA image use policy.</a></b> <b><a href="http://www.nasa.gov/centers/goddard/home/index.html" rel="nofollow">NASA Goddard Space Flight Center</a></b> enables NASA’s mission through four scientific endeavors: Earth Science, Heliophysics, Solar System Exploration, and Astrophysics. Goddard plays a leading role in NASA’s accomplishments by contributing compelling scientific knowledge to advance the Agency’s mission. <b>Follow us on <a href="http://twitter.com/NASA_GoddardPix" rel="nofollow">Twitter</a></b> <b>Like us on <a href="http://www.facebook.com/pages/Greenbelt-MD/NASA-Goddard/395013845897?ref=tsd" rel="nofollow">Facebook</a></b> <b>Find us on <a href="http://instagrid.me/nasagoddard/?vm=grid" rel="nofollow">Instagram</a></b>
A glacial canyon in northern Greenland as seen by NASA's P-3B aircraft on May 3, 2012. Credit: Michael Studinger/NASA =========== IceBridge, a six-year NASA mission, is the largest airborne survey of Earth's polar ice ever flown. It will yield an unprecedented three-dimensional view of Arctic and Antarctic ice sheets, ice shelves and sea ice. These flights will provide a yearly, multi-instrument look at the behavior of the rapidly changing features of the Greenland and Antarctic ice. Data collected during IceBridge will help scientists bridge the gap in polar observations between NASA's Ice, Cloud and Land Elevation Satellite (ICESat) -- in orbit since 2003 -- and ICESat-2, planned for early 2016. ICESat stopped collecting science data in 2009, making IceBridge critical for ensuring a continuous series of observations. IceBridge will use airborne instruments to map Arctic and Antarctic areas once a year. IceBridge flights are conducted in March-May over Greenland and in October-November over Antarctica. Other smaller airborne surveys around the world are also part of the IceBridge campaign. To read more about IceBridge - Arctic 2012 go to: <a href="http://www.nasa.gov/mission_pages/icebridge/index.html" rel="nofollow">www.nasa.gov/mission_pages/icebridge/index.html</a> <b><a href="http://www.nasa.gov/audience/formedia/features/MP_Photo_Guidelines.html" rel="nofollow">NASA image use policy.</a></b> <b><a href="http://www.nasa.gov/centers/goddard/home/index.html" rel="nofollow">NASA Goddard Space Flight Center</a></b> enables NASA’s mission through four scientific endeavors: Earth Science, Heliophysics, Solar System Exploration, and Astrophysics. Goddard plays a leading role in NASA’s accomplishments by contributing compelling scientific knowledge to advance the Agency’s mission. <b>Follow us on <a href="http://twitter.com/NASA_GoddardPix" rel="nofollow">Twitter</a></b> <b>Like us on <a href="http://www.facebook.com/pages/Greenbelt-MD/NASA-Goddard/395013845897?ref=tsd" rel="nofollow">Facebook</a></b> <b>Find us on <a href="http://instagrid.me/nasagoddard/?vm=grid" rel="nofollow">Instagram</a></b>

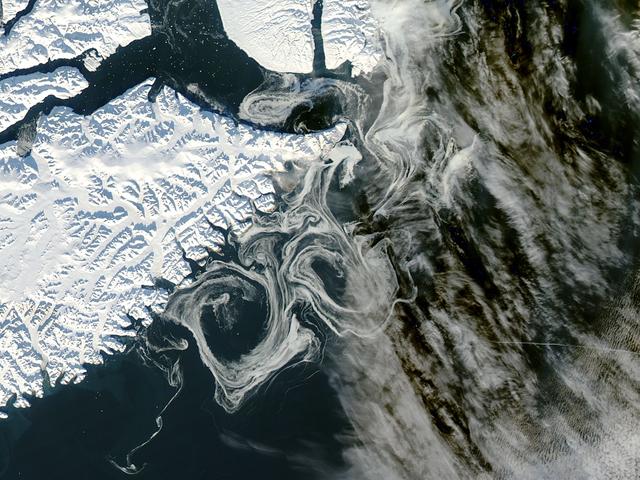
NASA's Aqua satellite observed swirls of sea ice along the coast of Greenland on December 30, 2012. Credit: NASA/GSFC/Jeff Schmaltz/MODIS Land Rapid Response Team <b><a href="http://www.nasa.gov/audience/formedia/features/MP_Photo_Guidelines.html" rel="nofollow">NASA image use policy.</a></b> <b><a href="http://www.nasa.gov/centers/goddard/home/index.html" rel="nofollow">NASA Goddard Space Flight Center</a></b> enables NASA’s mission through four scientific endeavors: Earth Science, Heliophysics, Solar System Exploration, and Astrophysics. Goddard plays a leading role in NASA’s accomplishments by contributing compelling scientific knowledge to advance the Agency’s mission. <b>Follow us on <a href="http://twitter.com/NASA_GoddardPix" rel="nofollow">Twitter</a></b> <b>Like us on <a href="http://www.facebook.com/pages/Greenbelt-MD/NASA-Goddard/395013845897?ref=tsd" rel="nofollow">Facebook</a></b> <b>Find us on <a href="http://instagram.com/nasagoddard?vm=grid" rel="nofollow">Instagram</a></b>
At 1 p.m. EDT (10 a.m. PDT) on Friday, Aug. 28, NASA's Goddard Space Flight Center in Greenbelt, Maryland, will host a live TV program about agency research into how and why the massive Greenland ice sheet is changing. The event features scientists actively conducting field work in Greenland, along with extensive video footage of their work performed over this summer. Panelists include: Tom Wagner (cryosphere program scientist with NASA's Earth Science Division), Laurence Smith (chair of the University of California, Los Angeles Department of Geography), Mike Bevis (professor of geodynamics at Ohio State University in Columbus), Sophie Nowicki (physical scientist at Goddard), and Josh Willis (JPL). The Friday program will air live on NASA TV and stream online at: <a href="http://www.nasa.gov/nasatv" rel="nofollow">www.nasa.gov/nasatv</a>. To ask questions via social media during the televised event, use the hashtag #askNASA. <b><a href="http://www.nasa.gov/audience/formedia/features/MP_Photo_Guidelines.html" rel="nofollow">NASA image use policy.</a></b> <b><a href="http://www.nasa.gov/centers/goddard/home/index.html" rel="nofollow">NASA Goddard Space Flight Center</a></b> enables NASA’s mission through four scientific endeavors: Earth Science, Heliophysics, Solar System Exploration, and Astrophysics. Goddard plays a leading role in NASA’s accomplishments by contributing compelling scientific knowledge to advance the Agency’s mission. <b>Follow us on <a href="http://twitter.com/NASAGoddardPix" rel="nofollow">Twitter</a></b> <b>Like us on <a href="http://www.facebook.com/pages/Greenbelt-MD/NASA-Goddard/395013845897?ref=tsd" rel="nofollow">Facebook</a></b> <b>Find us on <a href="http://instagrid.me/nasagoddard/?vm=grid" rel="nofollow">Instagram</a></b>
This spectacular north looking view of south Greenland (62.0N, 46.0W) shows numerous indentations along the coastline, many of which contain small settlements. These indentations are fiords carved by glaciers of the last ice age. Even today, ice in the center of Greenland is as much as 10,000 ft. thick and great rivers of ice continuously flow toward the sea, where they melt or break off as icebergs - some of which may be seen floating offshore.
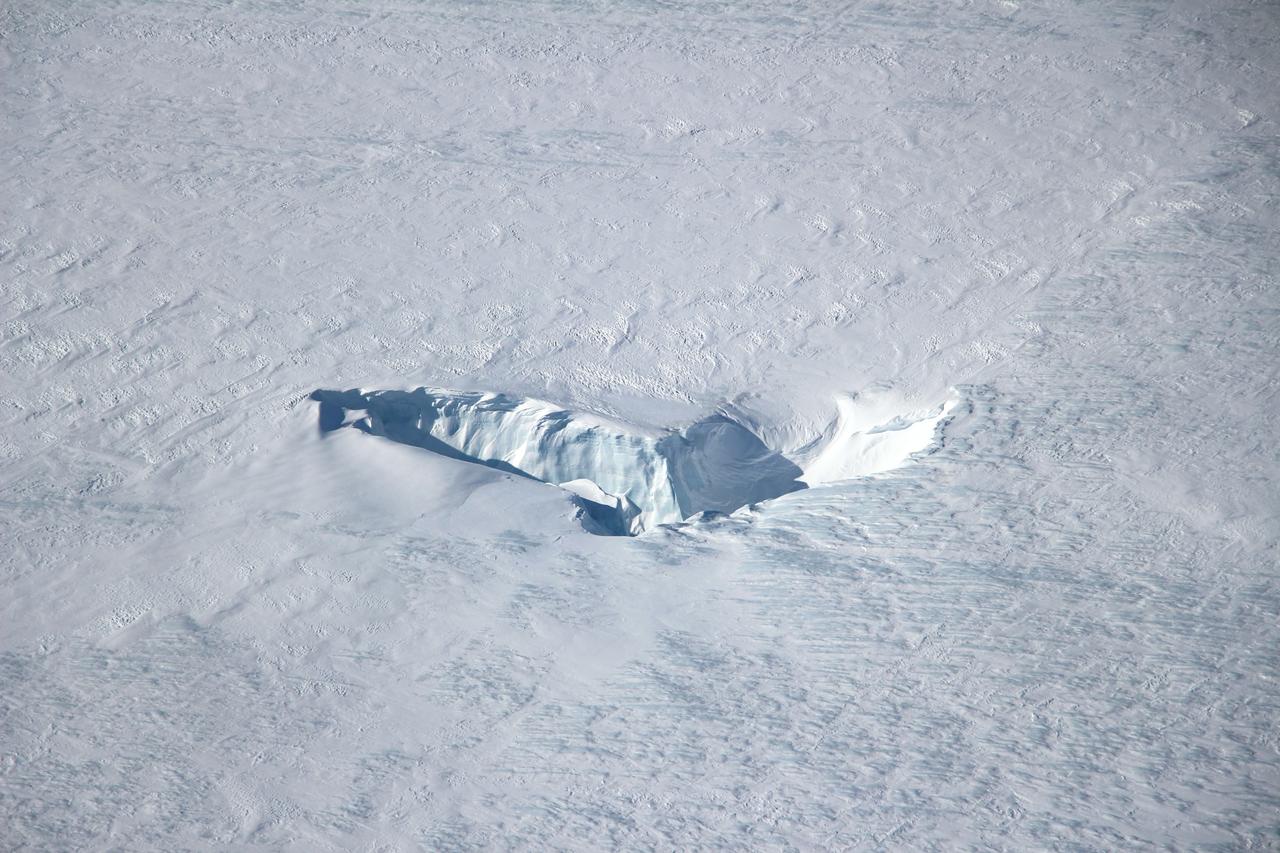
Scientists and crew with NASA’s Operation IceBridge, which makes annual aerial surveys of polar ice, are wrapping up their seventh campaign over the Arctic. In spring 2015, the team began using a different research aircraft—an adapted C-130 Hercules. They also added four new high-priority targets in the rapidly changing region of northeast Greenland. Many of the flights, however, were routine. And that’s exactly the point; making measurements over the same path each year provides continuity between NASA’s Ice, Cloud, and Land Elevation Satellite (ICESat) missions—the first of which ended in 2009 and the second of which is scheduled for launch in 2017. Repeat measurements show how a landscape changes over time. One area that has been surveyed repeatedly is northern Greenland’s Ryder Glacier. This photograph, taken during the IceBridge flight on May 6, 2015, shows a large moulin—dozens of meters across—atop this glacier. Moulins are holes in the ice sheet that drain melt water from the ice sheet’s surface to the bottom or out to the sea. Scientists are working to figure out what happens to melt water once it enters a moulin. Read more: <a href="http://earthobservatory.nasa.gov/IOTD/view.php?id=85858&eocn=home&eoci=iotd_title" rel="nofollow">earthobservatory.nasa.gov/IOTD/view.php?id=85858&eocn...</a> Credit: <b><a href="http://www.earthobservatory.nasa.gov/" rel="nofollow"> NASA Earth Observatory</a></b> <b><a href="http://www.nasa.gov/audience/formedia/features/MP_Photo_Guidelines.html" rel="nofollow">NASA image use policy.</a></b> <b><a href="http://www.nasa.gov/centers/goddard/home/index.html" rel="nofollow">NASA Goddard Space Flight Center</a></b> enables NASA’s mission through four scientific endeavors: Earth Science, Heliophysics, Solar System Exploration, and Astrophysics. Goddard plays a leading role in NASA’s accomplishments by contributing compelling scientific knowledge to advance the Agency’s mission. <b>Follow us on <a href="http://twitter.com/NASAGoddardPix" rel="nofollow">Twitter</a></b> <b>Like us on <a href="http://www.facebook.com/pages/Greenbelt-MD/NASA-Goddard/395013845897?ref=tsd" rel="nofollow">Facebook</a></b> <b>Find us on <a href="http://instagrid.me/nasagoddard/?vm=grid" rel="nofollow">Instagram</a></b>
The frequent coverage provided by NASA SeaWinds instrument on the QuikScat satellite in 1999 provided unprecedented capability to monitor daily and seasonal changes in the key melt zones of Greenland.
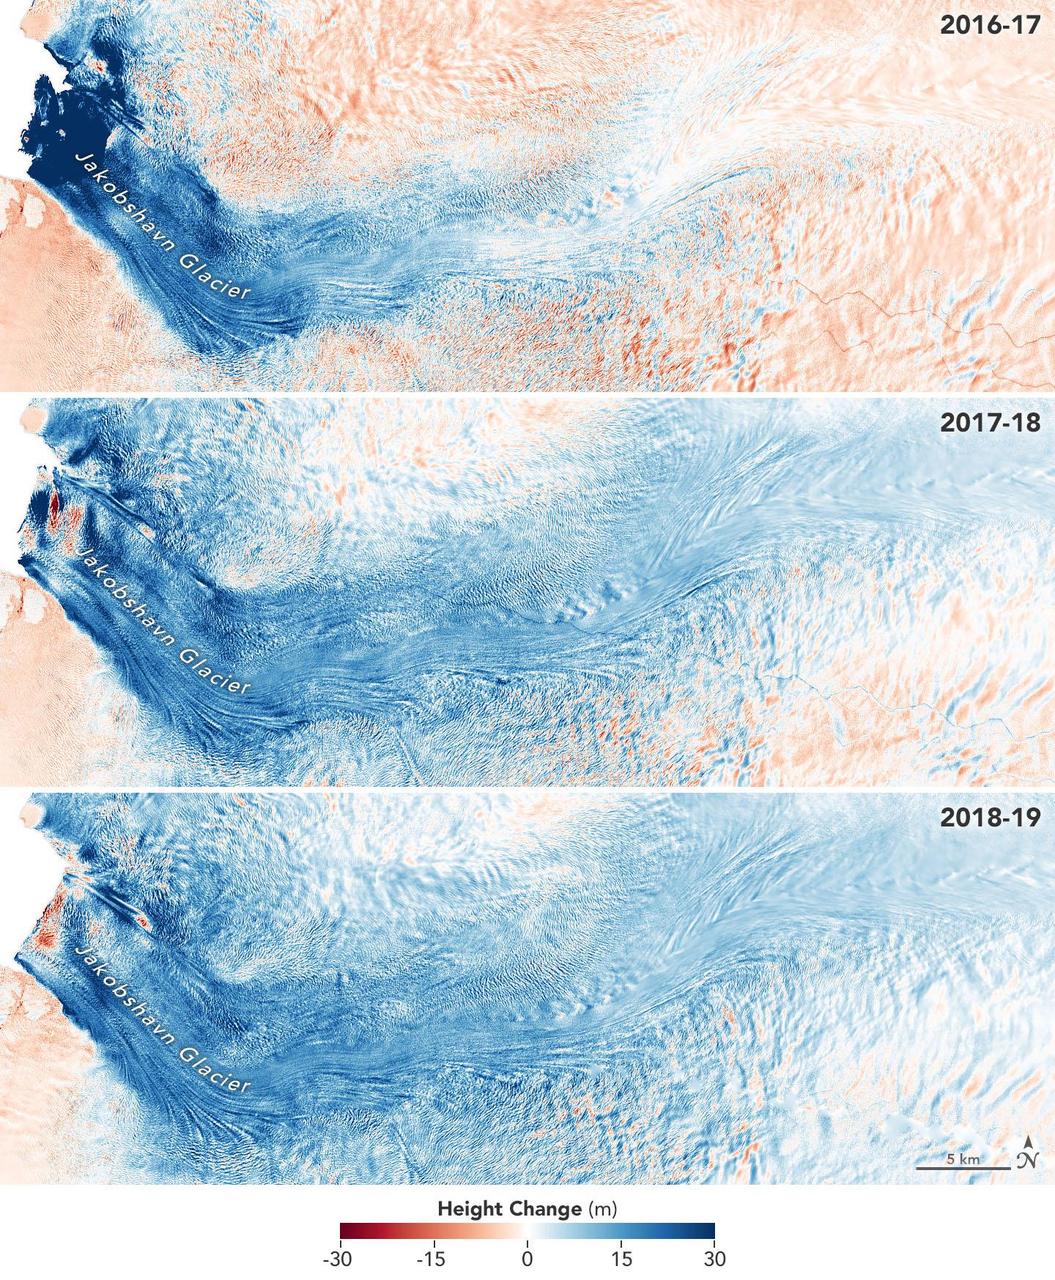
These images show the mass Greenland's Jakobshavn Glacier has gained from 2016-17, 2017-18 and 2018-19. Areas with the most growth — about 33 yards (30 meters) — are shown in dark blue. Red areas represent thinning. The images were produced using GLISTIN-A radar data as part of NASA's Ocean's Melting Greenland (OMG) mission. https://photojournal.jpl.nasa.gov/catalog/PIA23147
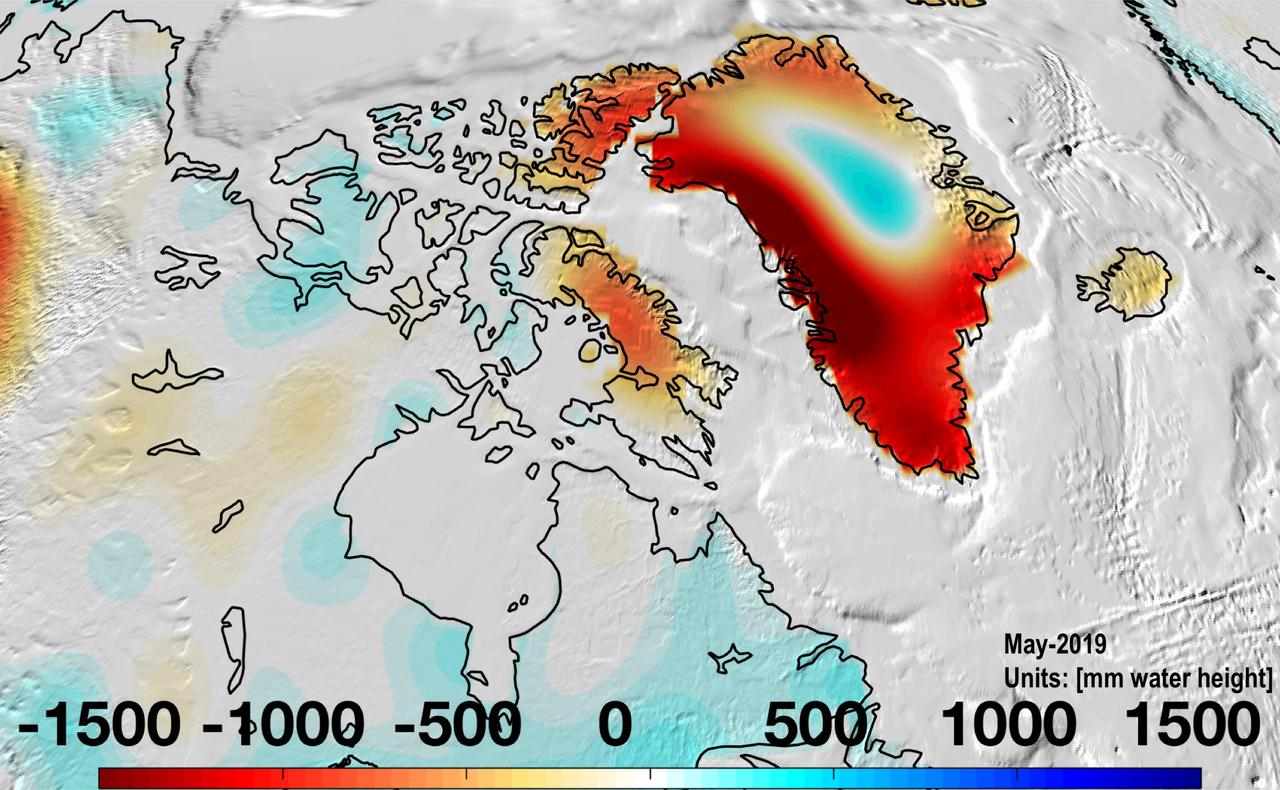
Almost all of Greenland continued to lose mass in May 2019 as the ice sheet continues to melt. https://photojournal.jpl.nasa.gov/catalog/PIA23340
This north-looking view of southwestern Greenland was taken in November, 1994, and shows numerous indentations, many of which contain small settlements. These fjords were carved by the glaciers of the last ice age 10,000 years ago. Even today, the ice in the center of Greenland is nearly 3,500 meters (11,000 feet) thick and great rivers of ice continuously flow down toward the sea, where they melt or break off as icebergs. Some Icebergs exceed the size of small islands, weigh several million tons, and rise several hundred feet above the sea surface. Cape Farewell is visible toward the bottom right of the view. Julianehab Bay and the Bredev fjord can be seen toward the center of the photograph. Godthab, the main settlement on Greenland, is barely visible to the north of the Frederikeshabs Icefield near the left center of the view.

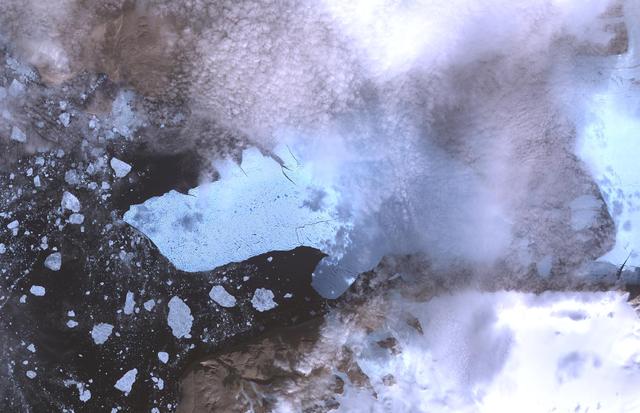
For five years, Jeremy Harbeck has worked as a support scientist for NASA’s Operation IceBridge, an airborne mission to study polar ice. The data processing that he does typically takes place in an office at NASA’s Goddard Space Flight Center in Maryland. However, to speed the process of delivering data to the Arctic sea ice forecasting community, Harbeck traveled to Greenland for the first time in spring 2015. He had just arrived at Greenland’s Thule Air Base on March 20 when a mechanical issue grounded the aircraft. No science flight could happen for a few days. As teams in the United States and Greenland scrambled to locate and deliver a replacement part, researchers on the ground waited. Some of them hiked to what was locally known as “the iceberg.” The unnamed berg pictured above has been frozen in place by sea ice in North Star Bay. Harbeck shot the photograph—a composite of four 49-second images—on March 21 at about 2:30 a.m. local time. The sun never fully sets at this time of year in the Arctic, so sunlight appears on the left side of the image. Lights from Thule are visible on the right side. Look for the Milky Way (top left) and a few very faint meteors visible in the early morning sky. Harbeck left the dock at Thule with sea ice scientist (and current IceBridge project scientist) Nathan Kurtz and a local recreation officer at about 10 p.m. From there, the group hiked 2.4 kilometers (1.5 miles) across the still-thick sea ice in weather that Harbeck called a “pleasant” minus 18 degrees Celsius (0 degrees Fahrenheit). They paused frequently on the way, and they even circled the berg to check for polar bears. “You don’t have a sense of scale of this berg until you get up to it,” Harbeck said. “It’s about the size of my apartment building, and that’s only the part protruding from the water.” Assuming the berg is ungrounded (which is uncertain), about one-tenth of its mass is above water. Photograph by Jeremy Harbeck, support scientist for NASA's Operation IceBridge mission. Caption by Kathryn Hansen. Credit: <b><a href="http://www.earthobservatory.nasa.gov/" rel="nofollow"> NASA Earth Observatory</a></b> <b><a href="http://www.nasa.gov/audience/formedia/features/MP_Photo_Guidelines.html" rel="nofollow">NASA image use policy.</a></b> <b><a href="http://www.nasa.gov/centers/goddard/home/index.html" rel="nofollow">NASA Goddard Space Flight Center</a></b> enables NASA’s mission through four scientific endeavors: Earth Science, Heliophysics, Solar System Exploration, and Astrophysics. Goddard plays a leading role in NASA’s accomplishments by contributing compelling scientific knowledge to advance the Agency’s mission. <b>Follow us on <a href="http://twitter.com/NASAGoddardPix" rel="nofollow">Twitter</a></b> <b>Like us on <a href="http://www.facebook.com/pages/Greenbelt-MD/NASA-Goddard/395013845897?ref=tsd" rel="nofollow">Facebook</a></b> <b>Find us on <a href="http://instagrid.me/nasagoddard/?vm=grid" rel="nofollow">Instagram</a></b>
Peering into the thousands of frozen layers inside Greenland’s ice sheet is like looking back in time. Each layer provides a record of what Earth’s climate was like at the dawn of civilization, or during the last ice age, or during an ancient period of warmth similar to the one we experience today. Scientists using ice-penetrating radar data collected by NASA’s Operation IceBridge and earlier airborne campaigns have built the first-ever comprehensive map of layers deep inside the Greenland Ice Sheet. View the full video: <a href="http://youtu.be/u0VbPE0TOtQ" rel="nofollow">youtu.be/u0VbPE0TOtQ</a> Credit: NASA’s Goddard Space Flight Center <b><a href="http://www.nasa.gov/audience/formedia/features/MP_Photo_Guidelines.html" rel="nofollow">NASA image use policy.</a></b> <b><a href="http://www.nasa.gov/centers/goddard/home/index.html" rel="nofollow">NASA Goddard Space Flight Center</a></b> enables NASA’s mission through four scientific endeavors: Earth Science, Heliophysics, Solar System Exploration, and Astrophysics. Goddard plays a leading role in NASA’s accomplishments by contributing compelling scientific knowledge to advance the Agency’s mission. <b>Follow us on <a href="http://twitter.com/NASAGoddardPix" rel="nofollow">Twitter</a></b> <b>Like us on <a href="http://www.facebook.com/pages/Greenbelt-MD/NASA-Goddard/395013845897?ref=tsd" rel="nofollow">Facebook</a></b> <b>Find us on <a href="http://instagram.com/nasagoddard?vm=grid" rel="nofollow">Instagram</a></b>
On April 8, 2011, IceBridge flew a mission to coastal areas in southwest Greenland. Mountains and an open-water fjord surround one of the mission's targets, a small ice cap called Sukkertoppen Isflade. Operation IceBridge, now in its third year, makes annual campaigns in the Arctic and Antarctic where science flights monitor glaciers, ice sheets and sea ice. Credit: NASA/GSFC/Michael Studinger To learn more about Ice Bridge go to: <a href="http://www.nasa.gov/mission_pages/icebridge/news/spr11/index.html" rel="nofollow">www.nasa.gov/mission_pages/icebridge/news/spr11/index.html</a> <b><a href="http://www.nasa.gov/centers/goddard/home/index.html" rel="nofollow">NASA Goddard Space Flight Center</a></b> enables NASA’s mission through four scientific endeavors: Earth Science, Heliophysics, Solar System Exploration, and Astrophysics. Goddard plays a leading role in NASA’s accomplishments by contributing compelling scientific knowledge to advance the Agency’s mission. <b>Follow us on <a href="http://twitter.com/NASA_GoddardPix" rel="nofollow">Twitter</a></b> <b>Join us on <a href="http://www.facebook.com/pages/Greenbelt-MD/NASA-Goddard/395013845897?ref=tsd" rel="nofollow">Facebook</a></b>
NASA GRACE mission has become a key source of knowledge about global ice mass changes. Studies of Greenland using GRACE and other data indicate that between 2000 and 2008 the Greenland ice sheet lost as much as 1,500 gigatons of mass.
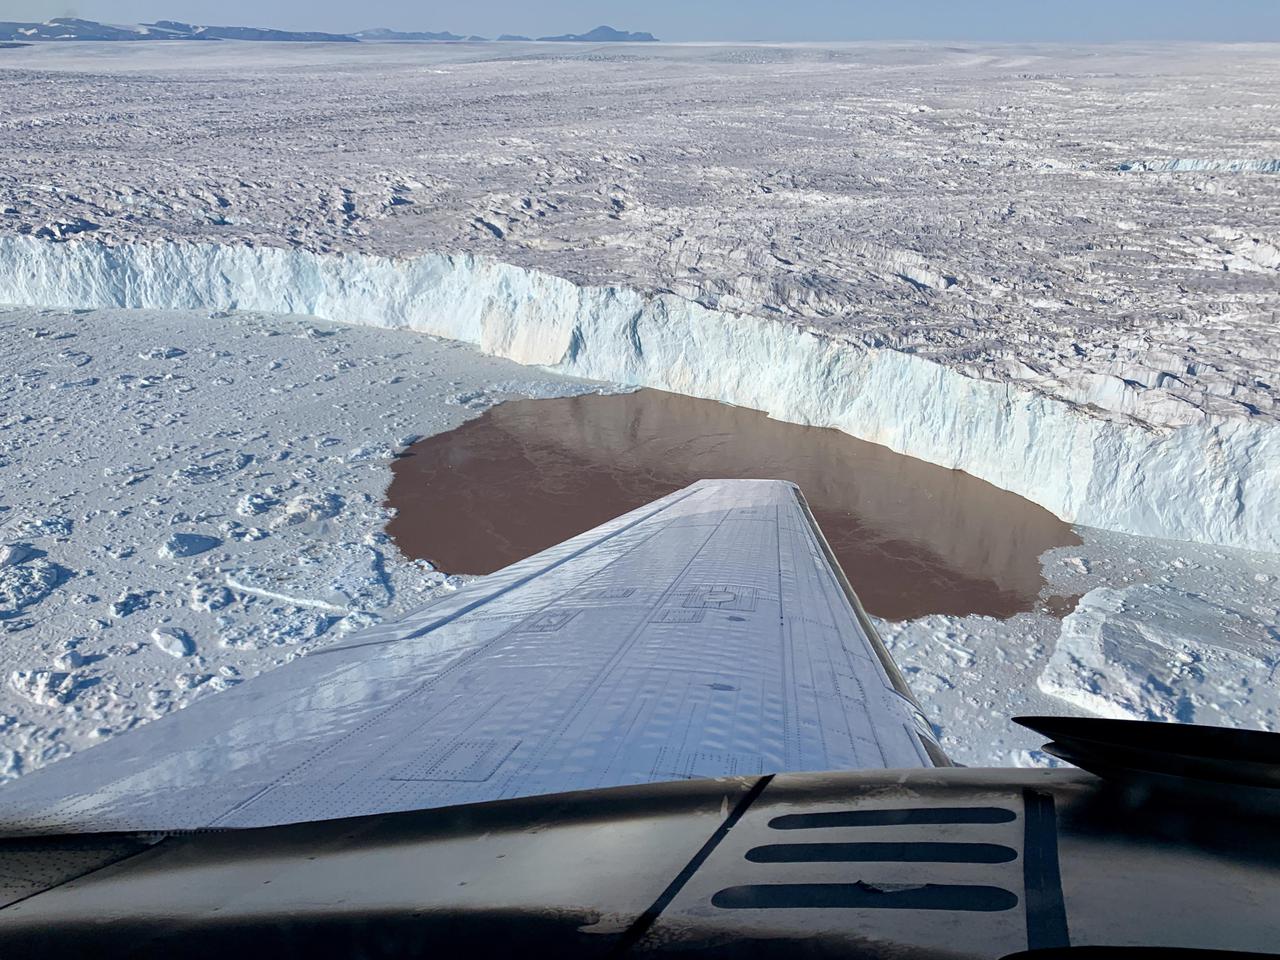
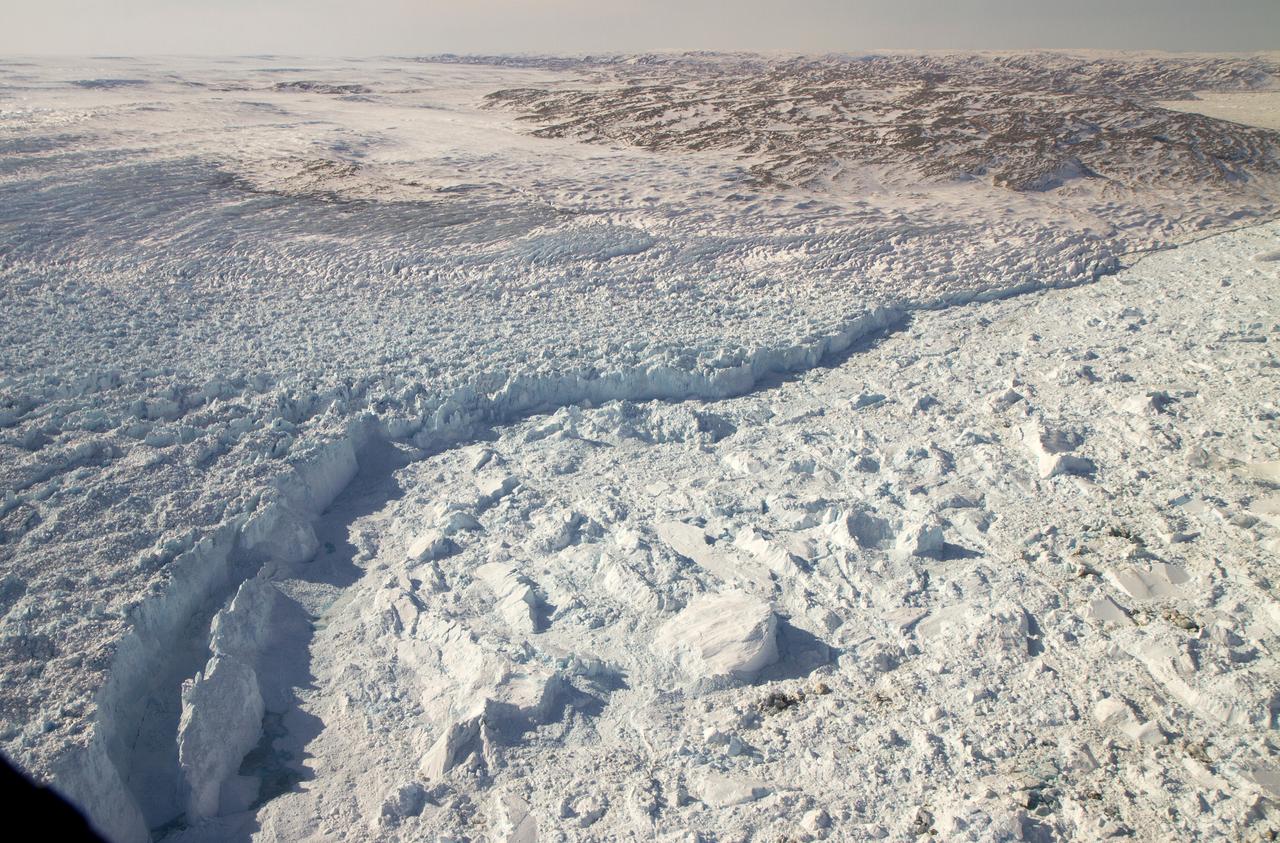
In this aerial view, a glacier along Greenland's craggy coastline is actively undergoing undercutting, a process in which meltwater flowing out from the bottom of the glacier enters the fjord. The brown water in front of the glacier is caused by sediment being dredged up from the base of the glacier by meltwater plumes reaching the surface of the fjord. Because the meltwater contains no salt, it is lighter and rises through the saltier ocean water, dragging the warm ocean water into contact with the ice at the glacier's base. The result is increased melting at the bottom of the glacier, which creates and overhanging layer of ice that breaks off (or calves) as icebergs. As the climate warms, the ocean water temperature and the amount of meltwater both increase, combining to hasten this undercutting process and speed up the ice loss from Greenland's Ice Sheet. The image was taken on Aug. 25, 2019 by a probe-dropping airplane as part of the Oceans Melting Greenland (OMG) mission. OMG has been studying glaciers that plunge into Greenland's steep-sided inlets, or fjords, for the past five years, gathering precise measurements of fjord depth and water salinity from probes dropped by plane, supplemented by measurements made by boat. The aim is to better understand how the warming ocean water around Greenland is hastening ice melt and calving of these marine-terminating glaciers. https://photojournal.jpl.nasa.gov/catalog/PIA24162
NASA image acquired October 16, 2012 The MODIS instrument on NASA's Aqua satellite captured this visible image of Sea Ice off eastern Greenland on October 16, 2012. NASA/GSFC/Jeff Schmaltz/MODIS Land Rapid Response Team <b><a href="http://www.nasa.gov/audience/formedia/features/MP_Photo_Guidelines.html" rel="nofollow">NASA image use policy.</a></b> <b><a href="http://www.nasa.gov/centers/goddard/home/index.html" rel="nofollow">NASA Goddard Space Flight Center</a></b> enables NASA’s mission through four scientific endeavors: Earth Science, Heliophysics, Solar System Exploration, and Astrophysics. Goddard plays a leading role in NASA’s accomplishments by contributing compelling scientific knowledge to advance the Agency’s mission. <b>Follow us on <a href="http://twitter.com/NASA_GoddardPix" rel="nofollow">Twitter</a></b> <b>Like us on <a href="http://www.facebook.com/pages/Greenbelt-MD/NASA-Goddard/395013845897?ref=tsd" rel="nofollow">Facebook</a></b> <b>Find us on <a href="http://instagrid.me/nasagoddard/?vm=grid" rel="nofollow">Instagram</a></b>
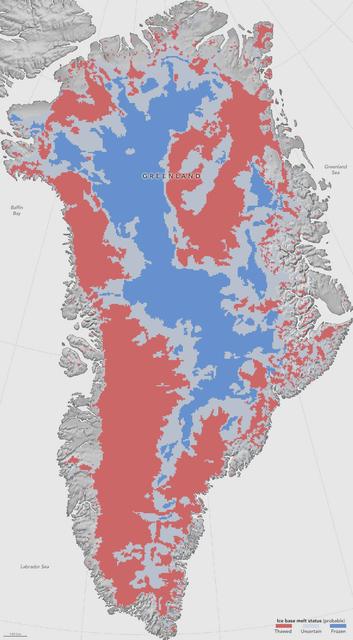
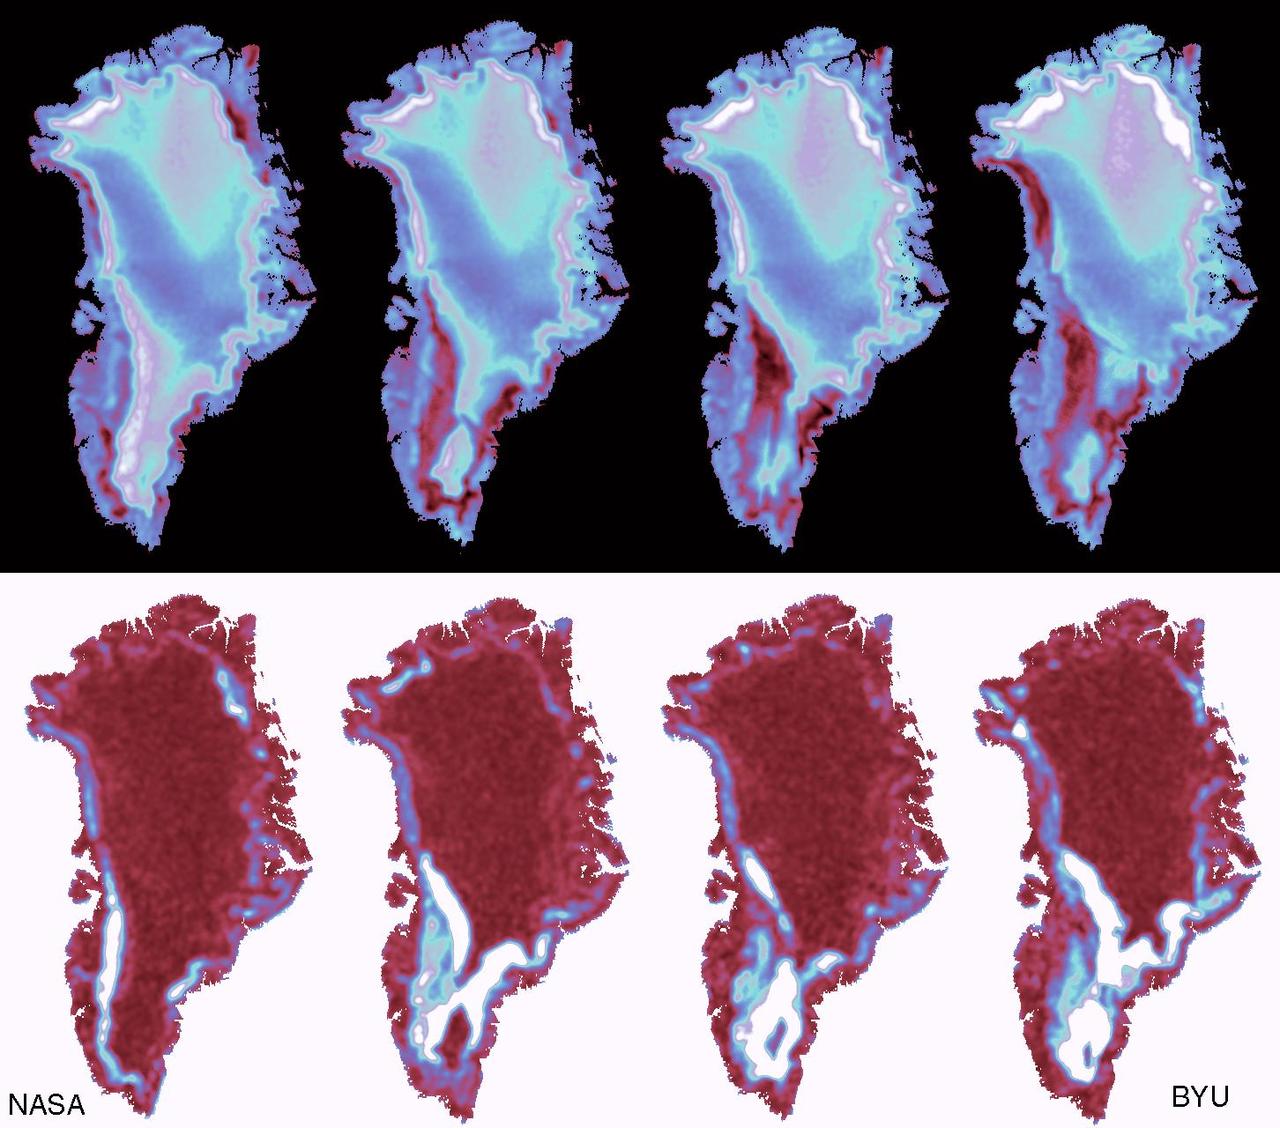
NASA researchers have helped produce the first map showing what parts of the bottom of the massive Greenland Ice Sheet are thawed – key information in better predicting how the ice sheet will react to a warming climate. Greenland’s thick ice sheet insulates the bedrock below from the cold temperatures at the surface, so the bottom of the ice is often tens of degrees warmer than at the top, because the ice bottom is slowly warmed by heat coming from the Earth’s depths. Knowing whether Greenland’s ice lies on wet, slippery ground or is anchored to dry, frozen bedrock is essential for predicting how this ice will flow in the future, But scientists have very few direct observations of the thermal conditions beneath the ice sheet, obtained through fewer than two dozen boreholes that have reached the bottom. Now, a new study synthesizes several methods to infer the Greenland Ice Sheet’s basal thermal state –whether the bottom of the ice is melted or not– leading to the first map that identifies frozen and thawed areas across the whole ice sheet. Map caption: This first-of-a-kind map, showing which parts of the bottom of the Greenland Ice Sheet are likely thawed (red), frozen (blue) or still uncertain (gray), will help scientists better predict how the ice will flow in a warming climate. Credit: NASA Earth Observatory/Jesse Allen Read more: <a href="http://go.nasa.gov/2avKgl2" rel="nofollow">go.nasa.gov/2avKgl2</a> <b><a href="http://www.nasa.gov/audience/formedia/features/MP_Photo_Guidelines.html" rel="nofollow">NASA image use policy.</a></b> <b><a href="http://www.nasa.gov/centers/goddard/home/index.html" rel="nofollow">NASA Goddard Space Flight Center</a></b> enables NASA’s mission through four scientific endeavors: Earth Science, Heliophysics, Solar System Exploration, and Astrophysics. Goddard plays a leading role in NASA’s accomplishments by contributing compelling scientific knowledge to advance the Agency’s mission. <b>Follow us on <a href="http://twitter.com/NASAGoddardPix" rel="nofollow">Twitter</a></b> <b>Like us on <a href="http://www.facebook.com/pages/Greenbelt-MD/NASA-Goddard/395013845897?ref=tsd" rel="nofollow">Facebook</a></b> <b>Find us on <a href="http://instagrid.me/nasagoddard/?vm=grid" rel="nofollow">Instagram</a></b>
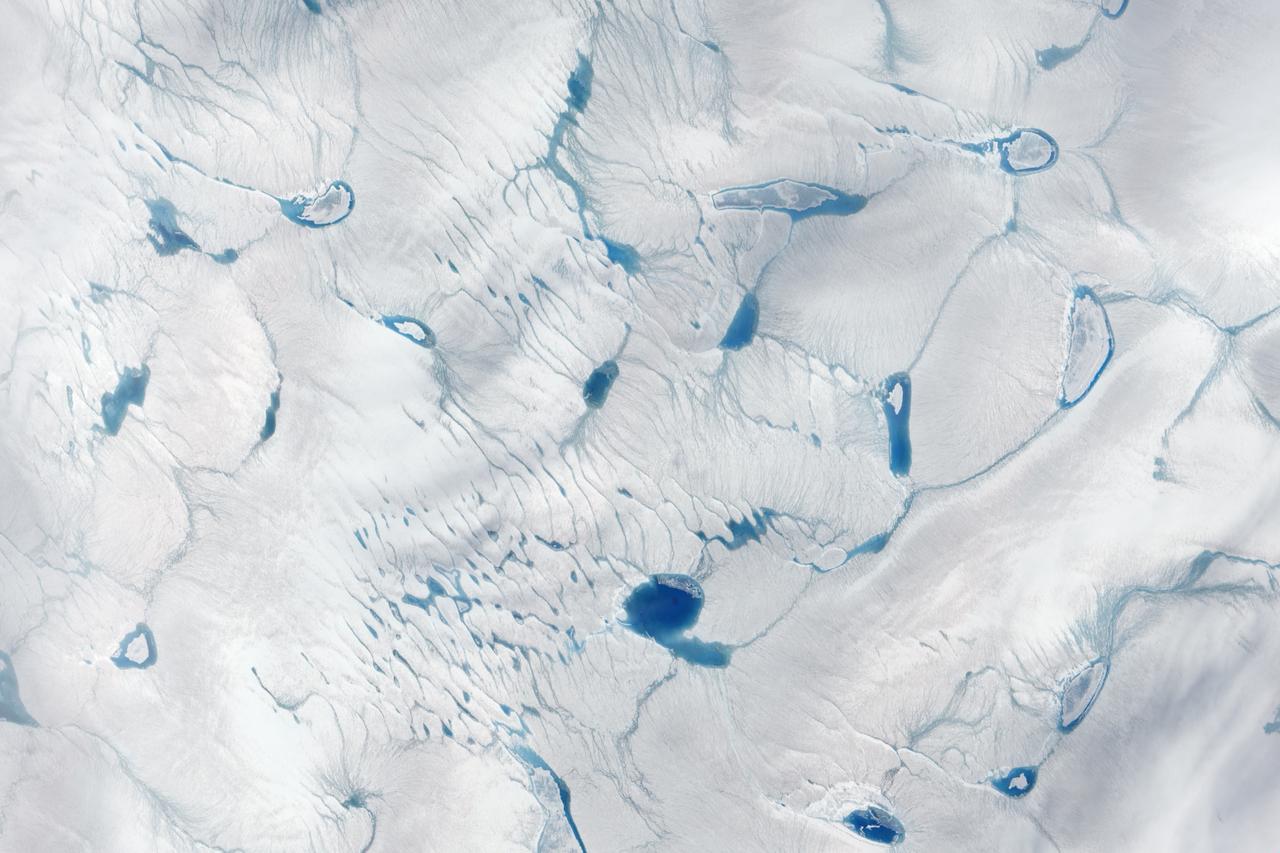
On June 15, 2016, the Advanced Land Imager (ALI) on NASA’s Earth Observing-1 satellite acquired a natural-color image of an area just inland from the coast of southwestern Greenland (120 kilometers southeast of Ilulisat and 500 kilometers north-northeast of Nuuk). According to Marco Tedesco, a professor at Columbia University’s Lamont Doherty Earth Observatory, melting in this area began relatively early in April but was not sustained. It started up again in May and grew into the watery June scene pictured above. Surface melt can directly contribute to sea level rise via runoff. It can also force its way through crevasses to the base of a glacier, temporarily speeding up ice flow and indirectly contributing to sea level rise. Also, ponding of meltwater can “darken” the ice sheet’s surface and lead to further melting. Read more: <a href="https://earthobservatory.nasa.gov/IOTD/view.php?id=88288" rel="nofollow">earthobservatory.nasa.gov/IOTD/view.php?id=88288</a> Credit: NASA Earth Observatory image by Jesse Allen, using EO-1 ALI data provided courtesy of the NASA EO-1 team <b><a href="http://www.nasa.gov/audience/formedia/features/MP_Photo_Guidelines.html" rel="nofollow">NASA image use policy.</a></b> <b><a href="http://www.nasa.gov/centers/goddard/home/index.html" rel="nofollow">NASA Goddard Space Flight Center</a></b> enables NASA’s mission through four scientific endeavors: Earth Science, Heliophysics, Solar System Exploration, and Astrophysics. Goddard plays a leading role in NASA’s accomplishments by contributing compelling scientific knowledge to advance the Agency’s mission. <b>Follow us on <a href="http://twitter.com/NASAGoddardPix" rel="nofollow">Twitter</a></b> <b>Like us on <a href="http://www.facebook.com/pages/Greenbelt-MD/NASA-Goddard/395013845897?ref=tsd" rel="nofollow">Facebook</a></b> <b>Find us on <a href="http://instagrid.me/nasagoddard/?vm=grid" rel="nofollow">Instagram</a></b>
Vibrant reds, emerald greens, brilliant whites, and pastel blues adorn this view of the area surrounding the Jakobshavn Glacier on the western coast of Greenland captured by NASA Terra spacecraft on June 18, 2003.
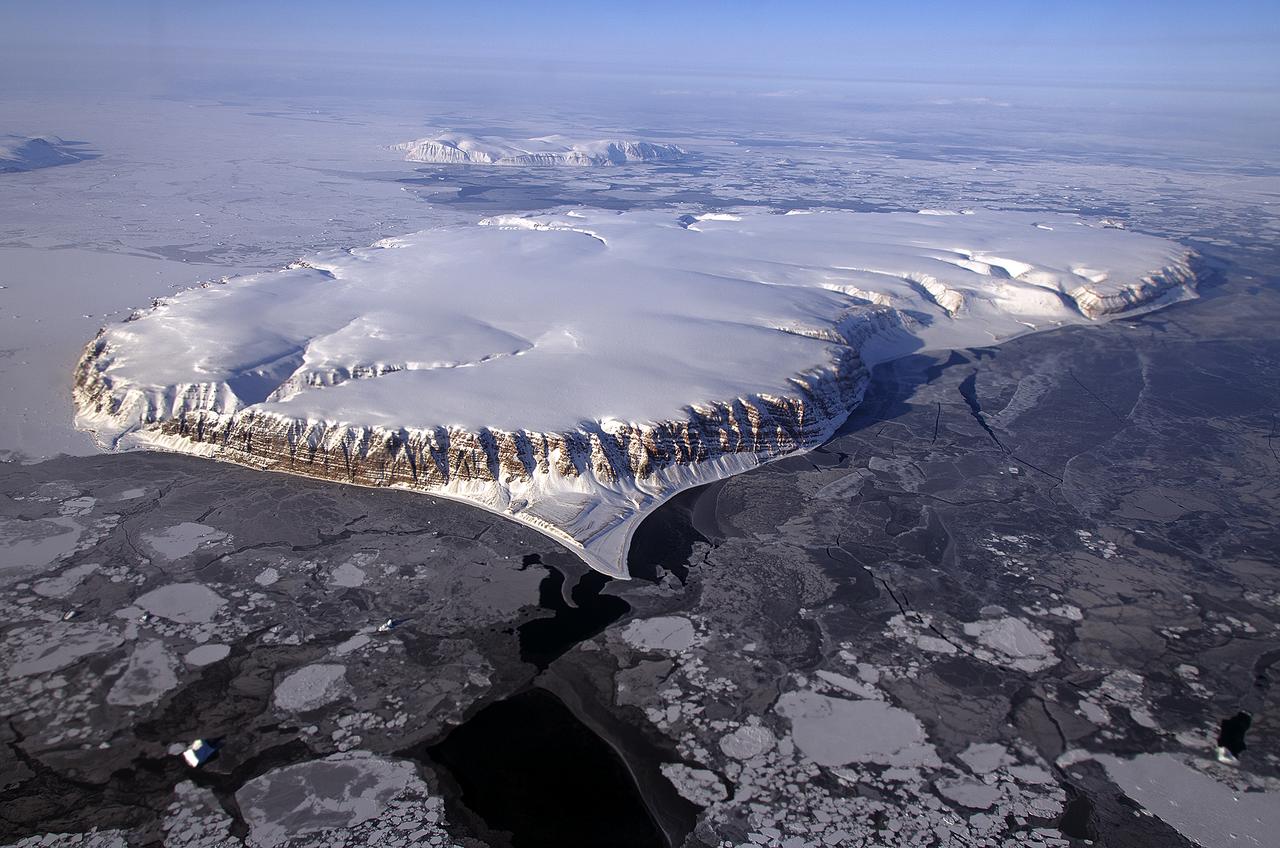
The northernmost land in the world is located in Pearyland, Greenland, at a latitude of 83 degrees, 39.6 minutes. This is a land of permanent snows, glaciers, and 24-hours of daylight during the summer months. The ASTER image was acquired May 17, 2003, covers an area of 47.9 x 42.1 km, and is located at 83.6 degrees north latitude, 33.4 degrees west longitude. http://photojournal.jpl.nasa.gov/catalog/PIA11169

NASA's IceBridge, an airborne survey of polar ice, flew over the Helheim/Kangerdlugssuaq region of Greenland on Sept. 11, 2016. This photograph from the flight captures Greenland's Steenstrup Glacier, with the midmorning sun glinting off of the Denmark Strait in the background. IceBridge completed the final flight of the summer campaign to observe the impact of the summer melt season on the ice sheet on Sept. 16. The IceBridge flights, which began on Aug. 27, are mostly repeats of lines that the team flew in early May, so that scientists can observe changes in ice elevation between the spring and late summer. For this short, end-of-summer campaign, the IceBridge scientists flew aboard an HU-25A Guardian aircraft from NASA's Langley Research Center in Hampton, Virginia. Credit: NASA/John Sonntag <b><a href="http://www.nasa.gov/audience/formedia/features/MP_Photo_Guidelines.html" rel="nofollow">NASA image use policy.</a></b> <b><a href="http://www.nasa.gov/centers/goddard/home/index.html" rel="nofollow">NASA Goddard Space Flight Center</a></b> enables NASA’s mission through four scientific endeavors: Earth Science, Heliophysics, Solar System Exploration, and Astrophysics. Goddard plays a leading role in NASA’s accomplishments by contributing compelling scientific knowledge to advance the Agency’s mission. <b>Follow us on <a href="http://twitter.com/NASAGoddardPix" rel="nofollow">Twitter</a></b> <b>Like us on <a href="http://www.facebook.com/pages/Greenbelt-MD/NASA-Goddard/395013845897?ref=tsd" rel="nofollow">Facebook</a></b> <b>Find us on <a href="http://instagrid.me/nasagoddard/?vm=grid" rel="nofollow">Instagram</a></b>
Satellite images from 2022 (Main image) and 1985 (Figure A) capture the retreat of Jakobshavn Isbrae, a glacier on Greenland's western coast, as icebergs broke off its edge over nearly four decades. In a recent study in Nature, researchers from NASA's Jet Propulsion Laboratory in Southern California calculated that Jakobshavn lost an estimated 97 billion tons (88 billion metric tons) of ice in the period between the two images. The earlier image was taken by the Thematic Mapper instrument on the Landsat 5 satellite on Sept. 5, 1985, while the later image was captured by the Operational Land Imager on the Landsat 8 satellite on Sept. 4, 2022. Of the 207 glaciers analyzed in the study, Jakobshavn lost the second most ice mass, trailing only Zachariae Isstrom, a glacier in northeast Greenland. The study took a comprehensive look at glacial retreat around the edges of the entire Greenland Ice Sheet from 1985 to 2022 and found that 179 glaciers retreated significantly since 1985, 27 held steady, and just one advanced slightly. The study found that overall the ice sheet shed about 1,140 billion tons (1,034 billion metric tons) of ice from 1985 to 2022, one-fifth more mass than previously estimated, as icebergs fell into the ocean at an accelerating rate. Most of the ice loss came from below sea level, in fjords on Greenland's periphery. Once occupied by ancient glacial ice, many of these deep coastal valleys have filled with seawater – meaning the ice that broke off made little net contribution to sea level. But the loss likely accelerated the movement of ice flowing down from higher elevations, which in turn added to sea level rise. It also added previously unaccounted-for fresh water to the North Atlantic Ocean, which could have impacts on global ocean currents. https://photojournal.jpl.nasa.gov/catalog/PIA26117
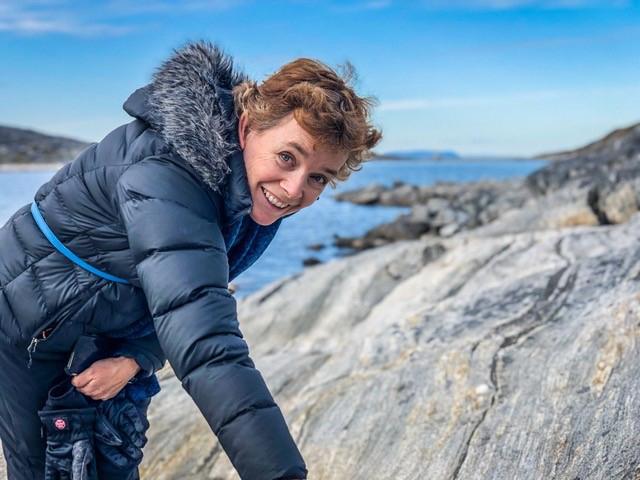
Abigail Allwood, principal investigator of the Planetary Instrument for X-ray Lithochemistry (PIXL) aboard NASA's Perseverance Mars rover, is seen here examining rocks in Greenland. Allwood is a scientist based at NASA's Jet Propulsion Laboratory in Southern California. A key objective for Perseverance's mission on Mars is astrobiology, including the search for signs of ancient microbial life. The rover will characterize the planet's geology and past climate, pave the way for human exploration of the Red Planet, and be the first mission to collect and cache Martian rock and regolith (broken rock and dust). Subsequent NASA missions, in cooperation with ESA (European Space Agency), would send spacecraft to Mars to collect these sealed samples from the surface and return them to Earth for in-depth analysis. The Mars 2020 Perseverance mission is part of NASA's Moon to Mars exploration approach, which includes Artemis missions to the Moon that will help prepare for human exploration of the Red Planet. https://photojournal.jpl.nasa.gov/catalog/PIA24667
This image of Petermann Glacier and the new iceberg was acquired from NASA Terra spacecraft on Aug. 12, 2010. On Aug. 5, 2010, an enormous chunk of ice broke off the Petermann Glacier along the northwestern coast of Greenland.

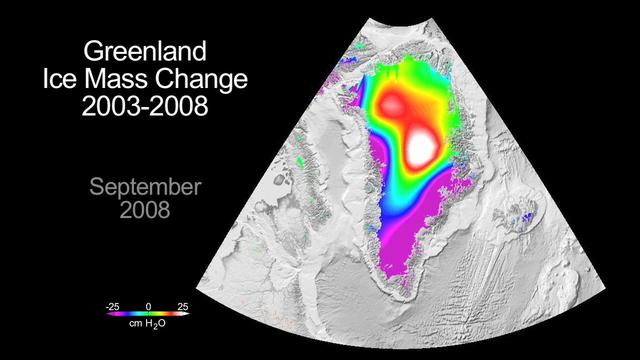
This frame from an animation based on data from NASA Grace satellite shows dramatic changes in Greenland ice mass from 2003 through 2011 revealing how much ice has been lost and gained each year.
Satellite images from 2022 (Main image) and 1999 (Figure A) capture the retreat of Zachariae Isstrom, a glacier in northeast Greenland, as icebergs broke off its edge over the course of 23 years. In a recent study in Nature, researchers from NASA's Jet Propulsion Laboratory in Southern California calculated that Zachariae lost an estimated 176 billion tons (160 billion metric tons) of ice in the period between 1985 and 2022. That was the greatest mass lost for the period of any of the 207 glaciers analyzed in the paper. The earlier image was taken by the Enhanced Thematic Mapper Plus on the Landsat 7 satellite on Aug. 5, 1999, while the later image was captured by the Operational Land Imager on the Landsat 8 satellite on Aug. 22, 2022. The study took a comprehensive look at glacial retreat around the edges of the entire Greenland Ice Sheet from 1985 to 2022 and found that 179 glaciers retreated significantly since 1985, 27 held steady, and just one advanced slightly. The study found that overall the ice sheet shed about 1,140 billion tons (1,034 billion metric tons) of ice from 1985 to 2022, one-fifth more mass than previously estimated, as icebergs fell into the ocean at an accelerating rate. Most of the ice loss came from below sea level, in fjords on Greenland's periphery. Once occupied by ancient glacial ice, many of these deep coastal valleys have filled with seawater – meaning the ice that broke off made little net contribution to sea level. But the loss likely accelerated the movement of ice flowing down from higher elevations, which in turn added to sea level rise. It also added previously unaccounted-for fresh water to the North Atlantic Ocean, which could have impacts on global ocean currents. https://photojournal.jpl.nasa.gov/catalog/PIA26118
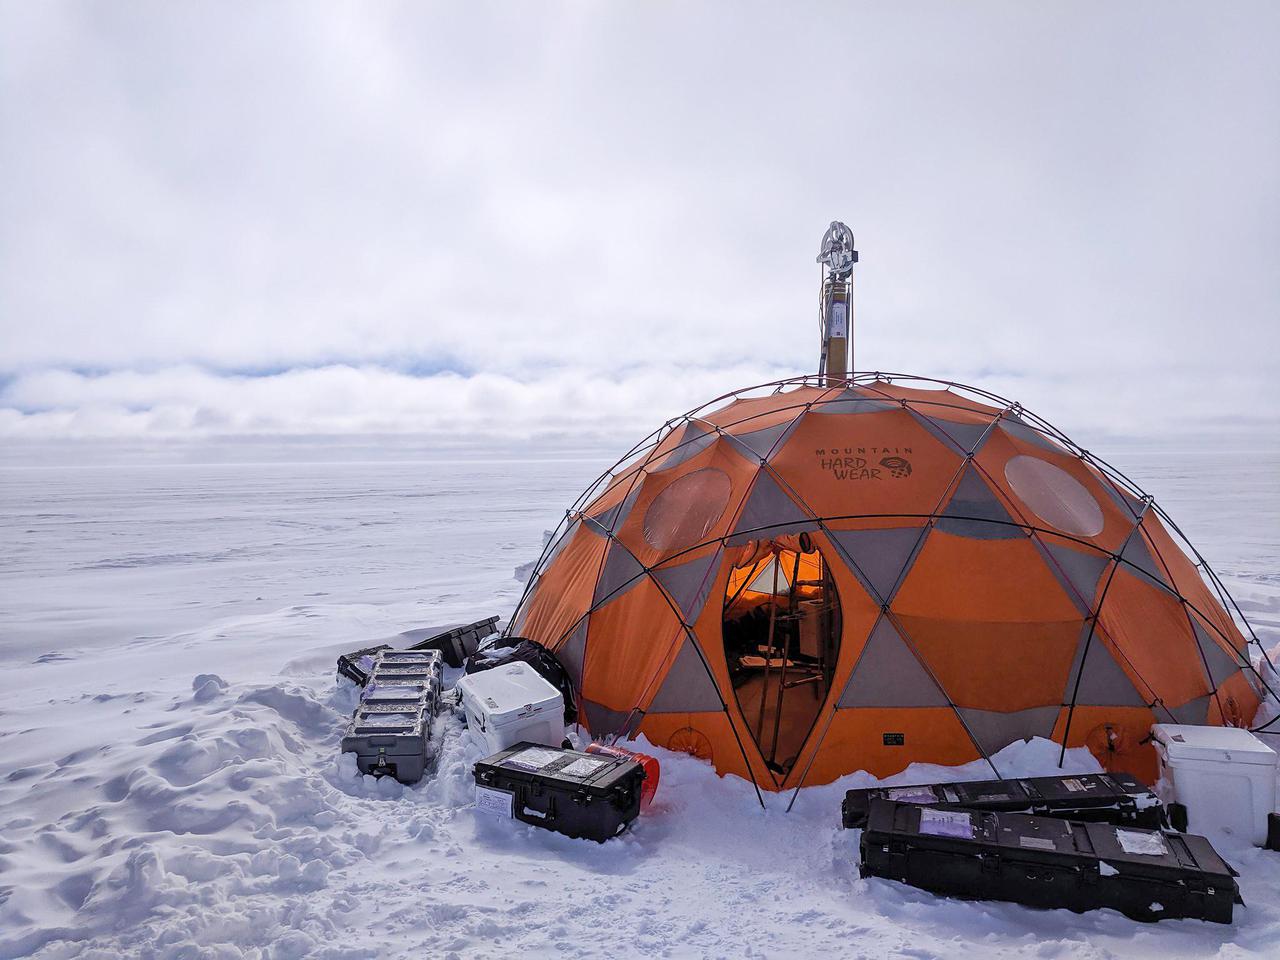
During 2019 field tests near Greenland's Summit Station, a high-elevation remote observing station, the WATSON (Wireline Analysis Tool for the Subsurface Observation of Northern ice sheets) instrument is put through its paces to seek out signs of life, or biosignatures, 360 feet (110 meters) down a borehole. In this photograph, the winch that holds the drill pokes out the top of the drill tent. WATSON could one day be launched aboard a robotic mission to seek out biosignatures on the ocean moons of Enceladus, Europa, or even Titan. The WATSON team hopes to test the instrument in a variety of cold locations on Earth to see how the distribution and variety of biosignatures change depending on where they are. By testing WATSON in different Earth analogs — areas on Earth that can stand in for those on other worlds — scientists would be able to better understand the chemical fingerprints of any biosignatures detected on other worlds. https://photojournal.jpl.nasa.gov/catalog/PIA24169
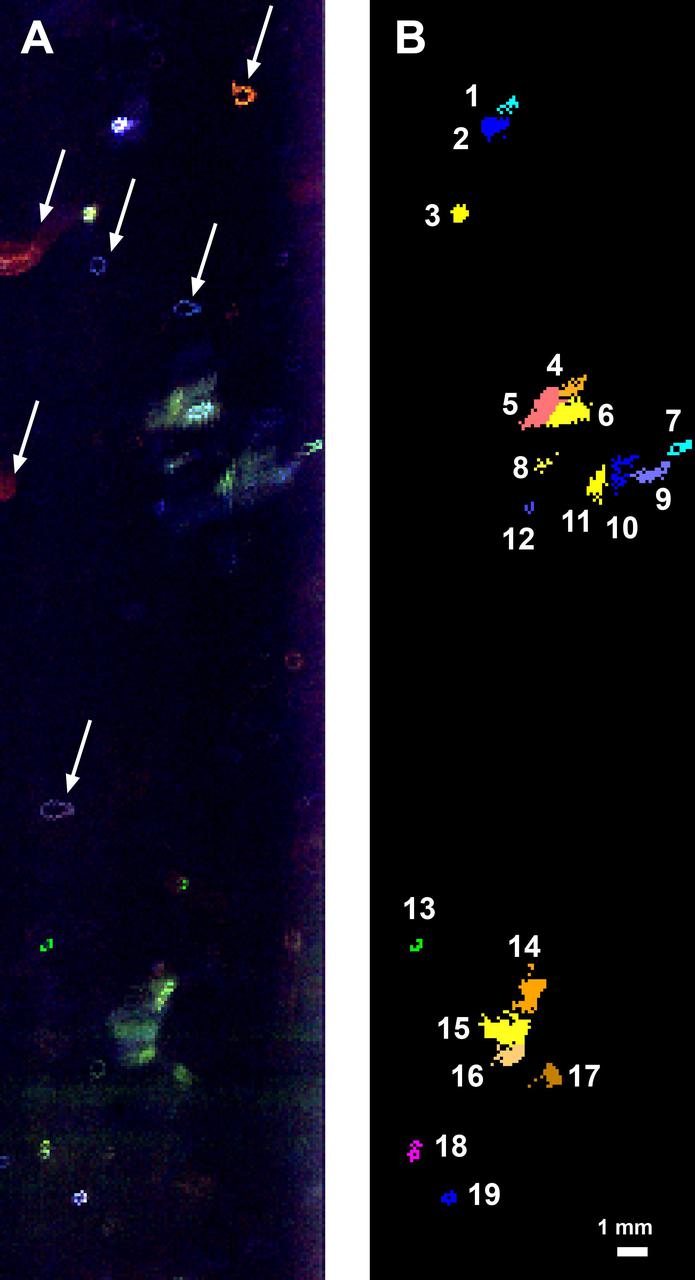
This fluorescence map of the inside wall of an ice borehole near Greenland's Summit Station was produced at a depth of 307.7 feet (93.8 meters) into the ice sheet by the WATSON (Wireline Analysis Tool for the Subsurface Observation of Northern ice sheets) instrument. Recorded during a 2019 field test of the WATSON instrument, the left panel shows the variety of biosignatures that were detected in the ice — different colors represent different organic molecules, some of which are likely microbes. The arrows highlight artifacts on the instrument's optical window, not biosignatures in the ice. In the right panel, the biosignature detections have been colorized to indicate the different features detected. Blotches that are the same color are likely made of the same chemicals. The numbers list the different and distinct features that WATSON detected at that depth in the ice. WATSON could one day be launched aboard a robotic mission to seek out biosignatures on the ocean moons of Enceladus, Europa, or even Titan. The WATSON team hopes to test the instrument in a variety of cold locations on Earth to see how the distribution and variety of biosignatures change depending on where they are. By testing WATSON in different "Earth analogs," scientists would be able to better understand the chemical fingerprints of any biosignatures detected on other worlds. https://photojournal.jpl.nasa.gov/catalog/PIA24140
Laurence Smith, chair of geography at University of California, Los Angeles, deploys an autonomous drift boat equipped with several sensors in a meltwater river on the surface of the Greenland ice sheet on July 19, 2015. “Surface melting in Greenland has increased recently, and we lacked a rigorous estimate of the water volumes being produced and their transport,” said Tom Wagner, the cryosphere program scientist at NASA Headquarters in Washington. “NASA funds fieldwork like Smith’s because it helps us to interpret satellite data, and to extrapolate measurements from the local field sites to the larger ice sheet." Credit: NASA/Goddard/Jefferson Beck Read more: <a href="http://www.nasa.gov/feature/a-summer-of-nasa-research-on-sea-level-rise-in-greenland" rel="nofollow">www.nasa.gov/feature/a-summer-of-nasa-research-on-sea-lev...</a> <b><a href="http://www.nasa.gov/audience/formedia/features/MP_Photo_Guidelines.html" rel="nofollow">NASA image use policy.</a></b> <b><a href="http://www.nasa.gov/centers/goddard/home/index.html" rel="nofollow">NASA Goddard Space Flight Center</a></b> enables NASA’s mission through four scientific endeavors: Earth Science, Heliophysics, Solar System Exploration, and Astrophysics. Goddard plays a leading role in NASA’s accomplishments by contributing compelling scientific knowledge to advance the Agency’s mission. <b>Follow us on <a href="http://twitter.com/NASAGoddardPix" rel="nofollow">Twitter</a></b> <b>Like us on <a href="http://www.facebook.com/pages/Greenbelt-MD/NASA-Goddard/395013845897?ref=tsd" rel="nofollow">Facebook</a></b> <b>Find us on <a href="http://instagrid.me/nasagoddard/?vm=grid" rel="nofollow">Instagram</a></b>
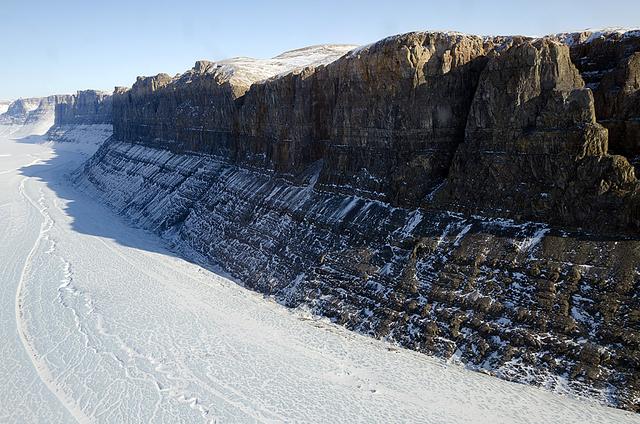
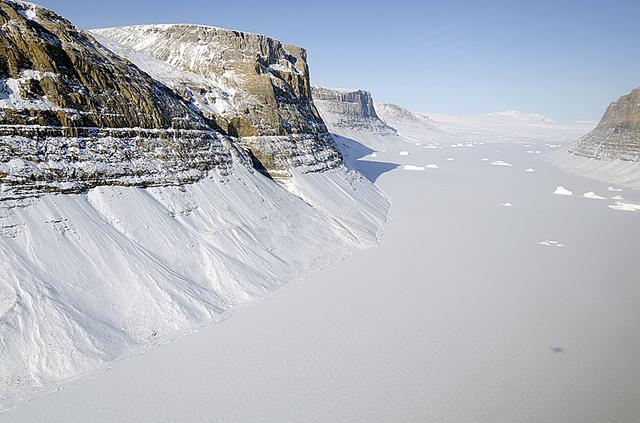
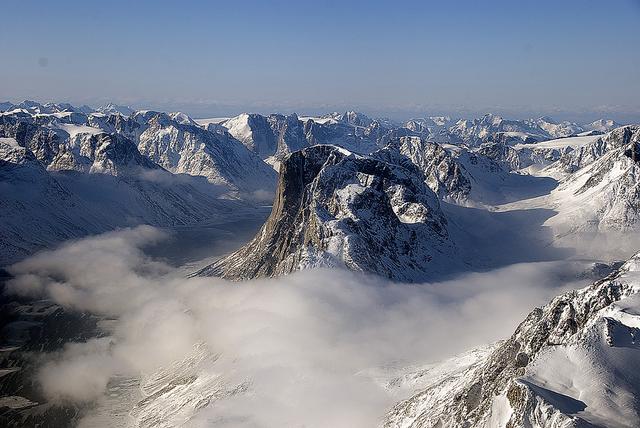
A wider view of mountains showing the distinctive geology of the Geikie Plateau region in eastern Greenland, as seen from NASA's P-3B aircraft on April 16, 2012. Credit: NASA/GSFC/Jefferson Beck =========== IceBridge, a six-year NASA mission, is the largest airborne survey of Earth's polar ice ever flown. It will yield an unprecedented three-dimensional view of Arctic and Antarctic ice sheets, ice shelves and sea ice. These flights will provide a yearly, multi-instrument look at the behavior of the rapidly changing features of the Greenland and Antarctic ice. Data collected during IceBridge will help scientists bridge the gap in polar observations between NASA's Ice, Cloud and Land Elevation Satellite (ICESat) -- in orbit since 2003 -- and ICESat-2, planned for early 2016. ICESat stopped collecting science data in 2009, making IceBridge critical for ensuring a continuous series of observations. IceBridge will use airborne instruments to map Arctic and Antarctic areas once a year. IceBridge flights are conducted in March-May over Greenland and in October-November over Antarctica. Other smaller airborne surveys around the world are also part of the IceBridge campaign. To read more about IceBridge - Arctic 2012 go to: <a href="http://www.nasa.gov/mission_pages/icebridge/index.html" rel="nofollow">www.nasa.gov/mission_pages/icebridge/index.html</a> <b><a href="http://www.nasa.gov/audience/formedia/features/MP_Photo_Guidelines.html" rel="nofollow">NASA image use policy.</a></b> <b><a href="http://www.nasa.gov/centers/goddard/home/index.html" rel="nofollow">NASA Goddard Space Flight Center</a></b> enables NASA’s mission through four scientific endeavors: Earth Science, Heliophysics, Solar System Exploration, and Astrophysics. Goddard plays a leading role in NASA’s accomplishments by contributing compelling scientific knowledge to advance the Agency’s mission. <b>Follow us on <a href="http://twitter.com/NASA_GoddardPix" rel="nofollow">Twitter</a></b> <b>Like us on <a href="http://www.facebook.com/pages/Greenbelt-MD/NASA-Goddard/395013845897?ref=tsd" rel="nofollow">Facebook</a></b> <b>Find us on <a href="http://instagrid.me/nasagoddard/?vm=grid" rel="nofollow">Instagram</a></b>
The calving front of the Jakobshavn Glacier in western Greenland, as seen from NASA's P-3B aircraft on April 21, 2012. Credit: NASA/GSFC/Jefferson Beck =========== IceBridge, a six-year NASA mission, is the largest airborne survey of Earth's polar ice ever flown. It will yield an unprecedented three-dimensional view of Arctic and Antarctic ice sheets, ice shelves and sea ice. These flights will provide a yearly, multi-instrument look at the behavior of the rapidly changing features of the Greenland and Antarctic ice. Data collected during IceBridge will help scientists bridge the gap in polar observations between NASA's Ice, Cloud and Land Elevation Satellite (ICESat) -- in orbit since 2003 -- and ICESat-2, planned for early 2016. ICESat stopped collecting science data in 2009, making IceBridge critical for ensuring a continuous series of observations. IceBridge will use airborne instruments to map Arctic and Antarctic areas once a year. IceBridge flights are conducted in March-May over Greenland and in October-November over Antarctica. Other smaller airborne surveys around the world are also part of the IceBridge campaign. To read more about IceBridge - Arctic 2012 go to: <a href="http://www.nasa.gov/mission_pages/icebridge/index.html" rel="nofollow">www.nasa.gov/mission_pages/icebridge/index.html</a> <b><a href="http://www.nasa.gov/audience/formedia/features/MP_Photo_Guidelines.html" rel="nofollow">NASA image use policy.</a></b> <b><a href="http://www.nasa.gov/centers/goddard/home/index.html" rel="nofollow">NASA Goddard Space Flight Center</a></b> enables NASA’s mission through four scientific endeavors: Earth Science, Heliophysics, Solar System Exploration, and Astrophysics. Goddard plays a leading role in NASA’s accomplishments by contributing compelling scientific knowledge to advance the Agency’s mission. <b>Follow us on <a href="http://twitter.com/NASA_GoddardPix" rel="nofollow">Twitter</a></b> <b>Like us on <a href="http://www.facebook.com/pages/Greenbelt-MD/NASA-Goddard/395013845897?ref=tsd" rel="nofollow">Facebook</a></b> <b>Find us on <a href="http://instagrid.me/nasagoddard/?vm=grid" rel="nofollow">Instagram</a></b>
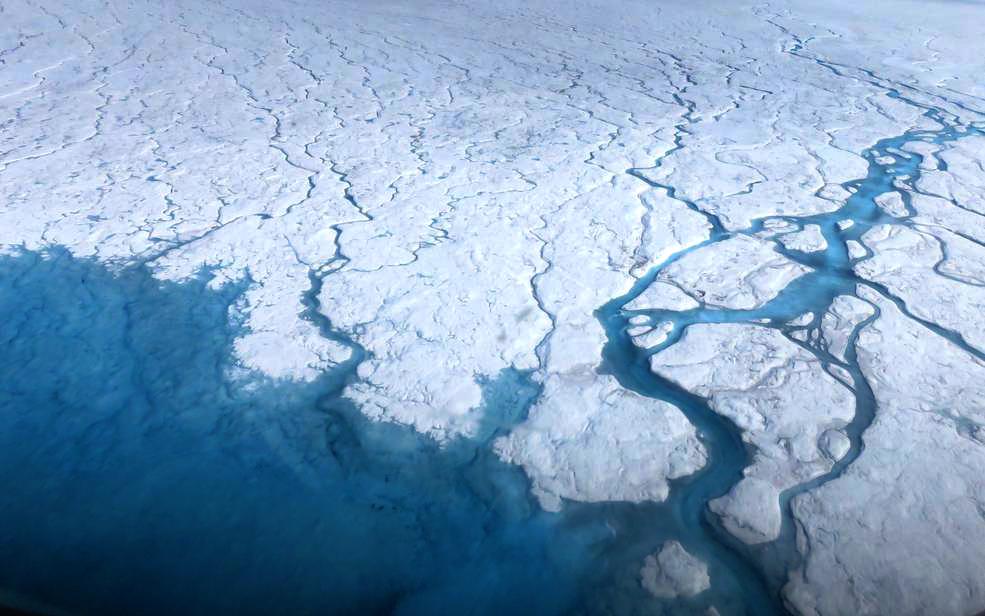
Streams and rivers that form on top of the Greenland ice sheet during spring and summer are the main agent transporting melt runoff from the ice sheet to the ocean. “Surface melting in Greenland has increased recently, and we lacked a rigorous estimate of the water volumes being produced and their transport,” said Tom Wagner, the cryosphere program scientist at NASA Headquarters in Washington. “NASA funds fieldwork like Smith’s because it helps us to interpret satellite data, and to extrapolate measurements from the local field sites to the larger ice sheet." Credit: NASA/Goddard/Maria-José Viñas Read more: <a href="http://www.nasa.gov/feature/a-summer-of-nasa-research-on-sea-level-rise-in-greenland" rel="nofollow">www.nasa.gov/feature/a-summer-of-nasa-research-on-sea-lev...</a> <b><a href="http://www.nasa.gov/audience/formedia/features/MP_Photo_Guidelines.html" rel="nofollow">NASA image use policy.</a></b> <b><a href="http://www.nasa.gov/centers/goddard/home/index.html" rel="nofollow">NASA Goddard Space Flight Center</a></b> enables NASA’s mission through four scientific endeavors: Earth Science, Heliophysics, Solar System Exploration, and Astrophysics. Goddard plays a leading role in NASA’s accomplishments by contributing compelling scientific knowledge to advance the Agency’s mission. <b>Follow us on <a href="http://twitter.com/NASAGoddardPix" rel="nofollow">Twitter</a></b> <b>Like us on <a href="http://www.facebook.com/pages/Greenbelt-MD/NASA-Goddard/395013845897?ref=tsd" rel="nofollow">Facebook</a></b> <b>Find us on <a href="http://instagrid.me/nasagoddard/?vm=grid" rel="nofollow">Instagram</a></b>
Mountain ridges showing the distinctive geology of the Geikie Plateau region in eastern Greenland, as seen from NASA's P-3B aircraft on April 16, 2012. Credit: NASA/GSFC/Jefferson Beck =========== IceBridge, a six-year NASA mission, is the largest airborne survey of Earth's polar ice ever flown. It will yield an unprecedented three-dimensional view of Arctic and Antarctic ice sheets, ice shelves and sea ice. These flights will provide a yearly, multi-instrument look at the behavior of the rapidly changing features of the Greenland and Antarctic ice. Data collected during IceBridge will help scientists bridge the gap in polar observations between NASA's Ice, Cloud and Land Elevation Satellite (ICESat) -- in orbit since 2003 -- and ICESat-2, planned for early 2016. ICESat stopped collecting science data in 2009, making IceBridge critical for ensuring a continuous series of observations. IceBridge will use airborne instruments to map Arctic and Antarctic areas once a year. IceBridge flights are conducted in March-May over Greenland and in October-November over Antarctica. Other smaller airborne surveys around the world are also part of the IceBridge campaign. To read more about IceBridge - Arctic 2012 go to: <a href="http://www.nasa.gov/mission_pages/icebridge/index.html" rel="nofollow">www.nasa.gov/mission_pages/icebridge/index.html</a> <b><a href="http://www.nasa.gov/audience/formedia/features/MP_Photo_Guidelines.html" rel="nofollow">NASA image use policy.</a></b> <b><a href="http://www.nasa.gov/centers/goddard/home/index.html" rel="nofollow">NASA Goddard Space Flight Center</a></b> enables NASA’s mission through four scientific endeavors: Earth Science, Heliophysics, Solar System Exploration, and Astrophysics. Goddard plays a leading role in NASA’s accomplishments by contributing compelling scientific knowledge to advance the Agency’s mission. <b>Follow us on <a href="http://twitter.com/NASA_GoddardPix" rel="nofollow">Twitter</a></b> <b>Like us on <a href="http://www.facebook.com/pages/Greenbelt-MD/NASA-Goddard/395013845897?ref=tsd" rel="nofollow">Facebook</a></b> <b>Find us on <a href="http://instagrid.me/nasagoddard/?vm=grid" rel="nofollow">Instagram</a></b>
Abigail Allwood (second from left), principal investigator of the Planetary Instrument for X-ray Lithochemistry (PIXL) aboard NASA's Perseverance Mars rover, is seen here examining rocks at a site in Greenland. Allwood is a scientist based at NASA's Jet Propulsion Laboratory in Southern California. A key objective for Perseverance's mission on Mars is astrobiology, including the search for signs of ancient microbial life. The rover will characterize the planet's geology and past climate, pave the way for human exploration of the Red Planet, and be the first mission to collect and cache Martian rock and regolith (broken rock and dust). Subsequent NASA missions, in cooperation with ESA (European Space Agency), would send spacecraft to Mars to collect these sealed samples from the surface and return them to Earth for in-depth analysis. The Mars 2020 Perseverance mission is part of NASA's Moon to Mars exploration approach, which includes Artemis missions to the Moon that will help prepare for human exploration of the Red Planet. https://photojournal.jpl.nasa.gov/catalog/PIA24668
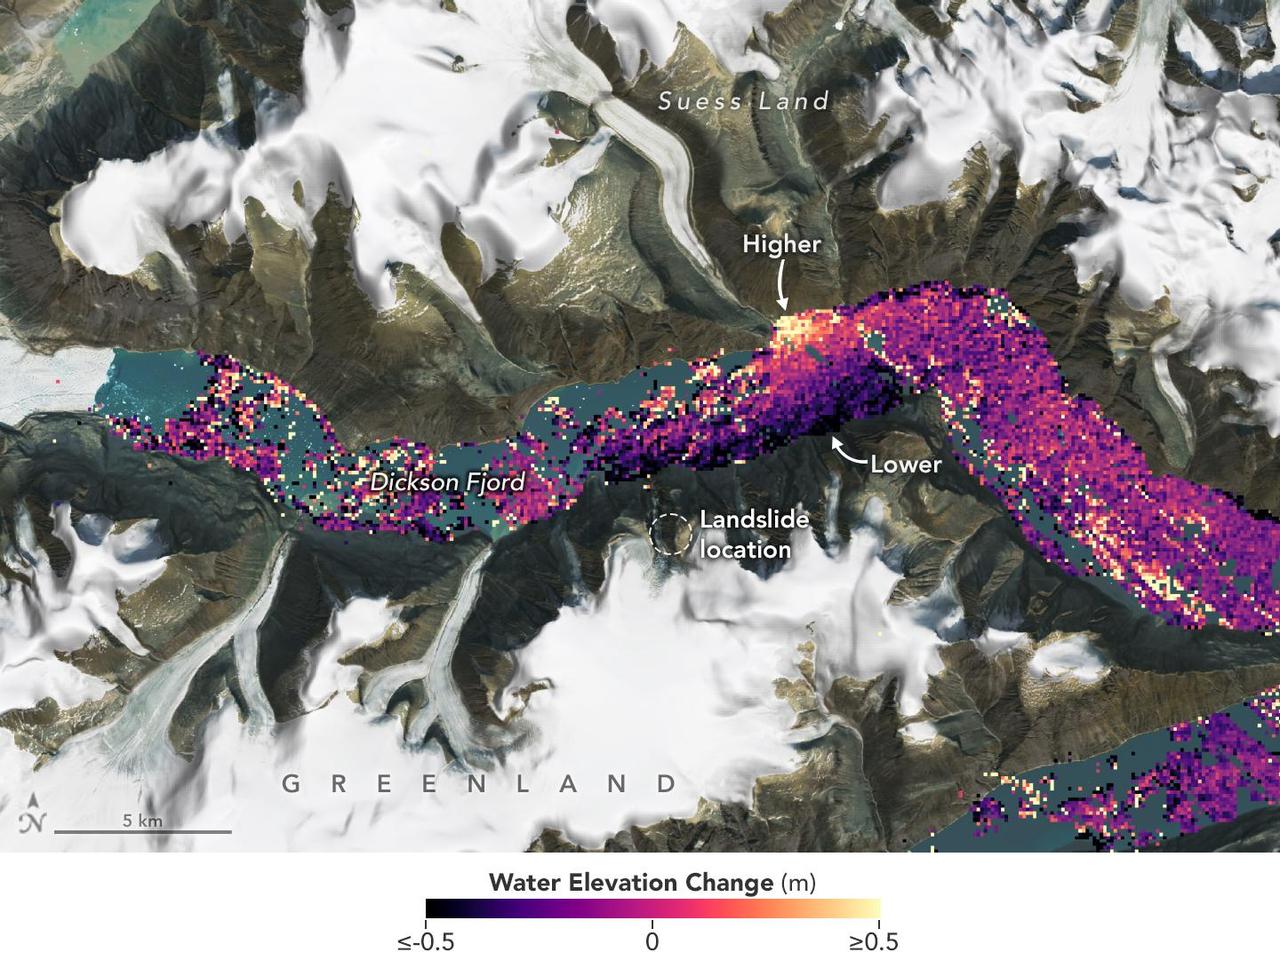
A visualization based on data from the international SWOT satellite mission shows the unique contours of a tsunami that sloshed within the steep walls of a fjord in Greenland in September 2023. Triggered by a massive landslide, the tsunami generated a seismic rumble that reverberated around the world for nine days. Short for Surface Water and Ocean Topography, SWOT collected water elevation measurements in the Dickson Fjord on Sept. 17, 2023, the day after the initial landslide and tsunami. The data was compared with measurements made under normal conditions a few weeks prior, on Aug. 6, 2023. Colors toward the lighter end of the scale indicate higher water levels, and darker colors indicate lower-than-normal levels. The data suggest that water levels at some points along the north side of the fjord were as much as 4 feet (1.2 meters) higher than on the south. In a September 2024 paper in Science, researchers traced a seismic signal back to the tsunami, which began when more than 880 million cubic feet of rock and ice (25 million cubic meters) fell into the Dickson Fjord. Part of a network of channels on Greenland's eastern coast, the fjord is about 1,772 feet (540 meters) deep and 1.7 miles (2.7 kilometers) wide, with walls taller than 6,000 feet (1,830 meters). Far from the open ocean, in a confined space, the energy of the tsunami's motion had limited opportunity to dissipate, so the wave moved back and forth about every 90 seconds for nine days. It caused tremors recorded on seismic instruments thousands of miles away. Launched in December 2022 from Vandenberg Space Force Base in central California, SWOT is now in its operations phase, collecting data that will be used for research and other purposes. https://photojournal.jpl.nasa.gov/catalog/PIA26420
On March 31, the P-3 departed Thule, Greenland. IceBridge teams flew a science transit flight to Kangerlussaq, Greenland, where missions will be based for the next several weeks before returning to Thule. Along the route, instruments surveyed several targets of opportunity including two ground tracks of the Ice, Cloud and land Elevation Satellite (ICESat) and several glaciers (Rink, Kangerdlugssuaq, Jakobshavn and Russell), turning up great data and spectacular views. March 29 was another perfect day for a land ice flight. The P-3 flew between deep canyons and over glaciers along the northwest coast of Greenland. But before the start of land ice flights, IceBridge reached a key milestone over sea ice. On March 28, IceBridge flew its eighth sea ice flight marking the completion of all high- and medium-priority sea ice missions planned from Thule. Among the sea ice missions was a science transit back from Fairbanks to Thule on March 25, during which the P-3 surveyed in complete darkness. Researchers watched the scanning pattern of the green lasers on the sea ice below and the beautiful Aurora Borealis above. To learn more about Ice Bridge go to: <a href="http://www.nasa.gov/mission_pages/icebridge/news/spr11/index.html" rel="nofollow">www.nasa.gov/mission_pages/icebridge/news/spr11/index.html</a> <b><a href="http://www.nasa.gov/centers/goddard/home/index.html" rel="nofollow">NASA Goddard Space Flight Center</a></b> enables NASA’s mission through four scientific endeavors: Earth Science, Heliophysics, Solar System Exploration, and Astrophysics. Goddard plays a leading role in NASA’s accomplishments by contributing compelling scientific knowledge to advance the Agency’s mission. <b>Follow us on <a href="http://twitter.com/NASA_GoddardPix" rel="nofollow">Twitter</a></b> <b>Join us on <a href="http://www.facebook.com/pages/Greenbelt-MD/NASA-Goddard/395013845897?ref=tsd" rel="nofollow">Facebook</a></b>
James Jacobson, a Data Analyst based out of Ames Research Center, explains his Digital Mapping System instrument to two teachers flying with Operation IceBridge, (top to bottom) Tom Koch Svennesen, of Greenland, and Peter Gross, of Denmark, on April 14, 2012. Credit: NASA/Jefferson Beck ============= IceBridge, a six-year NASA mission, is the largest airborne survey of Earth's polar ice ever flown. It will yield an unprecedented three-dimensional view of Arctic and Antarctic ice sheets, ice shelves and sea ice. These flights will provide a yearly, multi-instrument look at the behavior of the rapidly changing features of the Greenland and Antarctic ice. To read more about this mission go to: <a href="http://www.nasa.gov/mission_pages/icebridge/index.html" rel="nofollow">www.nasa.gov/mission_pages/icebridge/index.html</a> <b><a href="http://www.nasa.gov/audience/formedia/features/MP_Photo_Guidelines.html" rel="nofollow">NASA image use policy.</a></b> <b><a href="http://www.nasa.gov/centers/goddard/home/index.html" rel="nofollow">NASA Goddard Space Flight Center</a></b> enables NASA’s mission through four scientific endeavors: Earth Science, Heliophysics, Solar System Exploration, and Astrophysics. Goddard plays a leading role in NASA’s accomplishments by contributing compelling scientific knowledge to advance the Agency’s mission. <b>Follow us on <a href="http://twitter.com/NASA_GoddardPix" rel="nofollow">Twitter</a></b> <b>Like us on <a href="http://www.facebook.com/pages/Greenbelt-MD/NASA-Goddard/395013845897?ref=tsd" rel="nofollow">Facebook</a></b> <b>Find us on <a href="http://instagrid.me/nasagoddard/?vm=grid" rel="nofollow">Instagram</a></b>
The SeaWinds scatterometer on NASA QuikScat satellite makes global radar measurements day and night, in clear sky and through clouds. Greenland and the polar ice cap are shown here on September 20, 1999.

At Mars North Pole is a dome of icy layers ranging up to 2 kilometers thick, roughly analogous to the Earth ice caps in Greenland or Antarctica. This image is from NASA Mars Reconnaissance Orbiter.

Acquired by NASA Terra spacecraft, this image shows the west coast of Greenland, one of Earth premiere incubators for icebergs -- large blocks of land ice that break off from glaciers or ice shelves and float in the ocean.
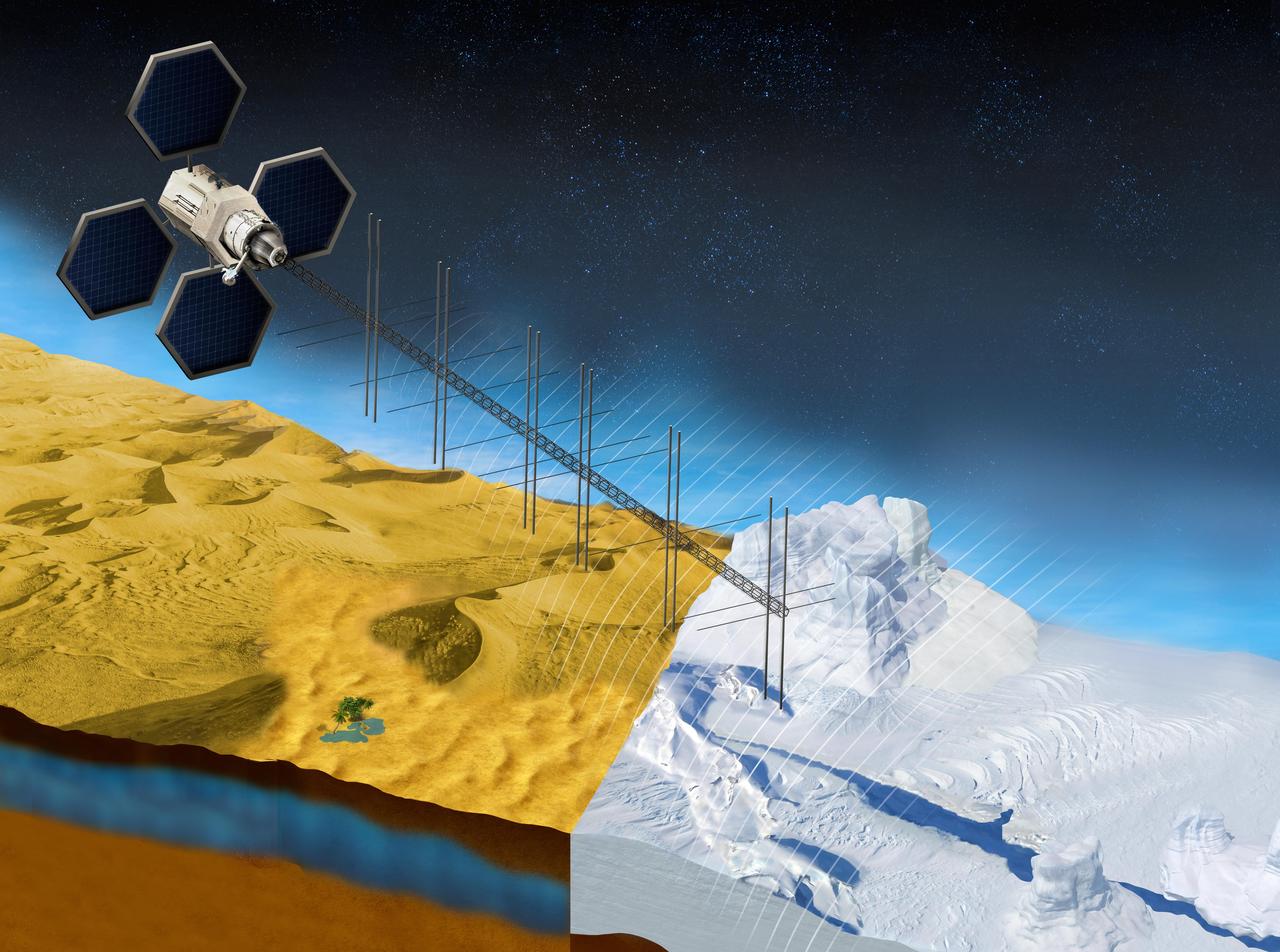
The OASIS project seeks to study fresh water aquifers in the desert as well as ice sheets in places like Greenland. This illustration shows what a satellite with a proposed radar instrument for the mission could look like. https://photojournal.jpl.nasa.gov/catalog/PIA23790

All was well at the North Pole this summer, when Santa and his elves were busily making toys and taking orders for this Christmas. NASA's Terra satellite was able to piece together a number of images it took to give us a complete look at the North Pole, which is usually very difficult to see by satellites, so Santa can keep his exact location secret. On June 30, 2011 the Moderate Resolution Imaging Spectroradiometer (MODIS) aboard NASA’s Terra satellite made multiple passes over the Arctic from its orbit in space, capturing a true-color image of the summer lands and sea-ice near the North Pole on each pass. Individual images were then pieced together to create a large mosaic of the area, which gives a broader view that would not be possible with individual images. In this mosaic of the Arctic, the polar ice cap appears blue-white, while the ice covering land appears bright white. The ice of Greenland, in the lower left (southwest), is especially bright. Clouds also appear bright white, and can be difficult to separate from ice in true-color images. Most of the clouds in this image appear in billowing swirls, while ice tends to be smoother. This can only be confirmed in the false-color images that were also generated by MODIS that same day. The North Pole is found northeast off the coast of Greenland, in the middle of the ice-covered Arctic Ocean and roughly near the center of this image. This is the northernmost point on Earth. From the North Pole, all directions are south. Santa will be leaving from here on the night of the 24th and circling the globe. Credit: NASA/GSFC/Jeff Schmaltz/MODIS Land Rapid Response Team <b><a href="http://www.nasa.gov/centers/goddard/home/index.html" rel="nofollow">NASA Goddard Space Flight Center</a></b> enables NASA’s mission through four scientific endeavors: Earth Science, Heliophysics, Solar System Exploration, and Astrophysics. Goddard plays a leading role in NASA’s accomplishments by contributing compelling scientific knowledge to advance the Agency’s mission. <b>Follow us on <a href="http://twitter.com/NASA_GoddardPix" rel="nofollow">Twitter</a></b> <b>Like us on <a href="http://www.facebook.com/pages/Greenbelt-MD/NASA-Goddard/395013845897?ref=tsd" rel="nofollow">Facebook</a></b> <b>Find us on <a href="http://web.stagram.com/n/nasagoddard/?vm=grid" rel="nofollow">Instagram</a></b>
On April 11, 2011, IceBridge finally got the clear weather necessary to fly over glaciers in southeast Greenland, but with clear skies came winds of up to 70 knots. What looks like clouds is actually wind-blown snow. The data could help scientists to evaluate the impact of wind-blown snow on satellite-based laser altimetry measurements. Operation IceBridge, now in its third year, makes annual campaigns in the Arctic and Antarctic where science flights monitor glaciers, ice sheets and sea ice. Credit: NASA/GSFC/Michael Studinger To learn more about Ice Bridge go to: <a href="http://www.nasa.gov/mission_pages/icebridge/news/spr11/index.html" rel="nofollow">www.nasa.gov/mission_pages/icebridge/news/spr11/index.html</a> <b><a href="http://www.nasa.gov/centers/goddard/home/index.html" rel="nofollow">NASA Goddard Space Flight Center</a></b> enables NASA’s mission through four scientific endeavors: Earth Science, Heliophysics, Solar System Exploration, and Astrophysics. Goddard plays a leading role in NASA’s accomplishments by contributing compelling scientific knowledge to advance the Agency’s mission. <b>Follow us on <a href="http://twitter.com/NASA_GoddardPix" rel="nofollow">Twitter</a></b> <b>Join us on <a href="http://www.facebook.com/pages/Greenbelt-MD/NASA-Goddard/395013845897?ref=tsd" rel="nofollow">Facebook</a></b>
On April 11, 2011, IceBridge finally got the clear weather necessary to fly over glaciers in southeast Greenland. But with clear skies came winds of up to 70 knots, which made for a bumpy ride over the calving front of glaciers like Gyldenlove. Operation IceBridge, now in its third year, makes annual campaigns in the Arctic and Antarctic where science flights monitor glaciers, ice sheets and sea ice. Credit: NASA/GSFC/Michael Studinger To learn more about Ice Bridge go to: <a href="http://www.nasa.gov/mission_pages/icebridge/news/spr11/index.html" rel="nofollow">www.nasa.gov/mission_pages/icebridge/news/spr11/index.html</a> <b><a href="http://www.nasa.gov/centers/goddard/home/index.html" rel="nofollow">NASA Goddard Space Flight Center</a></b> enables NASA’s mission through four scientific endeavors: Earth Science, Heliophysics, Solar System Exploration, and Astrophysics. Goddard plays a leading role in NASA’s accomplishments by contributing compelling scientific knowledge to advance the Agency’s mission. <b>Follow us on <a href="http://twitter.com/NASA_GoddardPix" rel="nofollow">Twitter</a></b> <b>Join us on <a href="http://www.facebook.com/pages/Greenbelt-MD/NASA-Goddard/395013845897?ref=tsd" rel="nofollow">Facebook</a></b>
The Martian north polar layered deposits are an ice sheet much like the Greenland ice sheet on the Earth in this image from NASA Mars Reconnaissance Orbiter. This Martian ice sheet contains many layers that record variations in the Martian climate.

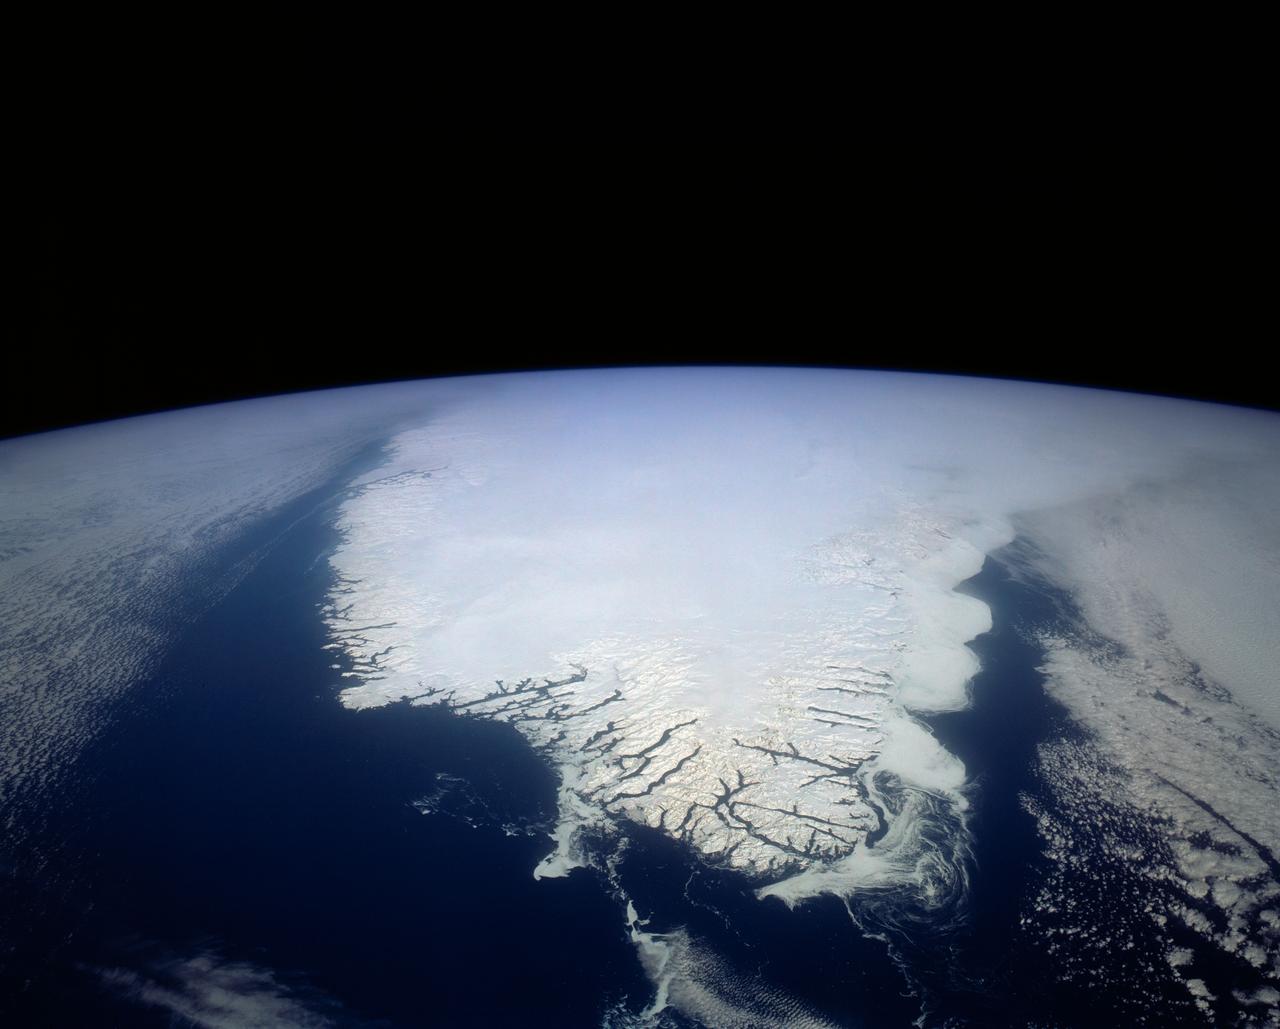
ISS017-E-012583 (4 Aug. 2008) --- Cape Farewell, Greenland is featured in this image photographed by an Expedition 17 crewmember on the International Space Station (ISS). This view illustrates the southernmost tip of Greenland, known as Kap Farvel in Danish and Nunap Isua in Inuit. The viewing direction is towards the northeast; the image was taken when the space station was located near its most northerly orbital latitude of 52 degrees, off the northern coast of the Island of Newfoundland approximately 1160 kilometers to the southwest. Greenland is the world's largest island with an area of over 2 million square kilometers; however much of the island is covered by an ice cap that can reach thicknesses of 3 kilometers. The image is highly oblique -- taken from an angle looking outwards from the ISS, rather than straight down towards the Earth -- and this provides a sense of topography along the southern edge of Greenland. The exposed dark grey bedrock along the southwestern coastline has been carved by glaciers into numerous fjords -- steep-sided valleys that drain directly into the ocean; the white cloud cover surrounding the island doubtless contains some sea ice and icebergs calved from glaciers. A band of high-altitude cirrus clouds (light grey) cast shadows on the lower stratus cloud deck in the lower third of the image. The thin blue layer of Earth's atmosphere is visible.

Laurence Smith, chair of geography at University of California, Los Angeles, deploys an autonomous drift boat equipped with several sensors in a meltwater river on the surface of the Greenland ice sheet on July 19, 2015. “Surface melting in Greenland has increased recently, and we lacked a rigorous estimate of the water volumes being produced and their transport,” said Tom Wagner, the cryosphere program scientist at NASA Headquarters in Washington. “NASA funds fieldwork like Smith’s because it helps us to interpret satellite data, and to extrapolate measurements from the local field sites to the larger ice sheet." Credit: NASA/Goddard/Jefferson Beck
STS085-502-078 (7 - 19 August 1997) --- The southern coastline of seldom-seen Iceland can be detected under cloud, top right in this dramatic west-looking view. Iceland's capital city, Reykjavik, lies on the cape that projects furthest left (i.e. southwest) in this view. Along the southeast margin (nearest to the viewer), Iceland's largest icecap, Vatnajškull, appears as a white mass with a texture different to the spotty cumulus cloud. At the closest point, Greenland only lies 170 miles to the northwest of Iceland -- and under a hand lens, hundreds of miles of the east coast of Greenland can be seen stretching across the top of this view. Taken with the large format Linhof camera, the enormous clarity of the air on this day allowed the crew to photograph Iceland which lies 400 miles and more north of the northernmost point which the Space Shuttle Discovery attained (57.5 degrees north latitude). Greenland lies more than 700 miles from the orbiter. The nature of the light brown feature in the ocean (middle of the view under the tailfin) is unclear. Part is a reflection off the window, but part shows details characteristic of a plankton bloom.
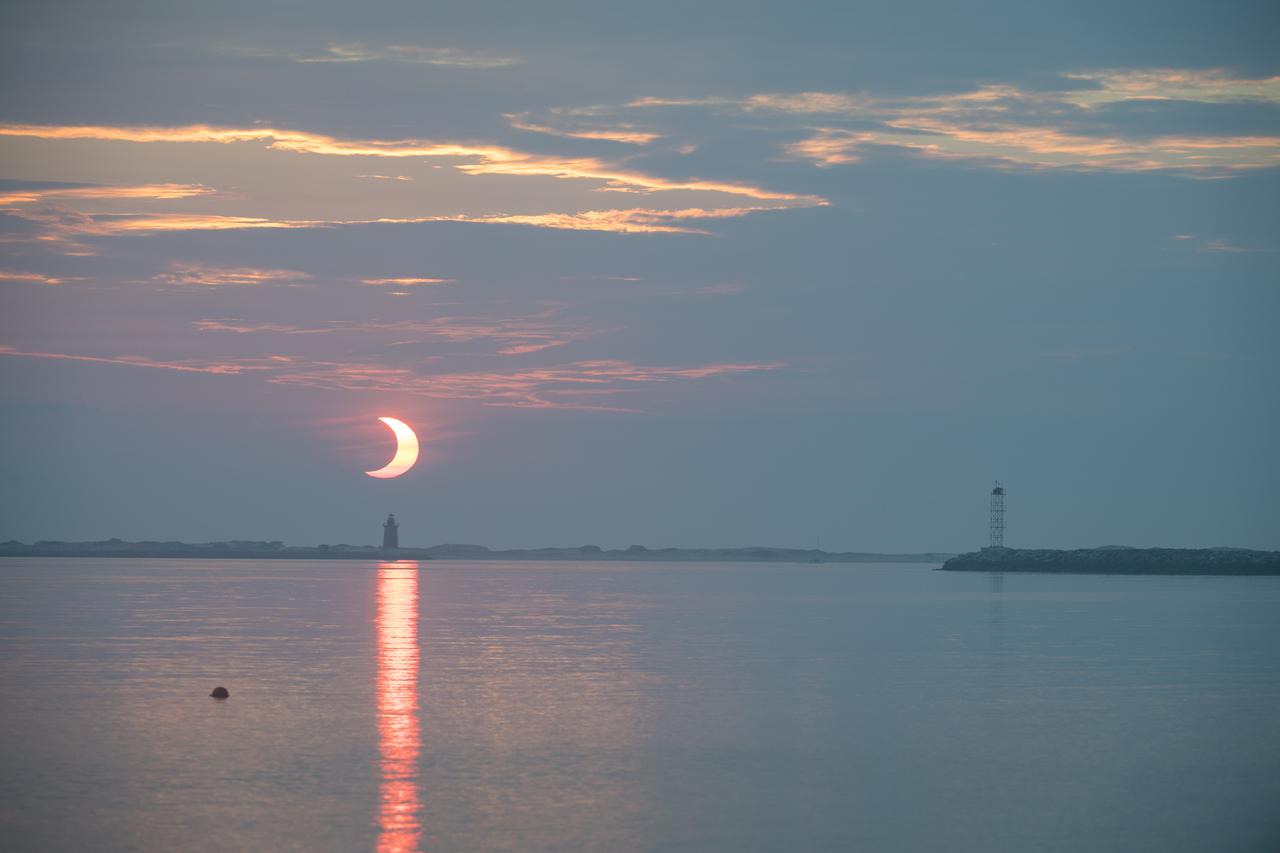
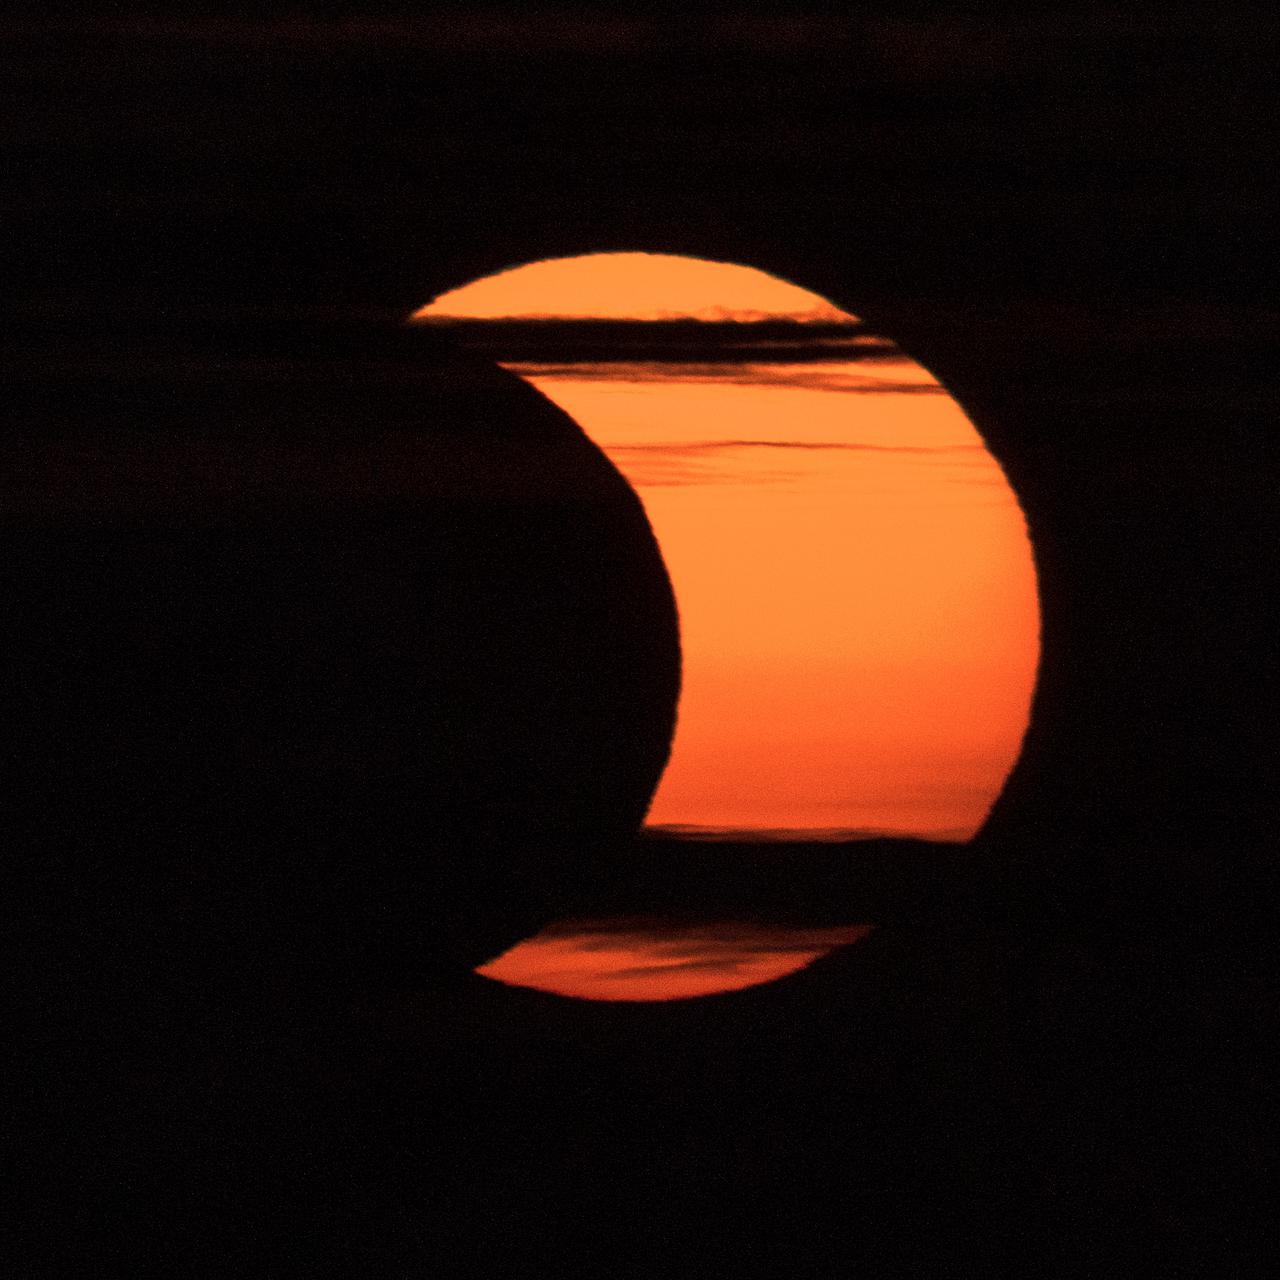
A partial solar eclipse is seen as the sun rises behind the Delaware Breakwater Lighthouse, Thursday, June 10, 2021, at Lewes Beach in Delaware. The annular or “ring of fire” solar eclipse is only visible to some parts of Greenland, Northern Russia, and Canada. Photo Credit: (NASA/Aubrey Gemignani)
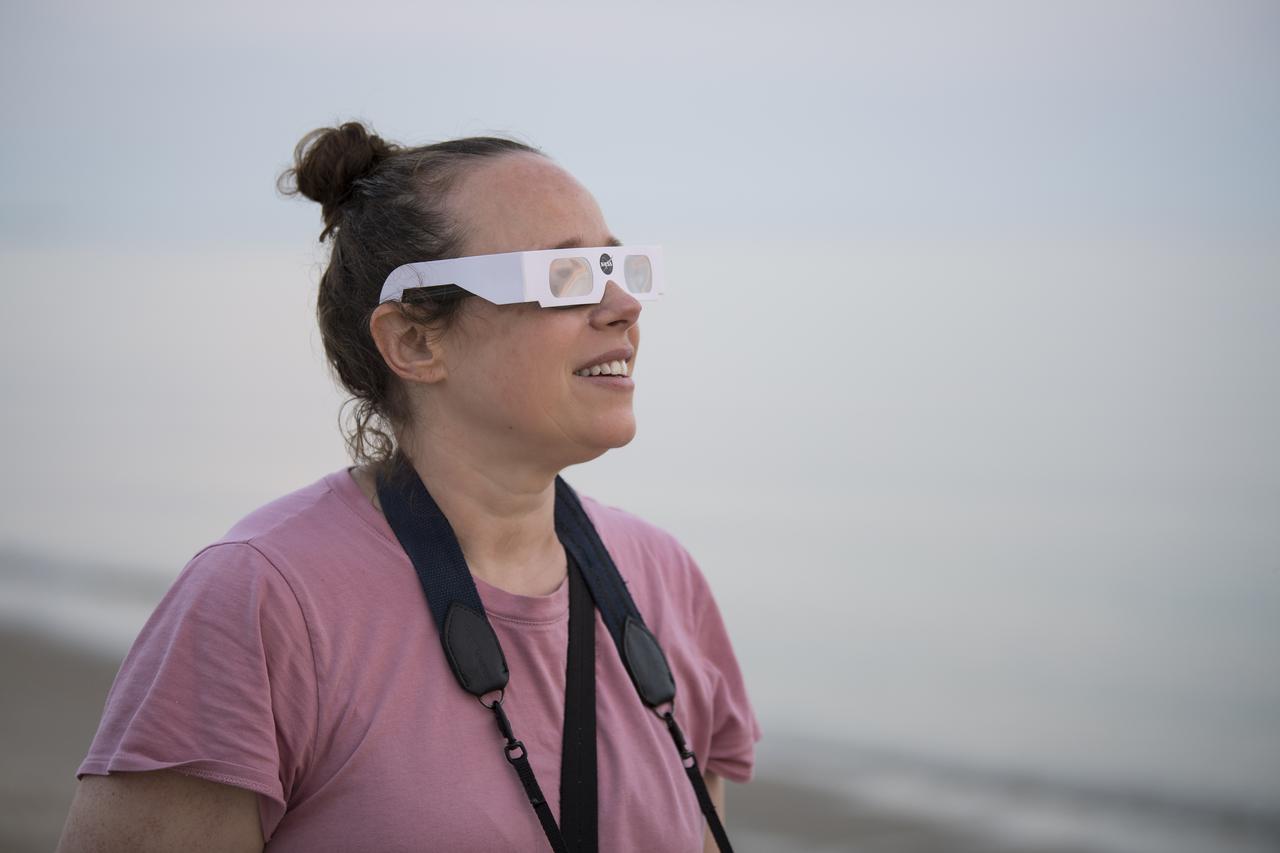
Sarah Baker views the partial solar eclipse as the sun rises, Thursday, June 10, 2021, at Lewes Beach in Delaware. The annular or “ring of fire” solar eclipse is only visible to some parts of Greenland, Northern Russia, and Canada. Photo Credit: (NASA/Aubrey Gemignani)
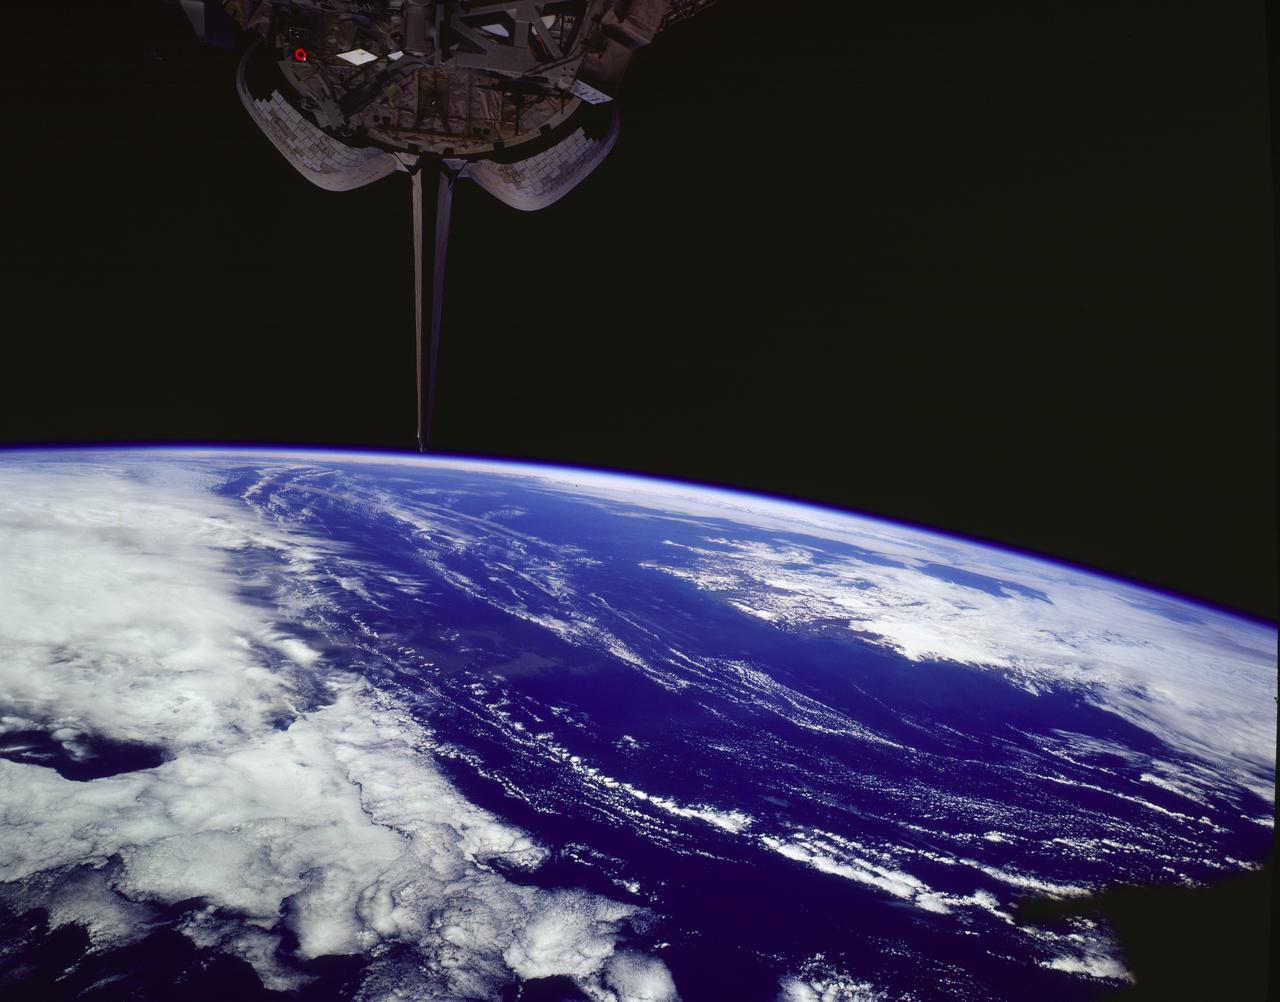
ISS024-E-013979 (7 Sept. 2010) --- A high-oblique view of the extra-tropical unnamed cyclone that merged with Hurricane Earl is featured in this image photographed by an Expedition 24 crew member on the International Space Station. At the time the photo was taken, the ISS was over the Labrador Sea, southwest of Greenland.

A partial solar eclipse is seen as the sun rises to the left of the United States Capitol building, Thursday, June 10, 2021, as seen from Arlington, Virginia. The annular or “ring of fire” solar eclipse is only visible to some people in Greenland, Northern Russia, and Canada. Photo Credit: (NASA/Bill Ingalls)
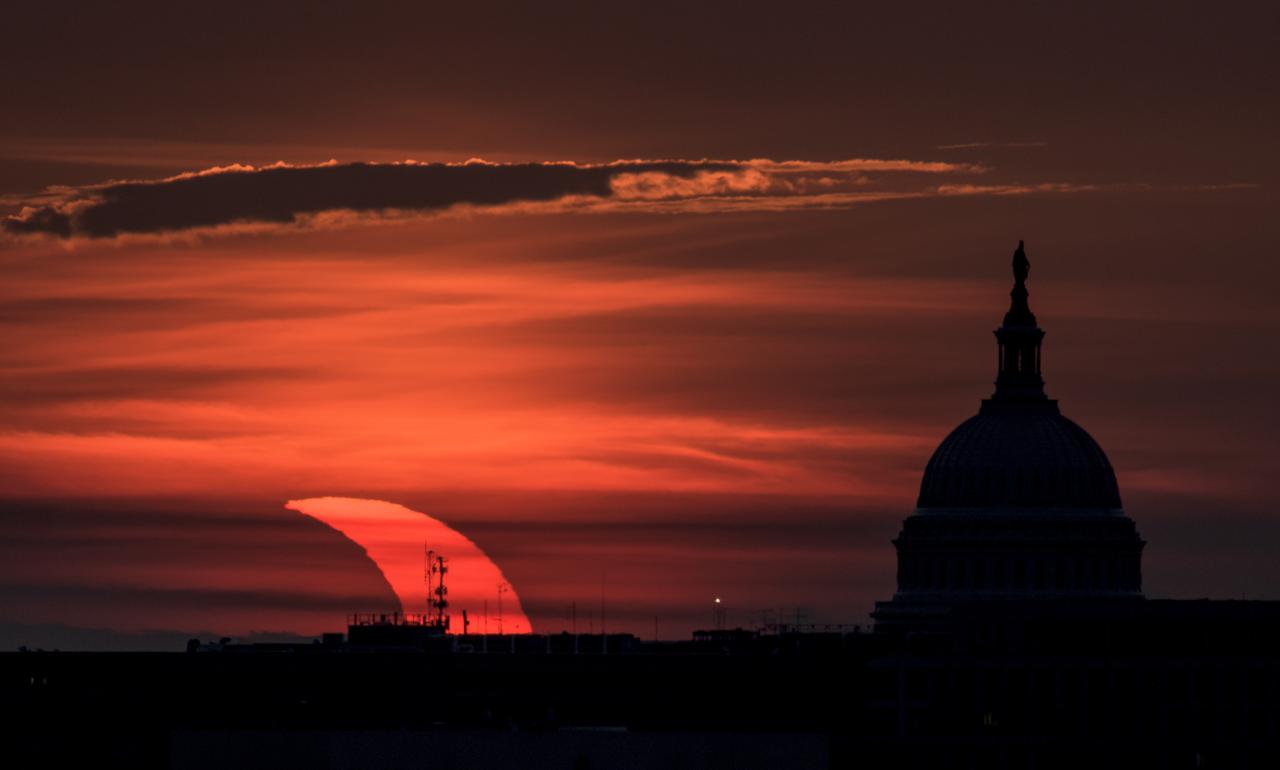
A partial solar eclipse is seen as the sun rises to the left of the United States Capitol building, Thursday, June 10, 2021, as seen from Arlington, Virginia. The annular or “ring of fire” solar eclipse is only visible to some people in Greenland, Northern Russia, and Canada. Photo Credit: (NASA/Bill Ingalls)

A partial solar eclipse is seen as the sun rises behind the United States Capitol Building, Thursday, June 10, 2021, as seen from Arlington, Virginia. The annular or “ring of fire” solar eclipse is only visible to some people in Greenland, Northern Russia, and Canada. Photo Credit: (NASA/Bill Ingalls)
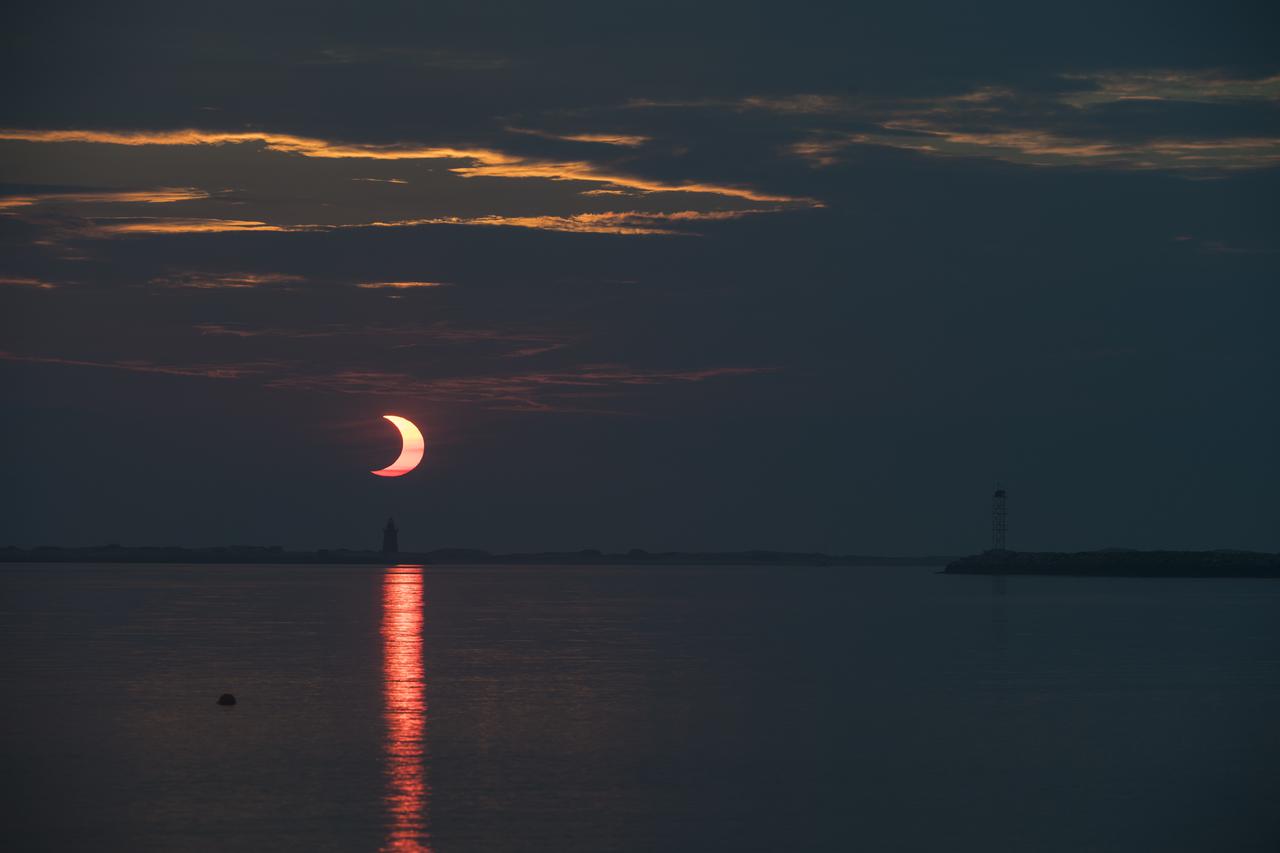
A partial solar eclipse is seen as the sun rises behind the Delaware Breakwater Lighthouse, Thursday, June 10, 2021, at Lewes Beach in Delaware. The annular or “ring of fire” solar eclipse is only visible to some parts of Greenland, Northern Russia, and Canada. Photo Credit: (NASA/Aubrey Gemignani)
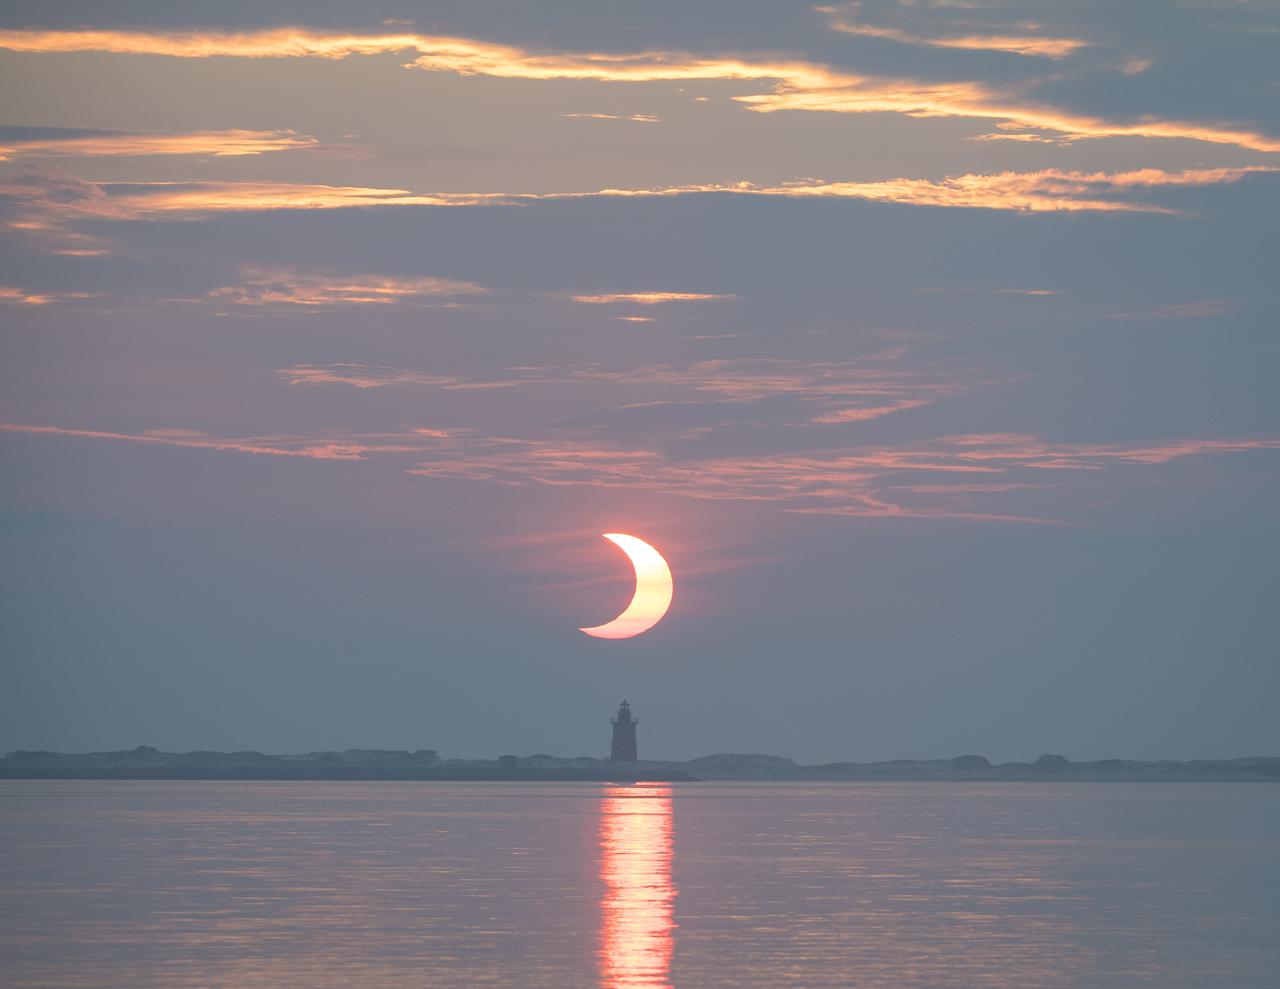
A partial solar eclipse is seen as the sun rises behind the Delaware Breakwater Lighthouse, Thursday, June 10, 2021, at Lewes Beach in Delaware. The annular or “ring of fire” solar eclipse is only visible to some parts of Greenland, Northern Russia, and Canada. Photo Credit: (NASA/Aubrey Gemignani)
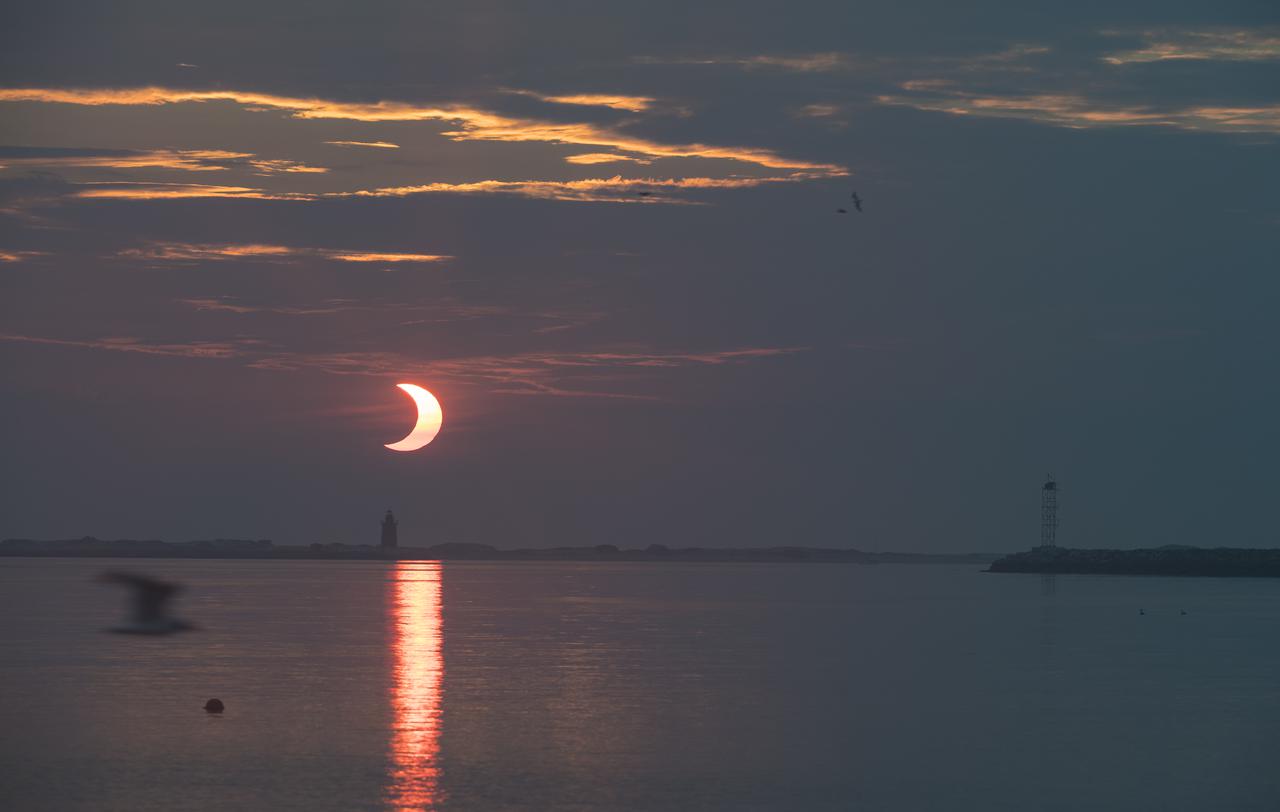
A partial solar eclipse is seen as the sun rises behind the Delaware Breakwater Lighthouse, Thursday, June 10, 2021, at Lewes Beach in Delaware. The annular or “ring of fire” solar eclipse is only visible to some parts of Greenland, Northern Russia, and Canada. Photo Credit: (NASA/Aubrey Gemignani)

A partial solar eclipse is seen as the sun rises behind the Delaware Breakwater Lighthouse, Thursday, June 10, 2021, at Lewes Beach in Delaware. The annular or “ring of fire” solar eclipse is only visible to some parts of Greenland, Northern Russia, and Canada. Photo Credit: (NASA/Aubrey Gemignani)
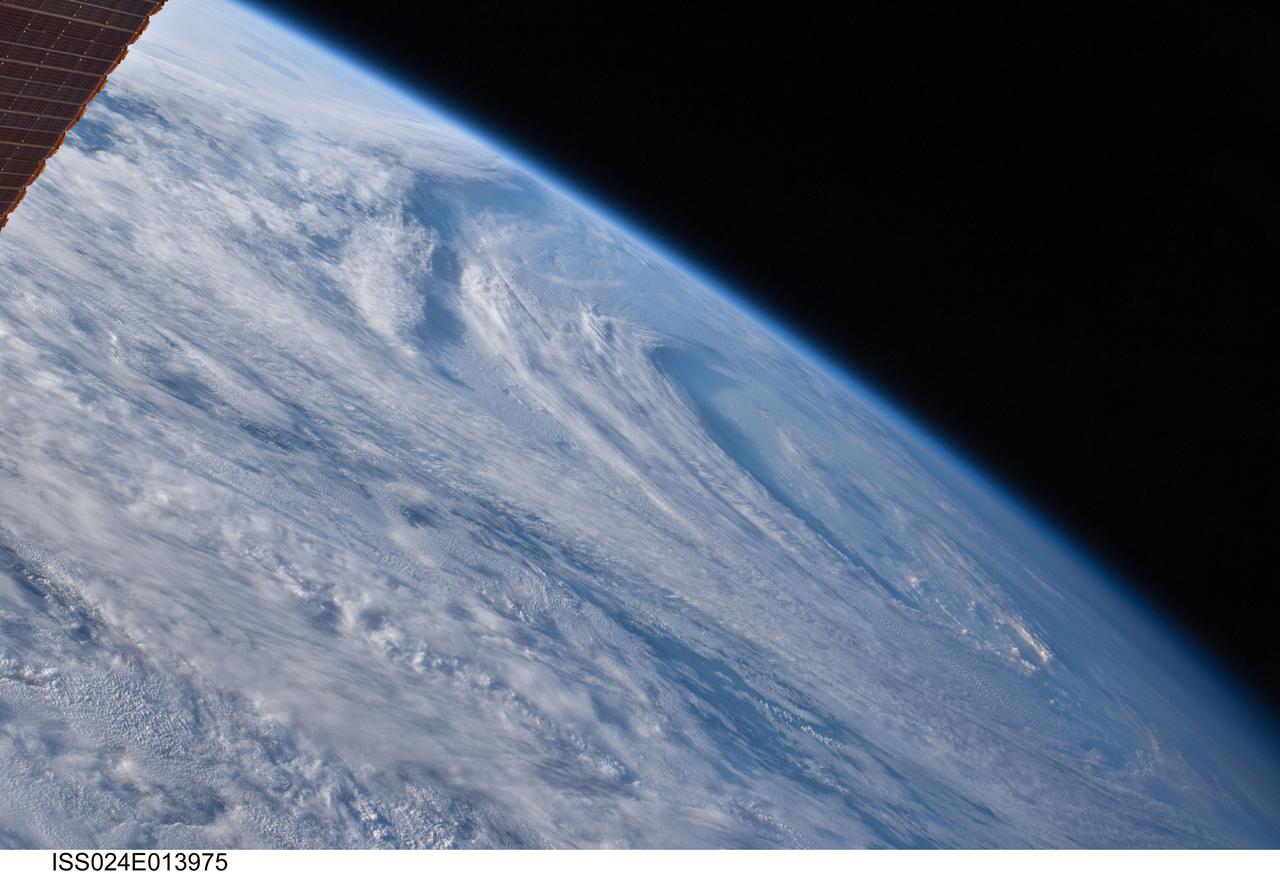
ISS024-E-013975 (7 Sept. 2010) --- A high-oblique view of the extra-tropical unnamed cyclone that merged with Hurricane Earl is featured in this image photographed by an Expedition 24 crew member on the International Space Station. At the time the photo was taken, the ISS was over the Labrador Sea, southwest of Greenland.
A partial solar eclipse is seen from Arlington, Virginia, Thursday, June 10, 2021. The annular or “ring of fire” solar eclipse is only visible to some people in Greenland, Northern Russia, and Canada. Photo Credit: (NASA/Bill Ingalls)
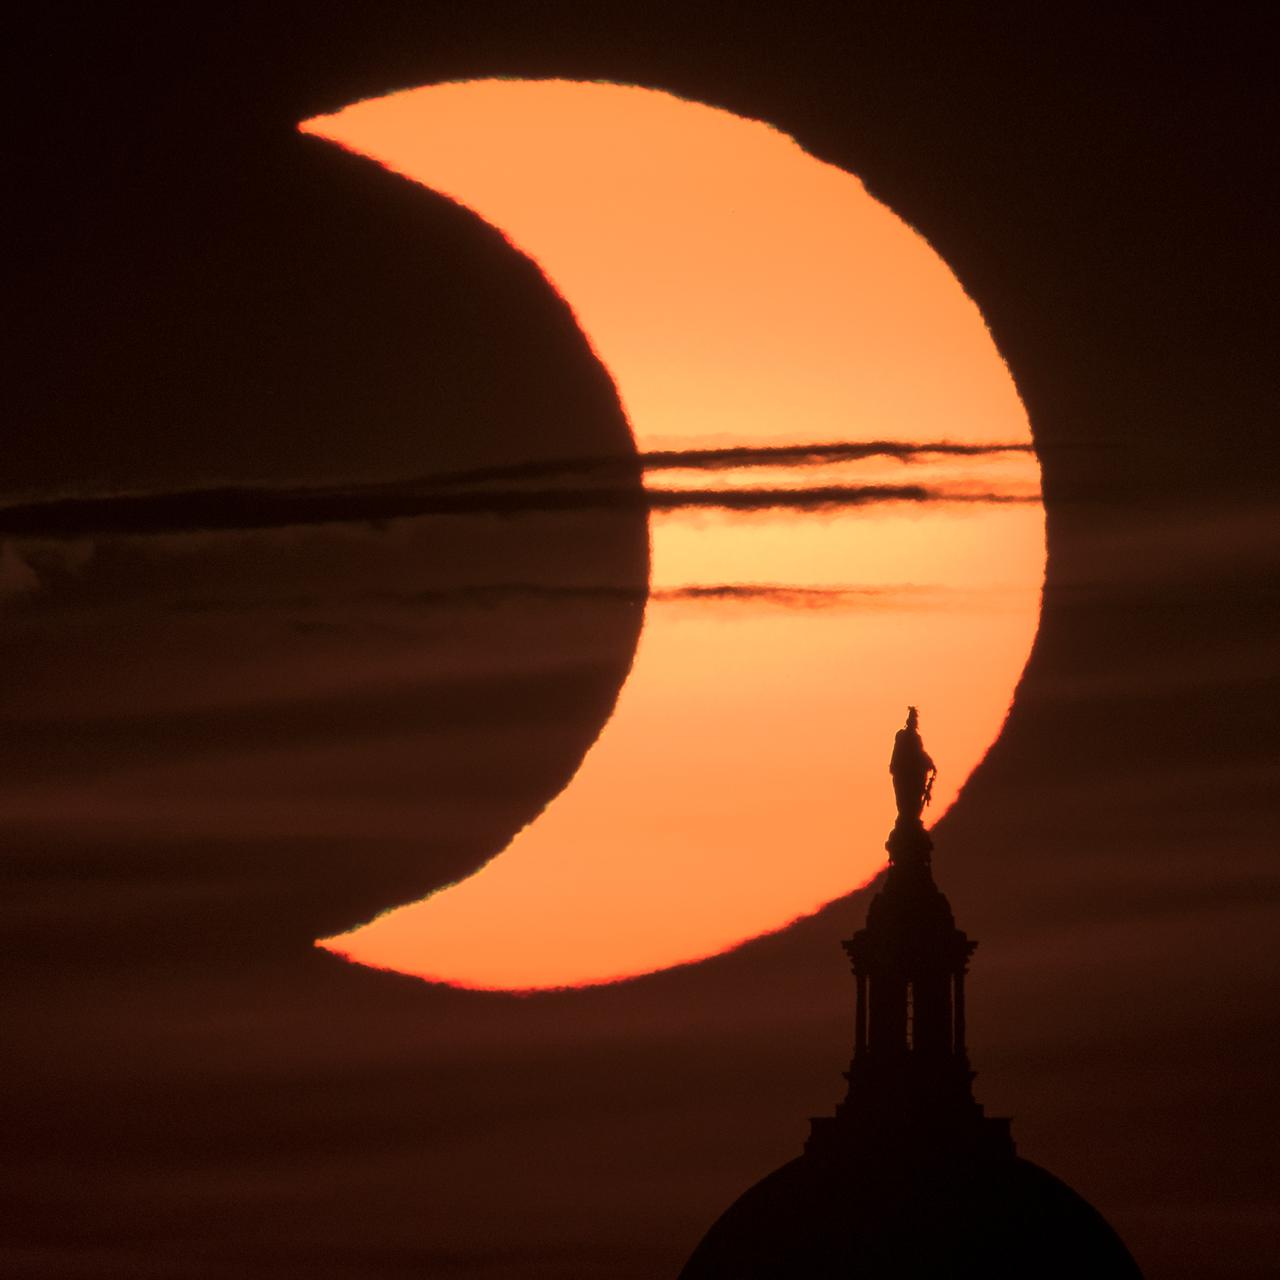
A partial solar eclipse is seen as the sun rises behind the Statue of Freedom atop the United States Capitol Building, Thursday, June 10, 2021, as seen from Arlington, Virginia. The annular or “ring of fire” solar eclipse is only visible to some people in Greenland, Northern Russia, and Canada. Photo Credit: (NASA/Bill Ingalls)
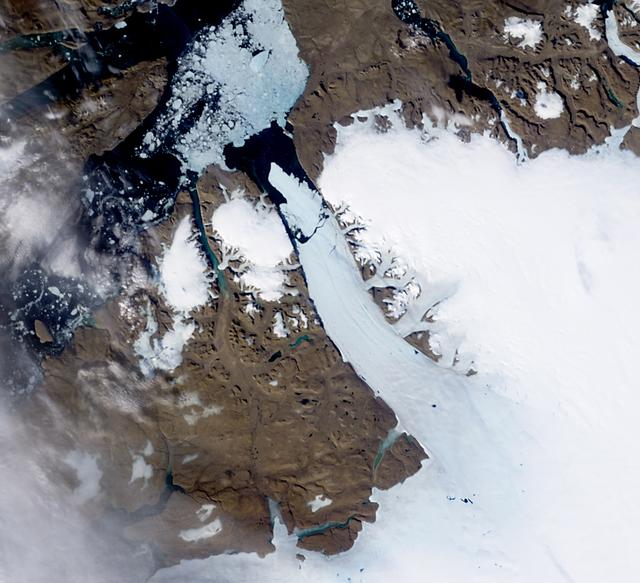
NASA image acquired August 5, 2010 On August 5, 2010, an enormous chunk of ice, roughly 97 square miles (251 square kilometers) in size, broke off the Petermann Glacier, along the northwestern coast of Greenland. The Canadian Ice Service detected the remote event within hours in near real-time data from the Moderate Resolution Imaging Spectroradiometer (MODIS) on NASA’s Aqua satellite. The Peterman Glacier lost about one-quarter of its 70-kilometer (40-mile) long floating ice shelf, said researchers who analyzed the satellite data at the University of Delaware. The Moderate Resolution Imaging Spectroradiometer (MODIS) on NASA’s Terra satellite captured these natural-color images of Petermann Glacier 18:05 UTC on August 5, 2010 (top), and 17:15 UTC on July 28, 2010 (bottom). The Terra image of the Petermann Glacier on August 5 was acquired almost 10 hours after the Aqua observation that first recorded the event. By the time Terra took this image, skies were less cloudy than they had been earlier in the day, and the oblong iceberg had broken free of the glacier and moved a short distance down the fjord. Icebergs calving off the Petermann Glacier are not unusual. Petermann Glacier’s floating ice tongue is the Northern Hemisphere’s largest, and it has occasionally calved large icebergs. The recently calved iceberg is the largest to form in the Arctic since 1962, said the University of Delaware. To read more and or to download the high res go here: <a href="http://www.nasa.gov/topics/earth/features/petermann-calve.html" rel="nofollow">www.nasa.gov/topics/earth/features/petermann-calve.html</a> or Click here to see more images from <b><a href="#//earthobservatory.nasa.gov/" rel="nofollow"> NASA Goddard’s Earth Observatory</a></b> NASA Earth Observatory image created by Jesse Allen and Robert Simmon, using data obtained from the Goddard Level 1 and Atmospheric Archive and Distribution System (LAADS). Caption by Holli Riebeek and Michon Scott. Instrument: Terra - MODIS <b><a href="http://www.nasa.gov/centers/goddard/home/index.html" rel="nofollow">NASA Goddard Space Flight Center</a></b> is home to the nation's largest organization of combined scientists, engineers and technologists that build spacecraft, instruments and new technology to study the Earth, the sun, our solar system, and the universe. <b>Follow us on <a href="http://twitter.com/NASA_GoddardPix" rel="nofollow">Twitter</a></b> <b>Join us on <a href="http://www.facebook.com/pages/Greenbelt-MD/NASA-Goddard/395013845897?ref=tsd" rel="nofollow">Facebook</a><b></b></b>
The P-3B is waiting outside the hangar at Thule Air Base with the Greenland Ice sheet in the background. Today, NASA's IceBridge, Arctic 2013 mission will collect data across the Arctic Ocean between Greenland and Alaska. -- IceBridge, a six-year NASA mission, is the largest airborne survey of Earth's polar ice ever flown. It will yield an unprecedented three-dimensional view of Arctic and Antarctic ice sheets, ice shelves and sea ice. These flights will provide a yearly, multi-instrument look at the behavior of the rapidly changing features of the Greenland and Antarctic ice. Data collected during IceBridge will help scientists bridge the gap in polar observations between NASA's Ice, Cloud and Land Elevation Satellite (ICESat) -- in orbit since 2003 -- and ICESat-2, planned for early 2016. ICESat stopped collecting science data in 2009, making IceBridge critical for ensuring a continuous series of observations. IceBridge will use airborne instruments to map Arctic and Antarctic areas once a year. IceBridge flights are conducted in March-May over Greenland and in October-November over Antarctica. Other smaller airborne surveys around the world are also part of the IceBridge campaign. Credit: NASA/Goddard/Michael Studinger <b><a href="http://www.nasa.gov/audience/formedia/features/MP_Photo_Guidelines.html" rel="nofollow">NASA image use policy.</a></b> <b><a href="http://www.nasa.gov/centers/goddard/home/index.html" rel="nofollow">NASA Goddard Space Flight Center</a></b> enables NASA’s mission through four scientific endeavors: Earth Science, Heliophysics, Solar System Exploration, and Astrophysics. Goddard plays a leading role in NASA’s accomplishments by contributing compelling scientific knowledge to advance the Agency’s mission. <b>Follow us on <a href="http://twitter.com/NASA_GoddardPix" rel="nofollow">Twitter</a></b> <b>Like us on <a href="http://www.facebook.com/pages/Greenbelt-MD/NASA-Goddard/395013845897?ref=tsd" rel="nofollow">Facebook</a></b> <b>Find us on <a href="http://instagram.com/nasagoddard?vm=grid" rel="nofollow">Instagram</a></b>
This image of Saunders Island and Wolstenholme Fjord with Kap Atholl in the background was taken during an Operation IceBridge survey flight in April, 2013. Sea ice coverage in the fjord ranges from thicker, white ice seen in the background, to thinner grease ice and leads showing open ocean water in the foreground. In March 2013, NASA's Operation IceBridge scientists began another season of research activity over Arctic ice sheets and sea ice. IceBridge, a six-year NASA mission, is the largest airborne survey of Earth's polar ice ever flown. It will yield an unprecedented three-dimensional view of Arctic and Antarctic ice sheets, ice shelves and sea ice. These flights will provide a yearly, multi-instrument look at the behavior of the rapidly changing features of the Greenland and Antarctic ice. Image Credit: NASA / Michael Studinger Read more about the mission here: <a href="http://www.nasa.gov/mission_pages/icebridge/index.html" rel="nofollow">www.nasa.gov/mission_pages/icebridge/index.html</a> <b><a href="http://www.nasa.gov/audience/formedia/features/MP_Photo_Guidelines.html" rel="nofollow">NASA image use policy.</a></b> <b><a href="http://www.nasa.gov/centers/goddard/home/index.html" rel="nofollow">NASA Goddard Space Flight Center</a></b> enables NASA’s mission through four scientific endeavors: Earth Science, Heliophysics, Solar System Exploration, and Astrophysics. Goddard plays a leading role in NASA’s accomplishments by contributing compelling scientific knowledge to advance the Agency’s mission. <b>Follow us on <a href="http://twitter.com/NASA_GoddardPix" rel="nofollow">Twitter</a></b> <b>Like us on <a href="http://www.facebook.com/pages/Greenbelt-MD/NASA-Goddard/395013845897?ref=tsd" rel="nofollow">Facebook</a></b> <b>Find us on <a href="http://instagram.com/nasagoddard?vm=grid" rel="nofollow">Instagram</a></b>

KENNEDY SPACE CENTER, FLA. -- The Merritt Island National Wildlife Refuge, which shares a boundary with the Kennedy Space Center, is winter home to hundreds of waterfowl such as these coots and pintail ducks. The smaller coot inhabits open ponds and marshes, wintering in saltwater bays and inlets. They range from southern Canada to northern South America. The pintail can be found in marshes, prairie ponds and tundra, and salt marshes in winter. They range from Alaska and Greenland south to Central America and the West Indies
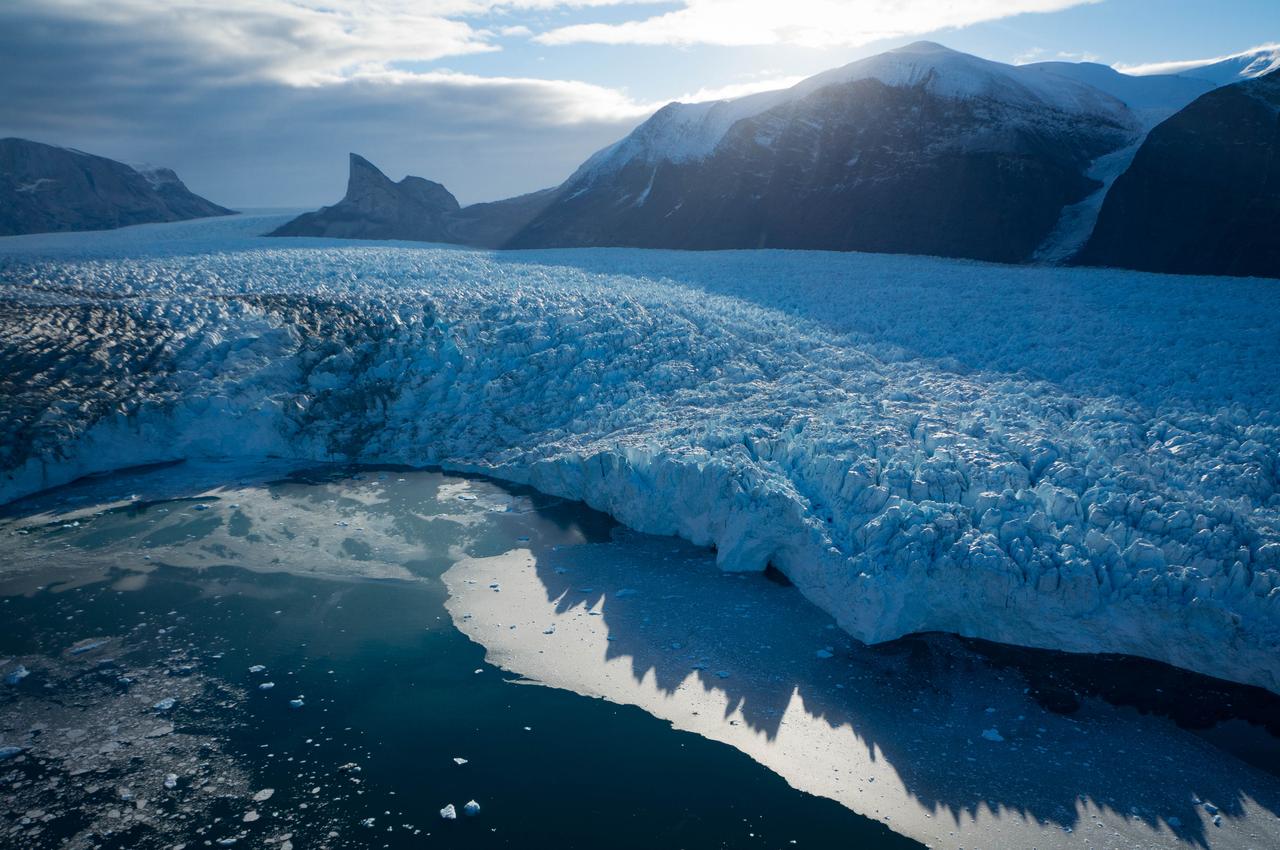
A new NASA-funded study has identified which glaciers in West Greenland are most susceptible to thinning in the coming decades by analyzing how they’re shaped. The research could help predict how much the Greenland Ice Sheet will contribute to future sea level rise in the next century, a number that currently ranges from inches to feet. “There are glaciers that popped up in our study that flew under the radar until now,” said lead author Denis Felikson, a graduate research assistant at The University of Texas Institute for Geophysics (UTIG) and a Ph.D. student in The University of Texas Department of Aerospace Engineering and Engineering Mechanics. Felikson’s study was published in Nature Geoscience on April 17. Read more: <a href="https://go.nasa.gov/2pJJwNA" rel="nofollow">go.nasa.gov/2pJJwNA</a> Caption: Terminus of Kangerlugssuup Sermerssua glacier in west Greenland Photo credit: Denis Felikson, Univ. of Texas <b><a href="http://www.nasa.gov/audience/formedia/features/MP_Photo_Guidelines.html" rel="nofollow">NASA image use policy.</a></b> <b><a href="http://www.nasa.gov/centers/goddard/home/index.html" rel="nofollow">NASA Goddard Space Flight Center</a></b> enables NASA’s mission through four scientific endeavors: Earth Science, Heliophysics, Solar System Exploration, and Astrophysics. Goddard plays a leading role in NASA’s accomplishments by contributing compelling scientific knowledge to advance the Agency’s mission. <b>Follow us on <a href="http://twitter.com/NASAGoddardPix" rel="nofollow">Twitter</a></b> <b>Like us on <a href="http://www.facebook.com/pages/Greenbelt-MD/NASA-Goddard/395013845897?ref=tsd" rel="nofollow">Facebook</a></b> <b>Find us on <a href="http://instagrid.me/nasagoddard/?vm=grid" rel="nofollow">Instagram</a></b>
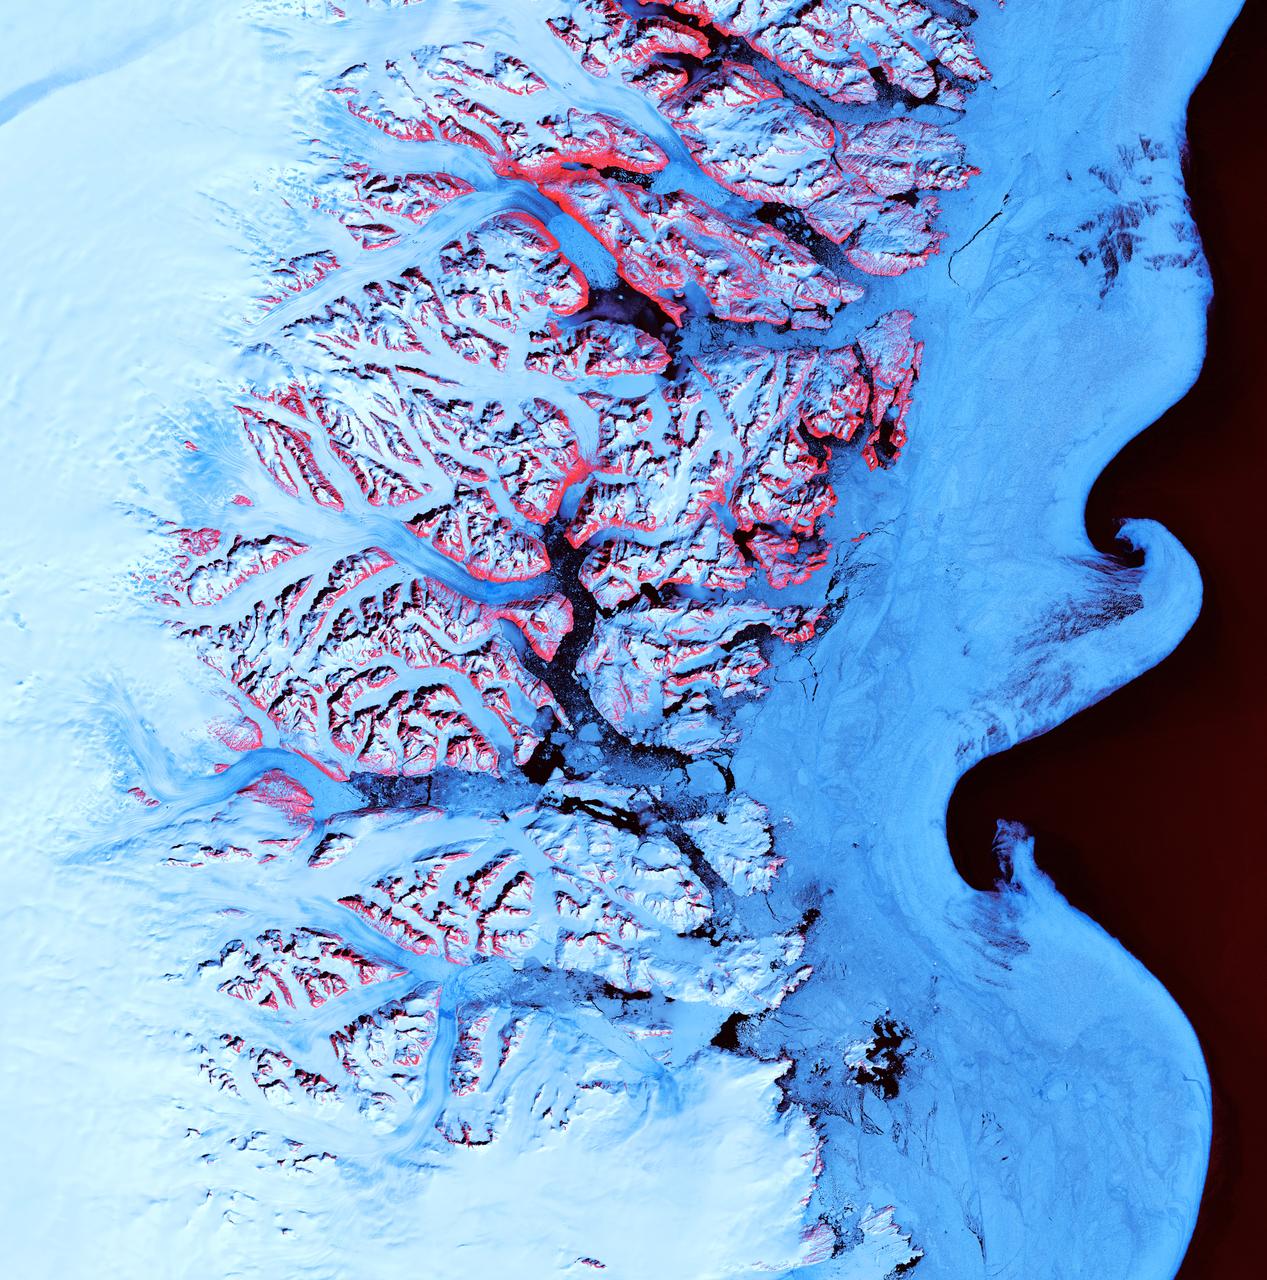
Ice Waves - May 21st, 2001 Description: Along the southeastern coast of Greenland, an intricate network of fjords funnels glacial ice to the Atlantic Ocean. During the summer melting season, newly calved icebergs join slabs of sea ice and older, weathered bergs in an offshore slurry that the southward-flowing East Greenland Current sometimes swirls into stunning shapes. Exposed rock of mountain peaks, tinted red in this image, hints at a hidden landscape. Credit: USGS/NASA/Landsat 7 To learn more about the Landsat satellite go to: <a href="http://landsat.gsfc.nasa.gov/" rel="nofollow">landsat.gsfc.nasa.gov/</a> <b><a href="http://www.nasa.gov/centers/goddard/home/index.html" rel="nofollow">NASA Goddard Space Flight Center</a></b> enables NASA’s mission through four scientific endeavors: Earth Science, Heliophysics, Solar System Exploration, and Astrophysics. Goddard plays a leading role in NASA’s accomplishments by contributing compelling scientific knowledge to advance the Agency’s mission. <b>Follow us on <a href="http://twitter.com/NASA_GoddardPix" rel="nofollow">Twitter</a></b> <b>Join us on <a href="http://www.facebook.com/pages/Greenbelt-MD/NASA-Goddard/395013845897?ref=tsd" rel="nofollow">Facebook</a></b>
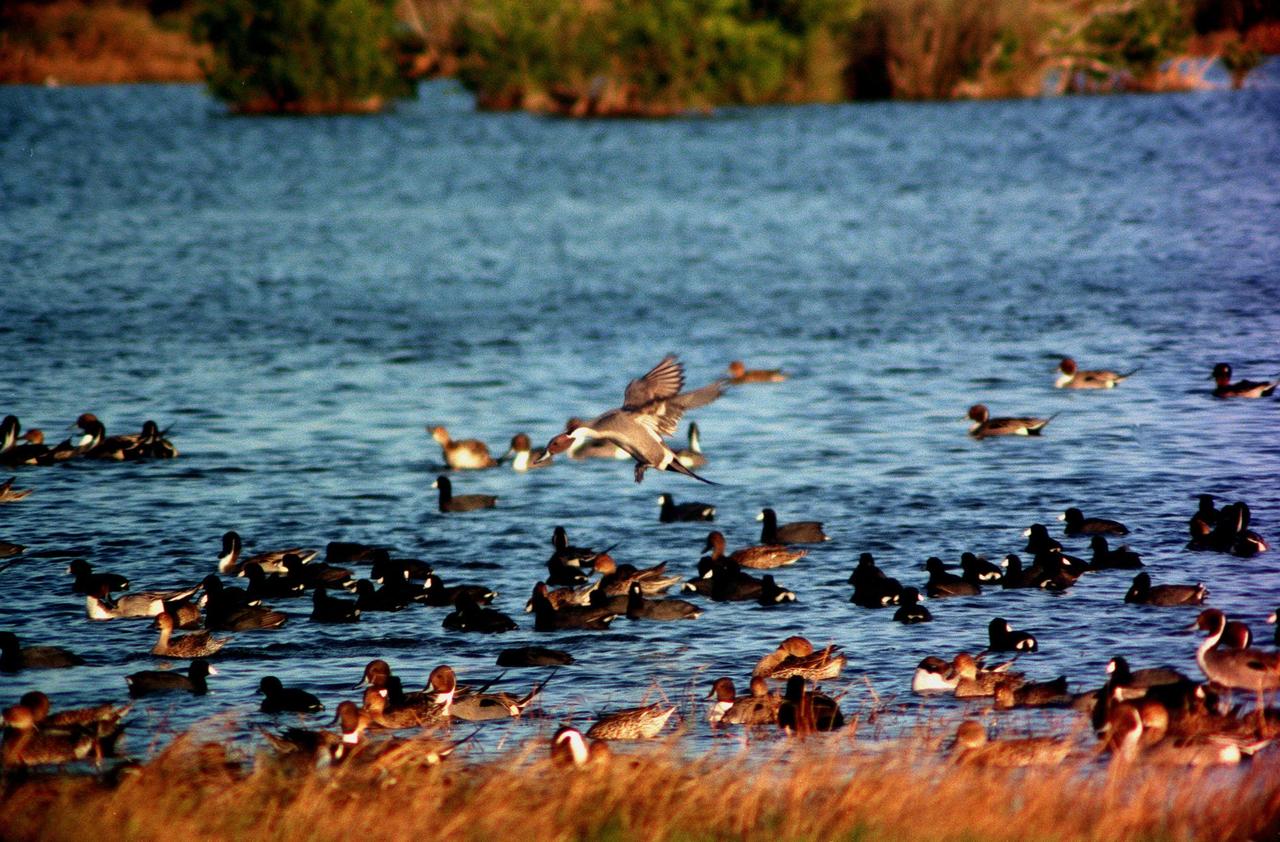
KENNEDY SPACE CENTER, FLA. -- A pintail duck is poised for landing, joining other ducks and coots on the waters of the Merritt Island National Wildlife Refuge at Kennedy Space Center. The refuge is winter home to hundreds of waterfowl such as these coots and pintail ducks. The smaller coot inhabits open ponds and marshes, wintering in saltwater bays and inlets. They range from southern Canada to northern South America. The pintail can be found in marshes, prairie ponds and tundra, and salt marshes in winter. They range from Alaska and Greenland south to Central America and the West Indies
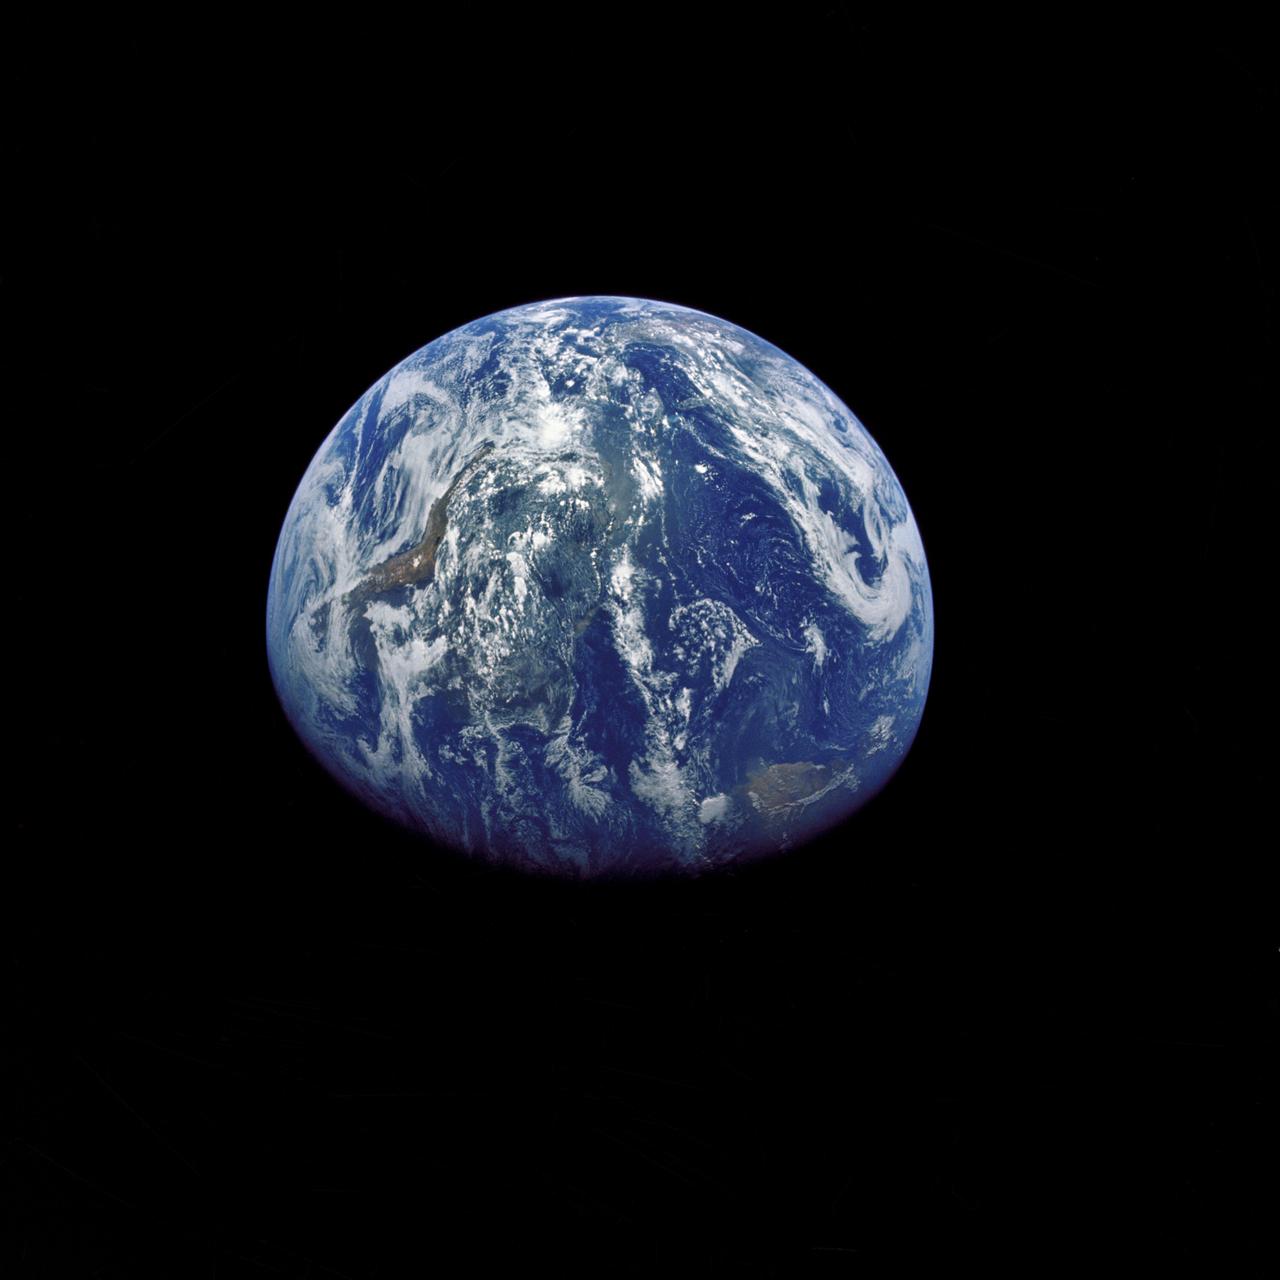
AS15-91-12343 (26 July 1971) --- This view of Earth was photographed by the Apollo 15 crewmen as they sped toward the fourth lunar landing. The spacecraft was between 25,000 and 30,000 nautical miles from Earth when this photo was made. The United States (note Florida), Central America and part of Canada can be seen at the left side of the picture, with South America at lower center. Spain and the northwest part of Africa can be seen at right. The Bahamas Banks, unique geological feature, can be seen (different shade of blue) east of Florida. Also note large North Atlantic storm front moving over Greenland in upper center.
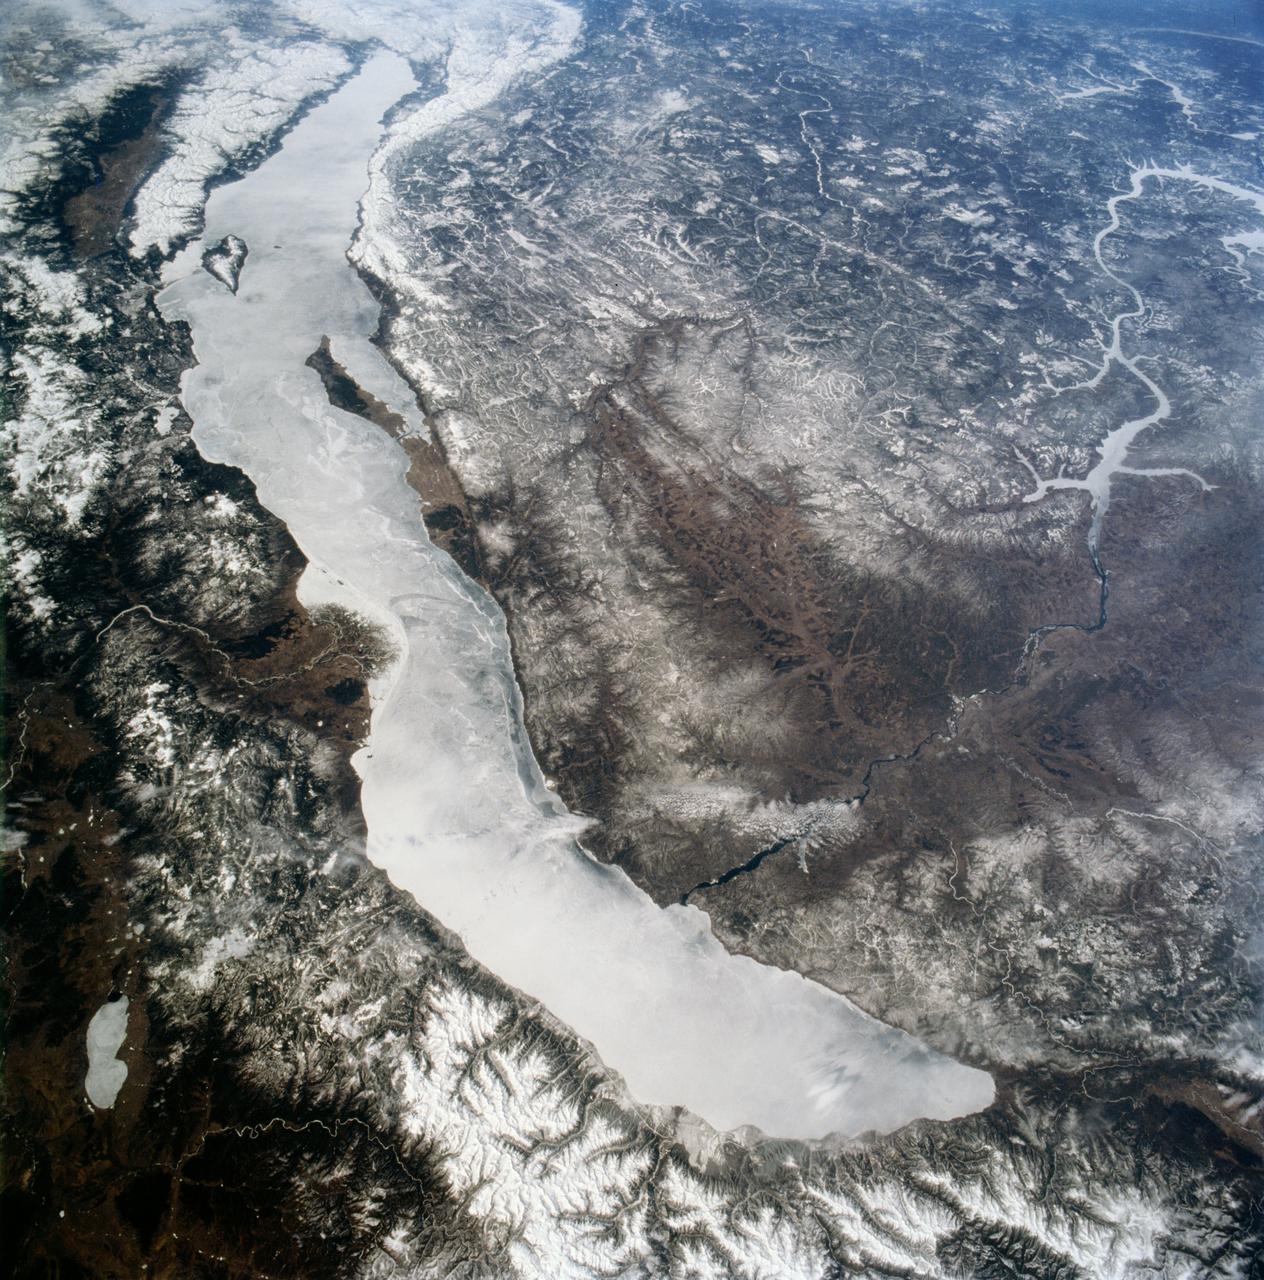
STS059-90-098 (9-20 April 1994) --- Ice-covered Lake Baikal, in Siberia, is about 400 miles long within a major rift valley. The water surface is 455 meters above sea level, but the bottom is 1,295 meters below sea level; the lake represents the largest body of fresh water in the world, except for the Antarctic and Greenland ice sheets. A tributary, the Senusi River, has built a delta on the east side. The Angara River exits the lake to the northwest; the city of Irkutsk is under the small, rippled cloud bank that crosses the river. Hasselblad camera.
![The two largest ice sheets in the inner solar system are here on Earth, Antarctica and Greenland. The third largest is at the South Pole of Mars and a small part of it is shown in this image from NASA's Mars Reconnaissance Orbiter (MRO). Much like the terrestrial examples, this ice sheet is layered and scientists refer to it as the South Polar layered deposits. The ice layers contain information about past climates on Mars and deciphering this record has been a major goal of Mars science for decades. This slope, near the ice sheet's edge, shows the internal layers that have this climate record. With stereo images, we can tell the heights of these layers so we can measure their thickness and try to unravel the climatic information they contain. (Be sure to view the digital terrain model for this observation.) The map is projected here at a scale of 25 centimeters (9.8 inches) per pixel. [The original image scale is 25.0 centimeters (9.8 inches) per pixel (with 1 x 1 binning); objects on the order of 75 centimeters (29.5 inches) across are resolved.] North is up. https://photojournal.jpl.nasa.gov/catalog/PIA22125](https://images-assets.nasa.gov/image/PIA22125/PIA22125~thumb.jpg)
The two largest ice sheets in the inner solar system are here on Earth, Antarctica and Greenland. The third largest is at the South Pole of Mars and a small part of it is shown in this image from NASA's Mars Reconnaissance Orbiter (MRO). Much like the terrestrial examples, this ice sheet is layered and scientists refer to it as the South Polar layered deposits. The ice layers contain information about past climates on Mars and deciphering this record has been a major goal of Mars science for decades. This slope, near the ice sheet's edge, shows the internal layers that have this climate record. With stereo images, we can tell the heights of these layers so we can measure their thickness and try to unravel the climatic information they contain. (Be sure to view the digital terrain model for this observation.) The map is projected here at a scale of 25 centimeters (9.8 inches) per pixel. [The original image scale is 25.0 centimeters (9.8 inches) per pixel (with 1 x 1 binning); objects on the order of 75 centimeters (29.5 inches) across are resolved.] North is up. https://photojournal.jpl.nasa.gov/catalog/PIA22125
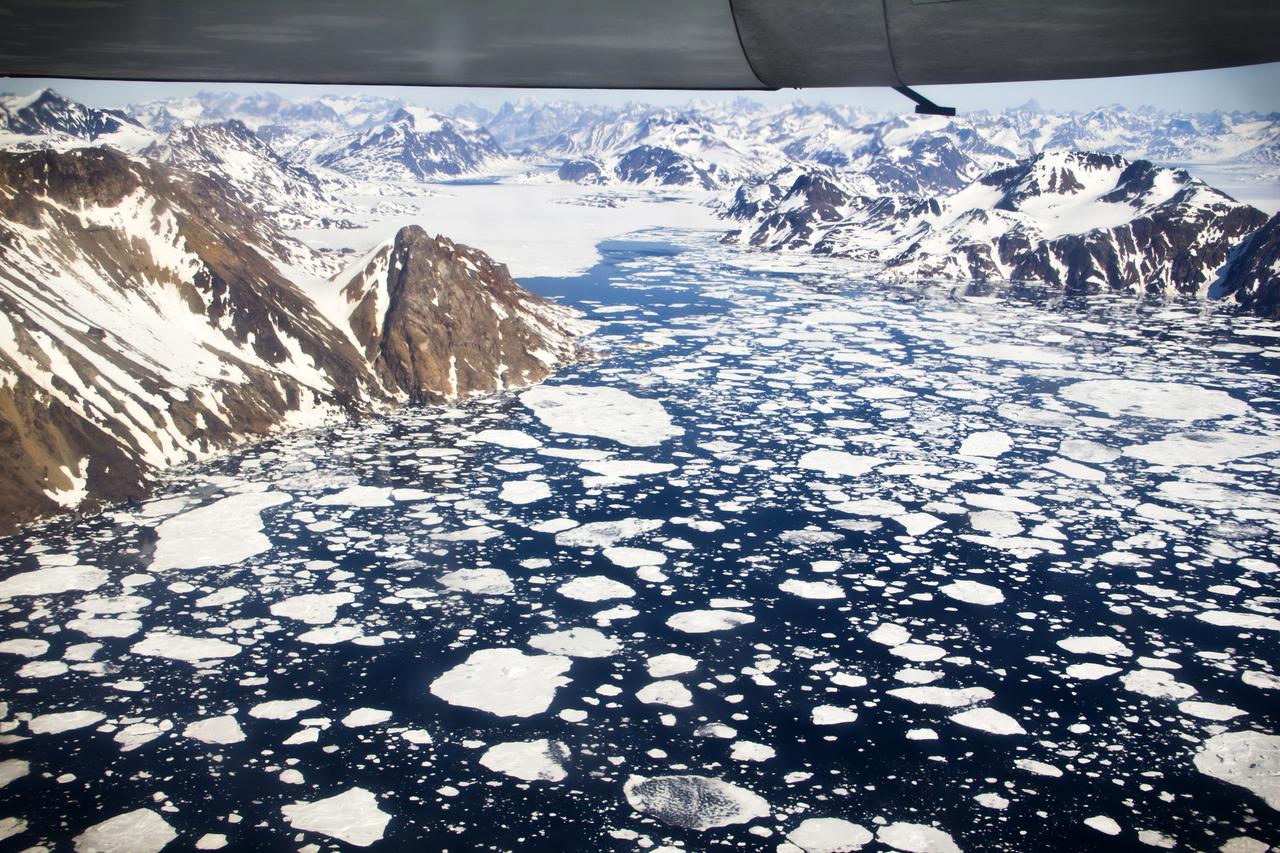
GPM "Let it Snow" Photo Contest Winners The Global Precipitation Measurement mission is happy to announce the top ten winners of the "Let It Snow" photo competition. Thank you to everyone who submitted their best pictures of winter. From January 7th through February 4th 2013, over 1,000 photos were submitted via Flickr and Instagram (see the Flickr submissions here: <a href="http://bit.ly/VVEubh" rel="nofollow">bit.ly/VVEubh</a>). We loved all of your entries and thoroughly appreciate your participation. About this image: Kulusuk Icebergs, by Andrew Bossi Location: On approach to the airstrip at Kulusuk, Greenland, located on the east coast. The flight departed out of Reykjavík, Iceland. How this Photo Was Taken: "My write-up of the day covers things in decent detail. Basically my vacation was focused on Scandinavia and hadn't even considered Greenland, but while traveling around Iceland I'd become aware that day trips were offered and I leapt at the opportunity. This approach was my first sight of Greenland. While I've seen plenty of glaciers and mountains, I'd never seen anything like this - it started with endless fields of ice amid the deep blue sea, and some minutes later a wall of frozen rock rose up from the horizon. I'd never seen anything so beautiful. I think my camera's shutter was snapping almost endlessly right up until we landed. The landing itself was an experience, as our tiny plane descended between the mountains -- rockfaces just outside each window -- and set down on a gravel runway." About Photographer Steven Sandner: More info about this photo: <a href="http://intentionallylost.blogspot.com/2011/06/gl-kulusuk.htm" rel="nofollow">intentionallylost.blogspot.com/2011/06/gl-kulusuk.htm</a> <a href="http://www.flickr.com/photos/thisisbossi/">www.flickr.com/photos/thisisbossi/</a> <a href="http://twitter.com/thisisbossi" rel="nofollow">twitter.com/thisisbossi</a> <b><a href="http://www.nasa.gov/audience/formedia/features/MP_Photo_Guidelines.html" rel="nofollow">NASA image use policy.</a></b> <b><a href="http://www.nasa.gov/centers/goddard/home/index.html" rel="nofollow">NASA Goddard Space Flight Center</a></b> enables NASA’s mission through four scientific endeavors: Earth Science, Heliophysics, Solar System Exploration, and Astrophysics. Goddard plays a leading role in NASA’s accomplishments by contributing compelling scientific knowledge to advance the Agency’s mission. <b>Follow us on <a href="http://twitter.com/NASA_GoddardPix" rel="nofollow">Twitter</a></b> <b>Like us on <a href="http://www.facebook.com/pages/Greenbelt-MD/NASA-Goddard/395013845897?ref=tsd" rel="nofollow">Facebook</a></b> <b>Find us on <a href="http://instagram.com/nasagoddard?vm=grid" rel="nofollow">Instagram</a></b>
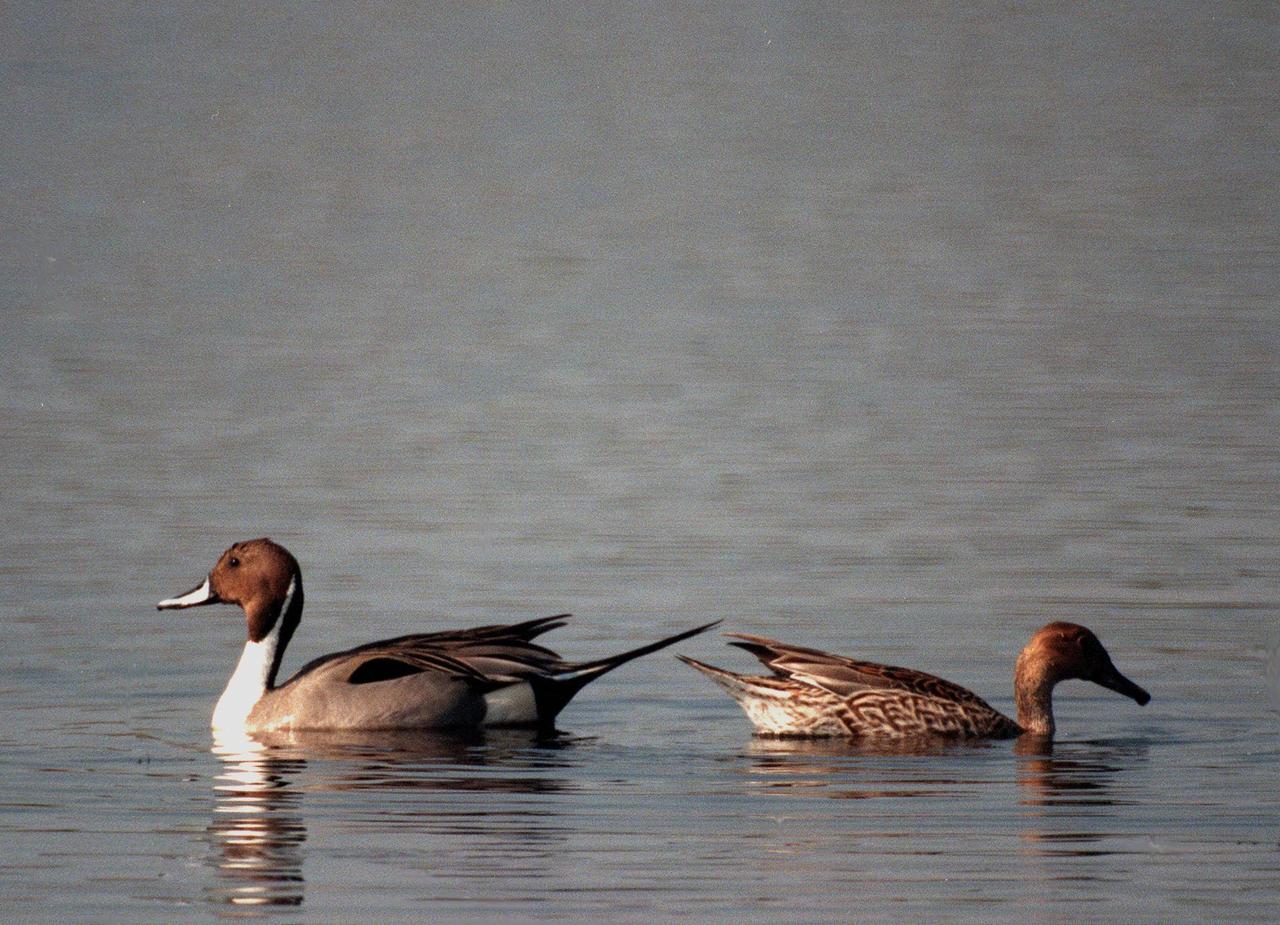
KENNEDY SPACE CENTER, FLA. -- A male pintail duck (left) and female pintail (right) look like bookends on a glass-topped table in the winter waters of the Merritt Island National Wildlife Refuge at Kennedy Space Center. The pintails can be found in the marshes, prairie ponds and tundra of Alaska, Greenland and north and western United States; in the winter they range south and east to Central America and the West Indies, sometimes in salt marshes such as the refuge offers. The open water of the refuge provides wintering areas for 23 species of migratory waterfowl, as well as a year-round home for great blue herons, great egrets, wood storks, cormorants, brown pelicans and other species of marsh and shore birds. The 92,000-acre refuge is also habitat for more than 310 species of birds, 25 mammals, 117 fishes and 65 amphibians and reptiles
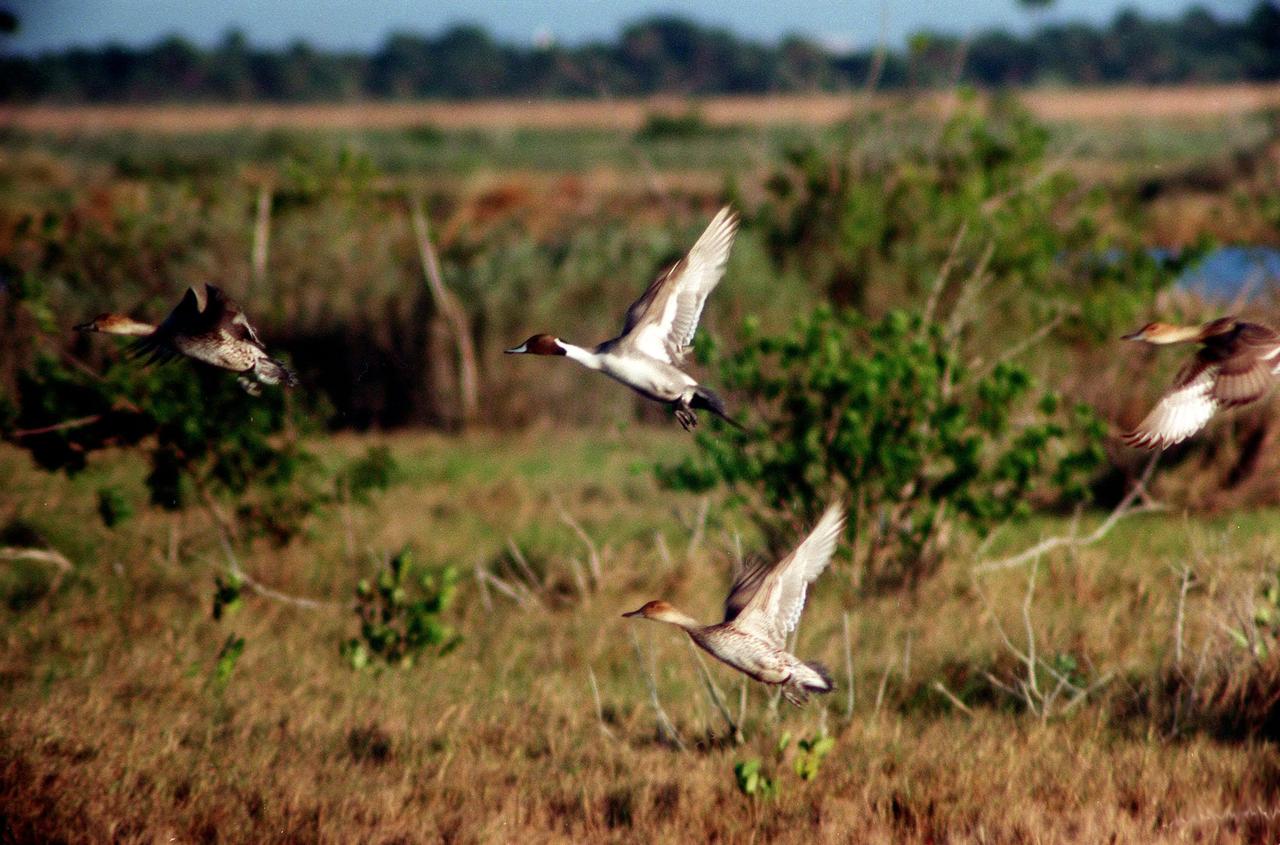
KENNEDY SPACE CENTER, FLA. -- Ducks take flight across the marshes of the Merritt Island National Wildlife Refuge at Kennedy Space Center. The duck at top-center is a pintail, which can be found in marshes, prairie ponds and tundra, and salt marshes in winter. They range from Alaska and Greenland south to Central America and the West Indies. The open waters of the Wildlife Refuge provide wintering areas for 23 species of migratory waterfowl as well as a year-round home for great blue herons, great egrets, wood storks, cormorants, brown pelicans and other species of marsh and shore birds. The refuge comprises 92,000 acres, ranging from fresh-water impoundments, salt-water estuaries and brackish marshes to hardwood hammocks and pine flatwoods
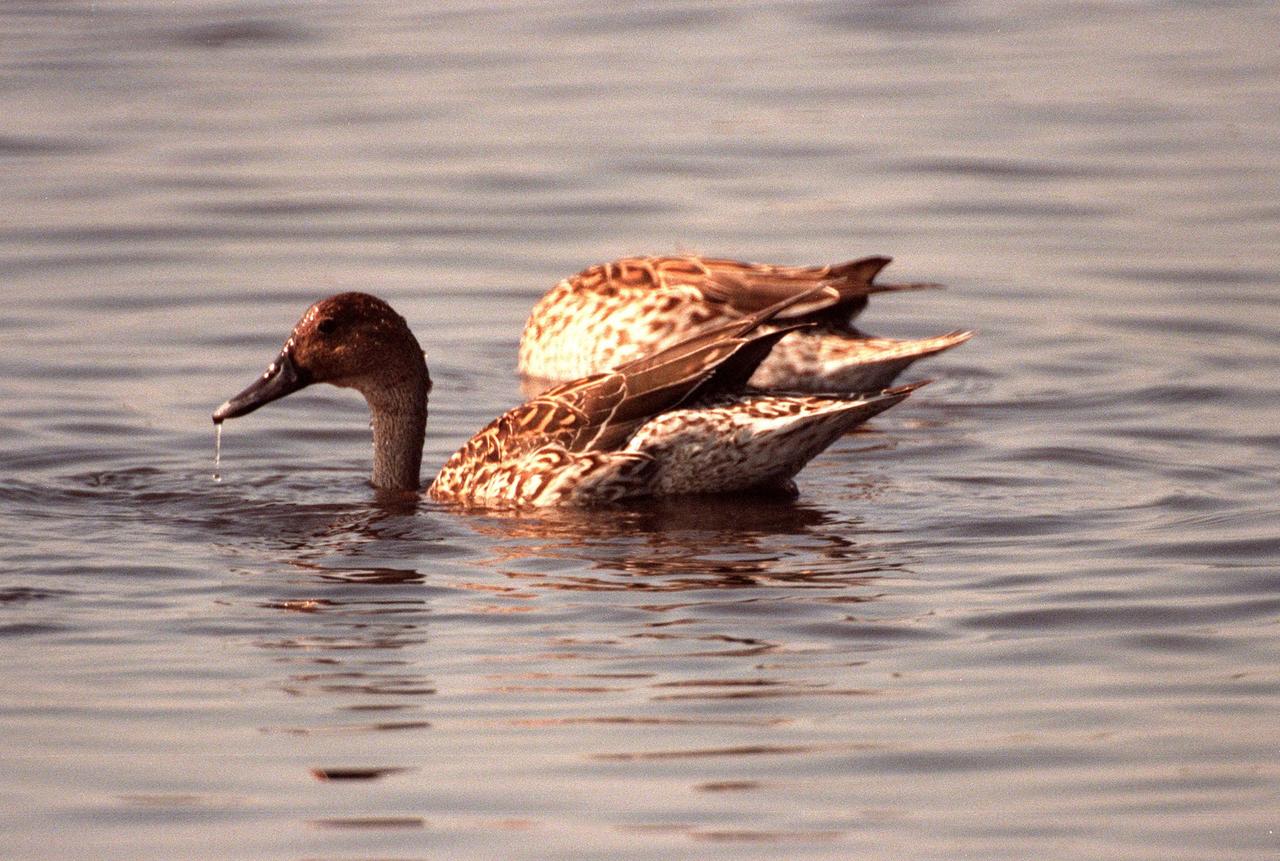
KENNEDY SPACE CENTER, FLA. -- Two female pintail ducks search for food in the winter waters of the Merritt Island National Wildlife Refuge at Kennedy Space Center. The pintails can be found in the marshes, prairie ponds and tundra of Alaska, Greenland and north and western United States; in the winter they range south and east to Central America and the West Indies, sometimes in salt marshes such as the refuge offers. The open water of the refuge provides wintering areas for 23 species of migratory waterfowl, as well as a year-round home for great blue herons, great egrets, wood storks, cormorants, brown pelicans and other species of marsh and shore birds. The 92,000-acre refuge is also habitat for more than 310 species of birds, 25 mammals, 117 fishes and 65 amphibians and reptiles
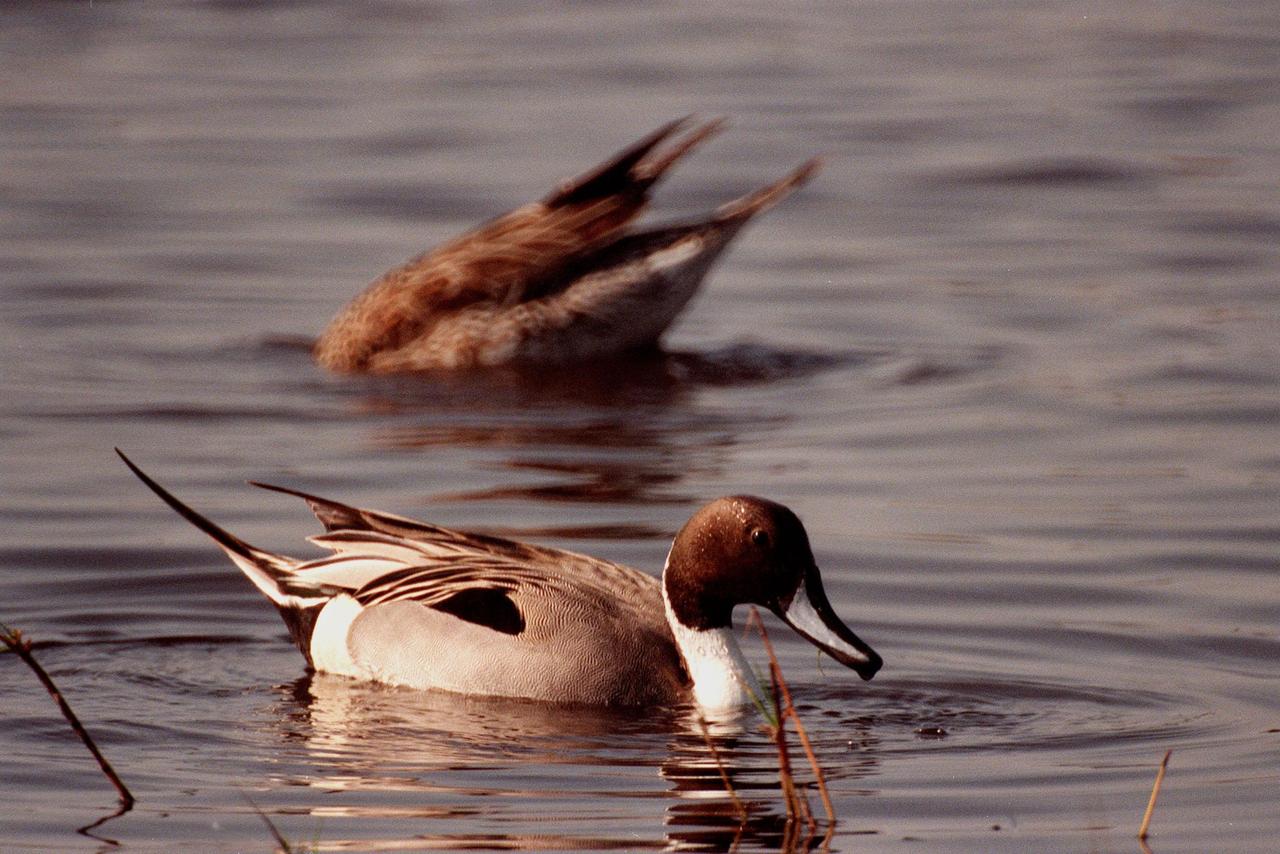
KENNEDY SPACE CENTER, FLA. -- A male pintail duck (foreground) paddles in the waters of the Merritt Island National Wildlife Refuge at Kennedy Space Center while a female behind him bobs for food. The pintails can be found in the marshes, prairie ponds and tundra of Alaska, Greenland and north and western United States; in the winter they range south and east to Central America and the West Indies, sometimes in salt marshes such as the refuge offers. The open water of the refuge provides wintering areas for 23 species of migratory waterfowl, as well as a year-round home for great blue herons, great egrets, wood storks, cormorants, brown pelicans and other species of marsh and shore birds. The 92,000-acre refuge is also habitat for more than 310 species of birds, 25 mammals, 117 fishes and 65 amphibians and reptiles
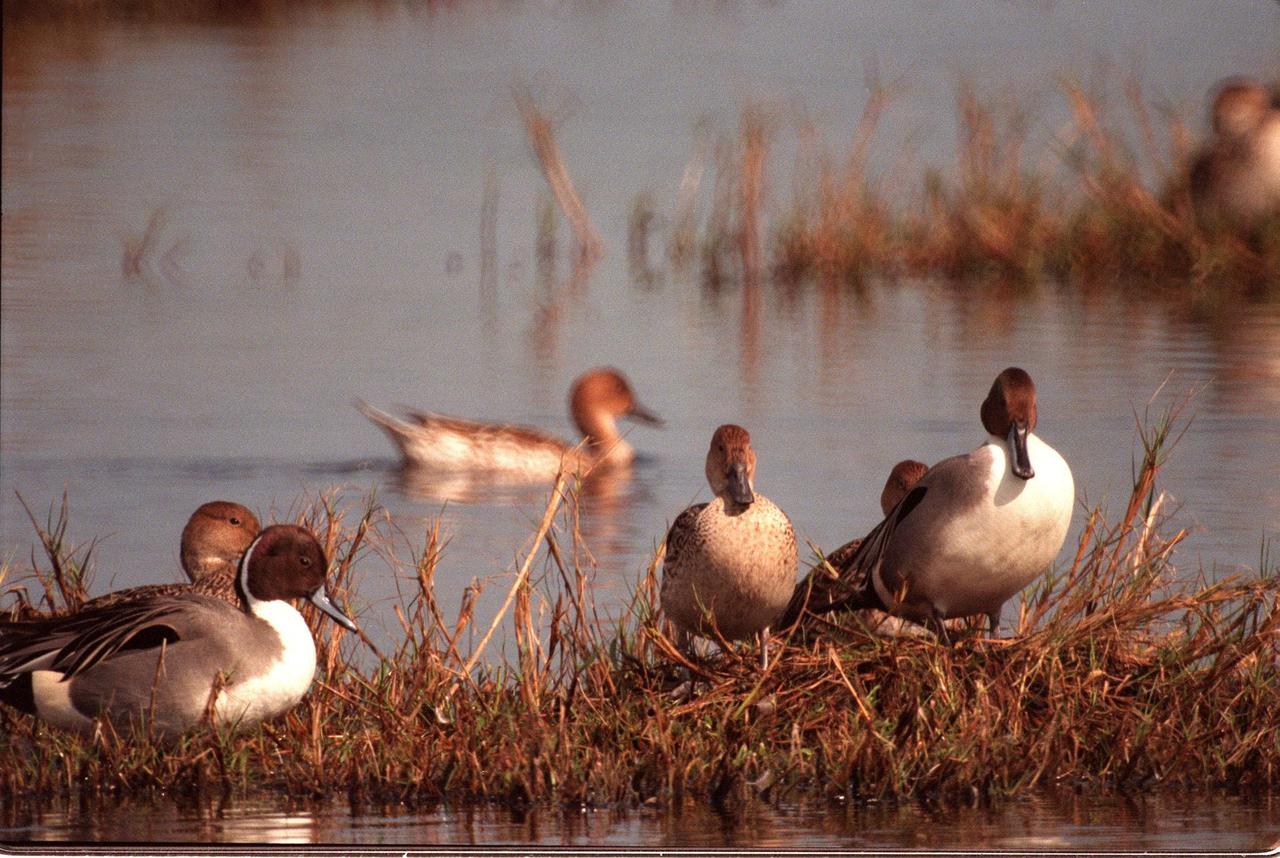
KENNEDY SPACE CENTER, FLA. -- Male (foreground) and female pintail ducks climb onto a grassy spot in the waters of the Merritt Island National Wildlife Refuge at Kennedy Space Center. The pintails can be found in the marshes, prairie ponds and tundra of Alaska, Greenland and north and western United States; in the winter they range south and east to Central America and the West Indies, sometimes in salt marshes such as the refuge offers. The open water of the refuge provides wintering areas for 23 species of migratory waterfowl, as well as a year-round home for great blue herons, great egrets, wood storks, cormorants, brown pelicans and other species of marsh and shore birds. The 92,000-acre refuge is also habitat for more than 310 species of birds, 25 mammals, 117 fishes and 65 amphibians and reptiles
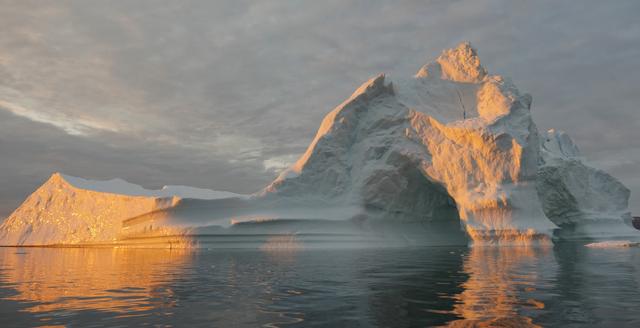
Sea level rise is a natural consequence of the warming of our planet. We know this from basic physics. When water heats up, it expands. So when the ocean warms, sea level rises. When ice is exposed to heat, it melts. And when ice on land melts and water runs into the ocean, sea level rises. For thousands of years, sea level has remained relatively stable and human communities have settled along the planet’s coastlines. But now Earth’s seas are rising. Globally, sea level has risen about eight inches since the beginning of the 20th century and more than two inches in the last 20 years alone. All signs suggest that this rise is accelerating. Read more: <a href="http://go.nasa.gov/1heZn29" rel="nofollow">go.nasa.gov/1heZn29</a> Caption: An iceberg floats in Disko Bay, near Ilulissat, Greenland, on July 24, 2015. The massive Greenland ice sheet is shedding about 300 gigatons of ice a year into the ocean, making it the single largest source of sea level rise from melting ice. Credits: NASA/Saskia Madlener <b><a href="http://www.nasa.gov/audience/formedia/features/MP_Photo_Guidelines.html" rel="nofollow">NASA image use policy.</a></b> <b><a href="http://www.nasa.gov/centers/goddard/home/index.html" rel="nofollow">NASA Goddard Space Flight Center</a></b> enables NASA’s mission through four scientific endeavors: Earth Science, Heliophysics, Solar System Exploration, and Astrophysics. Goddard plays a leading role in NASA’s accomplishments by contributing compelling scientific knowledge to advance the Agency’s mission. <b>Follow us on <a href="http://twitter.com/NASAGoddardPix" rel="nofollow">Twitter</a></b> <b>Like us on <a href="http://www.facebook.com/pages/Greenbelt-MD/NASA-Goddard/395013845897?ref=tsd" rel="nofollow">Facebook</a></b> <b>Find us on <a href="http://instagrid.me/nasagoddard/?vm=grid" rel="nofollow">Instagram</a></b>

In May 2014, two new studies concluded that a section of the land-based West Antarctic ice sheet had reached a point of inevitable collapse. Meanwhile, fresh observations from September 2014 showed sea ice around Antarctica had reached its greatest extent since the late 1970s. To better understand such dynamic and dramatic differences in the region's land and sea ice, researchers are travelling south to Antarctica this month for the sixth campaign of NASA’s Operation IceBridge. The airborne campaign, which also flies each year over Greenland, makes annual surveys of the ice with instrumented research aircraft. Instruments range from lasers that map the elevation of the ice surface, radars that "see" below it, and downward looking cameras to provide a natural-color perspective. The Digital Mapping System (DMS) camera acquired the above photo during the mission’s first science flight on October 16, 2009. At the time of the image, the DC-8 aircraft was flying at an altitude of 515 meters (1,700 feet) over heavily compacted first-year sea ice along the edge of the Amundsen Sea. Since that first flight, much has been gleaned from IceBridge data. For example, images from an IceBridge flight in October 2011 revealed a massive crack running about 29 kilometers (18 miles) across the floating tongue of Antarctica's Pine Island Glacier. The crack ultimately led to a 725-square-kilometer (280-square-mile) iceberg. In 2012, IceBridge data was a key part of a new map of Antarctica called Bedmap2. By combining surface elevation, ice thickness, and bedrock topography, Bedmap2 gives a clearer picture of Antarctica from the ice surface down to the land surface. Discoveries have been made in Greenland, too, including the identification of a 740-kilometer-long (460-mile-long) mega canyon below the ice sheet. Repeated measurements of land and sea ice from aircraft extend the record of observations once made by NASA’s Ice, Cloud, and Land Elevation Satellite, or ICESat, which stopped functioning in 2009. In addition to extending the ICESat record, IceBridge also sets the stage for ICESat-2, which is scheduled for launch in 2017. Credit: IceBridge DMS L0 Raw Imagery courtesy of the Digital Mapping System (DMS) team/NASA DAAC at the National Snow and Ice Data Center More info: <a href="http://earthobservatory.nasa.gov/IOTD/view.php?id=84549" rel="nofollow">earthobservatory.nasa.gov/IOTD/view.php?id=84549</a> <a href="http://earthobservatory.nasa.gov/IOTD/view.php?id=84549" rel="nofollow">earthobservatory.nasa.gov/IOTD/view.php?id=84549</a>
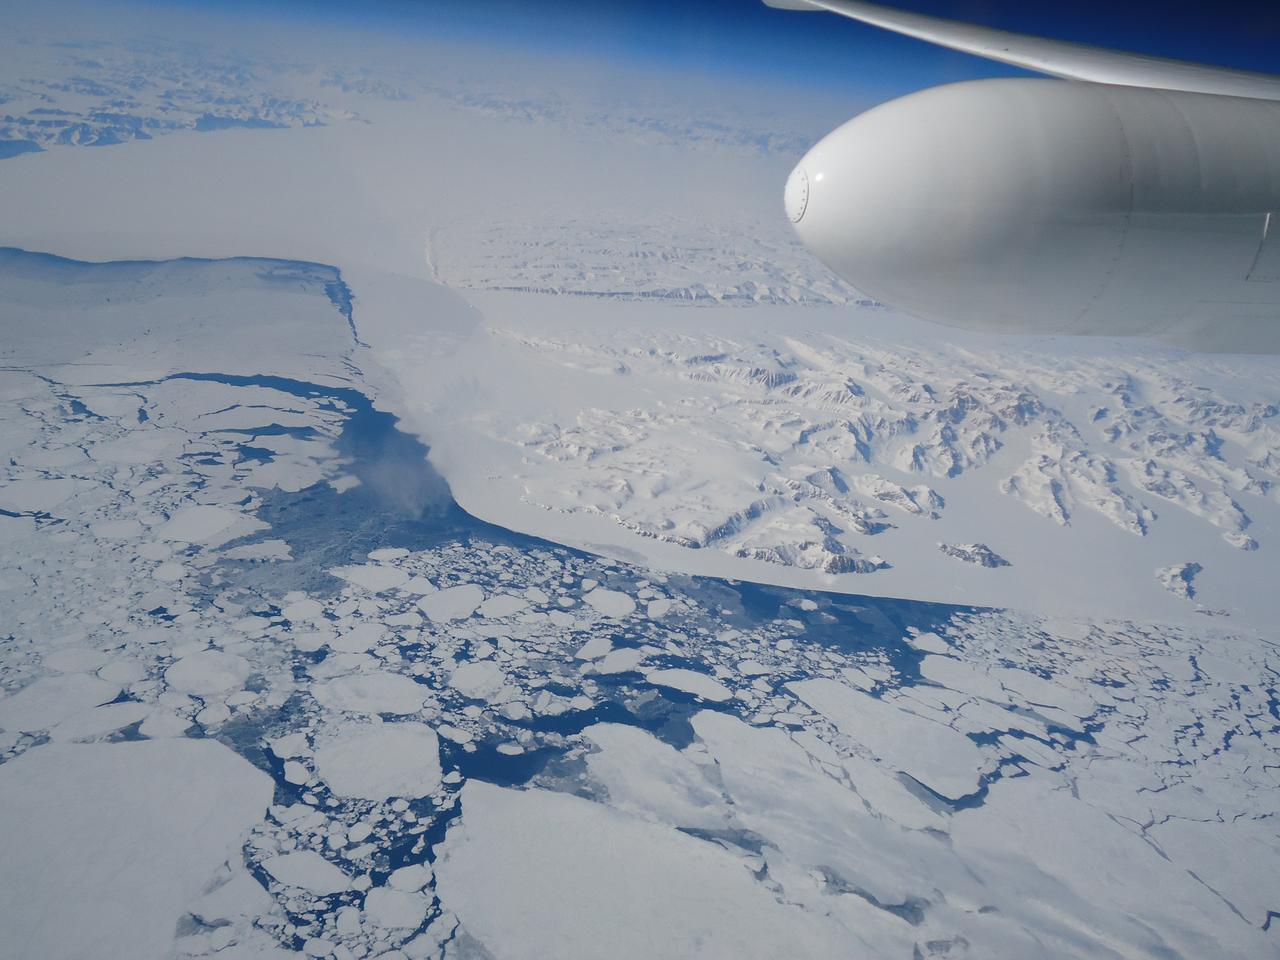
NASA's Multiple Altimeter Beam Experimental Lidar flew over Southwest Greenland's glaciers and sea ice to test a new method of measuring the height of Earth from space. Read more here: <a href="http://1.usa.gov/1fkvoBp" rel="nofollow">1.usa.gov/1fkvoBp</a> Credit: NASA/Tim Williams <b><a href="http://www.nasa.gov/audience/formedia/features/MP_Photo_Guidelines.html" rel="nofollow">NASA image use policy.</a></b> <b><a href="http://www.nasa.gov/centers/goddard/home/index.html" rel="nofollow">NASA Goddard Space Flight Center</a></b> enables NASA’s mission through four scientific endeavors: Earth Science, Heliophysics, Solar System Exploration, and Astrophysics. Goddard plays a leading role in NASA’s accomplishments by contributing compelling scientific knowledge to advance the Agency’s mission. <b>Follow us on <a href="http://twitter.com/NASAGoddardPix" rel="nofollow">Twitter</a></b> <b>Like us on <a href="http://www.facebook.com/pages/Greenbelt-MD/NASA-Goddard/395013845897?ref=tsd" rel="nofollow">Facebook</a></b> <b>Find us on <a href="http://instagram.com/nasagoddard?vm=grid" rel="nofollow">Instagram</a></b>

NASA's P-3B airborne laboratory on the ramp at Thule Air Base in Greenland early on the morning of Mar. 21, 2013. Credit: NASA/Goddard/Christy Hansen NASA's Operation IceBridge is an airborne science mission to study Earth's polar ice. For more information about IceBridge, visit: <a href="http://www.nasa.gov/icebridge" rel="nofollow">www.nasa.gov/icebridge</a> <b><a href="http://www.nasa.gov/audience/formedia/features/MP_Photo_Guidelines.html" rel="nofollow">NASA image use policy.</a></b> <b><a href="http://www.nasa.gov/centers/goddard/home/index.html" rel="nofollow">NASA Goddard Space Flight Center</a></b> enables NASA’s mission through four scientific endeavors: Earth Science, Heliophysics, Solar System Exploration, and Astrophysics. Goddard plays a leading role in NASA’s accomplishments by contributing compelling scientific knowledge to advance the Agency’s mission. <b>Follow us on <a href="http://twitter.com/NASA_GoddardPix" rel="nofollow">Twitter</a></b> <b>Like us on <a href="http://www.facebook.com/pages/Greenbelt-MD/NASA-Goddard/395013845897?ref=tsd" rel="nofollow">Facebook</a></b> <b>Find us on <a href="http://instagram.com/nasagoddard?vm=grid" rel="nofollow">Instagram</a></b>
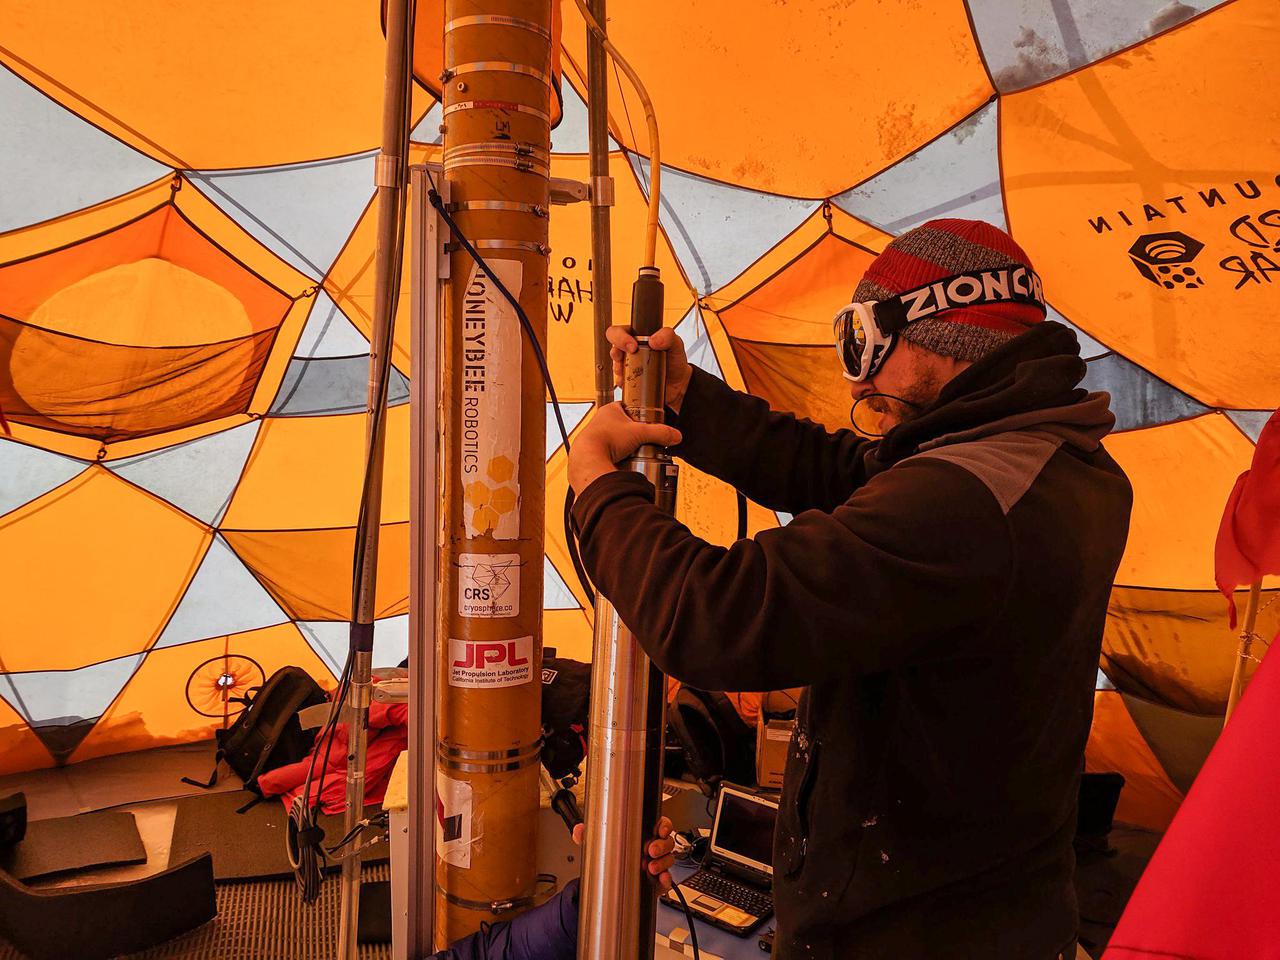
During 2019 field tests near Greenland's Summit Station, a high-elevation remote observing station, the WATSON (Wireline Analysis Tool for the Subsurface Observation of Northern ice sheets) instrument is put through its paces to seek out signs of life, or biosignatures, 360 feet (110 meters) down a borehole. In this photograph, a WATSON team member secures the tether to the top of the tube-like instrument and drill before lowering it into the ice. The tether also acts as the power cable and data feed. Care must be taken to ensure a tight connection between the tether and instrument, else the instrument could be lost in the ice. WATSON could one day be launched aboard a robotic mission to seek out biosignatures on the ocean moons of Enceladus, Europa, or even Titan. The WATSON team hopes to test the instrument in a variety of cold locations on Earth to see how the distribution and variety of biosignatures change depending on where they are. By testing WATSON in different Earth analogs — areas on Earth that can stand in for those on other worlds — scientists would be able to better understand the chemical fingerprints of any biosignatures detected on other worlds. https://photojournal.jpl.nasa.gov/catalog/PIA24170
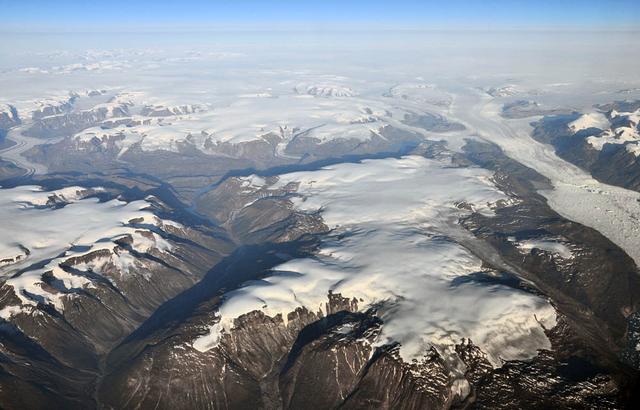
Peripheral glaciers and ice caps (isolated from the main ice sheet, which is seen in the upper right section of the image) in eastern Greenland. To learn about the contributions of glaciers to sea level rise, visit: <a href="http://www.nasa.gov/topics/earth/features/glacier-sea-rise.html" rel="nofollow">www.nasa.gov/topics/earth/features/glacier-sea-rise.html</a> Credit: Frank Paul, University of Zurich <b><a href="http://www.nasa.gov/audience/formedia/features/MP_Photo_Guidelines.html" rel="nofollow">NASA image use policy.</a></b> <b><a href="http://www.nasa.gov/centers/goddard/home/index.html" rel="nofollow">NASA Goddard Space Flight Center</a></b> enables NASA’s mission through four scientific endeavors: Earth Science, Heliophysics, Solar System Exploration, and Astrophysics. Goddard plays a leading role in NASA’s accomplishments by contributing compelling scientific knowledge to advance the Agency’s mission. <b>Follow us on <a href="http://twitter.com/NASA_GoddardPix" rel="nofollow">Twitter</a></b> <b>Like us on <a href="http://www.facebook.com/pages/Greenbelt-MD/NASA-Goddard/395013845897?ref=tsd" rel="nofollow">Facebook</a></b> <b>Find us on <a href="http://instagram.com/nasagoddard?vm=grid" rel="nofollow">Instagram</a></b>
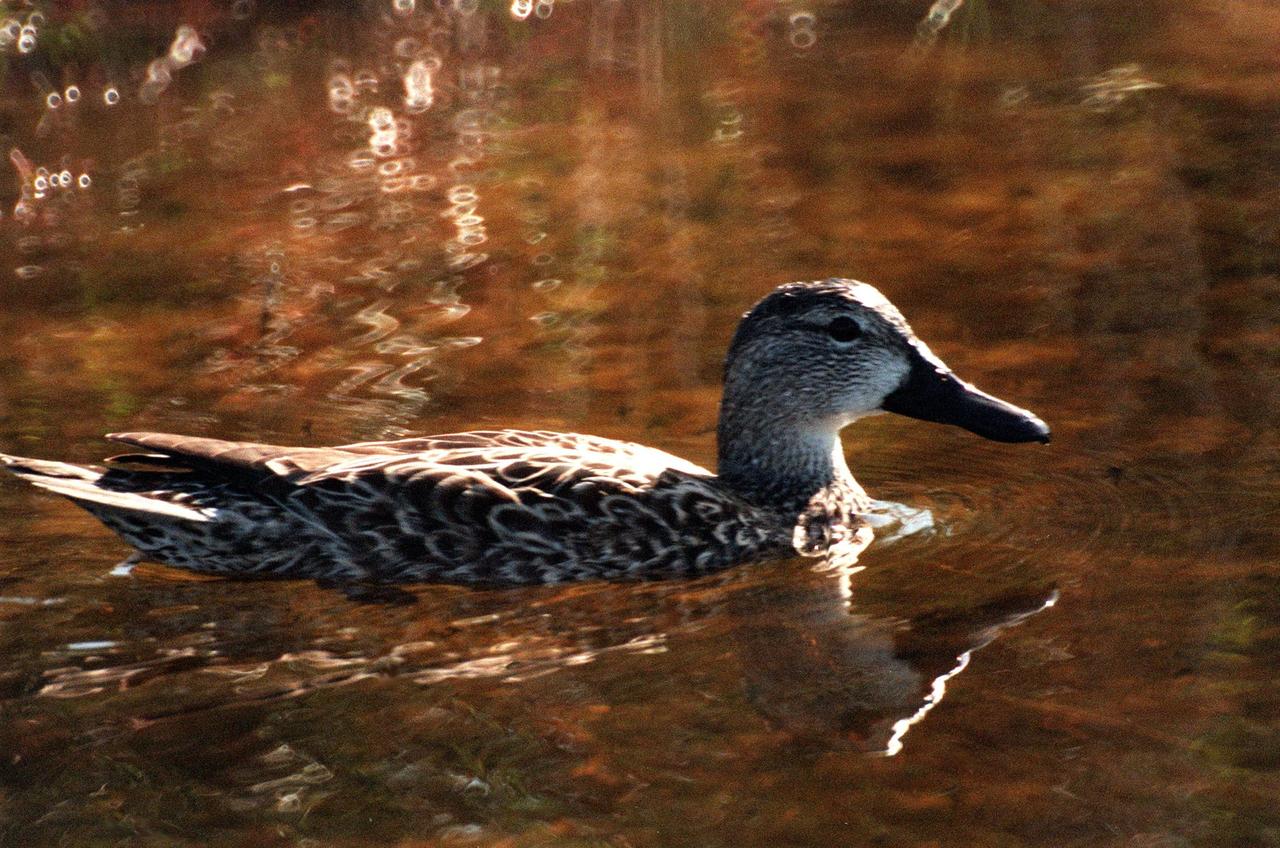
KENNEDY SPACE CENTER, FLA. -- A pintail duck swims calmly in the waters of the Merritt Island National <a href="http://www-pao.ksc.nasa.gov/kscpao/captions/subjects/wildlife.htm">Wildlife </a>Refuge, which shares a boundary with the space center. The pintail can be found in marshes, prairie ponds and tundra, and salt marshes in winter. They range from Alaska and Greenland south to Central America and the West Indies. The open waters of the Wildlife Refuge provide wintering areas for 23 species of migratory waterfowl as well as a year-round home for great blue herons, great egrets, wood storks, cormorants, brown pelicans and other species of marsh and shore birds. The refuge comprises 92,000 acres, ranging from fresh-water impoundments, salt-water estuaries and brackish marshes to hardwood hammocks and pine flatwoods. The diverse landscape provides habitat for more than 310 species of birds, 25 mammals, 117 fishes, and 65 amphibians and reptiles, including such endangered species as Southern bald eagles, wood storks, Florida scrub jays, Atlantic loggerhead and leatherback turtles, osprey, and nearly 5,000 alligators

The late winter sun shone brightly on a stunning scene of clouds and ice in the Davis Strait in late February, 2013. The Moderate Resolution Imaging Spectroradiometer aboard NASA’s Aqua satellite captured this true-color image on February 22 at 1625 UTC. The Davis Strait connects the Labrador Sea (part of the Atlantic Ocean) in the south with Baffin Bay to the north, and separates Canada, to the west, from Greenland to the east. Strong, steady winds frequently blow southward from the colder Baffin Bay to the warmer waters of the Labrador Sea. Over ice, the air is dry and no clouds form. However, as the Arctic air moves over the warmer, open water the rising moist air and the temperature differential gives rise to lines of clouds. In this image, the clouds are aligned in a beautiful, parallel pattern. Known as “cloud streets”, this pattern is formed in a low-level wind, with the clouds aligning in the direction of the wind. Credit: NASA/GSFC/Jeff Schmaltz/MODIS Land Rapid Response Team <b><a href="http://www.nasa.gov/audience/formedia/features/MP_Photo_Guidelines.html" rel="nofollow">NASA image use policy.</a></b> <b><a href="http://www.nasa.gov/centers/goddard/home/index.html" rel="nofollow">NASA Goddard Space Flight Center</a></b> enables NASA’s mission through four scientific endeavors: Earth Science, Heliophysics, Solar System Exploration, and Astrophysics. Goddard plays a leading role in NASA’s accomplishments by contributing compelling scientific knowledge to advance the Agency’s mission. <b>Follow us on <a href="http://twitter.com/NASA_GoddardPix" rel="nofollow">Twitter</a></b> <b>Like us on <a href="http://www.facebook.com/pages/Greenbelt-MD/NASA-Goddard/395013845897?ref=tsd" rel="nofollow">Facebook</a></b> <b>Find us on <a href="http://instagram.com/nasagoddard?vm=grid" rel="nofollow">Instagram</a></b>
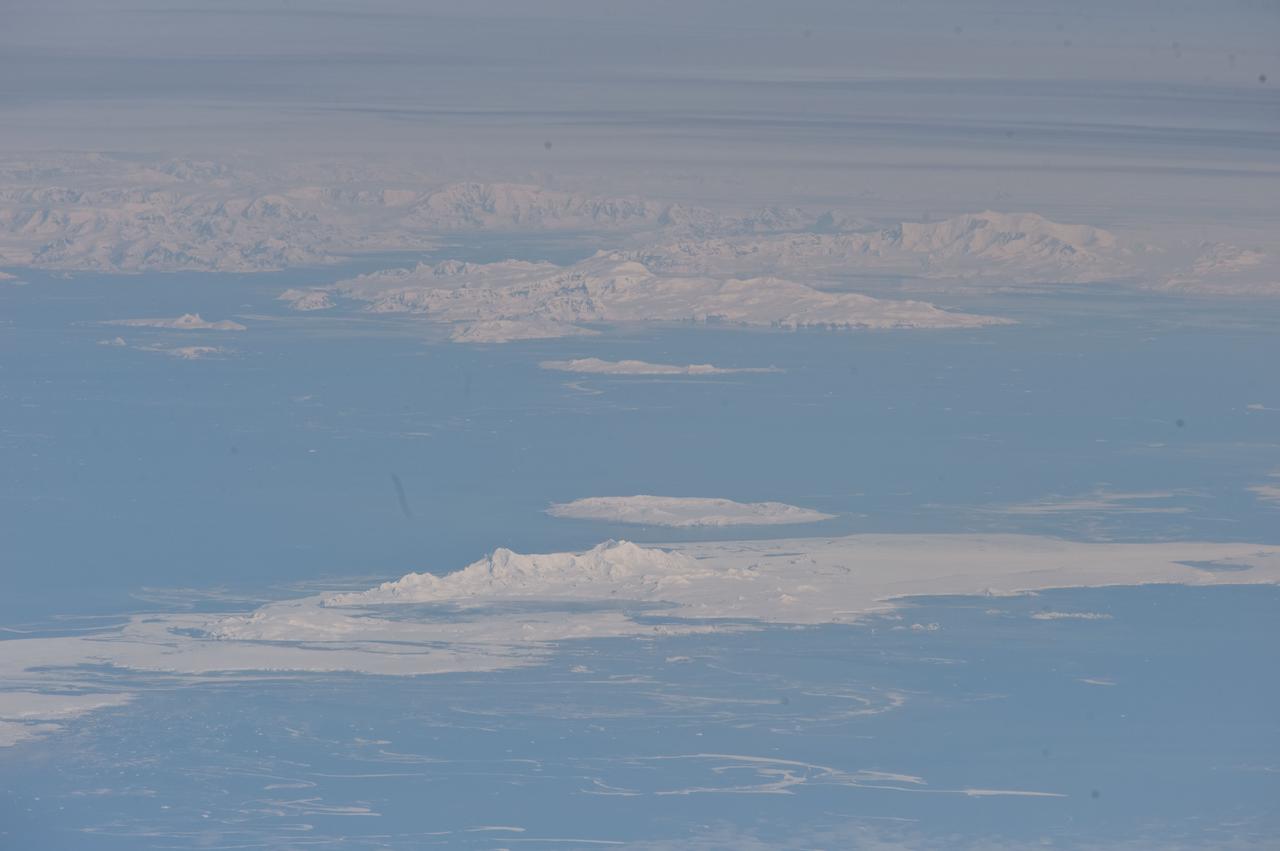
ISS029-E-041836 (4 Oct. 2011) --- South Shetland Islands and Antarctic Peninsula are featured in this image photographed by an Expedition 29 crew member on the International Space Station (ISS). The inclined equatorial orbit of the space station limits nadir Earth views?looking ?straight down? at the surface from the spacecraft?to latitudes between approximately 52 North and 52 South. When viewing conditions are ideal, the crew can obtain detailed oblique imagery?looking outwards at an angle from the space station?of regions at higher latitudes such as Greenland or, in this image, Antarctica. While the bulk of the continent of Antarctica is currently situated over the South Pole, the narrow Antarctic Peninsula extends like a finger towards the southern tip of South America. The northernmost part of the Peninsula is known as Graham Land, a small portion of which (located at approximately 64 South latitude) can be seen at top left in this photograph. Two of the South Shetland Islands that lay off the coast of Graham Land to the north-northwest, Livingston Island and Deception Island, are visible in the image. While both islands have a volcanic origin, active volcanism at Deception Island has been recorded since 1800; the last verified eruptive activity occurred in 1970. Closer to the coastline of Graham Land, Brabant Island (not considered to be part of the South Shetlands) also includes numerous outcrops of volcanic rock attesting to the complex tectonic history of the region. The space station was located over the South Atlantic Ocean, approximately 1,800 kilometers to the northeast in terms of its ground track, when this image was taken. This long viewing distance, combined with the highly oblique viewing angle, accentuates shadowing of the ground surface and provides a sense of the topography similar to the view one gets from an airplane. It also causes foreshortening of features visible in the image, making them appear closer to each other than they actually are ? for example, the actual distance between Livingston and Deception Islands is approximately 20 kilometers.
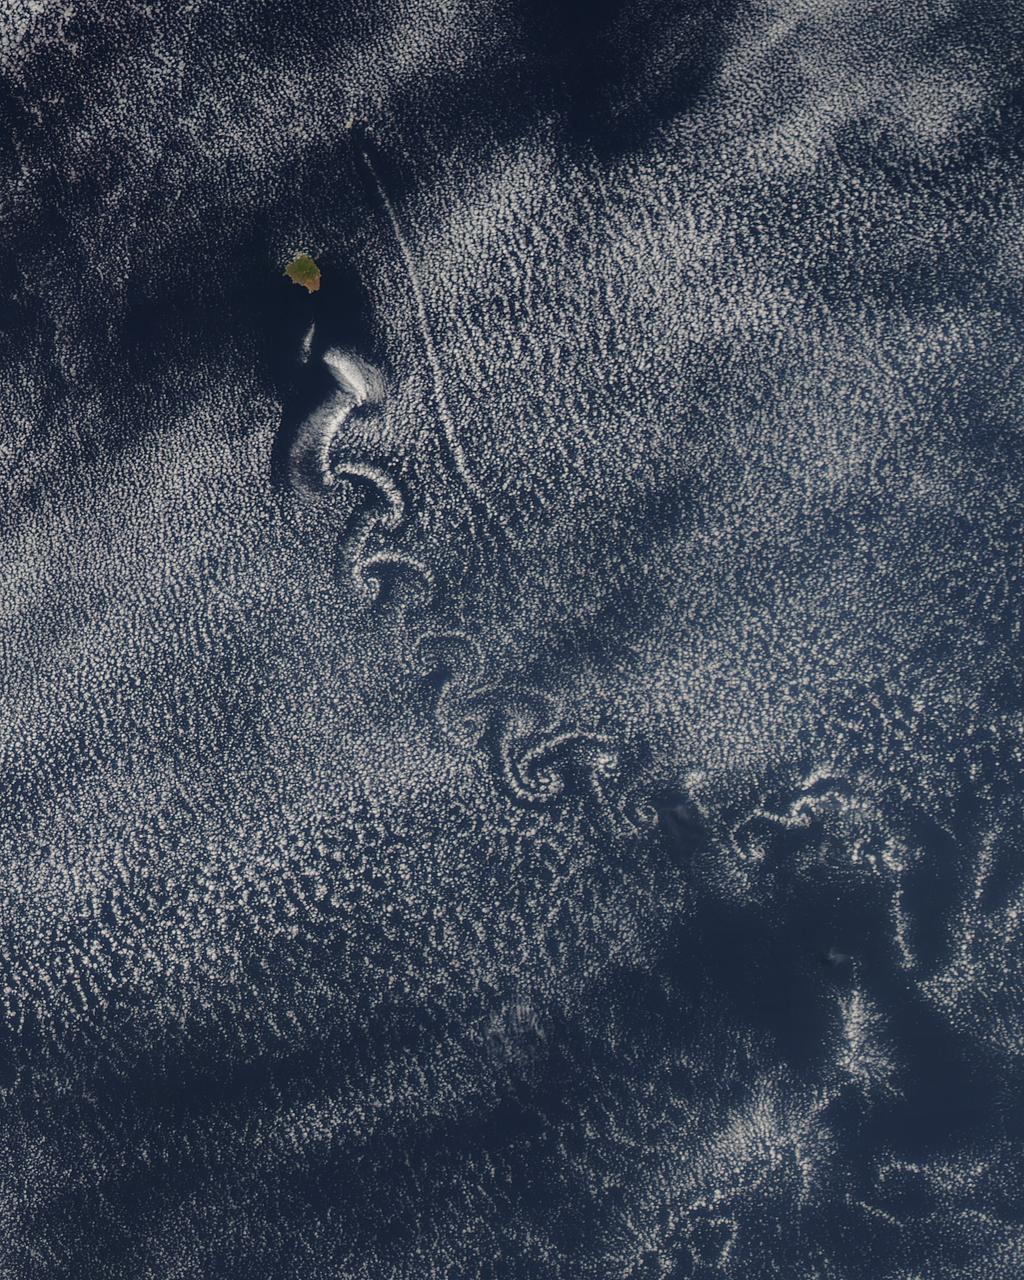
Theodore von Kármán, a Hungarian-American physicist, was the first to describe the physical processes that create long chains of spiral eddies like the one shown above. Known as von Kármán vortices the patterns can form nearly anywhere that fluid flow is disturbed by an object. Since the atmosphere behaves like a fluid, the wing of an airplane, a bridge, even an island can trigger the distinctive phenomenon. On May 22, 2013, the Moderate Resolution Imaging Spectroradiometer (MODIS) on NASA’s Terra satellite captured this natural-color image of cloud vortices behind Isla Socorro, a volcanic island located in the Pacific Ocean. The island, which is located a few hundred kilometers off the west coast of Mexico and the southern tip of Baja California, is part of the Revillagigedo Archipelago. Satellite sensors have spotted von Kármán vortices around the globe, including off of Guadalupe Island, near the coast of Chile, in the Greenland Sea, in the Arctic, and even next to a tropical storm. NASA image courtesy Jeff Schmaltz, LANCE/EOSDIS MODIS Rapid Response Team at NASA GSFC. Caption by Adam Voiland. Instrument: Terra - MODIS More info: <a href="http://1.usa.gov/14VSDQa" rel="nofollow">1.usa.gov/14VSDQa</a> Credit: <b><a href="http://www.earthobservatory.nasa.gov/" rel="nofollow"> NASA Earth Observatory</a></b> <b><a href="http://www.nasa.gov/audience/formedia/features/MP_Photo_Guidelines.html" rel="nofollow">NASA image use policy.</a></b> <b><a href="http://www.nasa.gov/centers/goddard/home/index.html" rel="nofollow">NASA Goddard Space Flight Center</a></b> enables NASA’s mission through four scientific endeavors: Earth Science, Heliophysics, Solar System Exploration, and Astrophysics. Goddard plays a leading role in NASA’s accomplishments by contributing compelling scientific knowledge to advance the Agency’s mission. <b>Follow us on <a href="http://twitter.com/NASA_GoddardPix" rel="nofollow">Twitter</a></b> <b>Like us on <a href="http://www.facebook.com/pages/Greenbelt-MD/NASA-Goddard/395013845897?ref=tsd" rel="nofollow">Facebook</a></b> <b>Find us on <a href="http://instagram.com/nasagoddard?vm=grid" rel="nofollow">Instagram</a></b>
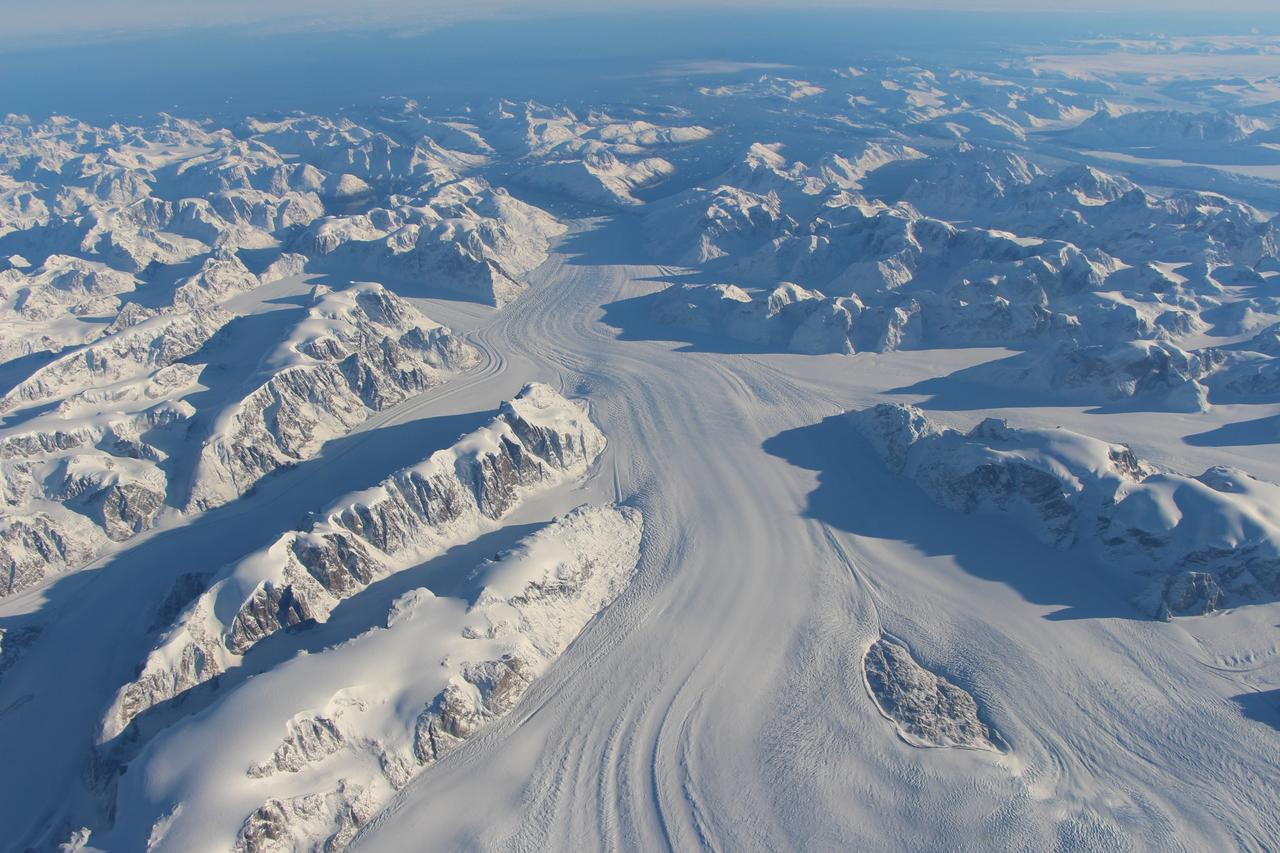
Heimdal Glacier in southern Greenland, in an image captured on Oct. 13, 2015, from NASA Langley Research Center's Falcon 20 aircraft flying 33,000 feet above mean sea level. NASA’s Operation IceBridge, an airborne survey of polar ice, recently finalized two overlapping campaigns at both of Earth’s poles. Down south, the mission observed a big drop in the height of two glaciers situated in the Antarctic Peninsula, while in the north it collected much needed measurements of the status of land and sea ice at the end of the Arctic summer melt season. This was the first time in its seven years of operations that IceBridge carried out parallel flights in the Arctic and Antarctic. Every year, the mission flies to the Arctic in the spring and to Antarctica in the fall to keep collect an uninterrupted record of yearly changes in the height of polar ice. Read more: <a href="http://www.nasa.gov/feature/goddard/nasa-s-operation-icebridge-completes-twin-polar-campaigns" rel="nofollow">www.nasa.gov/feature/goddard/nasa-s-operation-icebridge-c...</a> Credits: NASA/Goddard/John Sonntag <b><a href="http://www.nasa.gov/audience/formedia/features/MP_Photo_Guidelines.html" rel="nofollow">NASA image use policy.</a></b> <b><a href="http://www.nasa.gov/centers/goddard/home/index.html" rel="nofollow">NASA Goddard Space Flight Center</a></b> enables NASA’s mission through four scientific endeavors: Earth Science, Heliophysics, Solar System Exploration, and Astrophysics. Goddard plays a leading role in NASA’s accomplishments by contributing compelling scientific knowledge to advance the Agency’s mission. <b>Follow us on <a href="http://twitter.com/NASAGoddardPix" rel="nofollow">Twitter</a></b> <b>Like us on <a href="http://www.facebook.com/pages/Greenbelt-MD/NASA-Goddard/395013845897?ref=tsd" rel="nofollow">Facebook</a></b> <b>Find us on <a href="http://instagrid.me/nasagoddard/?vm=grid" rel="nofollow">Instagram</a></b>
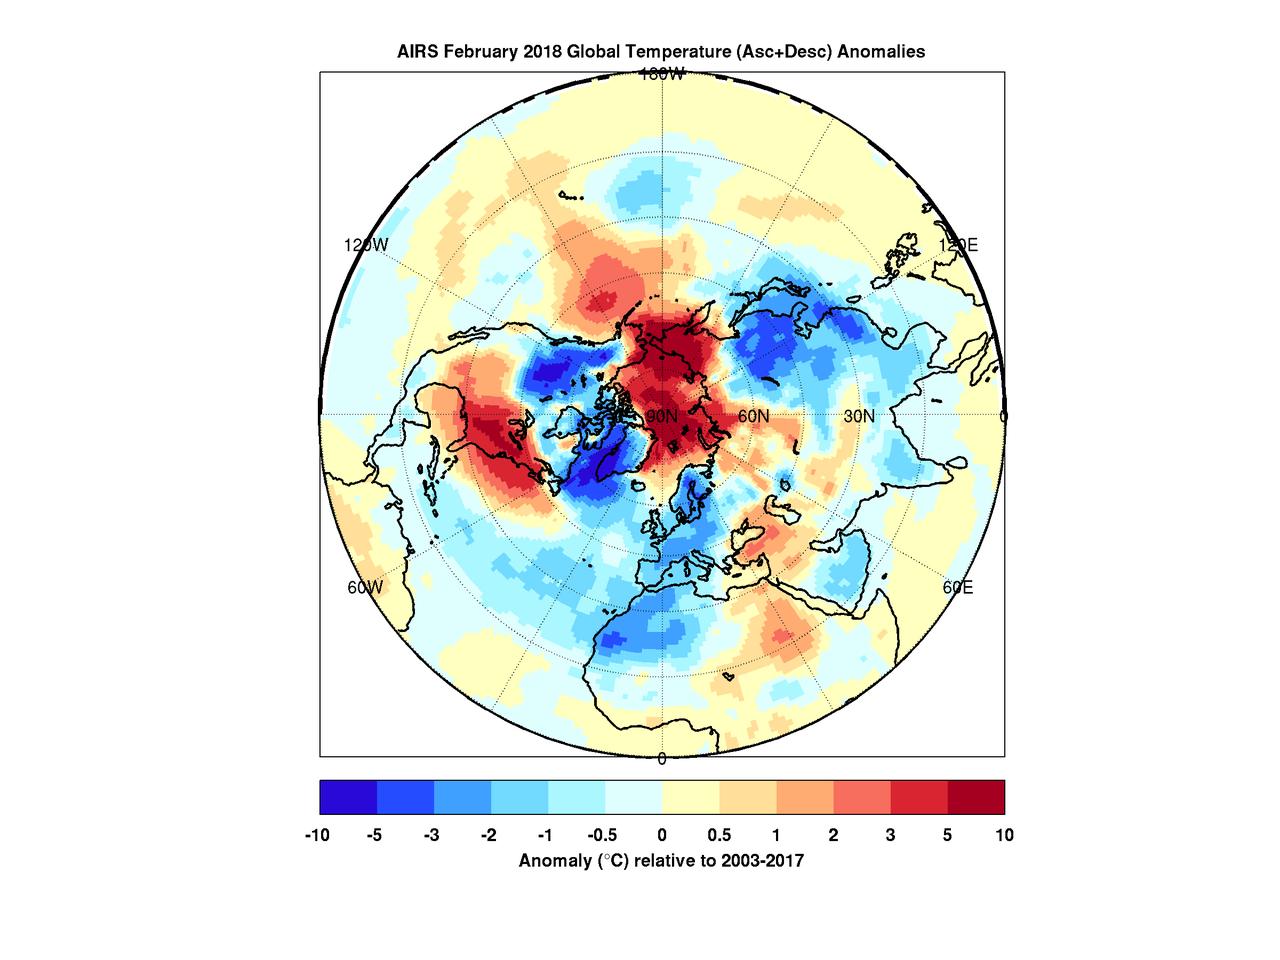
When the polar vortex dips south it often makes headlines. Frigid air, usually confined to the arctic, spills into lower parts of the continent making it a chilly challenge for people going about their day. But there's a warm part to the story as well. While the eastern and southern United States were shivering in January the arctic was experiencing above average temperatures. In maps created with data by the Atmospheric Infrared Sounder (AIRS) on NASA's Aqua satellite, warmer-than-normal temperatures are colored in red and below average temperatures are colored in blue. Provided in geographic and polar projections, the maps show regions of unusually cold air hovering over the eastern and southern U.S., eastern Canada and Greenland in January. February shows colder-than-normal air blanketing the northwest U.S., Canada, Western Europe, northwest Africa and East Asia. In both cases, the arctic remains exceptionally warm. During most winters the polar vortex is like a giant counterclockwise whirlpool spinning around the north pole with cold air at its center. Occasionally the vortex splits and its parts move south, usually over the continents. At the same time, warm air from the south moves in to fill the gap, and that northward movement usually occurs over the oceans. The cold air movement gets the most attention because it typically affects many millions of people. However, that cooling is very often accompanied by warming somewhere over the Arctic -- an equally important part of the polar vortex story that usually goes unnoticed but is very apparent in the images shown here. More images are available at https://photojournal.jpl.nasa.gov/catalog/PIA22344

The diagram – based on data used in a July 2024 NASA-funded study – shows polar motion, a phenomenon that results from the combined action of several physical processes that broadly shift the distribution of mass around the globe or create forces in its mantle and core that cause the planet to wobble as it rotates. These changes cause the spin axis to meander over time. The blue line starts at the position of the spin axis near the North Pole in 1900, the first year polar motion data was collected, and tracks it until 2023. The spin axis now sits about 30 feet (10 meters) from where it was in 1900, in the direction of Canada's Baffin Bay. Around 2000, the axis took a sudden eastward turn, which researchers at NASA's Jet Propulsion Laboratory in Southern California in a 2016 study attributed to faster melting of the Greenland and Antarctic ice sheets and groundwater depletion in Eurasia. Surendra Adhikari, a JPL geophysicist who co-authored that study, used measurements from the International Earth Rotation and Reference Systems Service to create the animation. Adhikari and collaborators from Switzerland, Canada, and Germany found in a July 2024 paper in Nature Geoscience that about 90% of repeated oscillations in polar motion between 1900 and 2018 could be explained by large-scale mass redistribution at Earth's surface due to the melting of ice sheets and glaciers and the depletion of aquifers. It also found that nearly all of the long-term, non-repeating drift of the axis was due to dynamics in the mantle. Animation available at https://photojournal.jpl.nasa.gov/catalog/PIA26120
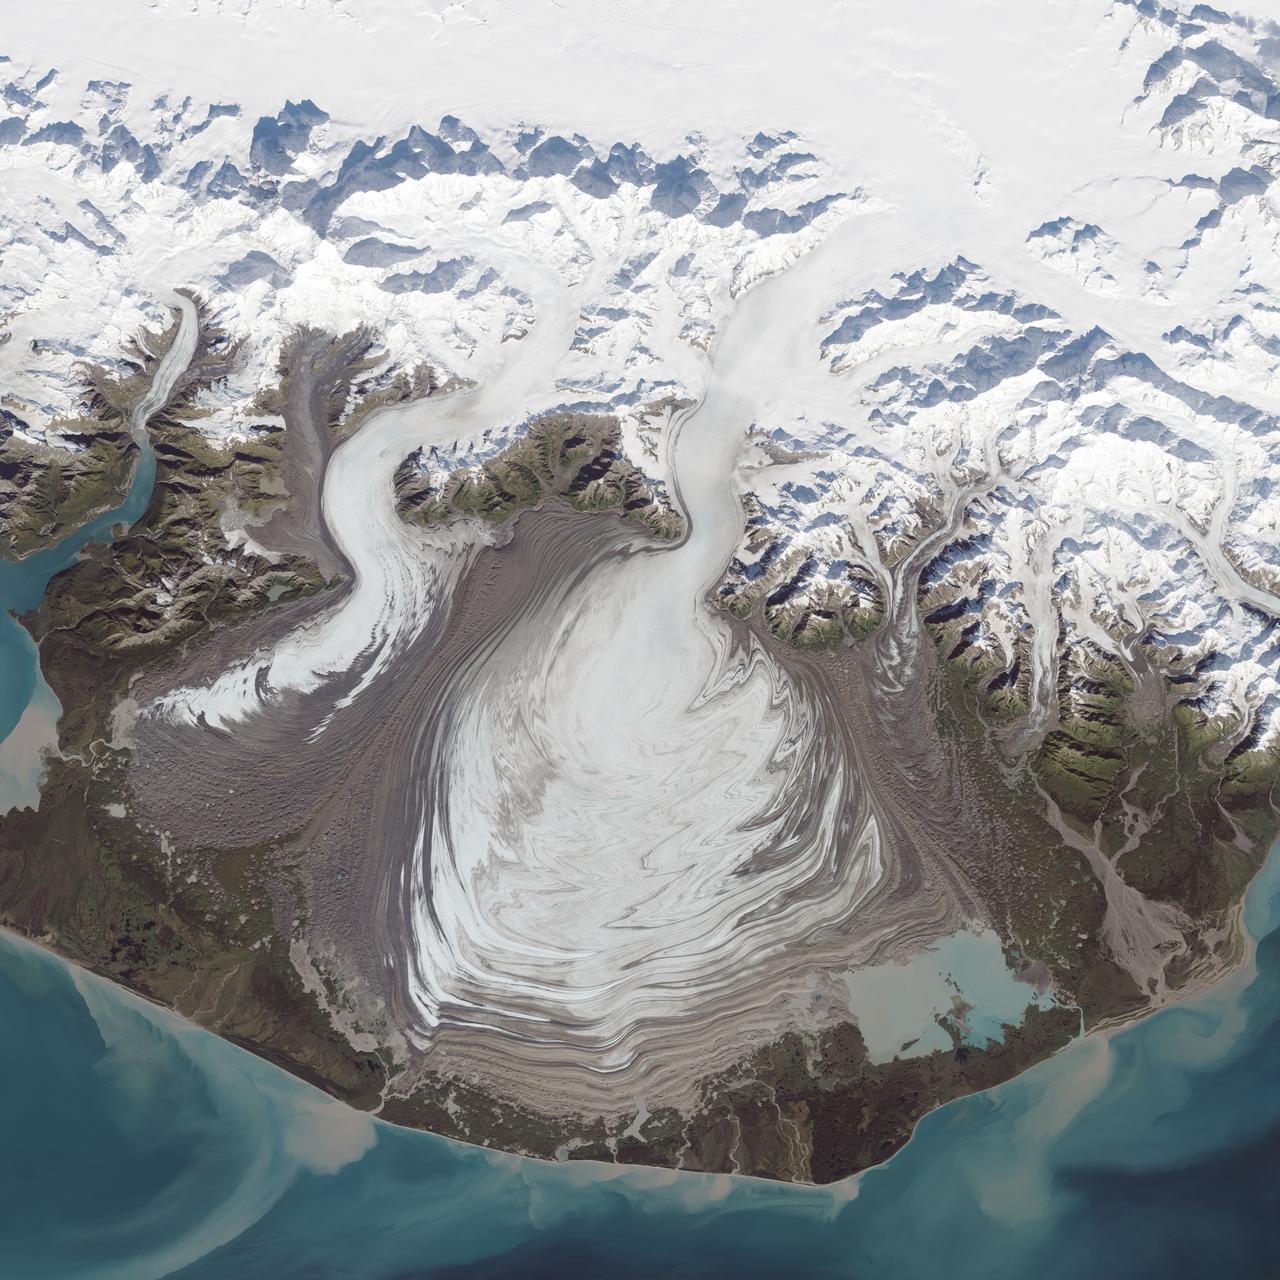
The ice of a piedmont glacier spills from a steep valley onto a relatively flat plain, where it spreads out unconstrained like pancake batter. Elephant Foot Glacier in northeastern Greenland is an excellent example; it is particularly noted for its symmetry. But the largest piedmont glacier in North America (and possibly the world) is Malaspina in southeastern Alaska. On September 24, 2014, the Operational Land Imager (OLI) on Landsat 8 acquired this image of Malaspina Glacier. The main source of ice comes from Seward Glacier, located at the top-center of this image. The Agassiz and Libbey glaciers are visible on the left side, and the Hayden and Marvine glaciers are on the right. The brown lines on the ice are moraines—areas where soil, rock, and other debris have been scraped up by the glacier and deposited at its sides. Where two glaciers flow together, the moraines merge to form a medial moraine. Glaciers that flow at a steady speed tend to have moraines that are relatively straight. But what causes the dizzying pattern of curves, zigzags, and loops of Malaspina’s moraines? Glaciers in this area of Alaska periodically “surge,”meaning they lurch forward quickly for one to several years. As a result of this irregular flow, the moraines at the edges and between glaciers can become folded, compressed, and sheared to form the characteristic loops seen on Malaspina. For instance, a surge in 1986 displaced moraines on the east side of Malaspina by as much as 5 kilometers (3 miles). NASA Earth Observatory image by Jesse Allen, using Landsat data from the U.S. Geological Survey. Caption by Kathryn Hansen. Credit: <b><a href="http://www.earthobservatory.nasa.gov/" rel="nofollow"> NASA Earth Observatory</a></b> <b><a href="http://www.nasa.gov/audience/formedia/features/MP_Photo_Guidelines.html" rel="nofollow">NASA image use policy.</a></b> <b><a href="http://www.nasa.gov/centers/goddard/home/index.html" rel="nofollow">NASA Goddard Space Flight Center</a></b> enables NASA’s mission through four scientific endeavors: Earth Science, Heliophysics, Solar System Exploration, and Astrophysics. Goddard plays a leading role in NASA’s accomplishments by contributing compelling scientific knowledge to advance the Agency’s mission. <b>Follow us on <a href="http://twitter.com/NASAGoddardPix" rel="nofollow">Twitter</a></b> <b>Like us on <a href="http://www.facebook.com/pages/Greenbelt-MD/NASA-Goddard/395013845897?ref=tsd" rel="nofollow">Facebook</a></b> <b>Find us on <a href="http://instagrid.me/nasagoddard/?vm=grid" rel="nofollow">Instagram</a></b>
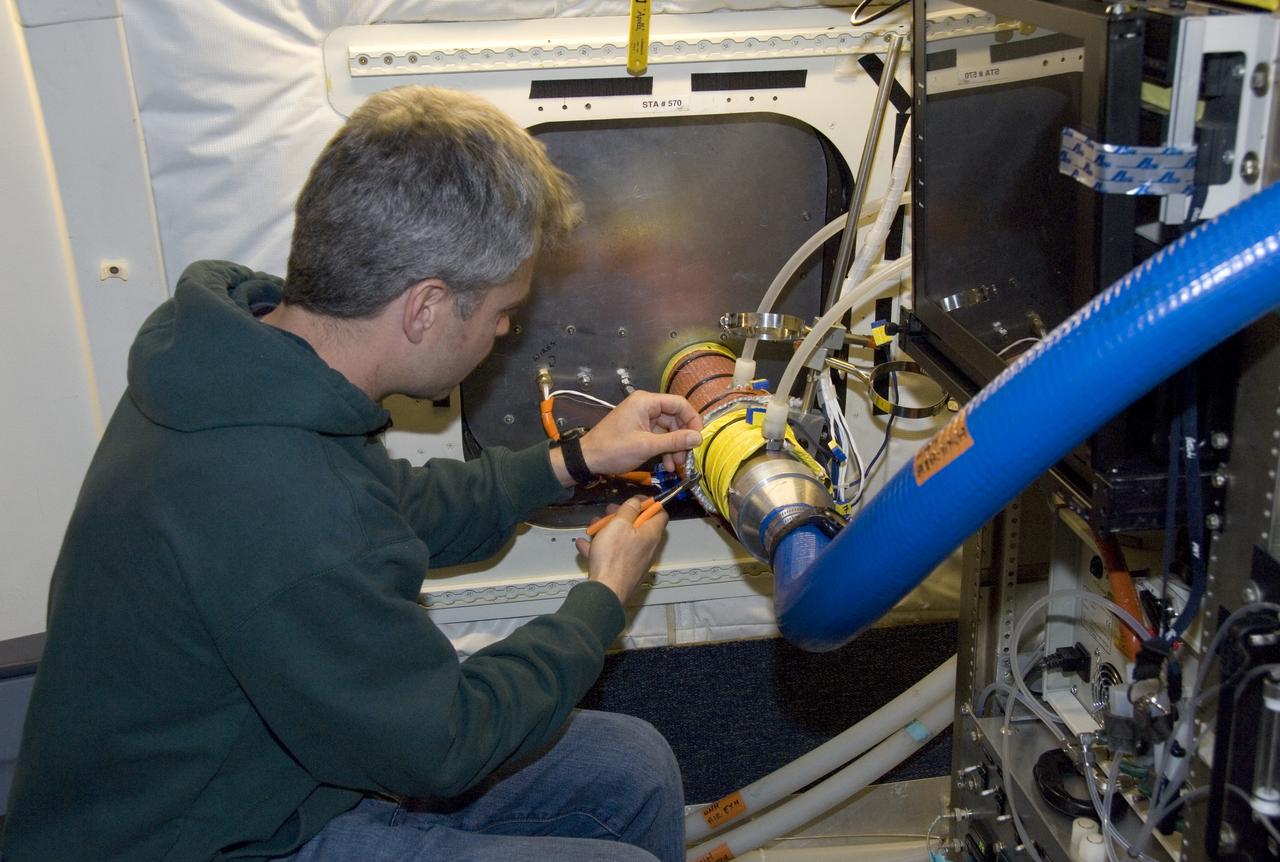
Climate researchers from the National Center for Atmospheric Research (NCAR) and several universities install and perform functional checkouts of a variety of sensitive atmospheric instruments on NASA's DC-8 airborne laboratory prior to beginning the ARCTAS mission.