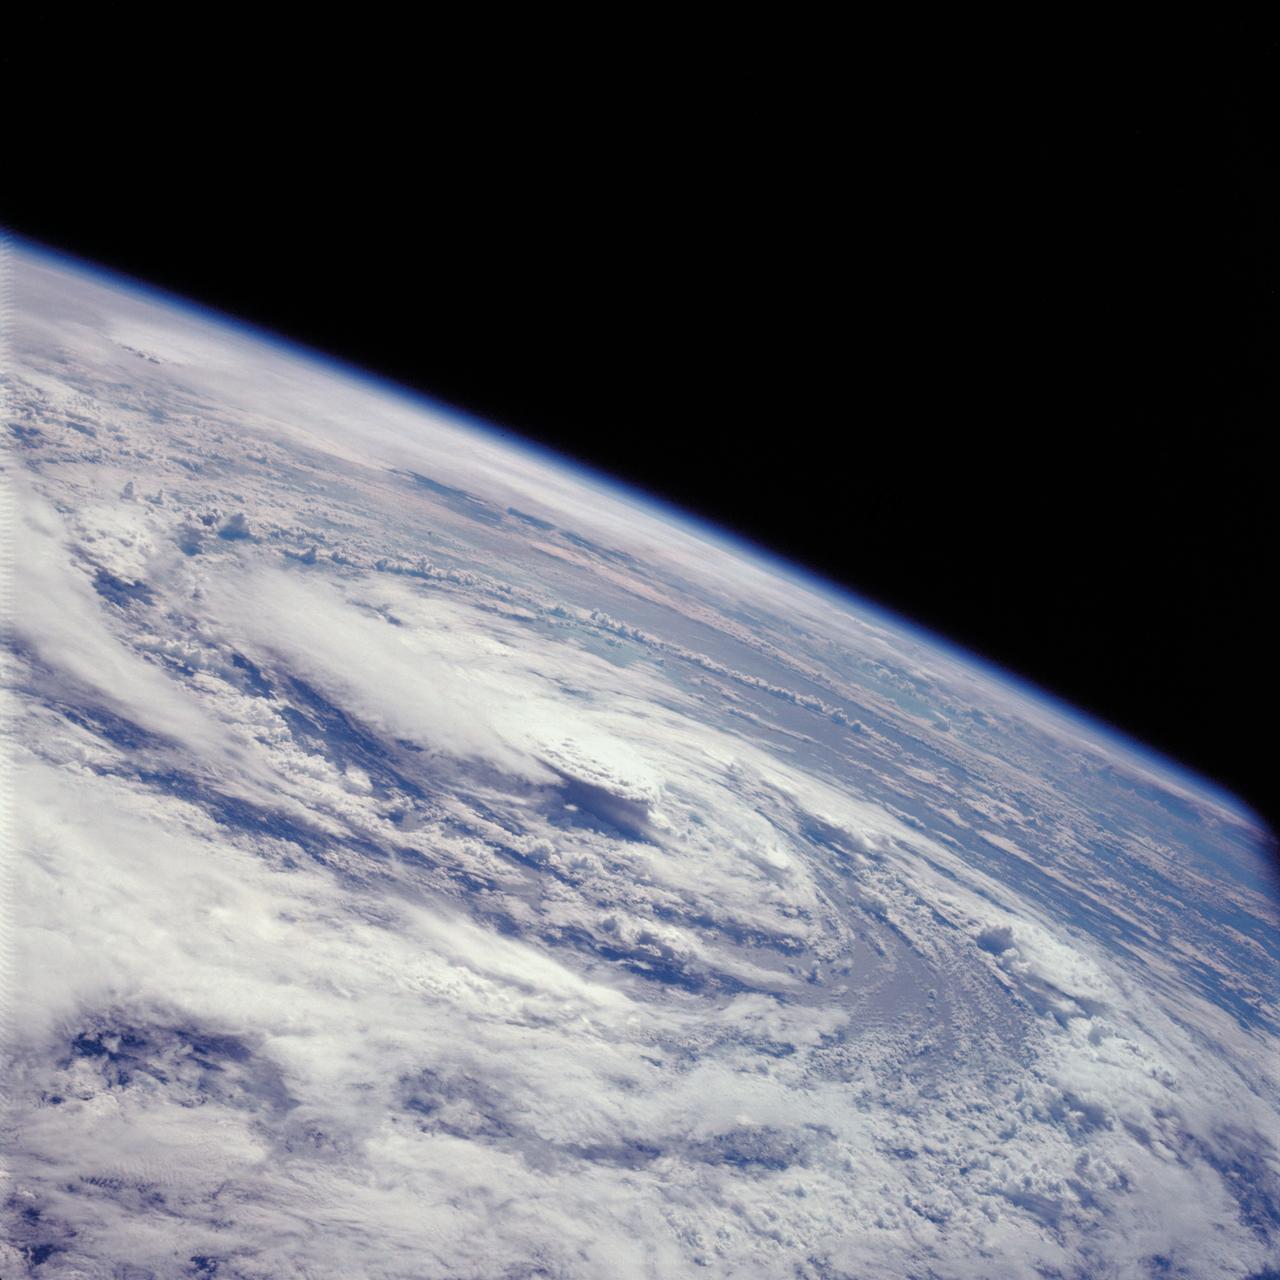
AS07-07-1877 (17 Oct. 1968) --- Hurricane Gladys, Gulf of Mexico, as seen from the Apollo 7 spacecraft during its 91st revolution of the earth. Photographed from an altitude of 99 nautical miles, at ground elapsed time of 144 hours and 27 minutes.
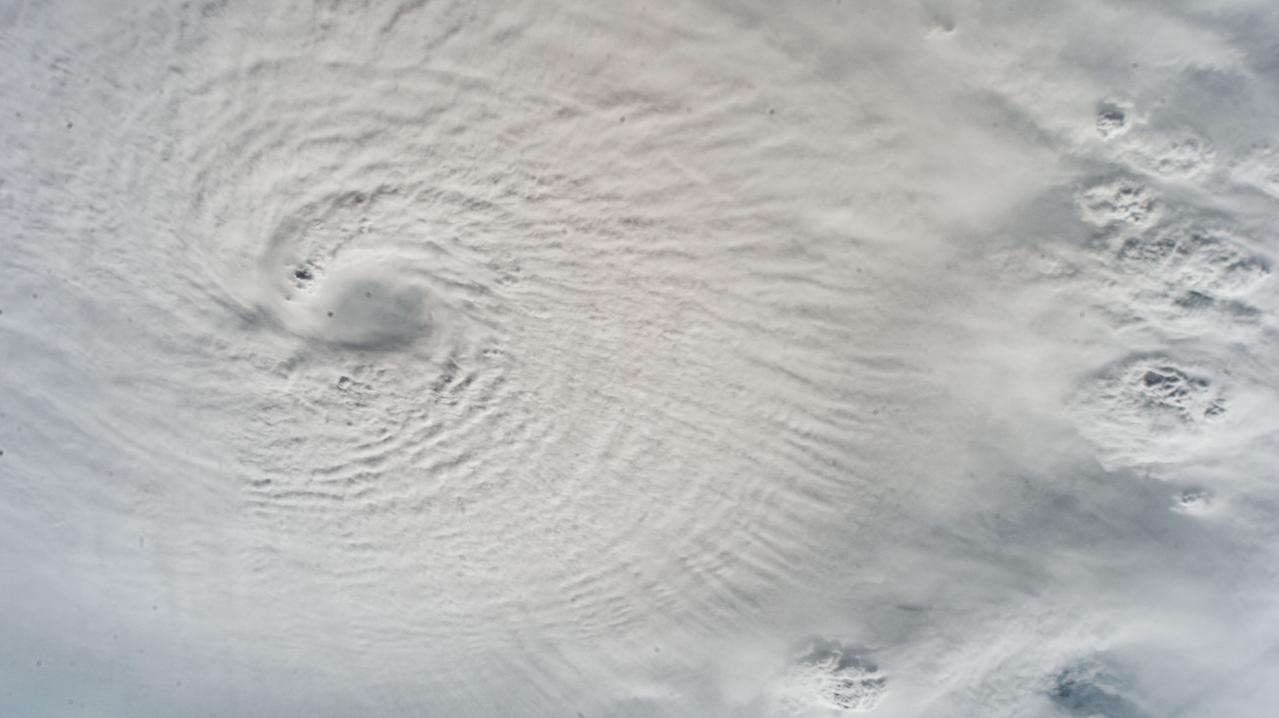
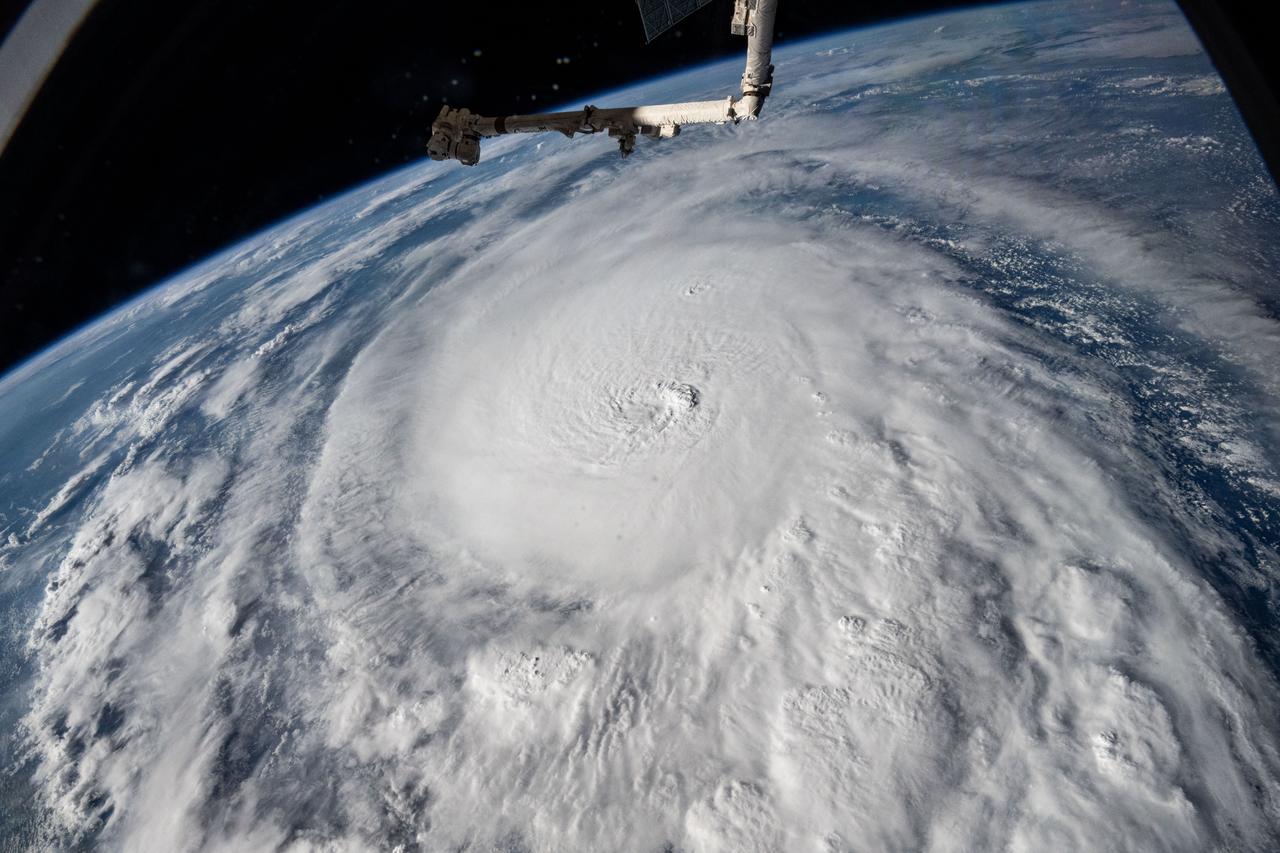
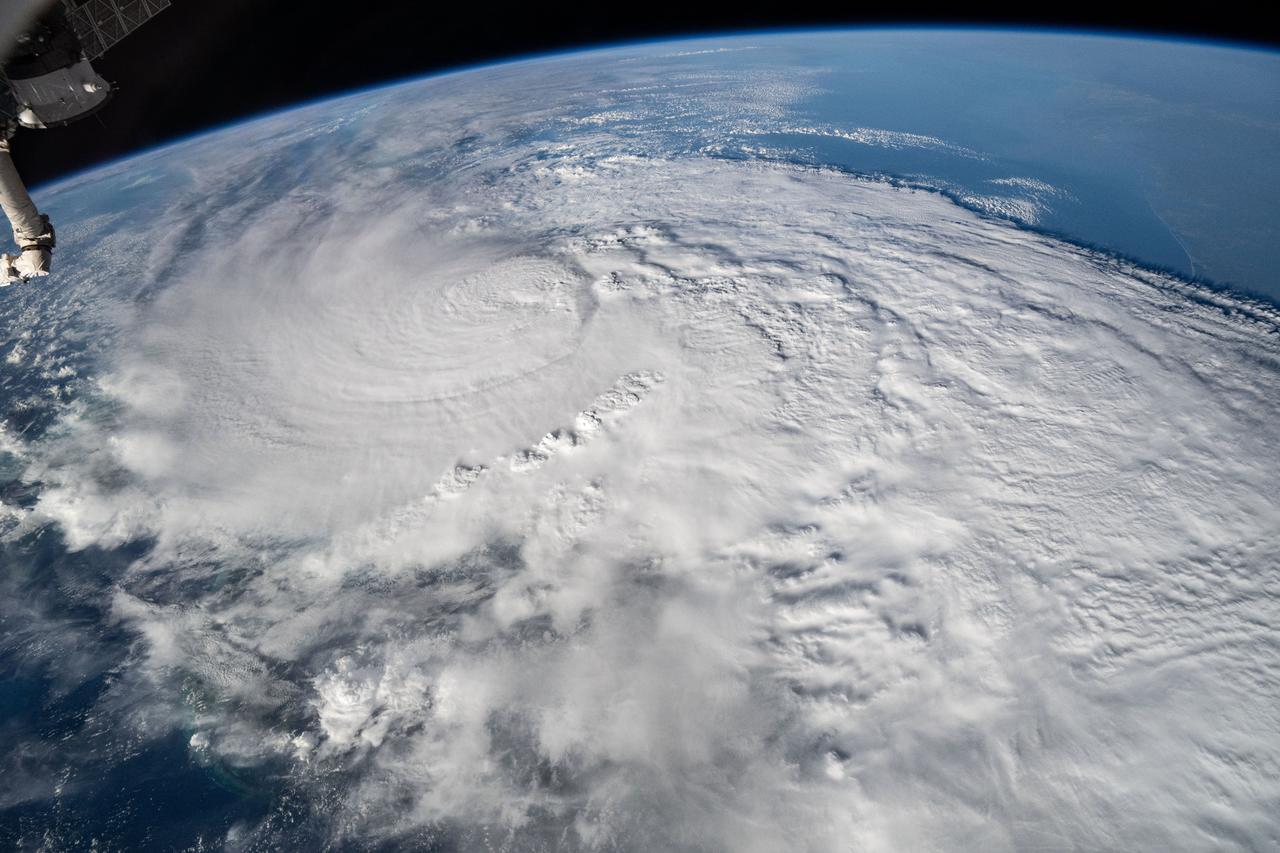
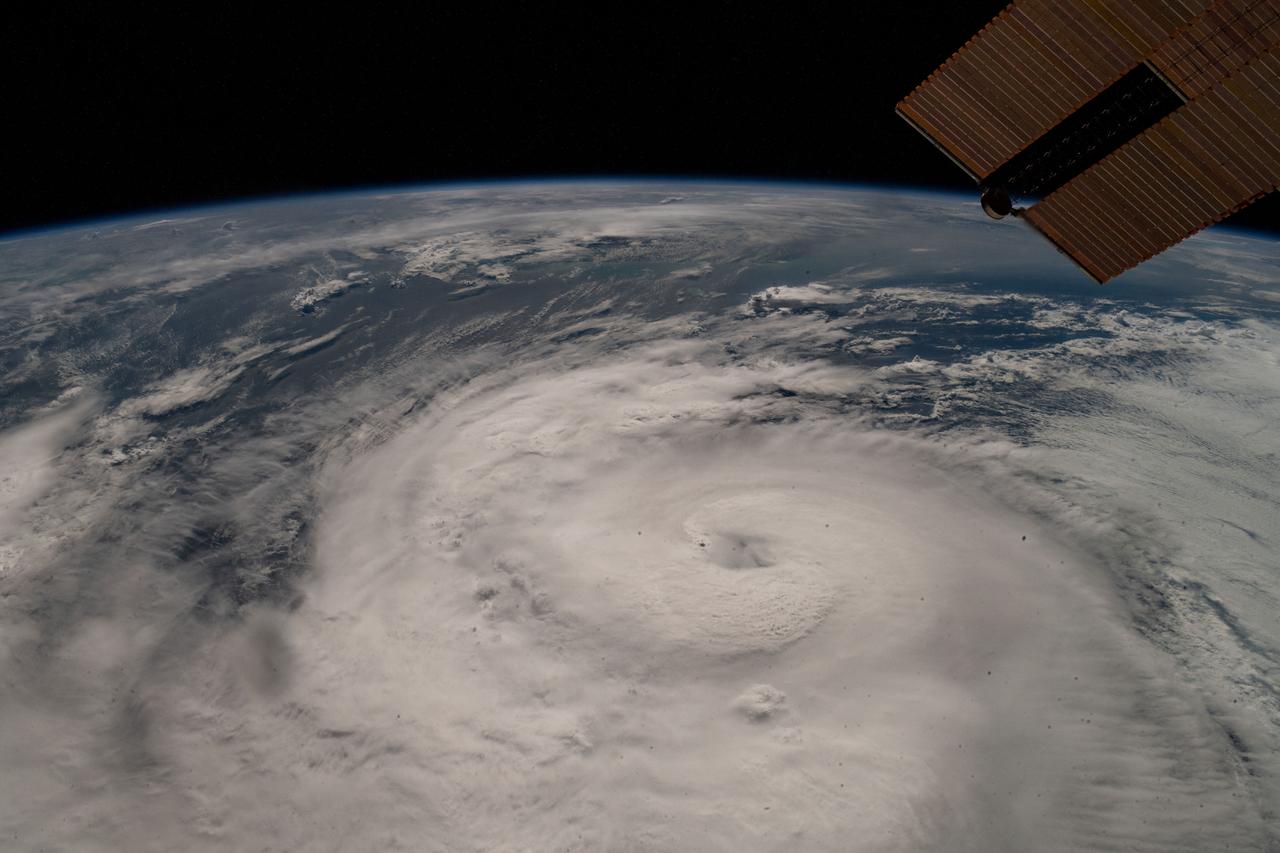
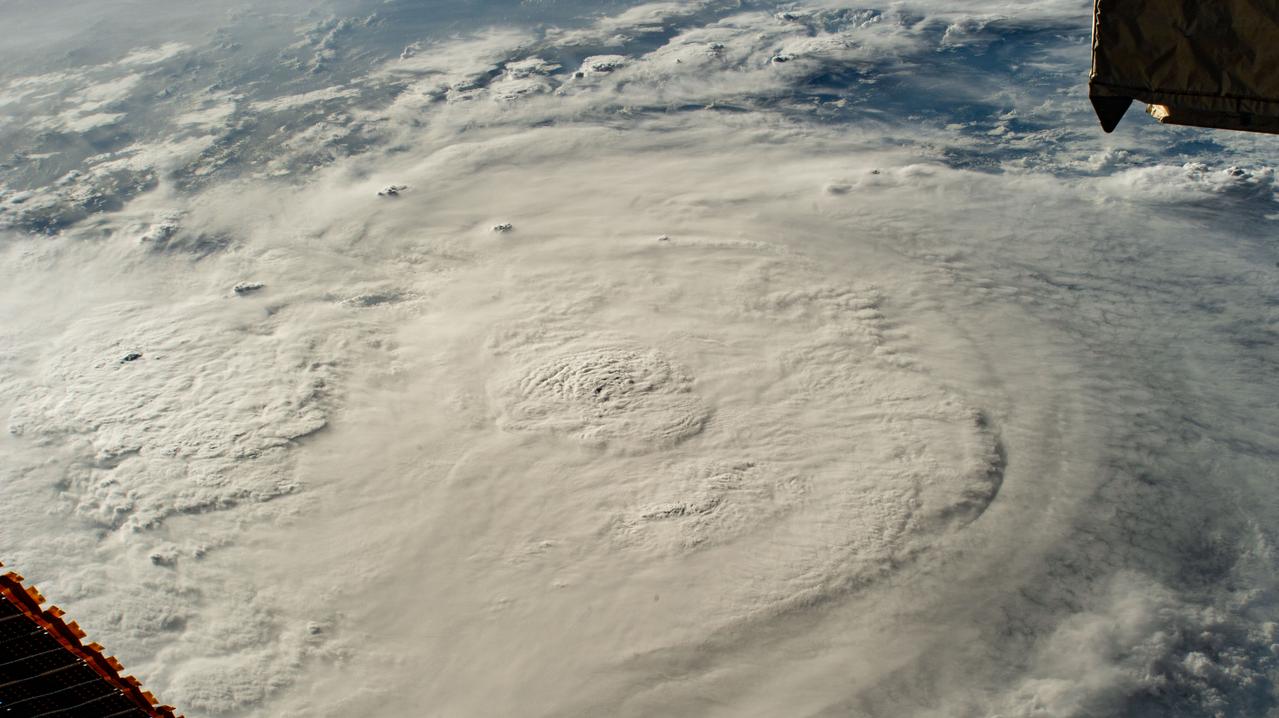
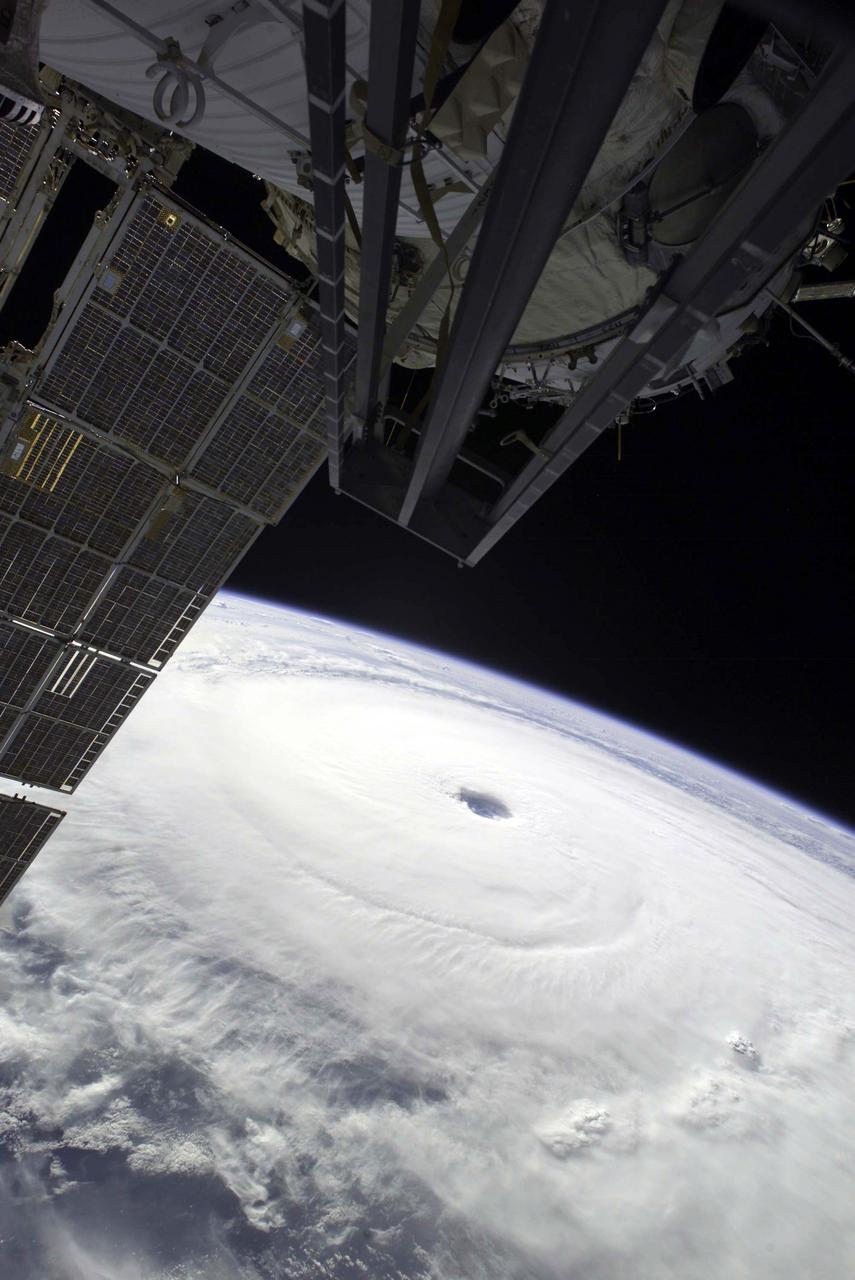
iss072e029017 (Oct. 7, 2024) --- While orbiting 257 miles above the Gulf of Mexico, an external camera on the International Space Station captured this image of Hurricane Milton, a Category 5 storm packing winds of 175 miles an hour at the time of this photograph, and its well-defined eye.
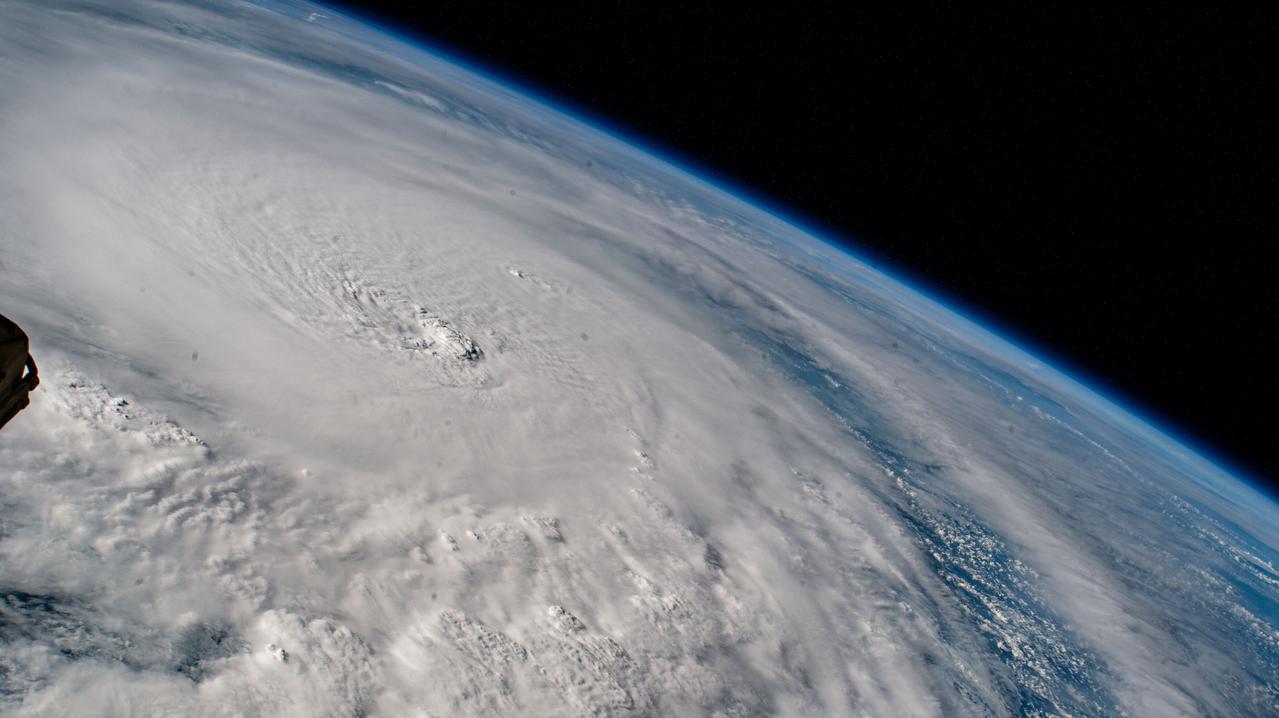
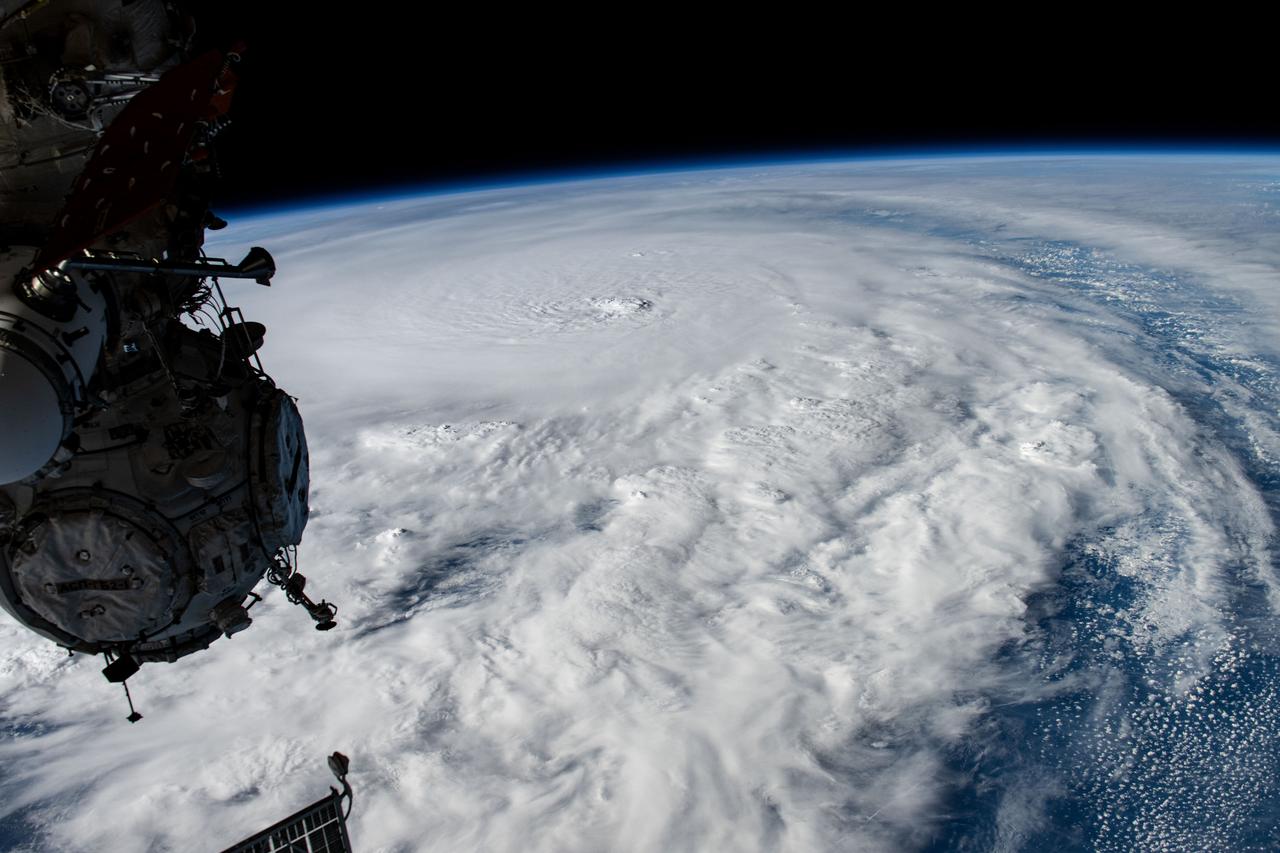
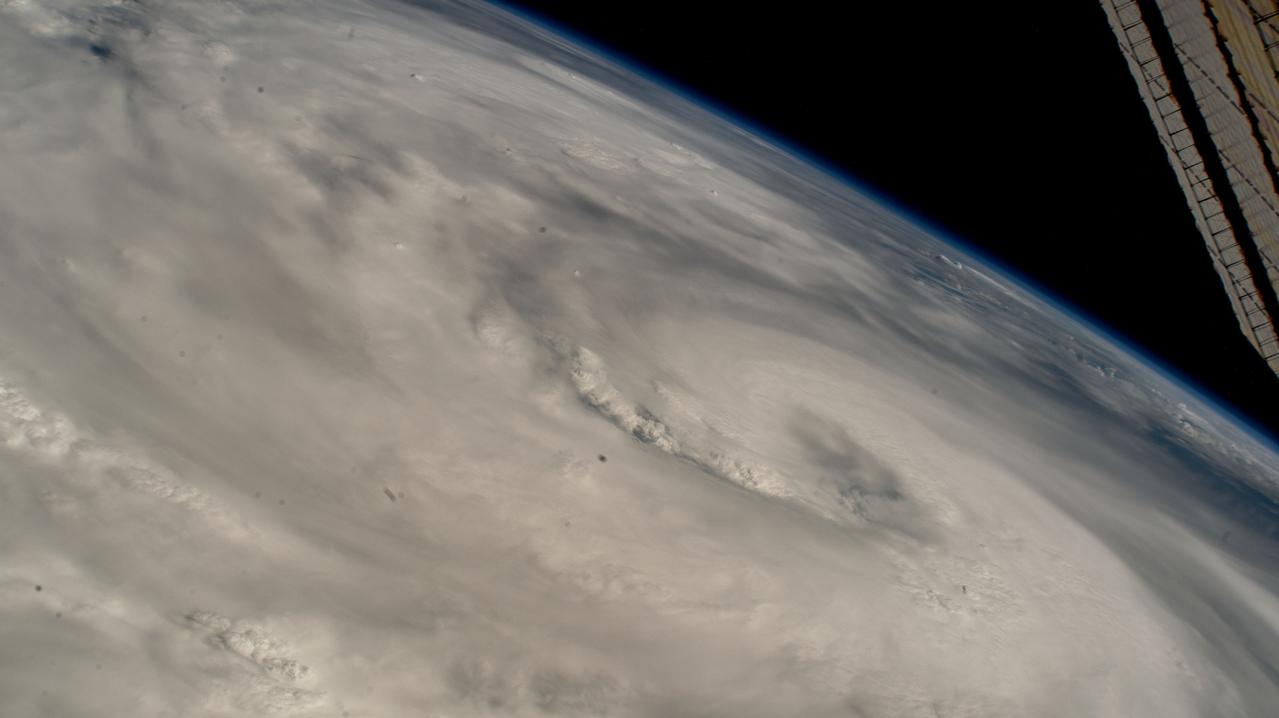
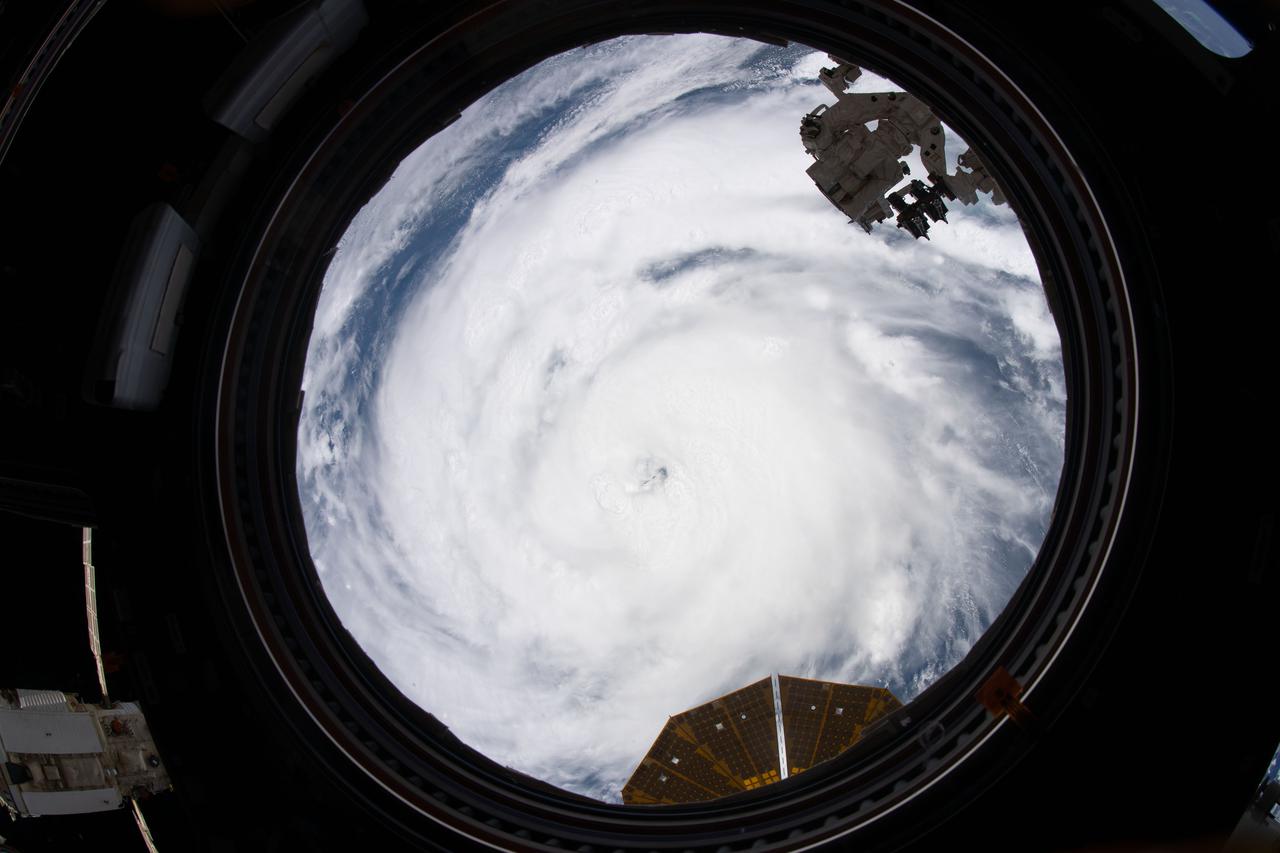
iss072e029488 (Oct. 8, 2024) --- Hurricane Milton, a Category 4 storm at the time of this photograph, is pictured in the Gulf of Mexico off the coast of Yucatan Peninsula from the International Space Station as it orbited 257 miles above.
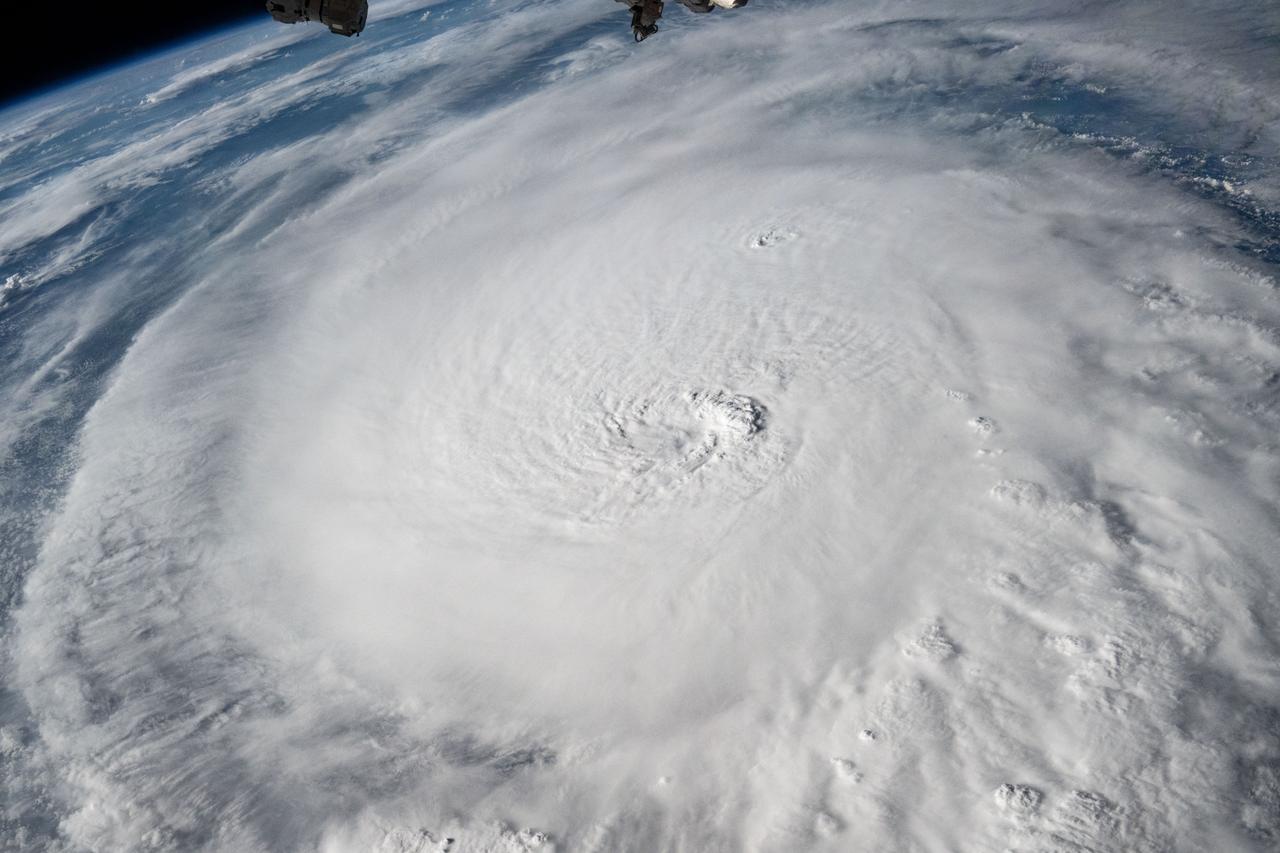
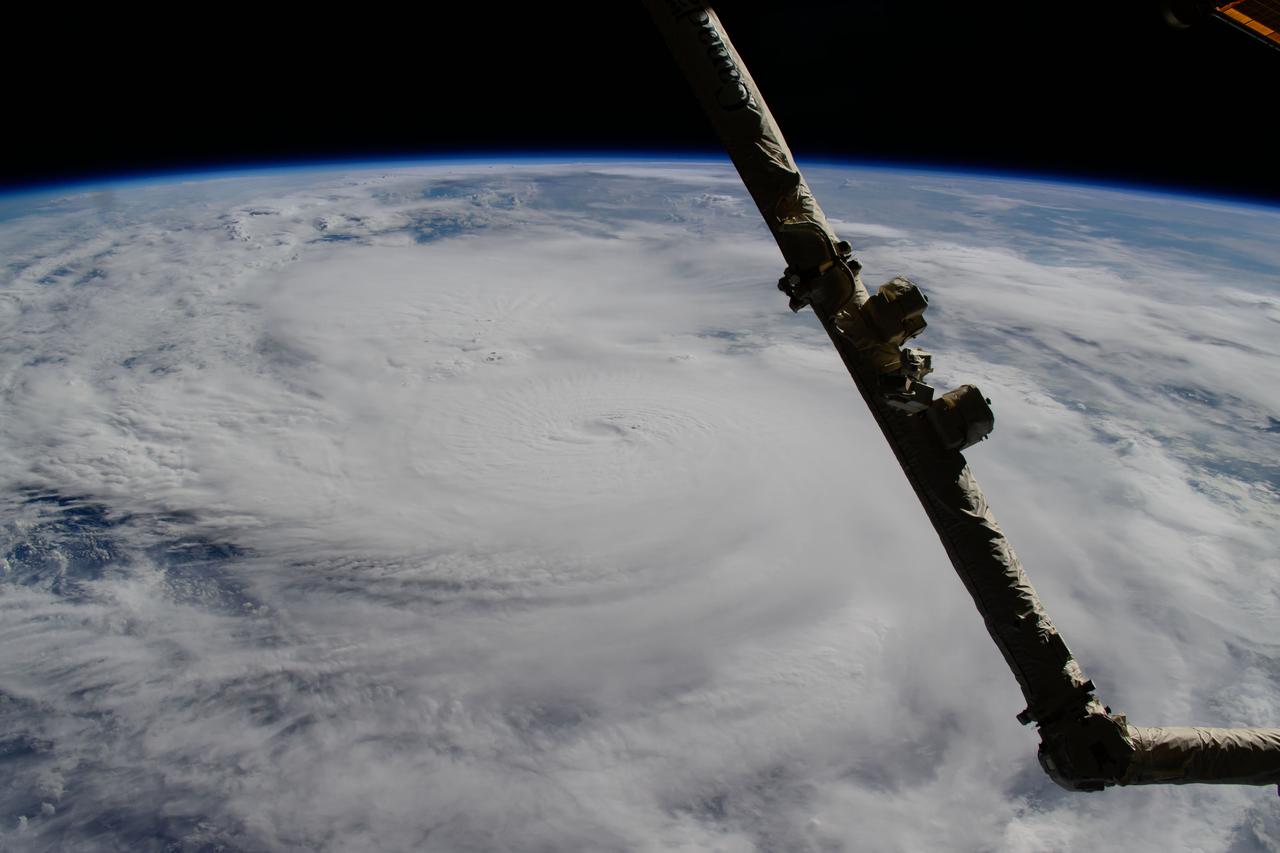
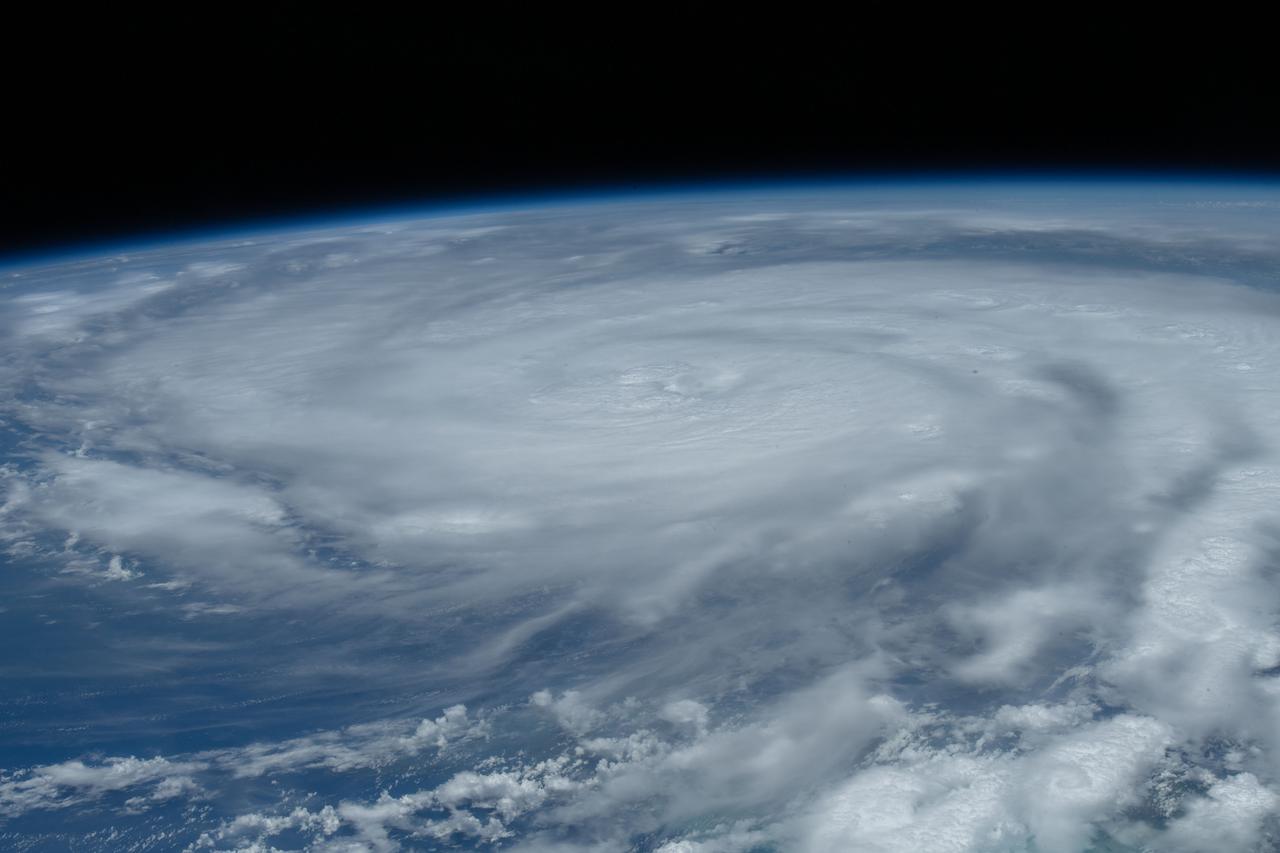
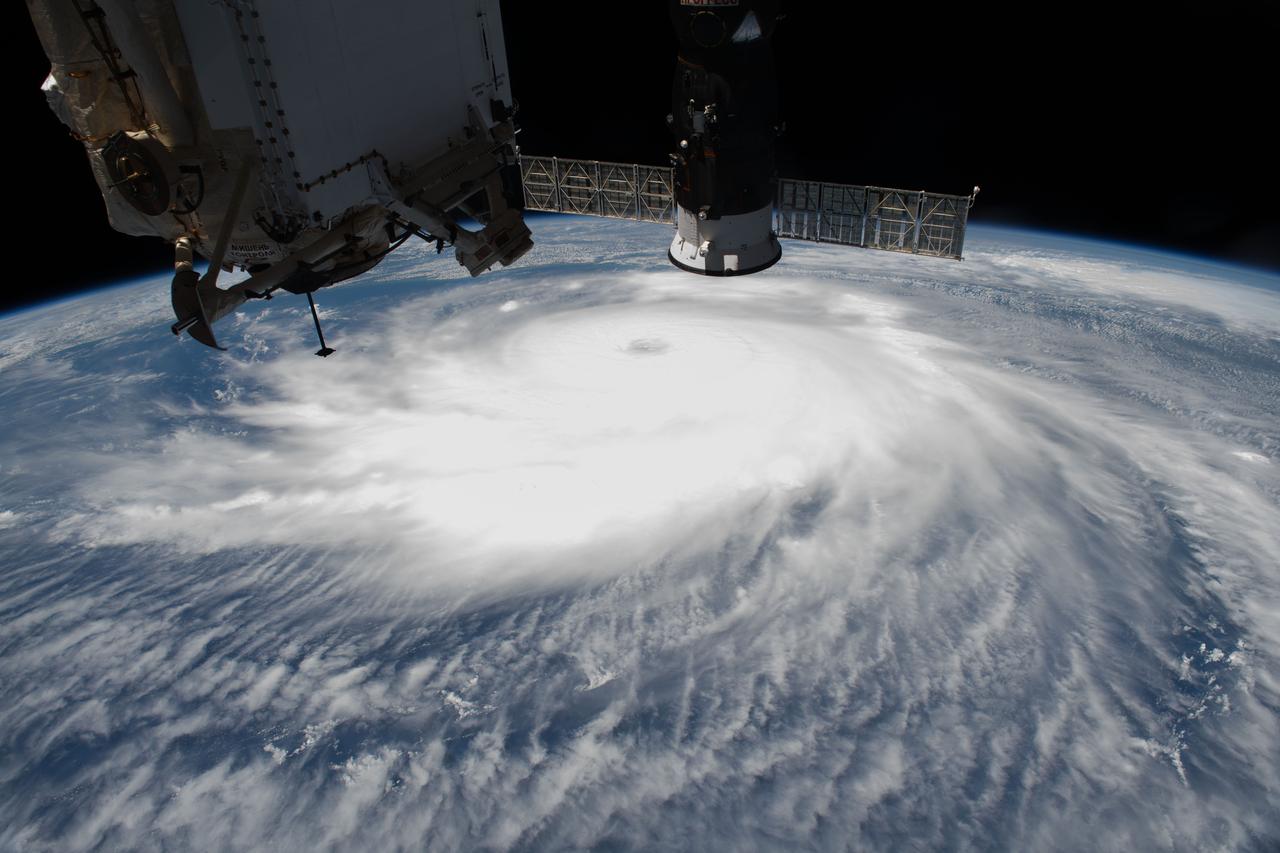
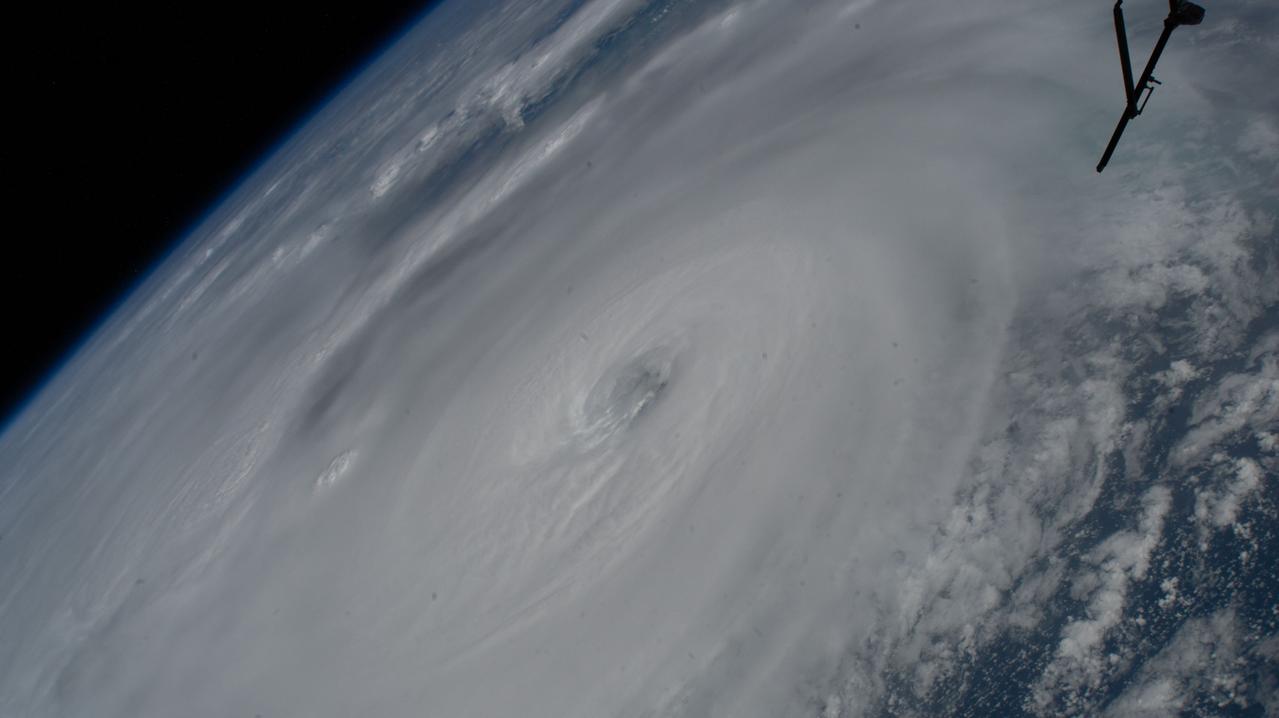
iss072e029135 (Oct. 8, 2024) --- Hurricane Milton, a Category 5 storm at the time of this photograph, is pictured in the Gulf of Mexico off the coast of Yucatan Peninsula from the International Space Station as it orbited 257 miles above.
iss072e029127 (Oct. 8, 2024) --- Hurricane Milton, a Category 5 storm at the time of this photograph, is pictured in the Gulf of Mexico off the coast of Yucatan Peninsula from the International Space Station as it orbited 257 miles above.
iss072e029445 (Oct. 8, 2024) --- Hurricane Milton, a Category 5 storm at the time of this photograph, is pictured in the Gulf of Mexico off the coast of Yucatan Peninsula from the International Space Station as it orbited 257 miles above.
iss072e014652 (Oct. 7, 2024) --- Hurricane Milton, a Category 4 storm at the time of this photograph, is pictured in the Gulf of Mexico off the coast of Yucatan Peninsula from the International Space Station as it orbited 257 miles above.

iss072e029295 (Oct. 8, 2024) --- Hurricane Milton, a Category 5 storm at the time of this photograph, is pictured in the Gulf of Mexico off the coast of Yucatan Peninsula from the International Space Station as it orbited 257 miles above.

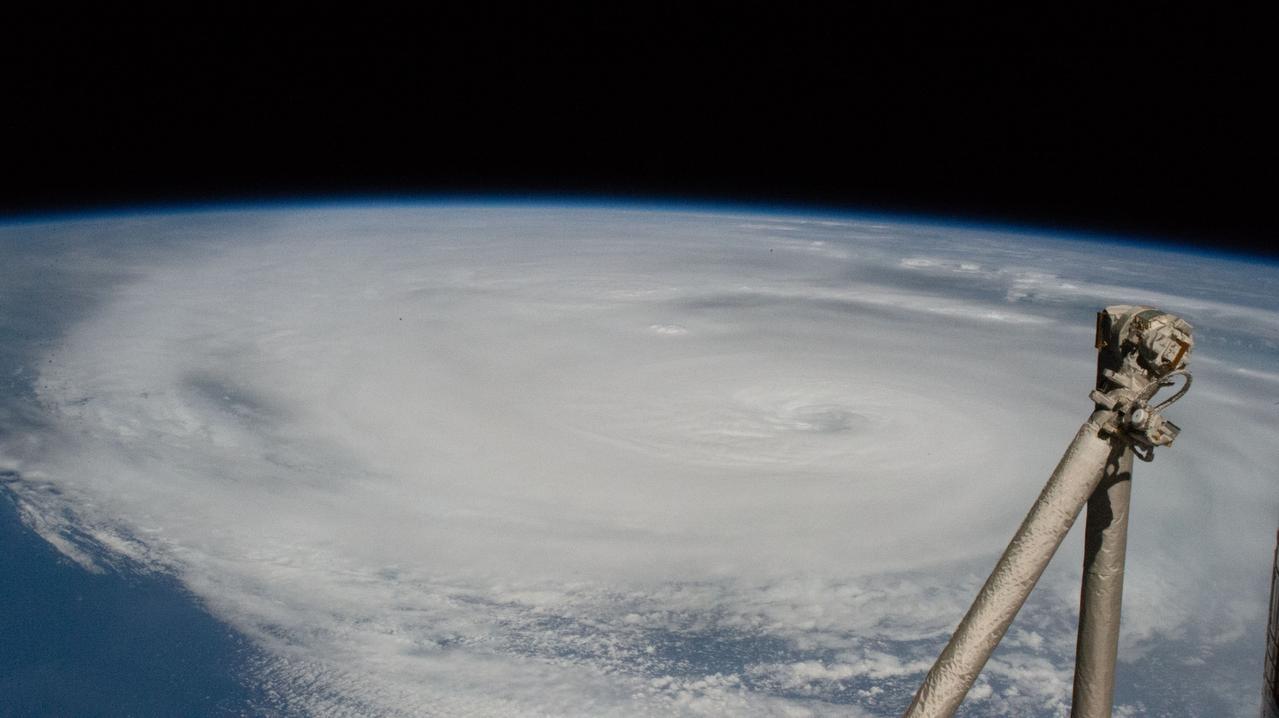
iss072e029487 (Oct. 8, 2024) --- Hurricane Milton, a Category 4 storm at the time of this photograph, is pictured in the Gulf of Mexico off the coast of Yucatan Peninsula from the International Space Station as it orbited 257 miles above.
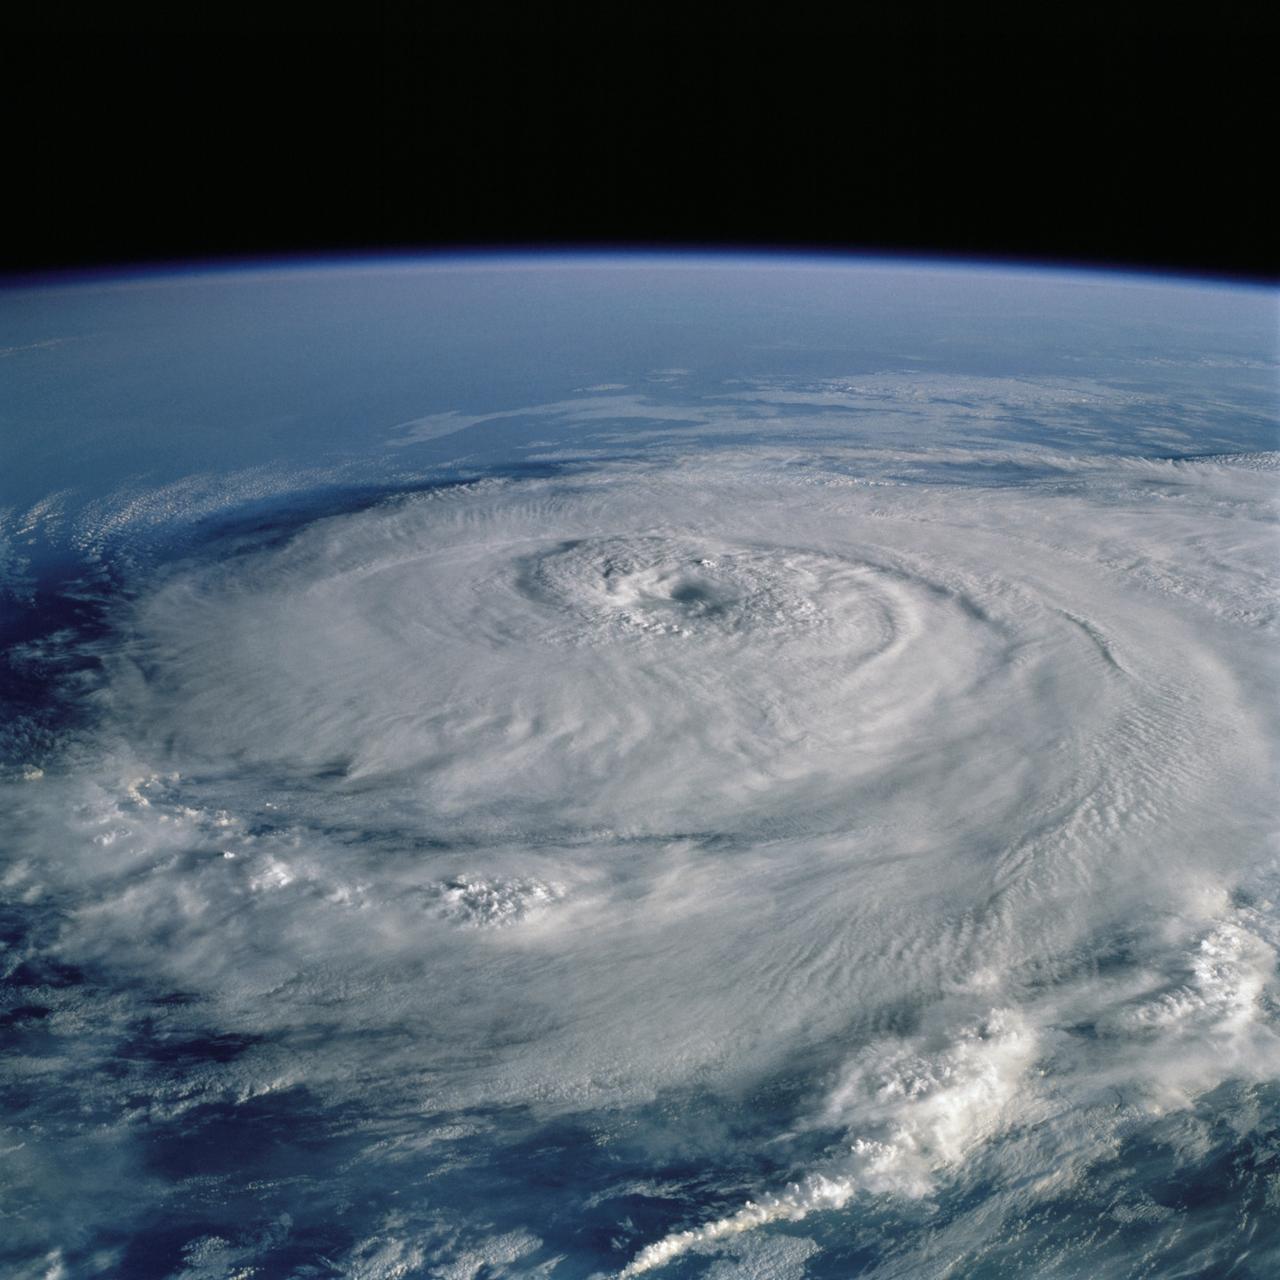
51I-44-052 (2 Sept. 1985) --- An oblique view of Hurricane Elena, photographed with a 70mm camera by STS-51I crew members of the space shuttle Discovery on Sept. 2, 1985. Photo credit: NASA
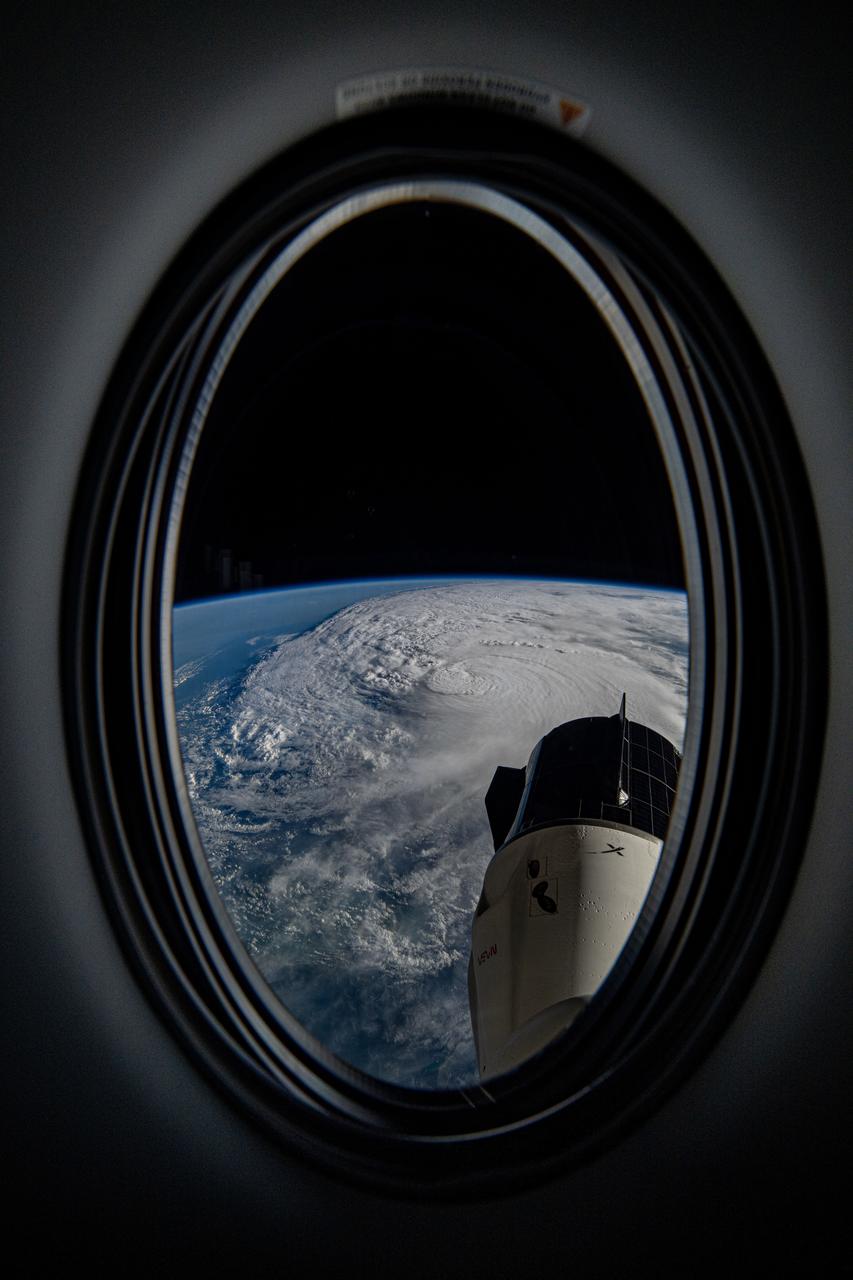
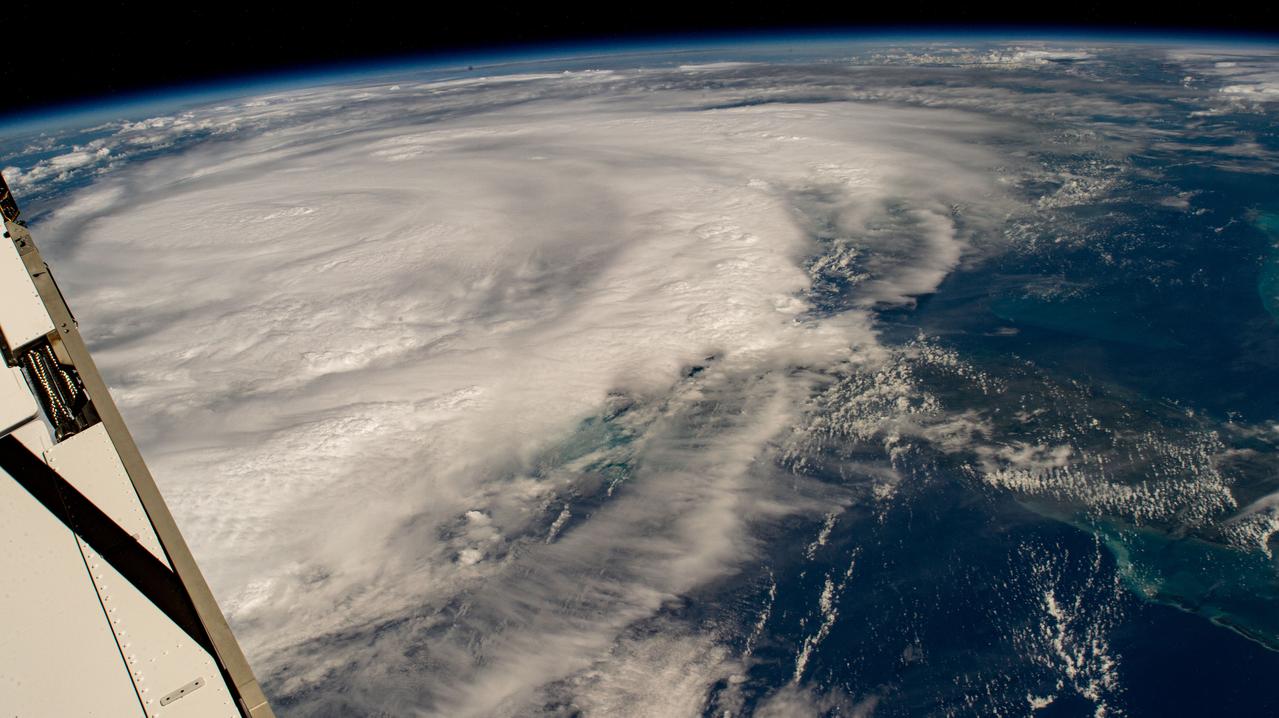
iss072e057797_alt (Oct. 9, 2024) --- Hurricane Milton is pictured as a category 4 storm in the Gulf of Mexico nearing the coast of Florida in this photograph from the International Space Station as it orbited 256 miles above. The SpaceX Dragon Freedom spacecraft is also pictured from a window on the Dragon Endeavour spacecraft. Credit: NASA/Matthew Dominick
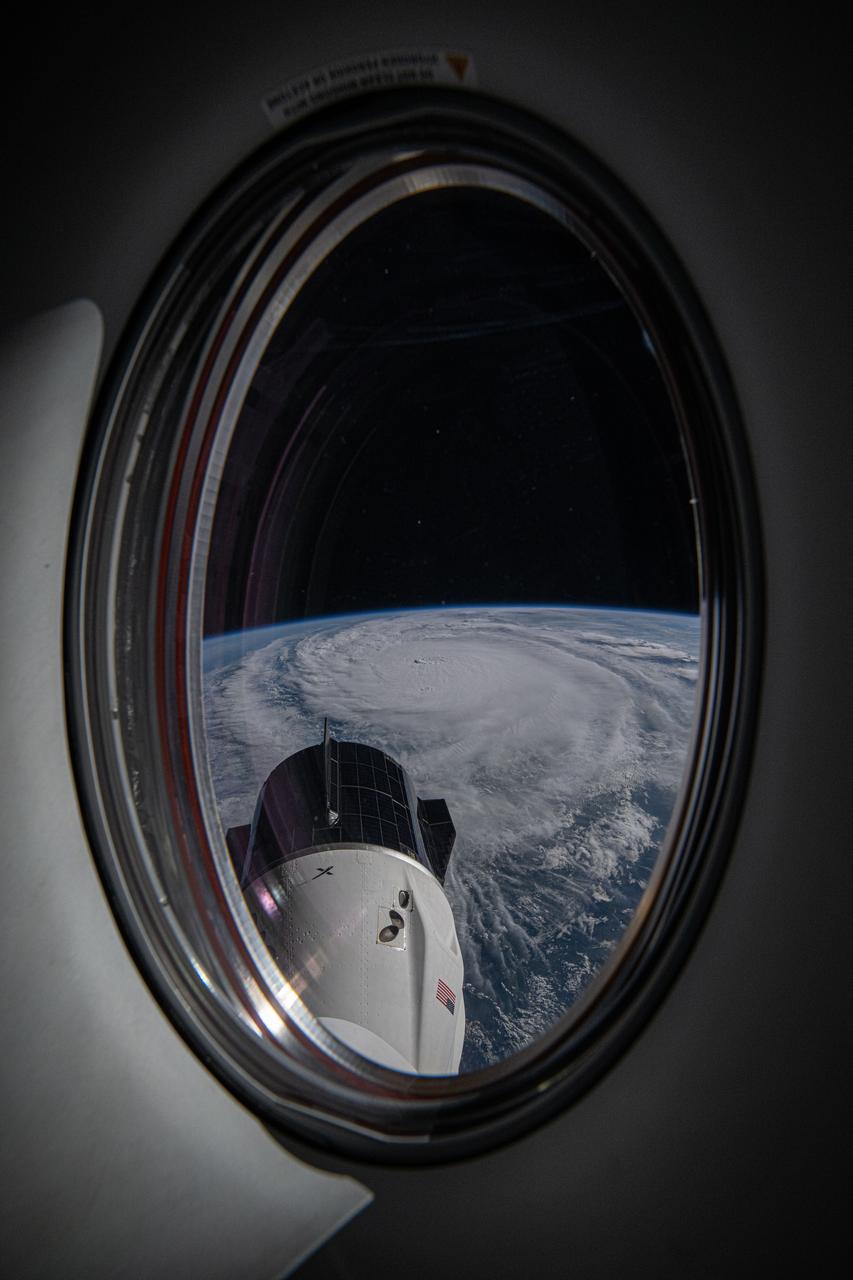
iss072e029590_alt (Oct. 8, 2024) --- Hurricane Milton is pictured as a category 4 storm in the Gulf of Mexico nearing the coast of Florida in this photograph from the International Space Station as it orbited 257 miles above. The SpaceX Dragon Freedom spacecraft is also pictured from a window on the Dragon Endeavour spacecraft. Credit: NASA/Matthew Dominick
iss072e031398 (Oct. 9, 2024) --- Hurricane Milton is pictured as a category 4 storm in the Gulf of Mexico nearing the coast of Florida in this photograph from the International Space Station as it orbited 258 miles above.

iss072e031284 (Oct. 7, 2024) --- Hurricane Milton is pictured as a category 4 storm in the Gulf of Mexico nearing the coast of Florida in this photograph from the International Space Station as it orbited 257 miles above. The SpaceX Dragon Freedom spacecraft is also pictured from a window on the Dragon Endeavour spacecraft.
Nearly the whole of the Gulf of Mexico was churning with the powerful winds and rains of Hurricane Katrina on August 28, 2005, when NASA QuikScat satellite captured this image.
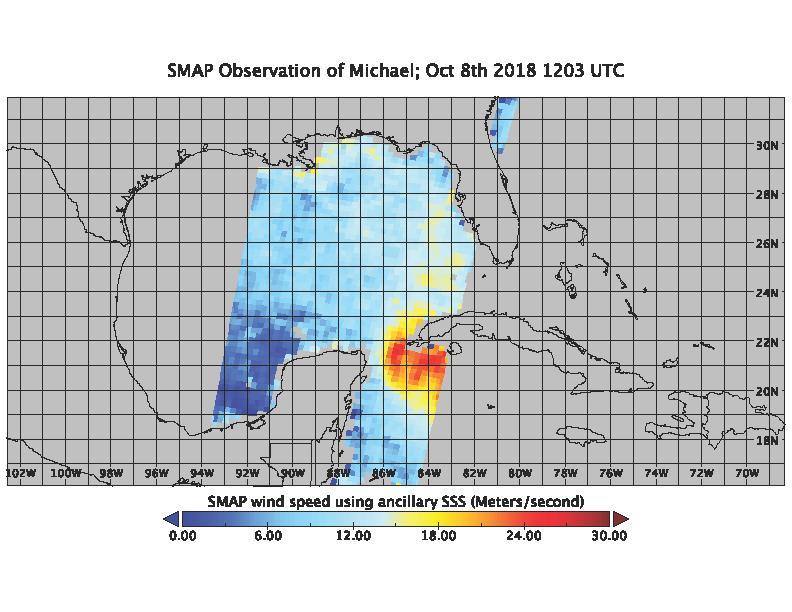
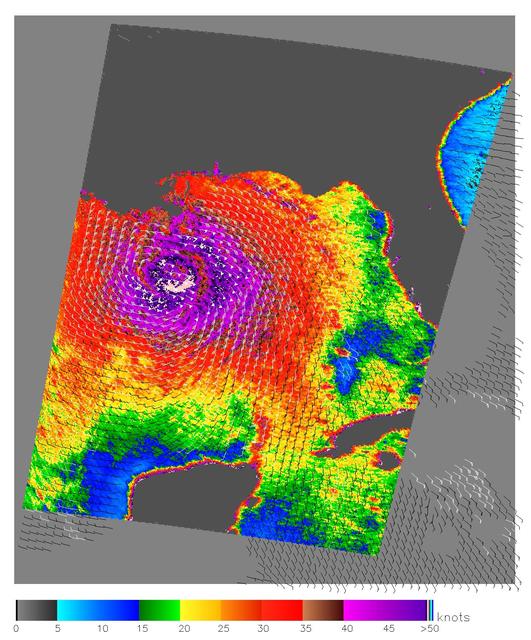
On the morning of Oct. 8, 2018, the NASA Soil Moisture Active Passive (SMAP) Radiometer got a snapshot of Hurricane Michael, which has intensified to a Category 2 hurricane over the warm waters of the Gulf of Mexico. The radiance acquired by the SMAP L-band Microwave Radiometer can see through clouds and rains, and is sensitive to the extreme ocean surface winds under a tropical storm or hurricane. Areas in red represent higher wind speeds; areas in blue have lower wind speeds. https://photojournal.jpl.nasa.gov/catalog/PIA22747
This anaglyph from the MISR instrument aboard NASA Terra spacecraft shows the strong convective development of Hurricane Katrina as it moved west through the Gulf of Mexico. 3D glasses are necessary to view this image.
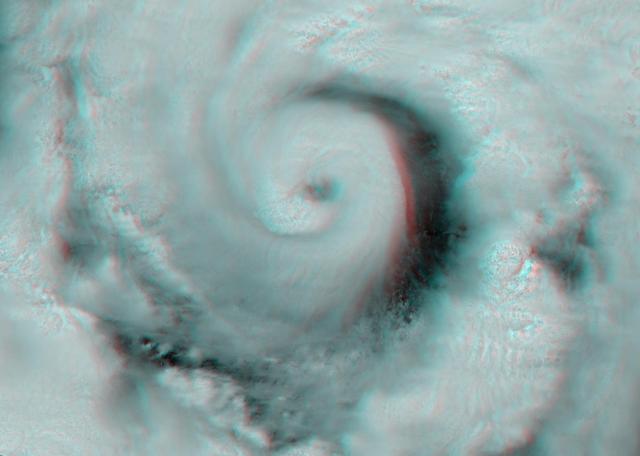
This view of Hurricane Alex in the western Gulf of Mexico was acquired by the Multi-angle Imaging SpectroRadiometer instrument aboard NASA Terra satellite just after noon Central Daylight Time on June 30, 2010. 3D glasses are necessary.

Tropical Cyclone Heat Potential TCHP field in the Gulf of Mexico during September 22, 2005. The path of Hurricane Rita is indicated with circles spaced every 3 hours with their size and color representing intensity see legend.
iss069e084548 (Aug. 29, 2023) --- Hurricane Idalia is pictured in the Gulf of Mexico as the International Space Station orbited 261 miles above.
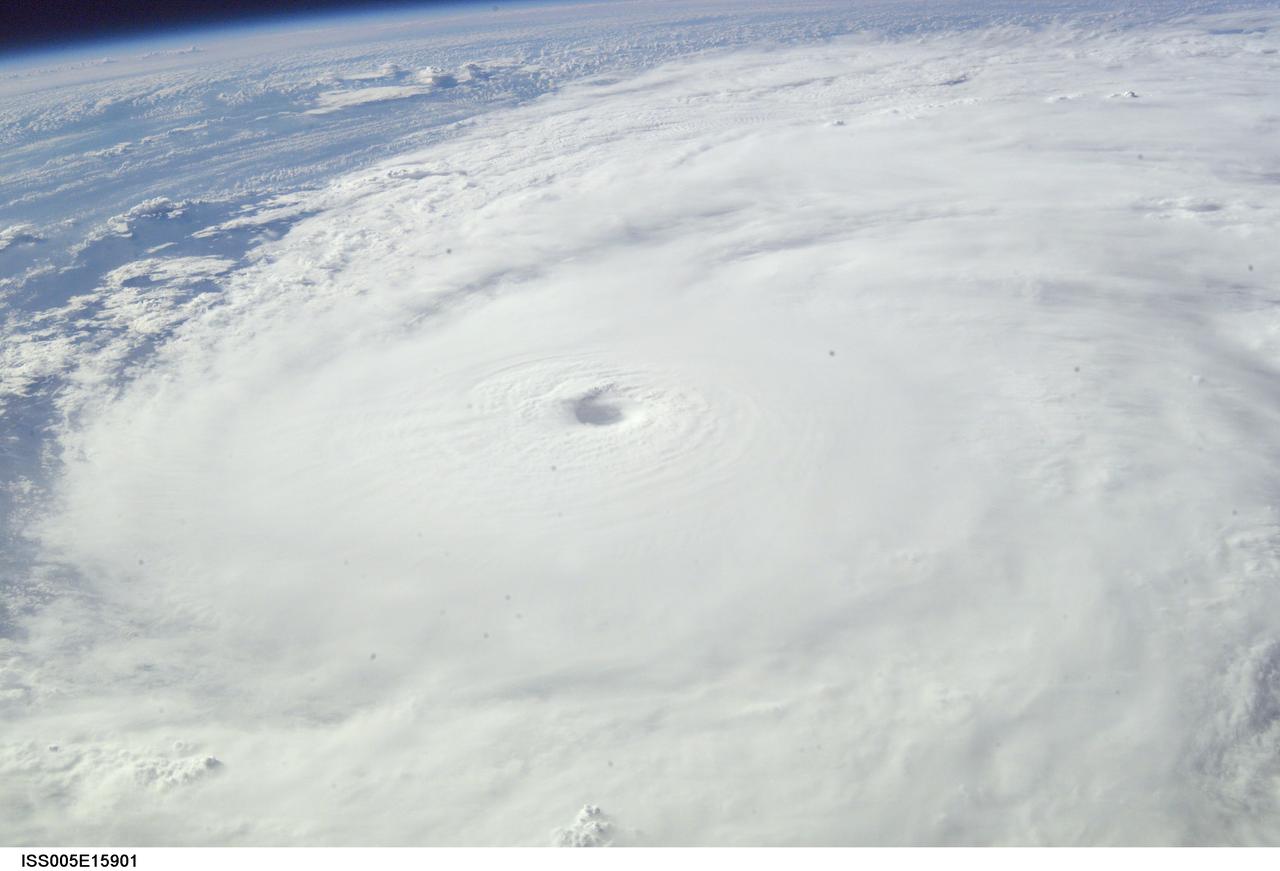
ISS005-E-15901 (2 Oct 2002) --- Hurricane Lili over the Gulf of Mexico.
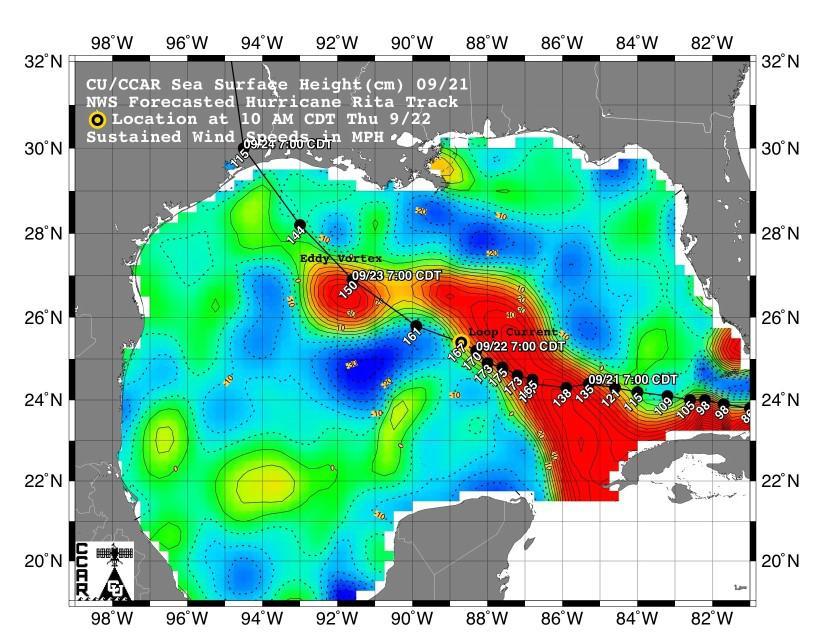
This sea surface height map of the Gulf of Mexico, with the Florida peninsula on the right and the Texas-Mexico Gulf Coast on the left, is based on altimeter data from four satellites including NASA’s Topex/Poseidon and Jason. Red indicates a strong circulation of much warmer waters, which can feed energy to a hurricane. This area stands 35 to 60 centimeters (about 13 to 23 inches) higher than the surrounding waters of the Gulf. The actual track of a hurricane is primarily dependent upon steering winds, which are forecasted through the use of atmospheric models. However, the interaction of the hurricane with the upper ocean is the primary source of energy for the storm. Hurricane intensity is therefore greatly affected by the upper ocean temperature structure and can exhibit explosive growth over warm ocean currents and eddies. Eddies are currents of water that run contrary to the direction of the main current. According to the forecasted track through the Gulf of Mexico, Hurricane Rita will continue crossing the warm waters of a Gulf of Mexico circulation feature called the Loop Current and then pass near a warm-water eddy called the Eddy Vortex, located in the north central Gulf, south of Louisiana. http://photojournal.jpl.nasa.gov/catalog/PIA06427
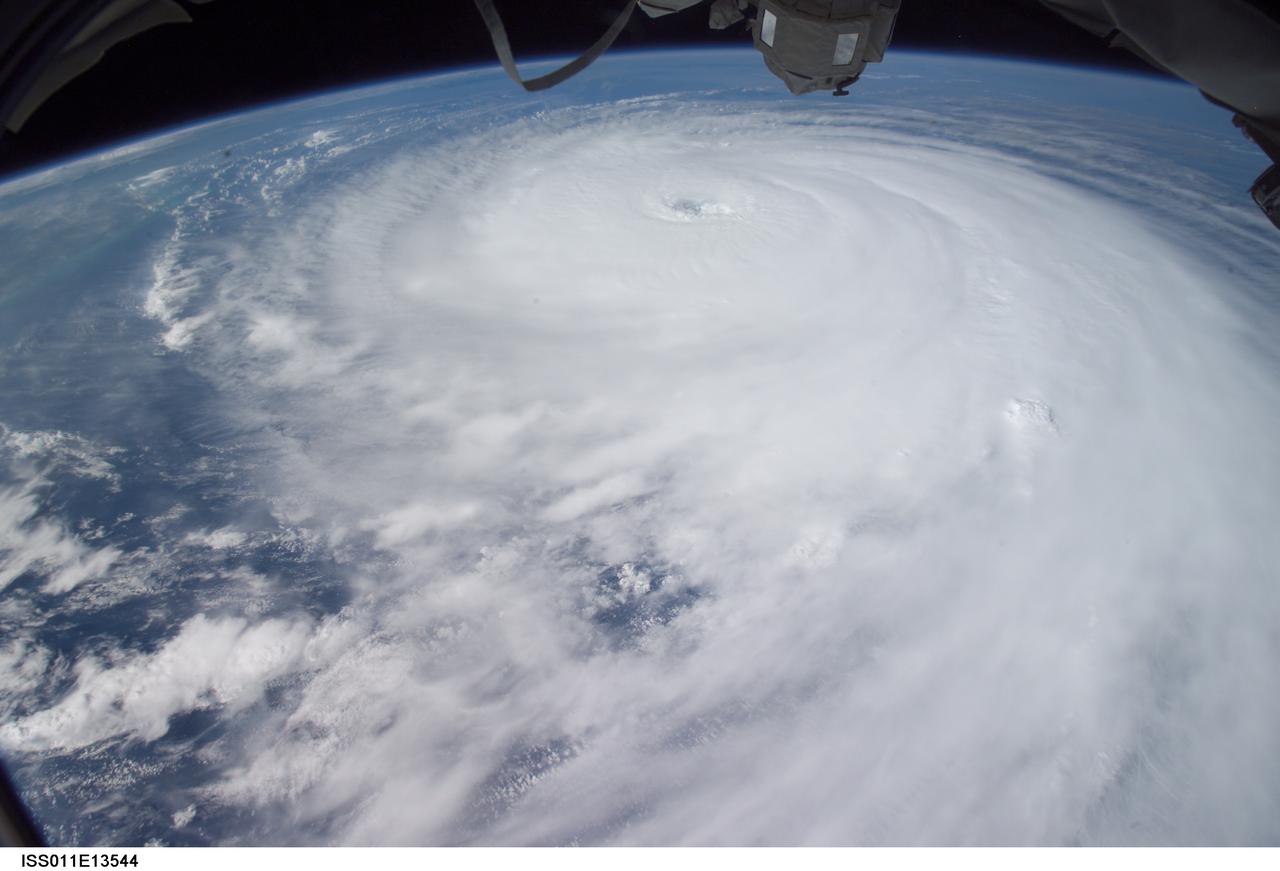
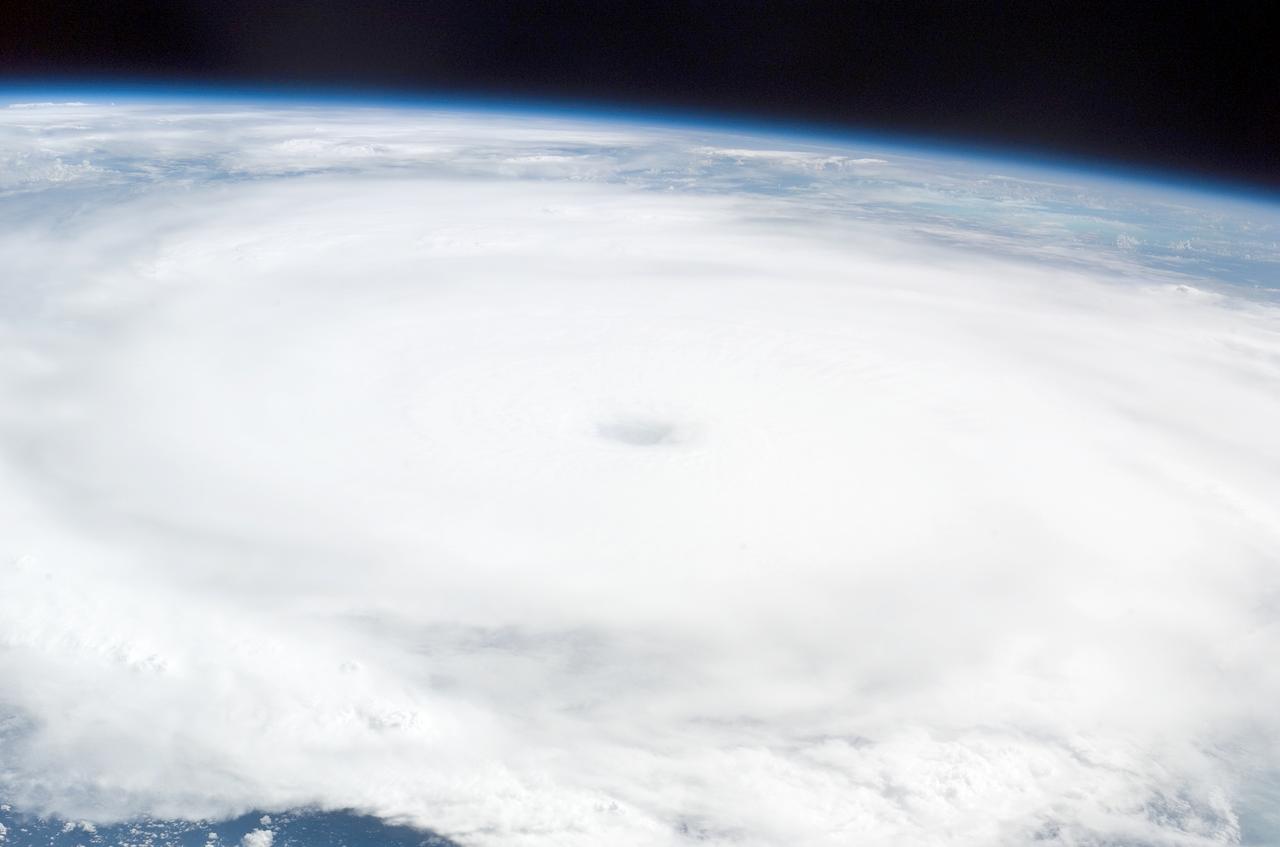
ISS011-E-13544 (23 Sept. 2005) --- Hurricane Rita, as it swirls in the Gulf of Mexico, is featured in this image photographed by an Expedition 11 crewmember on the International Space Station. The hurricane was heading toward the Texas coast.
iss072e001649 (Sept. 25, 2024) -- Hurricane Helene is pictured from the International Space Station as it orbited 257 above the Gulf of Mexico off the coast of Mississippi.
iss072e001650 (Sept. 25, 2024) -- Hurricane Helene is pictured from the International Space Station as it orbited 257 above the Gulf of Mexico off the coast of Mississippi.
iss064e002148 (Oct. 28, 2020) --- Hurricane Zeta was pictured from the International Space Station as the category two storm churned in the Gulf of Mexico nearing Louisiana.
iss065e319865 (Aug. 28, 2021) --- Hurricane Ida is pictured as a category 2 storm from the International Space Station as it orbited 263 miles above the Gulf of Mexico.
iss067e382116 (Sept. 28, 2022) --- Hurricane Ian is pictured approaching the west coast of Florida as a category 4 storm. The International Space Station was orbiting 259 miles above the Gulf of Mexico at the time of this photograph.
iss071e266894 (July 5, 2024) --- Hurricane Beryl is pictured as a Category 1 storm above the Yucatan Peninsula from the International Space Station as it orbited 262 miles above the Gulf of Mexico.
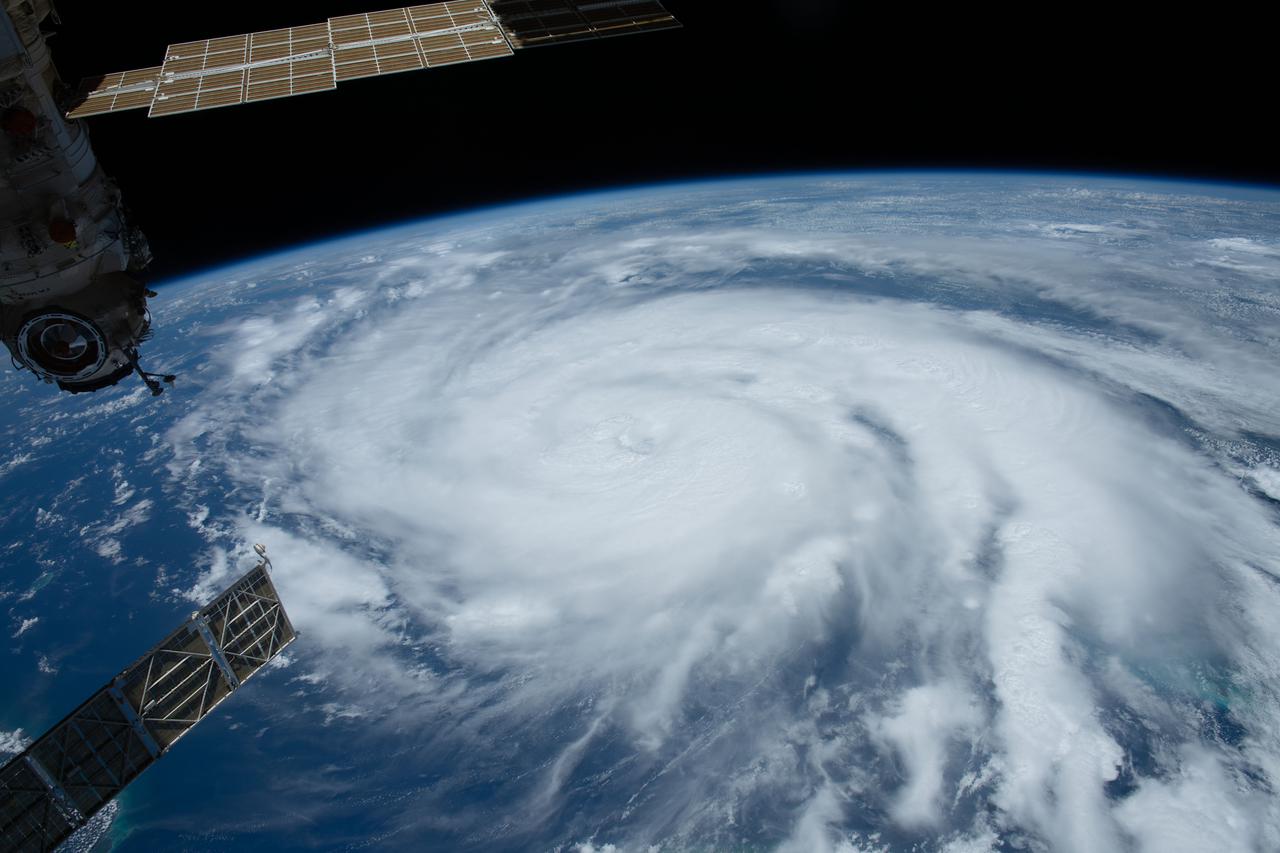
iss065e319500 (Aug. 28, 2021) --- Hurricane Ida is pictured as a category 2 storm in this near bird's-eye view from the International Space Station as it orbited 263 miles above the Gulf of Mexico.
iss063e078406 (Aug. 26, 2020) --- Hurricane Laura is pictured Wednesday afternoon off the coast of the Texas-Louisiana border as the International Space Station orbited above the Gulf of Mexico.
iss067e382118 (Sept. 28, 2022) --- Hurricane Ian is pictured approaching the west coast of Florida as a category 4 storm. The International Space Station was orbiting 259 miles above the Gulf of Mexico at the time of this photograph.
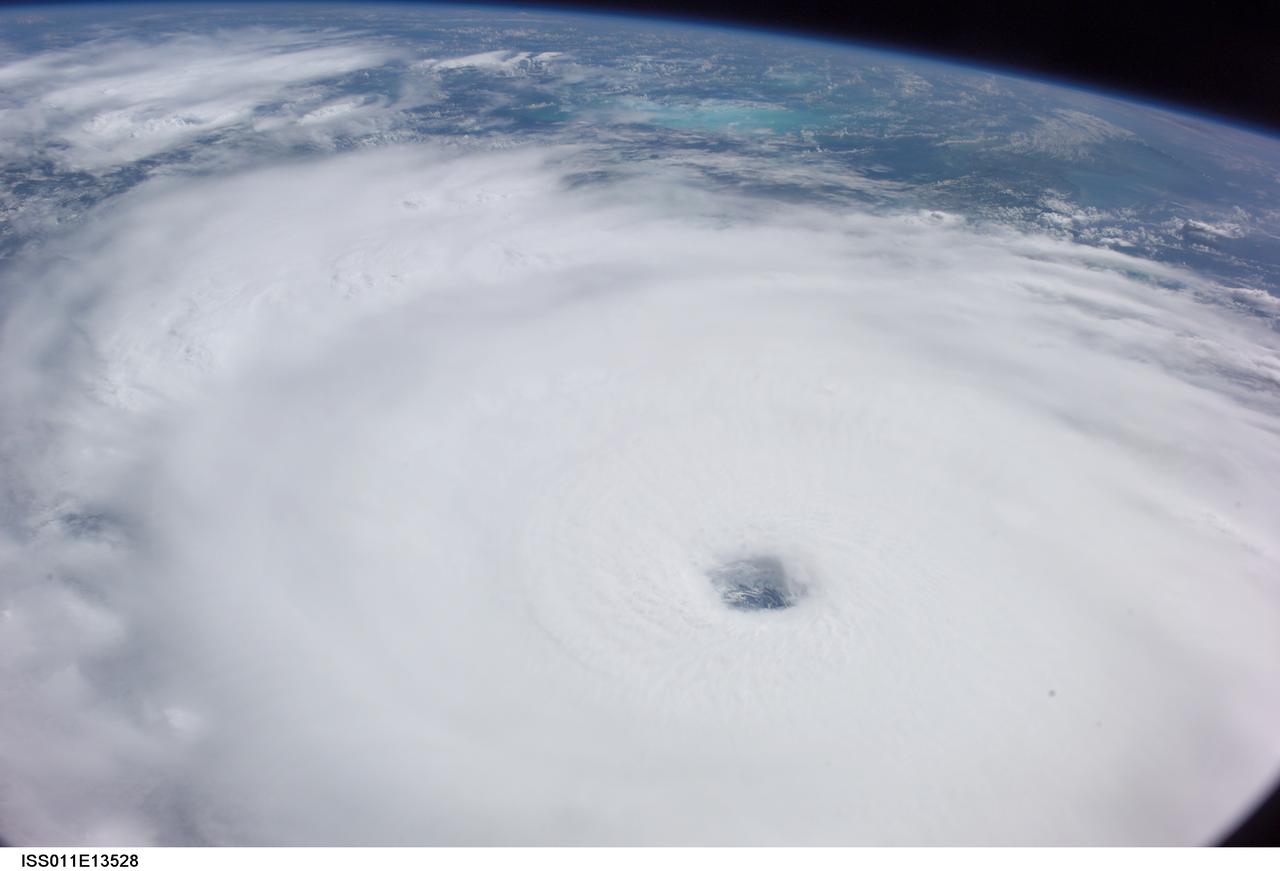
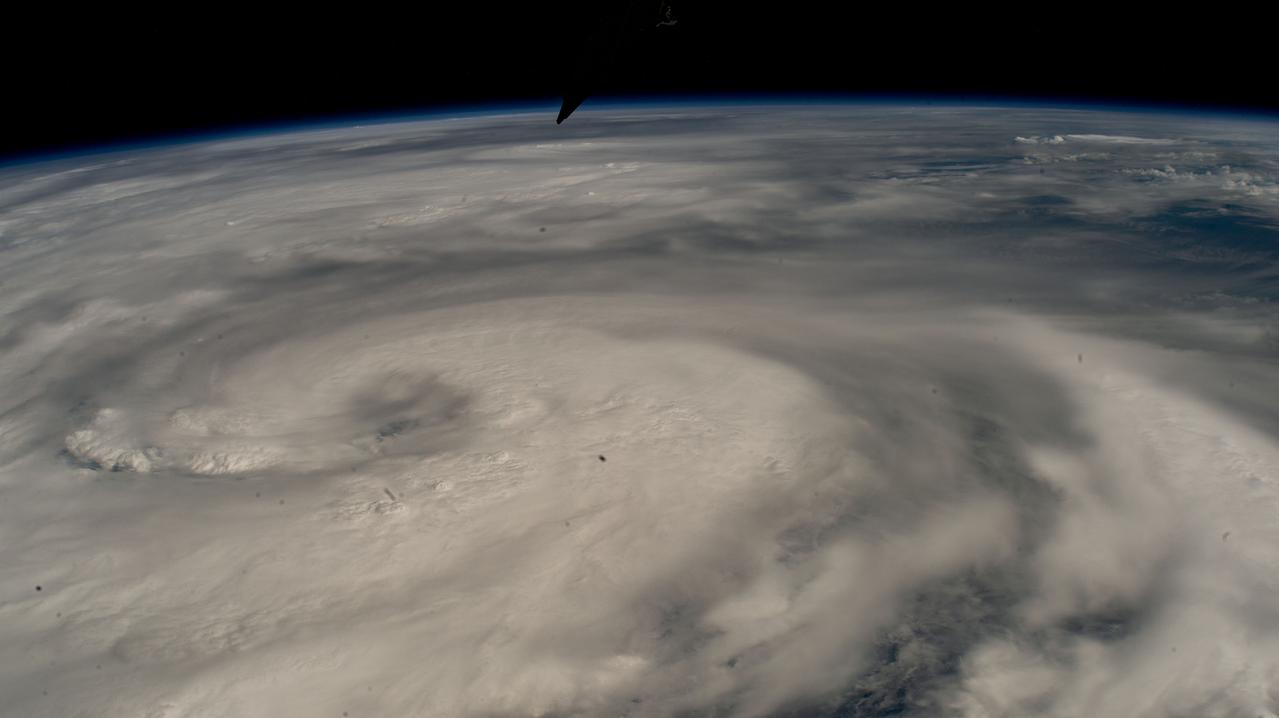
ISS011-E-13528 (21 September 2005) --- Hurricane Rita is featured in this image photographed by an Expedition 11 crewmember on the international space station, as it swirls in the Gulf of Mexico, heading toward the Texas coast.
iss063e078403 (Aug. 26, 2020) --- Hurricane Laura is pictured Wednesday afternoon off the coast of the Texas-Louisiana border as the International Space Station orbited above the Gulf of Mexico.
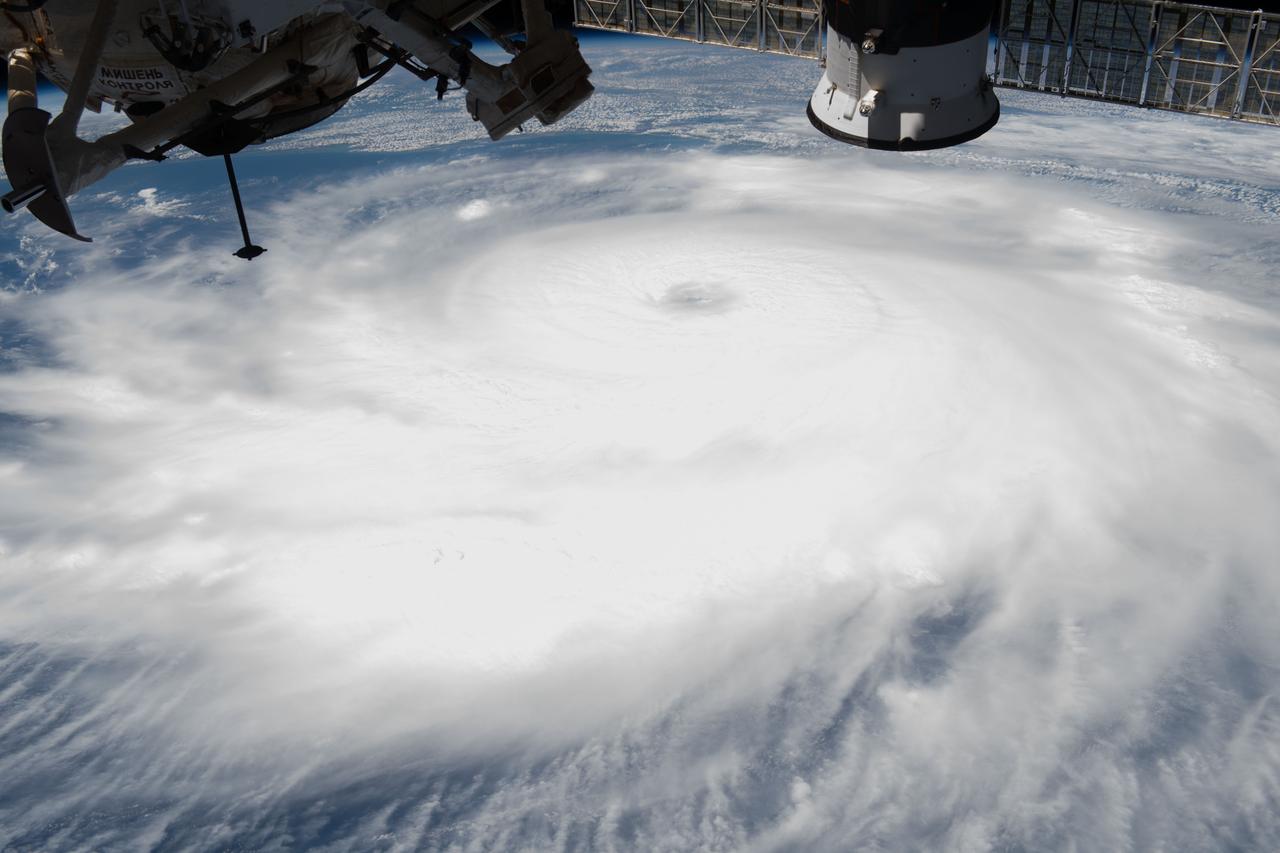
ISS011-E-13519 (21 September 2005) --- Hurricane Rita is featured in this image photographed by an Expedition 11 crewmember on the international space station, as it swirls in the Gulf of Mexico, heading toward the Texas coast.
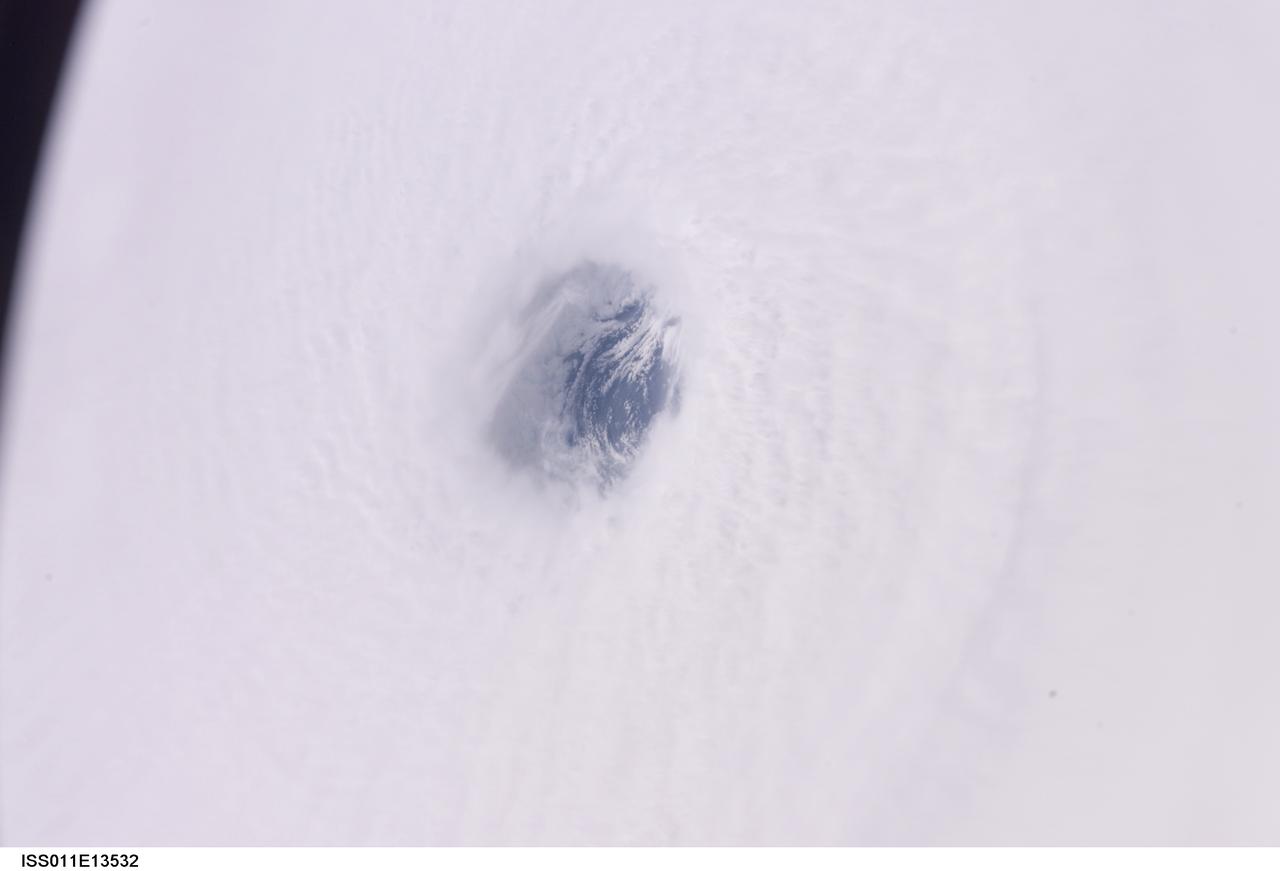
ISS011-E-13532 (21 Sept. 2005) --- A close-up view of the eye of Hurricane Rita, as it swirls in the Gulf of Mexico, is featured in this image photographed by an Expedition 11 crewmember on the International Space Station. The hurricane was heading toward the Texas coast.

iss065e319494 (Aug. 28, 2021) --- Hurricane Ida is pictured as a category 2 storm from the International Space Station as it orbited 264 miles above the Gulf of Mexico. In the foreground, is the Canadarm2 robotic arm with Dextre, the fine-tuned robotic hand, attached.
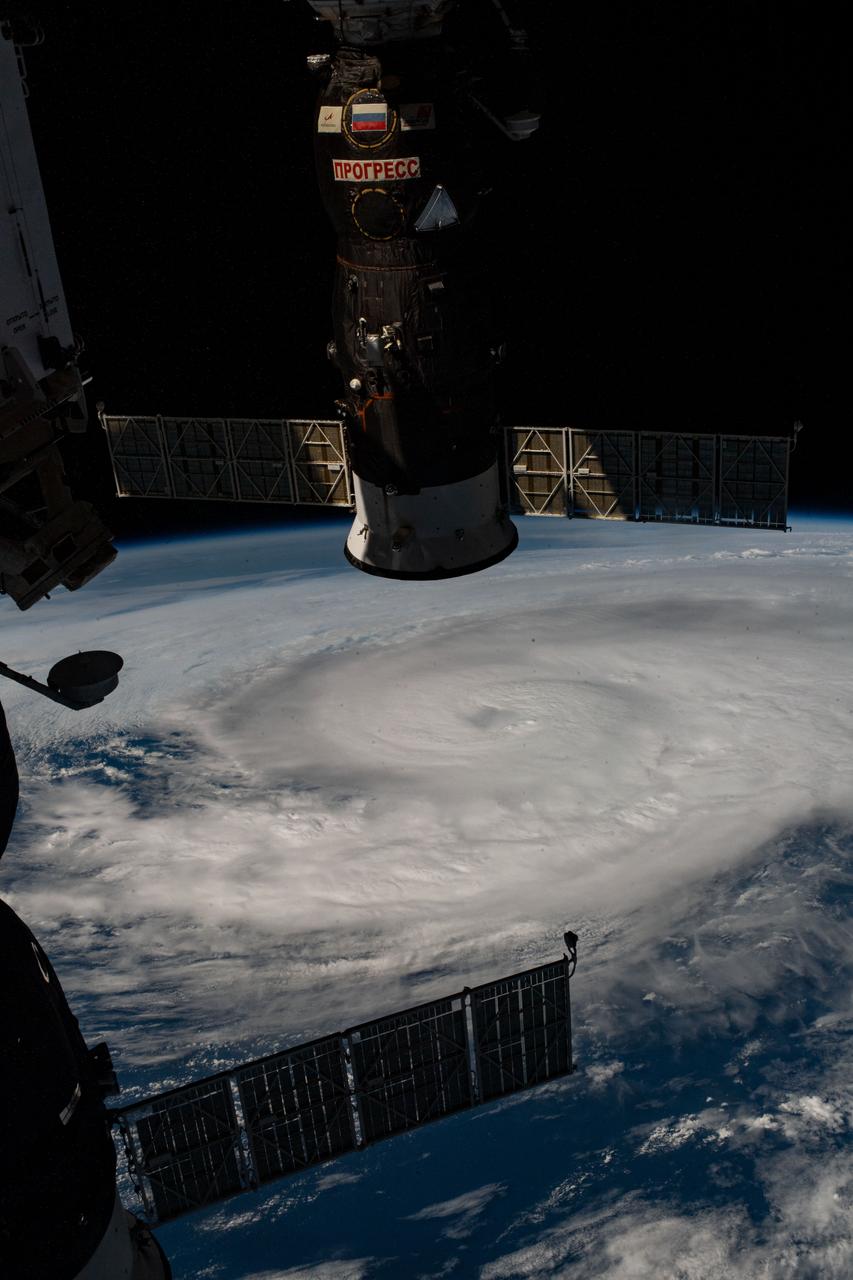
iss064e002219 (Oct. 28, 2020) --- Hurricane Zeta was pictured from the International Space Station as the category two storm churned in the Gulf of Mexico nearing Louisiana. In the upper foreground, is Russia's Progress 76 resupply ship docked to the Pirs docking compartment.
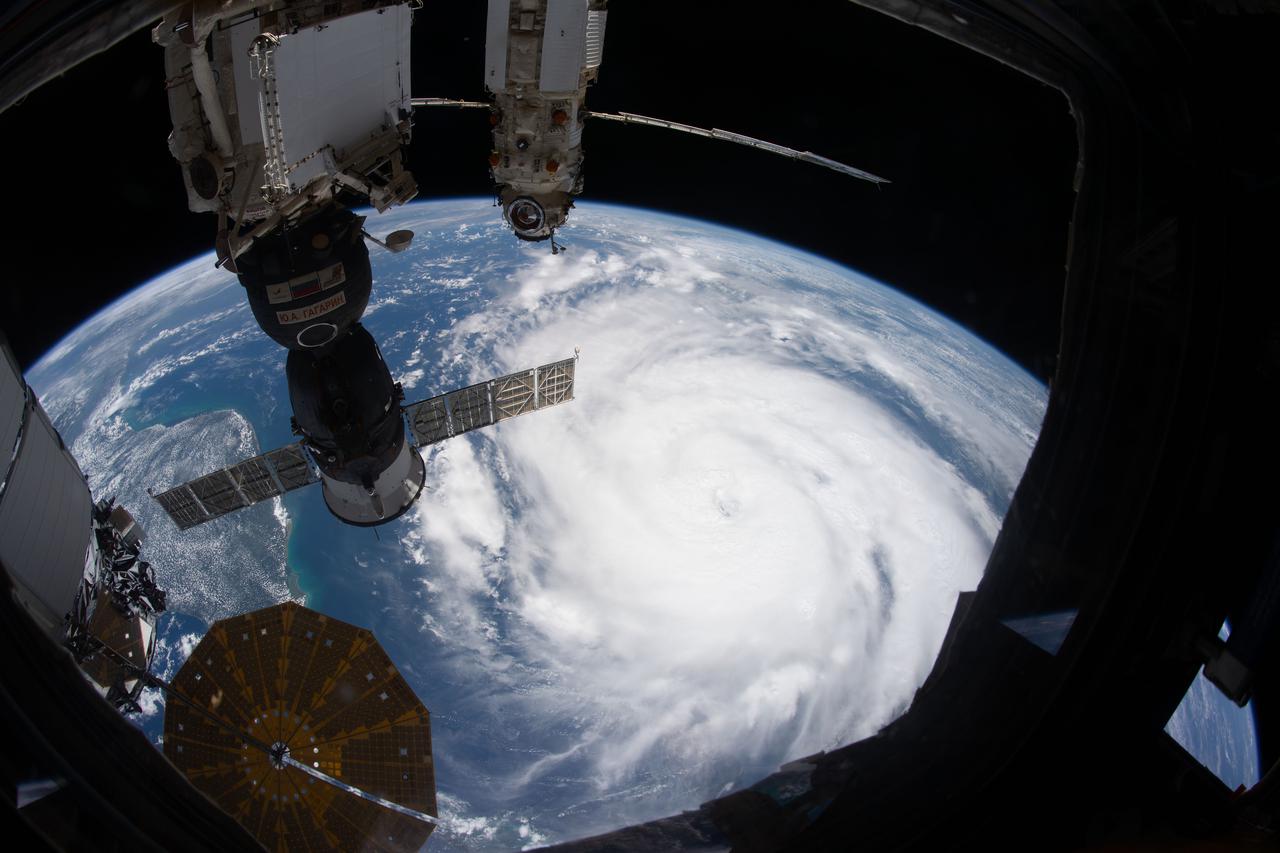
iss065e319503 (Aug. 28, 2021) --- Hurricane Ida is pictured as a category 2 storm from the International Space Station as it orbited 263 miles above the Gulf of Mexico. At left, from top to bottom, are the Nauka multipurpose laboratory module, the Soyuz MS-18 crew ship and the Northrop Grumman Cygnus space freighter.
iss065e319769 (Aug. 28, 2021) --- Hurricane Ida is pictured as a category 2 storm from the International Space Station as it orbited 263 miles above the Gulf of Mexico. At upper left, is the Nauka multipurpose laboratory module docked to the Earth-facing port of the Zvezda service module.
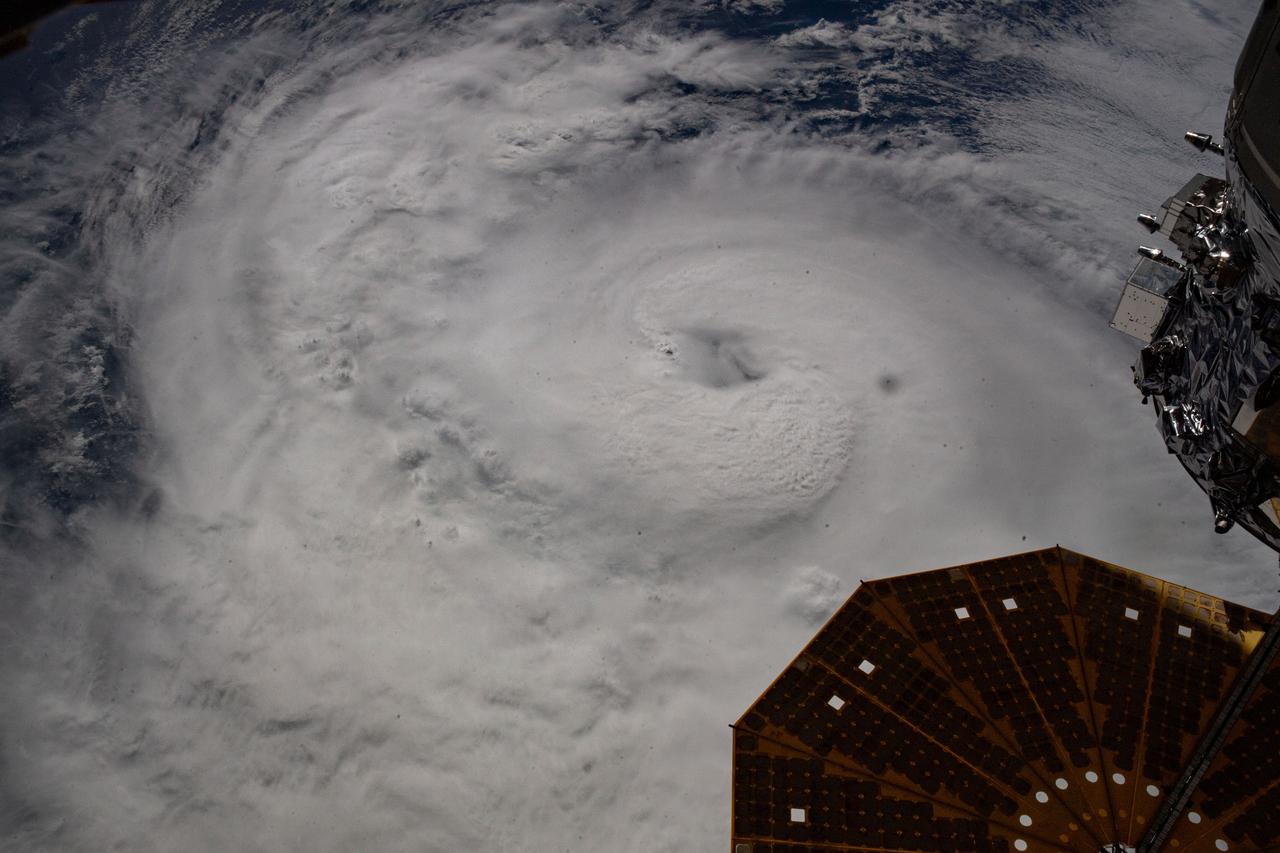
iss064e002177 (Oct. 28, 2020) --- Hurricane Zeta was pictured from the International Space Station as the category two storm churned in the Gulf of Mexico nearing Louisiana. At lower right, is a portion of one of the Northrop Grumman resupply ship's cymbal-shaped UltraFlex solar arrays.
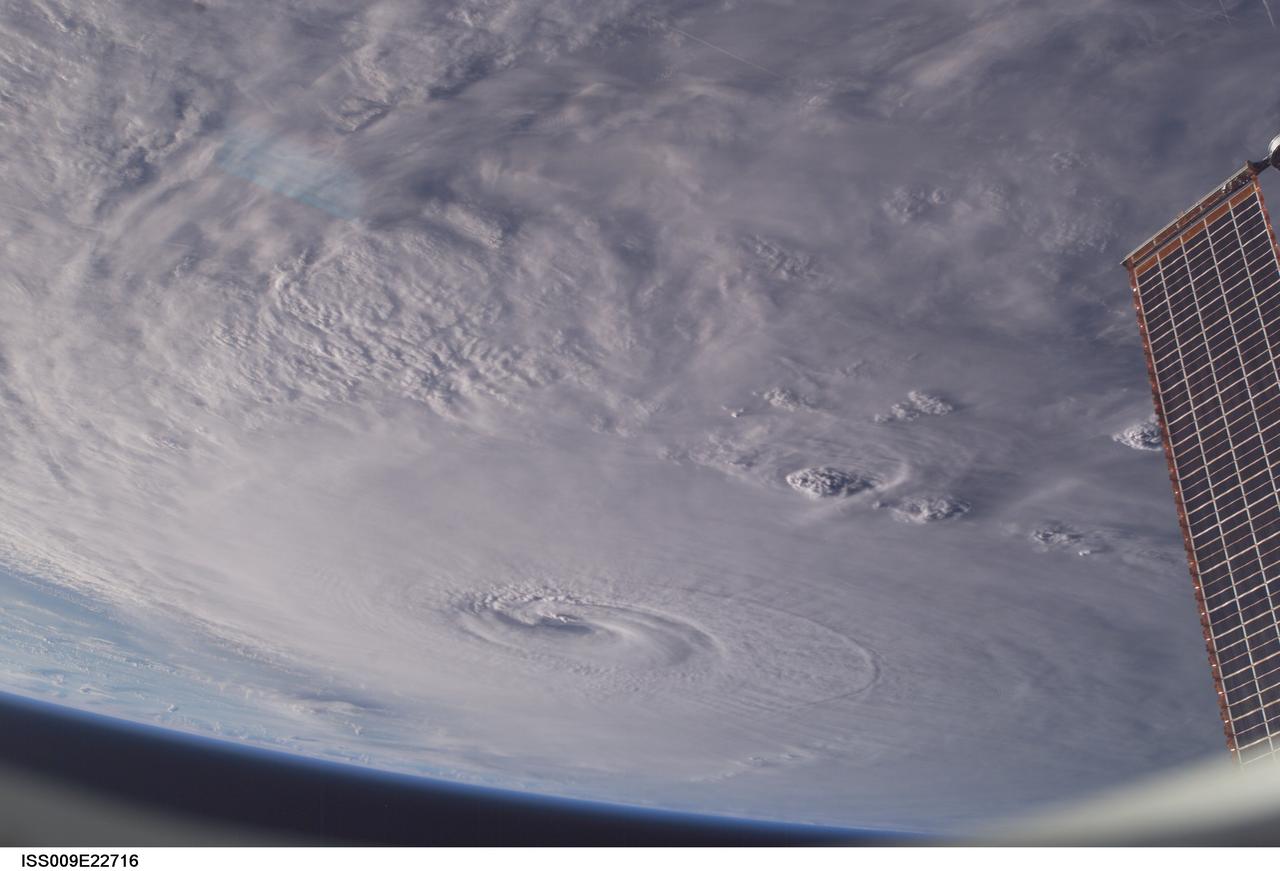
ISS009-E-22716 (14 September 2004) --- Hurricane Ivan was photographed as it churned in the Gulf of Mexico late Tuesday (23:09:41 GMT, Sept. 14) by astronaut Edward M. (Mike) Fincke aboard the International Space Station, 230 miles above Earth. At the time, Ivan was a category 4 hurricane with winds of 140 mph. Fincke, the NASA Station Science Officer, and Station Commander Gennady Padalka are in the final month of a six-month mission aboard the research platform.
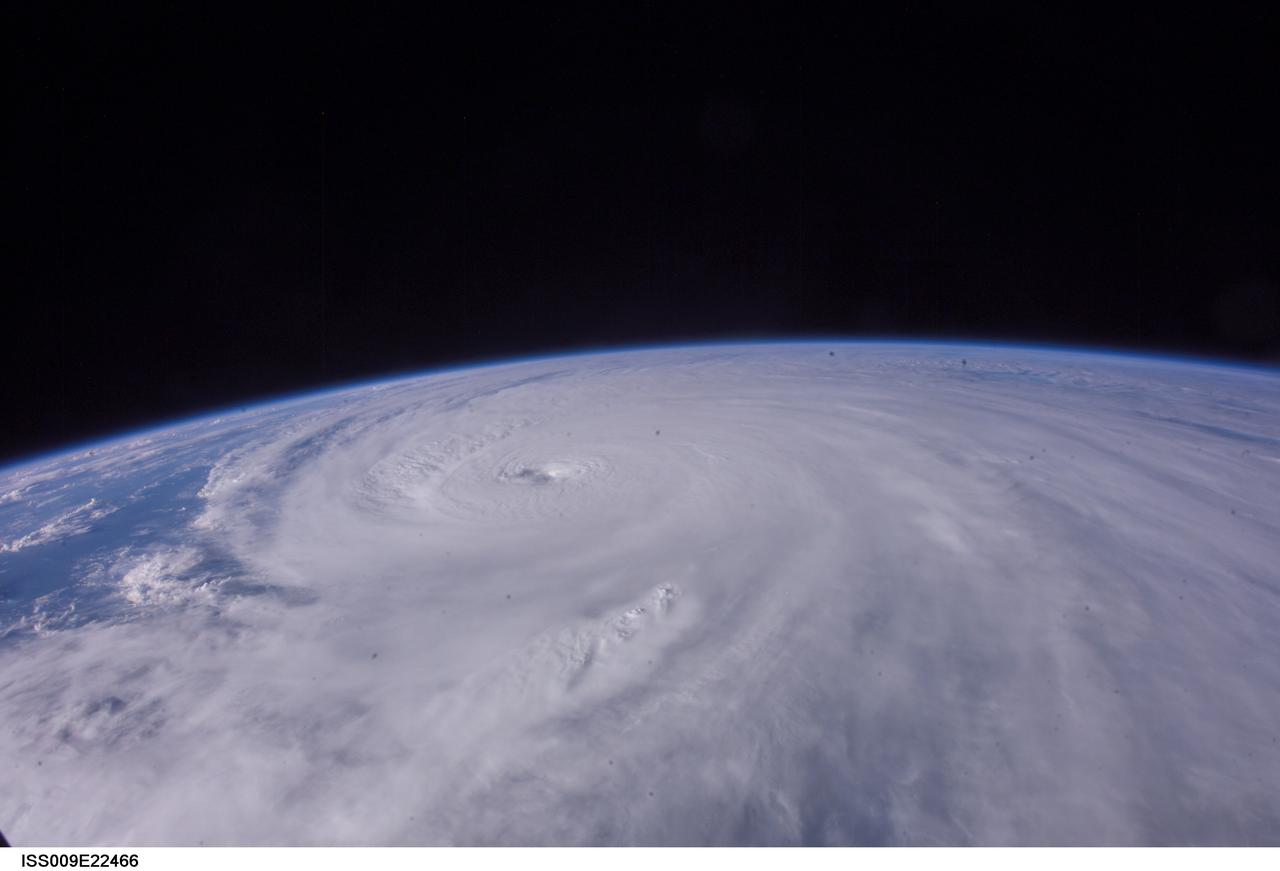
ISS009-E-22466 (13 September 2004) --- Hurricane Ivan was photographed as it entered the Gulf of Mexico late Monday (22:36:31 GMT, Sept. 13) by astronaut Edward M. (Mike) Fincke aboard the International Space Station, 230 miles above Earth. At the time, Ivan was a category 5 hurricane with winds of 160 mph. Fincke, the NASA Station Science Officer, and Station Commander Gennady Padalka are in the final month of a six-month mission aboard the research platform.
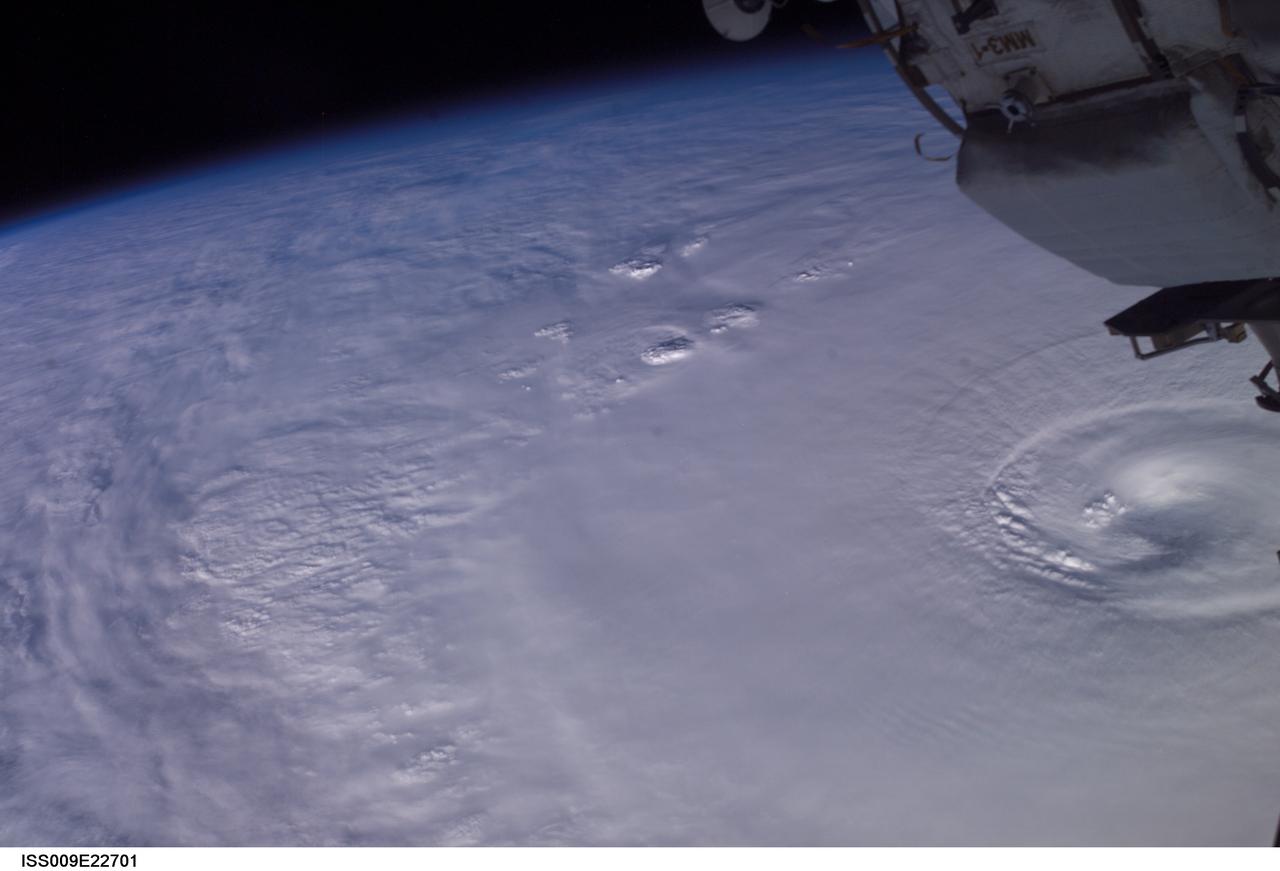
ISS009-E-22701 (14 September 2004) --- Hurricane Ivan was photographed as it churned in the Gulf of Mexico late Tuesday (23:06:56 GMT, Sept. 14) by astronaut Edward M. (Mike) Fincke aboard the International Space Station, 230 miles above Earth. At the time, Ivan was a category 4 hurricane with winds of 140 mph. Fincke, the NASA Station Science Officer, and Station Commander Gennady Padalka are in the final month of a six-month mission aboard the research platform.
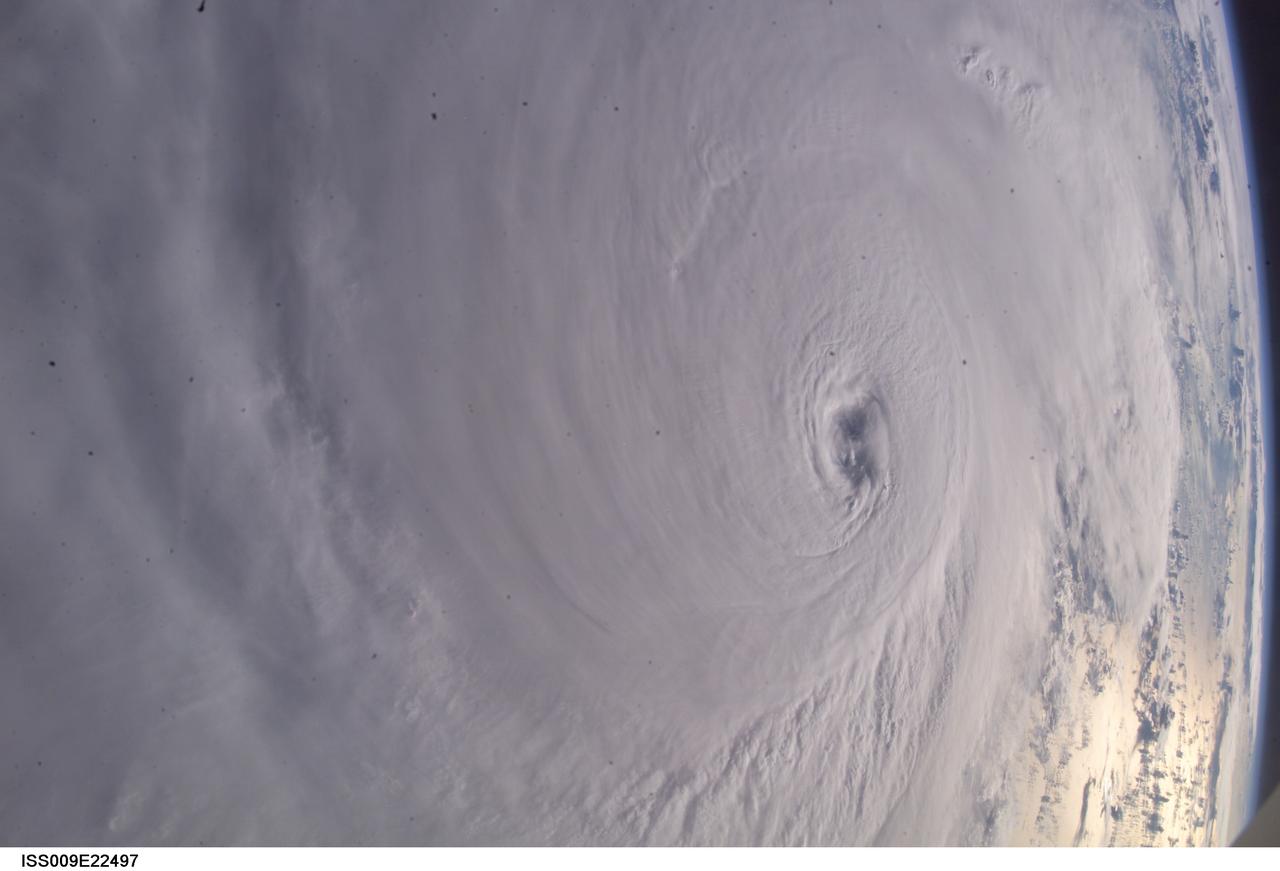
ISS009-E-22497 (13 September 2004) --- Hurricane Ivan was photographed as it entered the Gulf of Mexico late Monday (22:39:23 GMT, Sept. 13) by astronaut Edward M. (Mike) Fincke aboard the International Space Station, 230 miles above Earth. At the time, Ivan was a category 5 hurricane with winds of 160 mph. Fincke, the NASA Station Science Officer, and Station Commander Gennady Padalka are in the final month of a six-month mission aboard the research platform.
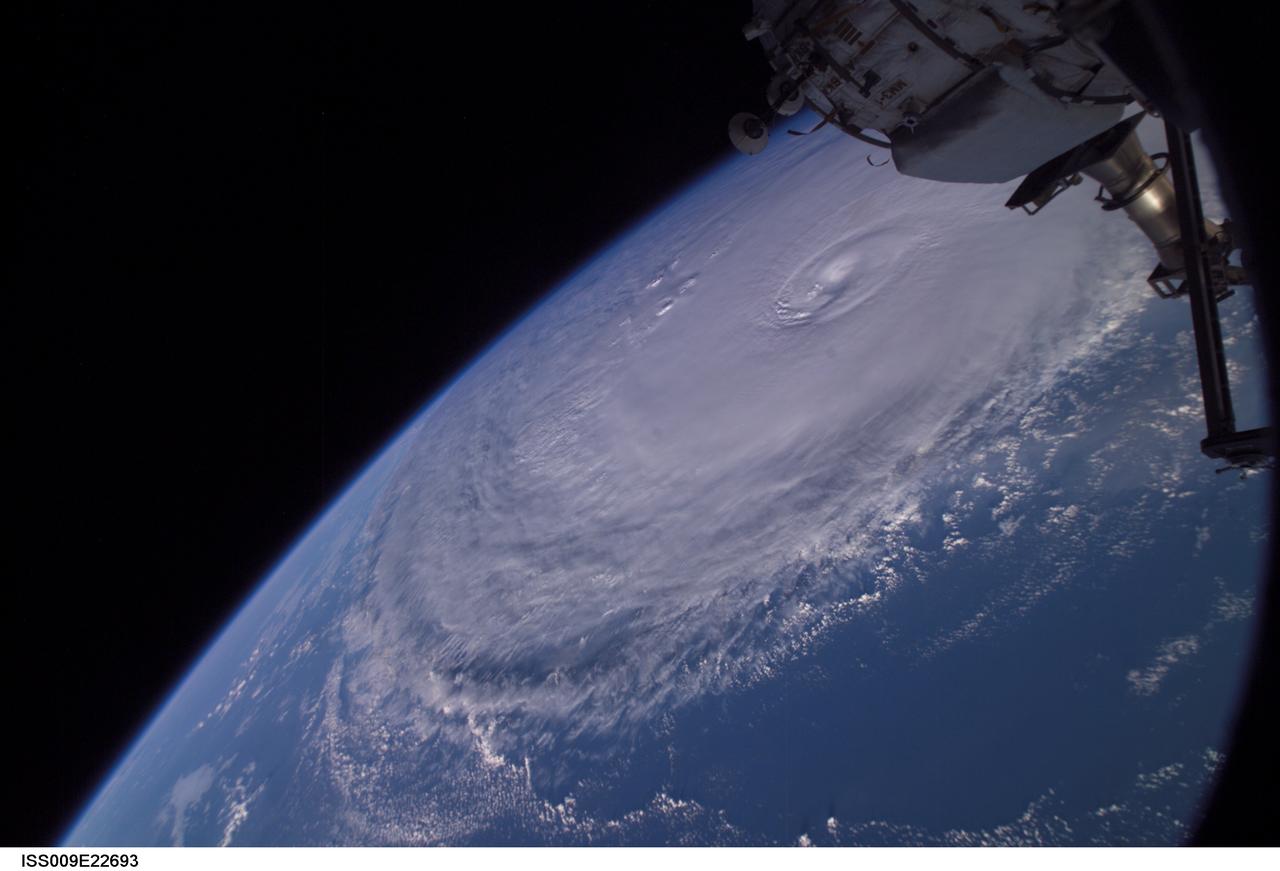
ISS009-E-22693 (14 September 2004) --- Hurricane Ivan was photographed as it churned in the Gulf of Mexico late Tuesday (23:06:23 GMT, Sept. 14) by astronaut Edward M. (Mike) Fincke aboard the International Space Station, 230 miles above Earth. At the time, Ivan was a category 4 hurricane with winds of 140 mph. Fincke, the NASA Station Science Officer, and Station Commander Gennady Padalka are in the final month of a six-month mission aboard the research platform.
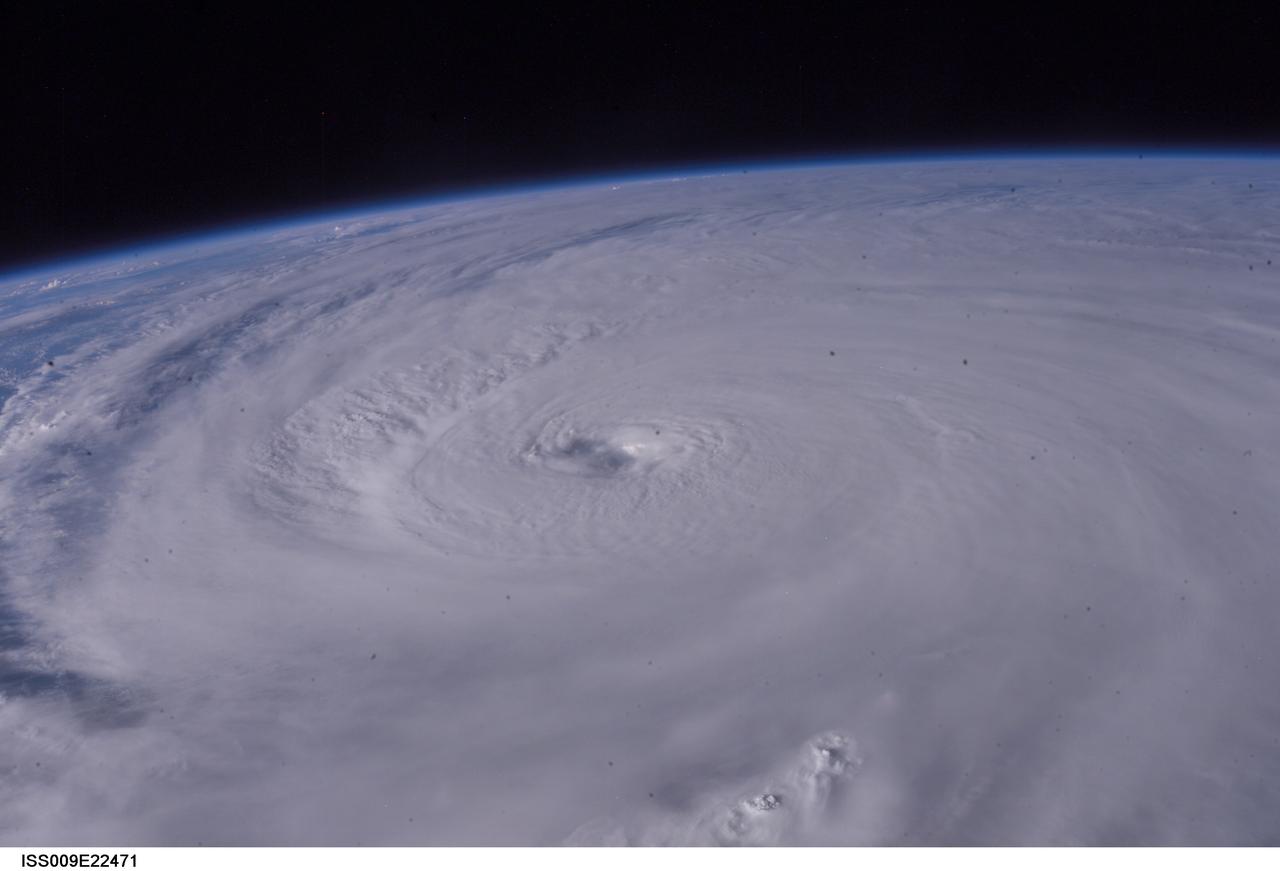
ISS009-E-22471 (13 September 2004) --- Hurricane Ivan was photographed as it entered the Gulf of Mexico late Monday (22:36:49 GMT, Sept. 13) by astronaut Edward M. (Mike) Fincke aboard the International Space Station, 230 miles above Earth. At the time, Ivan was a category 5 hurricane with winds of 160 mph. Fincke, the NASA Station Science Officer, and Station Commander Gennady Padalka are in the final month of a six-month mission aboard the research platform.
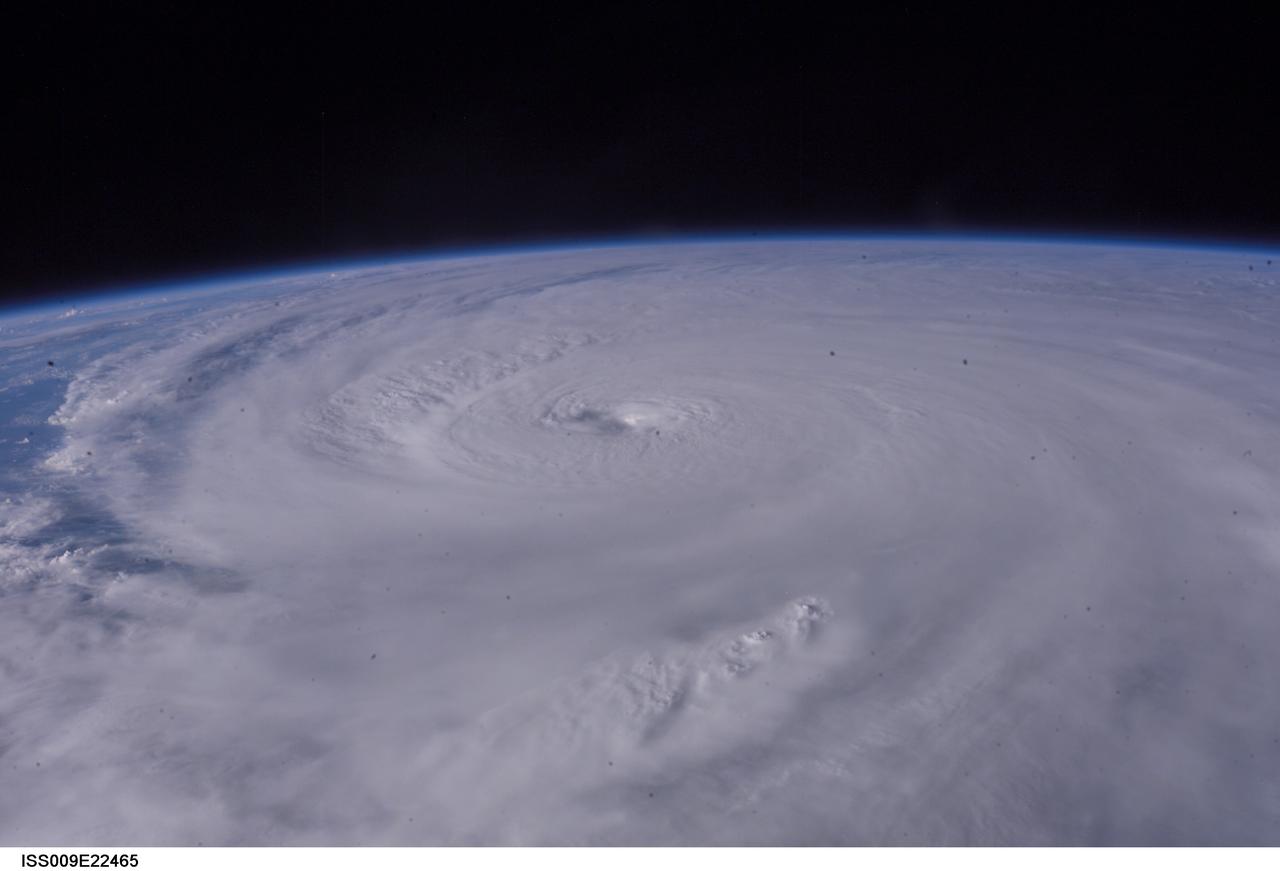
ISS009-E-22465 (13 September 2004) --- Hurricane Ivan was photographed as it entered the Gulf of Mexico late Monday (22:36:24 GMT, Sept. 13) by astronaut Edward M. (Mike) Fincke aboard the International Space Station, 230 miles above Earth. At the time, Ivan was a category 5 hurricane with winds of 160 mph. Fincke, the NASA Station Science Officer, and Station Commander Gennady Padalka are in the final month of a six-month mission aboard the research platform.
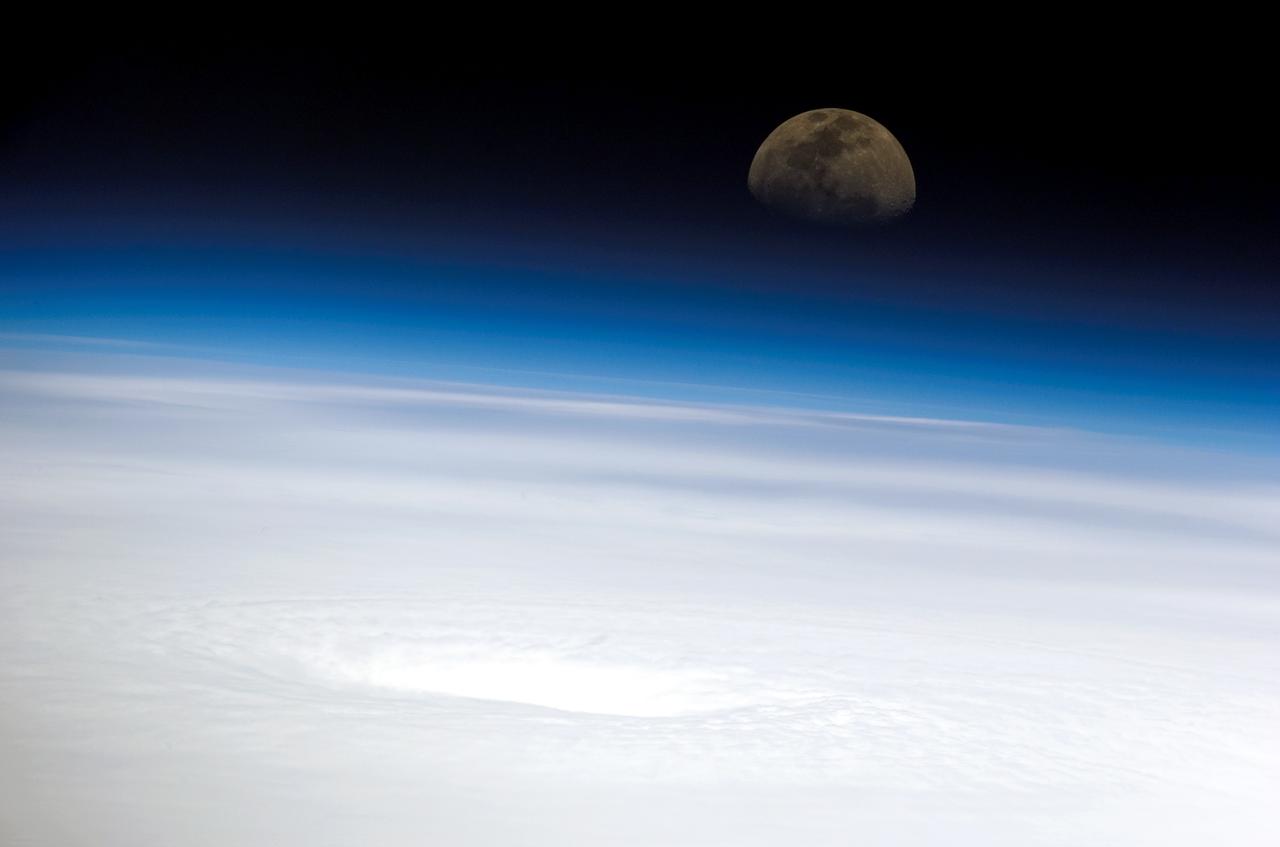
ISS011-E-10509 (16 July 2005) --- This high-oblique panoramic view, recorded by a digital still camera using a 400mm lens, shows the eye of Hurricane Emily. The image was captured by the crew of the international space station while the complex was over the southern Gulf of Mexico looking eastwardly toward the rising moon. At the time, Emily was a strengthening Category 4 hurricane with winds of nearly 155 miles per hour and moving west-northwestwardly over the northwest Caribbean Sea about 135 miles southwest of Kingston, Jamaica.
Except for a small portion of the International Space Station (ISS) in the foreground, Hurricane Ivan, one of the strongest hurricanes on record, fills this image over the northern Gulf of Mexico. As the downgraded category 4 storm approached landfall on the Alabama coast Wednesday afternoon on September 15, 2004, sustained winds in the eye of the wall were reported at about 135 mph. The hurricane was photographed by astronaut Edward M. (Mike) Fincke from aboard the ISS at an altitude of approximately 230 miles. Crew Earth Observations record Earth surface changes over time, as well as more fleeting events such as storms, floods, fires, and volcanic eruptions.
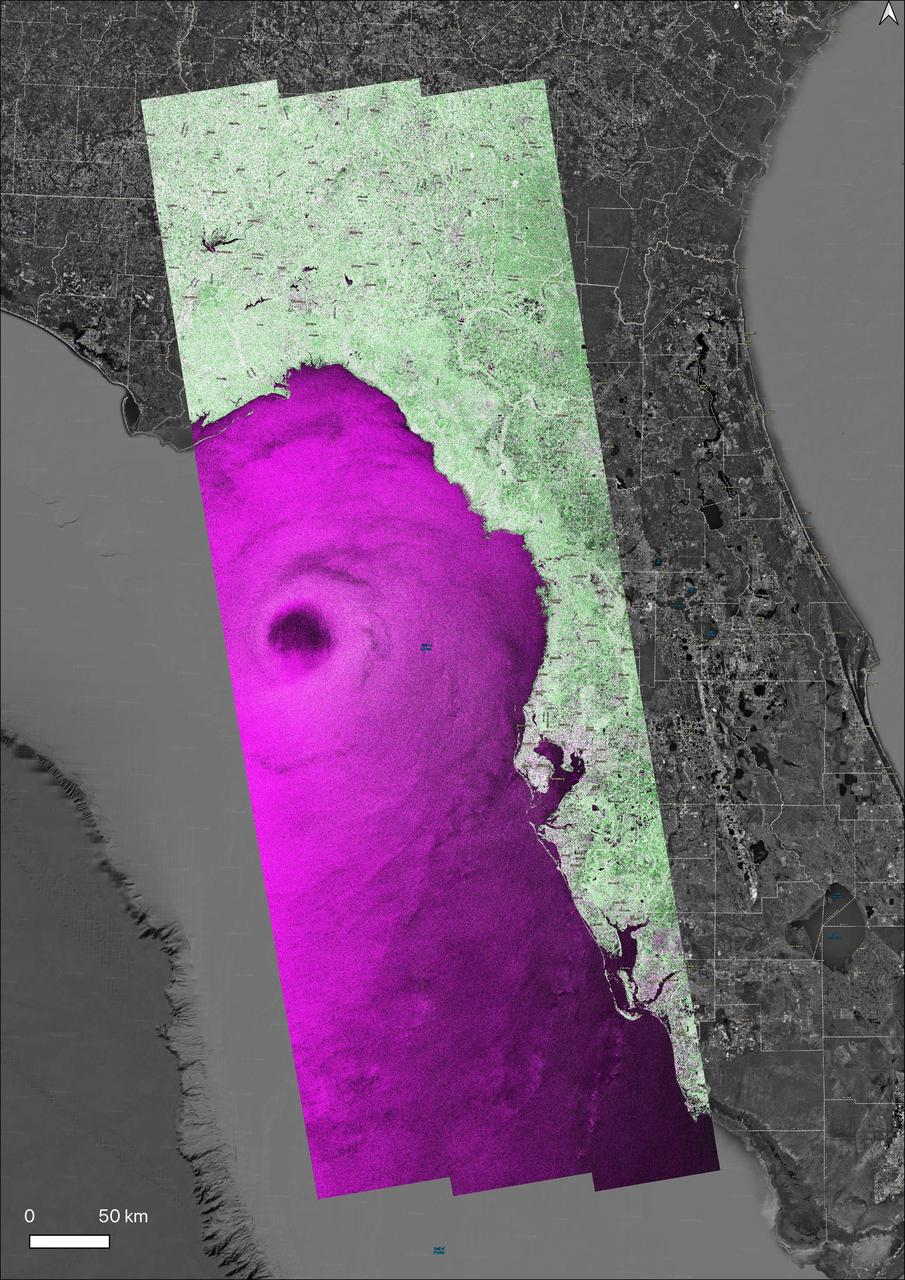
NASA's Observational Products for End-Users from Remote Sensing Analysis (OPERA) project generated a radar image of Hurricane Helene on Friday, Sept. 26, 2024, at 7:38 p.m. local time, as the storm approached the Florida coast. One of the largest storms to develop in the Gulf of Mexico in the last century, Helene made landfall as a Category 4 hurricane in the Big Bend area of Florida at about 11:10 p.m. The data shown in the image is from the synthetic aperture radar (SAR) instrument on the Copernicus Sentinel-1A satellite, operated by the European Space Agency (ESA), and processed by OPERA into a data product called OPERA RTC-S1. The OPERA RTC-S1 image was converted to a false color image. In this color scale, vegetated areas appear green, urban areas appear white/pink, calm water appears black, and rough water appears purple or magenta. The eye of the hurricane can be clearly seen as a large dark patch in the Gulf of Mexico. The OPERA RTC-S1 image was superimposed on a Google Earth satellite background shown in grayscale and the ESRI Boundaries Places layer. https://photojournal.jpl.nasa.gov/catalog/PIA26414
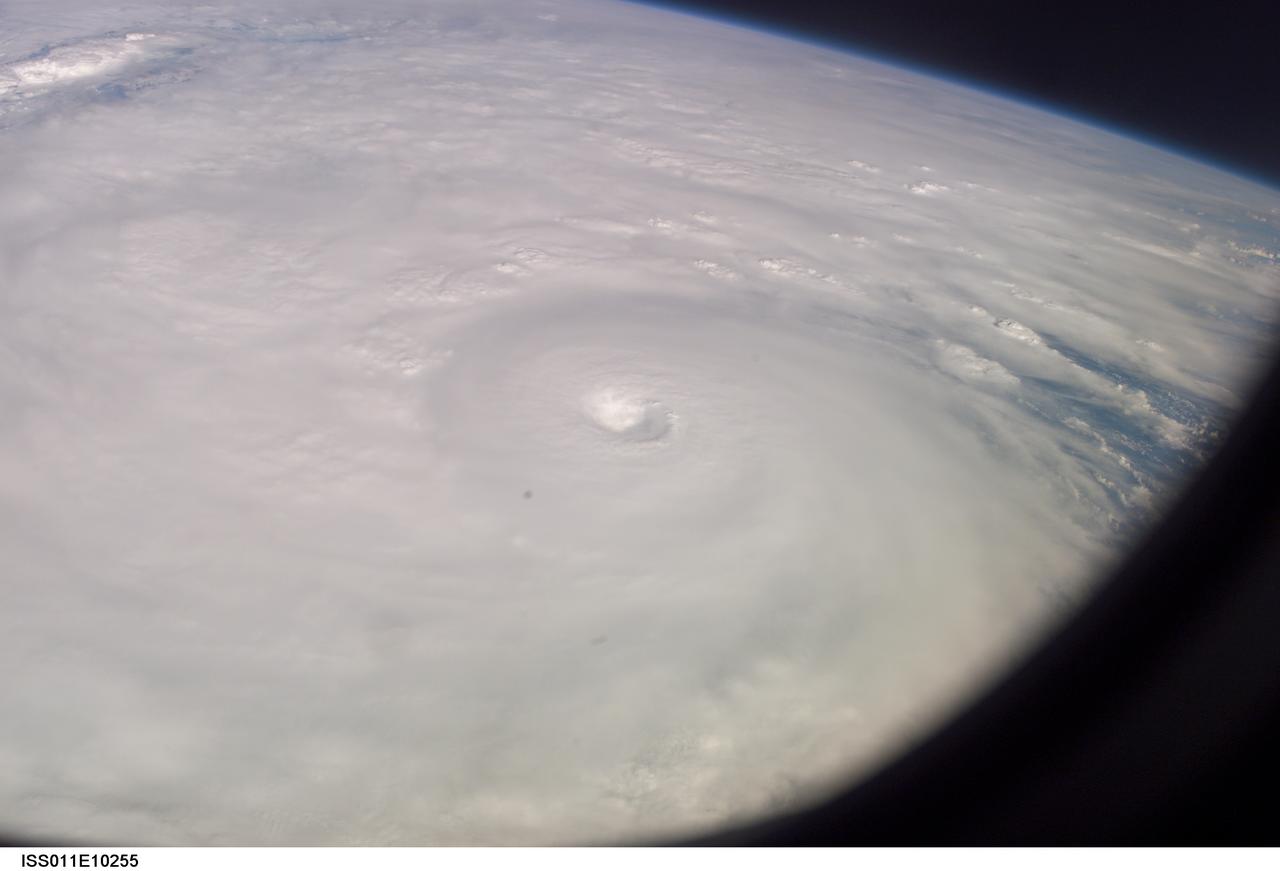
ISS011-E-10255 (9 July 2005) --- This easterly-looking image from the International Space Station shows Hurricane Dennis after the storm had already crossed Cuba and was heading for the northern Gulf of Mexico. Dennis was a Category 3 storm, packing winds of 115 miles per hour, at the time of exposure and located approximately 385 miles southeast of Biloxi, Mississippi or 280 miles south of Panama City, Florida. The eye of the hurricane is in the center of the frame, exposed at 22:06:54 (GMT), July 9, 2005. The dark triangle in loer right corner is part of the Space Station's window.
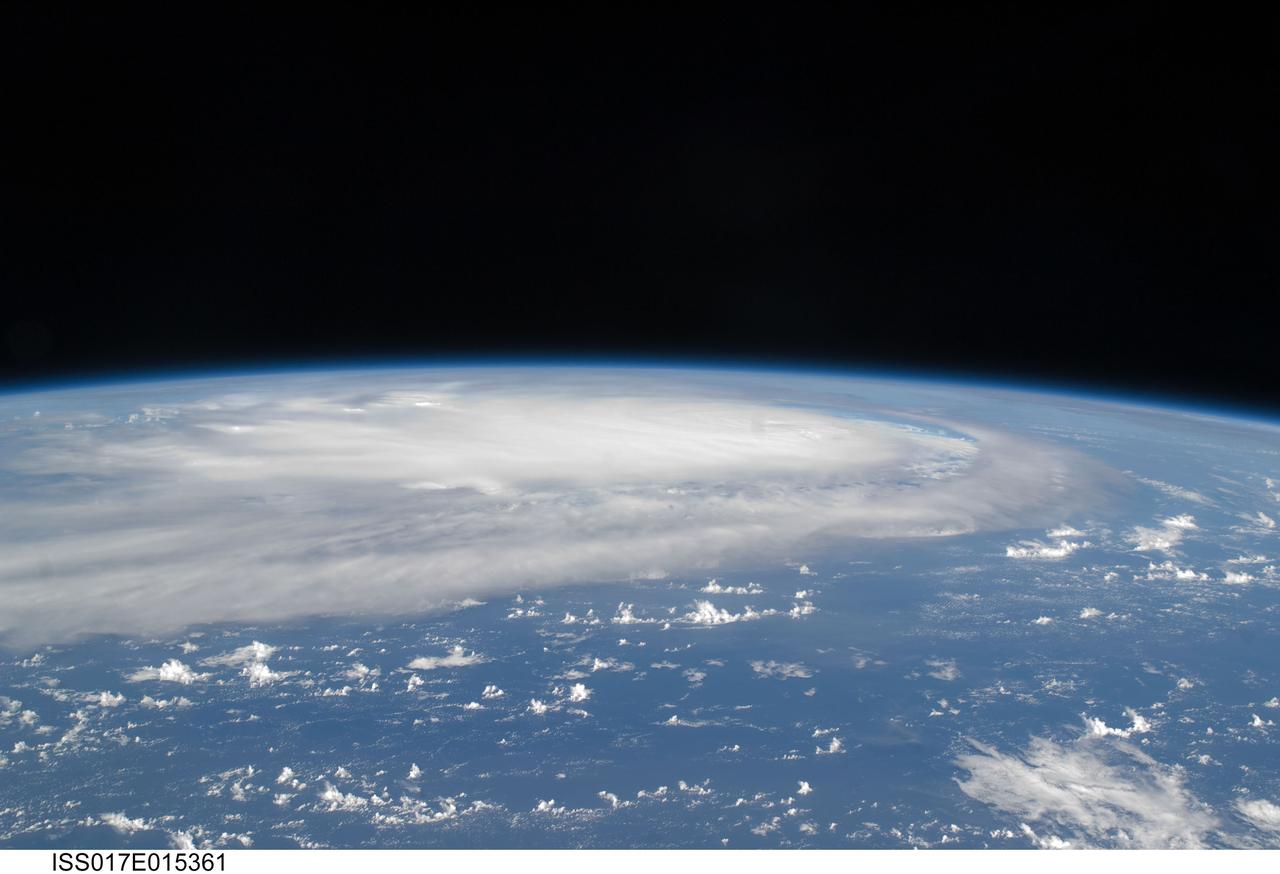
ISS017-E-015361 (5 Sept. 2008) --- When this image was taken of Hurricane Ike from the International Space Station's vantage point of 220 statute miles above Earth on Sept. 5, the eye of it was centered at 23.3 degrees north latitude and 62.0 degrees west longitude and moving 260 degrees at 17.2 miles per hour. The winds were sustained at 121 miles per hour with gusts to 149.8 miles per hour. The hurricane had not yet passed over Cuba and entered the Gulf of Mexico when this photo was taken.
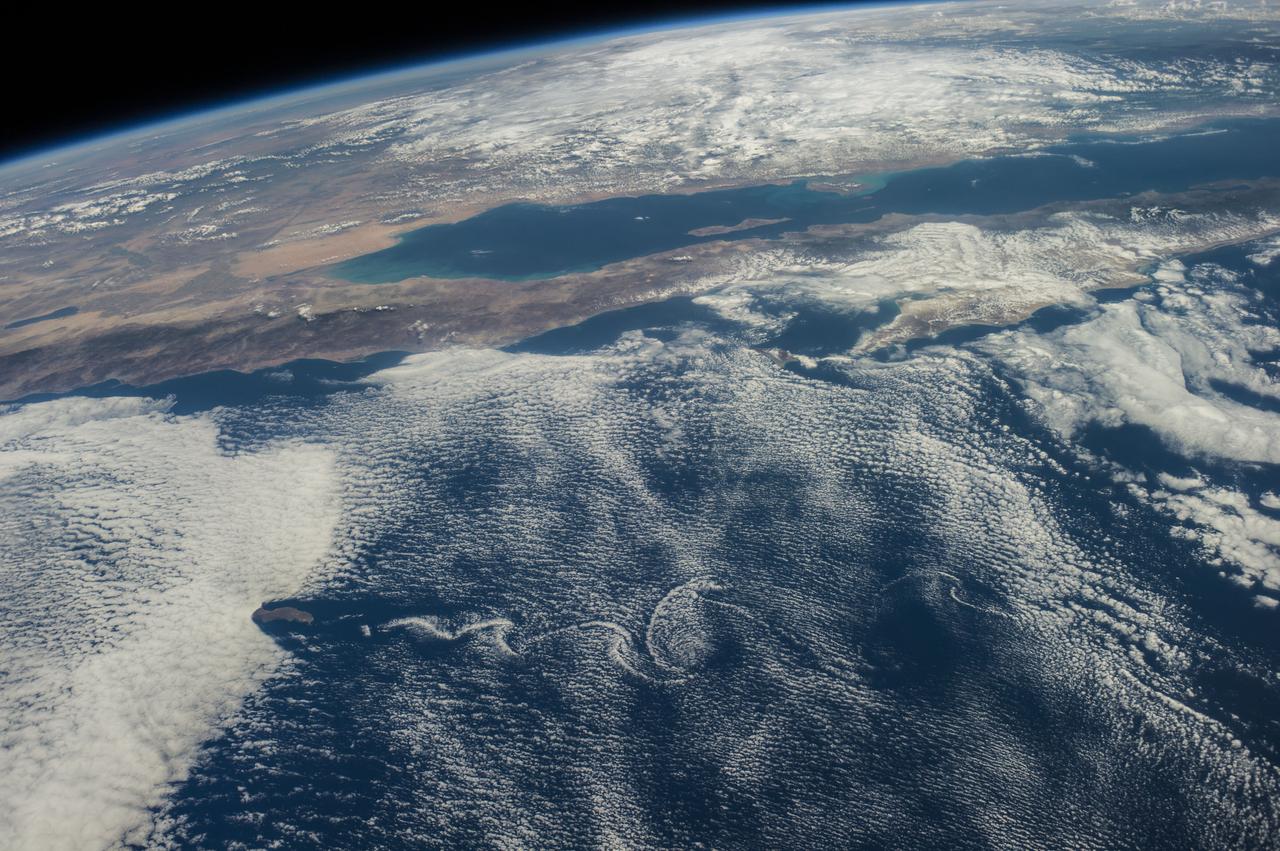
ISS041-E-016962 (18 Sept. 2014) --- Although land and waters of Mexico's Pacific area pictured here are influenced by masses of clouds, for Baja California and other parts of Mexico in this photograph made from the International Space Station, things are quite calmer than a few days ago when Hurricane Odile unleashed its power on the peninsula, especially Baja's south end (right side of frame) and Cabo San Lucas (just out of frame right). The Sea of Cortez (Gulf of California) experiences rather calm weather in this view. California's Salton Sea is visible at left center; and Guadalupe Island is visible at lower left, surrounded by von Karman vortices.
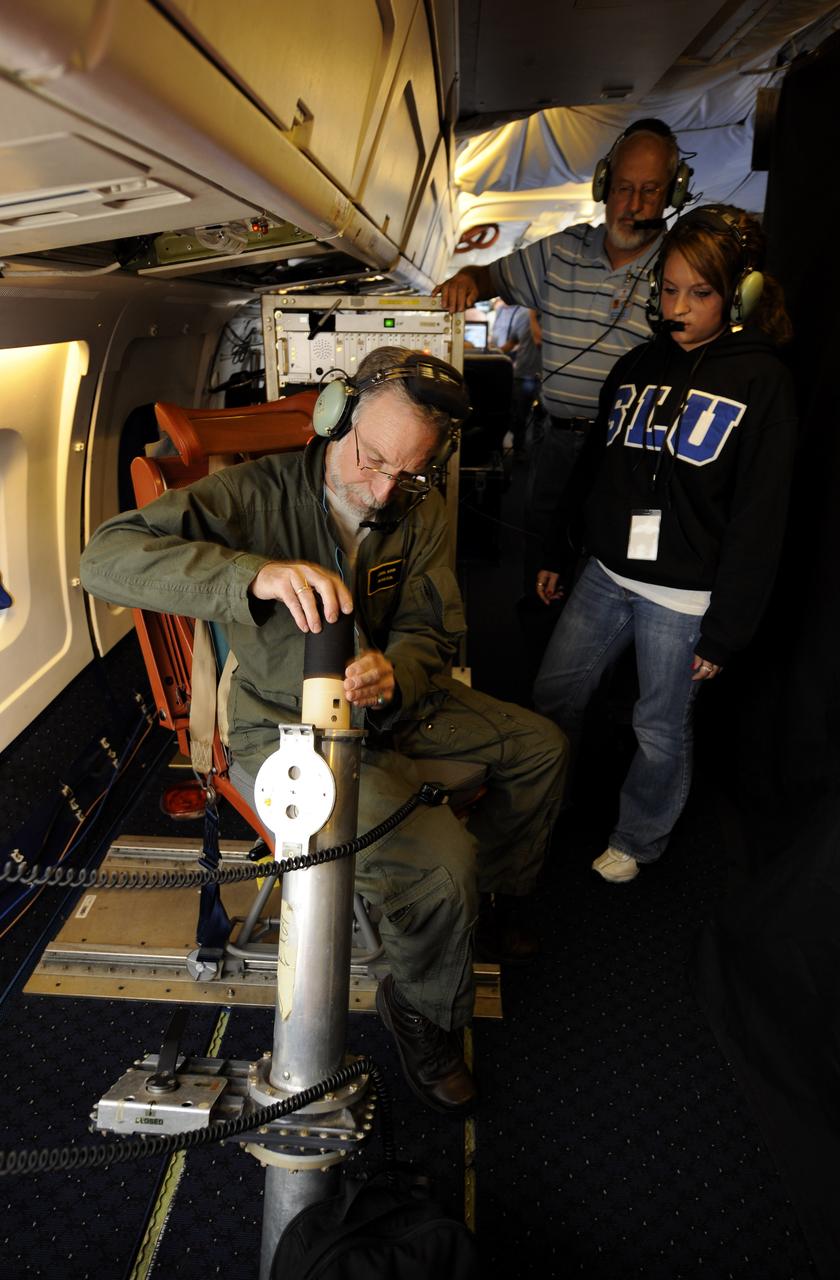
Errol Korn, seated left, deploys a dropsonde experiment over the Gulf of Mexico during a flight aboard the NASA DC-8 as Janel Thomas, a University of Maryland Baltimore County (UMBC) graduate student, and Bob Pasken, look on , Tuesday, Aug. 17, 2010. The Genesis and Rapid Intensification Processes (GRIP) experiment is a NASA Earth science field experiment in 2010 that is being conducted to better understand how tropical storms form and develop into major hurricanes. Photo Credit: (NASA/Paul E. Alers)

Cloud formations are seen through the window of NASA DC-8 aircraft during a flight, Tuesday, Aug. 17, 2010, over the Gulf of Mexico where researchers were studying weather patterns as part of trhe Genesis and Rapid Intensification Processes (GRIP) experiment, a NASA Earth science field experiment in 2010 that is being conducted to better understand how tropical storms form and develop into major hurricanes. Photo Credit: (NASA/Paul E. Alers)
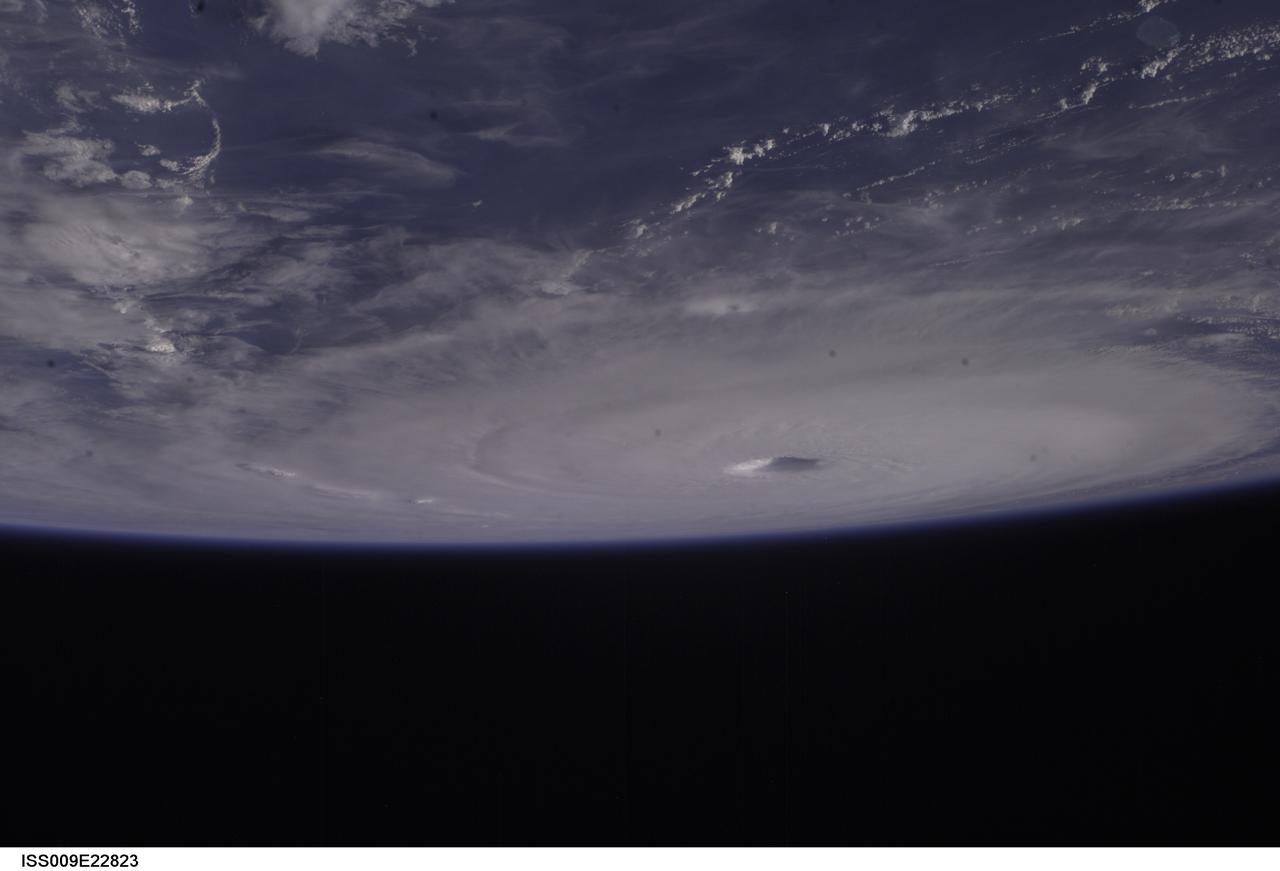
ISS009-E-22823 (15 September 2004) -- Hurricane Ivan fills the northern Gulf of Mexico in this photo taken by astronaut Edward M. (Mike) Fincke as the storm approached landfall on the Alabama coast Wednesday afternoon (21:59:36 GMT, Sept. 15). Ivan was reported to have sustained winds of 135 mph. This photo was taken from an altitude of about 230 miles. Fincke, the NASA ISS Science Officer, and Commander Gennady Padalka are nearing the end of a six-month mission aboard the research outpost.
A researcher with the Genesis and Rapid Intensification Processes (GRIP) experiment works aboard the NASA DC-8 during a flight over the Gulf of Mexico, Tuesday, Aug. 17, 2010. GRIP is a NASA Earth science field experiment in 2010 that is being conducted to better understand how tropical storms form and develop into major hurricanes. Photo Credit: (NASA/Paul E. Alers)
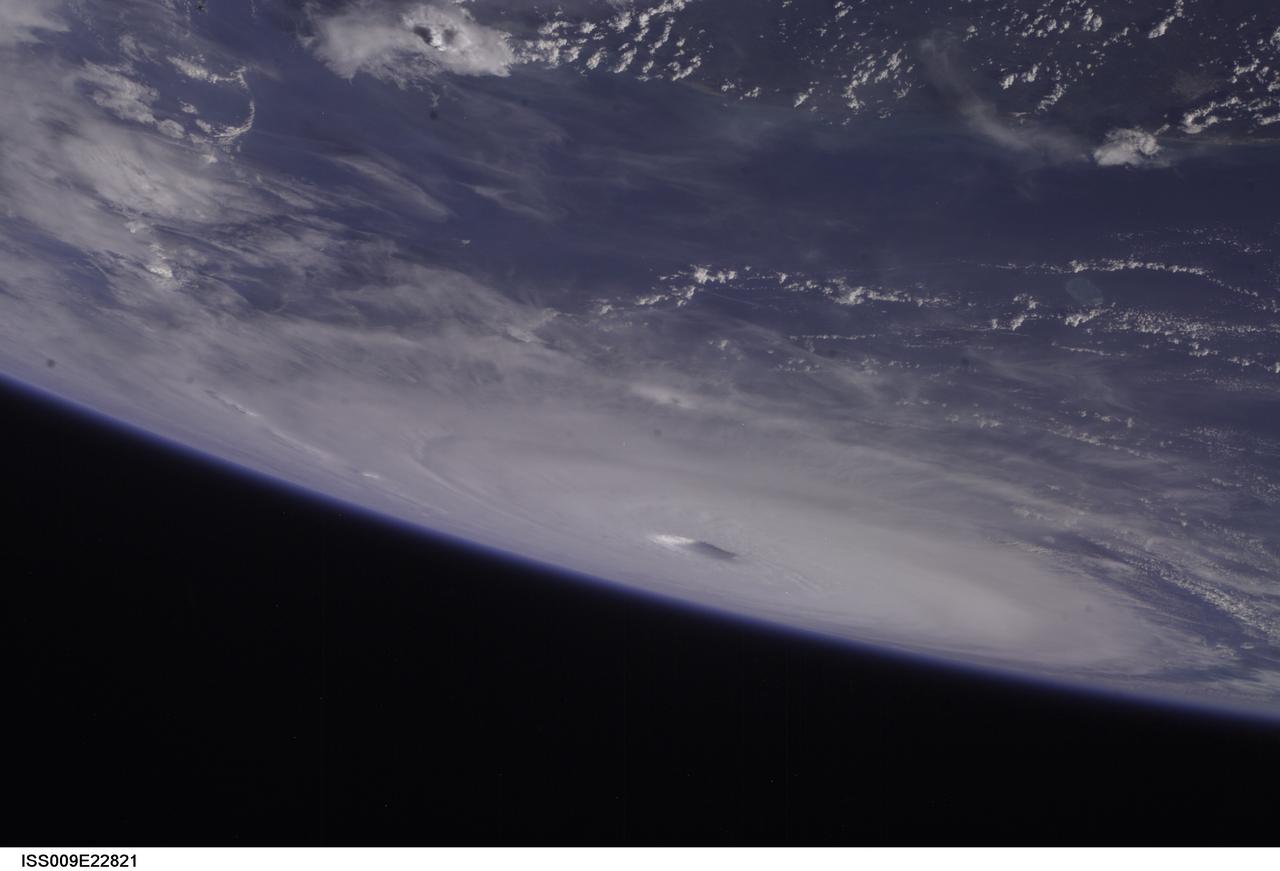
ISS009-E-22821 (15 September 2004) -- Hurricane Ivan fills the northern Gulf of Mexico in this photo taken by astronaut Edward M. (Mike) Fincke as the storm approached landfall on the Alabama coast Wednesday afternoon (21:59:25 GMT, Sept. 15). Ivan was reported to have sustained winds of 135 mph. This photo was taken from an altitude of about 230 miles. Fincke, the NASA ISS Science Officer, and Commander Gennady Padalka are nearing the end of a six-month mission aboard the research outpost.
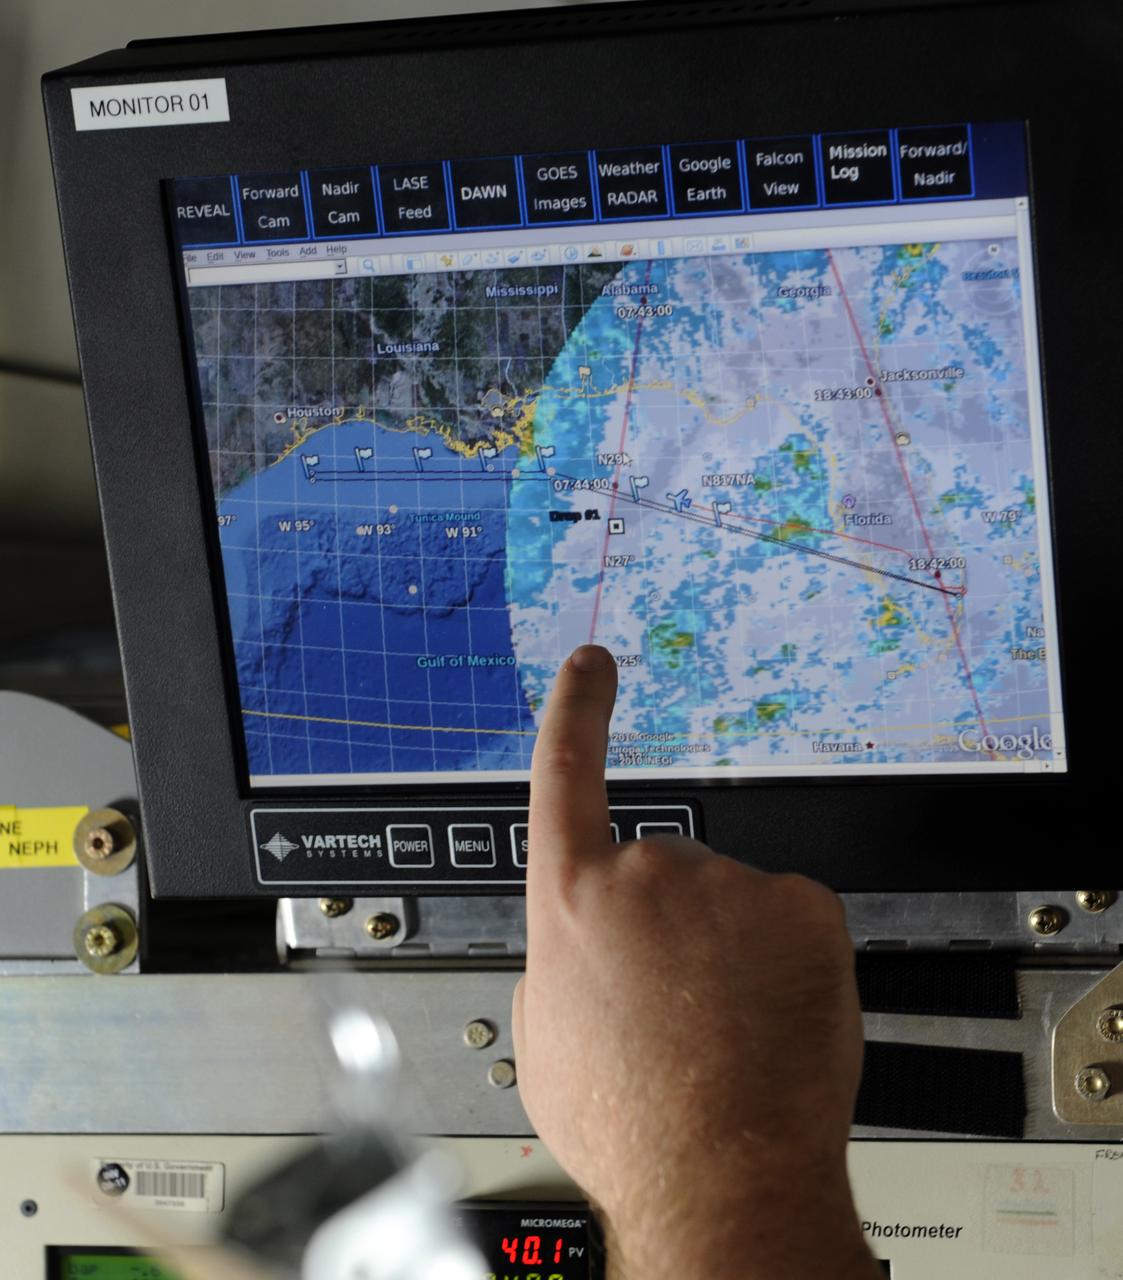
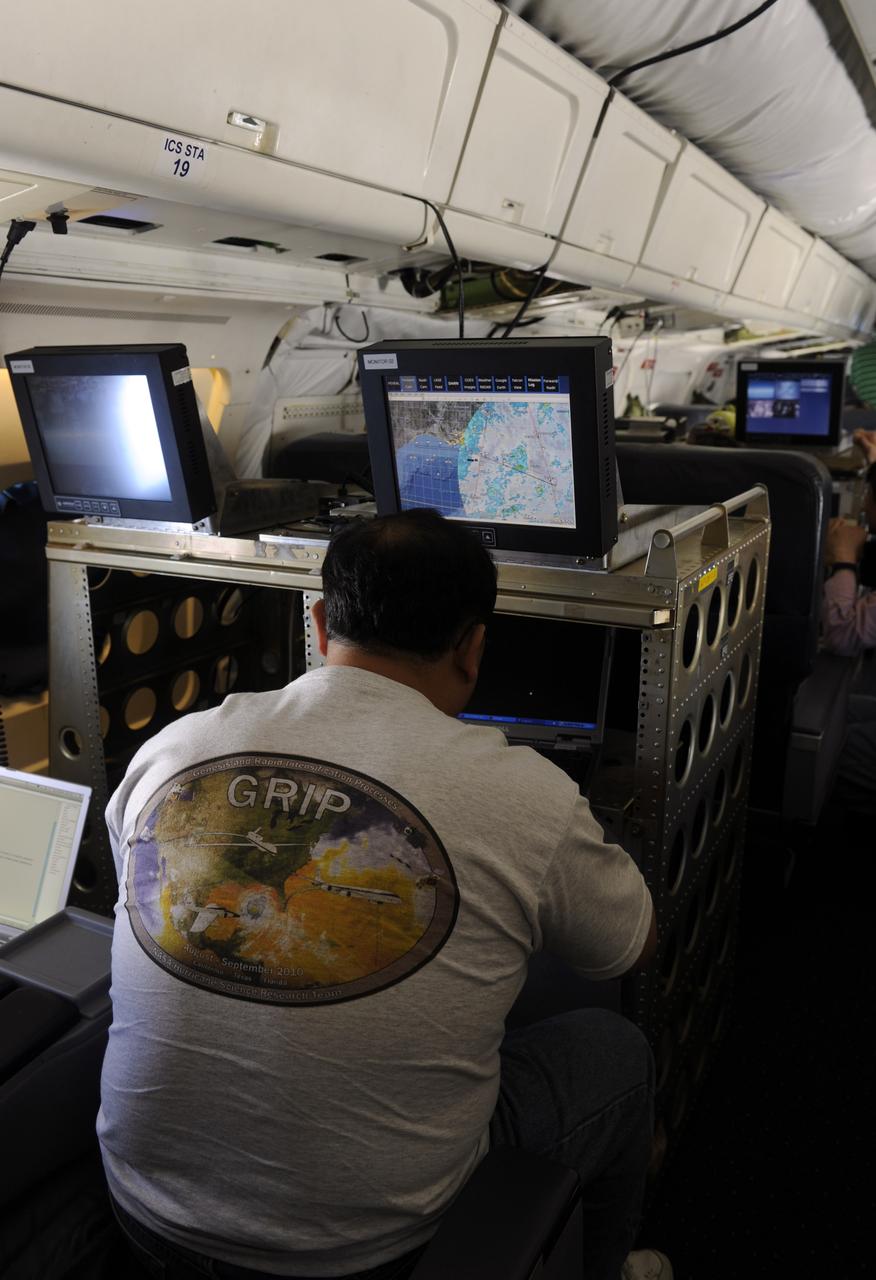
A researcher points out the trajectory of a weather pattern on a computer monitor during a flight aboard the NASA DC-8 aircraft, Tuesday, Aug. 17, 2010, over the Gulf of Mexico. Sceintists and researchers flew Tuesday to study weather as part of the Genesis and Rapid Intensification Processes (GRIP) experiment is a NASA Earth science field experiment in 2010 that is being conducted to better understand how tropical storms form and develop into major hurricanes. Photo Credit: (NASA/Paul E. Alers)

ISS009-E-22680 (14 September 2004) --- The eye of Ivan was photographed as the category 4 hurricane churned in the Gulf of Mexico late Tuesday (23:05:13 GMT, Sept. 14) by astronaut Edward M. (Mike) Fincke aboard the International Space Station, 230 miles above Earth. At the time, Ivan produced winds of 140 mph. Fincke, the NASA Station Science Officer, and Station Commander Gennady Padalka are in the final month of a six-month mission aboard the research platform.
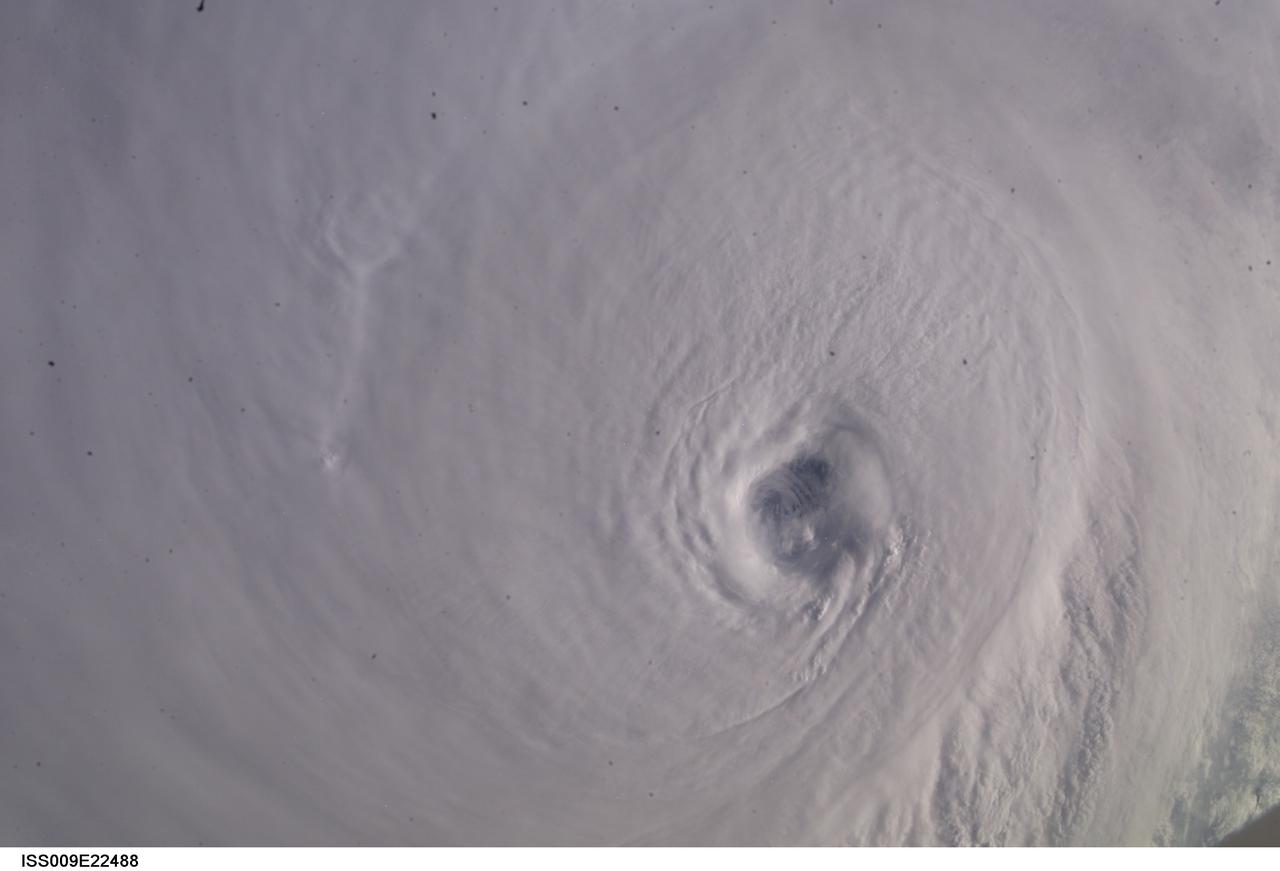
ISS009-E-22488 (13 September 2004) ---- The eye of Hurricane Ivan, swirling with sustained winds of 160 mph at the time, was photographed as the storm entered the Gulf of Mexico late Monday (22:38:37 GMT, Sept. 13) by astronaut Edward M. (Mike) Fincke, 230 miles above the Earth aboard the International Space Station. Fincke and Station Commander Gennady Padalka are in the final month of a six-month stay aboard the research complex.
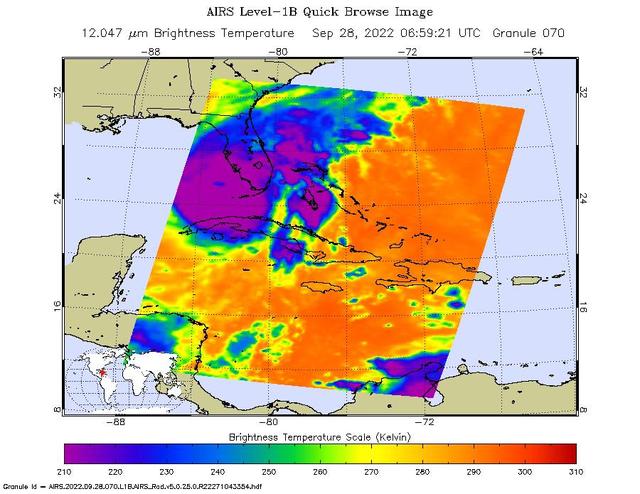
NASA's Atmospheric Infrared Sounder (AIRS) instrument aboard the Aqua satellite captured imagery of Hurricane Ian over the Gulf of Mexico between Cuba and Florida just before 2 a.m. local time Sept. 28, 2022. At that time, the Category 3 storm was in a period of rapid intensification – when a hurricane's wind speeds increase by 35 mph (56 kph) or more within 24 hours – while moving northward toward Florida after having recently made landfall over western Cuba. The image shows cloud or surface temperature measurements taken at infrared wavelengths. The large purple area indicates very cold clouds at about minus 90 degrees Fahrenheit (minus 67 degrees Celsius, or around 210 Kelvin on the map's scale). These clouds are carried high into the atmosphere by tall thunderstorms and are associated with very heavy rainfall. Warmer areas with shallower rain clouds are shown in blue and green. The orange and red areas represent mostly cloud-free air. The eye of the hurricane is seen as a small blue area in the middle of the large purple patch. AIRS, in conjunction with the Advanced Microwave Sounding Unit (AMSU), senses emitted infrared and microwave radiation from Earth to provide a 3D look at the planet's weather and climate. Working in tandem, the two instruments make simultaneous observations down to Earth's surface. With more than 2,000 channels sensing different regions of the atmosphere, the system creates a global, 3D map of atmospheric temperature and humidity, cloud amounts and heights, greenhouse gas concentrations, and many other atmospheric phenomena. Launched into Earth orbit in 2002 aboard NASA's Aqua spacecraft, the AIRS and AMSU instruments are managed by NASA's Jet Propulsion Laboratory in Southern California, under contract to NASA. JPL is a division of Caltech. https://photojournal.jpl.nasa.gov/catalog/PIA24908
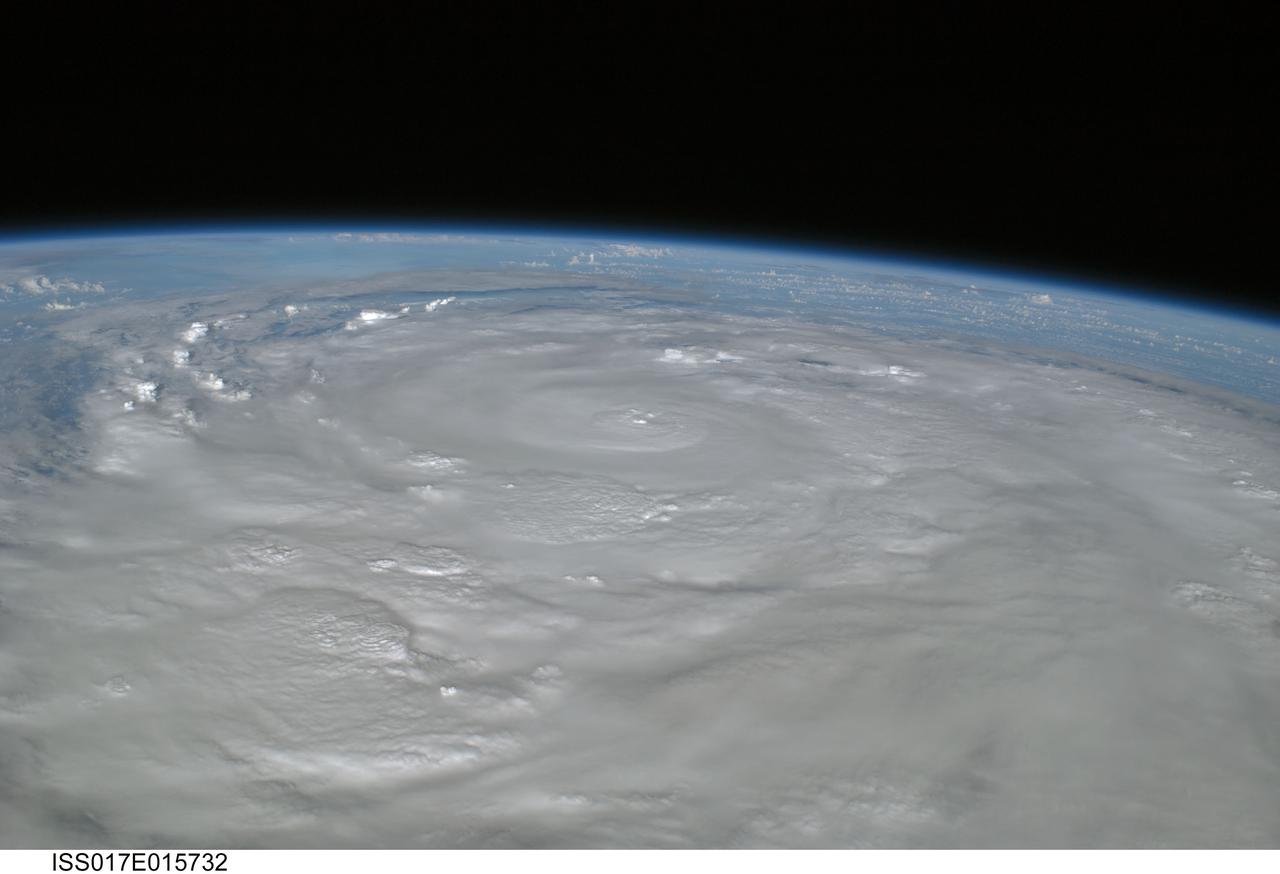
ISS017-E-015732 (9 Sept. 2008) --- Hurricane Ike covers more than half of Cuba in this image, photographed by the crew of ISS-17 aboard the International Space Station from a vantage point of 220 statute miles above Earth. The center of Ike was near 22.4 degrees north latitude and 82.4 degrees west longitude and moving 290 degrees at 11.7 miles per hour. Sustained winds were at 80.6 miles per hour, with gusts to 97.9 miles per hour and were forecast to strengthen as the eye moved back over the warm water in the gulf of Mexico.
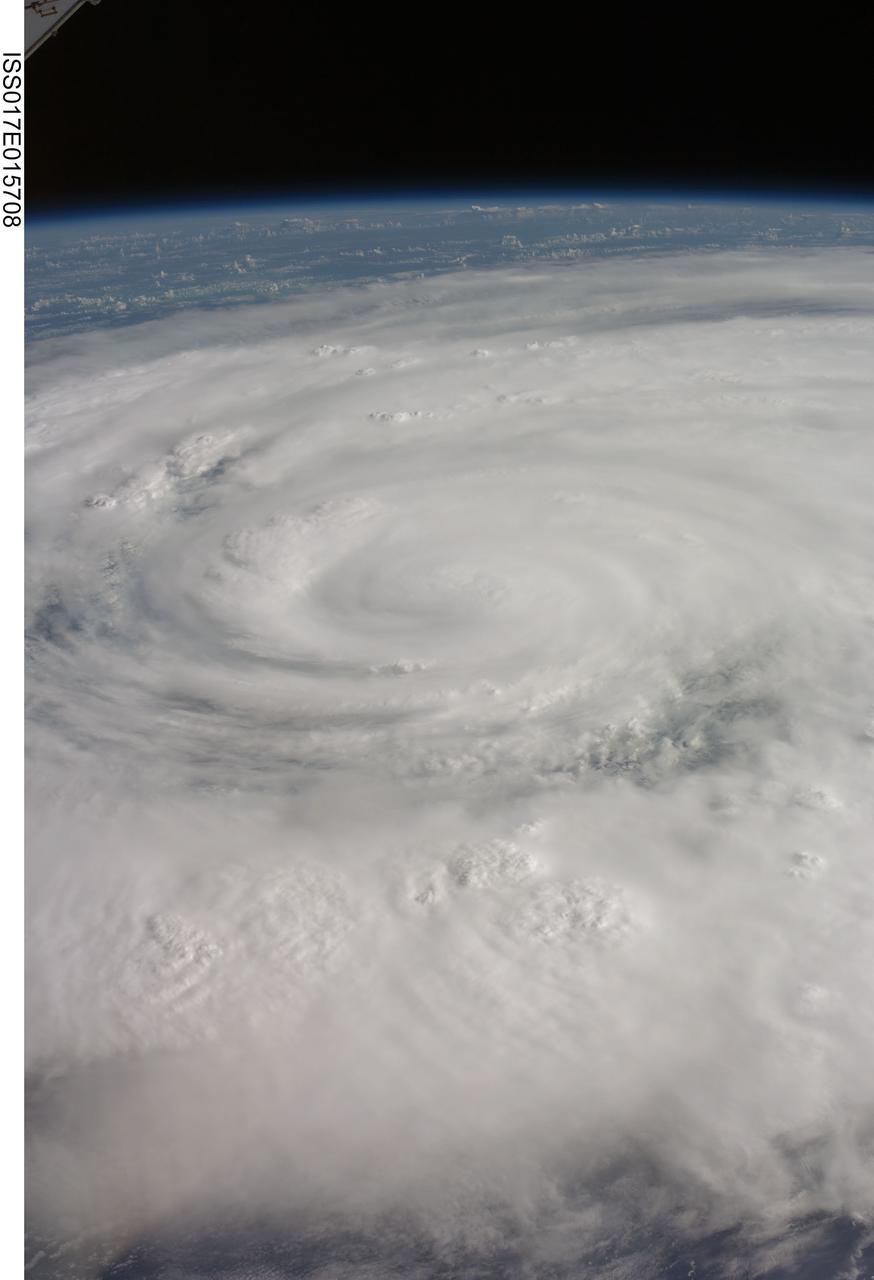
ISS017-E-015708 (9 Sept. 2008) --- Hurricane Ike covers more than half of Cuba in this image, photographed by the crew of ISS-17 aboard the International Space Station from a vantage point of 220 statute miles above Earth. The center of Ike was near 22.4 degrees north latitude and 82.4 degrees west longitude and moving 290 degrees at 11.7 miles per hour. Sustained winds were at 80.6 miles per hour, with gusts to 97.9 miles per hour and were forecast to strengthen as the eye moved back over the warm water in the gulf of Mexico.
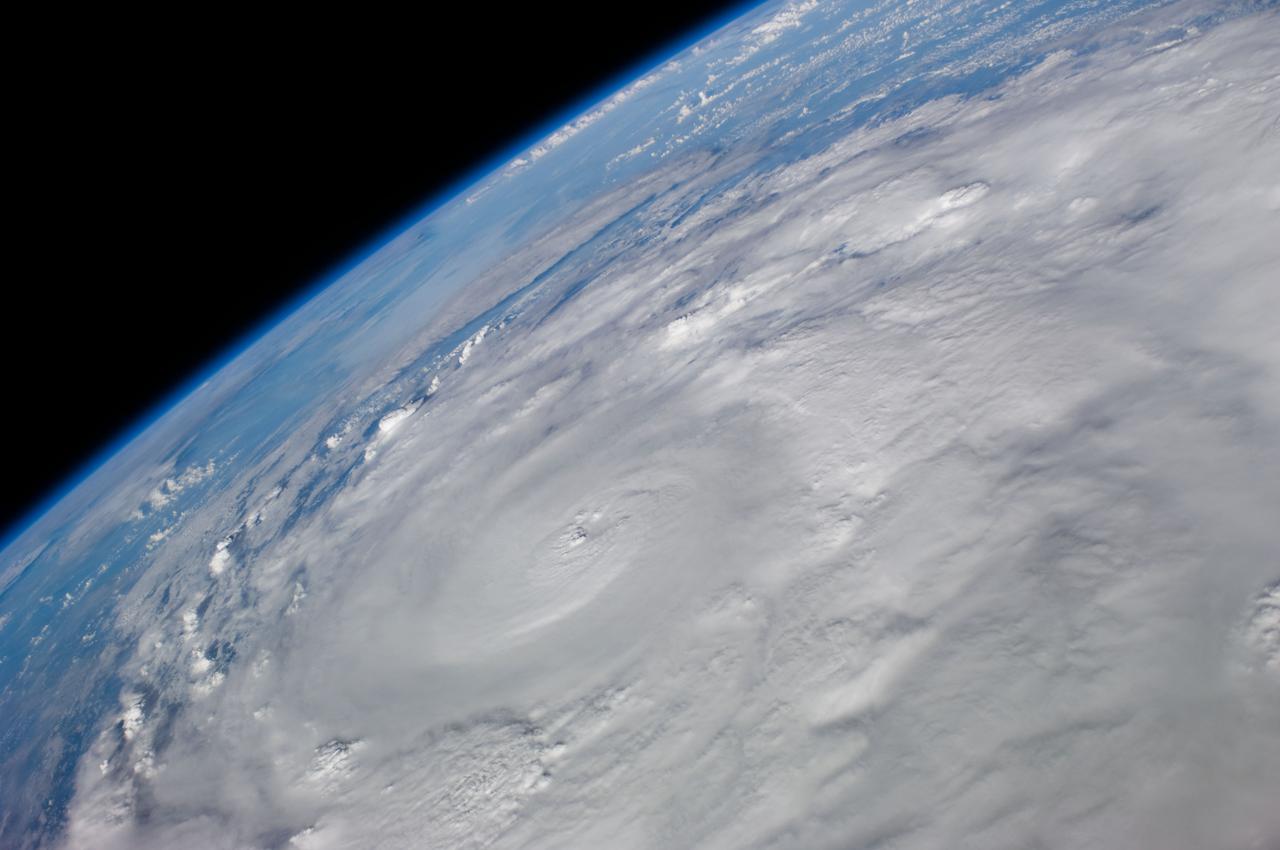
ISS017-E-015718 (9 Sept. 2008) --- Hurricane Ike covers more than half of Cuba in this image, photographed by the crew of ISS-17 aboard the International Space Station from a vantage point of 220 statute miles above Earth. The center of Ike was near 22.4 degrees north latitude and 82.4 degrees west longitude and moving 290 degrees at 11.7 miles per hour. Sustained winds were at 80.6 miles per hour, with gusts to 97.9 miles per hour and were forecast to strengthen as the eye moved back over the warm water in the gulf of Mexico.

Michael Kavaya, of the NASA Langley Research Center, a Principal Investigator for the DAWN experiment, looks over data with Jeffrey Beyon during a flight of the NASA DC-8, Tuesday, Aug. 17, 2010, in the Gulf of Mexico. The DAWN experiment, also known as the Doppler Aerosol Wind Lidar, is one of many experiments supporting the Genesis and Rapid Intensification Processes (GRIP) experiment, a NASA Earth science field experiment in 2010 that is being conducted to better understand how tropical storms form and develop into major hurricanes. Photo Credit: (NASA/Paul E. Alers)

An unidentified researcher looks over the wiring connecting the Airbrorne Precipitation Radar (APR-2) during a flight aboard the NASA DC-8 aircraft, Tuesday, Aug. 17, 2010, over the Gulf of Mexico. Scientists taking part in the Genesis and Rapid Intensification Processes (GRIP) experiment, a NASA Earth science field experiment in 2010 that is being conducted to better understand how tropical storms form and develop into major hurricanes, flew out over a weather pattern Tuesday to begin their research. Photo Credit: (NASA/Paul E. Alers)
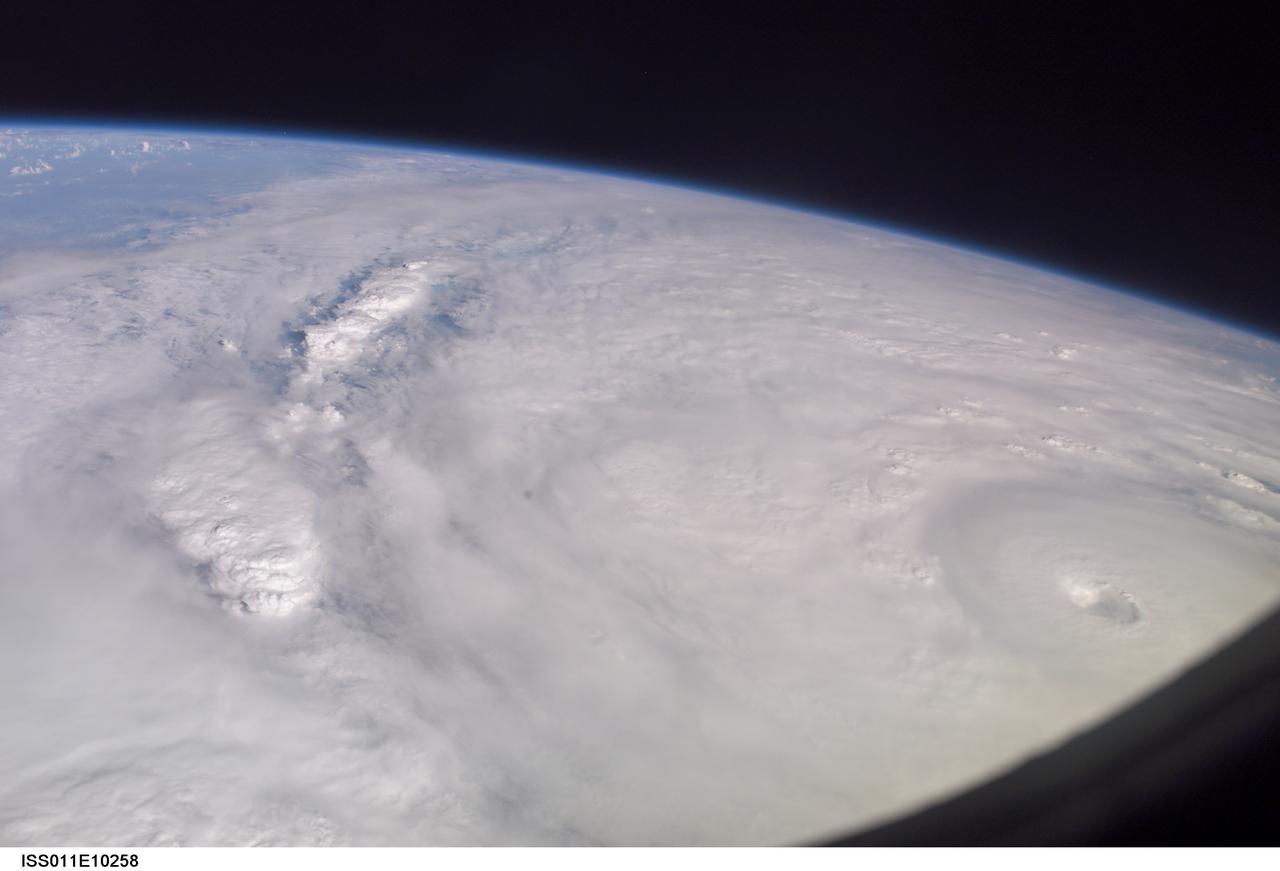
ISS011-E-10258 (9 July 2005) --- This easterly-looking image from the International Space Station shows Hurricane Dennis after the storm had already crossed Cuba and was heading for the northern Gulf of Mexico. Dennis was a Category 3 storm, packing winds of 115 miles per hour, at the time of exposure and located approximately 385 miles southeast of Biloxi, Mississippi or 280 miles south of Panama City, Florida. The ill-defined eye is in the lower right corner. The black triangle in extreme lower right is part of the Space Station's window.
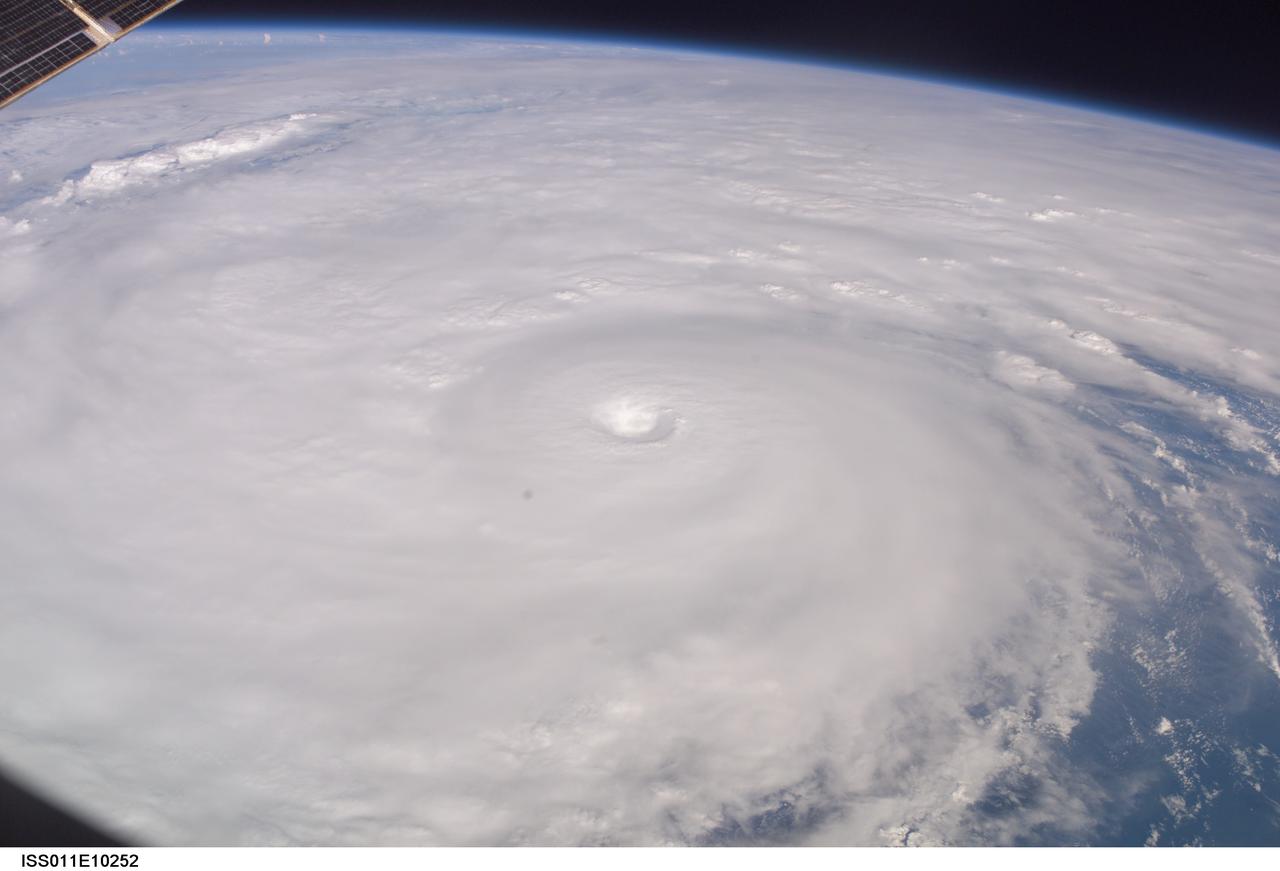
ISS011-E-10252 (9 July 2005) --- This easterly-looking image from the International Space Station shows Hurricane Dennis after the storm had already crossed Cuba and was heading for the northern Gulf of Mexico. Dennis was a Category 3 storm, packing winds of 115 miles per hour, at the time of exposure and located approximately 385 miles southeast of Biloxi, Mississippi or 280 miles south of Panama City, Florida. The image was exposed at 22:06:35 (GMT), July 9, 2005. The storm's eye is at frame center. The black triangle in extreme lower left is part of the Space Station's window.
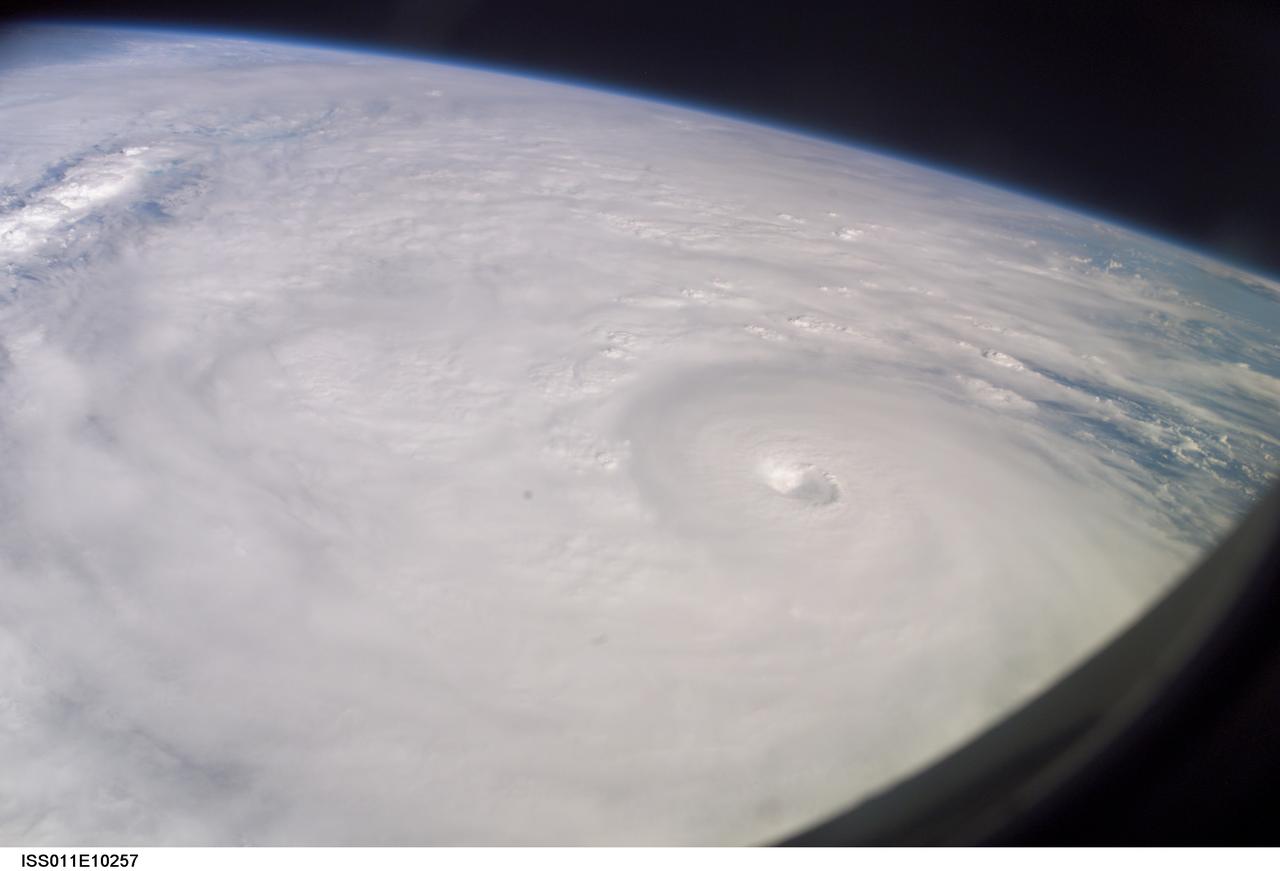
ISS011-E-10257 (9 July 2005) --- This easterly-looking image from the International Space Station shows Hurricane Dennis after the storm had already crossed Cuba and was heading for the northern Gulf of Mexico. Dennis was a Category 3 storm, packing winds of 115 miles per hour, at the time of exposure and located approximately 385 miles southeast of Biloxi, Mississippi or 280 miles south of Panama City, Florida. The image was exposed at 22:07:26 (GMT), July 9, 2005. The storm's eye is just to the right of frame center. The black triangle in extreme lower right is part of the Space Station's window.
NASA image acquired Sept 6, 2010 at 16 :45 UTC Tropical Storm Hermine (10L) in the Gulf of Mexico Satellite: Terra Credit: NASA/GSFC/Jeff Schmaltz/MODIS Land Rapid Response Team To learn more go to: <a href="http://www.nasa.gov/mission_pages/hurricanes/archives/2010/h2010_Hermine.html" rel="nofollow">www.nasa.gov/mission_pages/hurricanes/archives/2010/h2010...</a> <b><a href="http://www.nasa.gov/centers/goddard/home/index.html" rel="nofollow">NASA Goddard Space Flight Center</a></b> is home to the nation's largest organization of combined scientists, engineers and technologists that build spacecraft, instruments and new technology to study the Earth, the sun, our solar system, and the universe. <b>Follow us on <a href="http://twitter.com/NASA_GoddardPix" rel="nofollow">Twitter</a></b> <b>Join us on <a href="http://www.facebook.com/pages/Greenbelt-MD/NASA-Goddard/395013845897?ref=tsd" rel="nofollow">Facebook</a></b>
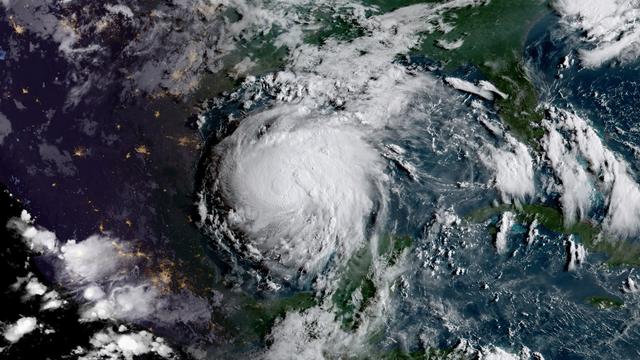
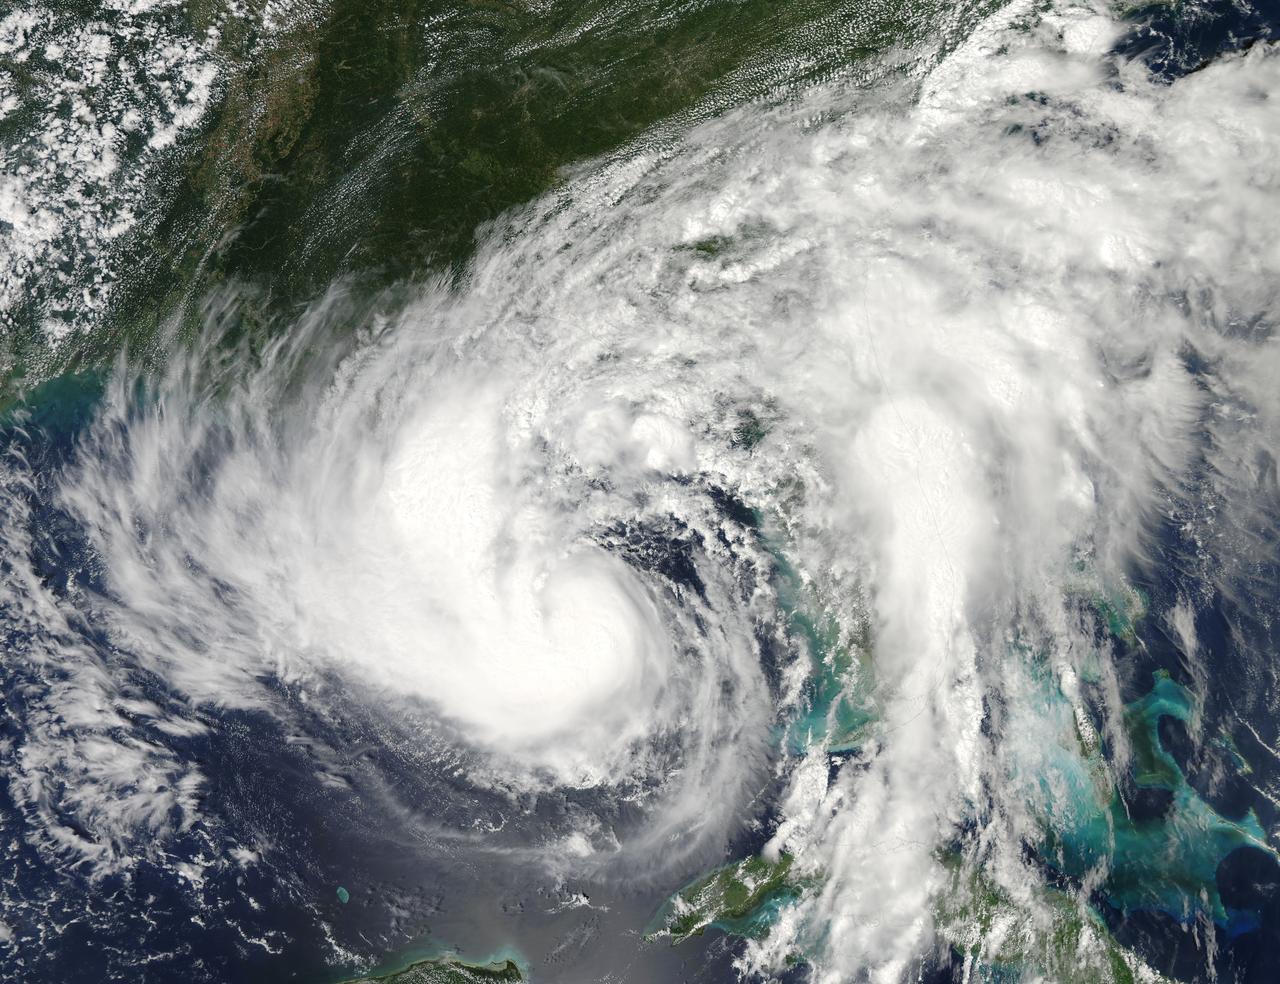
On Aug. 24, the National Hurricane Center noted that Hurricane Harvey was quickly strengthening and is forecast to be a category 3 Hurricane when it approaches the middle Texas coast. In addition, life-threatening storm surge and freshwater flooding expected. On Aug. 24, many warnings and watches were in effect: A Storm Surge Warning is in effect from Port Mansfield to San Luis Pass Texas. A Storm Surge Watch is in effect from south of Port Mansfield Texas to the mouth of the Rio Grande River and from north of San Luis Pass to High Island, Texas. A Hurricane Warning is in effect from Port Mansfield to Matagorda, Texas. A Tropical Storm Warning is in effect from north of Matagorda to High Island, Texas and south of Port Mansfield, Texas to the Mouth of the Rio Grande. A Hurricane Watch is in effect from south of Port Mansfield, Texas to the Mouth of the Rio Grande. A Tropical Storm Watch is in effect from south of the mouth of the Rio Grande to Boca de Catan, Mexico. GOES-16 captured this geocolor image of Tropical Storm Harvey in the Gulf of Mexico this morning, August 24, 2017. Geocolor imagery enhancement shown here displays geostationary satellite data in different ways depending on whether it is day or night. This image, captured as daylight moves into the area, offers a blend of both, with nighttime features on the left side of the image and daytime on the right. Credit: NOAA/NASA GOES Project
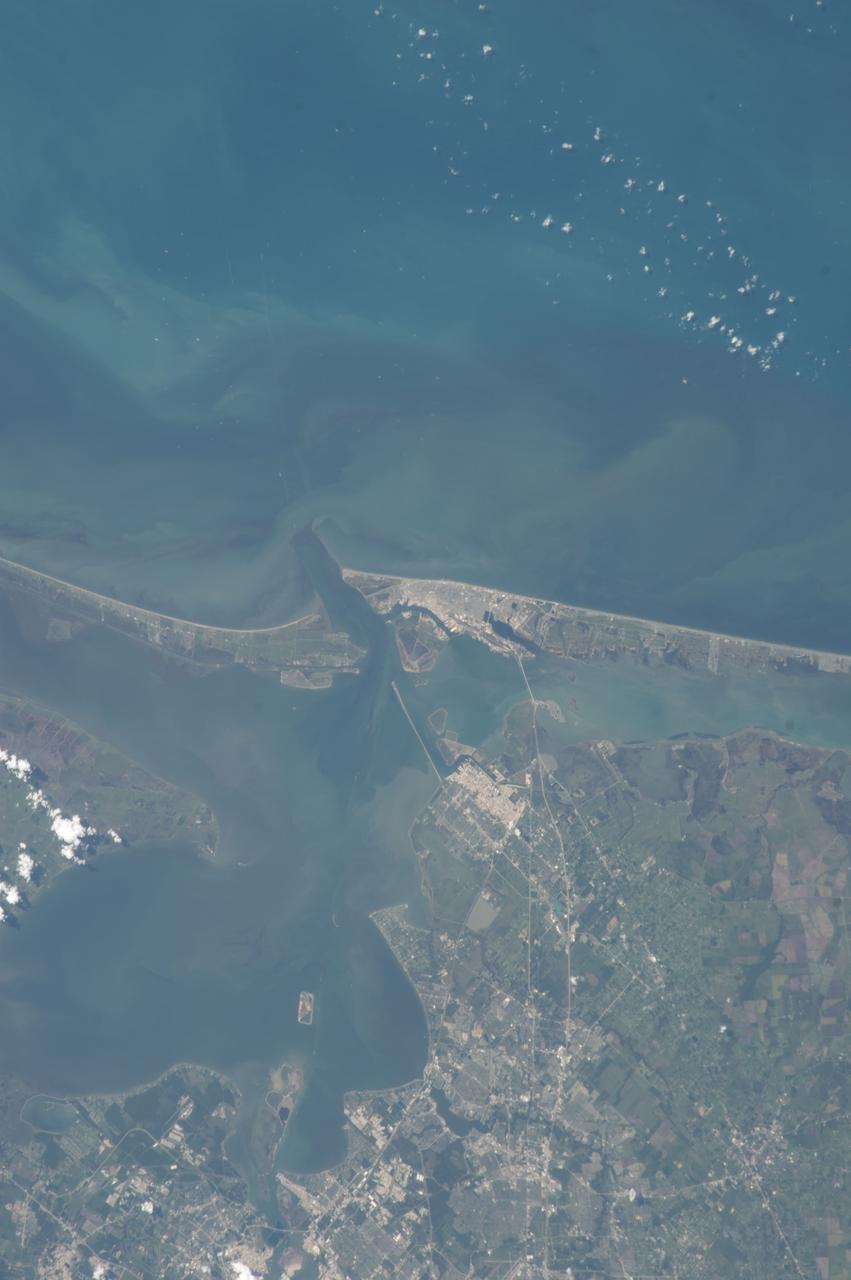
ISS036-E-037747 (28 Aug. 2013) --- One of the Expedition 36 crew members aboard the International Space Station on Aug. 28 photographed this vertical image that shows much of Galveston County and a small portion of southeast Harris County, Texas. Gulf of Mexico waters take up the top half of the picture. Galveston Island runs from just left of center through center right of the image, and the Bolivar Peninsula, highly impacted by Hurricane Ike five years ago, is the land mass at left center. Galveston Bay takes up much of the lower left quadrant of the pictured area. The NASA Johnson Space Center, the normal work place for NASA astronauts Chris Cassidy and Karen Nyberg, currently onboard the orbital complex, is in the bottom portion of the frame.
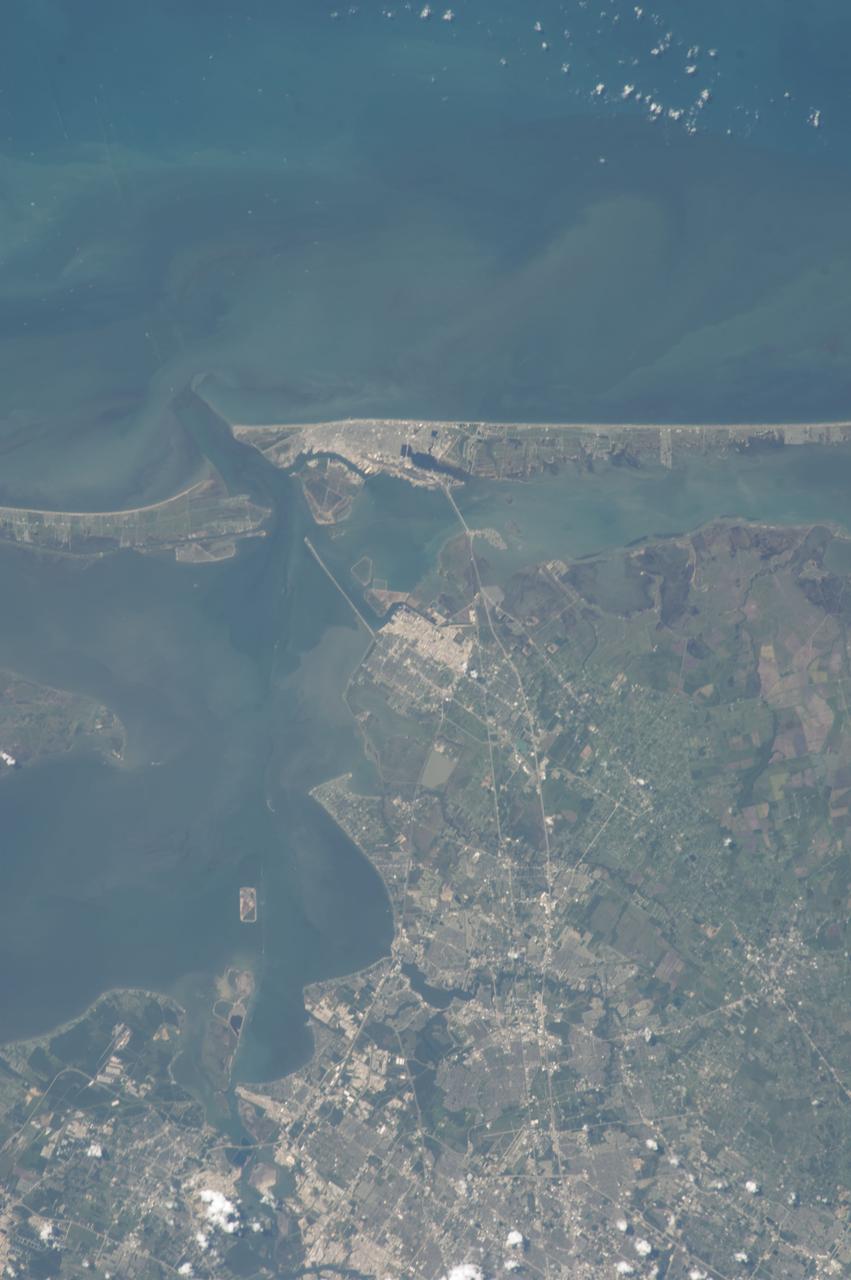
ISS036-E-037751 (28 Aug. 2013) --- One of the Expedition 36 crew members aboard the International Space Station on Aug. 28 photographed this vertical image that shows much of Galveston County and a small portion of southeast Harris County, Texas. Gulf of Mexico waters take up the top one third of the picture. Galveston Island runs from just left of top center through top right of the image, and the Bolivar Peninsula, highly impacted by Hurricane Ike five years ago, is the land mass at top left. Galveston Bay is on the left side of the lower part of the frame. The NASA Johnson Space Center, the normal work place for NASA astronauts Chris Cassidy and Karen Nyberg, currently onboard the orbital complex, is in the bottom portion of the frame.
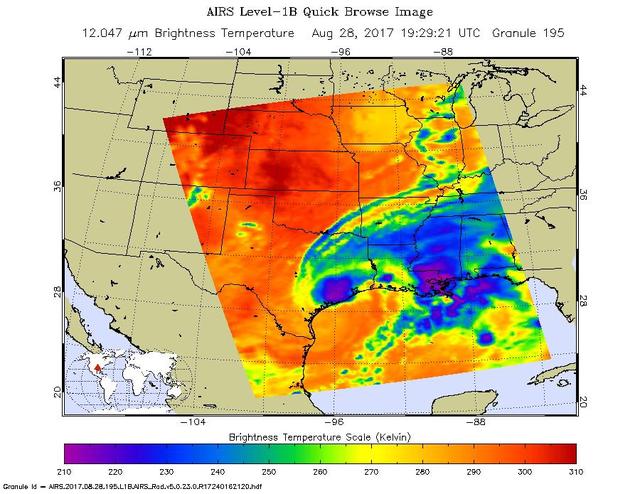
The latest infrared image from NASA's Atmospheric Infrared Sounder (AIRS) instrument aboard NASA's Aqua satellite illustrates the growing flood threat from now Tropical Storm Harvey. In the false-color image, acquired at 2:29 p.m. CDT (19:29 UTC) on Aug. 28, 2017, a large area of dark blue and purple centered along the southeastern Texas coast denotes the coldest cloud top temperatures and strongest thunderstorms. A second area of intense precipitation is visible over southeastern Louisiana. Harvey has reemerged over the Gulf of Mexico, but the National Hurricane Center forecasts only a small amount of strengthening before the storm moves slowly north and inland again. https://photojournal.jpl.nasa.gov/catalog/PIA21885

An oil slick in the Gulf of Mexico following Hurricane Ida – a high-end Category 4 when it made landfall near Port Fourchon, Louisiana, on Aug. 29, 2021 – appears as a green trail in the inset false-color graphic provided by NASA's Delta-X project, while the surrounding seawater appears orange. The National Oceanic and Atmospheric Administration (NOAA) regularly monitors U.S. coastal waters for potential spills and noticed slicks that appeared just off the coast after the hurricane. They were able to use this information from Delta-X to corroborate other data they had about oil slicks in the area (satellite image in the second inset picture). The blue-green swath crossing from the Gulf of Mexico over the Louisiana coast denotes the flight path of the Delta-X radar instrument on Sept. 1, just before 11:30 a.m. CDT. Charged with studying the Mississippi River Delta, Delta-X was gearing up to collect data on Louisiana's coastal wetlands when Hurricane Ida barreled ashore in late August. The storm damaged buildings and infrastructure alike, resulting in power outages, flooding, and oil slicks in the Gulf of Mexico. Oil tends to smooth out the bumps on the ocean's surface, which results in a distinct radar signal that the Delta-X mission was able to pick out of their data. Delta-X added flight paths to their planned schedule – with the support of NASA's Applied Science Disaster Program – in order to collect information over the gulf in areas of interest to NOAA. Delta-X is studying two wetlands – the Atchafalaya and Terrebonne Basins – by land, boat, and air to quantify water and sediment flow as well as vegetation growth. While the Atchafalaya Basin has been gaining land through sediment accumulation, Terrebonne Basin, which is right next to the Atchafalaya, has been rapidly losing land. The data collected by the project will be applied to models used to forecast which areas of the delta are likely to gain or lose land under various sea level rise, river flow, and watershed management scenarios. The mission uses several instruments to collect its data. Affixed to the bottom of a Gulfstream-III airplane, one of those instruments, the all-weather Uninhabited Aerial Vehicle Synthetic Aperture Radar (UAVSAR), bounces radar signals off of Earth's surface, forming a kind of image of a particular area. Repeated images of the same regions, captured at different times, enable researchers to detect changes in those areas, such as fluctuating water levels beneath the vegetation as the tides move in and out of these wetlands. In addition to radar measurements, teams from Caltech, Louisiana State University, Florida International University, and other collaborating institutions gather water and vegetation samples – among other data – by boat, other airborne sensors, and from instruments on the ground. Funded by NASA's Earth Venture Suborbital (EVS-3) program, Delta-X is managed by the agency's Jet Propulsion Laboratory. Caltech in Pasadena, California, manages JPL for NASA. Fall 2021 was Delta-X's last scheduled field campaign, although the five-year mission will run through the end of 2023. https://photojournal.jpl.nasa.gov/catalog/PIA24540
The MODIS instrument on NASA's Aqua satellite captured this visible image of Tropical Storm Isaac on Aug. 27 at 3:00 p.m. EDT is it was moving northwest through the Gulf of Mexico. Issac's large reach is seen by its eastern cloud cover over the entire state of Florida. To read more go to: <a href="http://www.nasa.gov/mission_pages/hurricanes/archives/2012/h2012_Isaac.html" rel="nofollow">www.nasa.gov/mission_pages/hurricanes/archives/2012/h2012...</a> Credit: NASA Goddard MODIS Rapid Response Team <b><a href="http://www.nasa.gov/audience/formedia/features/MP_Photo_Guidelines.html" rel="nofollow">NASA image use policy.</a></b> <b><a href="http://www.nasa.gov/centers/goddard/home/index.html" rel="nofollow">NASA Goddard Space Flight Center</a></b> enables NASA’s mission through four scientific endeavors: Earth Science, Heliophysics, Solar System Exploration, and Astrophysics. Goddard plays a leading role in NASA’s accomplishments by contributing compelling scientific knowledge to advance the Agency’s mission. <b>Follow us on <a href="http://twitter.com/NASA_GoddardPix" rel="nofollow">Twitter</a></b> <b>Like us on <a href="http://www.facebook.com/pages/Greenbelt-MD/NASA-Goddard/395013845897?ref=tsd" rel="nofollow">Facebook</a></b> <b>Find us on <a href="http://instagrid.me/nasagoddard/?vm=grid" rel="nofollow">Instagram</a></b>
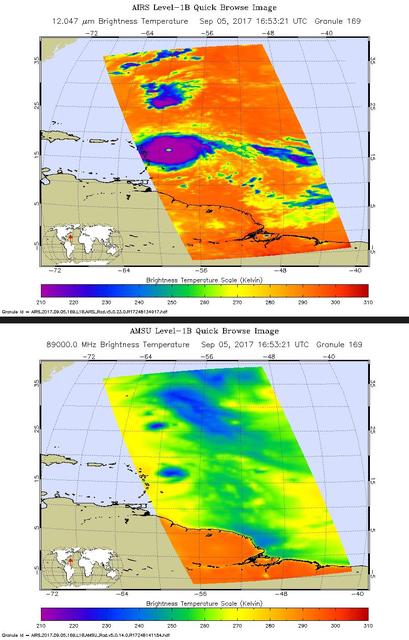
Hurricane Irma is the strongest hurricane ever recorded outside the Caribbean Sea and Gulf of Mexico. These two images from the Atmospheric Infrared Sounder (AIRS) instrument aboard NASA's Aqua satellite show what Hurricane Irma looked like when Aqua passed overhead just before 1 p.m. local time (10 a.m. PDT) on Sept. 5, 2017. Forecasts at the National Hurricane Center have Irma passing near the major islands to its west before turning northward near Florida this weekend. The first image (top) is an infrared snapshot from AIRS (see Figure 1 for larger image). In orange and red areas, the ocean surface shines through, while blue and purple areas represent cold, high clouds that obscure what lies below. Typical of well-developed hurricanes, Irma is nearly circular with a well-defined eye at its center. The eye is about 25 miles (40 kilometers) in diameter. Careful scrutiny shows a red pixel in the center of the eye, which means that AIRS achieved a bulls-eye with one of its "looks" and was able to see to the ocean between the dense clouds in the eye wall. The second image (bottom) shows the view through AIRS' microwave-colored "lenses" (see Figure 2 for larger image). Here the ocean surface looks yellow, while green represents various degrees of cloudiness. Blue shows areas where it is raining heavily. The eye is not apparent in this image because the "pixel size" of the microwave sounder, about 30 miles (50 kilometers), is larger than the eye and therefore cannot "thread the needle." The infrared sounder, on the other hand, has a pixel size of only 10 miles (16.5 kilometers) and can distinguish the small eye. https://photojournal.jpl.nasa.gov/catalog/PIA21941
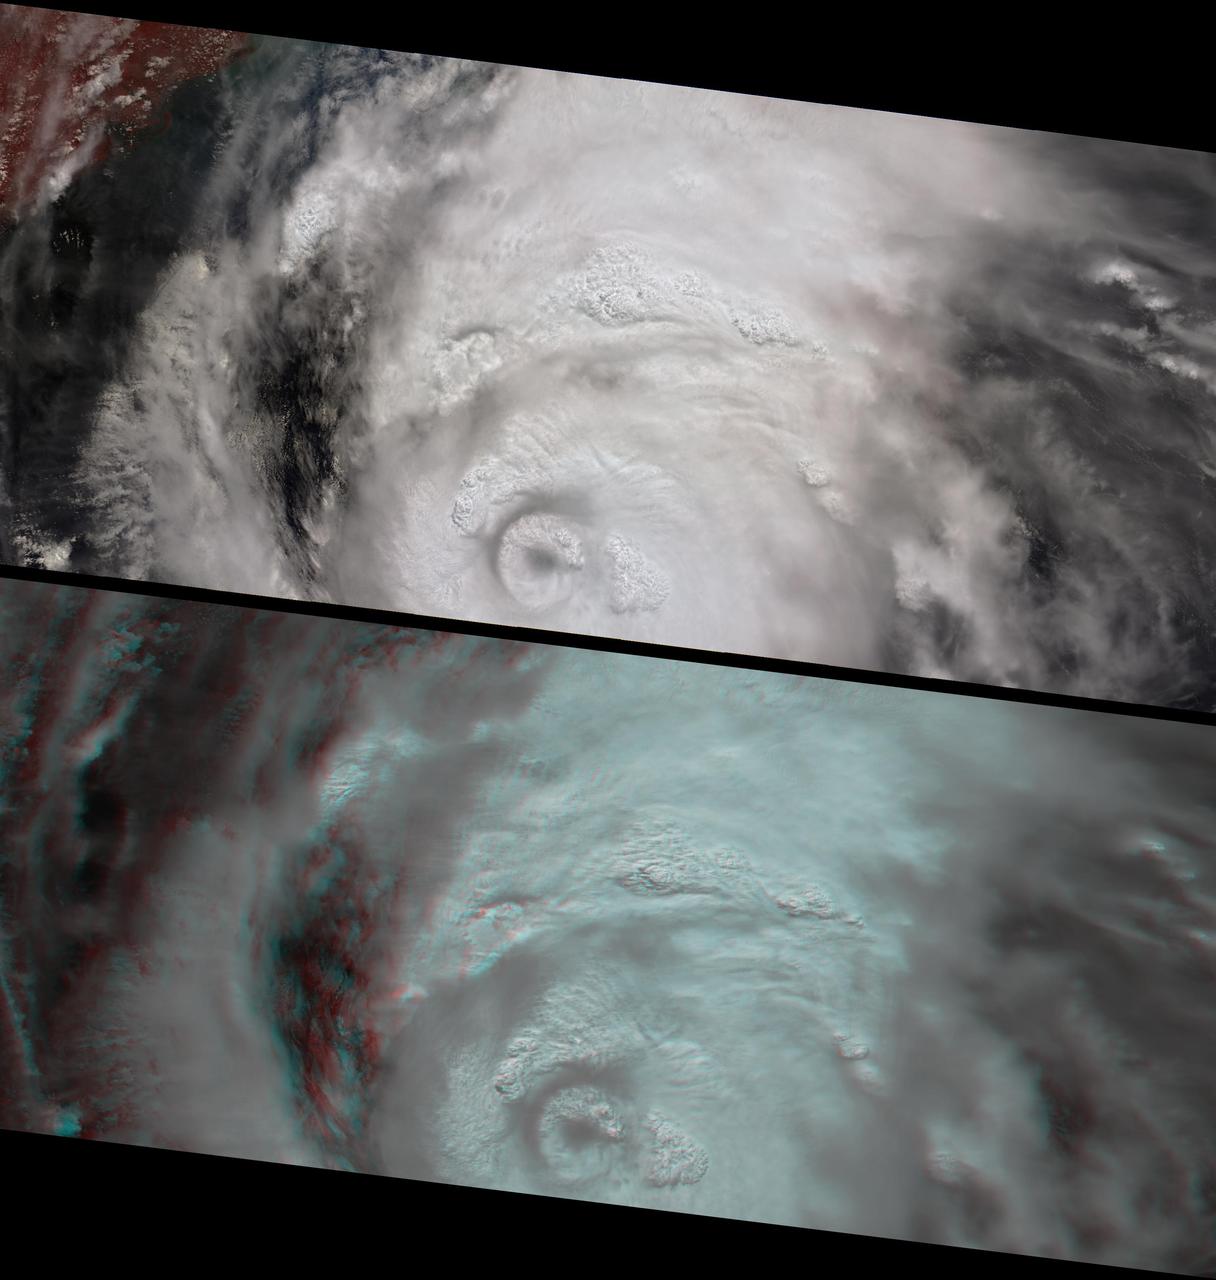
On the afternoon of Sept. 1, 2016, Tropical Storm Hermine strengthened into a Category 1 hurricane as it approached the coast of Florida. Hermine began life as Tropical Depression Nine, originating off the coast of Cuba on Aug. 28. After heading northwest into the Gulf of Mexico, it took a right turn toward Florida and on Wednesday, Aug. 31, was upgraded to a tropical storm before strengthening to a hurricane a day later. Winds are currently sustained near 75 miles (121 kilometers) per hour, and the storm is expected to make landfall tonight or early tomorrow. Florida Governor Rick Scott has declared a state of emergency in 51 counties, while Georgia Governor Nathan Deal has done the same for 56 counties in his state. Localized flooding is already occurring in some areas of Florida, which has not had a direct landfall by a hurricane in 11 years. After moving across Florida and Georgia, the storm is currently forecast to continue northward along the coast of the Eastern seaboard. On Sept. 1, at 12:30 p.m. EDT, the Multi-angle Imaging SpectroRadiometer (MISR) instrument aboard NASA's Terra spacecraft passed over the area. This natural-color image from MISR's vertical-pointing camera shows the large, loosely organized hurricane. At the time, the center of the storm was located about 200 miles (325 kilometers) to the west of Sarasota on the Florida coast. The image is 235 miles (378 kilometers) in width. Also included is a 3D stereo anaglyph, made by combining data from MISR's vertical-pointing and 46-degree forward-pointing camera. The image has been rotated so that north is to the left in order to enable stereo viewing. With the aid of red-blue glasses (with the red lens over the left eye), it is possible to observe the storm in three dimensions. Note the towering central thunderstorms around the eye in comparison to the low clouds visible within it. These data were acquired during Terra orbit 88865. http://photojournal.jpl.nasa.gov/catalog/PIA20898
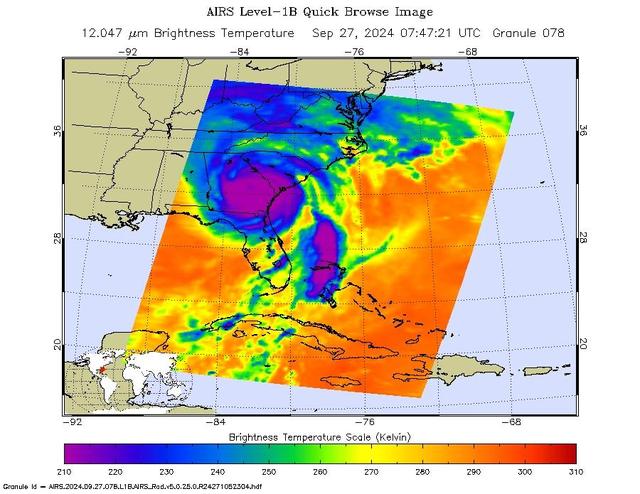
NASA's Atmospheric Infrared Sounder (AIRS) captured an infrared image of Hurricane Helene on Friday, Sept. 27, 2024, at 3:47 a.m. local time, nearly five hours after it made landfall on the Florida coast. One of the largest storms to develop in the Gulf of Mexico in the last century, Helene made landfall as a Category 4 hurricane in the Big Bend area on Sept. 26, at about 11:10 p.m. In the infrared images, the large purple areas indicate very cold clouds carried high into the atmosphere by deep thunderstorms and associated with heavy rainfall. Warmer areas with shallower rain clouds are shown in blue and green. The orange and red areas represent mostly cloud-free air. The eye of the hurricane can be seen as a small blue dot in the middle of the large purple patch. AIRS, in conjunction with the Advanced Microwave Sounding Unit (AMSU), senses emitted infrared and microwave radiation from Earth to provide a 3D look at Earth's weather and climate. Working in tandem, the two instruments make simultaneous observations down to Earth's surface. With more than 2,000 channels sensing different regions of the atmosphere, the system creates a global, 3D map of atmospheric temperature and humidity, cloud amounts and heights, greenhouse gas concentrations and many other atmospheric phenomena. Launched into Earth orbit in 2002, the AIRS and AMSU instruments fly onboard NASA's Aqua spacecraft and are managed by NASA's Jet Propulsion Laboratory in Southern California under contract to NASA. JPL is a division of the Caltech. https://photojournal.jpl.nasa.gov/catalog/PIA26413
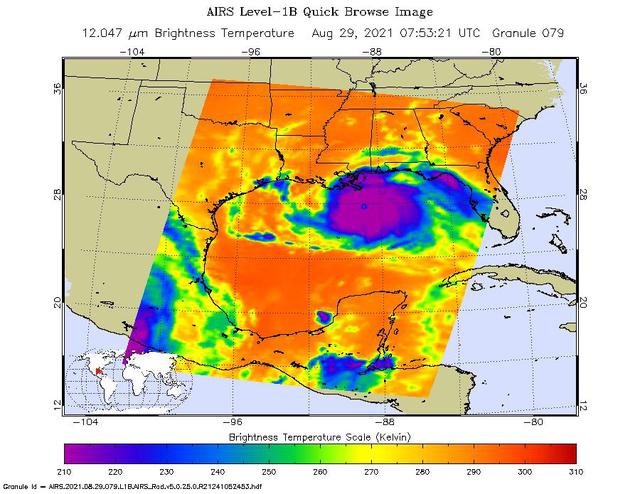
NASA's Atmospheric Infrared Sounder (AIRS), aboard the Aqua satellite, caught views of Hurricane Ida as the high-end Category 4 storm swept ashore around noon local time on Aug. 29, 2021, near Port Fourchon, Louisiana. One snapshot showed the hurricane around 3 a.m. that day while it was still over the Gulf of Mexico. The second view (Figure 1) caught the storm around 1:45 p.m. local time. In the infrared AIRS imagery, purple areas indicate very cold clouds carried high into the atmosphere by towering thunderstorms. These regions are also associated with heavy rainfall. Blue and green indicate warmer areas with shallower rain clouds. The orange and red areas represent mostly cloud-free air. The eye of the hurricane is seen just over the Louisiana coast as a small blue-green area in the middle of the large patch of purple in the after-landfall image. AIRS, in conjunction with the Advanced Microwave Sounding Unit (AMSU), senses emitted infrared and microwave radiation from Earth to provide a three-dimensional look at the planet's weather and climate. Working in tandem, the two instruments make simultaneous observations down to Earth's surface. With more than 2,000 channels sensing different regions of the atmosphere, the system creates a global, three-dimensional map of atmospheric temperature and humidity, cloud amounts and heights, greenhouse gas concentrations, and many other atmospheric phenomena. Launched into Earth orbit in 2002 aboard NASA's Aqua spacecraft, the AIRS and AMSU instruments are managed by NASA's Jet Propulsion Laboratory in Southern California, under contract to NASA. JPL is a division of Caltech. https://photojournal.jpl.nasa.gov/catalog/PIA24538
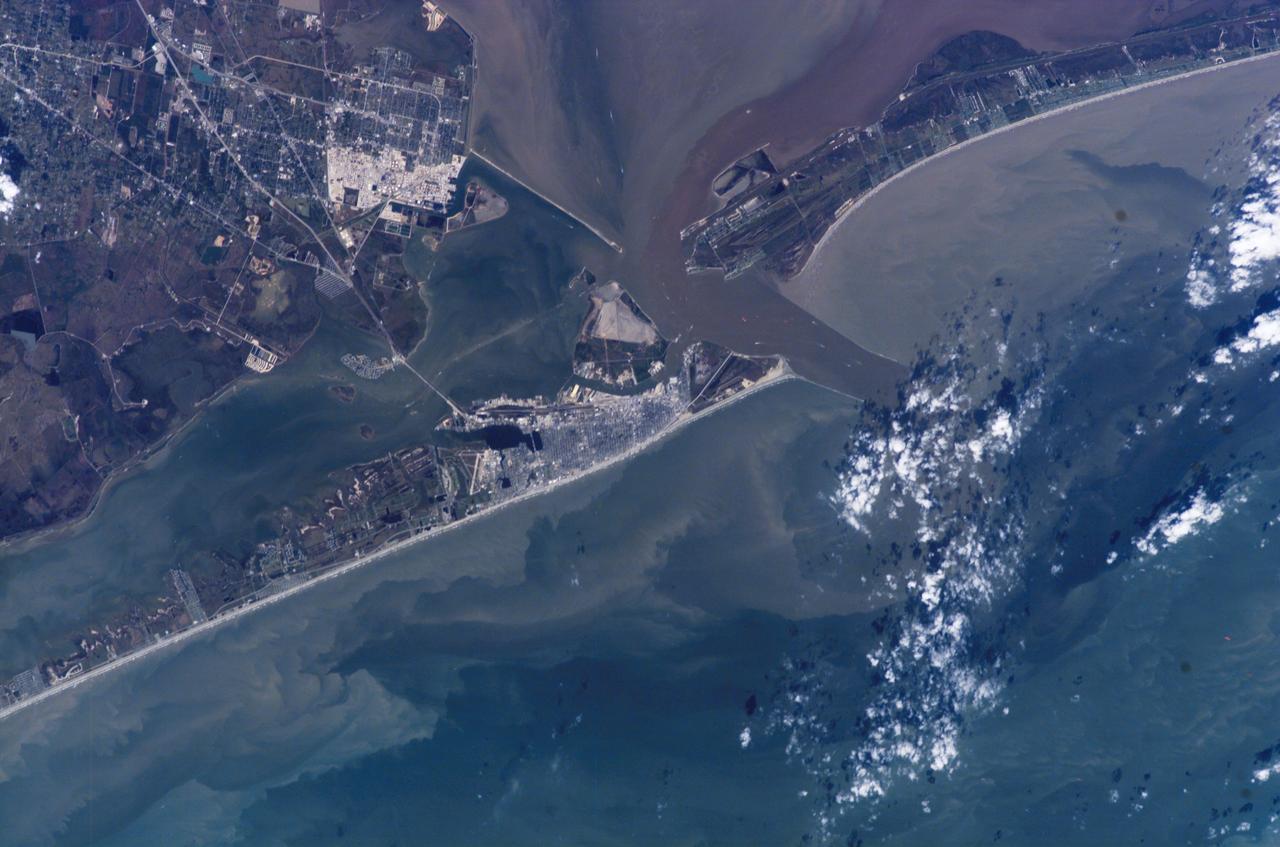
ISS014-E-07258 (4 Nov. 2006) --- Galveston, Texas is featured in this image photographed by an Expedition 14 crewmember on the International Space Station (ISS). Mexico established a port of entry (known as Galveston) in 1825, and following the Texas Revolution it was the capital of the Republic of Texas during 1836. The modern-day city of Galveston was incorporated in 1839, and became the major trading seaport of Texas during the latter half of the 19th century. The city was largely destroyed in early September of 1900 by a powerful hurricane; this, coupled with construction of the Houston Ship Channel and discovery of oil in eastern Texas shifted the center of trade northwest to Houston. Many human footprints are easily observed from the vantage point of low Earth orbit. The eastern half of Galveston Island is dominated by the city of Galveston (gray-white region at center). A large seawall along the Gulf of Mexico (southern coastline of Galveston Island) protects most of the city. To the west of Galveston, coastal wetlands are largely submerged by regional subsidence--a result of ground water withdrawal by the petrochemical industry of Houston and Texas City. The entrance to Galveston Bay and the Houston Ship Channel is located between Galveston Island and the Bolivar Peninsula (upper right). Numerous ship wakes are visible along the Houston Ship Channel. Other visible features of the entrance to Galveston Bay include the five-mile long Texas City Dike, a structure that protects the Texas City channel and includes a fishing pier that extends 600 feet beyond the end of the Dike. Extensive petroleum processing facilities are located to the west of the Dike in Texas City. The Intracoastal Waterway runs through western Galveston Bay; new subdivisions built on dredge spoils are visible along the northern boundary of the Waterway. Geologists studying the ISS collection of down linked still imagery observe that complex estuarine sediment patterns are visible in this image. Dark brown to tan waters adjacent to the Bolivar Peninsula and Texas City Dike reflect increased sediment loads following heavy rains in mid-to-late October, coupled with northerly winds moving Bay water southwards. Turbidity currents to both the northwest and southeast of Galveston Island produce a more chaotic pattern of sediment-laden (light green to tan) and relatively sediment-free (dark green) water leading into the dark green Gulf of Mexico (lower right).
NASA-NOAA's Suomi NPP satellite flew over Hurricane Blanca in the Eastern Pacific Ocean and gathered infrared data on the storm that was false-colored to show locations of the strongest thunderstorms within the storm. The Visible Infrared Imaging Radiometer Suite or VIIRS instrument aboard the satellite gathered infrared data of the storm that was made into an image at the University of Wisconsin-Madison. The image was false-colored to show temperature. Coldest cloud top temperatures indicate higher, stronger, thunderstorms within a tropical cyclone. Those are typically the strongest storms with potential for heavy rainfall. VIIRS is a scanning radiometer that collects visible and infrared imagery and "radiometric" measurements. Basically it means that VIIRS data is used to measure cloud and aerosol properties, ocean color, sea and land surface temperature, ice motion and temperature, fires, and Earth's albedo (reflected light). The VIIRS image from June 5 at 8:11 UTC (4:11 a.m. EDT) showed two areas of coldest cloud top temperatures and strongest storms were west-southwest and east-northeast of the center of Blanca's circulation center. On June 5 at 5 a.m. EDT (0900 UTC) Blanca's maximum sustained winds were near 105 mph (165 kph) with higher gusts. The National Hurricane Center (NHC) forecast expects some strengthening during the next day or so. Weakening is forecast to begin by late Saturday. At that time, NHC placed the center of Hurricane Blanca near latitude 14.3 North, longitude 106.2 West. That puts the center about 350 miles (560 km) south-southwest of Manzanillo, Mexico and about 640 miles (1,030 km) south-southeast of Cabo San Lucas, Mexico. The estimated minimum central pressure is 968 millibars (28.59 inches). Blanca is moving toward the northwest near 10 mph (17 kph). A northwestward to north-northwestward motion at a similar forward speed is expected to continue through Saturday night. Blanca has been stirring up surf along the coast of southwestern Mexico and will reach the Pacific coast of the Baja California peninsula and the southern Gulf of California later today, June 5. These swells are likely to cause life-threatening surf and rip current conditions. On the forecast track, the center of Blanca will approach the southern Baja California peninsula on Sunday. NHC cautions that "Interests in the southern Baja California peninsula should monitor the progress of Blanca. A tropical storm or hurricane watch will likely be required for a portion of Baja California Sur later today." The NHC forecast track shows Blanca making landfall in the southeastern tip of Baja California on Sunday, June 7 and tracking north-northeast along the Baja California peninsula, for several days following. Image credit: Credits: NASA/NOAA/UW-CIMSS <b><a href="http://www.nasa.gov/audience/formedia/features/MP_Photo_Guidelines.html" rel="nofollow">NASA image use policy.</a></b> <b><a href="http://www.nasa.gov/centers/goddard/home/index.html" rel="nofollow">NASA Goddard Space Flight Center</a></b> enables NASA’s mission through four scientific endeavors: Earth Science, Heliophysics, Solar System Exploration, and Astrophysics. Goddard plays a leading role in NASA’s accomplishments by contributing compelling scientific knowledge to advance the Agency’s mission. <b>Follow us on <a href="http://twitter.com/NASAGoddardPix" rel="nofollow">Twitter</a></b> <b>Like us on <a href="http://www.facebook.com/pages/Greenbelt-MD/NASA-Goddard/395013845897?ref=tsd" rel="nofollow">Facebook</a></b> <b>Find us on <a href="http://instagrid.me/nasagoddard/?vm=grid" rel="nofollow">Instagram</a></b>
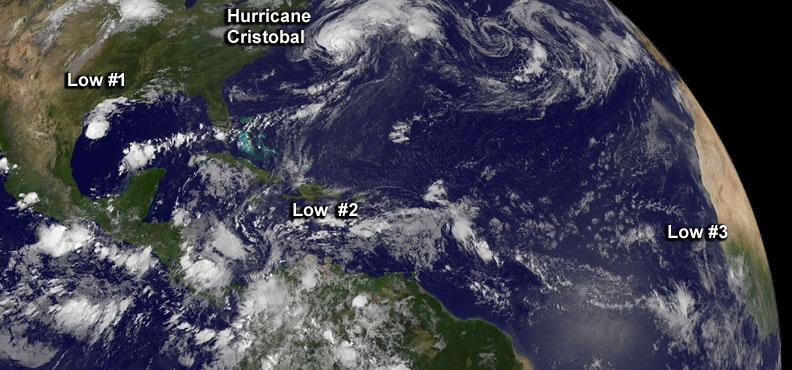
Although there's only one formed tropical cyclone in the Atlantic: Hurricane Cristobal, there are three other developing areas of low pressure and all were captured in this panoramic image from NOAA's GOES-East satellite today at 8 a.m. EDT. Cristobal is a hurricane located east of the U.S. East coast and is forecast to move up toward eastern Canada tonight (and stay off-shore). The image was made at NASA's GOES Project at NASA's Goddard Space Flight Center in Greenbelt, Maryland. Low #1. A weak area of low pressure near the coast of South Texas is producing disorganized showers and thunderstorms. Significant development of this system is unlikely before it moves inland over South Texas and northern Mexico today. It has a ten percent chance of development into a tropical depression in the next 2 days. Low #2. A tropical wave located over the eastern Caribbean Sea continues to produce disorganized cloudiness and showers. Upper-level winds are expected to remain unfavorable for development during the next couple of days while the system moves across the eastern and central Caribbean Sea. However, environmental conditions could become conducive for some development when the system moves over the northwestern Caribbean Sea on Sunday and into the southwestern Gulf of Mexico early next week. It has a near zero chance to develop in the next 2 days. Low #3. A tropical wave is forecast to move off the west coast of Africa on Friday. Environmental conditions could be conducive for some gradual development of this system while it moves westward at 10 to 15 mph across the eastern Atlantic early next week. This has a near zero chance of development in the next two days. <b><a href="http://www.nasa.gov/audience/formedia/features/MP_Photo_Guidelines.html" rel="nofollow">NASA image use policy.</a></b> <b><a href="http://www.nasa.gov/centers/goddard/home/index.html" rel="nofollow">NASA Goddard Space Flight Center</a></b> enables NASA’s mission through four scientific endeavors: Earth Science, Heliophysics, Solar System Exploration, and Astrophysics. Goddard plays a leading role in NASA’s accomplishments by contributing compelling scientific knowledge to advance the Agency’s mission. <b>Follow us on <a href="http://twitter.com/NASAGoddardPix" rel="nofollow">Twitter</a></b> <b>Like us on <a href="http://www.facebook.com/pages/Greenbelt-MD/NASA-Goddard/395013845897?ref=tsd" rel="nofollow">Facebook</a></b> <b>Find us on <a href="http://instagram.com/nasagoddard?vm=grid" rel="nofollow">Instagram</a></b>
Although there's only one formed tropical cyclone in the Atlantic: Hurricane Cristobal, there are three other developing areas of low pressure and all were captured in this panoramic image from NOAA's GOES-East satellite today at 8 a.m. EDT. Cristobal is a hurricane located east of the U.S. East coast and is forecast to move up toward eastern Canada tonight (and stay off-shore). The image was made at NASA's GOES Project at NASA's Goddard Space Flight Center in Greenbelt, Maryland. Low #1. A weak area of low pressure near the coast of South Texas is producing disorganized showers and thunderstorms. Significant development of this system is unlikely before it moves inland over South Texas and northern Mexico today. It has a ten percent chance of development into a tropical depression in the next 2 days. Low #2. A tropical wave located over the eastern Caribbean Sea continues to produce disorganized cloudiness and showers. Upper-level winds are expected to remain unfavorable for development during the next couple of days while the system moves across the eastern and central Caribbean Sea. However, environmental conditions could become conducive for some development when the system moves over the northwestern Caribbean Sea on Sunday and into the southwestern Gulf of Mexico early next week. It has a near zero chance to develop in the next 2 days. Low #3. A tropical wave is forecast to move off the west coast of Africa on Friday. Environmental conditions could be conducive for some gradual development of this system while it moves westward at 10 to 15 mph across the eastern Atlantic early next week. This has a near zero chance of development in the next two days. <b><a href="http://www.nasa.gov/audience/formedia/features/MP_Photo_Guidelines.html" rel="nofollow">NASA image use policy.</a></b> <b><a href="http://www.nasa.gov/centers/goddard/home/index.html" rel="nofollow">NASA Goddard Space Flight Center</a></b> enables NASA’s mission through four scientific endeavors: Earth Science, Heliophysics, Solar System Exploration, and Astrophysics. Goddard plays a leading role in NASA’s accomplishments by contributing compelling scientific knowledge to advance the Agency’s mission. <b>Follow us on <a href="http://twitter.com/NASAGoddardPix" rel="nofollow">Twitter</a></b> <b>Like us on <a href="http://www.facebook.com/pages/Greenbelt-MD/NASA-Goddard/395013845897?ref=tsd" rel="nofollow">Facebook</a></b> <b>Find us on <a href="http://instagram.com/nasagoddard?vm=grid" rel="nofollow">Instagram</a></b>
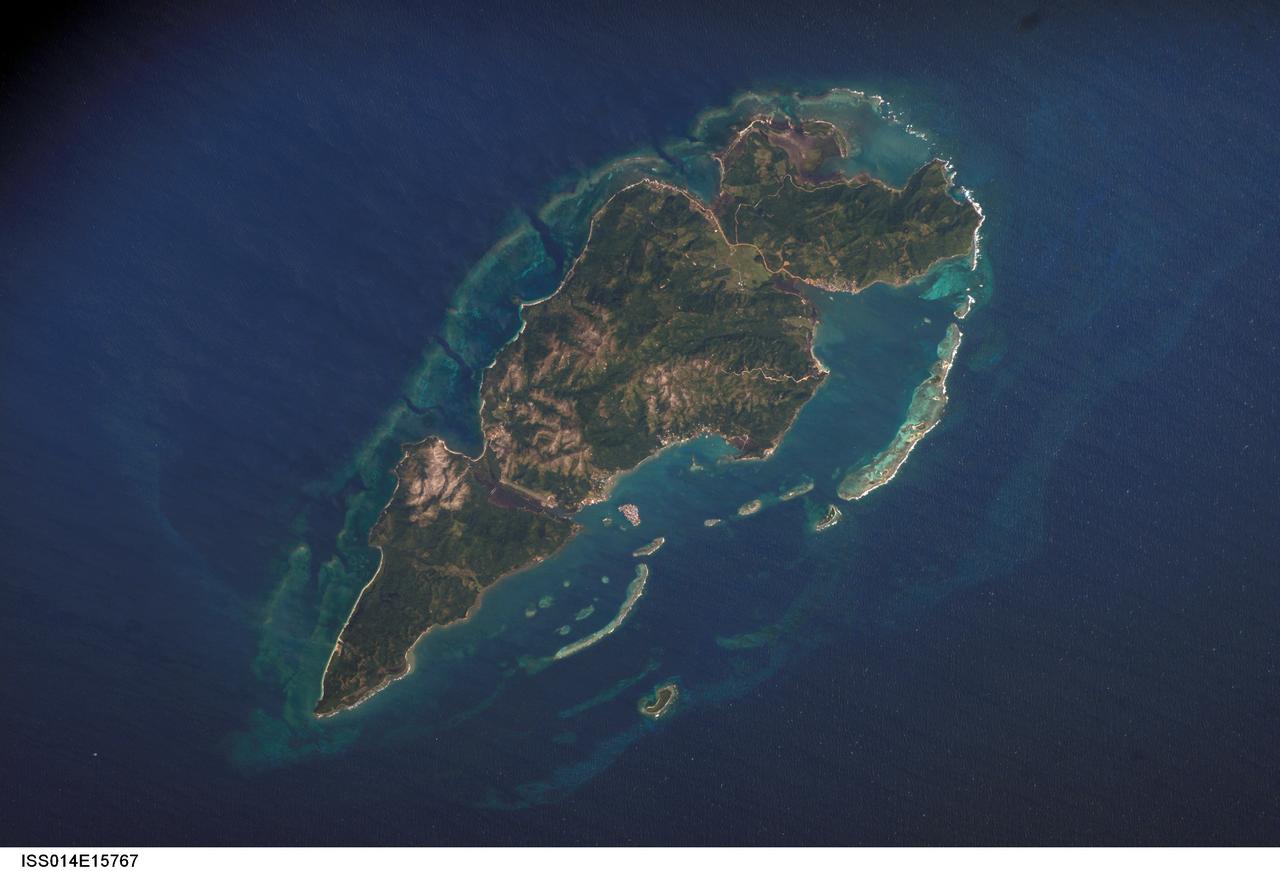
ISS014-E-15767 (1 March 2007) --- Guanaja Island, Honduras is featured in this image photographed by an Expedition 14 crewmember on the International Space Station. Guanaja Island is located along the southwestern margin of the Gulf of Mexico, approximately 60 kilometers north of mainland Honduras. The island is situated near the western edge of the Cayman Ridge, a topographic feature comprised of rock types indicative of ancient volcanic islands, sedimentary layers, and ocean crust. The Ridge formed as a result of tectonic interactions between the North American, South American, and Caribbean Plates. Guanaja and the nearby islands of Roatan and Utila (not shown) comprise the only portions of the western Cayman Ridge currently exposed above water. The island is also notable for its largely undeveloped character -- the exception being highly concentrated development on Bonacca Cay, a small island (roughly 0.5 kilometers by 0.3 kilometers) located along the southeastern coastline of the main island. The main island has little in the way of roads or other infrastructure -- a canal is the major means of traversing the island - making it an attractive destination for hikers and eco-tourists. The clear waters and reefs that almost completely encircle Guanaja also attract divers. In 1998, hurricane Mitch destroyed almost all (97 percent) of the island's mangrove forests, impacting coastal habitats and resulting in soil erosion. Regeneration of mangroves is slow and active reseeding efforts have been suggested as the only means to restore the forests.

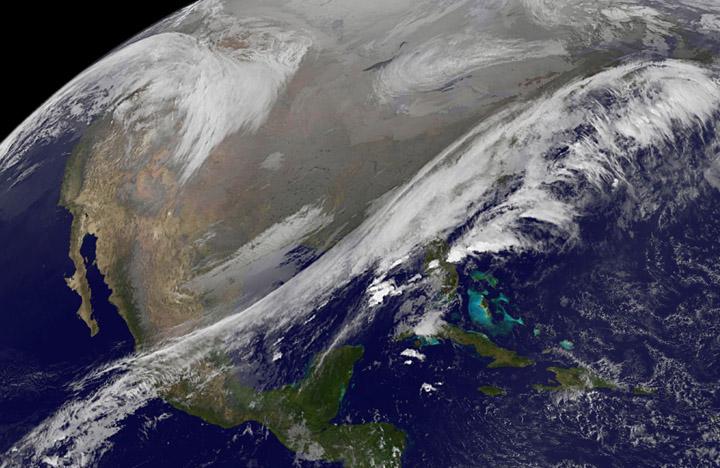
The remnant moisture from what was once Hurricane Patricia and moisture from the Gulf of Mexico were being transported north by a trough of low pressure over Wisconsin. The clouds and moisture were streaming into the Eastern third of the U.S. on October 28, 2015. The hybrid system was generating windy conditions which were seen from NASA's RapidScat instrument, while NOAA's GOES-East satellite captured an image of the impressive and sizeable cloud cover. Read more: <a href="http://www.nasa.gov/feature/goddard/patricia-eastern-pacific-2015" rel="nofollow">www.nasa.gov/feature/goddard/patricia-eastern-pacific-2015</a> <b><a href="http://goes.gsfc.nasa.gov/" rel="nofollow">Credit: NOAA/NASA GOES Project</a></b> <b><a href="http://www.nasa.gov/audience/formedia/features/MP_Photo_Guidelines.html" rel="nofollow">NASA image use policy.</a></b> <b><a href="http://www.nasa.gov/centers/goddard/home/index.html" rel="nofollow">NASA Goddard Space Flight Center</a></b> enables NASA’s mission through four scientific endeavors: Earth Science, Heliophysics, Solar System Exploration, and Astrophysics. Goddard plays a leading role in NASA’s accomplishments by contributing compelling scientific knowledge to advance the Agency’s mission. <b>Follow us on <a href="http://twitter.com/NASAGoddardPix" rel="nofollow">Twitter</a></b> <b>Like us on <a href="http://www.facebook.com/pages/Greenbelt-MD/NASA-Goddard/395013845897?ref=tsd" rel="nofollow">Facebook</a></b> <b>Find us on <a href="http://instagrid.me/nasagoddard/?vm=grid" rel="nofollow">Instagram</a></b>
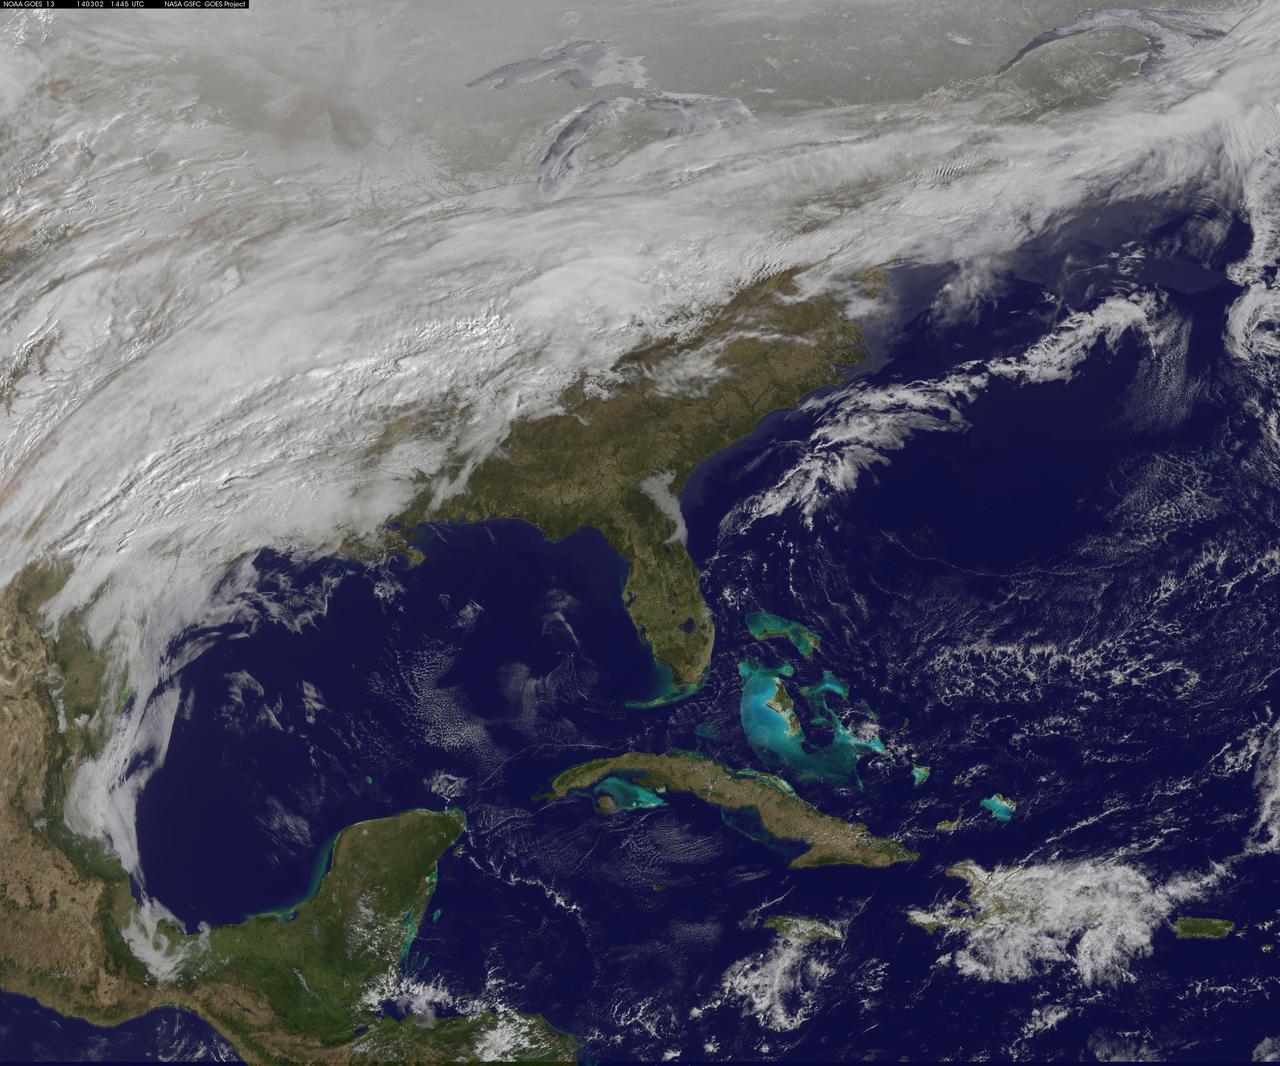
A major winter storm is poised to wallop the Mid-Atlantic and bring large amounts of snow to cities including Baltimore, Md., Washington, D.C. area on March 2 and 3, according to NOAA's National Weather Service. NOAA's GOES-East satellite captured this image of the clouds associated with the winter storm as it continued moving east toward those cities. On March 2, the National Weather Prediction Center in College Park, Md. noted that there is a slight risk for severe thunderstorms over parts of the western Gulf Coast and the Lower Mississippi Valley as a result of the southern portion of the system. The update at 7 a.m. EST noted that freezing rain/sleet is possible over parts of the lower Mississippi Valley and parts of the central Appalachians, while eastern Texas and the lower Mississippi Valley into the Ohio Valley are expected to experience heavy rain. The NWS Short Range Forecast Discussion stated "A strong storm over the Southern Plains/Lower Mississippi Valley will advance northeastward along a quasi-stationary front to off the Southern Mid-Atlantic Coast by Monday evening. Moisture from the Gulf of Mexico will overrun and pool along the associated front producing an area of snow extending from the Central Plains into the Northeast." The clouds are associated with a cold from that stretches from eastern Maine through Maryland and west into the Tennessee Valley. The low pressure center associated with the front was located over Arkansas. At NASA/NOAA's GOES Project at NASA's Goddard Space Flight Center in Greenbelt, Md. the cloud data from NOAA's GOES-East satellite were overlaid on a true-color image of land and ocean created by data from the Moderate Resolution Imaging Spectroradiometer or MODIS instrument that flies aboard NASA's Aqua and Terra satellites. Together, those data created the entire picture of the position of this major winter storm. GOES satellites provide the kind of continuous monitoring necessary for intensive data analysis. Geostationary describes an orbit in which a satellite is always in the same position with respect to the rotating Earth. This allows GOES to hover continuously over one position on Earth's surface, appearing stationary. As a result, GOES provide a constant vigil for the atmospheric "triggers" for severe weather conditions such as tornadoes, flash floods, hail storms and hurricanes. For updated information about the storm system, visit NOAA's NWS website: <a href="http://www.weather.gov" rel="nofollow">www.weather.gov</a> For more information about GOES satellites, visit: <a href="http://www.goes.noaa.gov/" rel="nofollow">www.goes.noaa.gov/</a> or <a href="http://goes.gsfc.nasa.gov/" rel="nofollow">goes.gsfc.nasa.gov/</a> Rob Gutro NASA Goddard Space Flight Center, Greenbelt, Md. <b><a href="http://www.nasa.gov/audience/formedia/features/MP_Photo_Guidelines.html" rel="nofollow">NASA image use policy.</a></b> <b><a href="http://www.nasa.gov/centers/goddard/home/index.html" rel="nofollow">NASA Goddard Space Flight Center</a></b> enables NASA’s mission through four scientific endeavors: Earth Science, Heliophysics, Solar System Exploration, and Astrophysics. Goddard plays a leading role in NASA’s accomplishments by contributing compelling scientific knowledge to advance the Agency’s mission. <b>Follow us on <a href="http://twitter.com/NASAGoddardPix" rel="nofollow">Twitter</a></b> <b>Like us on <a href="http://www.facebook.com/pages/Greenbelt-MD/NASA-Goddard/395013845897?ref=tsd" rel="nofollow">Facebook</a></b> <b>Find us on <a href="http://instagram.com/nasagoddard?vm=grid" rel="nofollow">Instagram</a></b>
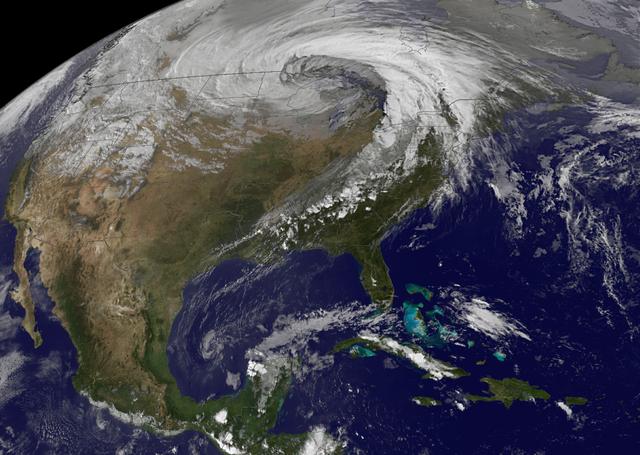
NASA image acquired October 26, 2010 The storm that swept across the center of the United States on October 26 and October 27, 2010, was memorable to those who experienced it because of its strong winds, rain, hail, and widespread tornadoes. Meteorologists get excited about the storm because it set a record for the lowest pressure (not associated with a hurricane) measured over land in the continental United States. At 5:13 p.m. CDT, the weather station in Bigfork, Minnesota recorded 955.2 millibars (28.21 inches of pressure). Pressure is one indicator of a storm’s strength, and this measurement corresponds to the pressure seen in a Category 3 hurricane. This image, taken by the GOES satellite on October 26, shows the storm system circling around the area of extreme low pressure. Such extratropical cyclones form over the United States in the spring and fall, when the temperature difference from north to south is large. Warm, high-pressure air rushes toward the cooler, low-pressure air in the north. Because the Earth is rotating, the air moving in ends up circling the area of low pressure, creating the cyclone shown in the image. The intensity of the storm is determined by the pressure difference between the center and the outer edges. Extreme low pressure in the center of the storm, therefore, is an indicator that the storm was very intense. The animation shows the storm developing starting late on October 25 and running through October 27. The cyclone formed very quickly on October 26, taking a distinctive comma shape as the day went on. The storm developed so quickly, in fact, that it is classified as a bomb, an extremely fast developing storm (dropping at least one millibar of pressure per hour for 24 hours), more common over water than land. The storm was also huge. Though the area of low pressure is centered over the Upper Midwest, the storm reached from the Gulf of Mexico into Canada, and from the Rocky Mountains to the Atlantic Ocean. Extratropical cyclones bring an array of unsettled weather, including strong wind, rain, hail, and tornadoes, and this cyclone brought all of that. On October 26–27, winds gusted up to 78 miles per hour in Michigan, with high winds throughout the Midwest. The National Weather Service reported 61 tornadoes over the two days. Heavy snow also fell in the north. NASA Earth Observatory imagery created by Jesse Allen, using imagery provided courtesy of the NASA GOES Project Science Office. Caption by Holli RIebeek. Instrument: GOES Credit: <b><a href="http://www.earthobservatory.nasa.gov/" rel="nofollow"> NASA Earth Observatory</a></b> <b><a href="http://www.nasa.gov/centers/goddard/home/index.html" rel="nofollow">NASA Goddard Space Flight Center</a></b> enables NASA’s mission through four scientific endeavors: Earth Science, Heliophysics, Solar System Exploration, and Astrophysics. Goddard plays a leading role in NASA’s accomplishments by contributing compelling scientific knowledge to advance the Agency’s mission. <b>Follow us on <a href="http://twitter.com/NASA_GoddardPix" rel="nofollow">Twitter</a></b> <b>Join us on <a href="http://www.facebook.com/pages/Greenbelt-MD/NASA-Goddard/395013845897?ref=tsd" rel="nofollow">Facebook</a></b>

NOAA's GOES-East satellite provided a look at the frigid eastern two-thirds of the U.S. on Jan. 7, 2015, that shows a blanket of northern snow, lake-effect snow from the Great Lakes and clouds behind the Arctic cold front. A visible picture captured at 1600 UTC (11 a.m. EST) showed the effects of the latest Arctic outbreak. The cold front that brought the Arctic air has moved as far south as Florida, and stretches back over the Gulf of Mexico and just west of Texas today. The image shows clouds behind the frontal boundary stretching from the Carolinas west over the Heartland. Farther north, a wide band of fallen snow covers the ground from New England west to Montana, with rivers appearing like veins. The GOES-East satellite image also shows wind-whipped lake-effect snows off the Great Lakes, blowing to the southeast. Meanwhile, Florida, the nation's warm spot appeared almost cloud-free. To create the image, NASA/NOAA's GOES Project used cloud data from NOAA's GOES-East satellite and overlaid it on a true-color image of land and ocean created by data from the Moderate Resolution Imaging Spectroradiometer, or MODIS, instrument that flies aboard NASA's Aqua and Terra satellites. Together, those data created the entire picture of the Arctic outbreak. The forecast from NOAA's National Weather Service Weather Prediction Center (WPC) calls for more snow along the Appalachian Mountains from Tennessee north to upstate New York. Snow is also expected to fall from New England west to Montana, and in eastern New Mexico and the Colorado Rockies. The WPC summary for Jan. 7 noted: Bitter cold will be felt from the western High Plains to the Mid-Atlantic and Northeast U.S. for the next few days. Widespread subzero overnight lows are forecast for the Dakotas, Upper Midwest, Great Lakes, and interior New England. Wind Chill Advisories and Warnings are in effect for many of these areas. GOES-East provides visible and infrared images over the eastern U.S. and the Atlantic Ocean from its fixed orbit in space. NOAA's GOES satellites provide the kind of continuous monitoring necessary for intensive data analysis. Geostationary describes an orbit in which a satellite is always in the same position with respect to the rotating Earth. This allows GOES to hover continuously over one position on Earth's surface, appearing stationary. As a result, GOES provide a constant vigil for the atmospheric triggers for severe weather conditions such as tornadoes, flash floods, hail storms and hurricanes. For updated information about the storm system, visit NOAA's NWS website: <a href="http://www.weather.gov" rel="nofollow">www.weather.gov</a> For more information about GOES satellites, visit: <a href="http://www.goes.noaa.gov/" rel="nofollow">www.goes.noaa.gov/</a> or goes.gsfc.nasa.gov/ Rob Gutro NASA's Goddard Space Flight Center, Greenbelt, Md. <b><a href="http://www.nasa.gov/audience/formedia/features/MP_Photo_Guidelines.html" rel="nofollow">NASA image use policy.</a></b> <b><a href="http://www.nasa.gov/centers/goddard/home/index.html" rel="nofollow">NASA Goddard Space Flight Center</a></b> enables NASA’s mission through four scientific endeavors: Earth Science, Heliophysics, Solar System Exploration, and Astrophysics. Goddard plays a leading role in NASA’s accomplishments by contributing compelling scientific knowledge to advance the Agency’s mission. <b>Follow us on <a href="http://twitter.com/NASAGoddardPix" rel="nofollow">Twitter</a></b> <b>Like us on <a href="http://www.facebook.com/pages/Greenbelt-MD/NASA-Goddard/395013845897?ref=tsd" rel="nofollow">Facebook</a></b> <b>Find us on <a href="http://instagram.com/nasagoddard?vm=grid" rel="nofollow">Instagram</a></b>
This NOAA's GOES satellite infrared image taken on Nov. 25 at 11:45 UTC (6:45 a.m. EST) shows two main weather systems over the U.S. Credit: NASA/NOAA GOES Project As the U.S. Thanksgiving holiday approaches this Thursday, November 27, NOAA's GOES-East and GOES-West satellites are keeping a weather eye out for storms that may affect early travelers. In an image from Nov. 25, the satellites show an active weather pattern is in place for travelers across the central and eastern U.S. NOAA's GOES-East satellite provides visible and infrared images over the eastern U.S. and the Atlantic Ocean, while NOAA's GOES-West satellite covers the western U.S. and Pacific Ocean from its fixed orbit in space. Data from both satellites were combined at NASA's GOES Project to create a full view of the U.S. on Nov. 25 at 11:45 UTC (6:45 a.m. EST). The image shows clouds associated with cold front stretching from the Gulf of Mexico over northern Florida and along the U.S. East coast to eastern Canada. Clouds associated with another area of low pressure are in the northern Rockies and northwestern U.S. To create the image, NASA/NOAA's GOES Project takes the cloud data from NOAA's GOES-East satellite and overlays it on a true-color image of land and ocean created by data from the Moderate Resolution Imaging Spectroradiometer, or MODIS, instrument that flies aboard NASA's Aqua and Terra satellites. Together, those data created the entire picture of the storm and show its movement. After the storm system passes, the snow on the ground becomes visible. NOAA's National Weather Service Weather Prediction Center said "a storm system will develop off the coast of the Carolinas early Wednesday (Nov. 25) and strengthen as it moves rapidly up the East Coast Wednesday into early Thursday (Nov. 26). Heavy snow is likely to begin in the central Appalachians early Wednesday morning, spreading northeast through the interior Mid-Atlantic into New England by Wednesday night. Winter Storm Watches are in effect for these areas." For travelers in the western U.S., the Northern Rocky Mountains are expected to receive more snow from the north side of a stationary frontal boundary. South of the boundary rain showers will affect the lower valley. The National Weather Service calls for cold weather to continue in the northern Plains and Upper Midwest as a Canadian surface high pressure rules the weather. The U.S. Southwest will experience nice weather for mid-week. In the Pacific Northwest, the National Weather Service noted that a warm front will bring rain, heavy at times, to the Cascades today and tonight. There will be a break in the heavier rains on Wednesday, then another period of heavy rain for the Cascades Wednesday night through Friday morning as a cold front slowly drags through the area. NOAA's GOES satellites provide the kind of continuous monitoring necessary for intensive data analysis. Geostationary describes an orbit in which a satellite is always in the same position with respect to the rotating Earth. This allows GOES to hover continuously over one position on Earth's surface, appearing stationary. As a result, GOES provide a constant vigil for the atmospheric triggers for severe weather conditions such as tornadoes, flash floods, hail storms and hurricanes.
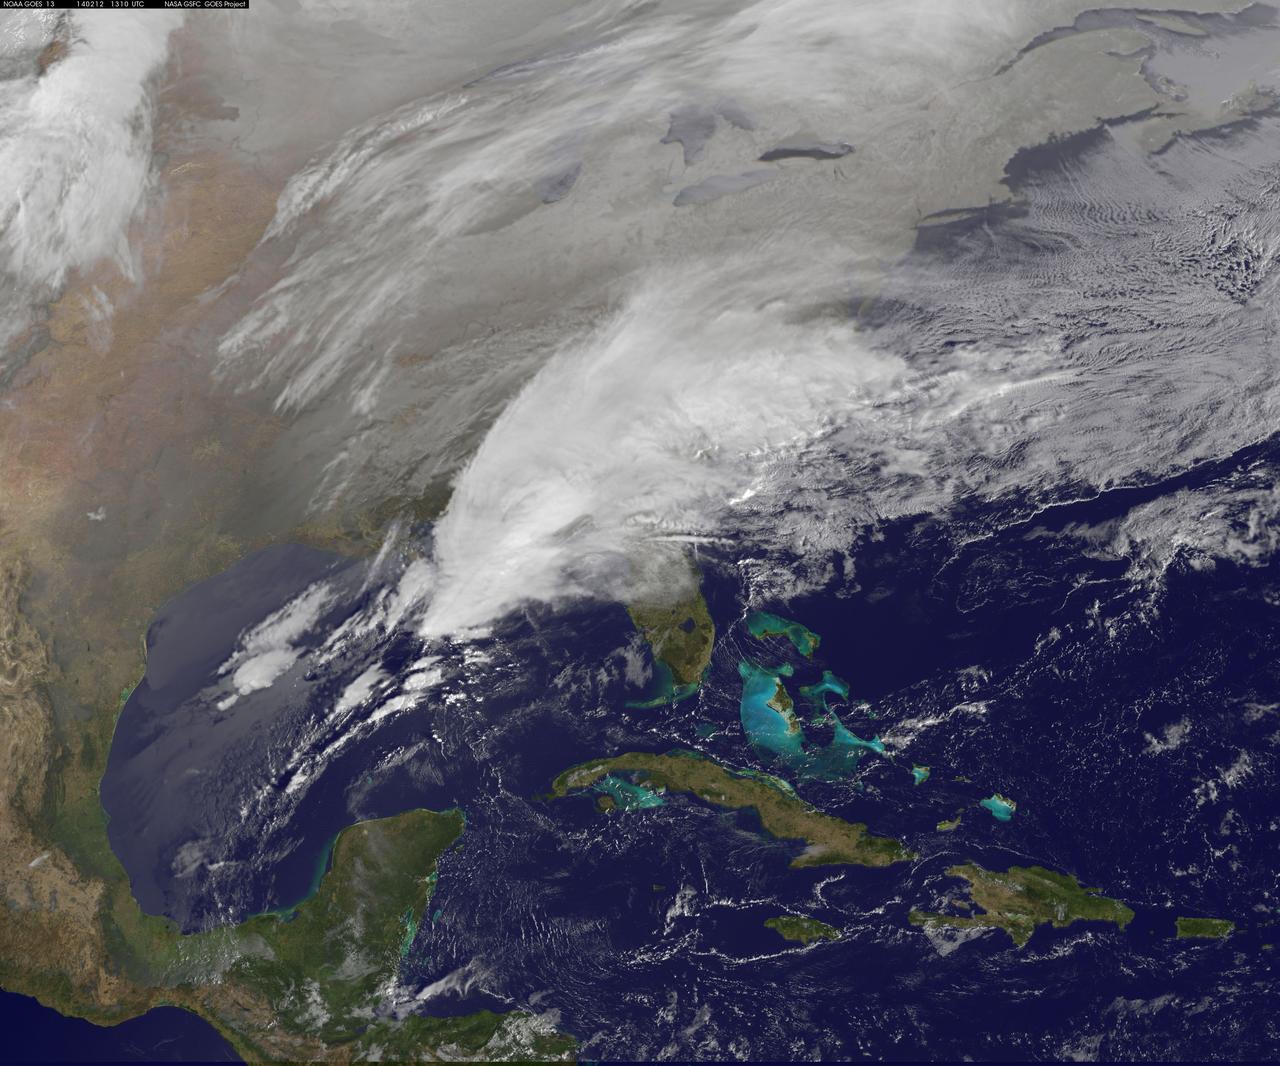
Clouds associated with the major winter storm that is bringing wintry precipitation and chilly temperatures to the U.S. south is the focus in an image from NOAA's GOES-East satellite today, February 12 at 1310 UTC/ 8:10 EST. Rain, freezing rain, sleet and snow are part of the large front that stretches from eastern Texas to the Carolinas in the Geostationary Operational Environmental satellite or GOES image. NOAA's weather maps show several areas of low pressure along the frontal boundary. One low pressure is in the northern Gulf of Mexico, while the other is in the Atlantic Ocean, just south of South Carolina. (Insert link: <a href="http://www.hpc.ncep.noaa.gov/noaa/noaad1.gif" rel="nofollow">www.hpc.ncep.noaa.gov/noaa/noaad1.gif</a>). NOAA's National Weather Service has been issuing watches and warnings throughout the south that extend along Mid-Atlantic east coast. The visible cloud and ground snow data in this image was taken from NOAA's GOES-East satellite. The image was created by the NASA GOES Project at NASA's Goddard Space Flight Center in Greenbelt, Md. The clouds and fallen snow were overlaid on a true-color image of land and ocean created by data from the Moderate Resolution Imaging Spectroradiometer or MODIS instrument that flies aboard NASA's Aqua and Terra satellites. NOAA's Weather Prediction Center, or WPC noted on Feb. 11 at 3:59 a.m. EST, "Once the intensifying surface low moves off the Southeast coast and begins its track up the Eastern Seaboard Wednesday night...winter weather will start lifting northward into the northern Mid-Atlantic states." GOES satellites provide the kind of continuous monitoring necessary for intensive data analysis. Geostationary describes an orbit in which a satellite is always in the same position with respect to the rotating Earth. This allows GOES to hover continuously over one position on Earth's surface, appearing stationary. As a result, GOES provide a constant vigil for the atmospheric "triggers" for severe weather conditions such as tornadoes, flash floods, hail storms and hurricanes. For updated information about the storm system, visit NOAA's WPC website; <a href="http://www.hpc.ncep.noaa.gov/" rel="nofollow">www.hpc.ncep.noaa.gov/</a> For more information about GOES satellites, visit: <a href="http://www.goes.noaa.gov/" rel="nofollow">www.goes.noaa.gov/</a> or <a href="http://goes.gsfc.nasa.gov/" rel="nofollow">goes.gsfc.nasa.gov/</a> Rob Gutro NASA's Goddard Space Flight Center <b><a href="http://www.nasa.gov/audience/formedia/features/MP_Photo_Guidelines.html" rel="nofollow">NASA image use policy.</a></b> <b><a href="http://www.nasa.gov/centers/goddard/home/index.html" rel="nofollow">NASA Goddard Space Flight Center</a></b> enables NASA’s mission through four scientific endeavors: Earth Science, Heliophysics, Solar System Exploration, and Astrophysics. Goddard plays a leading role in NASA’s accomplishments by contributing compelling scientific knowledge to advance the Agency’s mission. <b>Follow us on <a href="http://twitter.com/NASAGoddardPix" rel="nofollow">Twitter</a></b> <b>Like us on <a href="http://www.facebook.com/pages/Greenbelt-MD/NASA-Goddard/395013845897?ref=tsd" rel="nofollow">Facebook</a></b> <b>Find us on <a href="http://instagram.com/nasagoddard?vm=grid" rel="nofollow">Instagram</a></b>