Wuthering Heights
Such Great Heights
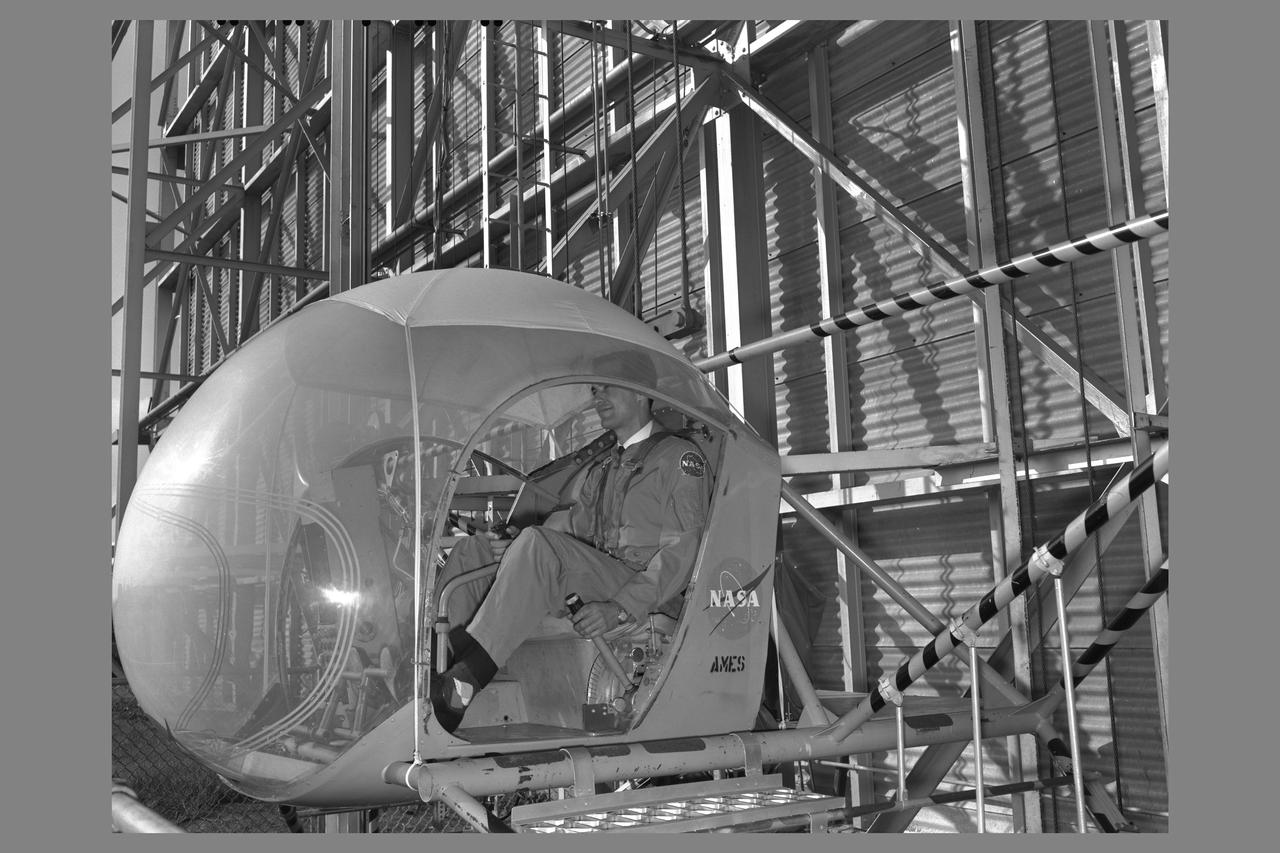
Height Control Simulator (HICONTA) with Pilot Gordon Hardy in cab
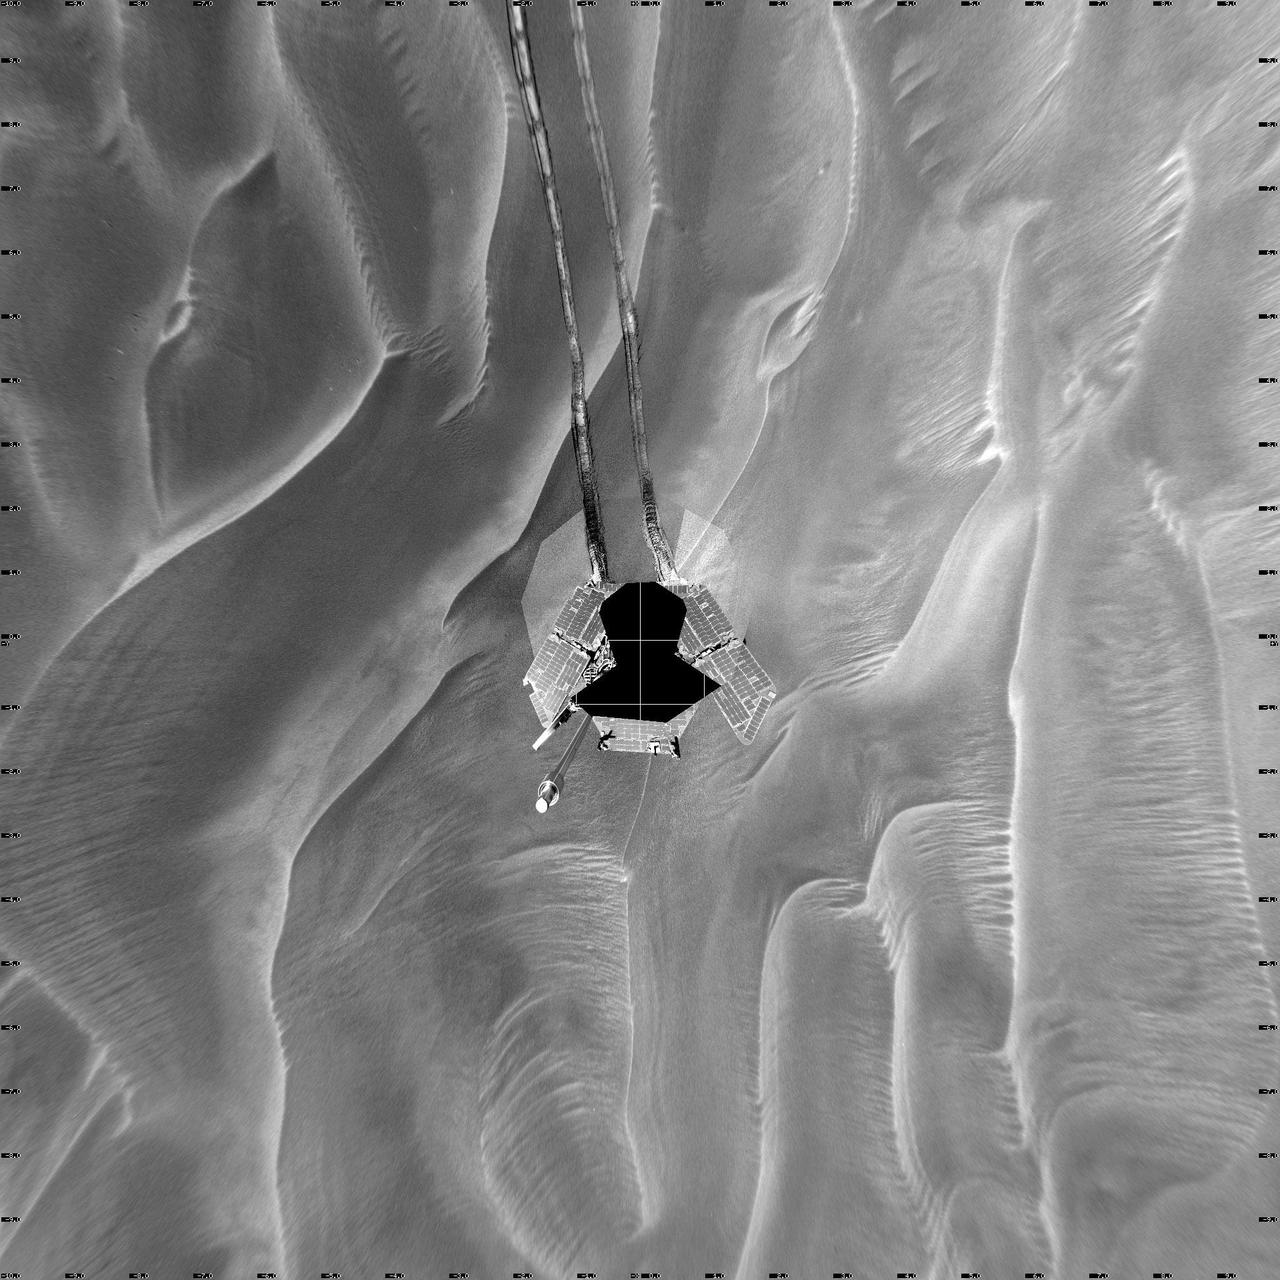
Opportunity Sol 446 Position, with Relative Heights
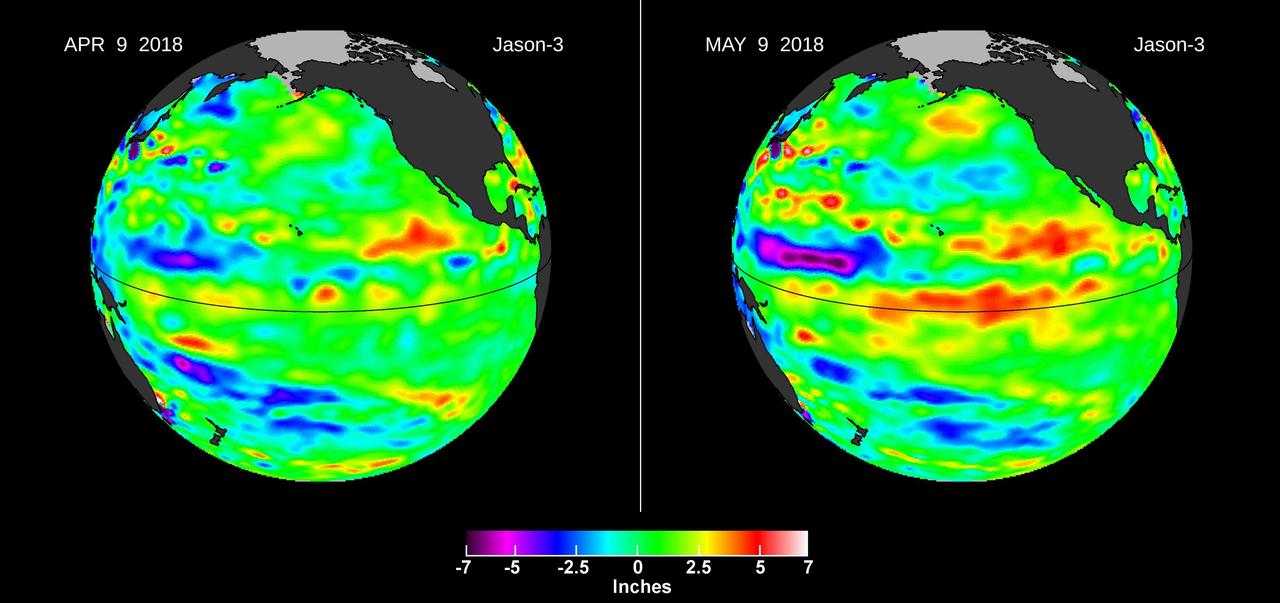
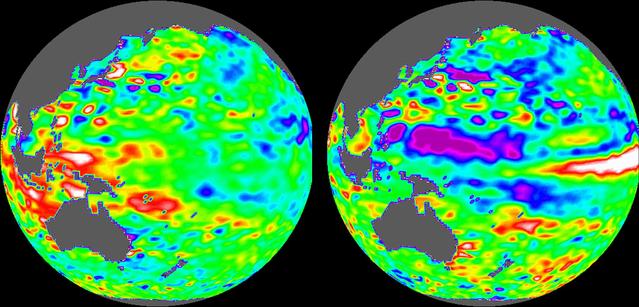
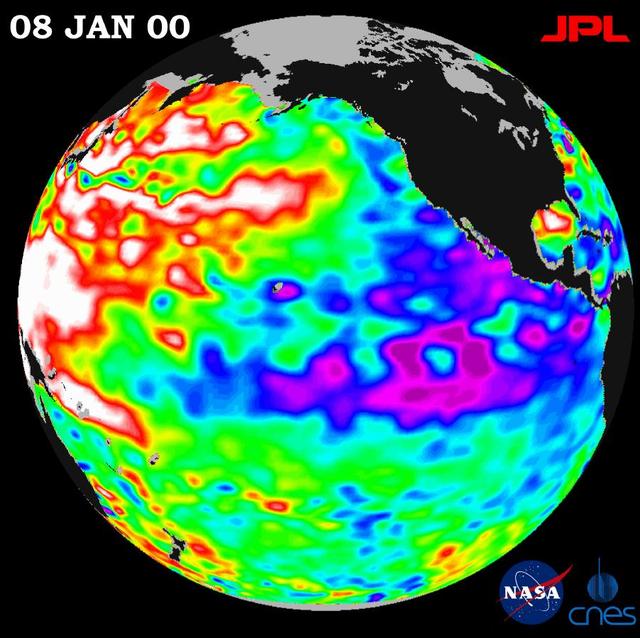
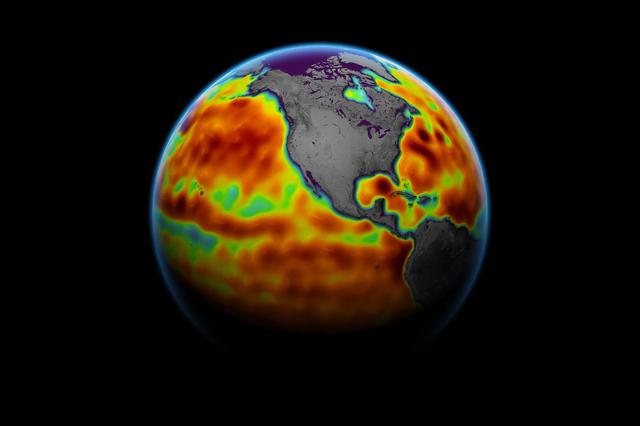
Images from the U.S./European Jason-3 satellite show sea surface height with respect to the seasonal cycle and the long-term trend. Blue/magenta colors indicate lower-than-normal sea levels, while yellow/red colors indicate higher-than-normal sea levels. The April 9, 2018 image (left panel) shows most of the ocean at neutral heights (green). A month later (right panel), a red patch is visible along the equator in the Central Pacific. The red area is a downwelling Kelvin wave, traveling eastward along the equator. https://photojournal.jpl.nasa.gov/catalog/PIA22473
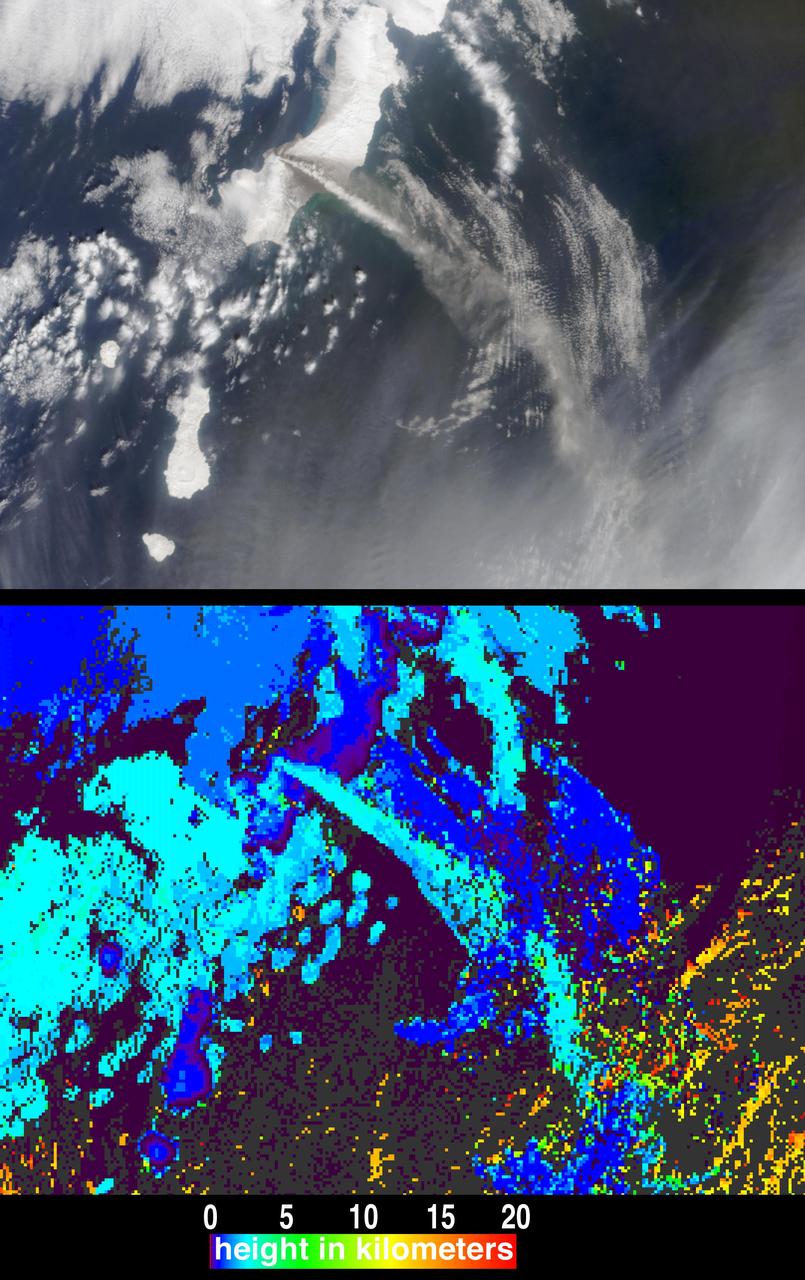
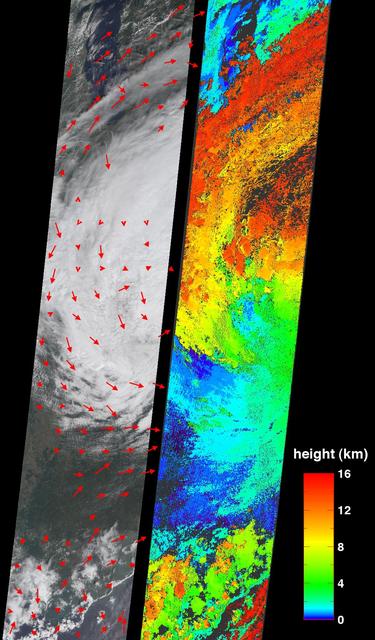
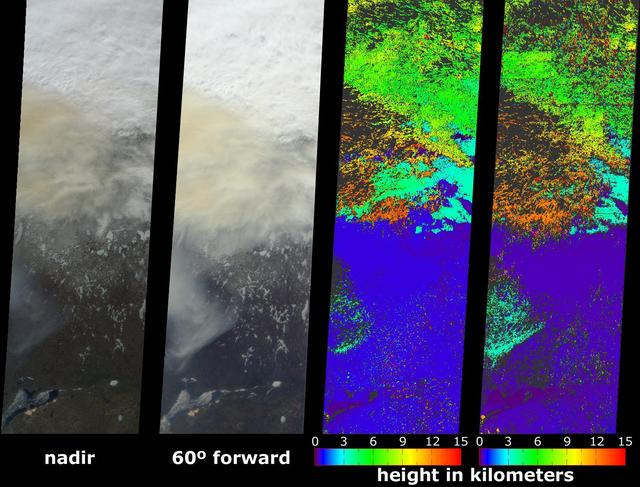
The height and motion of the ash and gas plume from the April 22, 2003, eruption of the Chikurachki volcano is portrayed in these views NASA Terra spacecraft.
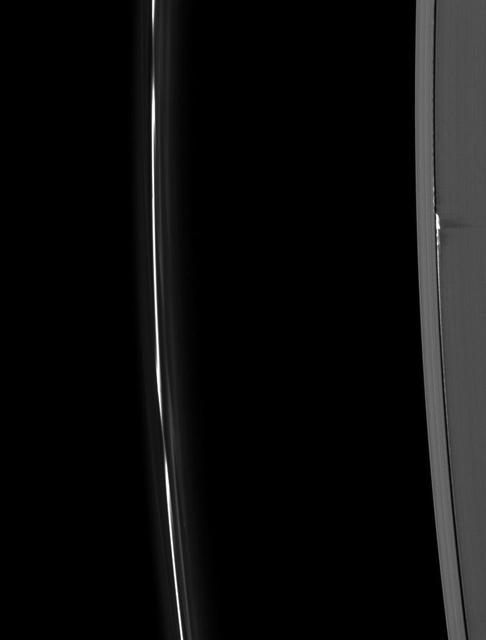
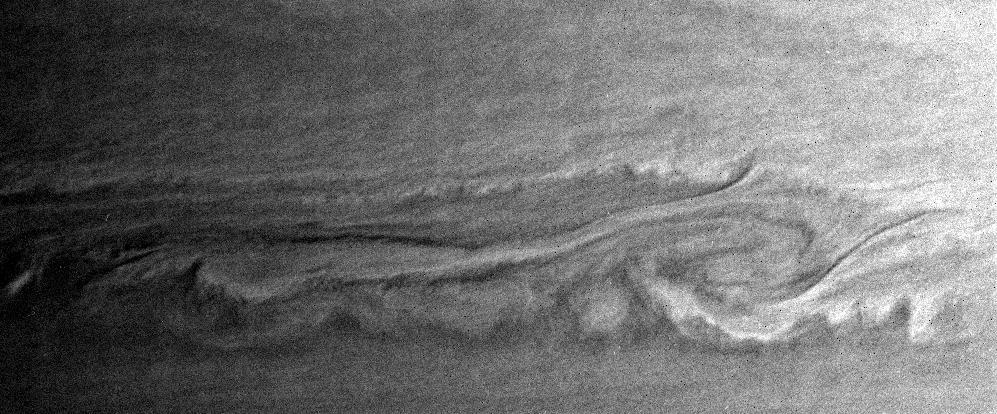
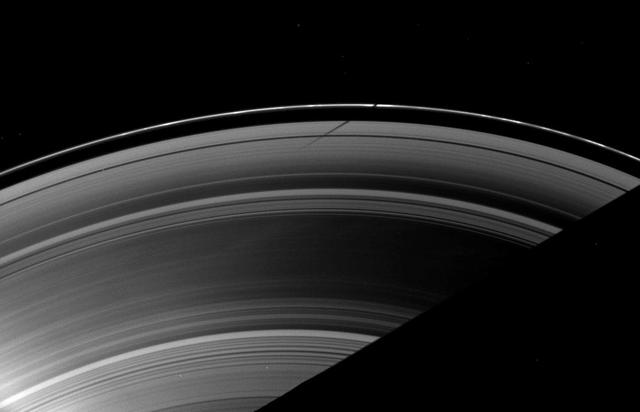
Ring material, pulled to spectacular heights above the ring plane by the gravity of the moon Daphnis, casts long shadows on Saturn’s A ring in this Cassini image taken about a month before the planet’s August 2009 equinox.
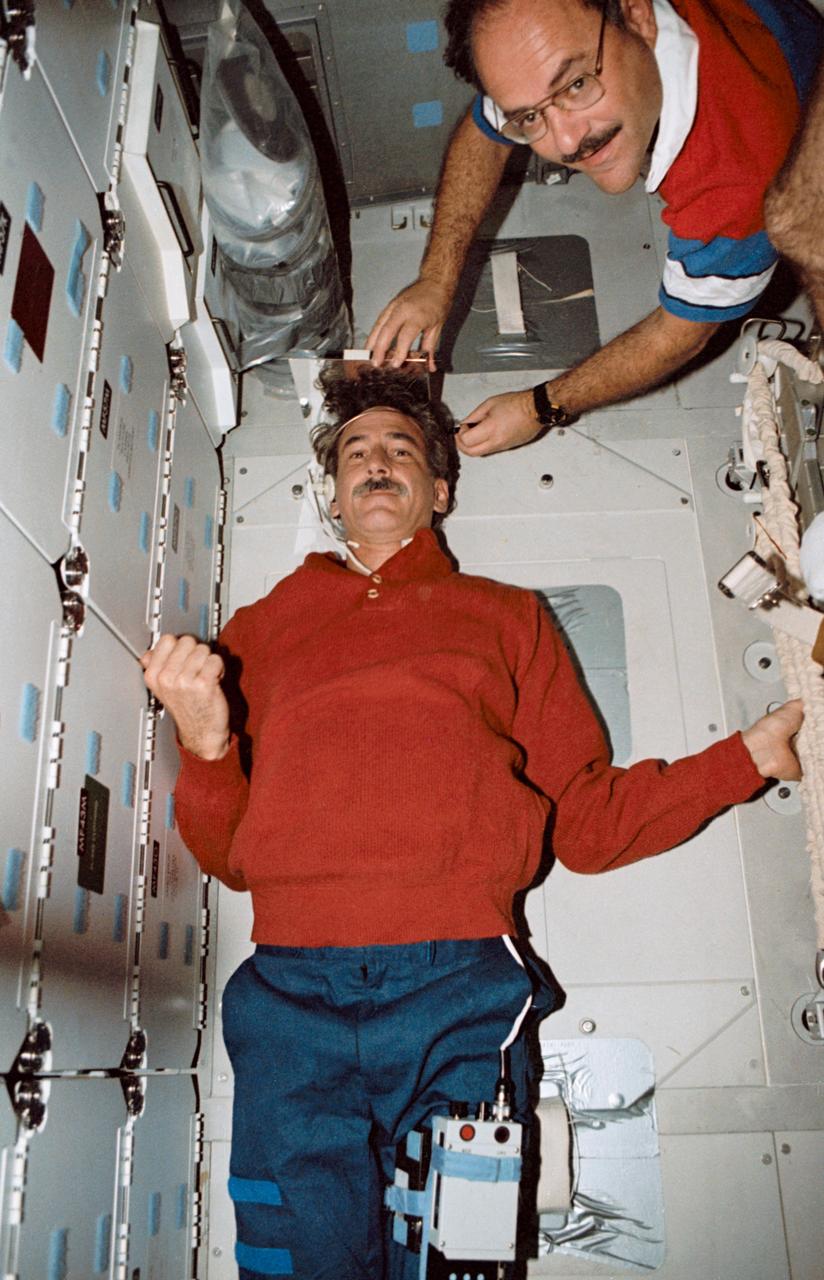
STS035-19-021 (December 1990) --- STS-35 Mission Specialist Jeffrey A. Hoffman stretches out on the middeck floor while MS John M. (Mike) Lounge records his height. The two crew members are in front of the forward lockers aboard Columbia, Orbiter Vehicle (OV) 102. Hoffman steadies himself using the stowed treadmill and the lockers. Above Hoffman's head is a plastic bag filled with Development Test Objective (DTO) 634, Trash Compaction and Retention System Demonstration, trash compactor charcoal filtered bag lids. This image was selected by the Public Affairs Office (PAO) for public release.
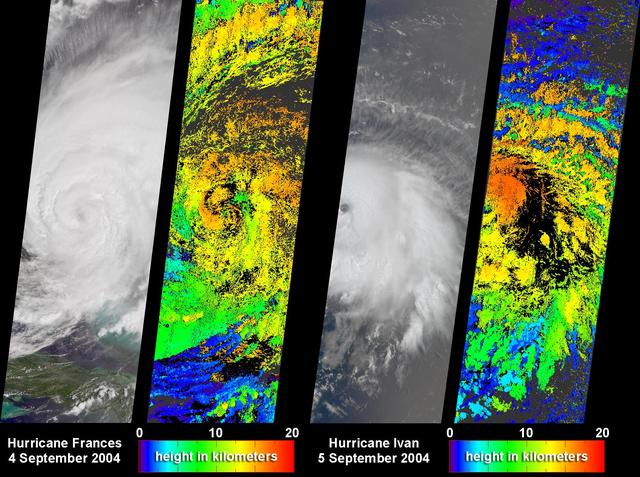
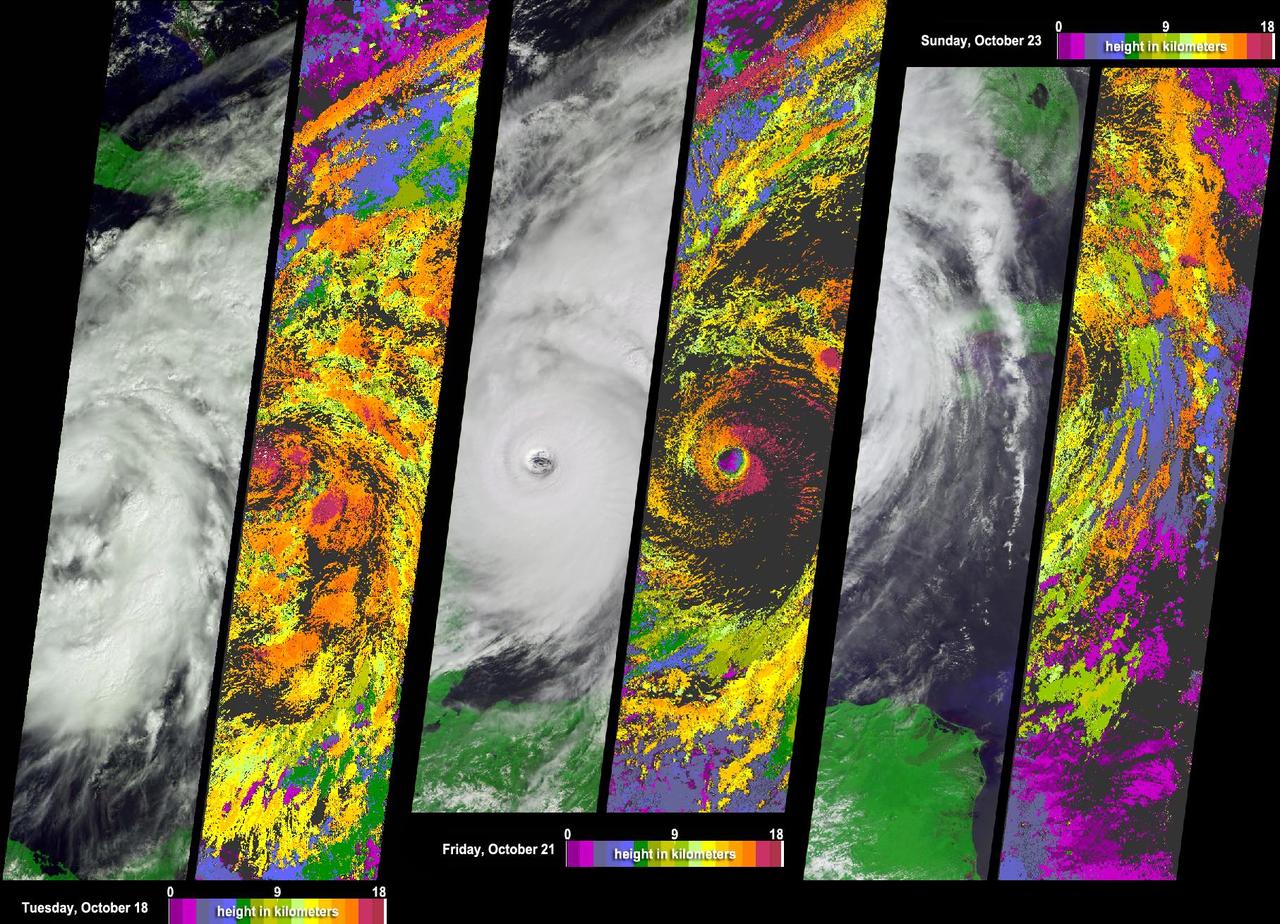
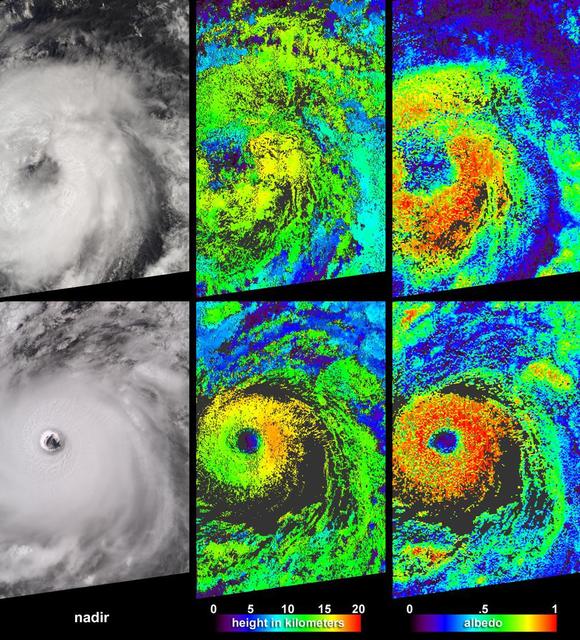
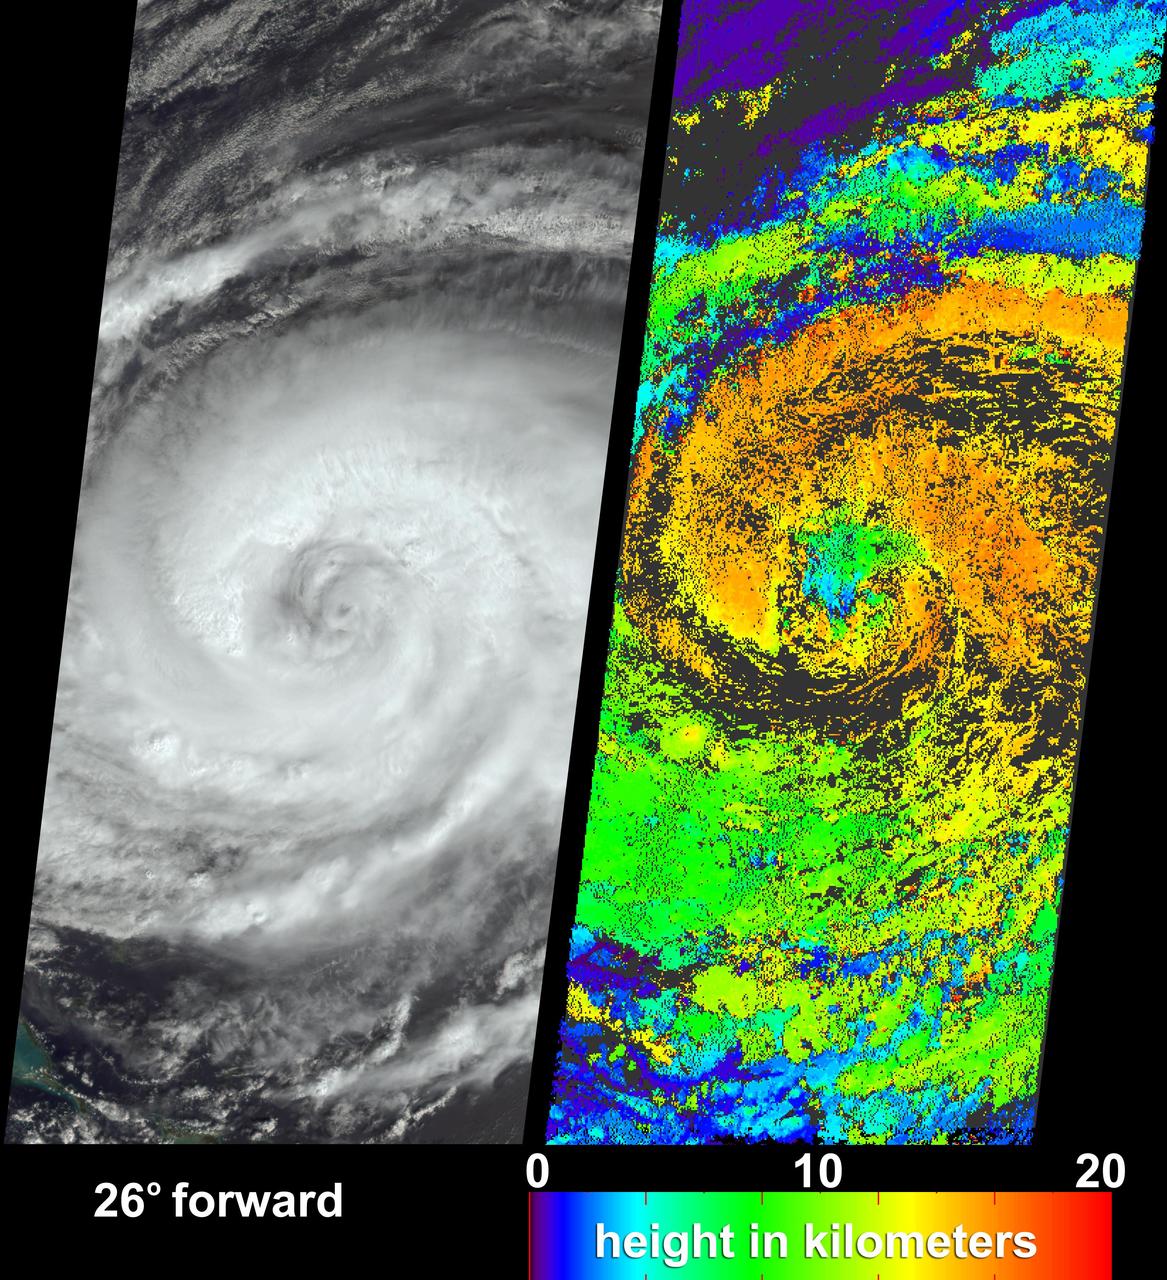
NASA Terra spacecraft captured these images and cloud-top height retrievals of Hurricane Frances on September 4, 2004, when the eye sat just off the coast of eastern Florida, and Hurricane Ivan on September 5th.

This image of the Pacific Ocean was produced using sea surface height measurements taken by NASA U.S.-French TOPEX/Poseidon satellite.
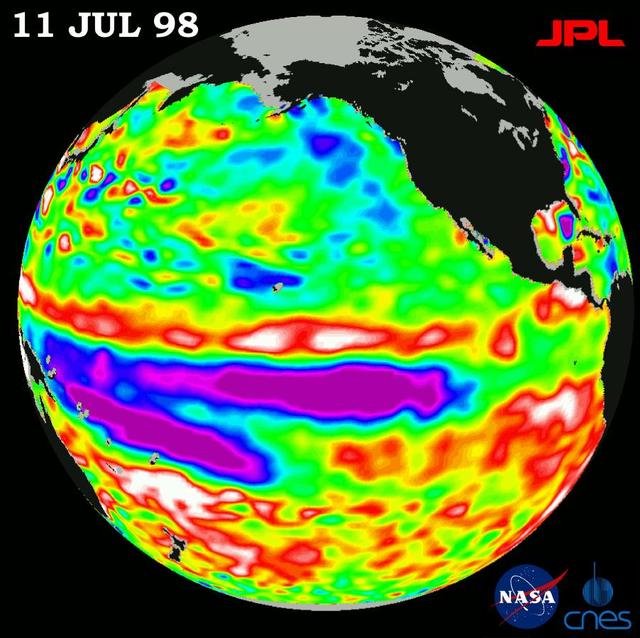
Height measurements taken by NASA U.S.-French TOPEX/Poseidon satellite. The image shows sea surface height relative to normal ocean conditions on July 11, 1998; sea surface height is an indicator of the heat content of the ocean.
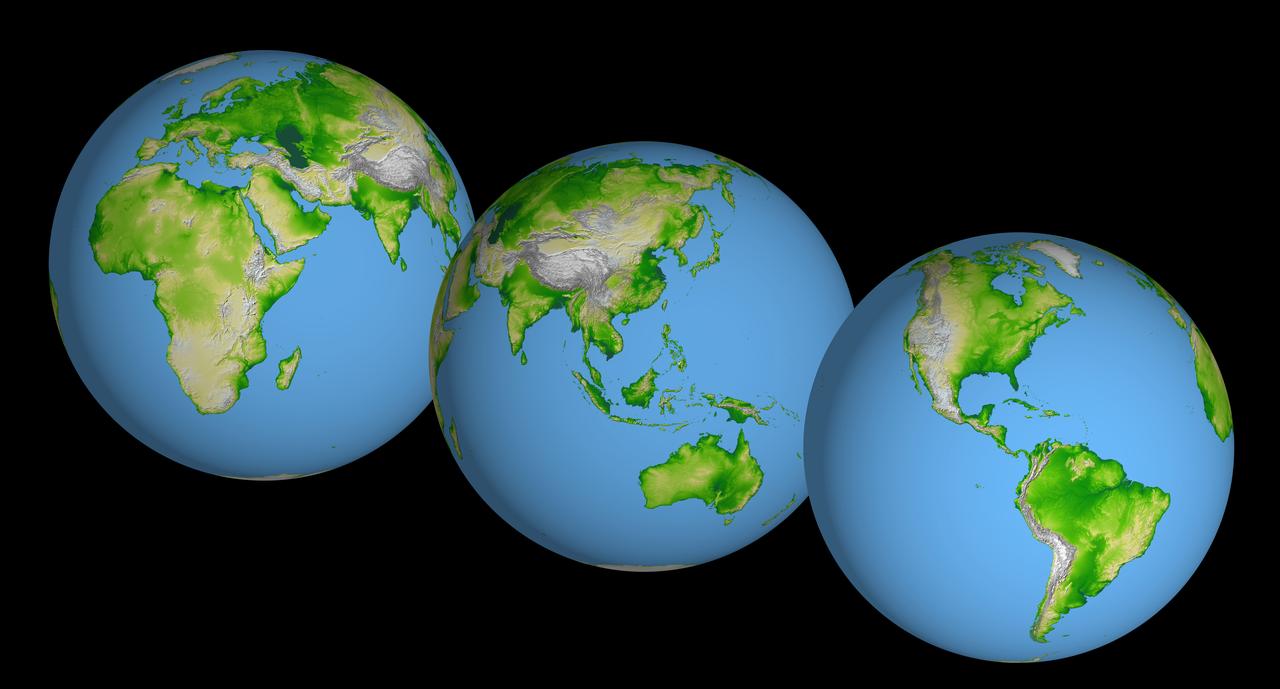
These images of the world were generated with data from the Shuttle Radar Topography Mission (SRTM). The SRTM Project has recently released a new global data set called SRTM30, where the original one arcsecond of latitude and longitude resolution (about 30 meters, or 98 feet, at the equator) was reduced to 30 arcseconds (about 928 meters, or 1496 feet.) These images were created from that data set and show the Earth as it would be viewed from a point in space centered over the Americas, Africa and the western Pacific. Two visualization methods were combined to produce the image: shading and color coding of topographic height. The shade image was derived by computing topographic slope in the northwest-southeast direction, so that northwest slopes appear bright and southeast slopes appear dark. Color coding is directly related to topographic height, with green at the lower elevations, rising through yellow and tan, to white at the highest elevations. Elevation data used in this image were acquired by the Shuttle Radar Topography Mission aboard the Space Shuttle Endeavour, launched on Feb. 11, 2000. http://photojournal.jpl.nasa.gov/catalog/PIA03394

This animation, created in 2012, shows the increasing clarity and detail of measurements of sea height made by successive satellite altimeters launched by NASA and other agencies over the past four decades, concluding with data at the resolution possible with the Surface Water and Ocean Topography (SWOT) satellite, expected to launch in December 2022. Each new spacecraft has been able to obtain higher-resolution observations than its predecessors. Sea height is key to understanding how much, and how fast, the oceans are rising in a warming climate. The animation starts with Seasat, launched in 1978 as one of the NASA's earliest Earth-observing satellites, then moves to Geosat, a U.S. Navy spacecraft launched in 1985, and on to ERS-1, TOPEX/Poseidon, ERS-2, Jason-1, Envisat, and Jason-2. Since the end of the time period shown in the animation, subsequent satellites have continued measuring sea height, creating an ongoing, decadeslong record. In March 2022, Sentinel-6 Michael Freilich, a joint U.S.-European mission, became the official reference satellite for global sea level measurements. SWOT will be latest spacecraft to observe ocean heights from Earth orbit. Its measurements will provide unprecedented insights into the activity of small-scale currents and their impact on climate change. Researchers believe small-scale currents, which are less than 60 miles (100 kilometers) in size, have a significant influence on the ocean's ability to absorb atmospheric heat and carbon and thereby moderate global temperature change. To measure these currents, SWOT will employ the Ka-band Radar Interferometer (KaRIn), a new technology developed at NASA's Jet Propulsion Laboratory in Southern California that will offer even greater spatial resolution than previous instruments that studied the ocean. SWOT will survey the water in Earth's lakes, rivers, reservoirs, and the ocean. The satellite will cover the planet's surface twice every 21 days and has a prime mission of three years. It was jointly developed by NASA and France's Centre National d'Études Spatiales (CNES), with contributions from the Canadian Space Agency (CSA) and the UK Space Agency. JPL, a division of Caltech in Southern California, manages the U.S. portion of the mission for NASA. Animation available at https://photojournal.jpl.nasa.gov/catalog/PIA25561
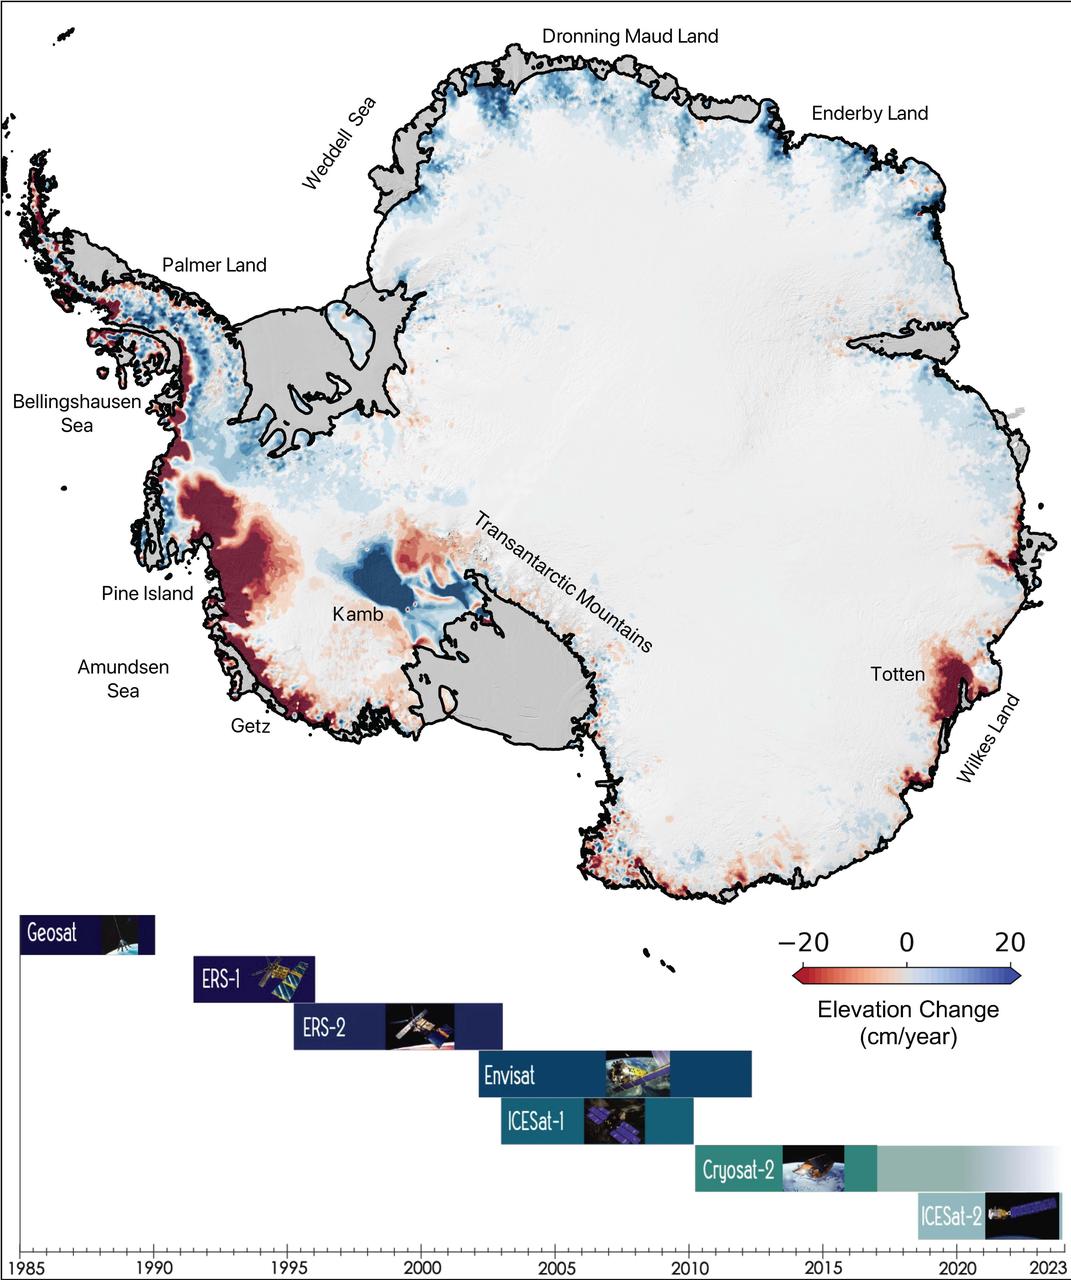
This map of Antarctica shows the changes in the elevation of the Antarctic ice sheet from 1985 through 2021. The map is part of a study, published in Earth System Science Data, conducted by researchers at NASA's Jet Propulsion Laboratory in Southern California. Ice height diminishes (shown in red) as the ice sheet melts by contact with ocean water; ice height rises (shown in blue) where accumulation exceeds ice loss. Ice shelves are shown in gray. The Pine Island and Thwaites glaciers in West Antarctica (the dark red spots on the left side of the map) are the largest areas of rapid ice loss. The stagnant Kamb Ice Stream (the dark blue area at middle-left) is the only major site of rapid accumulation as ice continues to push in from the interior but no longer flows out to an ice shelf. The image summarizes a new data set of monthly high-resolution "snapshots" of ice change. The satellite altimetry missions that supplied data for the study are listed in the timeline at the bottom of the image: Geosat (U.S. Navy), ERS-1 and ERS-2 (ESA, or European Space Agency), Envisat (ESA), ICESat-1 (NASA), Cryosat-2 (ESA), and ICESat-2 (NASA). https://photojournal.jpl.nasa.gov/catalog/PIA24990

STS064-05-020 (9-20 Sept. 1994) --- Astronaut Mark C. Lee gets his height measured by astronaut Jerry M. Linenger as part of a daily in-flight routine supporting a medical Detailed Supplementary Objective (DSO). Astronaut Richard N. Richards, STS-64 mission commander, looks on in the background. This study was designed to collect information about back pain and height changes experienced by astronauts during flight. Crew members participating in this DSO are required to record height measurements and long back-pain symptoms daily. As an ongoing program, this DSO will gather data from 30 astronauts who spend more than eight consecutive days in space. Photo credit: NASA or National Aeronautics and Space Administration
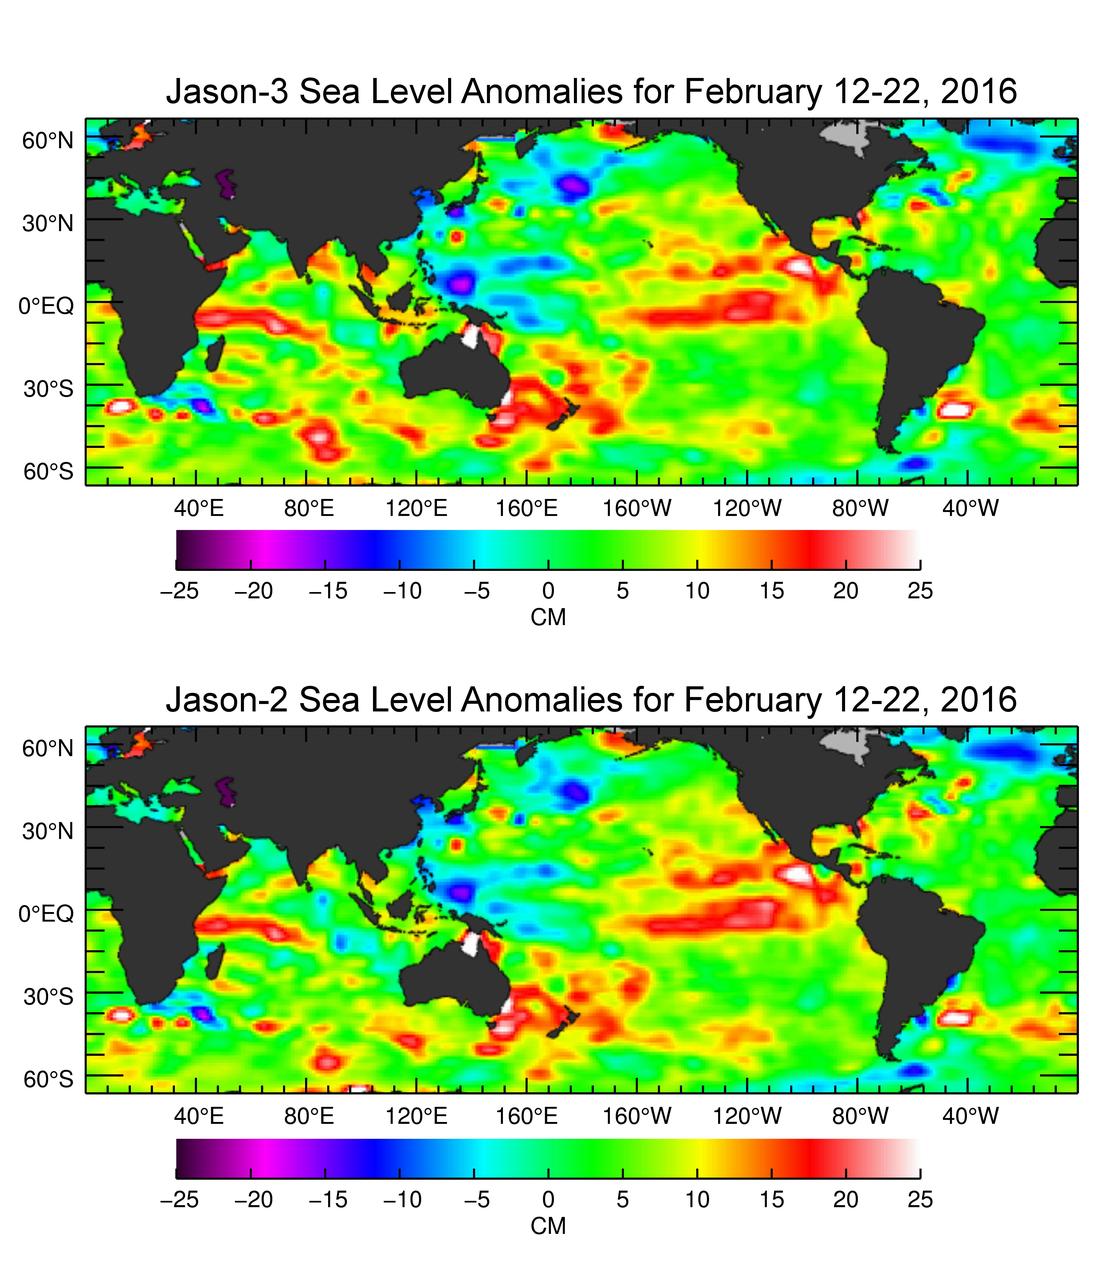
The U.S./European Jason-3 satellite has produced its first map of sea surface height, which corresponds well to data from its predecessor, Jason-2. Higher-than-normal sea levels are red; lower-than-normal sea levels are blue. El Niño is visible as the red blob in the eastern equatorial Pacific. Extending the timeline of ocean surface topography measurements begun by the Topex/Poseidon and Jason 1 and 2 satellites, Jason 3 will make highly detailed measurements of sea-level on Earth to gain insight into ocean circulation and climate change. http://photojournal.jpl.nasa.gov/catalog/PIA20532

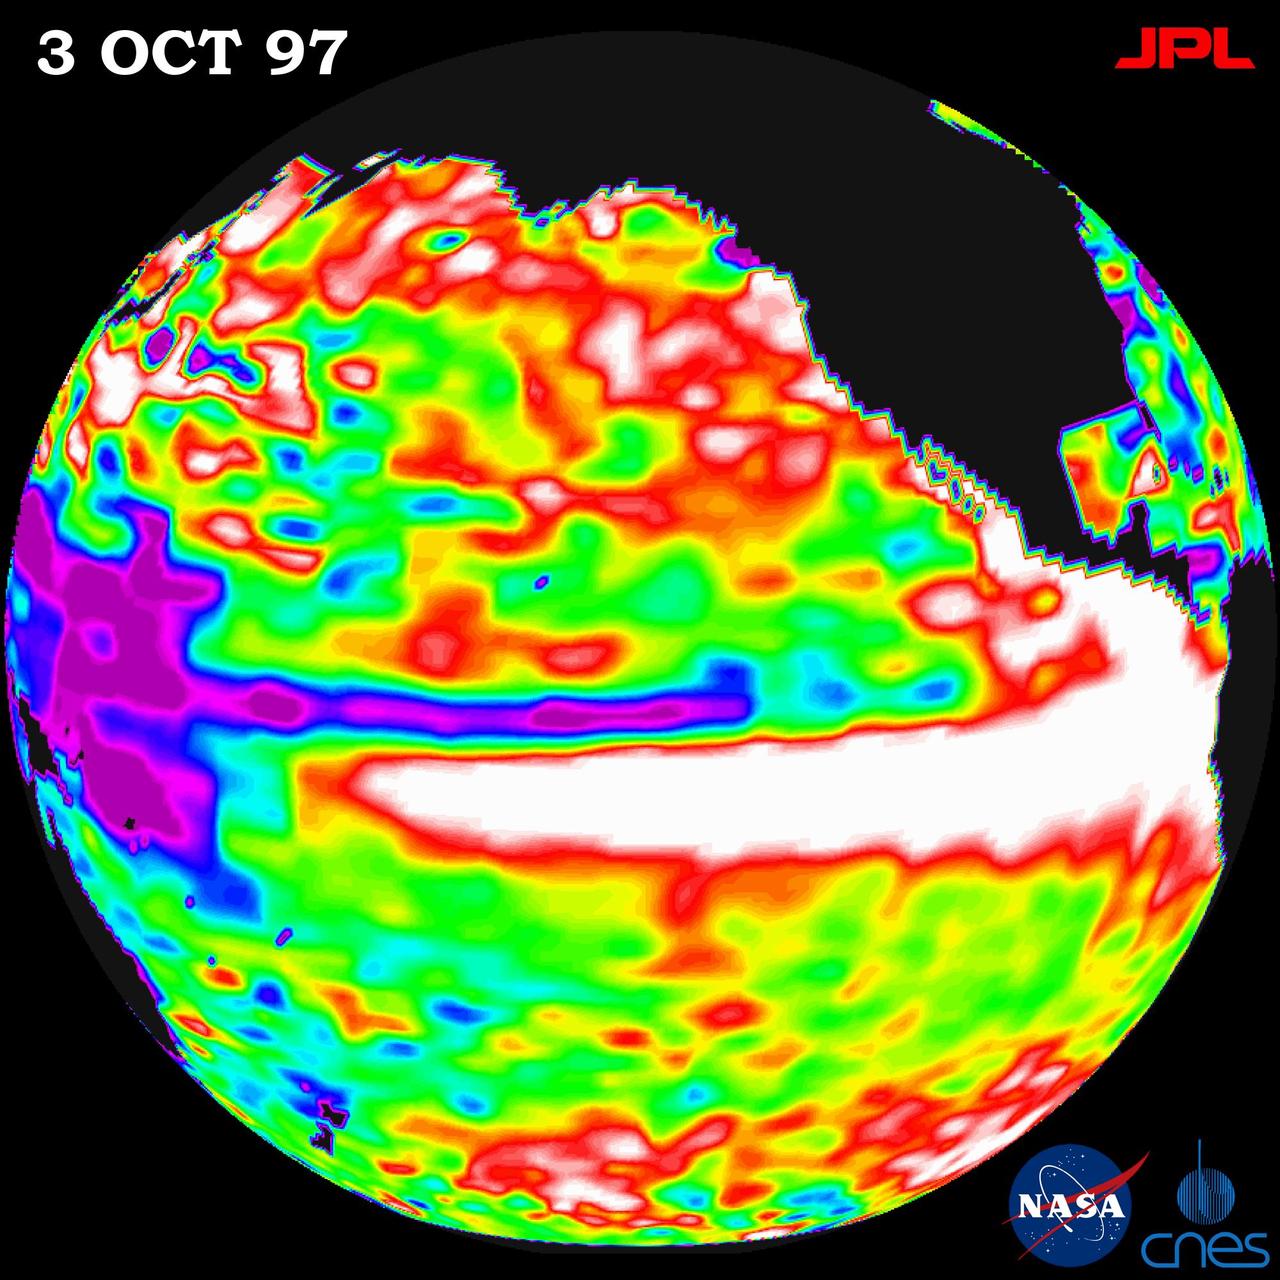
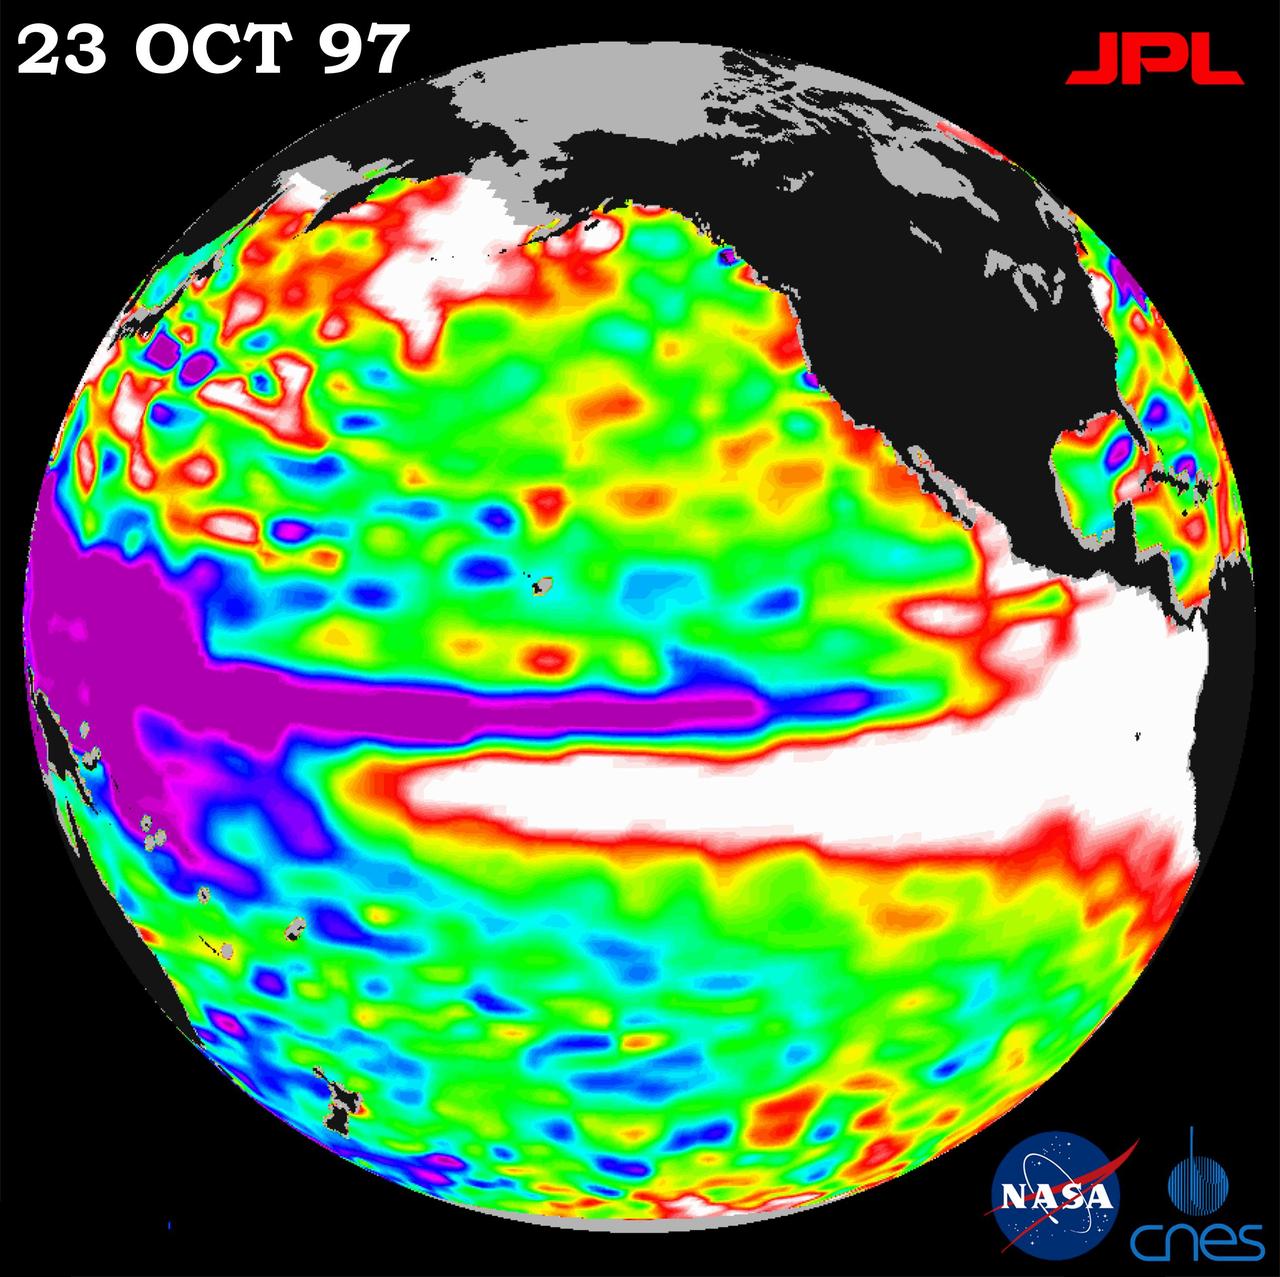
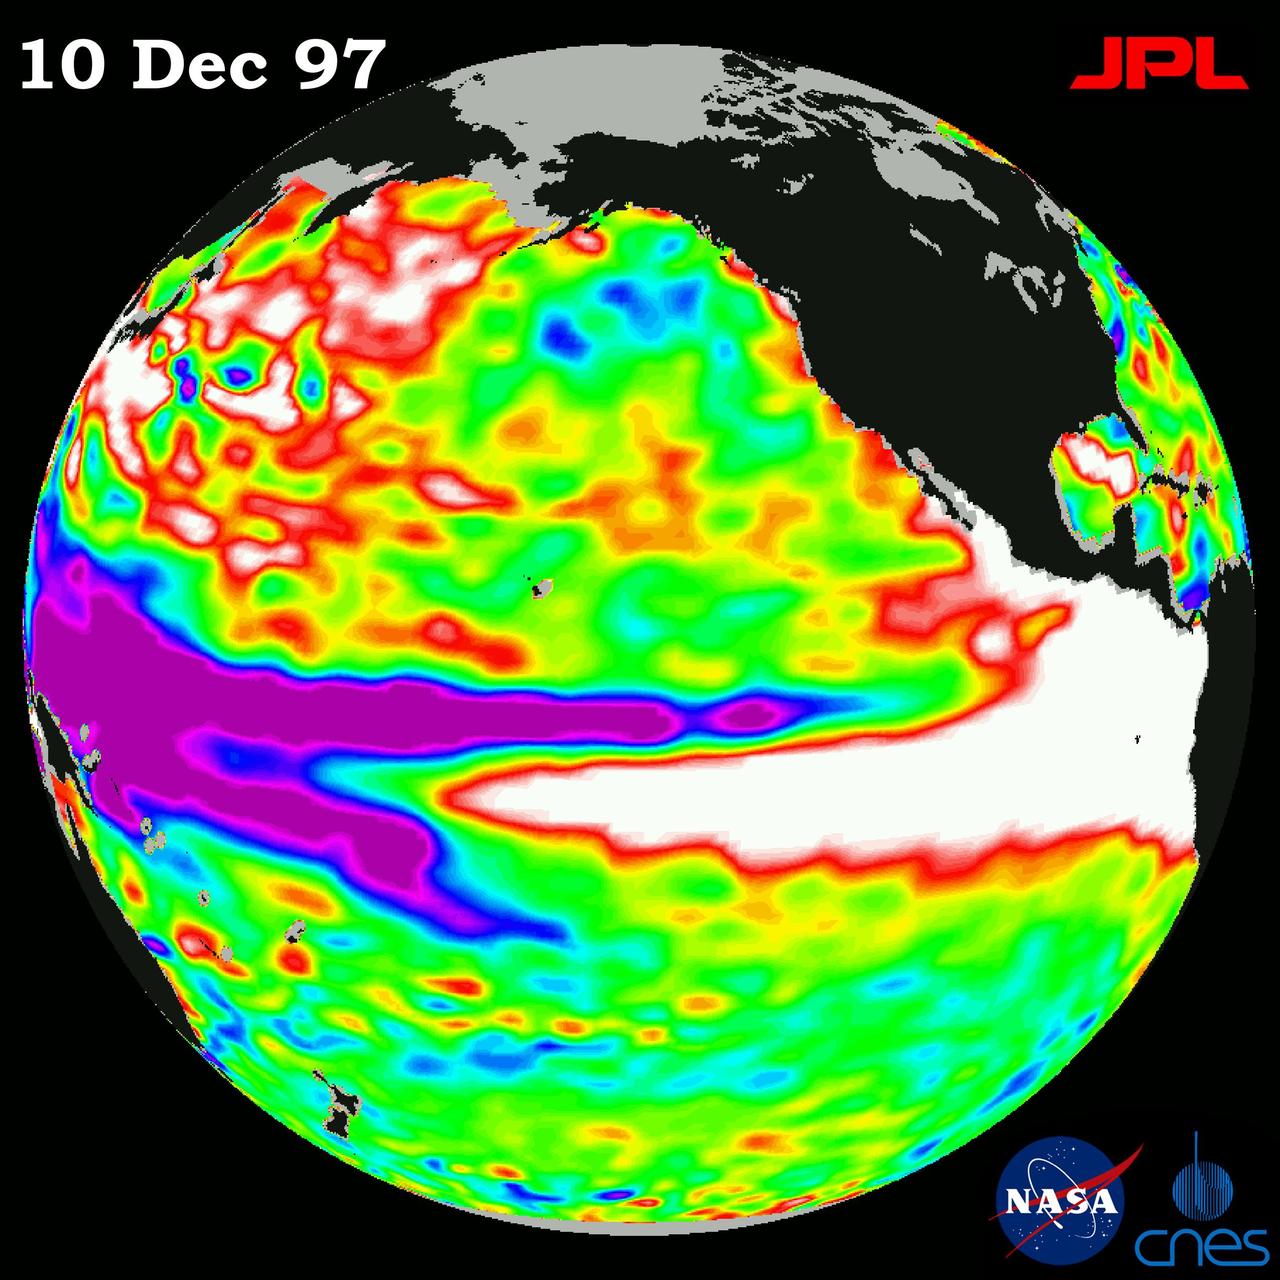
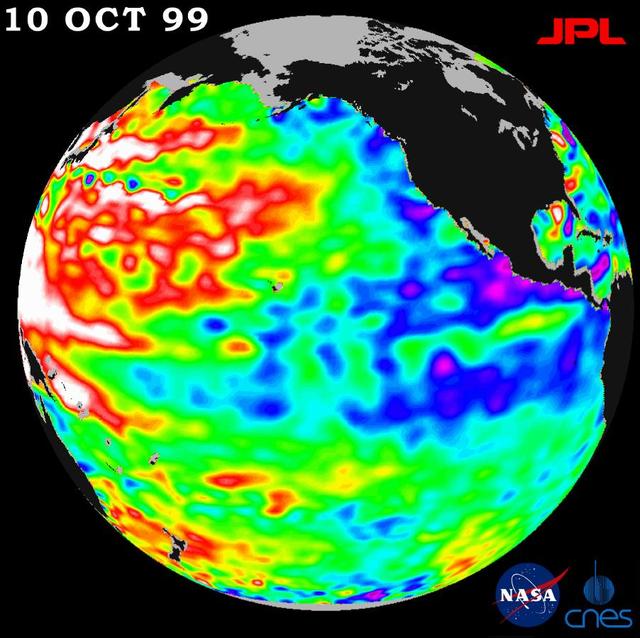
This image of the Pacific Ocean was produced using sea surface height measurements taken by the U.S./French TOPEX/Poseidon satellite. The image shows sea surface height relative to normal ocean conditions on Nov. 10, 1997.
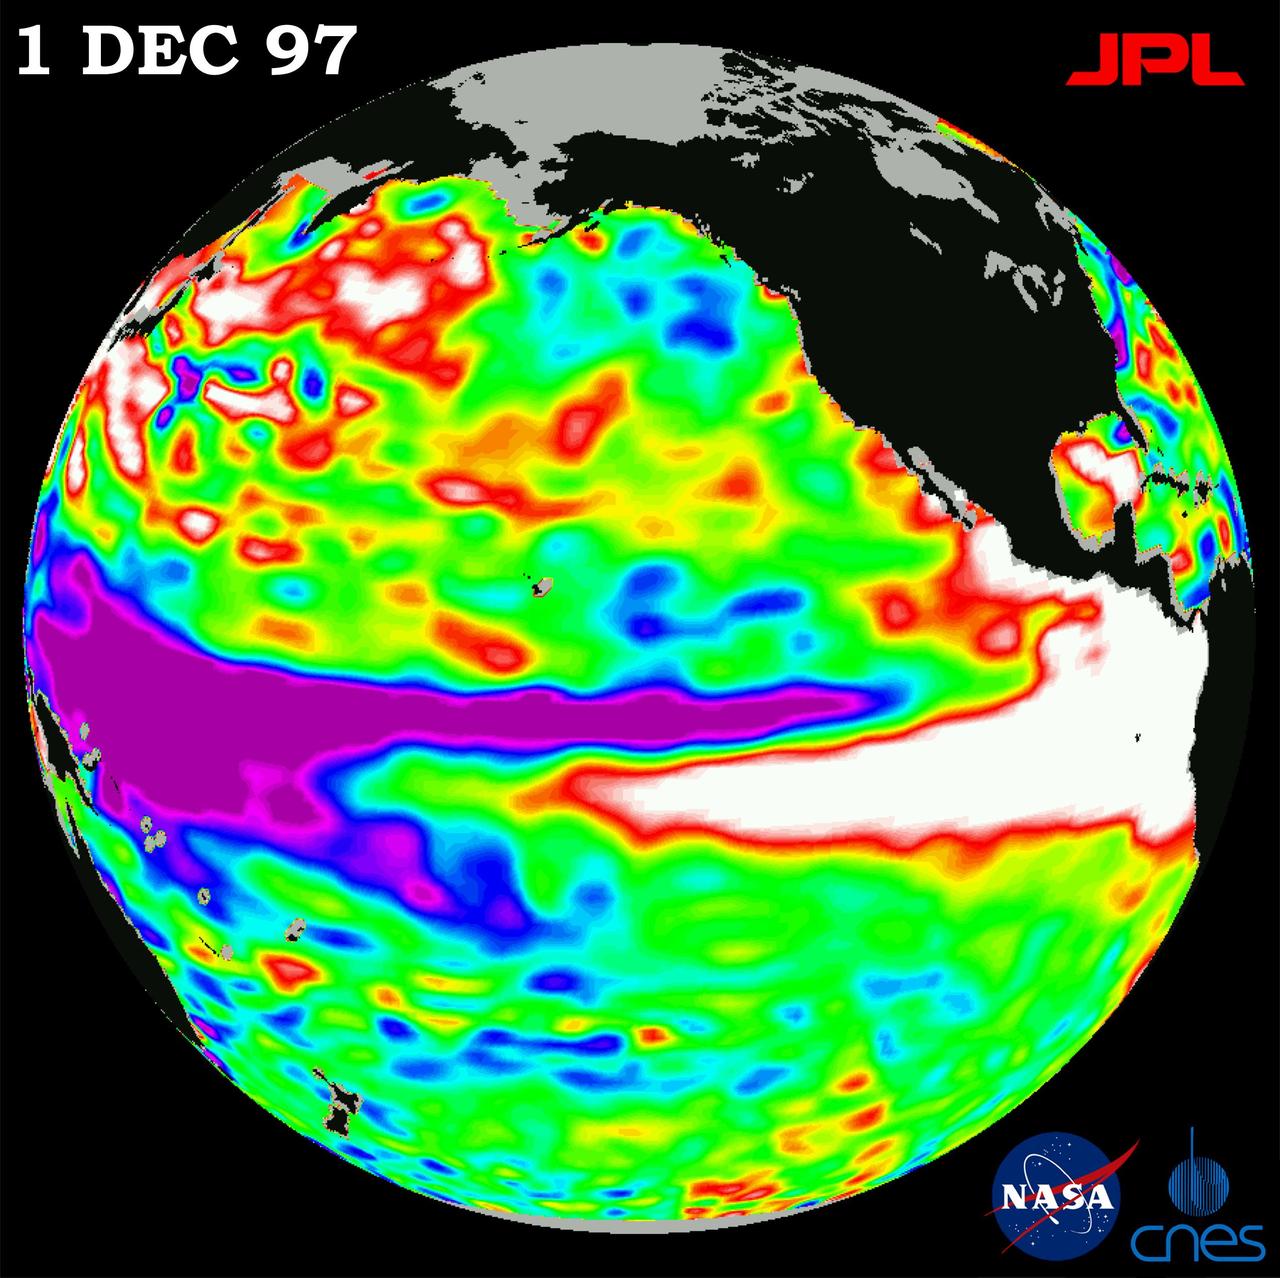
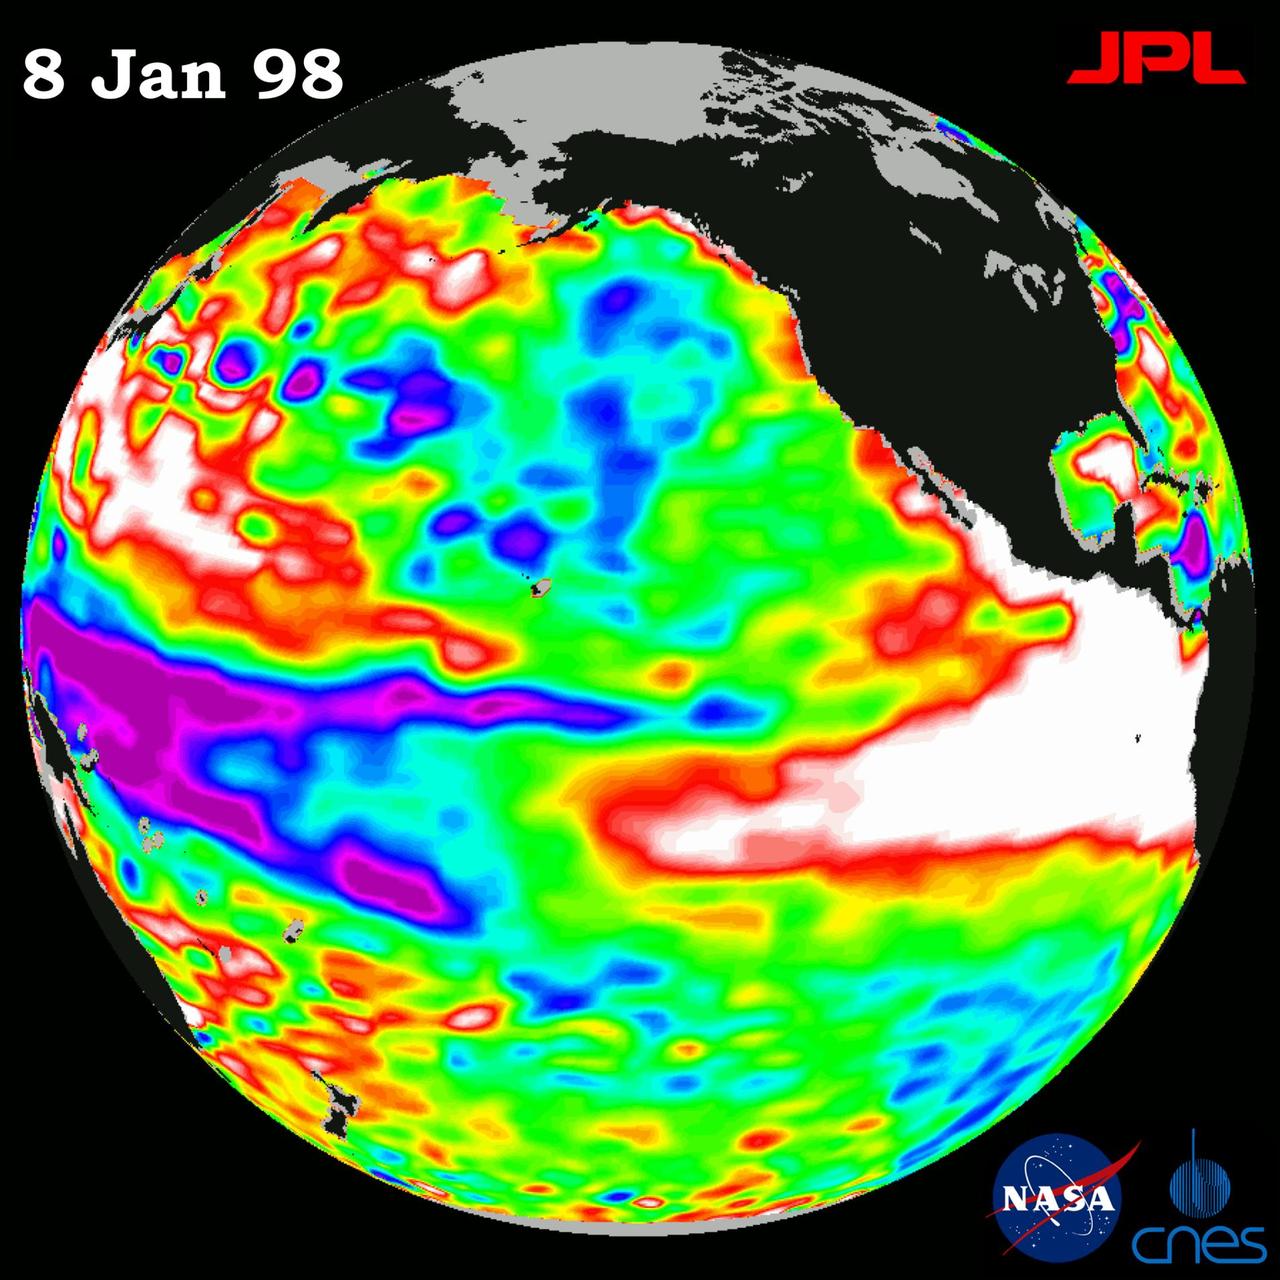
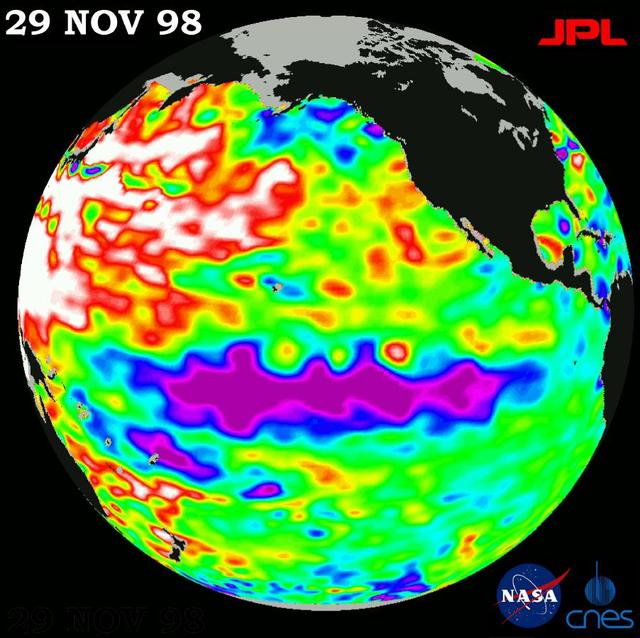
This image of the Pacific Ocean was produced using sea surface height measurements taken by NASA U.S./French TOPEX/Poseidon satellite. The image shows sea surface height relative to normal ocean conditions on Dec. 1, 1997.

This 1967 illustration compares the Apollo Saturn V Spacecraft of the Moon Landing era to the Statue of Liberty located on Liberty Island in New York City. The Apollo Saturn V, at 363 feet towers above Lady Liberty, as the statue is called, standing at 305 feet.
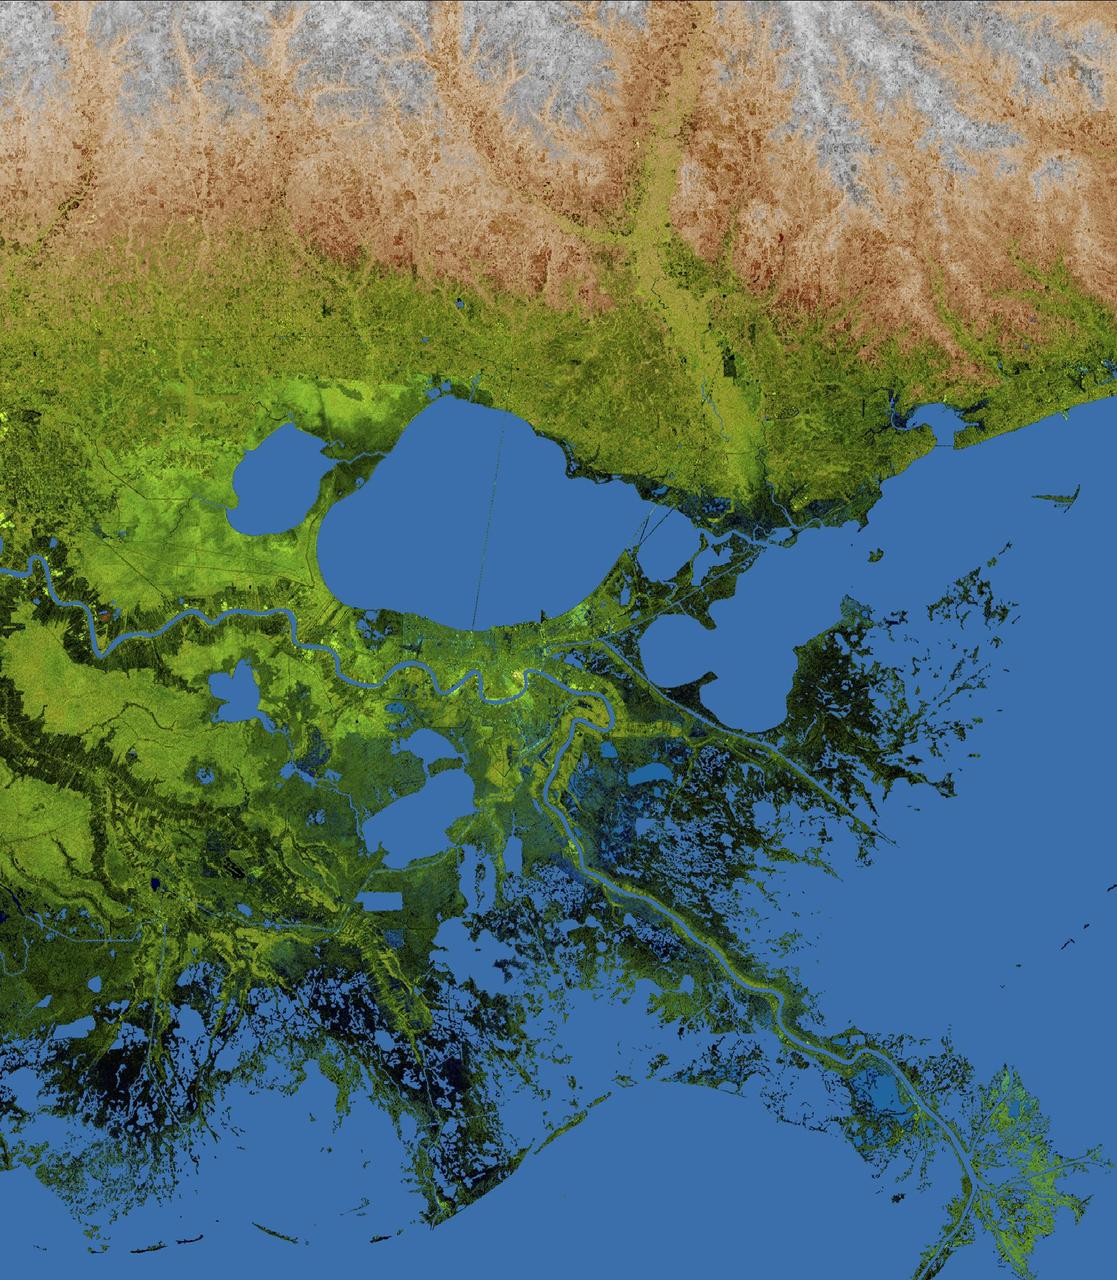
The geography of the New Orleans and Mississippi delta region is well shown in this radar image from the Shuttle Radar Topography Mission. In this image, bright areas show regions of high radar reflectivity, such as from urban areas, and elevations have been coded in color using height data also from the mission. Dark green colors indicate low elevations, rising through yellow and tan, to white at the highest elevations. New Orleans is situated along the southern shore of Lake Pontchartrain, the large, roughly circular lake near the center of the image. The line spanning the lake is the Lake Pontchartrain Causeway, the world's longest over water highway bridge. Major portions of the city of New Orleans are below sea level, and although it is protected by levees and sea walls, flooding during storm surges associated with major hurricanes is a significant concern. http://photojournal.jpl.nasa.gov/catalog/PIA04175
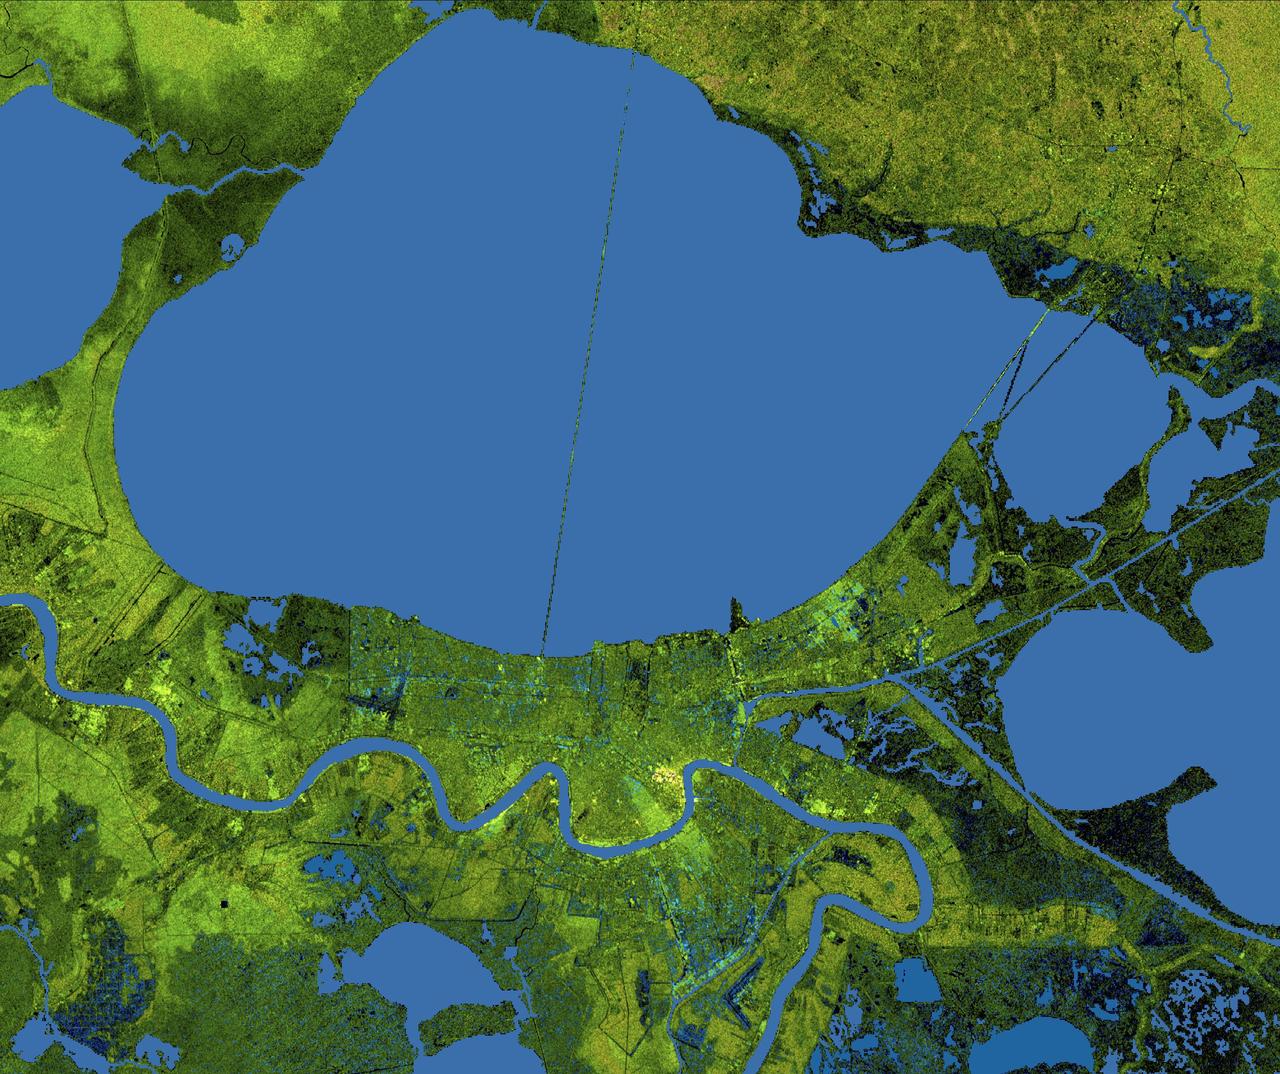
The city of New Orleans, situated on the southern shore of Lake Pontchartrain, is shown in this radar image from the Shuttle Radar Topography Mission (SRTM). In this image bright areas show regions of high radar reflectivity, such as from urban areas, and elevations have been coded in color using height data also from the SRTM mission. Dark green colors indicate low elevations, rising through yellow and tan, to white at the highest elevations. New Orleans is near the center of this scene, between the lake and the Mississippi River. The line spanning the lake is the Lake Pontchartrain Causeway, the world’s longest overwater highway bridge. Major portions of the city of New Orleans are actually below sea level, and although it is protected by levees and sea walls that are designed to protect against storm surges of 18 to 20 feet, flooding during storm surges associated with major hurricanes is a significant concern. http://photojournal.jpl.nasa.gov/catalog/PIA04174
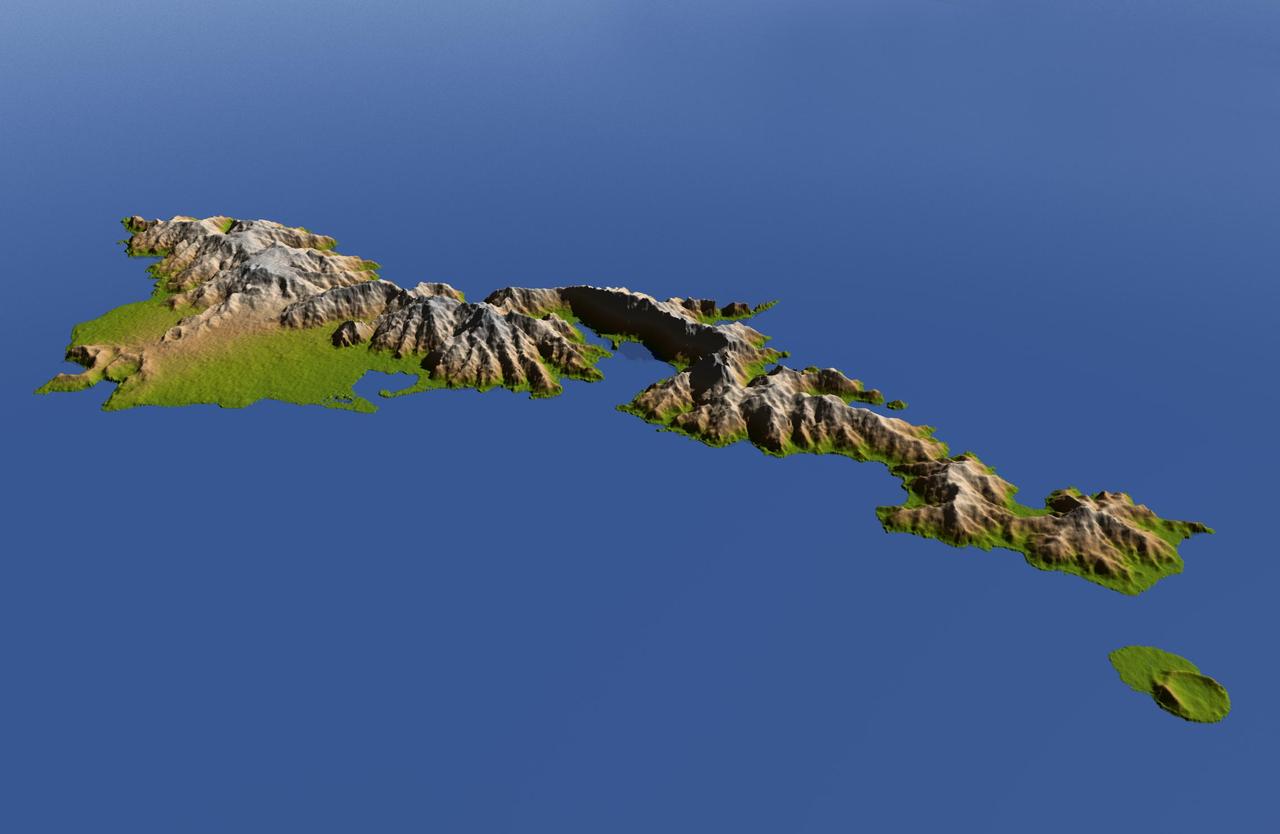
The topography of Tutuila, largest of the islands of American Samoa, is well shown in this color-coded perspective view generated with digital elevation data from the Shuttle Radar Topography Mission (SRTM.) The total area of Tutuila is about 141.8 square kilometers (54.8 square miles), slightly larger than San Francisco. The large bay near the center in this view is Pago Pago Harbor, actually a submerged volcanic crater whose south wall collapsed millions of years ago. Adjacent to the harbor is Pago Pago, the capital of American Samoa, and to the left (west) of the harbor in this view is Matafao Peak, Tutuila’s highest point at 653 meters (2,142 feet). On September 29, 2009, a tsunami generated by a major undersea earthquake located about 200 kilometers (120 miles) southwest of Tutuila inundated the more heavily populated southern coast of the island with an ocean surge more than 3 meters (10 feet) deep, causing scores of casualties. Digital topographic data such as those produced by SRTM aid researchers and planners in predicting which coastal regions are at the most risk from such waves, as well as from the more common storm surges caused by tropical storms and even sea level rise. Two visualization methods were combined to produce the image: shading and color coding of topographic height. The shaded image was derived by computing topographic slope in the northeast-southwest direction, so that northeast slopes appear bright and southwest slopes appear dark. Color coding is directly related to topographic height, with green at the lower elevations, rising through yellow and tan, to white at the highest elevations. The image was then projected using the elevation data to produce this perspective view, with the topography exaggerated by a factor of two. http://photojournal.jpl.nasa.gov/catalog/PIA11965

This image of the Pacific Ocean was produced using sea surface height measurements taken by NASA U.S.-French TOPEX/Poseidon satellite.
This image of the Pacific Ocean was produced using sea surface height measurements taken by NASA U.S.-French TOPEX/Poseidon satellite.
This image of the Pacific Ocean was produced using sea-surface height measurements taken by NASA U.S.-French TOPEX/Poseidon satellite.
This image of the Pacific Ocean was produced using sea-surface height measurements taken by NASA U.S.-French TOPEX/Poseidon satellite.
This image of the Pacific Ocean was produced using sea surface height measurements taken by NASA U.S./French TOPEX/Poseidon satellite.
This image of the Pacific Ocean was produced using sea-surface height measurements taken by NASA U.S.-French TOPEX/Poseidon satellite.
This image of the Pacific Ocean was produced using sea-surface height measurements taken by NASA U.S.-French TOPEX/Poseidon satellite.
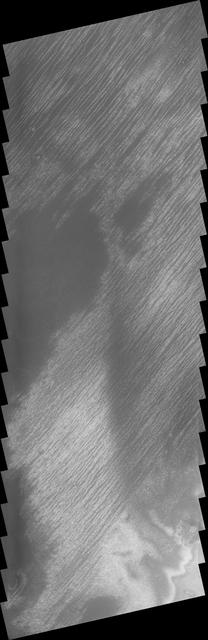
This linear features near the South Polar Cap appeared during the height of southern summer
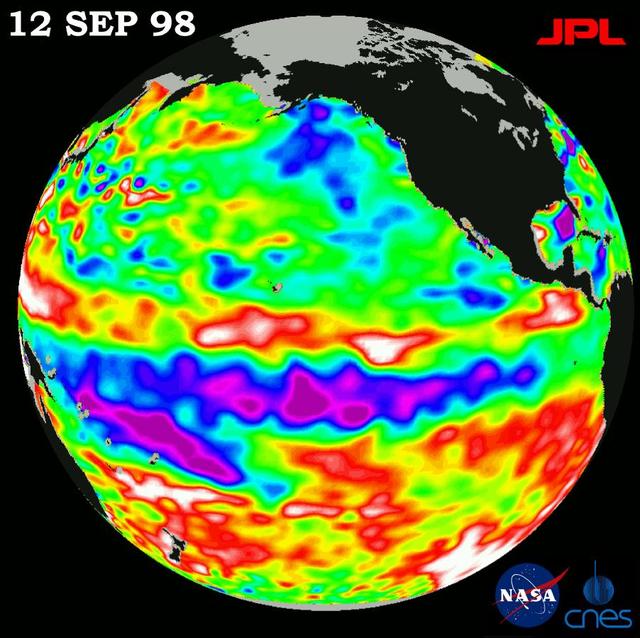
This image of the Pacific Ocean was produced using sea-surface height measurements taken by NASA U.S.-French TOPEX/Poseidon satellite.
This image of the Pacific Ocean was produced using sea surface height measurements taken by NASA U.S./French TOPEX/POSEIDON satellite.
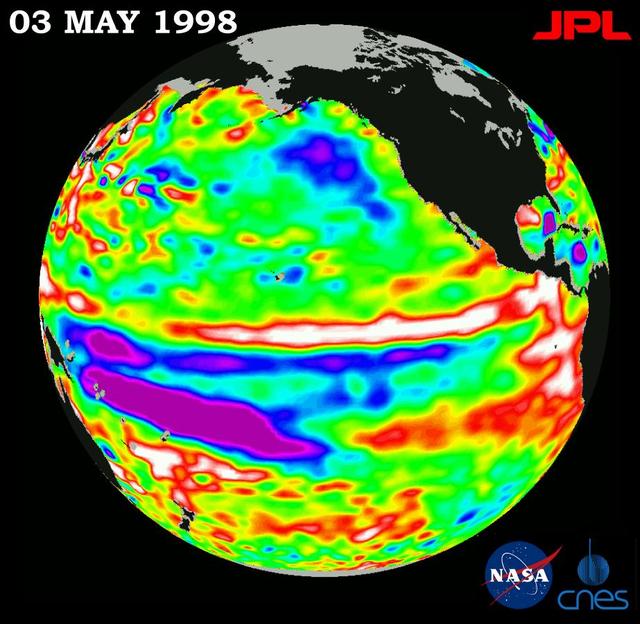
This image of the Pacific Ocean was produced using sea-surface height measurements taken by NASA U.S.-French TOPEX/Poseidon satellite.
This image of the Pacific Ocean was produced using sea surface height measurements taken by NASA U.S.-French TOPEX/Poseidon satellite.
This image of the Pacific Ocean was produced using sea-surface height measurements taken by NASA U.S.-French TOPEX/Poseidon satellite.
This image of the Pacific Ocean was produced using sea surface height measurements taken by NASA U.S.-French TOPEX/Poseidon satellite.
This image of the Pacific Ocean was produced using sea surface height measurements taken by NASA U.S./French TOPEX/POSEIDON satellite.
This image of the Pacific Ocean was produced using sea surface height measurements taken by NASA U.S./French TOPEX/POSEIDON satellite.
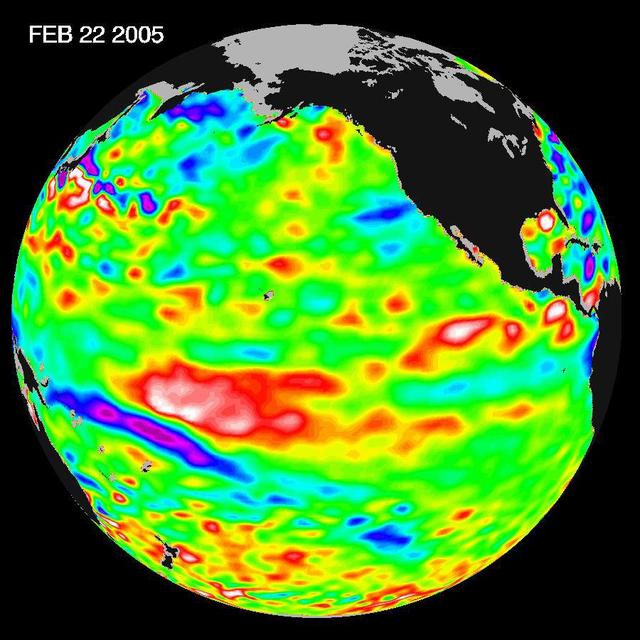
Recent sea-level height data from NASA U.S./France Jason altimetric satellite during a 10-day cycle ending February 22, 2005, show that the central equatorial Pacific continues to exhibit an area of higher-than-normal sea surface heights.
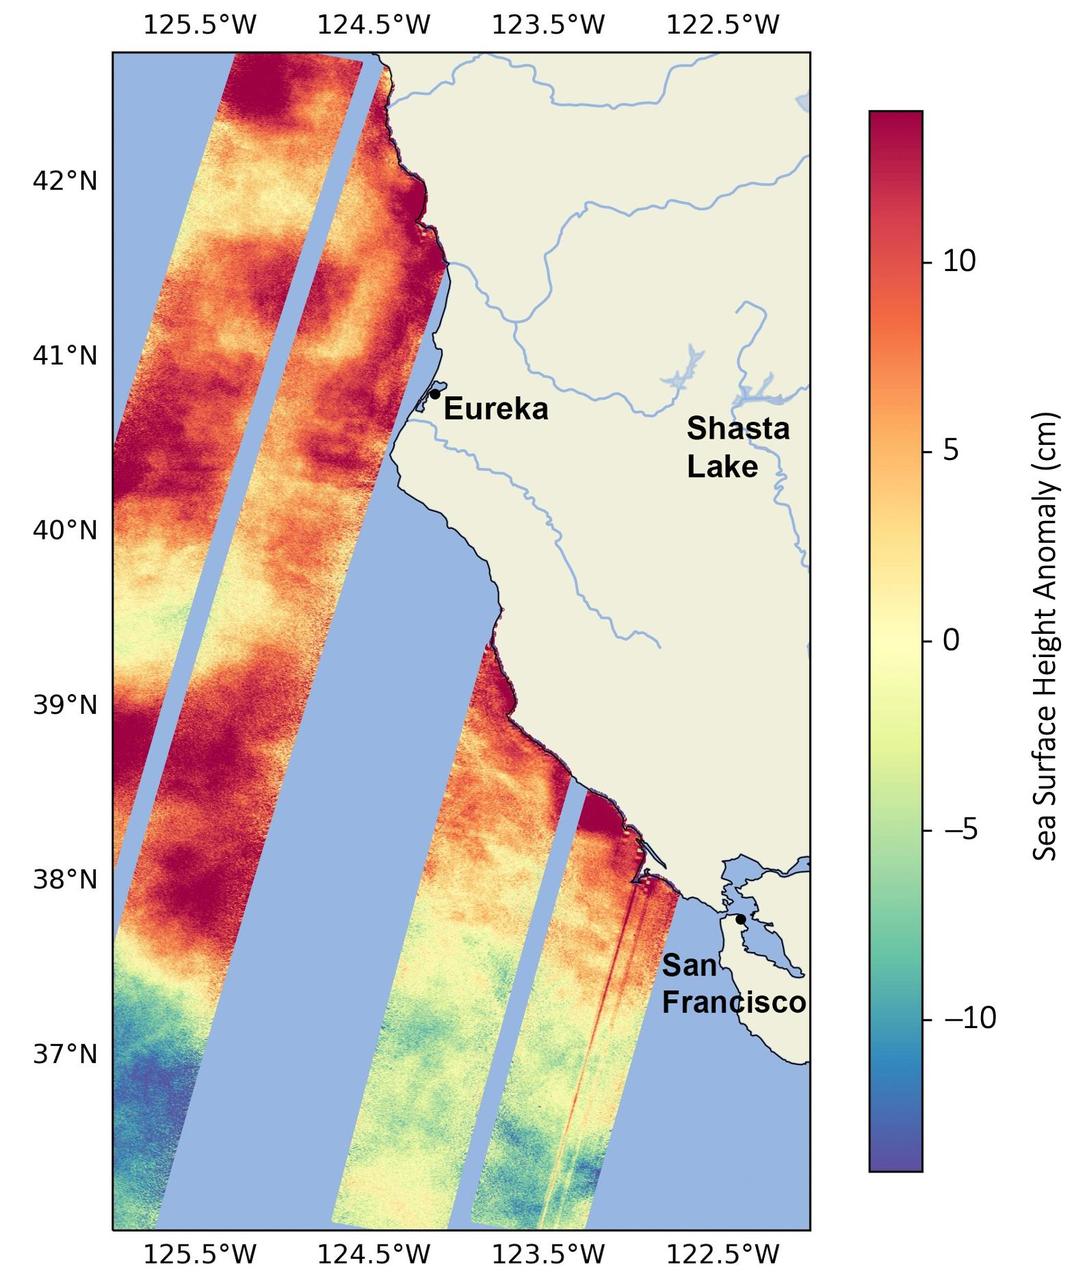
This data visualization image above shows sea surface heights off the northern California coast in August 2023 as measured by the Surface Water and Ocean Topography (SWOT) satellite. Red indicates higher-than-average ocean heights, while blue represents lower-than-average heights. Warm ocean waters from the developing El Niño are shifting north along coastlines in the eastern Pacific Ocean. Along the coast of California, these warm waters are interacting with a persistent marine heat wave that recently influenced the development of Hurricane Hilary. SWOT is able to spot the movement of these warm ocean waters in unprecedented detail. The SWOT science team made the measurements with the Ka-band Radar Interferometer (KaRIn) instrument. With two antennas spread 33 feet (10 meters) apart on a boom, KaRIn produces a pair of data swaths as it circles the globe, bouncing radar pulses off the water's surface to collect water-height measurements. The visualization combines data from two passes of the SWOT satellite. https://photojournal.jpl.nasa.gov/catalog/PIA26091
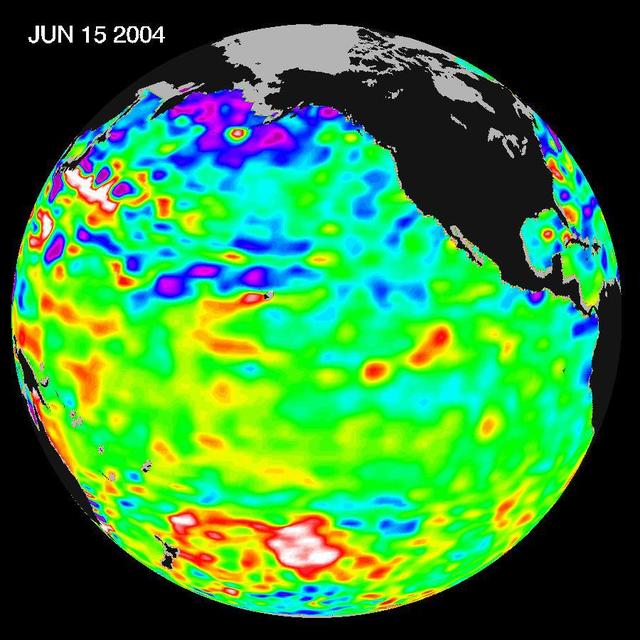
Recent sea level height data from NASA U.S./France Jason altimetric satellite during a 10-day cycle ending June 15, 2004.
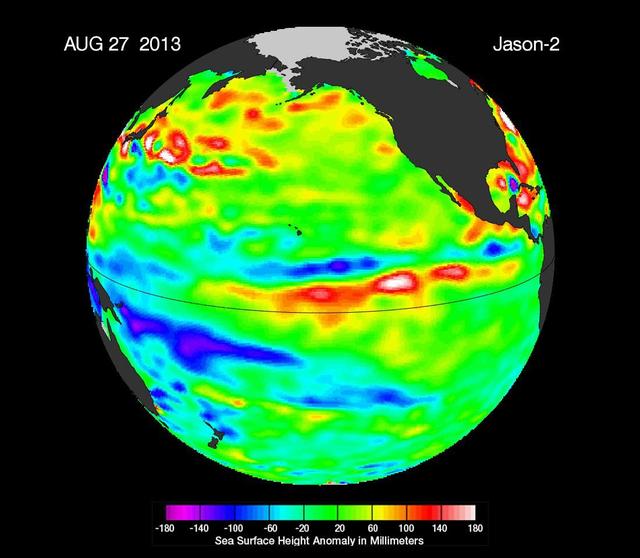
New data from NASA Jason-2 satellite show near-normal sea surface heights in the equatorial Pacific Ocean persisting for a 16th straight month.
These images of the Pacific Ocean near Indonesia were produced using sea surface height measurements taken by NASA U.S.-French TOPEX/Poseidon satellite.
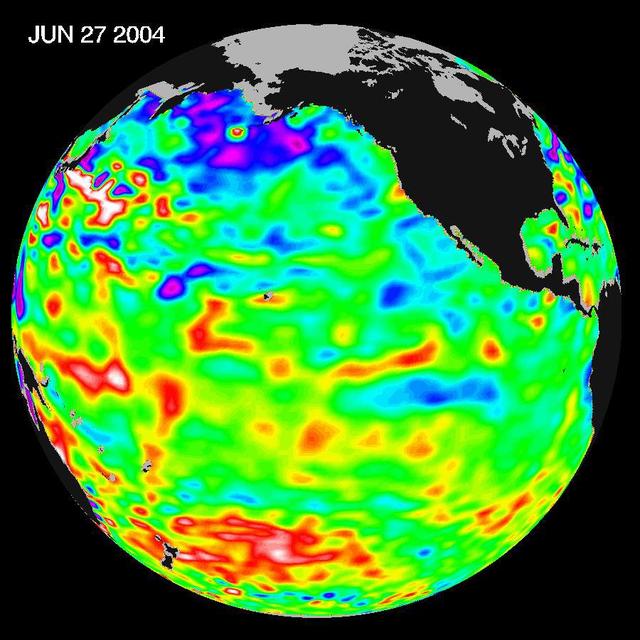
Recent sea level height data from NASA U.S./France Jason altimetric satellite during a 10-day cycle ending June 27, 2004.
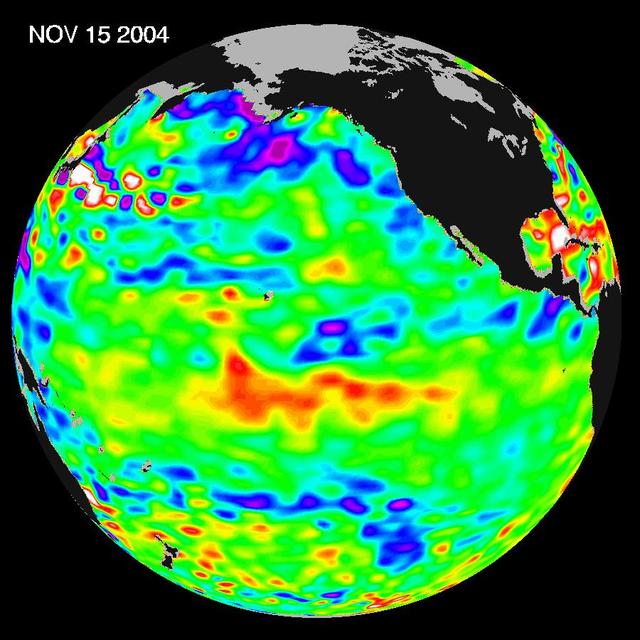
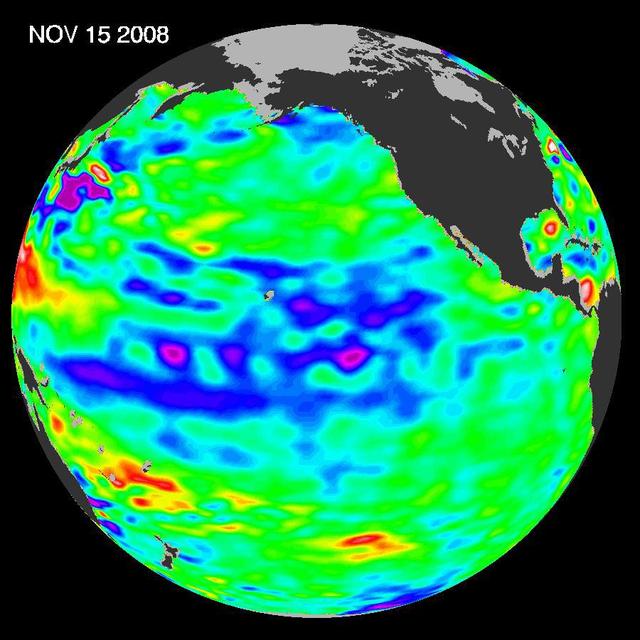
Recent sea-level height data from NASA U.S./France Jason altimetric satellite during a 10-day cycle ending November 15, 2004.
NASA Terra spacecraft acquired this sequence of images and cloud-top height observations for Hurricane Wilma as it progressed across the Caribbean in October 2005.
Cloud-top radiance and height characteristics of Hurricane Isabel are depicted in these data products and animations from NASA Terra spacecraft on September 7, 2003.
A giant horseshoe pattern of higher than normal sea-surface heights developing over the last year is beginning to dominate the entire western Pacific and Asiatic oceans.
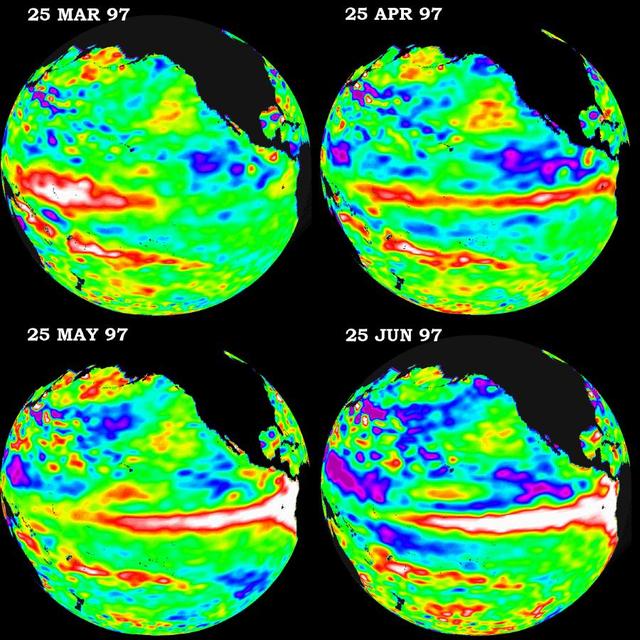
These four views of the Pacific Ocean were produced using sea surface height measurements taken by NASA U.S./French TOPEX/POSEIDON satellite.
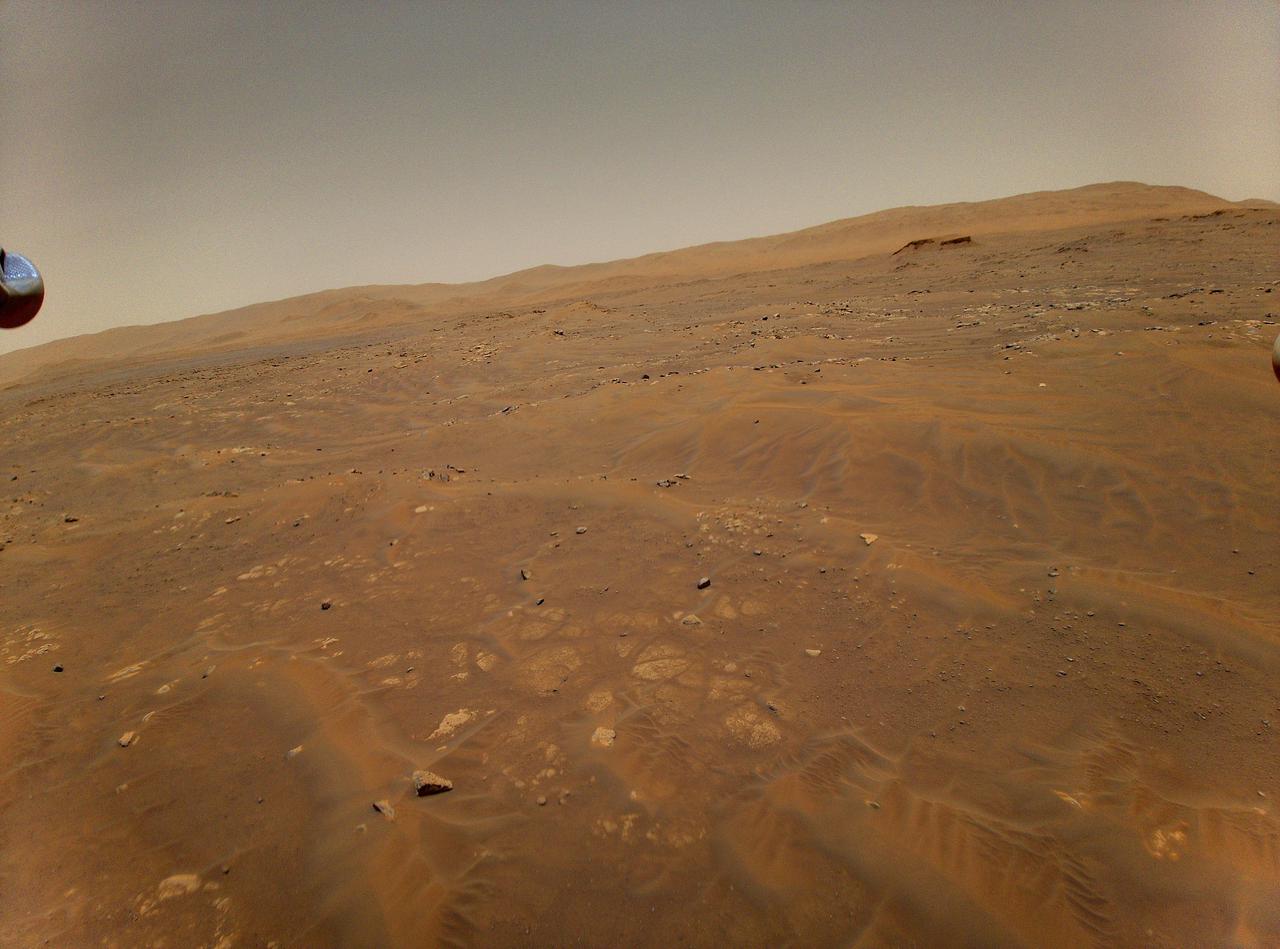
This image of Mars was taken from the height of 33 feet (10 meters) by NASA's Ingenuity Mars helicopter during its sixth flight, on May 22, 2021. https://photojournal.jpl.nasa.gov/catalog/PIA24600
This map shows sea level measured by the Sentinel-6 Michael Freilich satellite from June 5 to15. Red areas are regions where sea level is higher than normal, and blue areas indicate areas where it's lower than normal. The measurements are part of a set of data streams that become available to the public hours to a couple of days after the satellite collects them. The difference in when the products become available balances accuracy with delivery timeliness for tasks like forecasting the weather or helping to monitor the formation of hurricanes. The satellite, named after former NASA Earth Science Division Director Michael Freilich, collects its measurements for about 90% of the world's oceans. The spacecraft is one of two satellites that compose the Copernicus Sentinel-6/Jason-CS (Continuity of Service) mission. The second satellite, Sentinel-6B, is slated for launch in 2025. Together, they are the latest in a series of spacecraft starting with TOPEX/Poseidon in 1992 and continuing with the Jason series of satellites that have been gathering precise ocean height measurements for nearly 30 years. Shortly after launch in Nov. 2020, Sentinel-6 Michael Freilich moved into position, trailing the current reference sea level satellite Jason-3 by 30 seconds. Scientists and engineers then spent time cross-calibrating the data collected by both satellites to ensure the continuity of measurements between the two. Once assured of the data quality, Sentinel-6 Michael Freilich will then become the primary sea level satellite. https://photojournal.jpl.nasa.gov/catalog/PIA24533
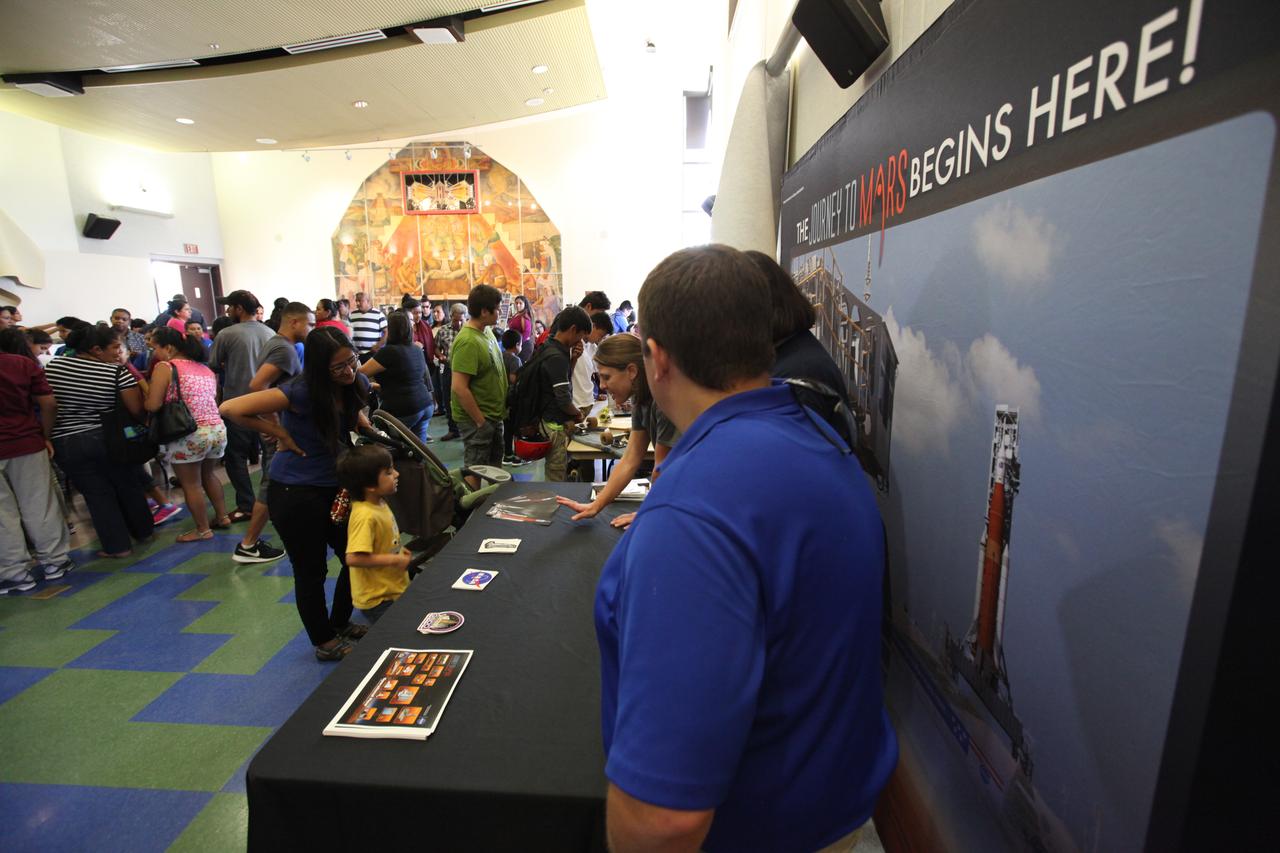
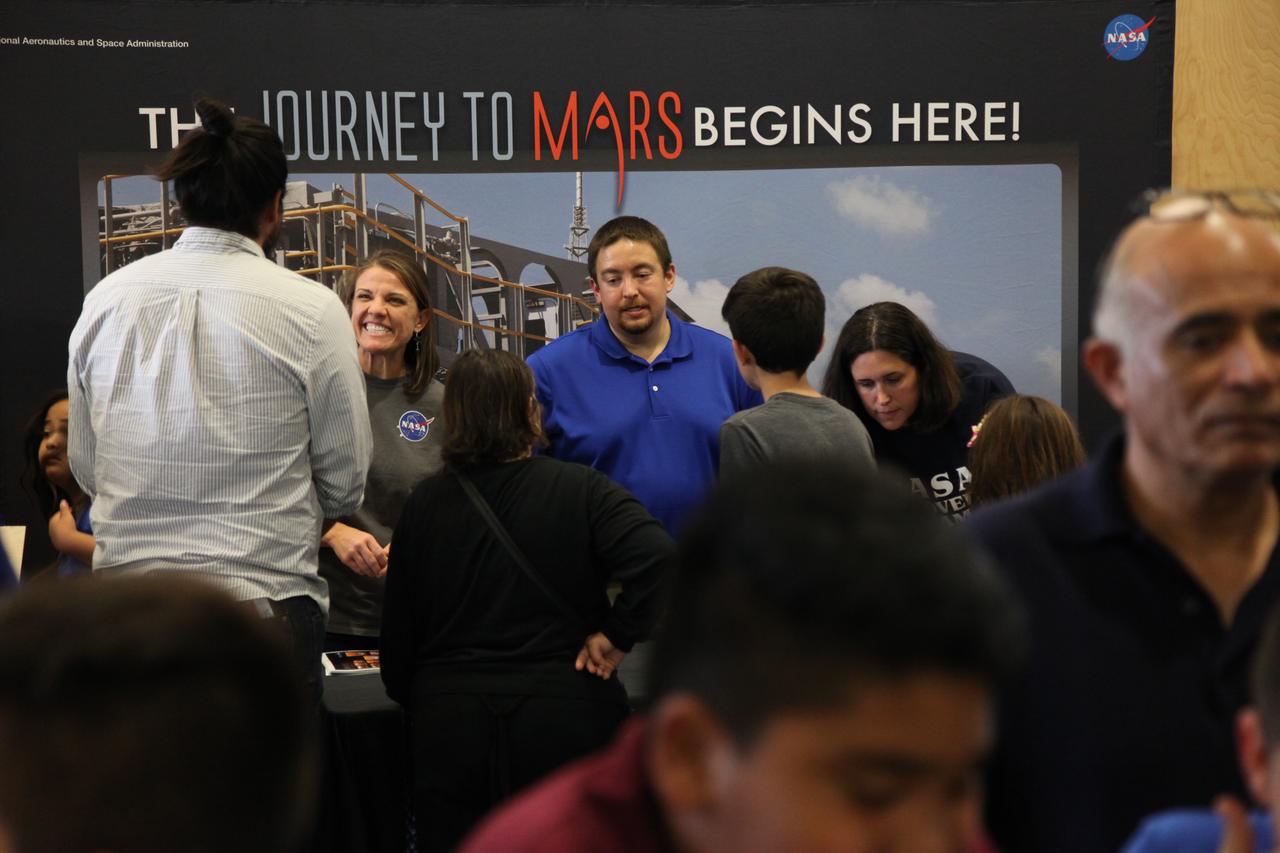
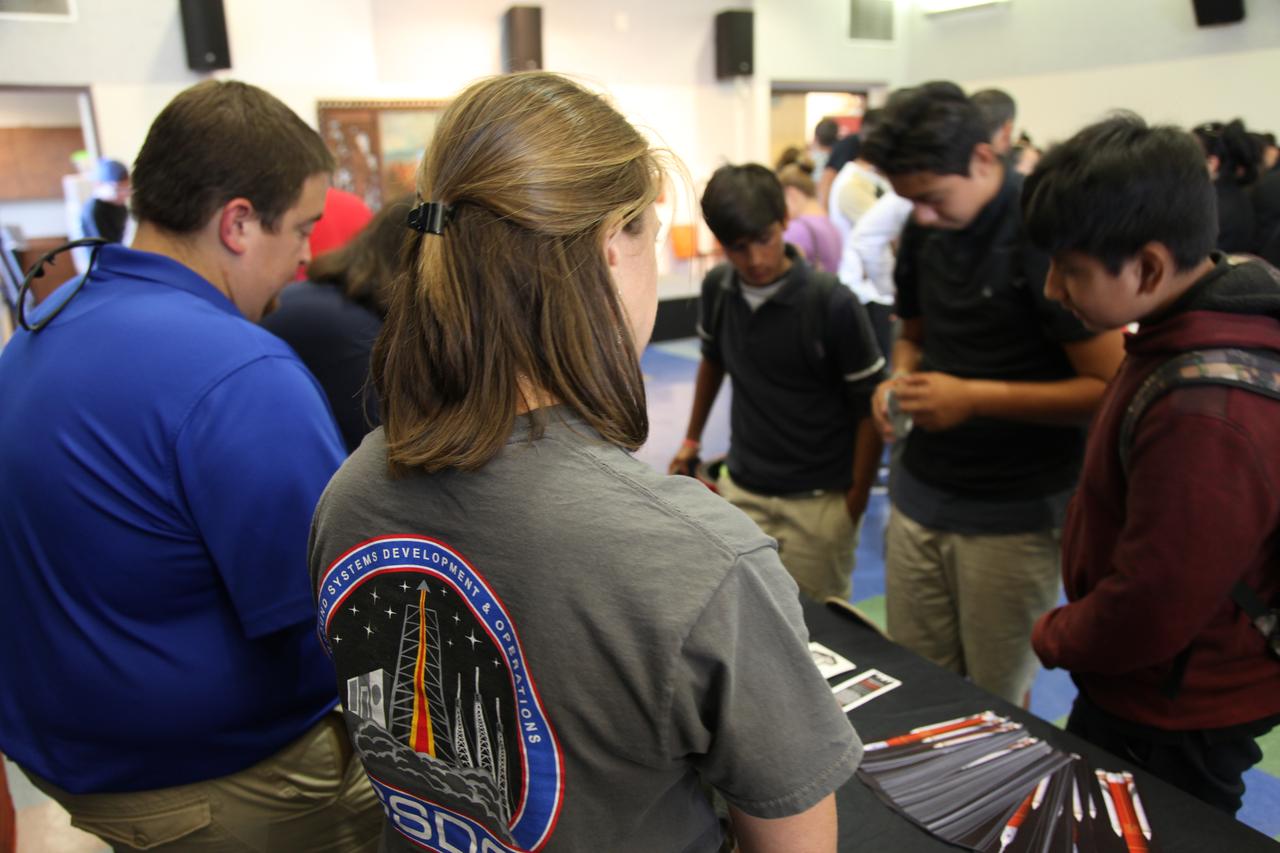
Students visit the displays at the Logan Heights Library in San Diego, California, during the “52 Weeks of Science” celebration. The Ground Systems Development and Operations (GSDO) Program is participating in the special event with a Journey to Mars display before the start of Underway Recovery Test 5 using a test version of the Orion spacecraft in the Pacific Ocean off the coast of California. The test will allow NASA, Orion manufacturer Lockheed Martin and the U.S. Navy to demonstrate and evaluate the recovery processes, procedures, hardware and personnel necessary for recovery of the Orion crew module on its return from a deep space mission. Orion is the exploration spacecraft designed to carry astronauts to destinations not yet explored by humans, including an asteroid and NASA Journey to Mars. It will have emergency abort capability, sustain the crew during space travel and provide safe re-entry from deep space return velocities. Orion is scheduled to launch atop NASA’s Space Launch System rocket in 2018. For more information, visit http://www.nasa.gov/orion.
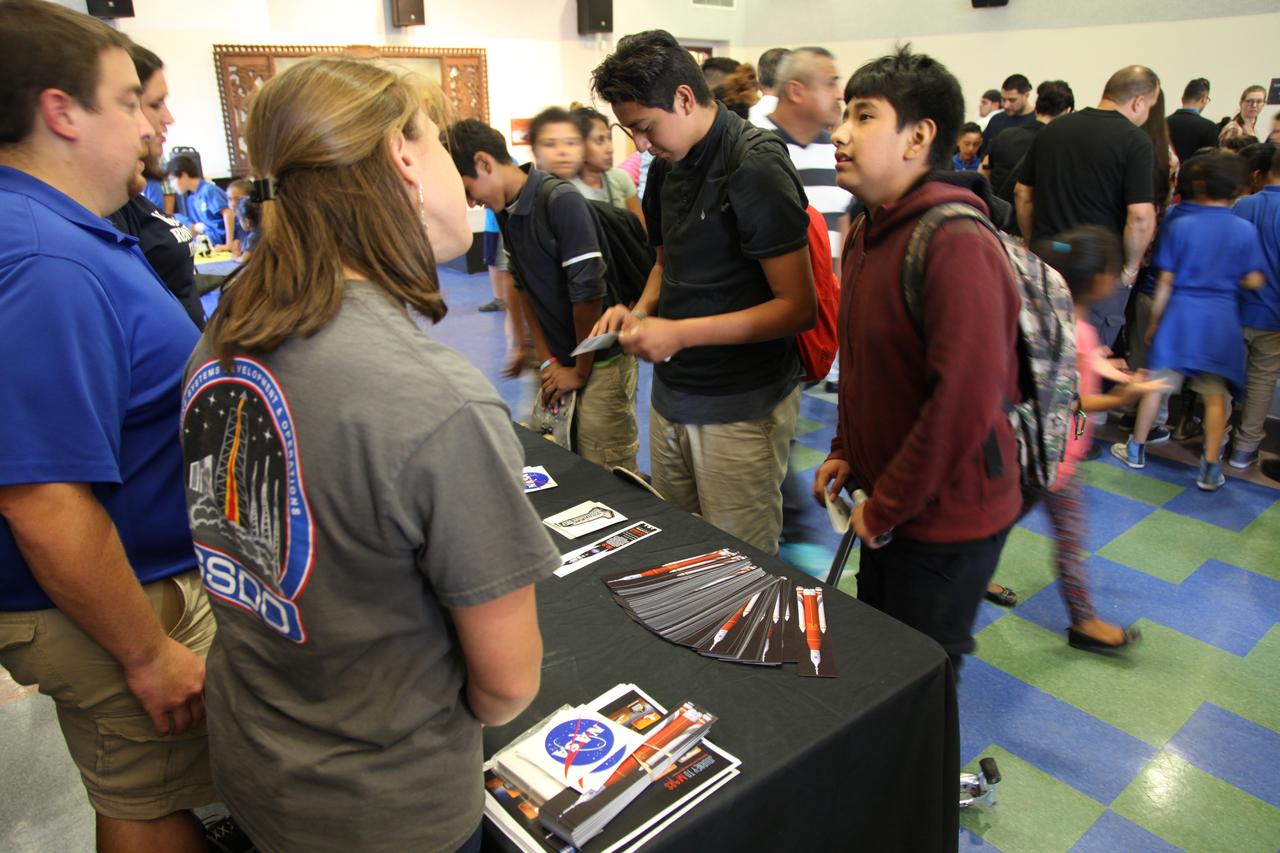
Students visit the displays at the Logan Heights Library in San Diego, California, during the “52 Weeks of Science” celebration. The Ground Systems Development and Operations (GSDO) Program is participating in the special event with a Journey to Mars display before the start of Underway Recovery Test 5 using a test version of the Orion spacecraft in the Pacific Ocean off the coast of California. The test will allow NASA, Orion manufacturer Lockheed Martin and the U.S. Navy to demonstrate and evaluate the recovery processes, procedures, hardware and personnel necessary for recovery of the Orion crew module on its return from a deep space mission. Orion is the exploration spacecraft designed to carry astronauts to destinations not yet explored by humans, including an asteroid and NASA Journey to Mars. It will have emergency abort capability, sustain the crew during space travel and provide safe re-entry from deep space return velocities. Orion is scheduled to launch atop NASA’s Space Launch System rocket in 2018. For more information, visit http://www.nasa.gov/orion.
Students visit the displays at the Logan Heights Library in San Diego, California, during the “52 Weeks of Science” celebration. The Ground Systems Development and Operations (GSDO) Program is participating in the special event with a Journey to Mars display before the start of Underway Recovery Test 5 using a test version of the Orion spacecraft in the Pacific Ocean off the coast of California. The test will allow NASA, Orion manufacturer Lockheed Martin and the U.S. Navy to demonstrate and evaluate the recovery processes, procedures, hardware and personnel necessary for recovery of the Orion crew module on its return from a deep space mission. Orion is the exploration spacecraft designed to carry astronauts to destinations not yet explored by humans, including an asteroid and NASA Journey to Mars. It will have emergency abort capability, sustain the crew during space travel and provide safe re-entry from deep space return velocities. Orion is scheduled to launch atop NASA’s Space Launch System rocket in 2018. For more information, visit http://www.nasa.gov/orion.

A young student visits the displays at the Logan Heights Library in San Diego, California, during the “52 Weeks of Science” celebration. The Ground Systems Development and Operations (GSDO) Program is participating in the special event with a Journey to Mars display before the start of Underway Recovery Test 5 using a test version of the Orion spacecraft in the Pacific Ocean off the coast of California. The test will allow NASA, Orion manufacturer Lockheed Martin and the U.S. Navy to demonstrate and evaluate the recovery processes, procedures, hardware and personnel necessary for recovery of the Orion crew module on its return from a deep space mission. Orion is the exploration spacecraft designed to carry astronauts to destinations not yet explored by humans, including an asteroid and NASA Journey to Mars. It will have emergency abort capability, sustain the crew during space travel and provide safe re-entry from deep space return velocities. Orion is scheduled to launch atop NASA’s Space Launch System rocket in 2018. For more information, visit http://www.nasa.gov/orion.

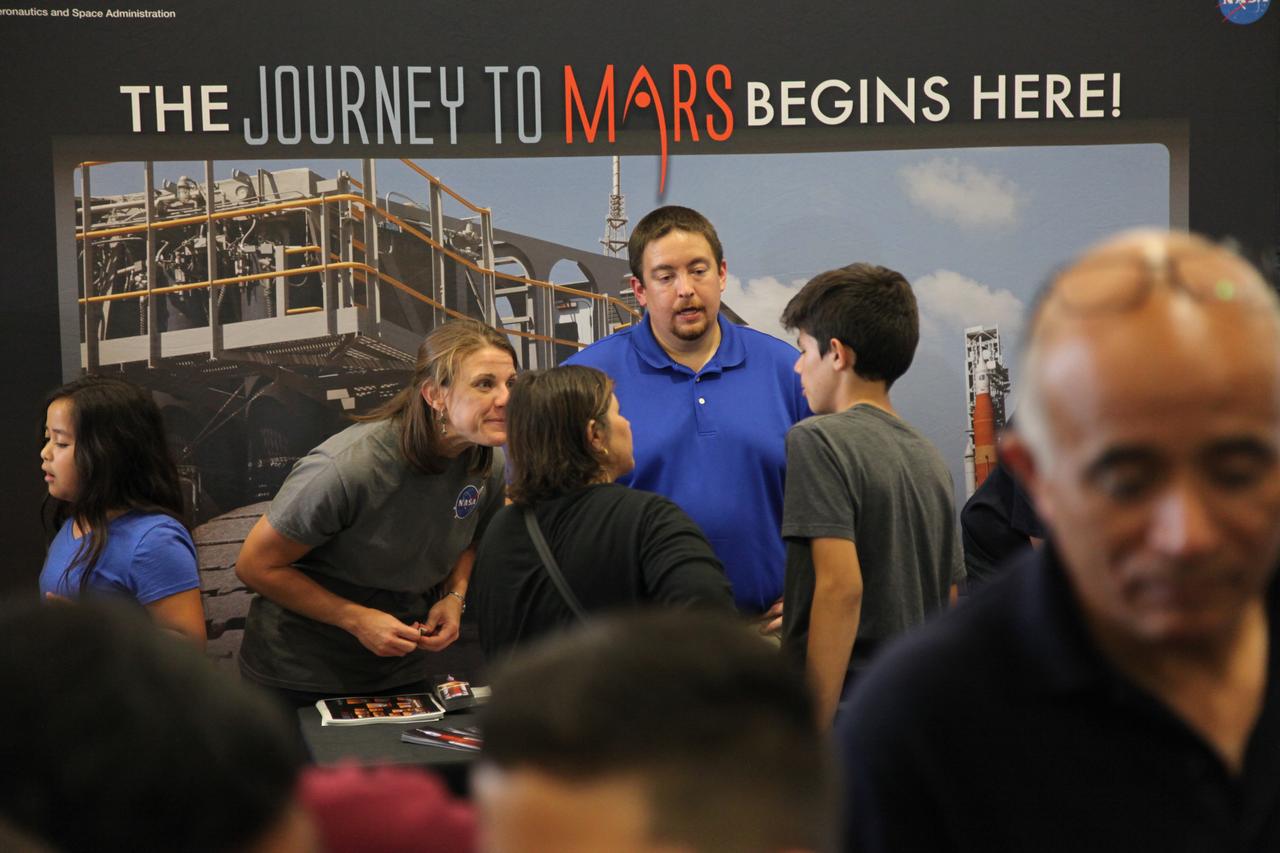
Melissa Jones, center, Ground Systems Development and Operation Program (GSDO) Landing and Recovery director, speaks to a student during the “52 Weeks of Science” celebration at the Logan Heights Library in San Diego, California. GSDO is participating in the special event before the start of Underway Recovery Test 5 using a test version of the Orion spacecraft in the Pacific Ocean off the coast of California. The test will allow NASA, Orion manufacturer Lockheed Martin and the U.S. Navy to demonstrate and evaluate the recovery processes, procedures, hardware and personnel necessary for recovery of the Orion crew module on its return from a deep space mission. Orion is the exploration spacecraft designed to carry astronauts to destinations not yet explored by humans, including an asteroid and NASA Journey to Mars. It will have emergency abort capability, sustain the crew during space travel and provide safe re-entry from deep space return velocities. Orion is scheduled to launch atop NASA’s Space Launch System rocket in 2018. For more information, visit http://www.nasa.gov/orion.

The Logan Heights Library in San Diego, California is the site of the “52 Weeks of Science” celebration for students. The Ground Systems Development and Operations (GSDO) Program is participating in the special event with a Journey to Mars display. GSDO’s participation before the start of Underway Recovery Test 5 using a test version of the Orion spacecraft in the Pacific Ocean off the coast of California. The test will allow NASA, Orion manufacturer Lockheed Martin and the U.S. Navy to demonstrate and evaluate the recovery processes, procedures, hardware and personnel necessary for recovery of the Orion crew module on its return from a deep space mission. Orion is the exploration spacecraft designed to carry astronauts to destinations not yet explored by humans, including an asteroid and NASA Journey to Mars. It will have emergency abort capability, sustain the crew during space travel and provide safe re-entry from deep space return velocities. Orion is scheduled to launch atop NASA’s Space Launch System rocket in 2018. For more information, visit http://www.nasa.gov/orion.
Students and parents visit the displays at the Logan Heights Library in San Diego, California, during the “52 Weeks of Science” celebration. The Ground Systems Development and Operations (GSDO) Program is participating in the special event with a Journey to Mars display before the start of Underway Recovery Test 5 using a test version of the Orion spacecraft in the Pacific Ocean off the coast of California. The test will allow NASA, Orion manufacturer Lockheed Martin and the U.S. Navy to demonstrate and evaluate the recovery processes, procedures, hardware and personnel necessary for recovery of the Orion crew module on its return from a deep space mission. Orion is the exploration spacecraft designed to carry astronauts to destinations not yet explored by humans, including an asteroid and NASA Journey to Mars. It will have emergency abort capability, sustain the crew during space travel and provide safe re-entry from deep space return velocities. Orion is scheduled to launch atop NASA’s Space Launch System rocket in 2018. For more information, visit http://www.nasa.gov/orion.
Students visit the displays at the Logan Heights Library in San Diego, California, during the “52 Weeks of Science” celebration. The Ground Systems Development and Operations (GSDO) Program is participating in the special event with a Journey to Mars display before the start of Underway Recovery Test 5 using a test version of the Orion spacecraft in the Pacific Ocean off the coast of California. The test will allow NASA, Orion manufacturer Lockheed Martin and the U.S. Navy to demonstrate and evaluate the recovery processes, procedures, hardware and personnel necessary for recovery of the Orion crew module on its return from a deep space mission. Orion is the exploration spacecraft designed to carry astronauts to destinations not yet explored by humans, including an asteroid and NASA Journey to Mars. It will have emergency abort capability, sustain the crew during space travel and provide safe re-entry from deep space return velocities. Orion is scheduled to launch atop NASA’s Space Launch System rocket in 2018. For more information, visit http://www.nasa.gov/orion.
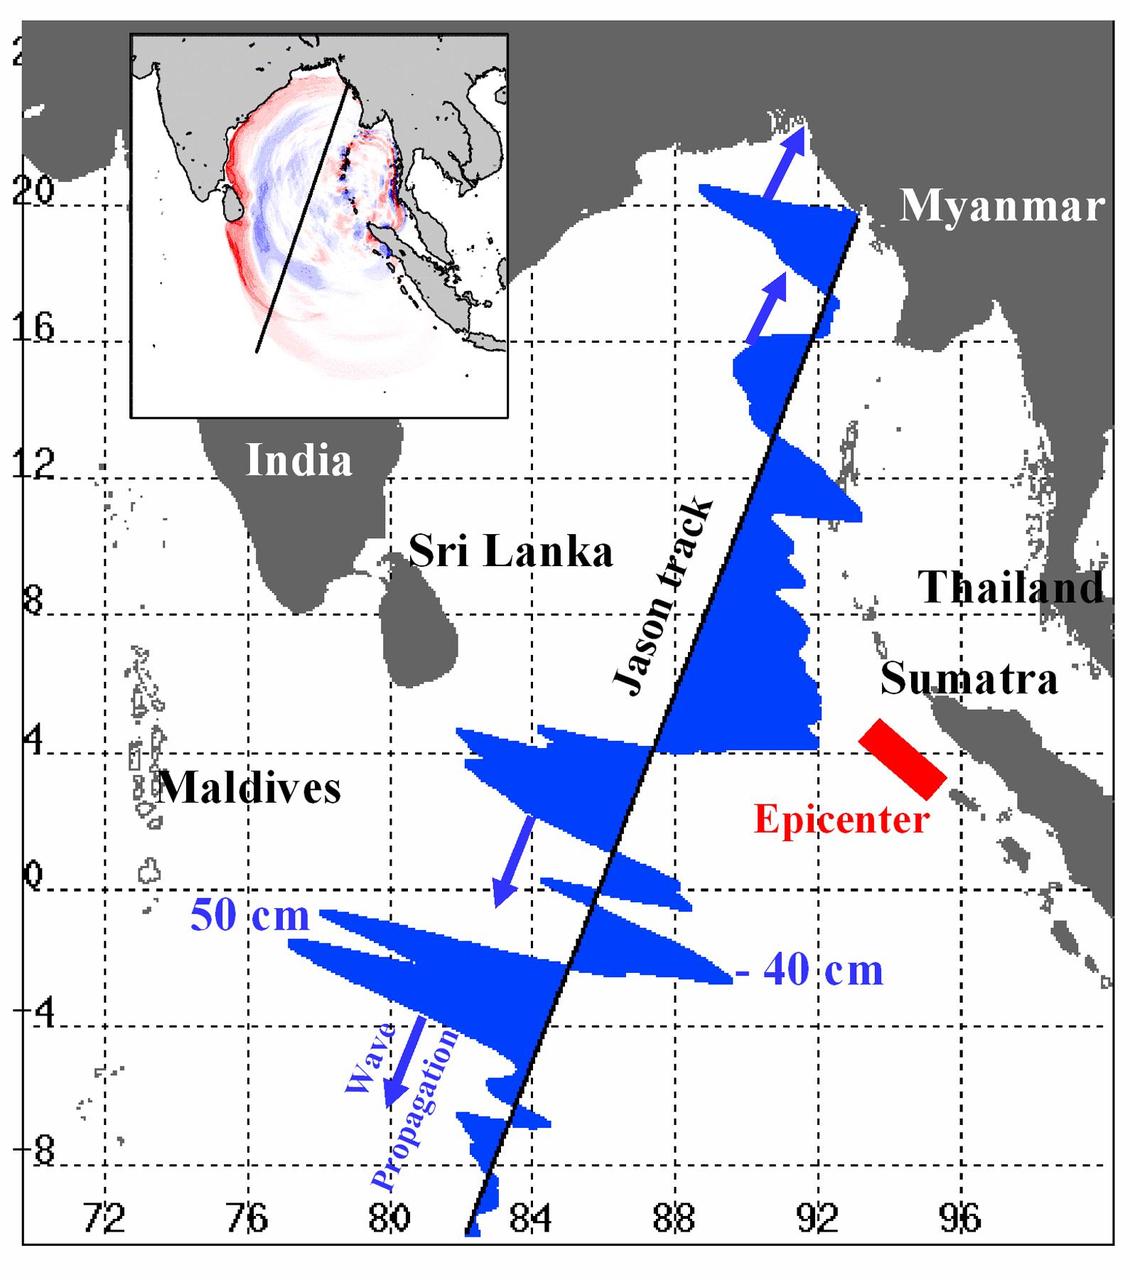
Displayed in blue color is the height of sea surface (shown in blue) measured by the Jason satellite two hours after the initial magnitude 9 earthquake hit the region (shown in red) southwest of Sumatra on December 26, 2004. The data were taken by a radar altimeter onboard the satellite along a track traversing the Indian Ocean when the tsunami waves had just filled the entire Bay of Bengal (see the model simulation inset image). The data shown are the changes of sea surface height from previous observations made along the same track 20-30 days before the earthquake, reflecting the signals of the tsunami waves. The maximum height of the leading wave crest was about 50 cm (or 1.6 ft), followed by a trough of sea surface depression of 40 cm. The directions of wave propagation along the satellite track are shown by the blue arrows. http://photojournal.jpl.nasa.gov/catalog/PIA07219
The shadow of the moon Mimas strikes the F ring at a different angle than the angle at which it is cast on the A ring, illustrating differences in the vertical heights of the rings in this image taken as Saturn approaches its August 2009 equinox.
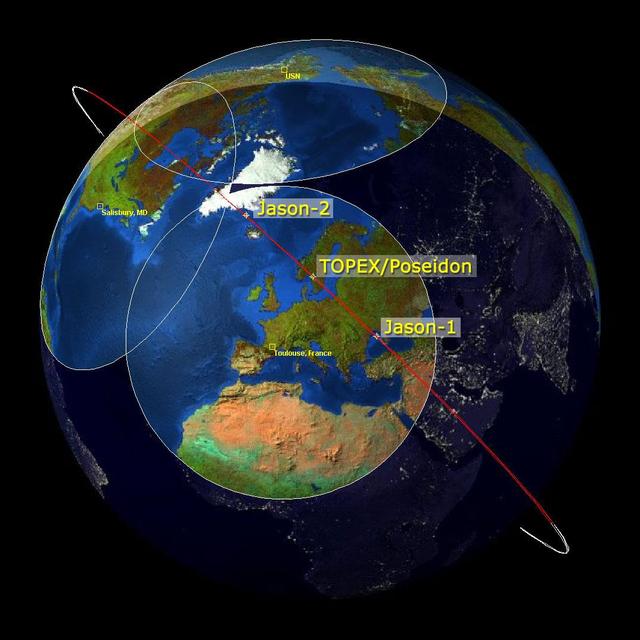
This image is a family portrait of Topex/Poseidon, Jason-1 and Ocean Surface Topography Mission/Jason-2 OSTM/Jason-2, NASA satellites that have measured global sea surface heights since 1992.
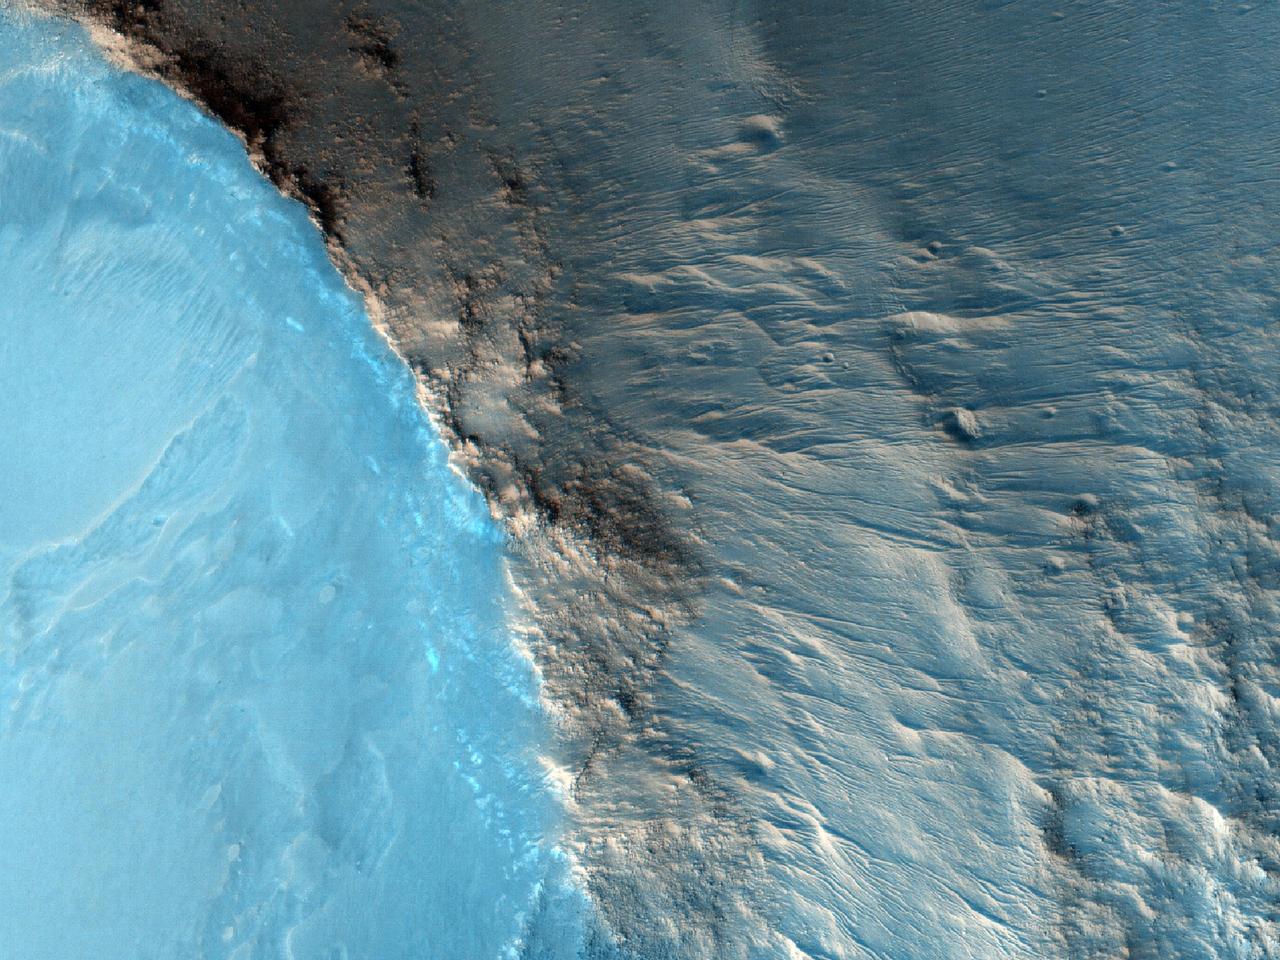
One type of feature of scientific interest on the mountain inside Gale crater is exposure of cemented fractures, evidence that groundwater once reached to at least that height of the mountain. This image is from NASA Mars Reconnaissance Orbiter.
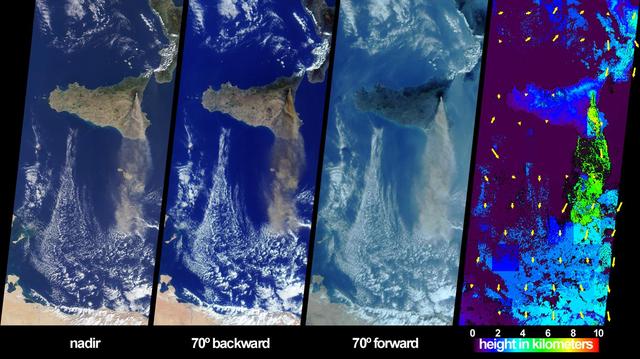
The height and southward extent of the ash plume emanating from Sicily Mount Etna volcano on October 27, 2002 are captured in these four image panels from NASA Terra spacecraft.
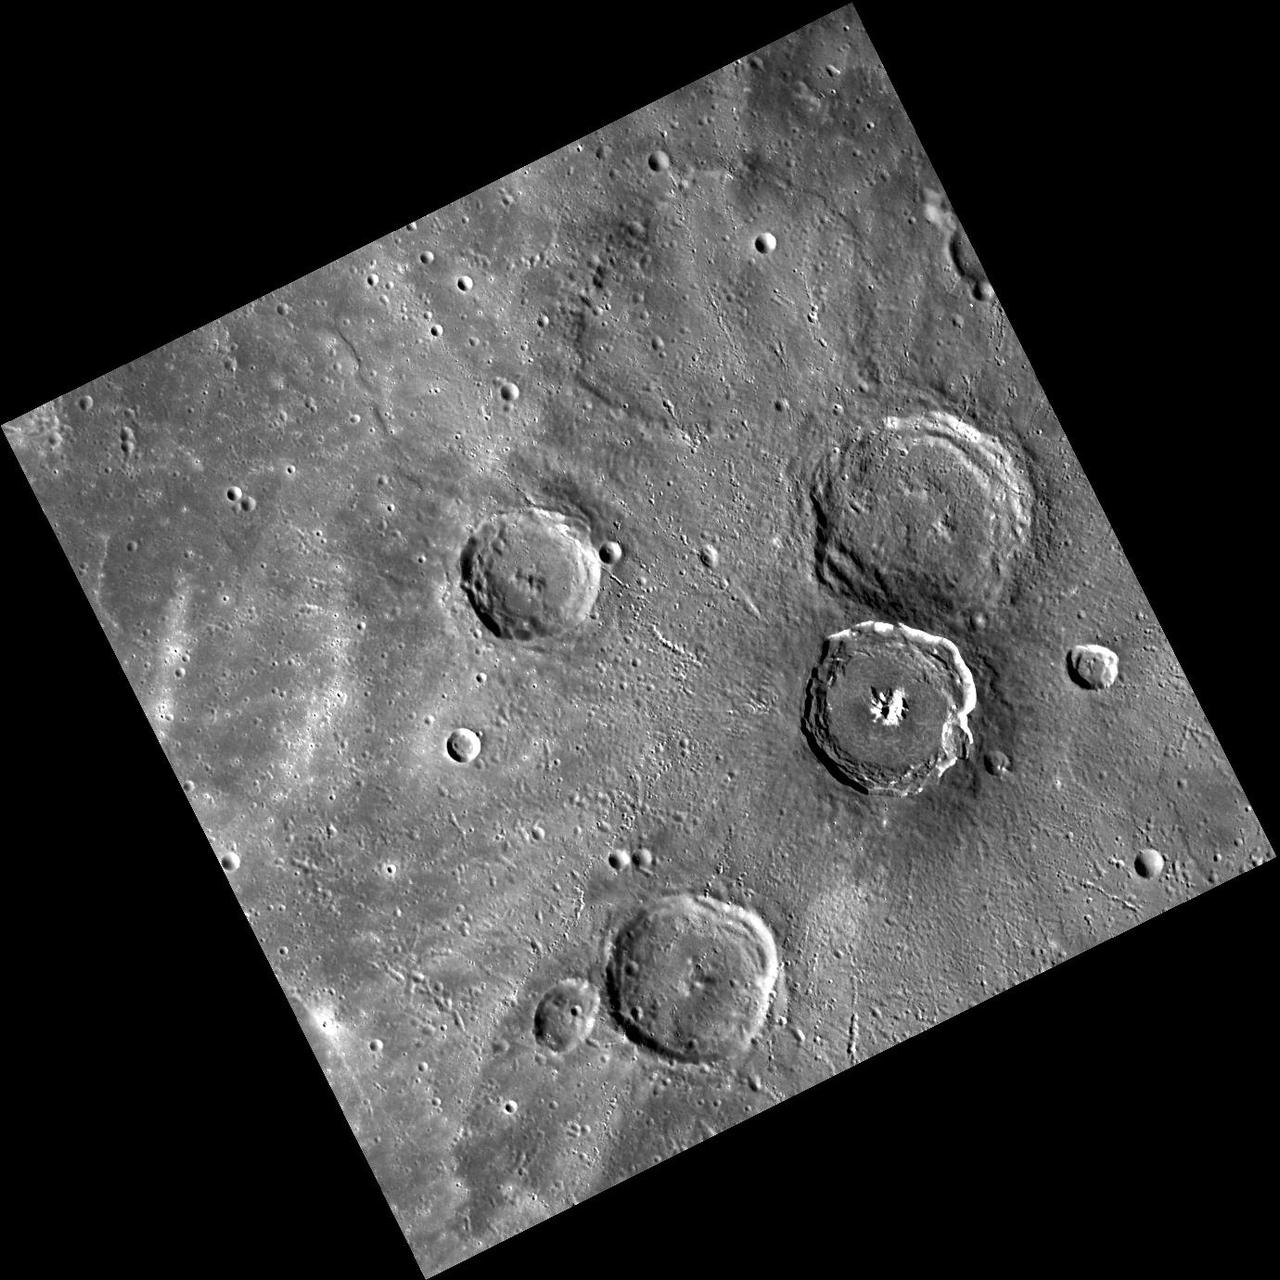
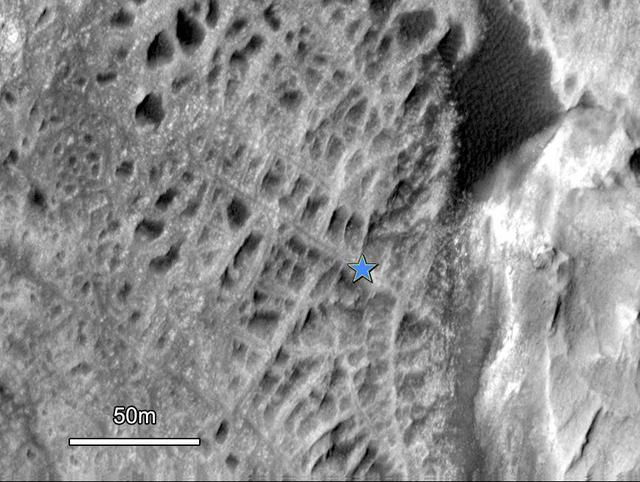
The suggested area in this observation from NASA Mars Reconnaissance Orbiter is characterized by a group of cones, shield-like features, and round mounds. They are a few hundred meters to kilometers in diameter but their heights are unknown.
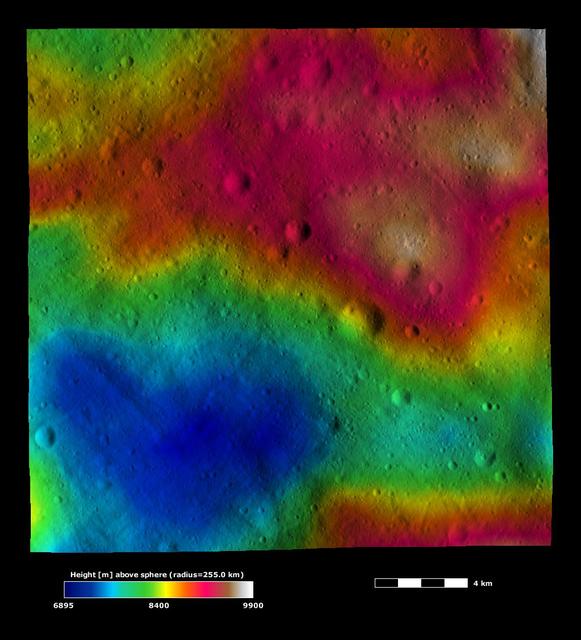
This image from NASA Dawn spacecraft, is based on a framing camera image that is overlain by a color-coded height representation of topography. This heart-shaped hollow is roughly 10 kilometers 6 miles across at its widest point.
The extent, height, and amount of smoke originating from the B&B Complex Fires in central Oregon are captured in these September 4, 2003 views from NASA Terra spacecraft.
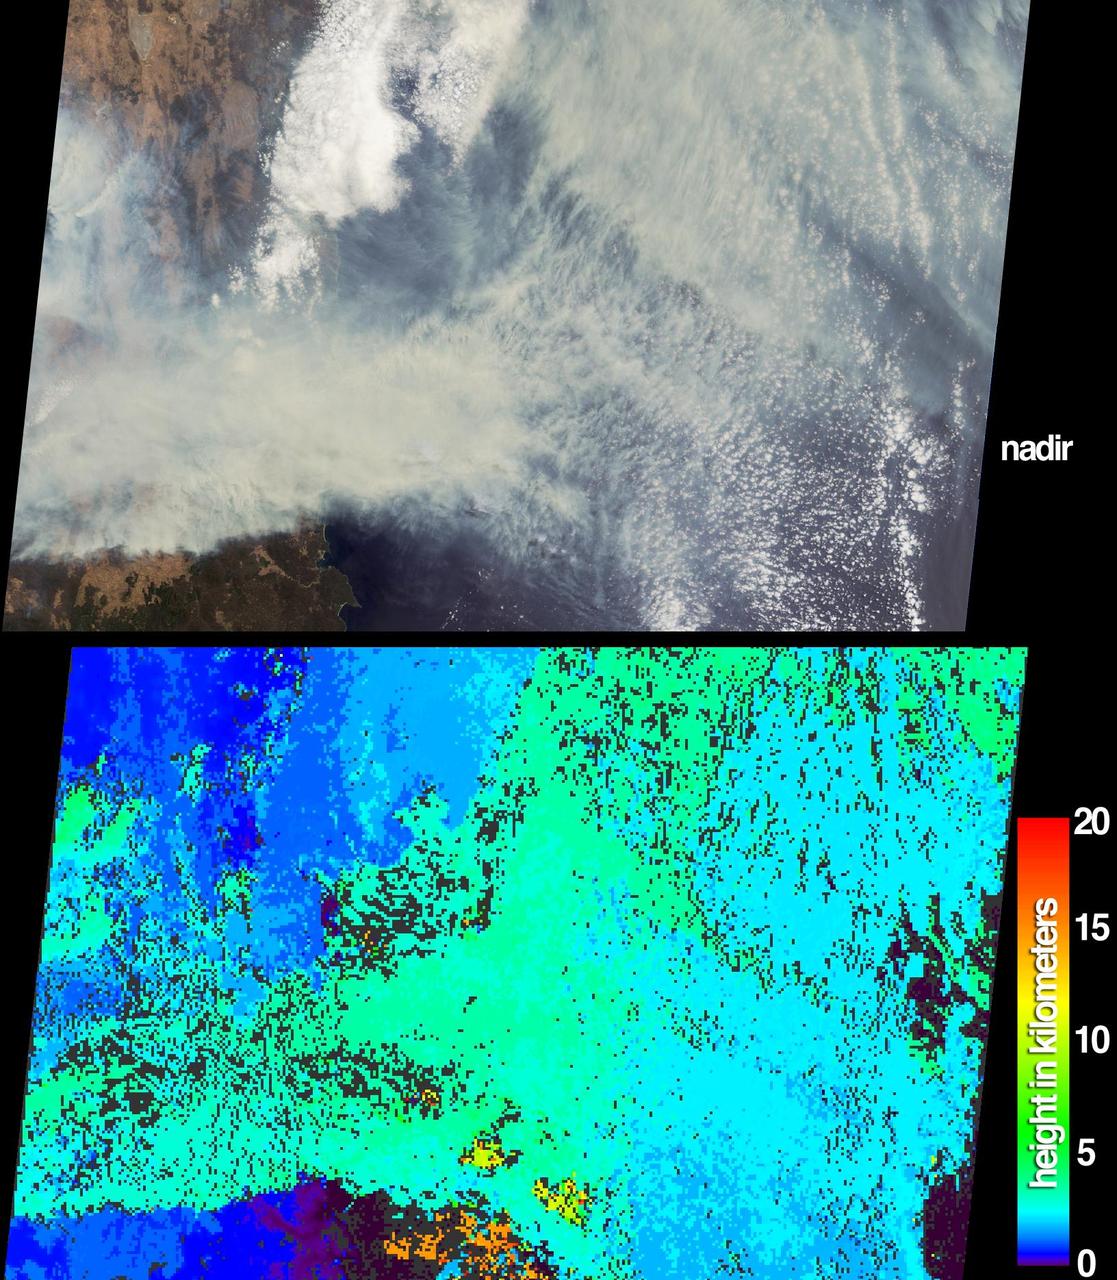
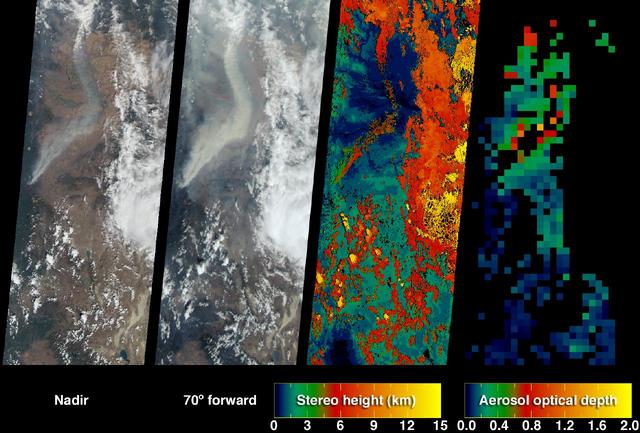
The height and extent of billowing smoke plumes from bushfires near Canberra, the Australian capital, are illustrated by these views from NASA Terra spacecraft acquired on January 18, 2003.
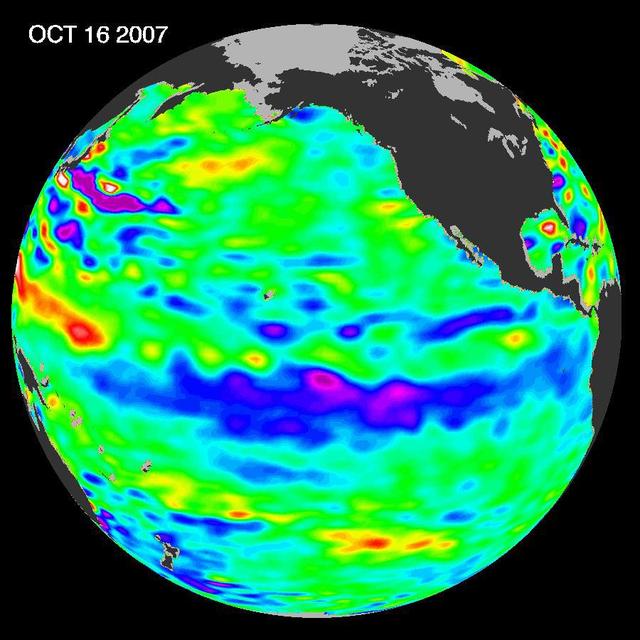
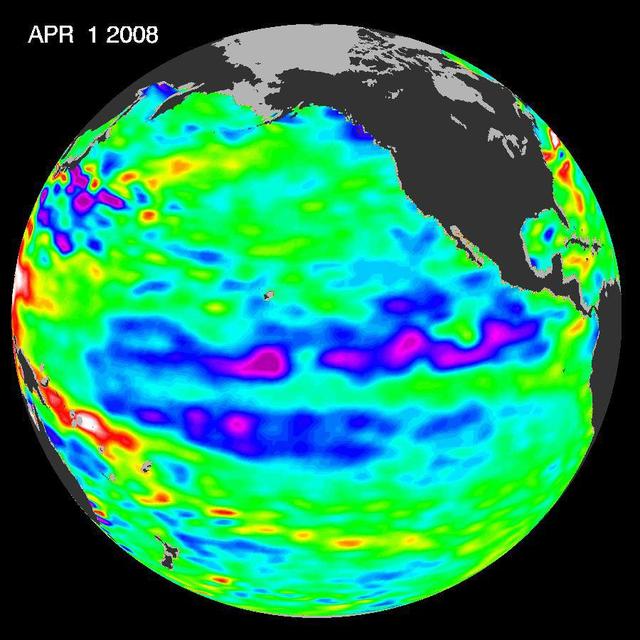
The tropical Pacific Ocean remains in the grips of a cool La Niña, as shown by new data of sea-level heights from mid-October of 2007, collected by NASA U.S-French Jason altimetric satellite.
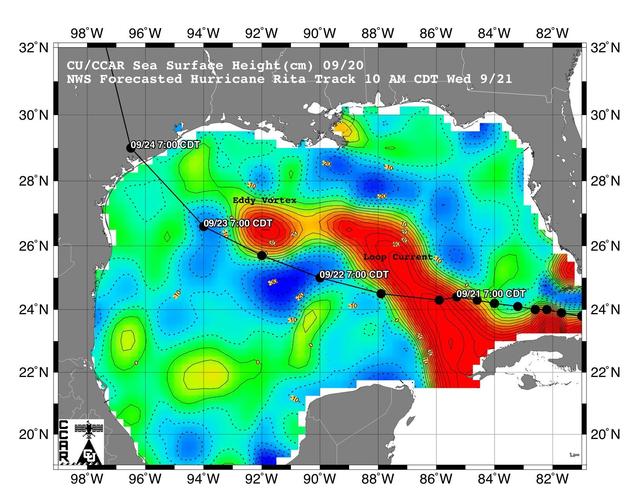
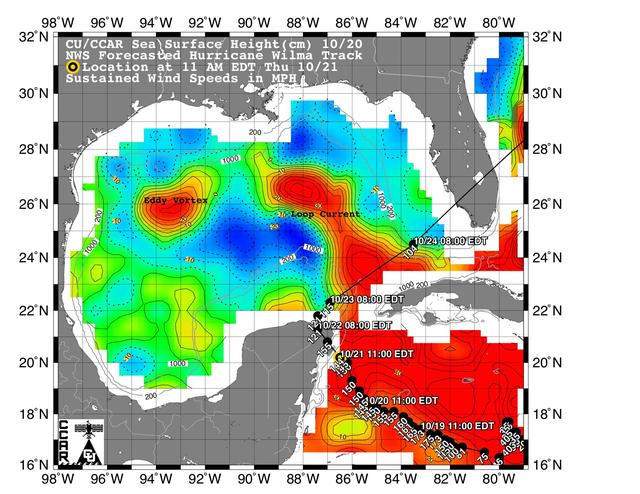
This sea surface height map of the Gulf of Mexico, with the Florida peninsula on the right and the Texas-Mexico Gulf Coast on the left, is based on altimeter data from four satellites including NASA’s Topex/Poseidon and Jason.
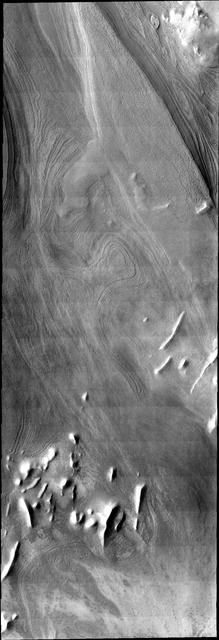
This VIS image illlustrates how distinct polar layers appear with no frost cover. This image was collected during the height of summer at the south pole of Mars by NASA 2001 Mars Odyssey spacecraft.
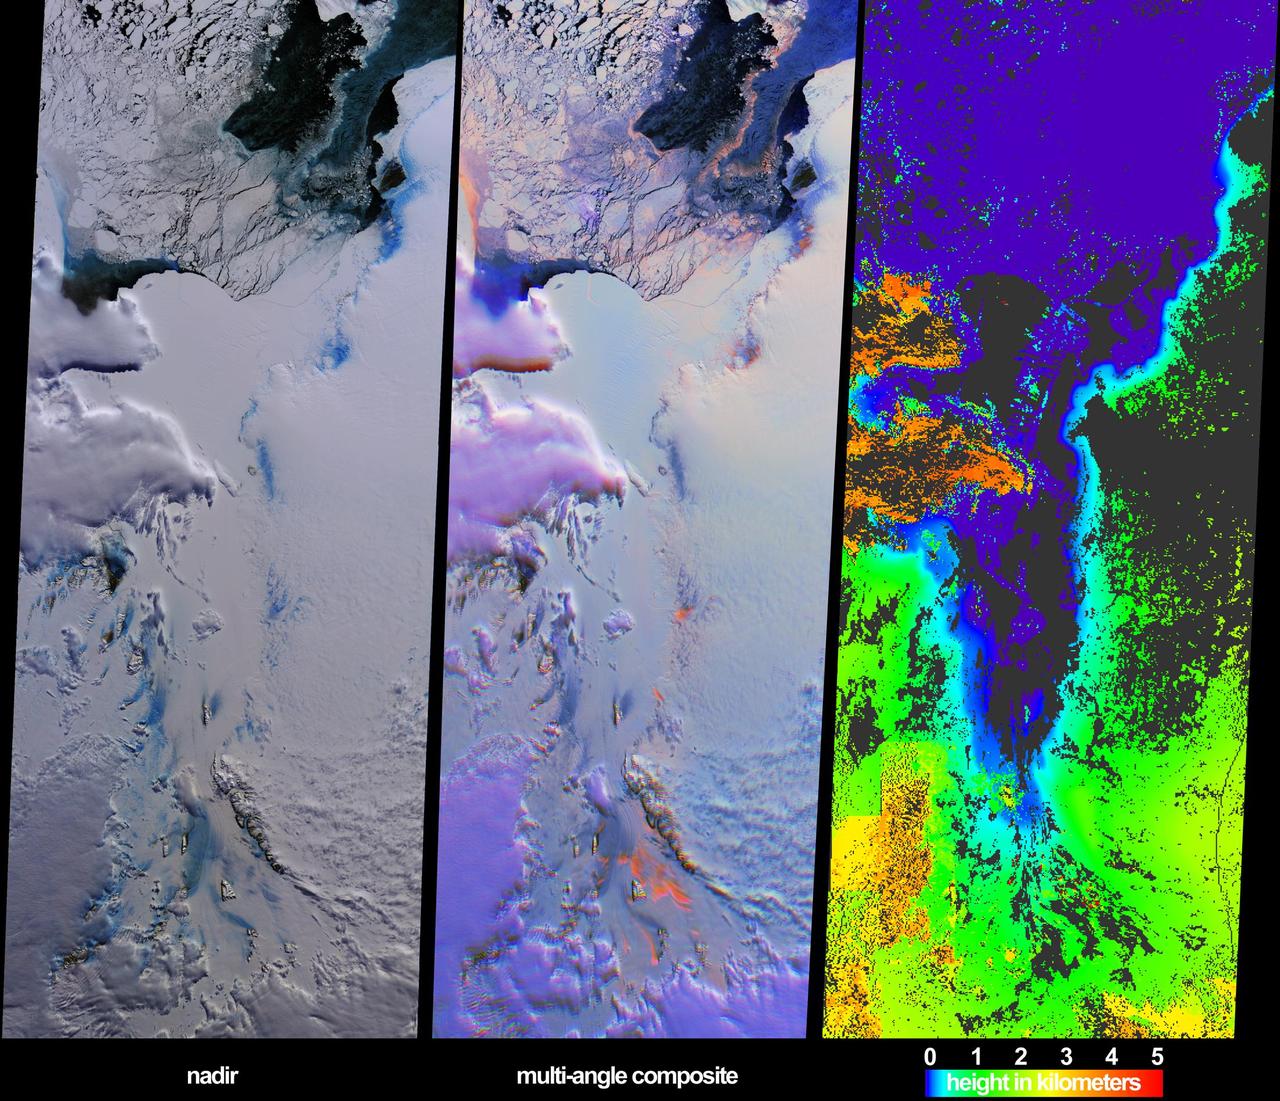
These views from NASA Terra spacecraft illustrate ice surface textures and cloud-top heights over the Amery Ice Shelf/Lambert Glacier system in East Antarctica on October 25, 2002.
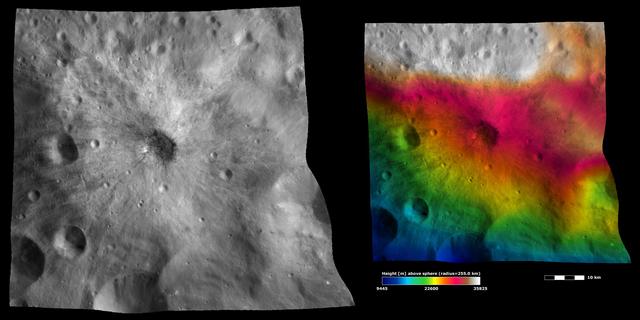
The left-hand image from NASA Dawn spacecraft shows the apparent brightness of asteroid Vesta surface. The right-hand image is based on this apparent brightness image, with a color-coded height representation of the topography overlain onto it.
A repeat of last year mild La Niña conditions -- with a stormy winter in the Pacific Northwest and a dry winter in the southwestern United States -- will be the likely outcome of sea-surface heights observed by NASA TOPEX/Poseidon satellite.
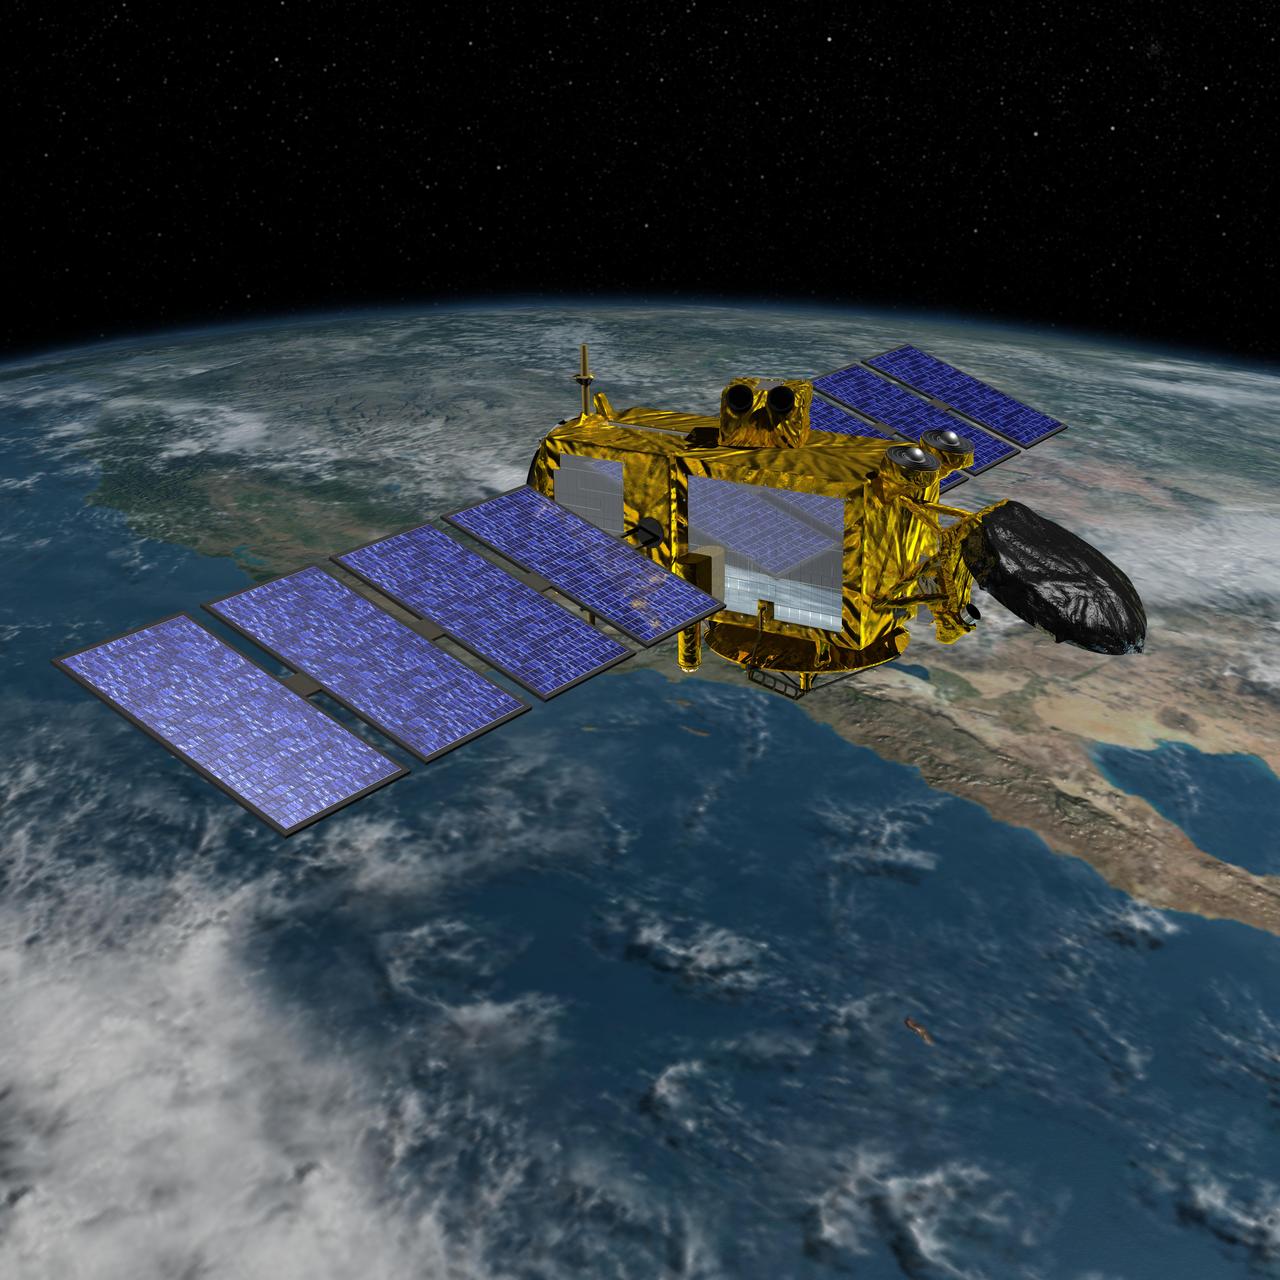
Artist concept of the U.S.-European Jason-3 spacecraft over the California coast. Jason-3 will precisely measure the height of the ocean surface, allowing scientists to monitor ocean circulation and sea level.
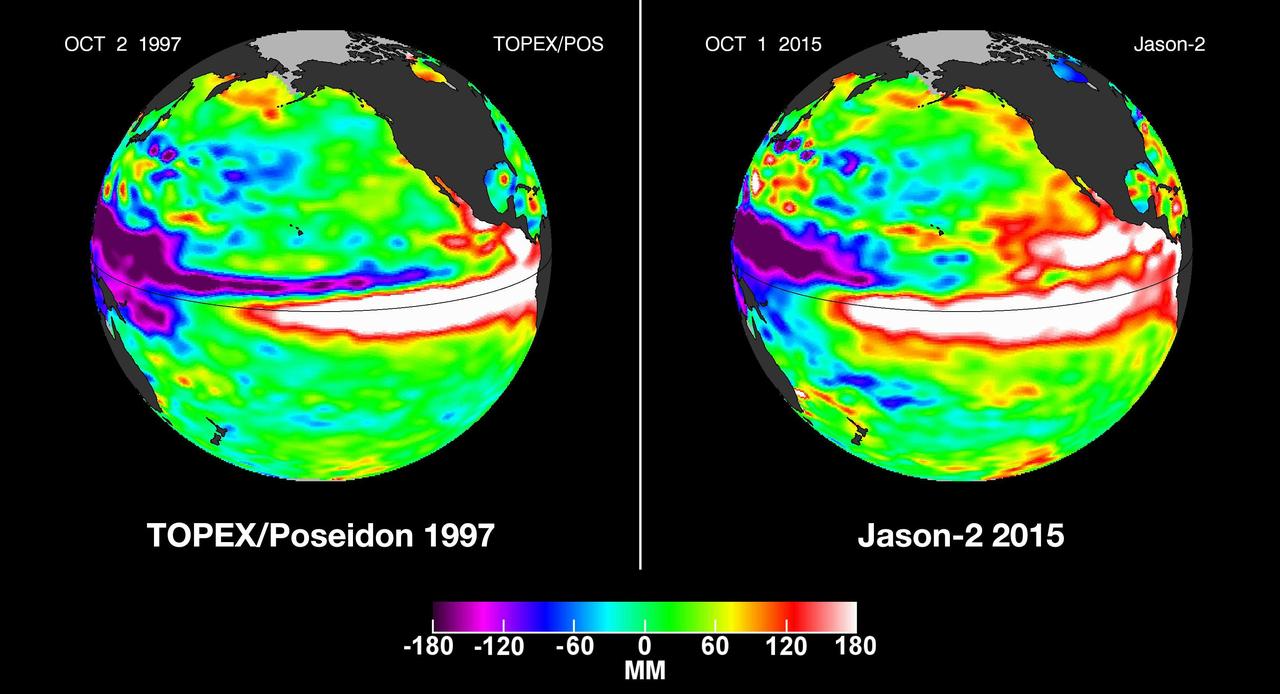
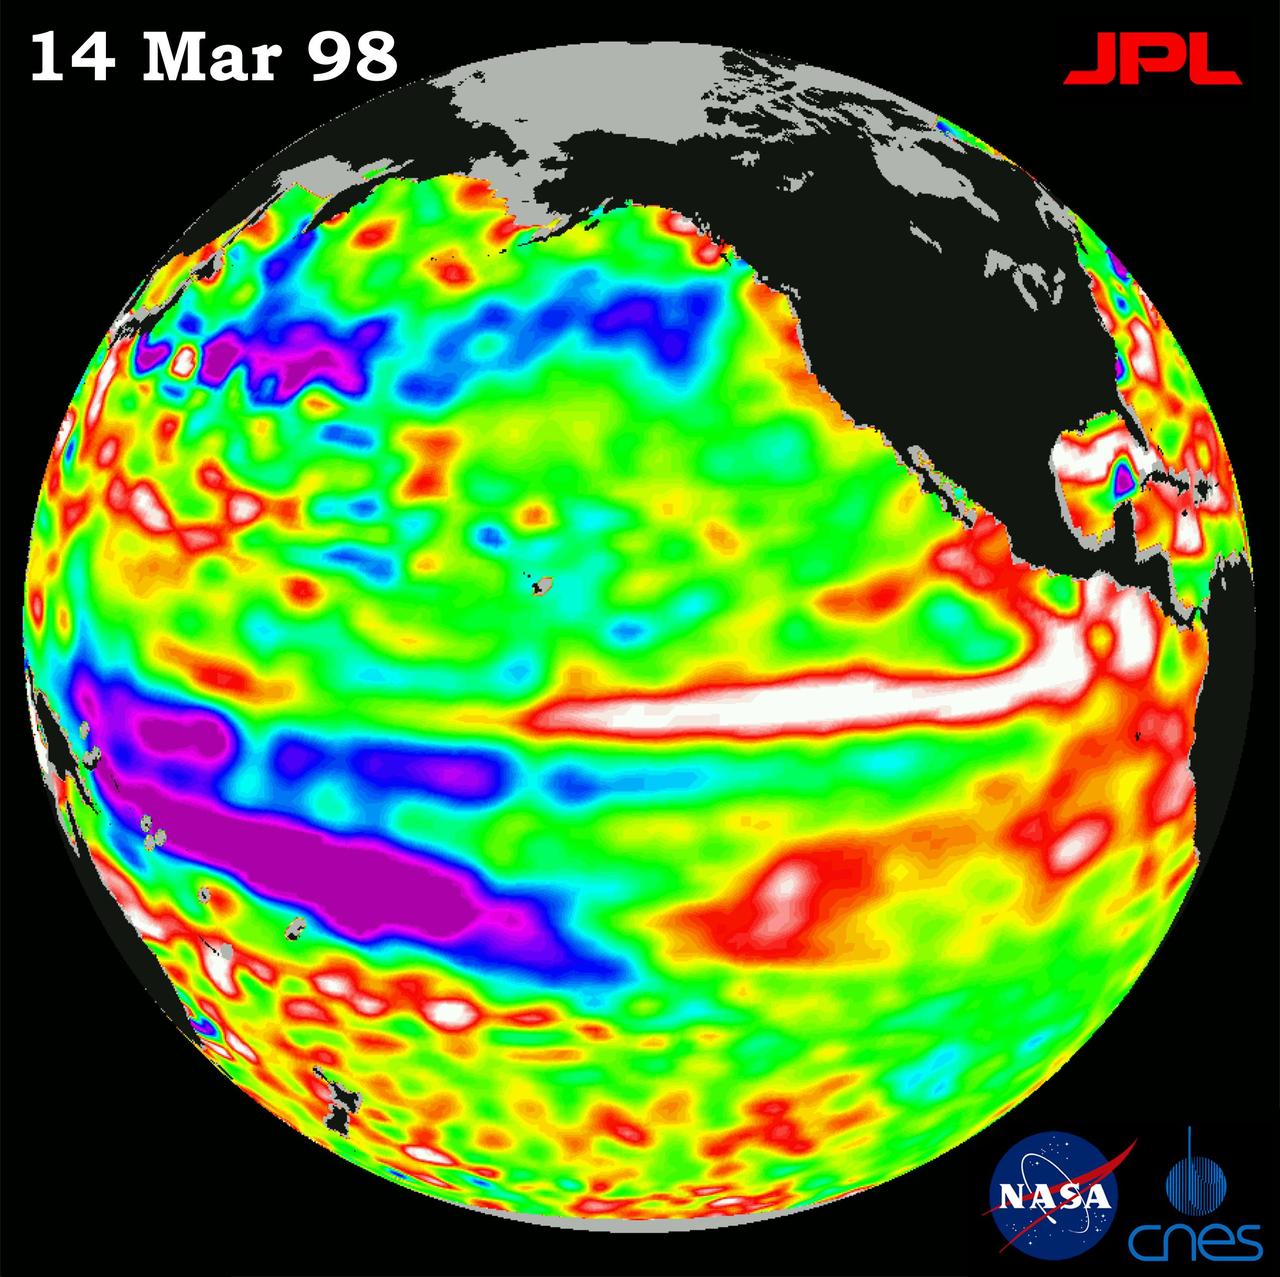
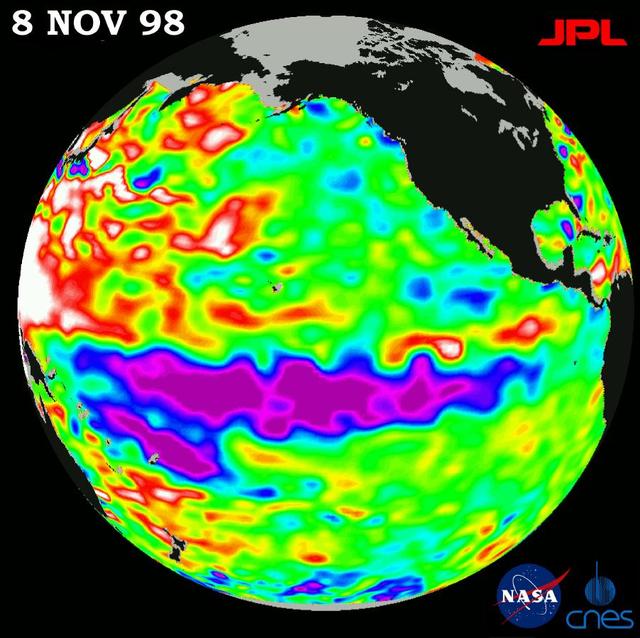
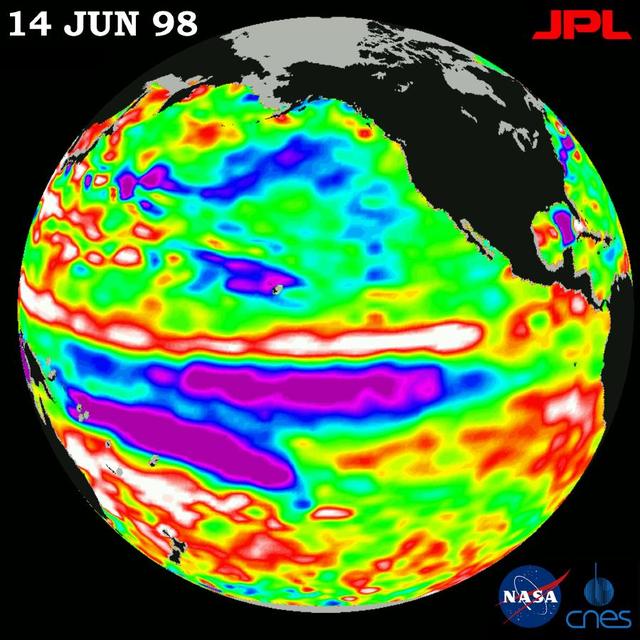
In this side-by-side visualization, Pacific Ocean sea surface height anomalies during the 1997-98 El Niño left are compared with 2015 Pacific conditions right.
One of the strongest La Niñas in many years is slowly weakening but continues to blanket the Pacific Ocean near the equator, as shown by new sea-level height data collected by NASA U.S.-French Jason oceanographic satellite.
The latest image of sea-surface height measurements from NASA U.S./French Jason-1 oceanography satellite shows the Pacific Ocean remains locked in a strong, cool phase of the Pacific Decadal Oscillation.
This sea surface height map of the Gulf of Mexico and the northwestern Caribbean Sea, with the Florida peninsula on the upper right, is based on altimeter data from three satellites including NASA Jason-1.
On Tuesday, August 30, 2005, NASA Terra spacecraft retrieved cloud-top heights and cloud-tracked wind velocities for Tropical Storm Katrina, as the center of the storm was situated over the Tennessee Valley.
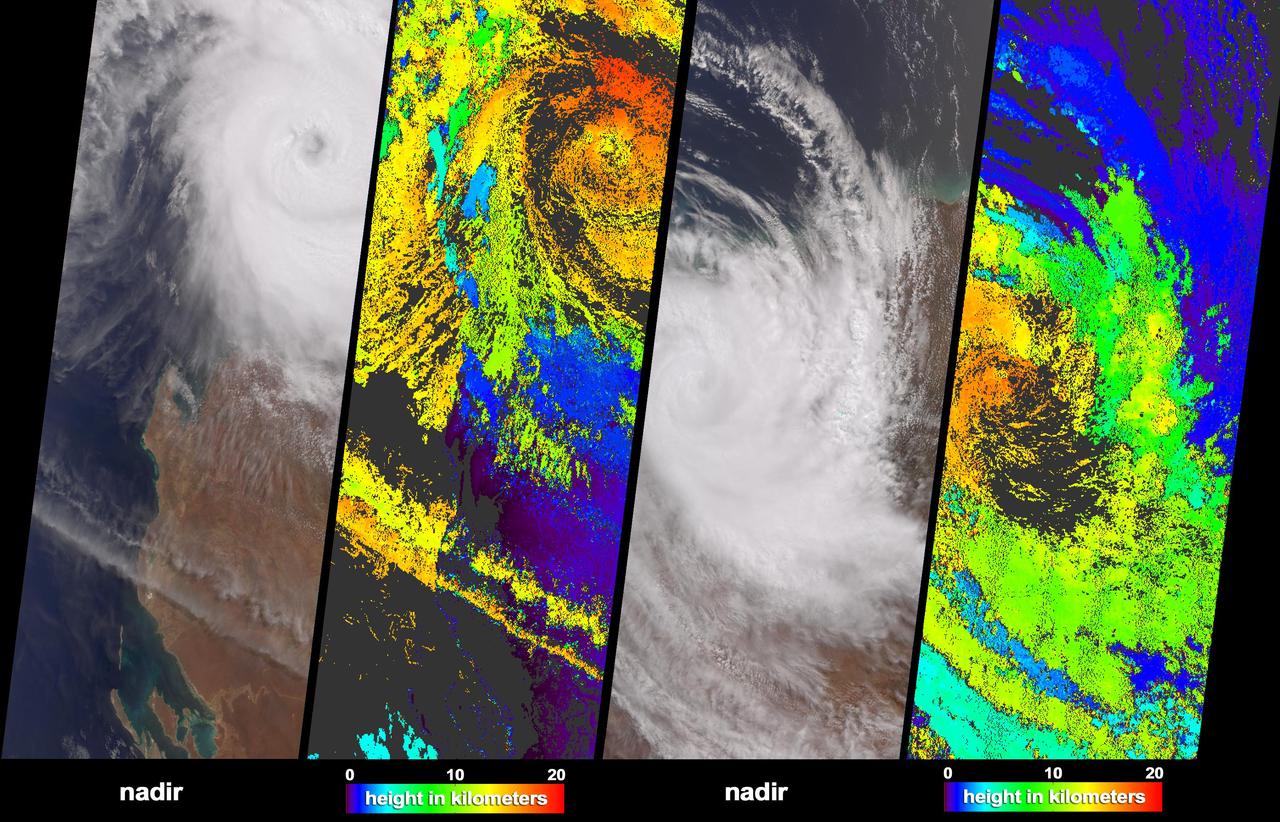
NASA Terra spacecraft acquired these natural color images and cloud top height measurements for Monty before and after the storm made landfall over the remote Pilbara region of Western Australia, on February 29 and March 2, 2004.
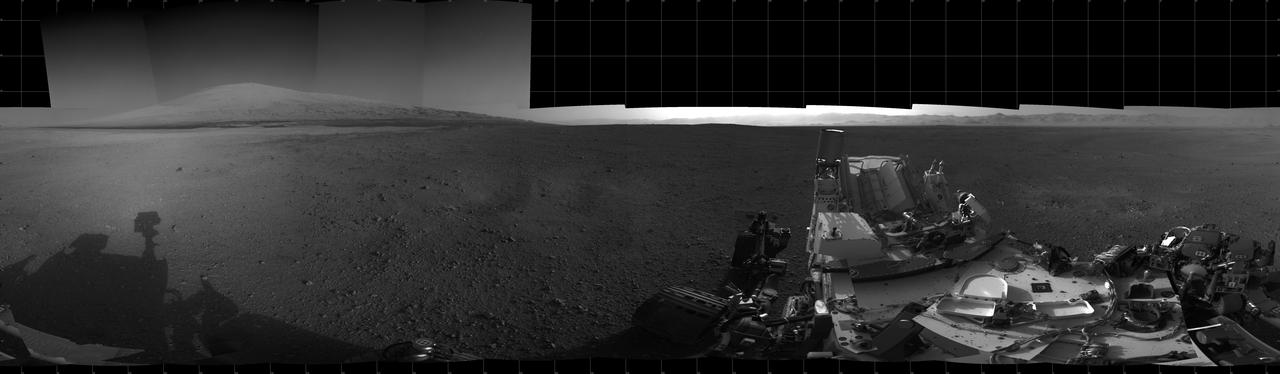
With the addition of four high-resolution Navigation Camera, or Navcam, images, taken on Aug. 18 Sol 12, Curiosity 360-degree landing-site panorama now includes the highest point on Mount Sharp visible from the rover.
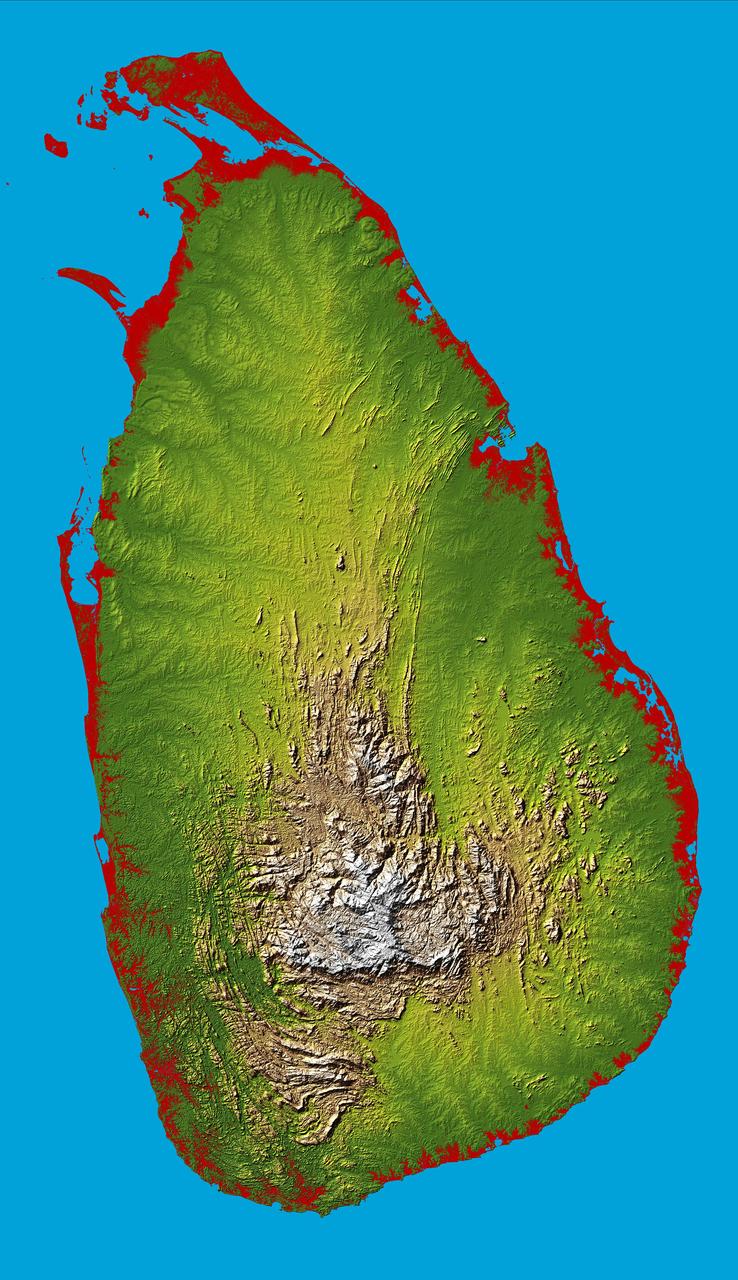
The topography of the island nation of Sri Lanka is well shown in this color-coded shaded relief map generated with digital elevation data from NASA Shuttle Radar Topography Mission SRTM.
A look at smoke from the Chisholm forest fire, which ignited on May 23, 2001 about 160 kilometers north of Edmonton in Alberta, Canada, as seen by NASA Terra spacecraft.
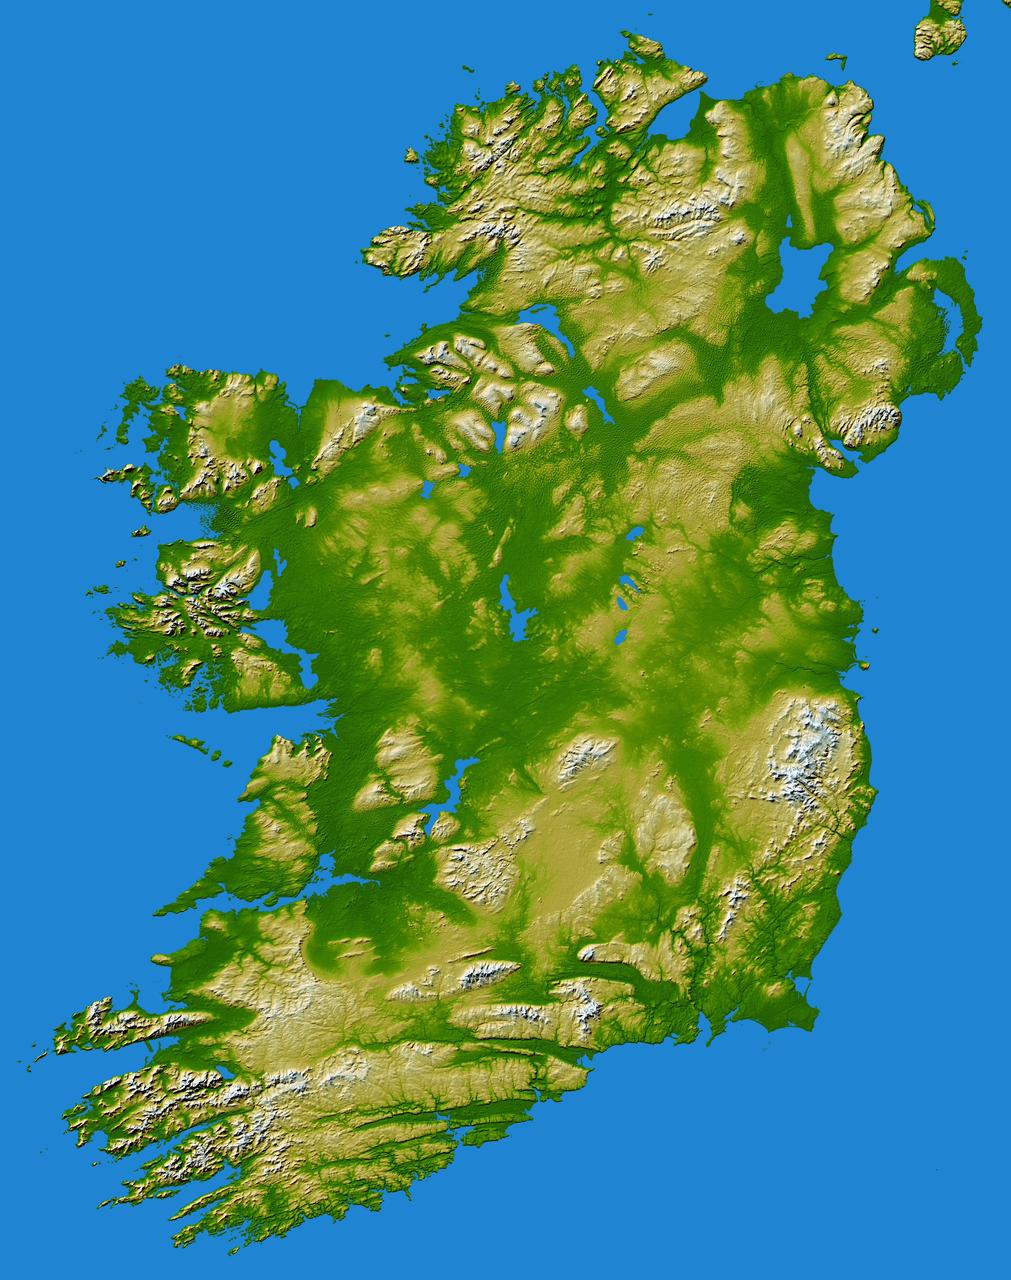
The island of Ireland comprises a large central lowland of limestone with a relief of hills surrounded by a discontinuous border of coastal mountains which vary greatly in geological structure.
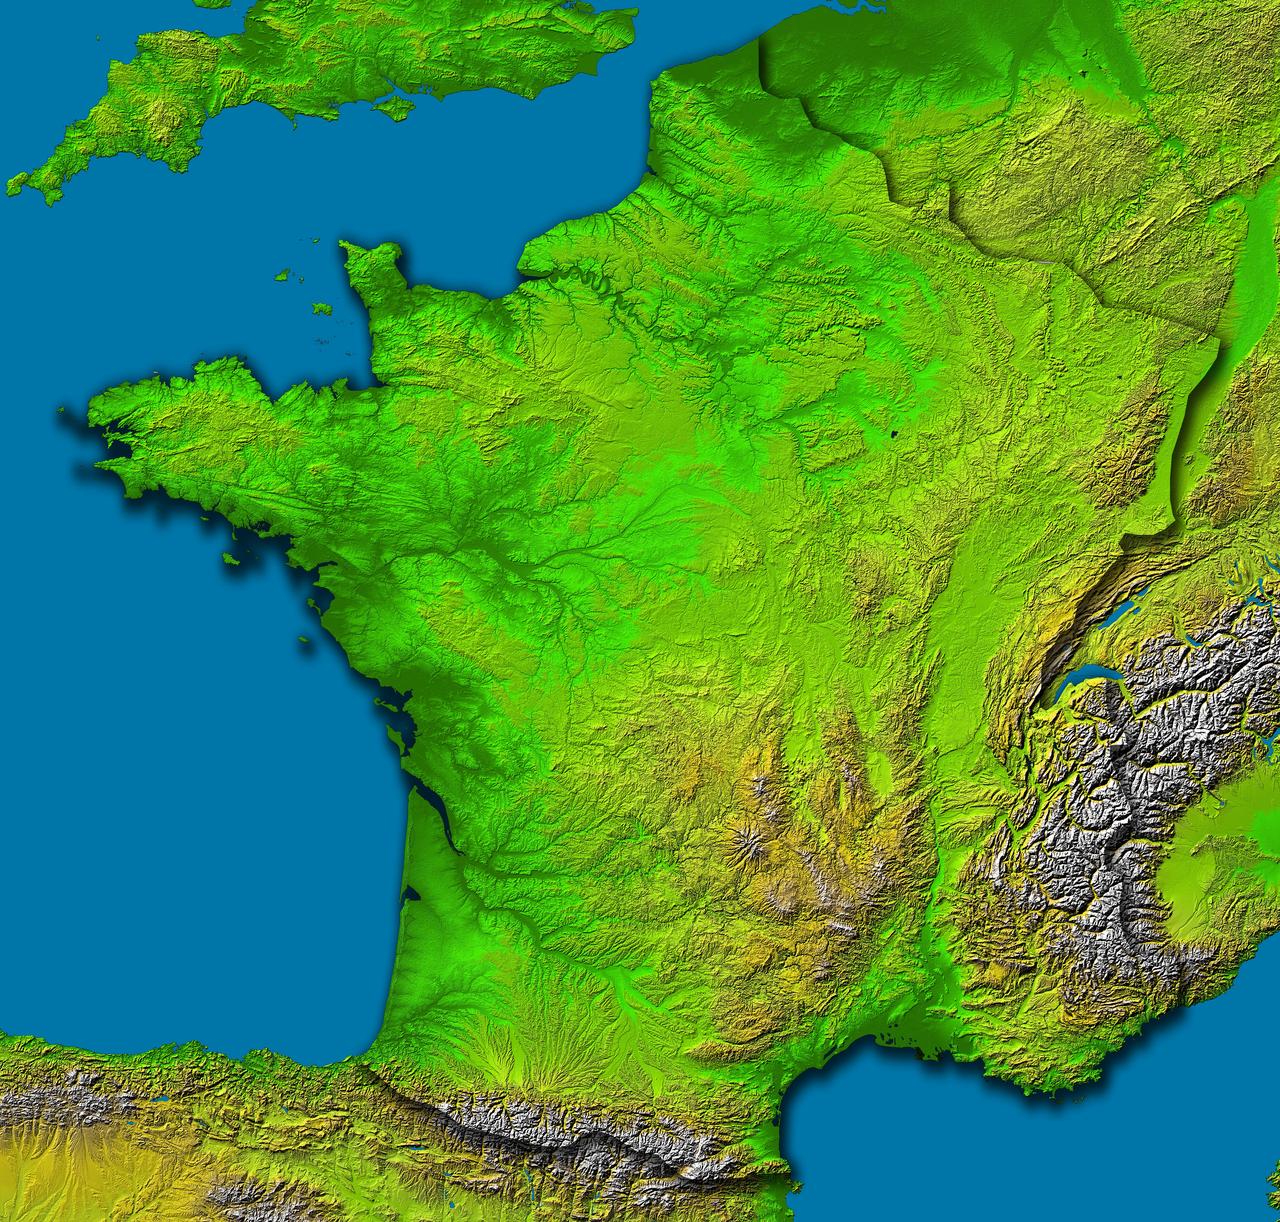
This image of France was generated with data from NASA Shuttle Radar Topography Mission SRTM.
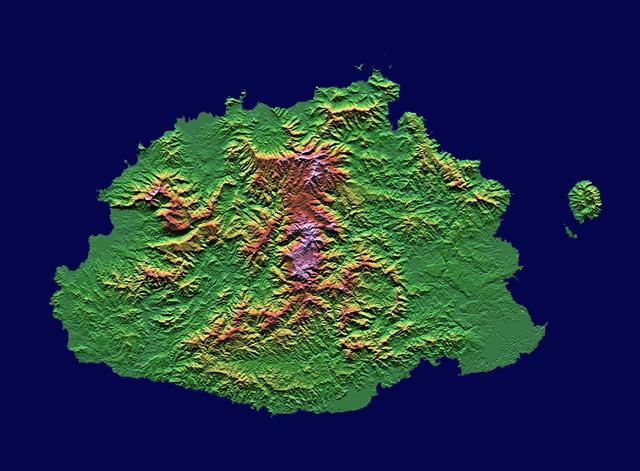
The Sovereign Democratic Republic of the Fiji Islands, commonly known as Fiji, is an independent nation consisting of some 332 islands surrounding the Koro Sea in the South Pacific Ocean. This image shows Viti Levu, the largest island in the group.
These visualizations of Hurricane Jeanne on September 24, 2004 were captured by NASA Terra spacecraft after the hurricane caused widespread destruction on Puerto Rico, Haiti and the Dominican Republic.
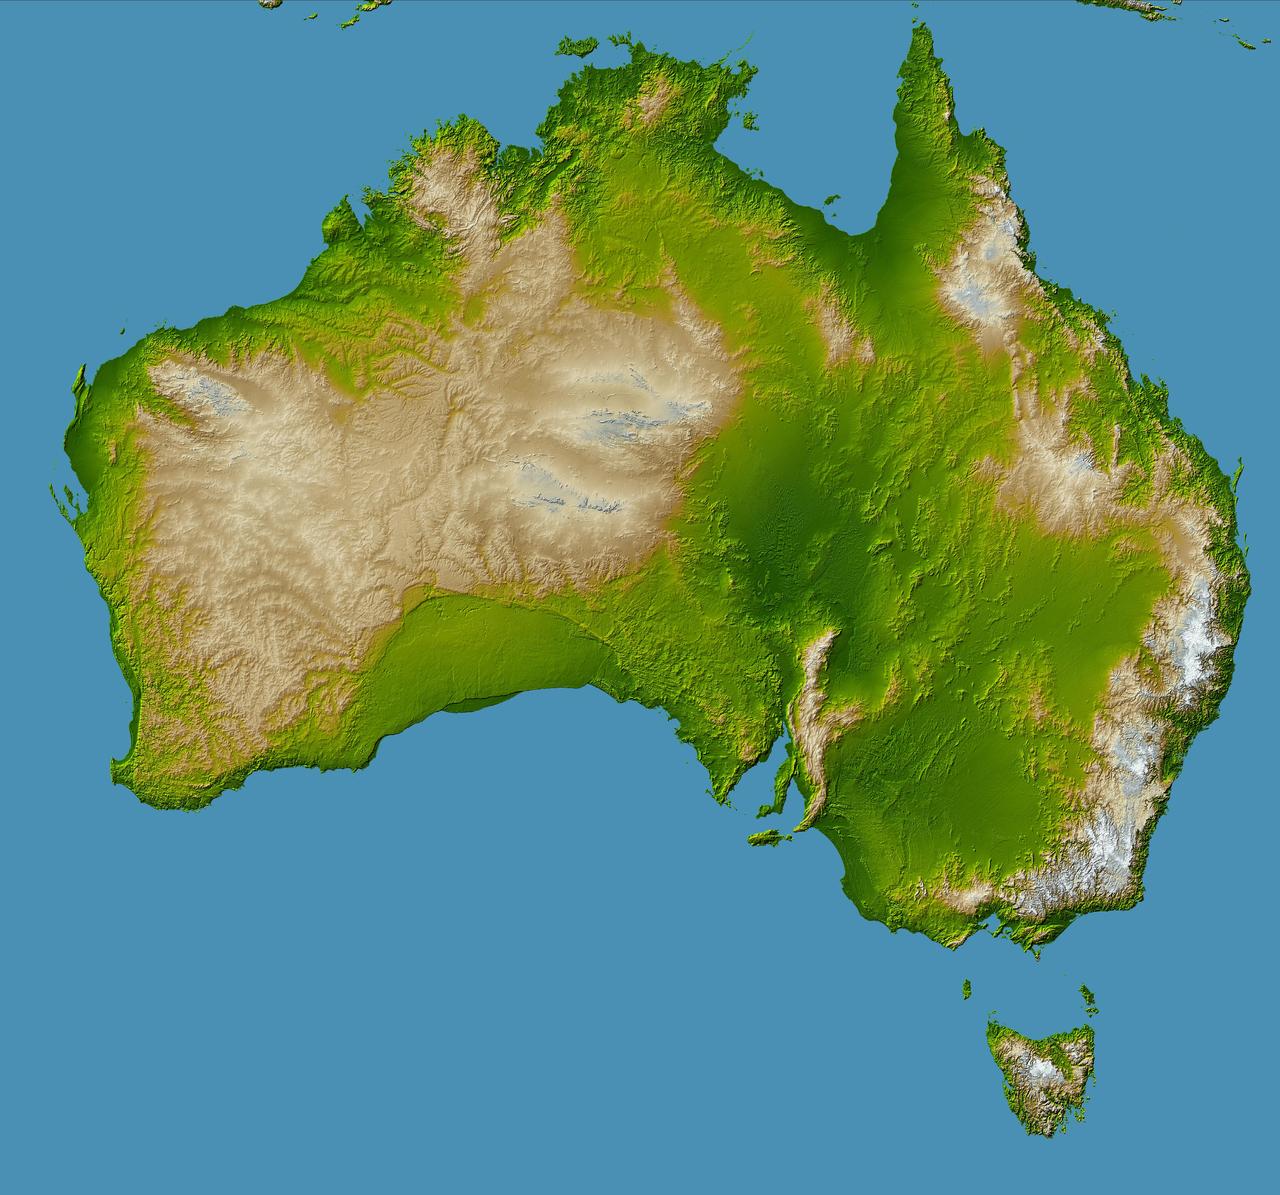
Australia is the world smallest, flattest, and after Antarctica driest continent, but at 7.7 million square kilometers 3.0 million square miles it is also the sixth largest country.
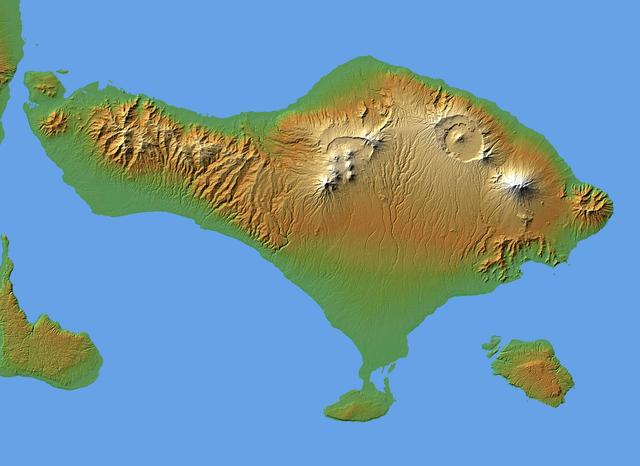
The volcanic nature of the island of Bali is evident in this shaded relief image generated with data from NASA Shuttle Radar Topography Mission SRTM.
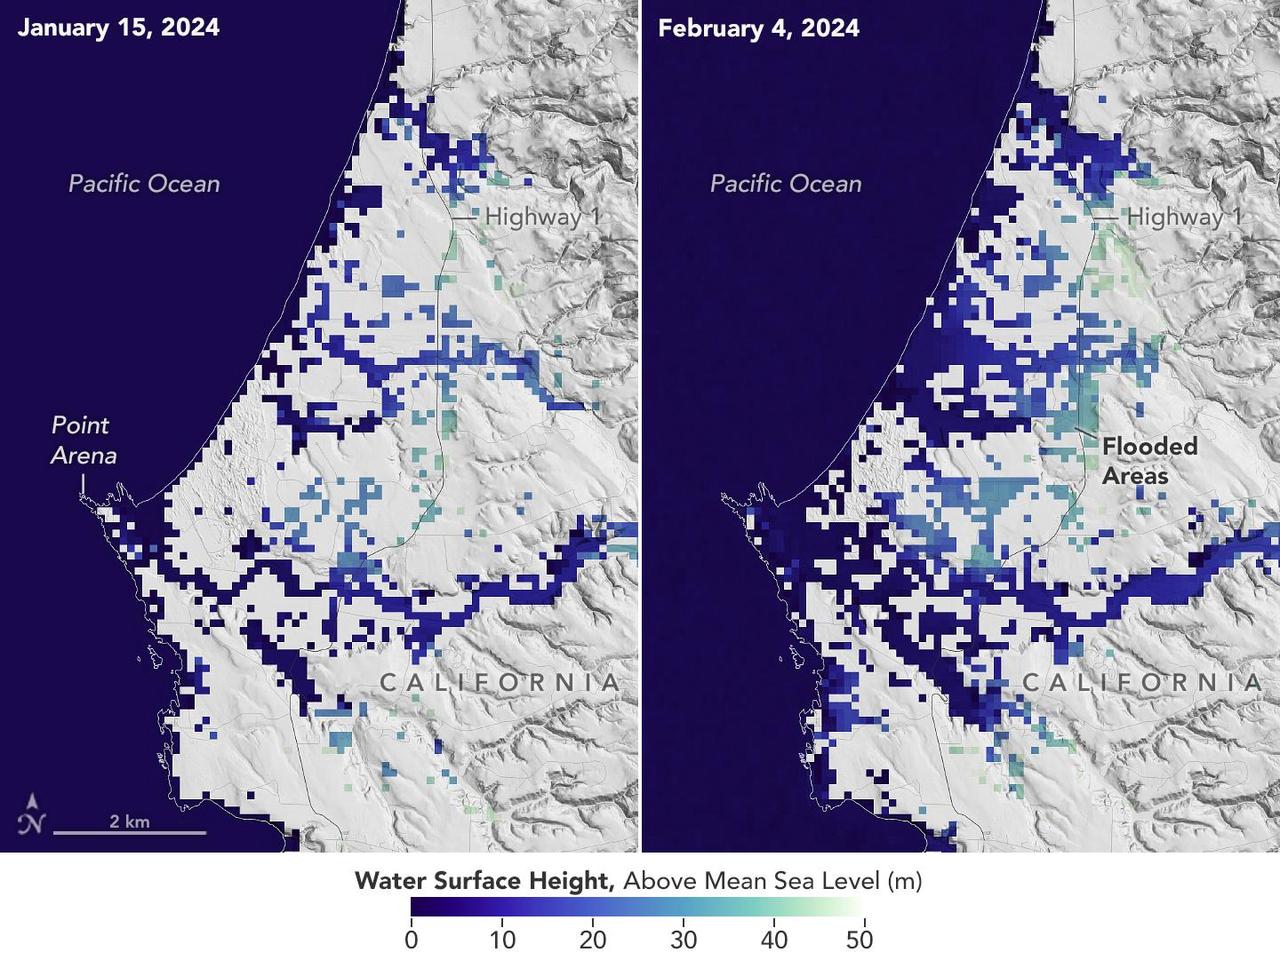
A series of atmospheric rivers drenched California in February 2024, with record amounts of rainfall and hurricane-force winds sweeping across parts of the state. The Surface Water and Ocean Topography (SWOT) mission captured data on coastal flooding near the community of Manchester, roughly 105 miles (169 kilometers) north of San Francisco. The satellite is a collaboration between NASA and the French space agency, CNES (Centre National d'Études Spatiales). The image shows the area on Jan. 15, 2024, before the rain and snow from atmospheric rivers hit California, and then again on Feb. 4, 2024, after the first in a series of storms soaked the state. Water heights are shown in shades of green and blue, with lighter hues indicating the highest levels relative to mean sea level. (Data for inland areas includes the height of the floodwaters plus the ground elevation beneath it.) Each pixel in the image represents an area that is 330 feet by 330 feet (100 meters by 100 meters). Since December 2022, SWOT has been measuring the height of nearly all water on Earth's surface, developing one of the most detailed, comprehensive views yet of the planet's oceans and freshwater lakes and rivers. Not only can the satellite detect the extent of the water on Earth's surface, as other satellites can, but SWOT can also provide water level data. The mission science team made the measurements using the Ka-band Radar Interferometer (KaRIn) instrument. With two antennas spread 33 feet (10 meters) apart on a boom, KaRIn produces a pair of data swaths as it circles the globe, bouncing radar pulses off water surfaces to collect surface-height measurements. Launched from Vandenberg Space Force Base in central California, SWOT is now in its operations phase, collecting data that will be used for research and other purposes. https://photojournal.jpl.nasa.gov/catalog/PIA26182
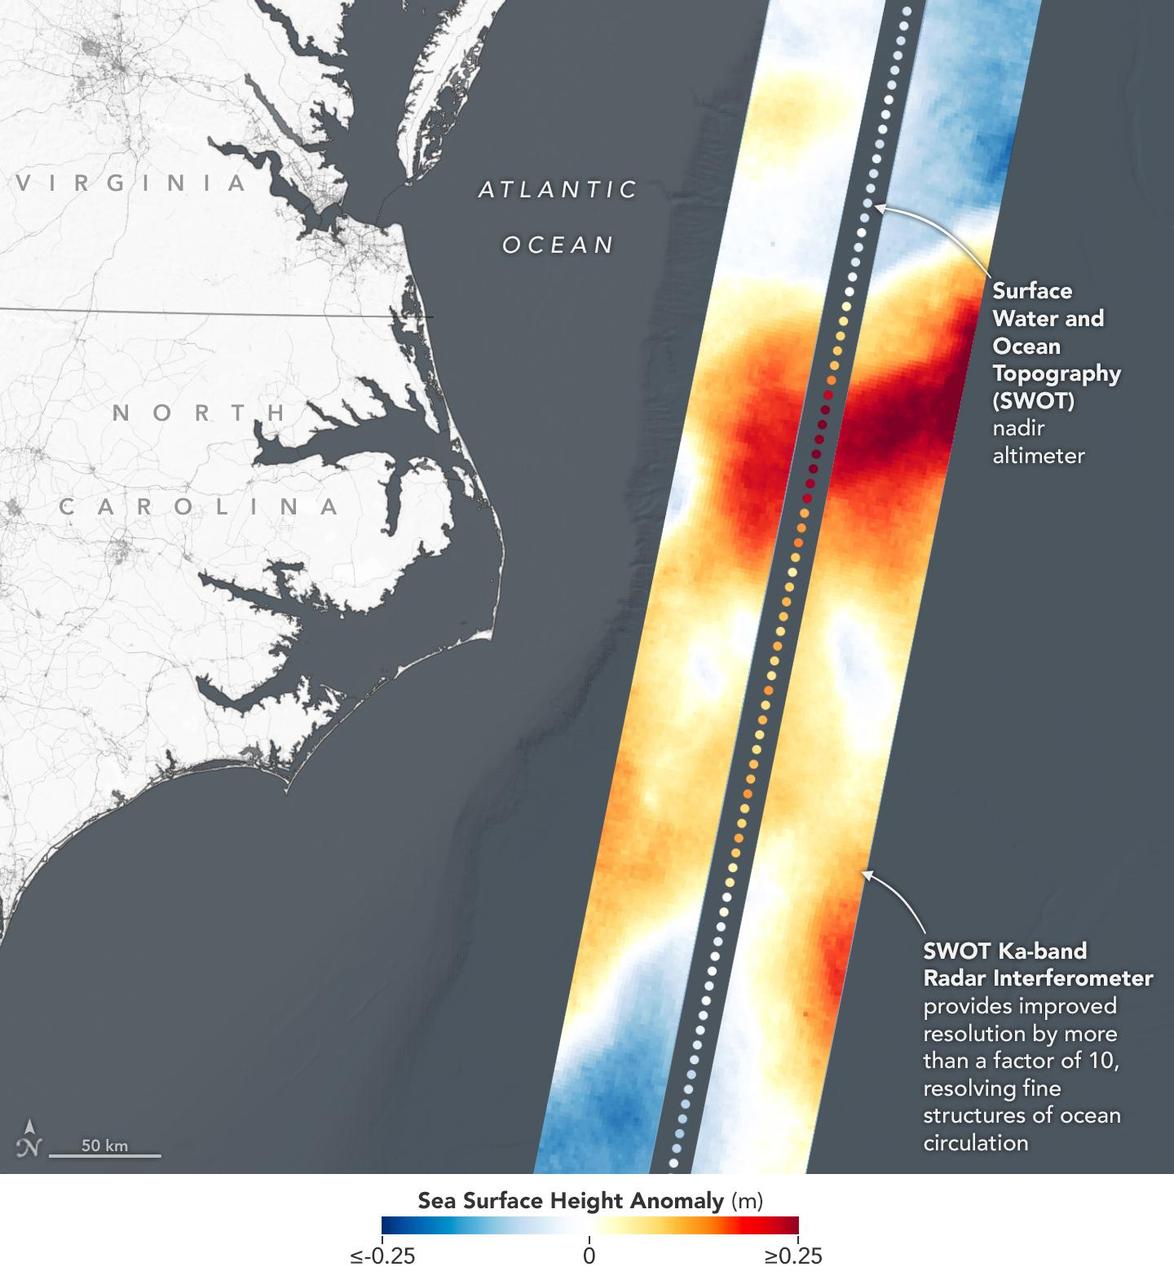
This visualization shows sea surface height measurements in the Gulf Stream off the coast of North Carolina and Virginia. The data was collected on Jan. 21, 2023, by an instrument on the Surface Water and Ocean Topography (SWOT) satellite called the Ka-band Radar Interferometer (KaRIn). KaRIn's two antennas acquired data that was mapped as two wide, colored strips spanning a total of 75 miles (120 kilometers) across. In the visualization, red and orange areas represent sea levels that are higher than the global average, while shades of blue represent sea levels that are lower than average. The spatial resolution of SWOT ocean measurements is 10 times greater than the composite of sea surface height data gathered over the same area by seven other satellites that same day. KaRIn is the scientific heart of the SWOT mission. It's a radar instrument with one antenna at each end of a boom that's 33 feet (10 meters) long. This enables KaRIn to look off to either side of a center line directly below the satellite as the instrument bounces microwave signals off of Earth's surface. The returning radar signals arrive at each antenna slightly out of step, or phase, from one another. When these signals are combined with other information about the antennas and the satellite's altitude, scientists will be able to map the height of water on Earth's surface with never-before-seen clarity. Led by NASA and the French space agency Centre National d'Études Spatiales (CNES), SWOT will measure the height of water on over 90% of Earth's surface, providing a high-definition survey of our planet's water for the first time. The satellite's measurements of freshwater bodies and the ocean will provide insights into how the ocean influences climate change; how a warming world affects lakes, rivers, and reservoirs; and how communities can better prepare for disasters like floods. Launched on Dec. 16, 2022, from Vandenberg Space Force Base in central California, SWOT is now in a six-month period called commissioning, calibration and validation. This is when engineers on the mission check out the satellite's systems and science instruments to ensure data accuracy before the start of science operations in July. https://photojournal.jpl.nasa.gov/catalog/PIA25772
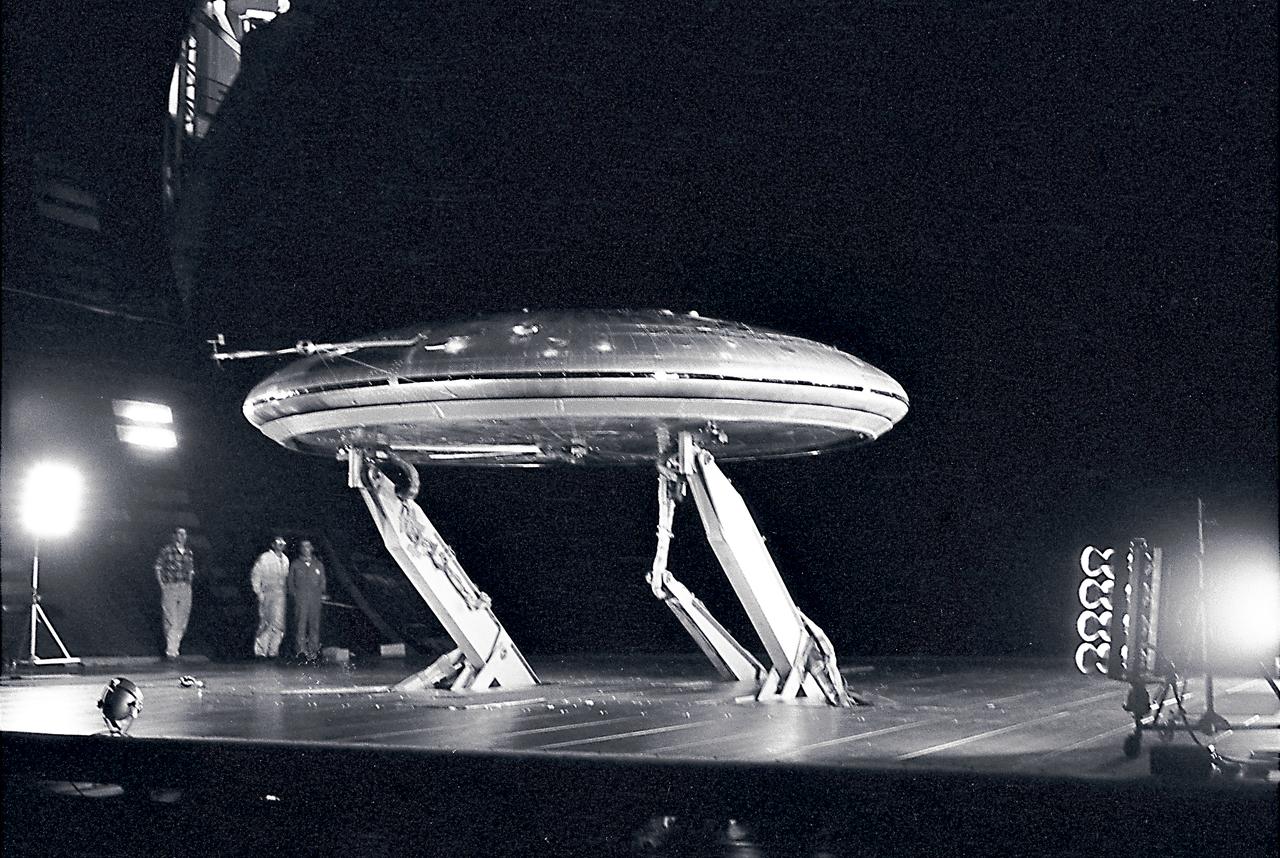
Front 3/4 view of the Avrocar mounted on variable height struts in the Ames 40x80 foot wind tunnel, without tail.

Goddard Space Center’s Laura Duncanson records global positioning satellite coordinates of the Pongara Mangrove and tree heights and diameters.

Color view of the Avrocar from overhead in the 40x80 wind tunnel, without A1:H73 mounted on variable height struts.

Front 3/4 view of the Avrocar mounted on variable height struts in the Ames 40x80 foot wind tunnel, without tail.
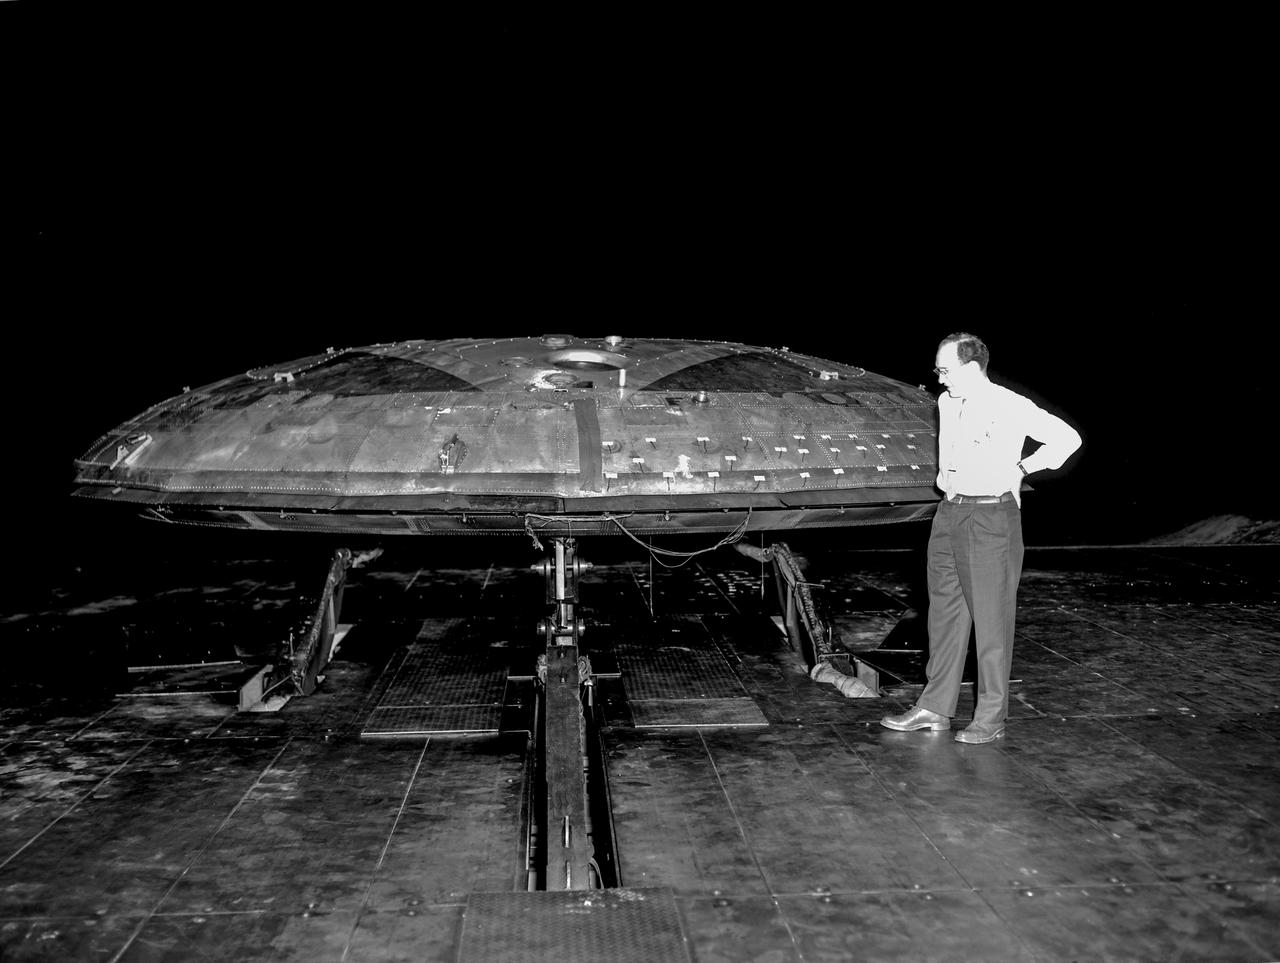
Avrocar with ground board and variable height struts and no tail. Can see focusing ring that controlled the peripheral jet.

Tandem dual ducted fan mounted on ground plane on varriable height struts, 3/4 front view
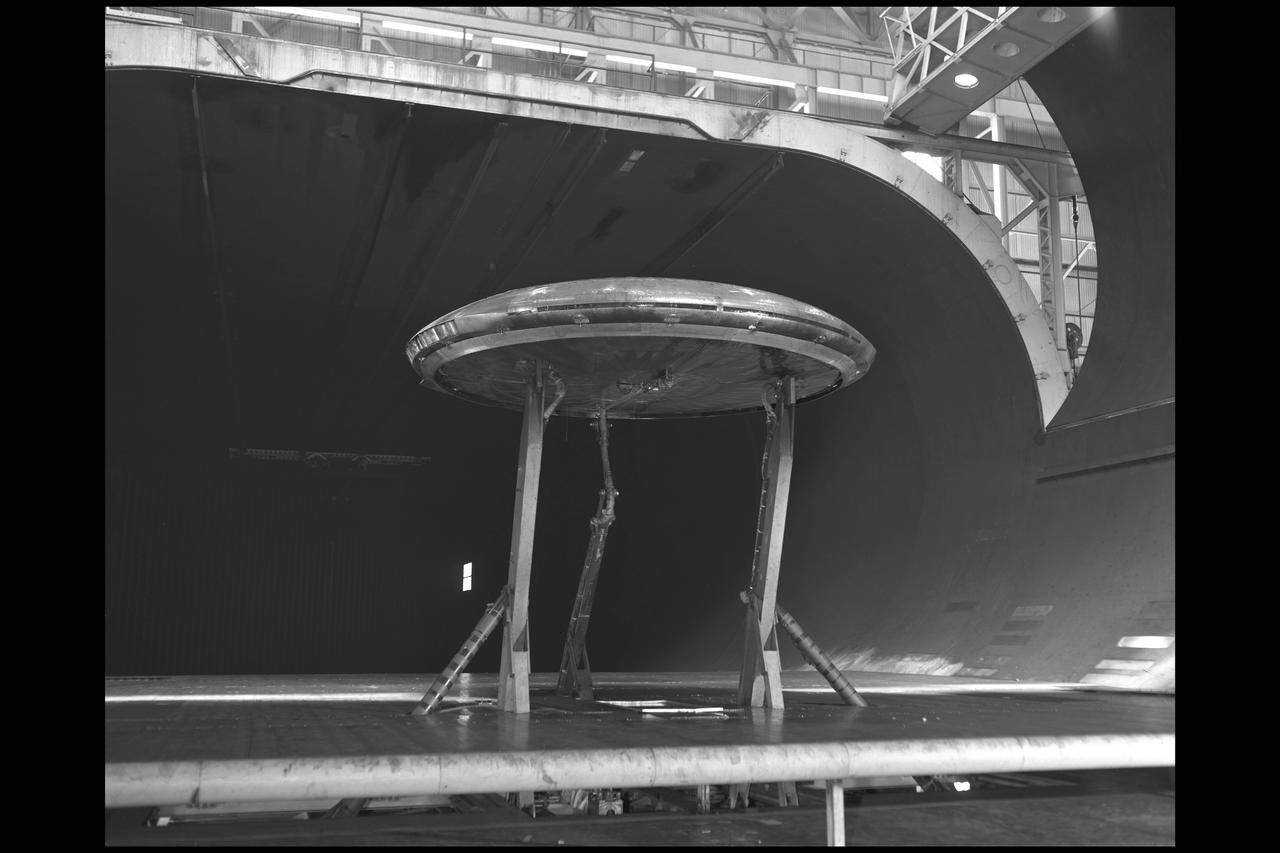
Front view of the Avrocar on variable height struts in 40x 80 wind tunnel with overhead doors open.
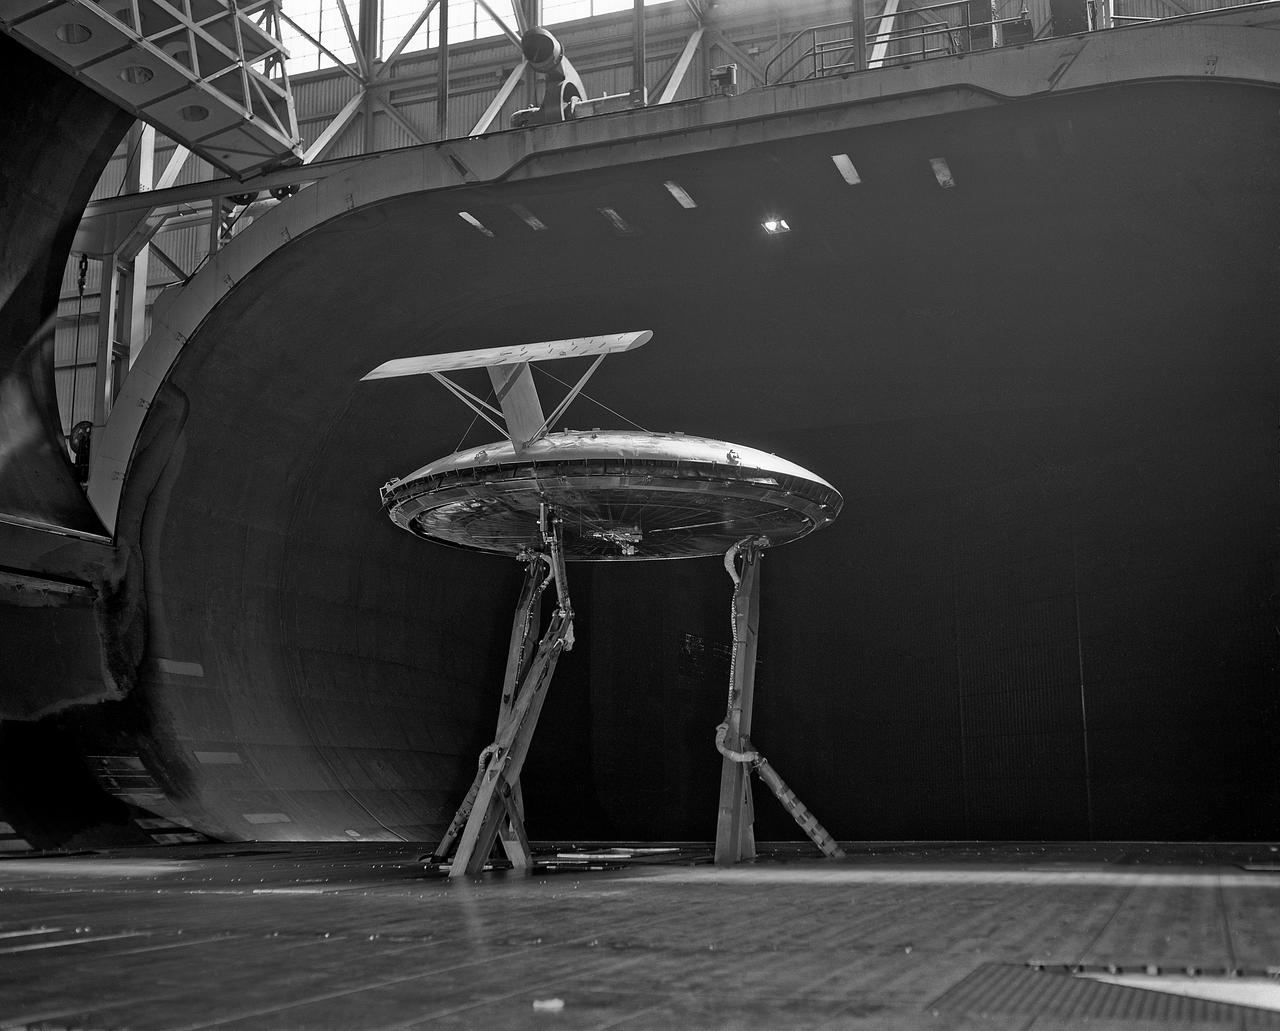
Rear view of the Avrocar with tail, mounted on variable height struts. Overhead doors of the wind tunnel test section open.