
Holli Riebeek, Education and Public Outreach Lead for NASA/Landsat Mission at NASA's Goddard Spaceflight Center, is seen speaking to students at NASA's Earth Day Science Gallery Exhibit, Monday, April 22, 2013 at Union Station in Washington. The NASA Science Gallery exhibits are being sponsored by NASA in honor of Earth Day. (Photo Credit: NASA/Carla Cioffi)

Holli Riebeek, Education and Public Outreach Lead for NASA/Landsat Mission at NASA's Goddard Spaceflight Center, holds up Landsat maps NASA's Earth Day Science Gallery Exhibit, Monday, April 22, 2013 at Union Station in Washington. The NASA Science Gallery exhibits are being sponsored by NASA in honor of Earth Day. (Photo Credit: NASA/Carla Cioffi)
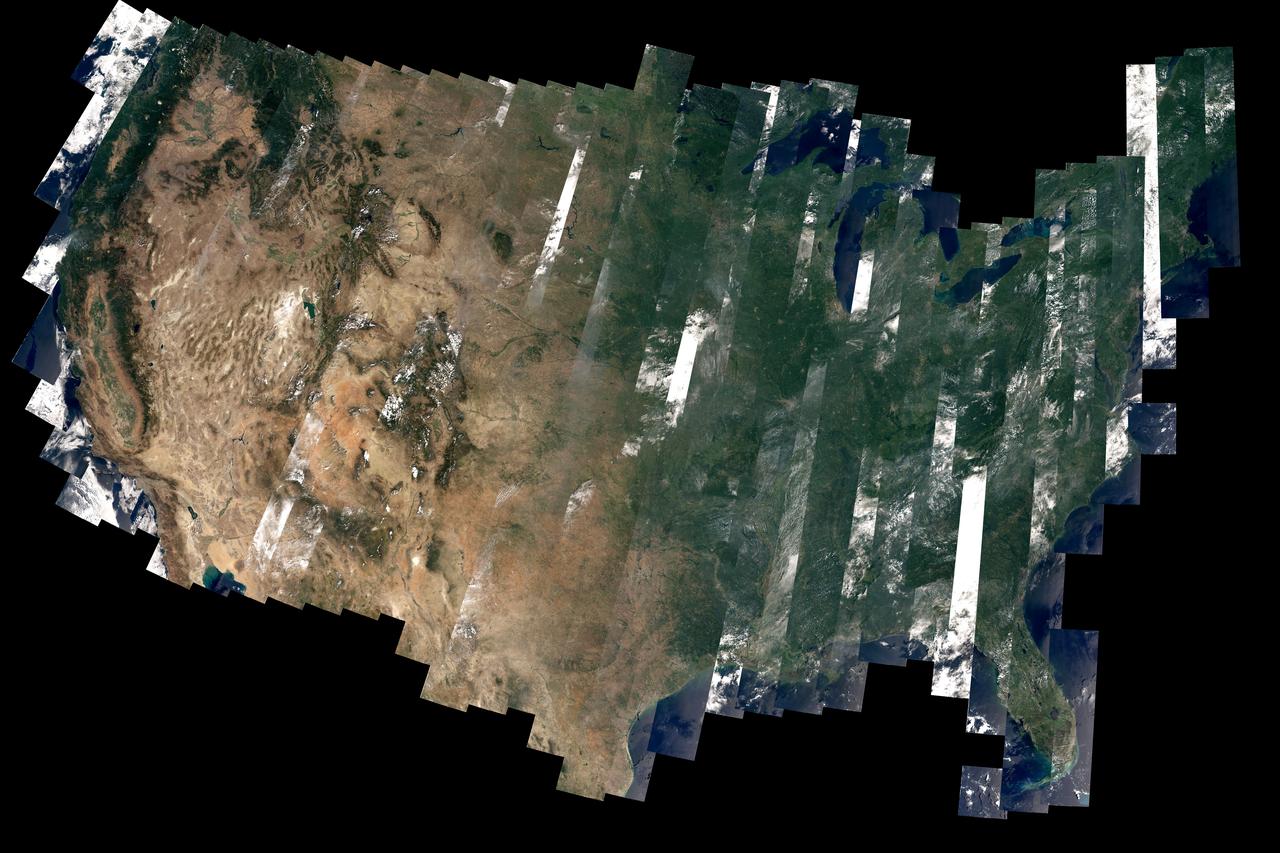
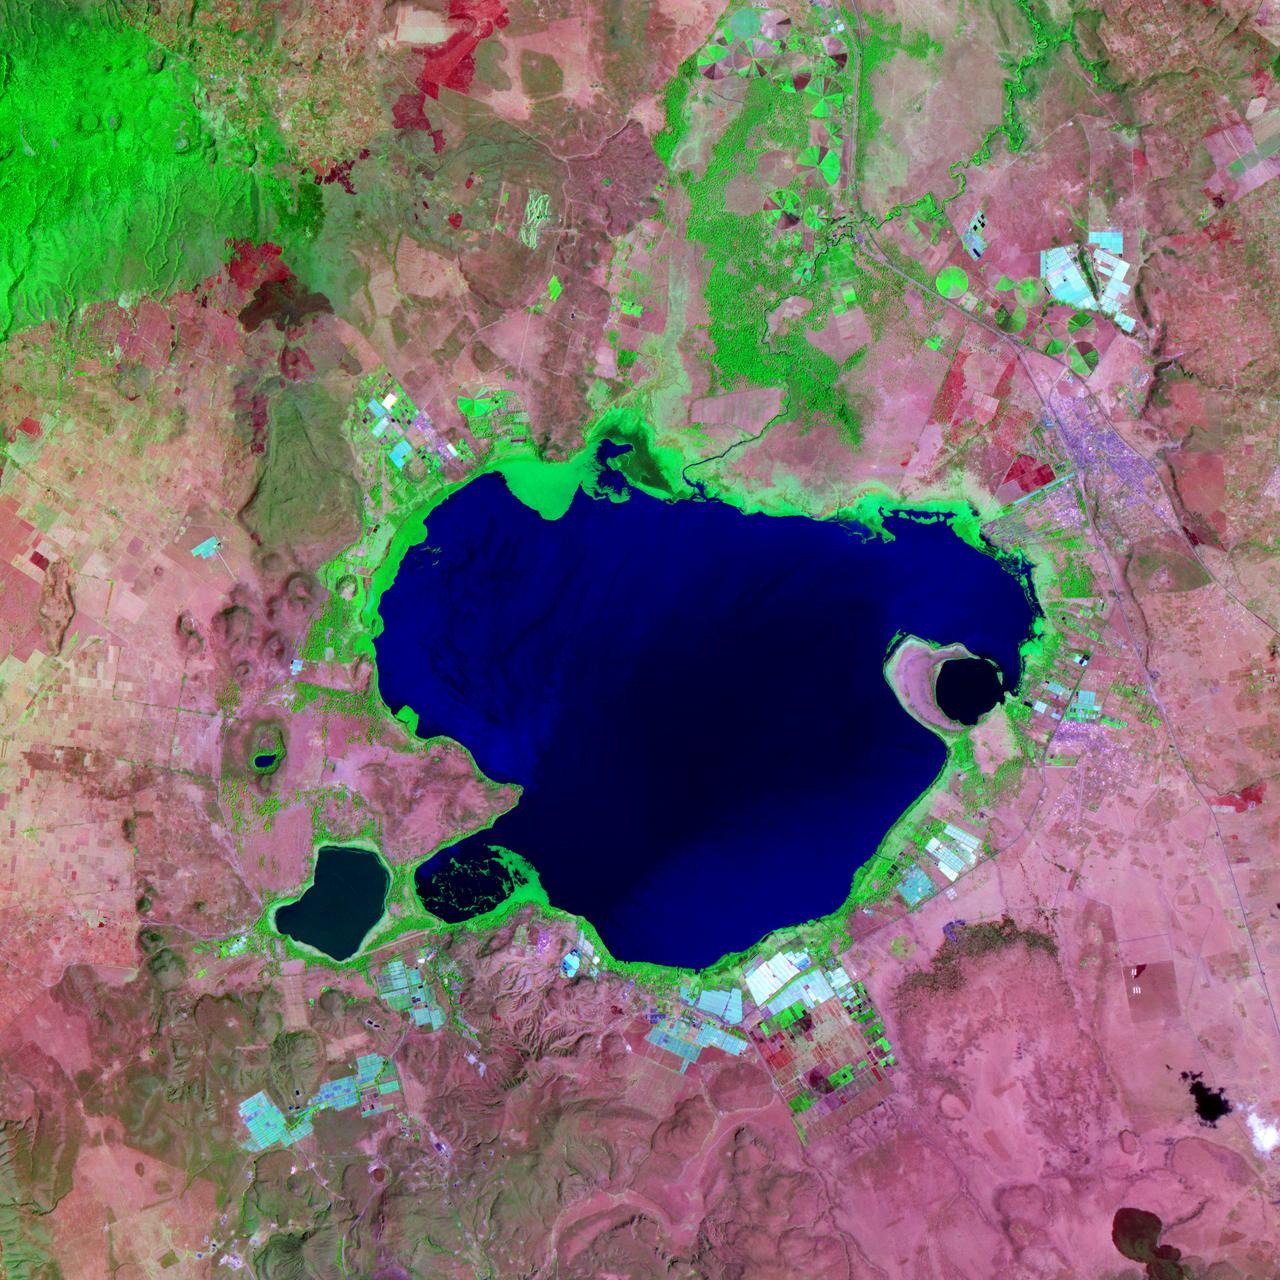
On February 11, 2013, the Landsat 8 satellite rocketed into a sunny California morning onboard a powerful Atlas V and began its life in orbit. In the year since launch, scientists have been working to understand the information the satellite has been sending back. Some have been calibrating the data—checking it against ground observations and matching it to the rest of the 42-year-long Landsat record. At the same time, the broader science community has been learning to use the new data. The map above—one of the first views of the United States from Landsat 8—is an example of how scientists are testing Landsat 8 data. David Roy, a co-leader of the USGS-NASA Landsat science team and researcher at South Dakota State University, made the map with observations taken during August 2013 by the satellite’s Operational Land Imager. Read more: <a href="http://earthobservatory.nasa.gov/IOTD/view.php?id=83099" rel="nofollow">earthobservatory.nasa.gov/IOTD/view.php?id=83099</a> Image courtesy David Roy, USGS-NASA WELD product. Caption by Holli Riebeek. Instrument: Landsat 8 - OLI Credit: <b><a href="http://www.earthobservatory.nasa.gov/" rel="nofollow"> NASA Earth Observatory</a></b> <b><a href="http://www.nasa.gov/audience/formedia/features/MP_Photo_Guidelines.html" rel="nofollow">NASA image use policy.</a></b> <b><a href="http://www.nasa.gov/centers/goddard/home/index.html" rel="nofollow">NASA Goddard Space Flight Center</a></b> enables NASA’s mission through four scientific endeavors: Earth Science, Heliophysics, Solar System Exploration, and Astrophysics. Goddard plays a leading role in NASA’s accomplishments by contributing compelling scientific knowledge to advance the Agency’s mission. <b>Follow us on <a href="http://twitter.com/NASAGoddardPix" rel="nofollow">Twitter</a></b> <b>Like us on <a href="http://www.facebook.com/pages/Greenbelt-MD/NASA-Goddard/395013845897?ref=tsd" rel="nofollow">Facebook</a></b> <b>Find us on <a href="http://instagram.com/nasagoddard?vm=grid" rel="nofollow">Instagram</a></b>
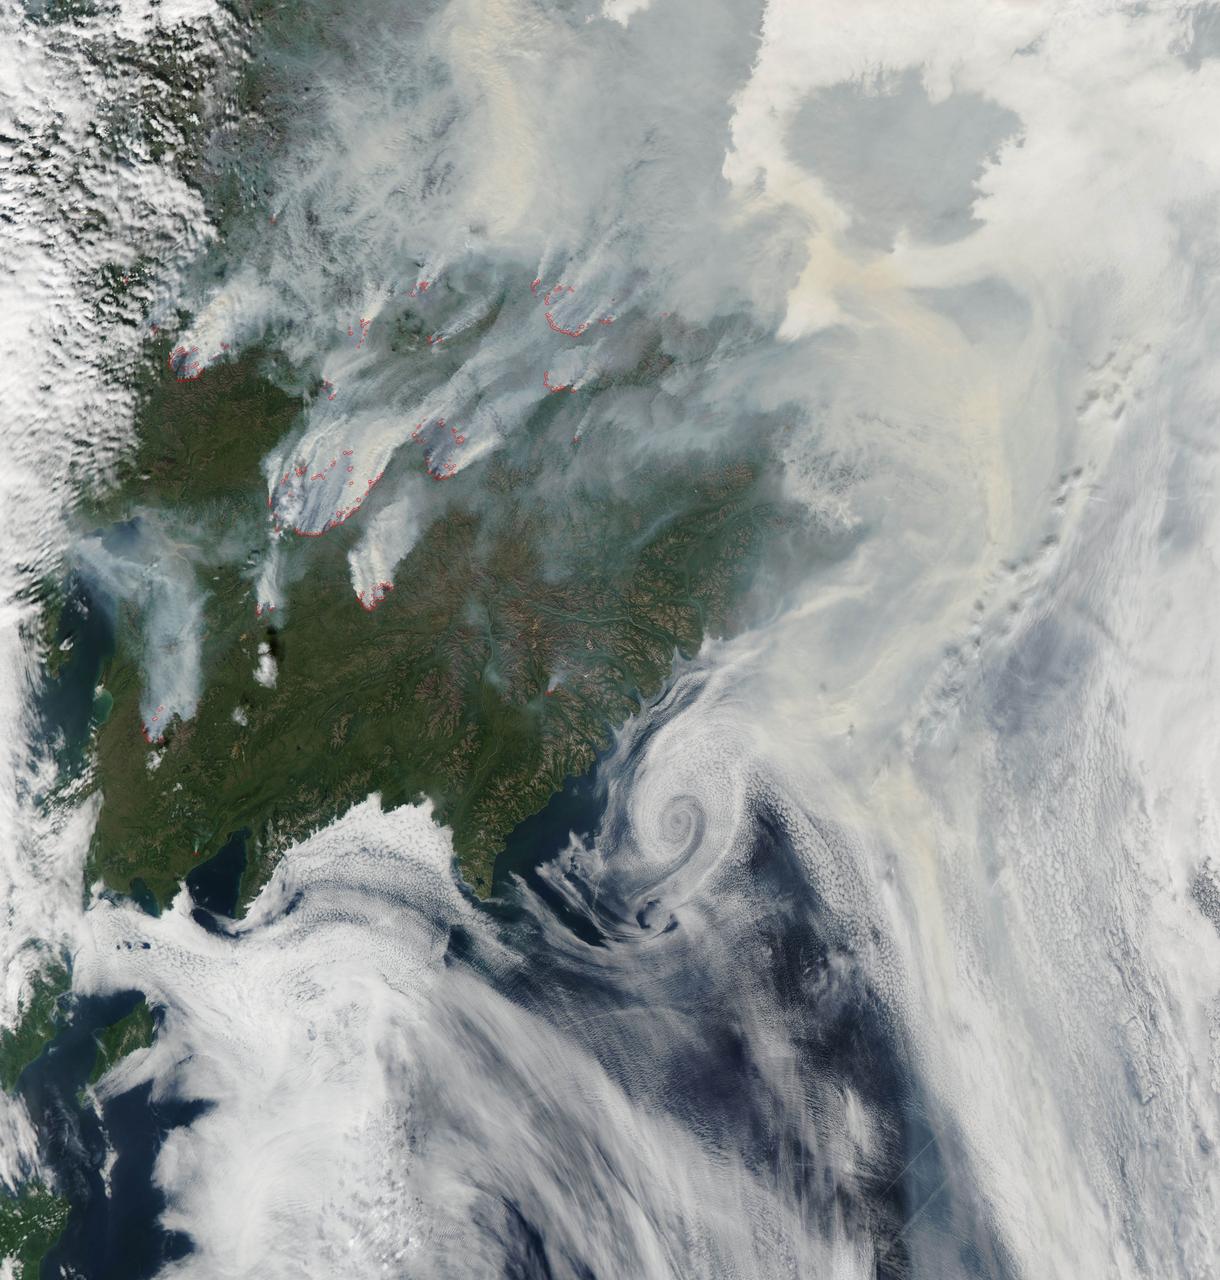
NASA image acquired August 1, 2010 Intense fires continued to burn in the boreal forests of eastern Siberia on August 1, 2010. The fires are outlined in red in this image, acquired by the Moderate Resolution Imaging Spectroradiometer (MODIS) on NASA’s Aqua satellite. The fires span the borders of Russia’s Chukotskiy, Magadan, and Koryakskiy provinces. Burning in coniferous (evergreen) forests, the fires blanketed northeastern Siberia with thick brown smoke. The smoke hugs the ground near the fires, filling valleys, and soars over clouds farther away from the flames. On August 1, the smoke flowed north from the fires and over the Arctic Ocean. A wide view of the Arctic shows the smoke crossing the Bering Strait and clouding skies over northern Alaska. This image is available in additional resolutions from the MODIS Rapid Response Team here: <a href="http://rapidfire.sci.gsfc.nasa.gov/gallery/?2010213-0801/Russia.A2010213.0045.2km.jpg" rel="nofollow">rapidfire.sci.gsfc.nasa.gov/gallery/?2010213-0801/Russia....</a> To view more images from this event go to: <a href="http://earthobservatory.nasa.gov/NaturalHazards/event.php?id=44561" rel="nofollow">earthobservatory.nasa.gov/NaturalHazards/event.php?id=44561</a> NASA image courtesy Jeff Schmaltz, MODIS Rapid Response Team at NASA GSFC. Caption by Holli Riebeek Instrument: Aqua - MODIS <b><a href="http://www.nasa.gov/centers/goddard/home/index.html" rel="nofollow">NASA Goddard Space Flight Center</a></b> is home to the nation's largest organization of combined scientists, engineers and technologists that build spacecraft, instruments and new technology to study the Earth, the sun, our solar system, and the universe. <b>Follow us on <a href="http://twitter.com/NASA_GoddardPix" rel="nofollow">Twitter</a></b> <b>Join us on <a href="http://www.facebook.com/pages/Greenbelt-MD/NASA-Goddard/395013845897?ref=tsd" rel="nofollow">Facebook</a><b></b></b>
September 22, the autumnal equinox, marks the beginning of fall in the Northern Hemisphere, but the fall harvest begins early in the harsh continental climate of eastern Kazakhstan. By September 9, 2013, when the Operational Land Imager (OLI) on the Landsat 8 satellite acquired this image, several fields were already harvested and bare. Others were dark green with pasture grasses or ripening crops. The fields fill the contours of the land, running long and narrow down mountain valleys and spreading in large squares over the plains. Agriculture is an important segment of the economy in Kazakhstan: the country’s dry climate is ideal for producing high quality wheat for export. However, 61 percent of the country’s agricultural land is pasture for livestock. The area shown in this image, far eastern Kazakhstan near the Chinese border, is a minor wheat-growing region and may also produce sunflowers, barley, and other food crops. An artifact of Soviet-era collective farms, most of the farms in Kazakhstan are large, covering more than 5,000 hectares (12,500 acres). Some of the larger fields in the image reflect the big business side of agriculture. However, family farms and small agriculture businesses account for 35 percent of the country’s agricultural production, and some of these are visible as well, particularly in the uneven hills and mountains. Nearly all agriculture in Kazakhstan is rain fed. Farmers in this region have designed their fields to take advantage of rain flowing down hills, allowing the natural shape of the land to channel water to crops. The effect is a mosaic of green and tan with tones matching the natural vegetation in the mountains to the north. NASA Earth Observatory image by Jesse Allen using Landsat data from the U.S. Geological Survey. Caption by Holli Riebeek. Instrument: Landsat 8 - OLI More info: <a href="http://1.usa.gov/16IZ047" rel="nofollow">1.usa.gov/16IZ047</a> <b><a href="http://www.nasa.gov/audience/formedia/features/MP_Photo_Guidelines.html" rel="nofollow">NASA image use policy.</a></b> <b><a href="http://www.nasa.gov/centers/goddard/home/index.html" rel="nofollow">NASA Goddard Space Flight Center</a></b> enables NASA’s mission through four scientific endeavors: Earth Science, Heliophysics, Solar System Exploration, and Astrophysics. Goddard plays a leading role in NASA’s accomplishments by contributing compelling scientific knowledge to advance the Agency’s mission. <b>Follow us on <a href="http://twitter.com/NASA_GoddardPix" rel="nofollow">Twitter</a></b> <b>Like us on <a href="http://www.facebook.com/pages/Greenbelt-MD/NASA-Goddard/395013845897?ref=tsd" rel="nofollow">Facebook</a></b> <b>Find us on <a href="http://instagram.com/nasagoddard?vm=grid" rel="nofollow">Instagram</a></b>
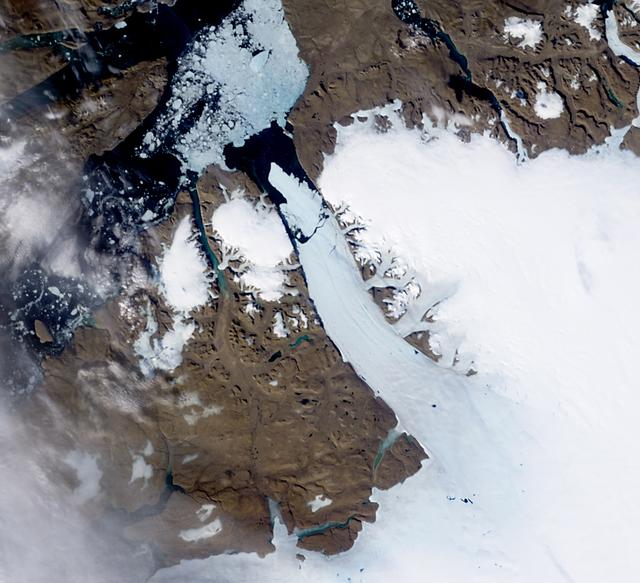
NASA image acquired August 5, 2010 On August 5, 2010, an enormous chunk of ice, roughly 97 square miles (251 square kilometers) in size, broke off the Petermann Glacier, along the northwestern coast of Greenland. The Canadian Ice Service detected the remote event within hours in near real-time data from the Moderate Resolution Imaging Spectroradiometer (MODIS) on NASA’s Aqua satellite. The Peterman Glacier lost about one-quarter of its 70-kilometer (40-mile) long floating ice shelf, said researchers who analyzed the satellite data at the University of Delaware. The Moderate Resolution Imaging Spectroradiometer (MODIS) on NASA’s Terra satellite captured these natural-color images of Petermann Glacier 18:05 UTC on August 5, 2010 (top), and 17:15 UTC on July 28, 2010 (bottom). The Terra image of the Petermann Glacier on August 5 was acquired almost 10 hours after the Aqua observation that first recorded the event. By the time Terra took this image, skies were less cloudy than they had been earlier in the day, and the oblong iceberg had broken free of the glacier and moved a short distance down the fjord. Icebergs calving off the Petermann Glacier are not unusual. Petermann Glacier’s floating ice tongue is the Northern Hemisphere’s largest, and it has occasionally calved large icebergs. The recently calved iceberg is the largest to form in the Arctic since 1962, said the University of Delaware. To read more and or to download the high res go here: <a href="http://www.nasa.gov/topics/earth/features/petermann-calve.html" rel="nofollow">www.nasa.gov/topics/earth/features/petermann-calve.html</a> or Click here to see more images from <b><a href="#//earthobservatory.nasa.gov/" rel="nofollow"> NASA Goddard’s Earth Observatory</a></b> NASA Earth Observatory image created by Jesse Allen and Robert Simmon, using data obtained from the Goddard Level 1 and Atmospheric Archive and Distribution System (LAADS). Caption by Holli Riebeek and Michon Scott. Instrument: Terra - MODIS <b><a href="http://www.nasa.gov/centers/goddard/home/index.html" rel="nofollow">NASA Goddard Space Flight Center</a></b> is home to the nation's largest organization of combined scientists, engineers and technologists that build spacecraft, instruments and new technology to study the Earth, the sun, our solar system, and the universe. <b>Follow us on <a href="http://twitter.com/NASA_GoddardPix" rel="nofollow">Twitter</a></b> <b>Join us on <a href="http://www.facebook.com/pages/Greenbelt-MD/NASA-Goddard/395013845897?ref=tsd" rel="nofollow">Facebook</a><b></b></b>
NASA satellite image acquired February 2, 2008. Outside the ground is frozen, quite possibly covered in snow and ice, and yet, stroll through a supermarket in North America or Europe in February, and you’ll be confronted with large displays of roses. We expect flowers in winter, and equatorial countries meet those expectations. A quarter of the cut flowers sold in Europe are grown in Kenya. Straddling the equator, Kenya gets steady sunlight dealt out in days that vary little in length. It’s the perfect climate for flowers year-round. The center of Kenya’s flower industry is Lake Naivasha, shown here. The Advanced Spaceborne Thermal Emission and Reflection Radiometer (ASTER) flying on NASA’s Terra satellite captured this image of Lake Naivasha on February 2, 2008. Bright white squares mix with fields of green, tan, and purple along the shores of the lake. Sunlight glints off the long rows of glass greenhouses, turning them silvery blue and white in this view from space. Fallow fields are tan and pink, while growing plants turn the ground bright green. Roses, lilies, and carnations are the most common flowers grown in the greenhouses and fields scattered around the lake. The large-scale industry shown here extends into small-scale rural farms elsewhere in Kenya, where smaller filler flowers are grown. The flowers provide an important source of income to Kenya, but the industry comes with a price. Flowers are not held to the same standards for chemical residues as food products, which are tightly regulated. Strong chemical pesticides can be used on the flowers to produce the perfect, pest-free bloom, and this could pose a health risk to workers and local wildlife, including hippos, environmental groups told the Food and Agriculture Organization of the United Nations in 2002. The chemicals may also have threatened the water quality of Lake Naivasha, one of Kenya’s few freshwater lakes. The Kenya Flower Council instituted a code of conduct establishing guidelines for pesticide that phases out the use of one of the most toxic pesticides. NASA image created by Jesse Allen, using data provided courtesy of NASA/GSFC/METI/ERSDAC/JAROS, and U.S./Japan ASTER Science Team. Caption by Holli Riebeek. Instrument: Terra - ASTER <b><a href="http://www.nasa.gov/centers/goddard/home/index.html" rel="nofollow">NASA Goddard Space Flight Center</a></b> is home to the nation's largest organization of combined scientists, engineers and technologists that build spacecraft, instruments and new technology to study the Earth, the sun, our solar system, and the universe.
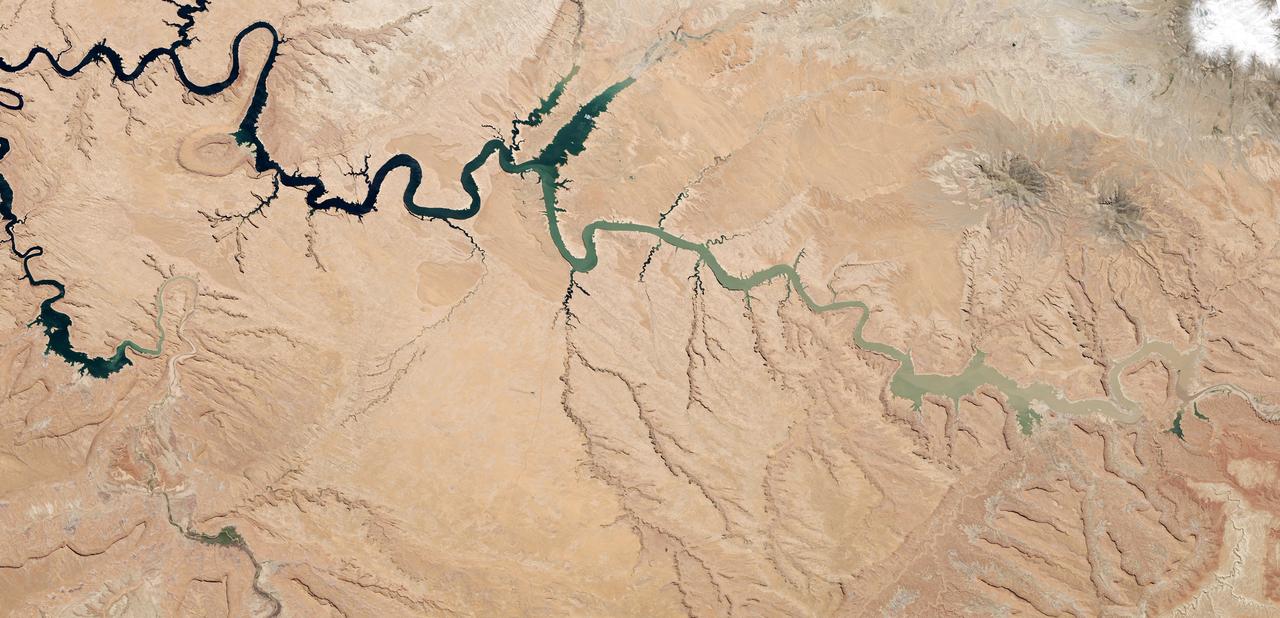
After 14 years of drought, Lake Powell was at 42 percent of its capacity as of May 20, 2014. The low water levels are evident in these images, which were acquired by the Landsat 8 satellite on May 13, 2014. White bleached rock show where Lake Powell’s shore is when the reservoir is at capacity. It is normal for water levels to fluctuate in the reservoir depending on how much water flows in from snow and rain and how much flows out to meet needs. However, it has been dry in all but three of the past 14 years. At the beginning of 2000, Lake Powell was at 94 percent of capacity. By October 2013 (the beginning of the 2014 water year), water levels had dropped to a low of 50 percent capacity, according to the Bureau of Reclamation, the agency that manages the reservoir. The Earth Observatory’s World of Change shows this annual fluctuation and overall decline. With slightly above average snowpack in the basin that feeds the lake, water levels are expected to rebound to about 51 percent of capacity by October 2014, the end of the water year. While the drop in water levels are worrying for those who generate electricity or use the water for agriculture, the lower water levels may be a draw for recreation. Boaters coming to Lake Powell in the spring of 2014 will find beaches and rock formations that are usually underwater. Bullfrog Bay is the starting point for many boat rentals. The popularity of the spot is evident in the lower image: boats dot the surface of the water, just tiny white flecks at this scale. NASA Earth Observatory image by Robert Simmon, using Landsat data from the U.S. Geological Survey. Caption by Holli Riebeek. Instrument(s): Landsat 8 - OLI Read more: <a href="http://1.usa.gov/1hck6NX" rel="nofollow">1.usa.gov/1hck6NX</a> Credit: <b><a href="http://www.earthobservatory.nasa.gov/" rel="nofollow"> NASA Earth Observatory</a></b> <b><a href="http://www.nasa.gov/audience/formedia/features/MP_Photo_Guidelines.html" rel="nofollow">NASA image use policy.</a></b> <b><a href="http://www.nasa.gov/centers/goddard/home/index.html" rel="nofollow">NASA Goddard Space Flight Center</a></b> enables NASA’s mission through four scientific endeavors: Earth Science, Heliophysics, Solar System Exploration, and Astrophysics. Goddard plays a leading role in NASA’s accomplishments by contributing compelling scientific knowledge to advance the Agency’s mission. <b>Follow us on <a href="http://twitter.com/NASAGoddardPix" rel="nofollow">Twitter</a></b> <b>Like us on <a href="http://www.facebook.com/pages/Greenbelt-MD/NASA-Goddard/395013845897?ref=tsd" rel="nofollow">Facebook</a></b> <b>Find us on <a href="http://instagram.com/nasagoddard?vm=grid" rel="nofollow">Instagram</a></b>
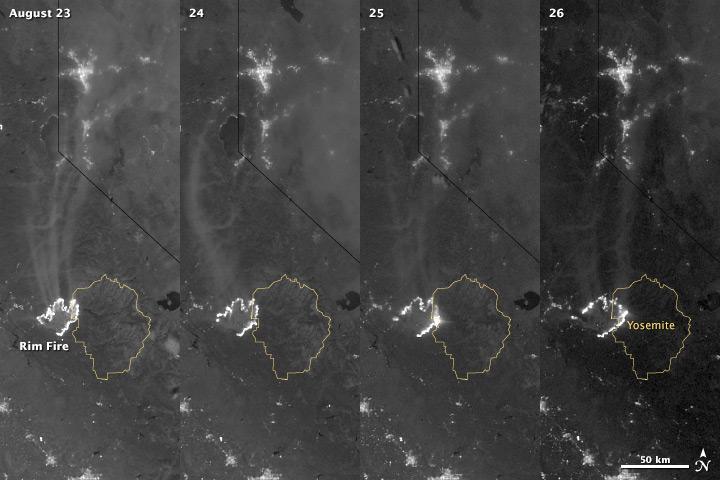
The winter of 2013 was among the driest on record for California, setting the stage for an active fire season. By August 26, the Rim Fire had made its way into the record books. At just 15 percent contained, the fire is now the 13th largest in California since records began in 1932. Apart from being large, the fire is also threatening one of the United States’ greatest natural treasures: Yosemite National Park. The Visible Infrared Imaging Radiometer Suite (VIIRS) on the Suomi NPP satellite tracked the growth of the fire between August 23 and August 26 in this series of nighttime images. The VIIRS day-night band is extremely sensitive to low light, making it possible to see the fire front from space. The brightest, most intense parts of the fire glow white, exceeding the brightness of the lights of Reno, Nevada to the north. Pale gray smoke streams north away from the fire throughout the sequence. The perimeter of the fire grows from day to day along different fronts, depending on winds and fire fighting efforts. On August 24, fire fighters focused their efforts on containing the western edge of the fire to prevent it from burning into Tuolumne City and the populated Highway 108 corridor. They also fought the eastern edge of the fire to protect Yosemite National Park. These efforts are evident in the image: Between August 23 and 24, the eastern edge of the fire held steady, and the western edge receded. The fire grew in the southeast. On the morning of August 25 fire managers reported that the fire was growing in the north and east. In the image, the most intense activity is just inside Yosemite National Park. Fire fighters reported that the Rim Fire continued to be extremely active on its eastern front on the morning of August 26, and this activity is visible in the image. By 8:00 a.m., the fire had burned 149,780 acres. The fire forced firefighters in Yosemite National Park to take measures to protect the Merced and Tuolumne Groves of Giant Sequoias, but the National Park Service reported that the trees were not in imminent danger. While parts of the park are closed, webcams show that most of the park has not been impacted. The Rim Fire started on the afternoon of August 17. It has destroyed 23 structures and threatened 4,500 other buildings. Its cause is under investigation. More details: <a href="http://1.usa.gov/18ilEAA" rel="nofollow">1.usa.gov/18ilEAA</a> NASA Earth Observatory image by Jesse Allen and Robert Simmon, using VIIRS Day Night Band data. Caption by Holli Riebeek. Instrument: Suomi NPP - VIIRS <b><a href="http://www.nasa.gov/audience/formedia/features/MP_Photo_Guidelines.html" rel="nofollow">NASA image use policy.</a></b> <b><a href="http://www.nasa.gov/centers/goddard/home/index.html" rel="nofollow">NASA Goddard Space Flight Center</a></b> enables NASA’s mission through four scientific endeavors: Earth Science, Heliophysics, Solar System Exploration, and Astrophysics. Goddard plays a leading role in NASA’s accomplishments by contributing compelling scientific knowledge to advance the Agency’s mission. <b>Follow us on <a href="http://twitter.com/NASA_GoddardPix" rel="nofollow">Twitter</a></b> <b>Like us on <a href="http://www.facebook.com/pages/Greenbelt-MD/NASA-Goddard/395013845897?ref=tsd" rel="nofollow">Facebook</a></b> <b>Find us on <a href="http://instagram.com/nasagoddard?vm=grid" rel="nofollow">Instagram</a></b>
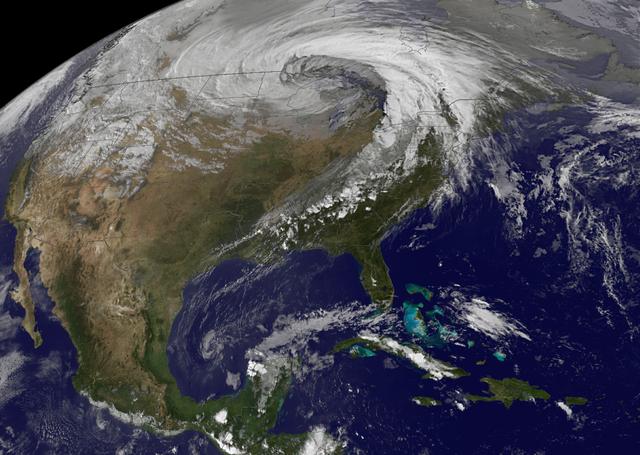
NASA image acquired October 26, 2010 The storm that swept across the center of the United States on October 26 and October 27, 2010, was memorable to those who experienced it because of its strong winds, rain, hail, and widespread tornadoes. Meteorologists get excited about the storm because it set a record for the lowest pressure (not associated with a hurricane) measured over land in the continental United States. At 5:13 p.m. CDT, the weather station in Bigfork, Minnesota recorded 955.2 millibars (28.21 inches of pressure). Pressure is one indicator of a storm’s strength, and this measurement corresponds to the pressure seen in a Category 3 hurricane. This image, taken by the GOES satellite on October 26, shows the storm system circling around the area of extreme low pressure. Such extratropical cyclones form over the United States in the spring and fall, when the temperature difference from north to south is large. Warm, high-pressure air rushes toward the cooler, low-pressure air in the north. Because the Earth is rotating, the air moving in ends up circling the area of low pressure, creating the cyclone shown in the image. The intensity of the storm is determined by the pressure difference between the center and the outer edges. Extreme low pressure in the center of the storm, therefore, is an indicator that the storm was very intense. The animation shows the storm developing starting late on October 25 and running through October 27. The cyclone formed very quickly on October 26, taking a distinctive comma shape as the day went on. The storm developed so quickly, in fact, that it is classified as a bomb, an extremely fast developing storm (dropping at least one millibar of pressure per hour for 24 hours), more common over water than land. The storm was also huge. Though the area of low pressure is centered over the Upper Midwest, the storm reached from the Gulf of Mexico into Canada, and from the Rocky Mountains to the Atlantic Ocean. Extratropical cyclones bring an array of unsettled weather, including strong wind, rain, hail, and tornadoes, and this cyclone brought all of that. On October 26–27, winds gusted up to 78 miles per hour in Michigan, with high winds throughout the Midwest. The National Weather Service reported 61 tornadoes over the two days. Heavy snow also fell in the north. NASA Earth Observatory imagery created by Jesse Allen, using imagery provided courtesy of the NASA GOES Project Science Office. Caption by Holli RIebeek. Instrument: GOES Credit: <b><a href="http://www.earthobservatory.nasa.gov/" rel="nofollow"> NASA Earth Observatory</a></b> <b><a href="http://www.nasa.gov/centers/goddard/home/index.html" rel="nofollow">NASA Goddard Space Flight Center</a></b> enables NASA’s mission through four scientific endeavors: Earth Science, Heliophysics, Solar System Exploration, and Astrophysics. Goddard plays a leading role in NASA’s accomplishments by contributing compelling scientific knowledge to advance the Agency’s mission. <b>Follow us on <a href="http://twitter.com/NASA_GoddardPix" rel="nofollow">Twitter</a></b> <b>Join us on <a href="http://www.facebook.com/pages/Greenbelt-MD/NASA-Goddard/395013845897?ref=tsd" rel="nofollow">Facebook</a></b>
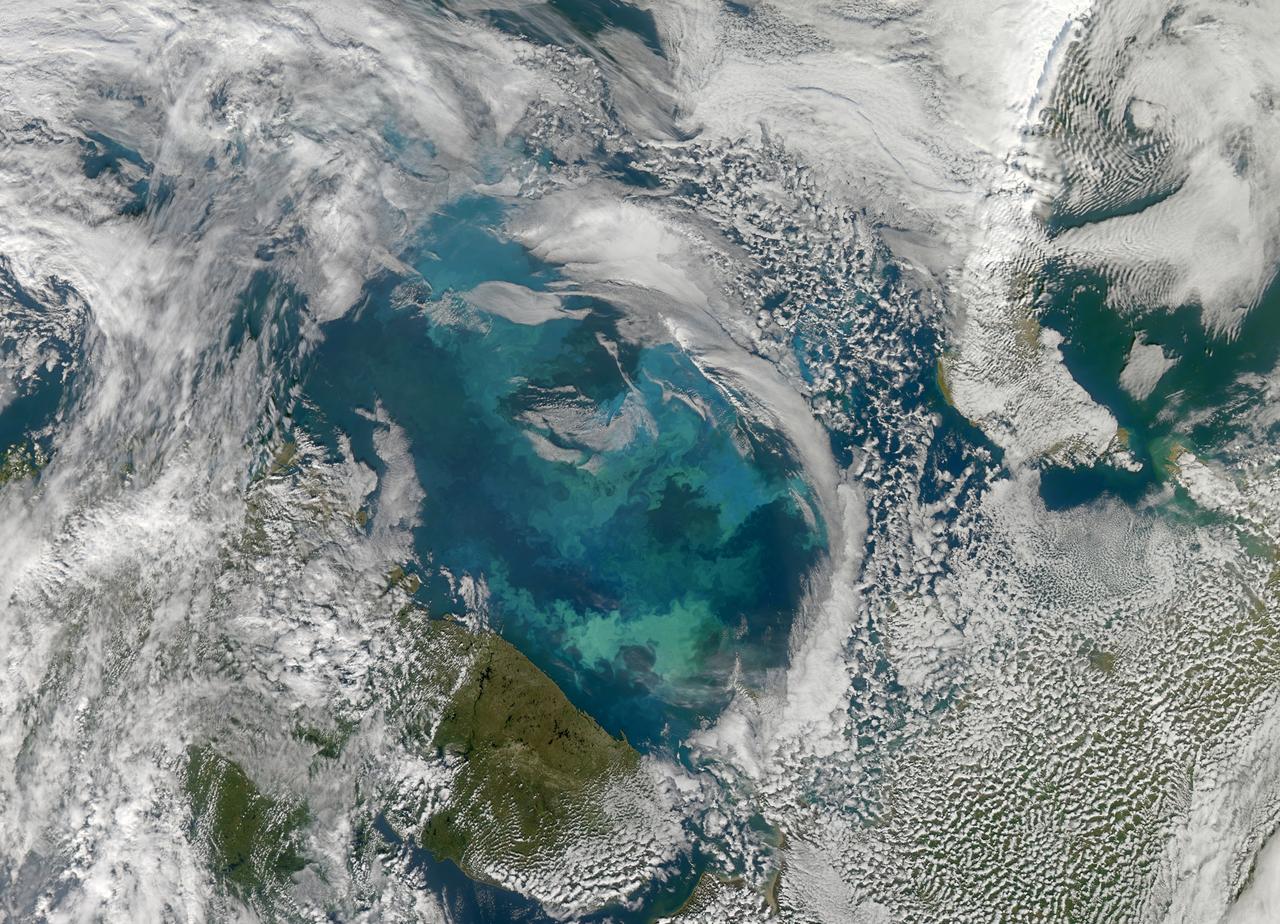
NASA image acquired August 31, 2010 To see a detail of this image go to: <a href="http://www.flickr.com/photos/gsfc/4971318856/">www.flickr.com/photos/gsfc/4971318856/</a> In this natural-color image from August 31, 2010, the ocean’s canvas swirls with turquoise, teal, navy, and green, the abstract art of the natural world. The colors were painted by a massive phytoplankton bloom made up of millions of tiny, light-reflecting organisms growing in the sunlit surface waters of the Barents Sea. Such blooms peak every August in the Barents Sea. The variations in color are caused by different species and concentrations of phytoplankton. The bright blue colors are probably from coccolithophores, a type of phytoplankton that is coated in a chalky shell that reflects light, turning the ocean a milky turquoise. Coccolithophores dominate the Barents Sea in August. Shades of green are likely from diatoms, another type of phytoplankton. Diatoms usually dominate the Barents Sea earlier in the year, giving way to coccolithophores in the late summer. However, field measurements of previous August blooms have also turned up high concentrations of diatoms. The Barents Sea is a shallow sea sandwiched between the coastline of northern Russia and Scandinavia and the islands of Svalbard, Franz Josef Land, and Novaya Zemlya. Within the shallow basin, currents carrying warm, salty water from the Atlantic collide with currents carrying cold, fresher water from the Arctic. During the winter, strong winds drive the currents and mix the waters. When winter’s sea ice retreats and light returns in the spring, diatoms thrive, typically peaking in a large bloom in late May. The shift between diatoms and coccolithophores occurs as the Barents Sea changes during the summer months. Throughout summer, perpetual light falls on the waters, gradually warming the surface. Eventually, the ocean stratifies into layers, with warm water sitting on top of cooler water. The diatoms deplete most of the nutrients in the surface waters and stop growing. Coccolithophores, on the other hand, do well in warm, nutrient-depleted water with a lot of light. In the Barents Sea, these conditions are strongest in August. The shifting conditions and corresponding change in species lead to strikingly beautiful multicolored blooms such as this one. The Moderate Resolution Imaging Spectroradiometer (MODIS) on NASA’s Aqua satellite acquired this image. NASA image courtesy Norman Kuring, NASA Ocean Color Group. Caption by Holli Riebeek. Instrument: Aqua - MODIS Click here to see more images from <b><a href="#//earthobservatory.nasa.gov/" rel="nofollow"> NASA Goddard’s Earth Observatory</a></b> <b><a href="http://www.nasa.gov/centers/goddard/home/index.html" rel="nofollow">NASA Goddard Space Flight Center</a></b> is home to the nation's largest organization of combined scientists, engineers and technologists that build spacecraft, instruments and new technology to study the Earth, the sun, our solar system, and the universe. <b>Follow us on <a href="http://twitter.com/NASA_GoddardPix" rel="nofollow">Twitter</a></b> <b>Join us on <a href="http://www.facebook.com/pages/Greenbelt-MD/NASA-Goddard/395013845897?ref=tsd" rel="nofollow">Facebook</a></b>
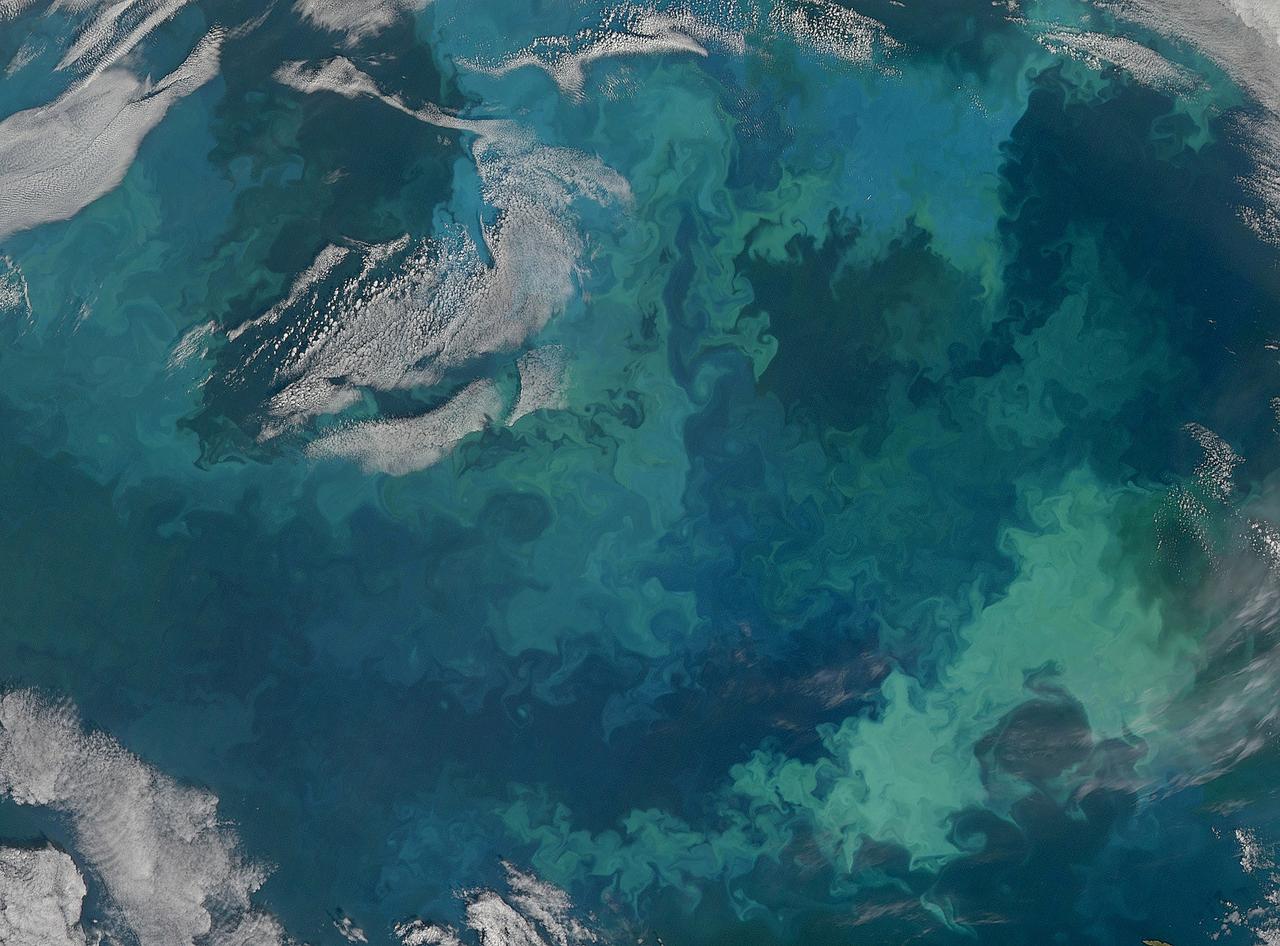
NASA image acquired August 31, 2010 To see the full view of this image go to: <a href="http://www.flickr.com/photos/gsfc/4970549945">www.flickr.com/photos/gsfc/4970549945</a> In this natural-color image from August 31, 2010, the ocean’s canvas swirls with turquoise, teal, navy, and green, the abstract art of the natural world. The colors were painted by a massive phytoplankton bloom made up of millions of tiny, light-reflecting organisms growing in the sunlit surface waters of the Barents Sea. Such blooms peak every August in the Barents Sea. The variations in color are caused by different species and concentrations of phytoplankton. The bright blue colors are probably from coccolithophores, a type of phytoplankton that is coated in a chalky shell that reflects light, turning the ocean a milky turquoise. Coccolithophores dominate the Barents Sea in August. Shades of green are likely from diatoms, another type of phytoplankton. Diatoms usually dominate the Barents Sea earlier in the year, giving way to coccolithophores in the late summer. However, field measurements of previous August blooms have also turned up high concentrations of diatoms. The Barents Sea is a shallow sea sandwiched between the coastline of northern Russia and Scandinavia and the islands of Svalbard, Franz Josef Land, and Novaya Zemlya. Within the shallow basin, currents carrying warm, salty water from the Atlantic collide with currents carrying cold, fresher water from the Arctic. During the winter, strong winds drive the currents and mix the waters. When winter’s sea ice retreats and light returns in the spring, diatoms thrive, typically peaking in a large bloom in late May. The shift between diatoms and coccolithophores occurs as the Barents Sea changes during the summer months. Throughout summer, perpetual light falls on the waters, gradually warming the surface. Eventually, the ocean stratifies into layers, with warm water sitting on top of cooler water. The diatoms deplete most of the nutrients in the surface waters and stop growing. Coccolithophores, on the other hand, do well in warm, nutrient-depleted water with a lot of light. In the Barents Sea, these conditions are strongest in August. The shifting conditions and corresponding change in species lead to strikingly beautiful multicolored blooms such as this one. The Moderate Resolution Imaging Spectroradiometer (MODIS) on NASA’s Aqua satellite acquired this image. NASA image courtesy Norman Kuring, NASA Ocean Color Group. Caption by Holli Riebeek. Instrument: Aqua - MODIS Click here to see more images from <b><a href="#//earthobservatory.nasa.gov/" rel="nofollow"> NASA Goddard’s Earth Observatory</a></b> <b><a href="http://www.nasa.gov/centers/goddard/home/index.html" rel="nofollow">NASA Goddard Space Flight Center</a></b> is home to the nation's largest organization of combined scientists, engineers and technologists that build spacecraft, instruments and new technology to study the Earth, the sun, our solar system, and the universe. <b>Follow us on <a href="http://twitter.com/NASA_GoddardPix" rel="nofollow">Twitter</a></b> <b>Join us on <a href="http://www.facebook.com/pages/Greenbelt-MD/NASA-Goddard/395013845897?ref=tsd" rel="nofollow">Facebook</a></b>

NASA image acquired August 4, 2010 Though many areas in northwest Pakistan were bracing for heavy rain and additional flash flooding on August 4, 2010, the city of Kheshgi, in northwest Pakistan, had clear skies. This image, taken by the Advanced Spaceborne Thermal Emission and Reflection Radiometer (ASTER) on NASA’s Terra satellite reveals a city awash in flood water. Thick with mud, the Kabul River is pale green in this false color image. Clearer water is dark blue. The river flows through its usual channel, but in places, water seeps over the channel and across the landscape. The buildings and roads of Kheshgi are silver. Spots of turquoise blue—shallow, muddy water or water-logged ground—covers several sections of the city. On the south side of the Kabul River, water flows down the hills, washing over neighborhoods. The bare ground in the hills is brown and tan. Plant-covered land, red in this image, is divided into long, narrow rectangles, pointing to agriculture. Geometric shapes under the water near the river are probably submerged fields of crops. Thousands of acres of crops had been lost in floods throughout Pakistan, said the United Nations. Kheshgi is in the Nowshera district in the Khyber Pakhutnkhwa province. As of August 2, Khyber Pakhutnkhwa was the hardest hit province in Pakistan, said the United Nations, and Nowshera was the most impacted district in the province. Nowshera reported 500,000 people displaced with 161 dead, said the Government of Khuber Pakhtunkhwa. The floods affected communities throughout Pakistan. More than 1,100 people had died, 15,000 homes were damaged or destroyed, and at least one million people were in need of emergency assistance throughout Pakistan, said the United Nations on August 2. The floods occurred as unusually heavy monsoon rains fell over Pakistan. NASA image courtesy NASA/GSFC/MITI/ERSDAC/JAROS, and U.S./Japan ASTER Science Team. Caption by Holli Riebeek. Instrument: Terra - ASTER Credit: <b><a href="#//earthobservatory.nasa.gov/" rel="nofollow"> NASA’s Earth Observatory</a></b> To learn more about this image go here: <a href="http://earthobservatory.nasa.gov/NaturalHazards/view.php?id=45050" rel="nofollow">earthobservatory.nasa.gov/NaturalHazards/view.php?id=45050</a> Or here: <a href="http://earthobservatory.nasa.gov/NaturalHazards/view.php?id=45343" rel="nofollow">earthobservatory.nasa.gov/NaturalHazards/view.php?id=45343</a> <b><a href="http://www.nasa.gov/centers/goddard/home/index.html" rel="nofollow">NASA Goddard Space Flight Center</a></b> is home to the nation's largest organization of combined scientists, engineers and technologists that build spacecraft, instruments and new technology to study the Earth, the sun, our solar system, and the universe. <b>Follow us on <a href="http://twitter.com/NASA_GoddardPix" rel="nofollow">Twitter</a></b> <b>Join us on <a href="http://www.facebook.com/pages/Greenbelt-MD/NASA-Goddard/395013845897?ref=tsd" rel="nofollow">Facebook</a></b>
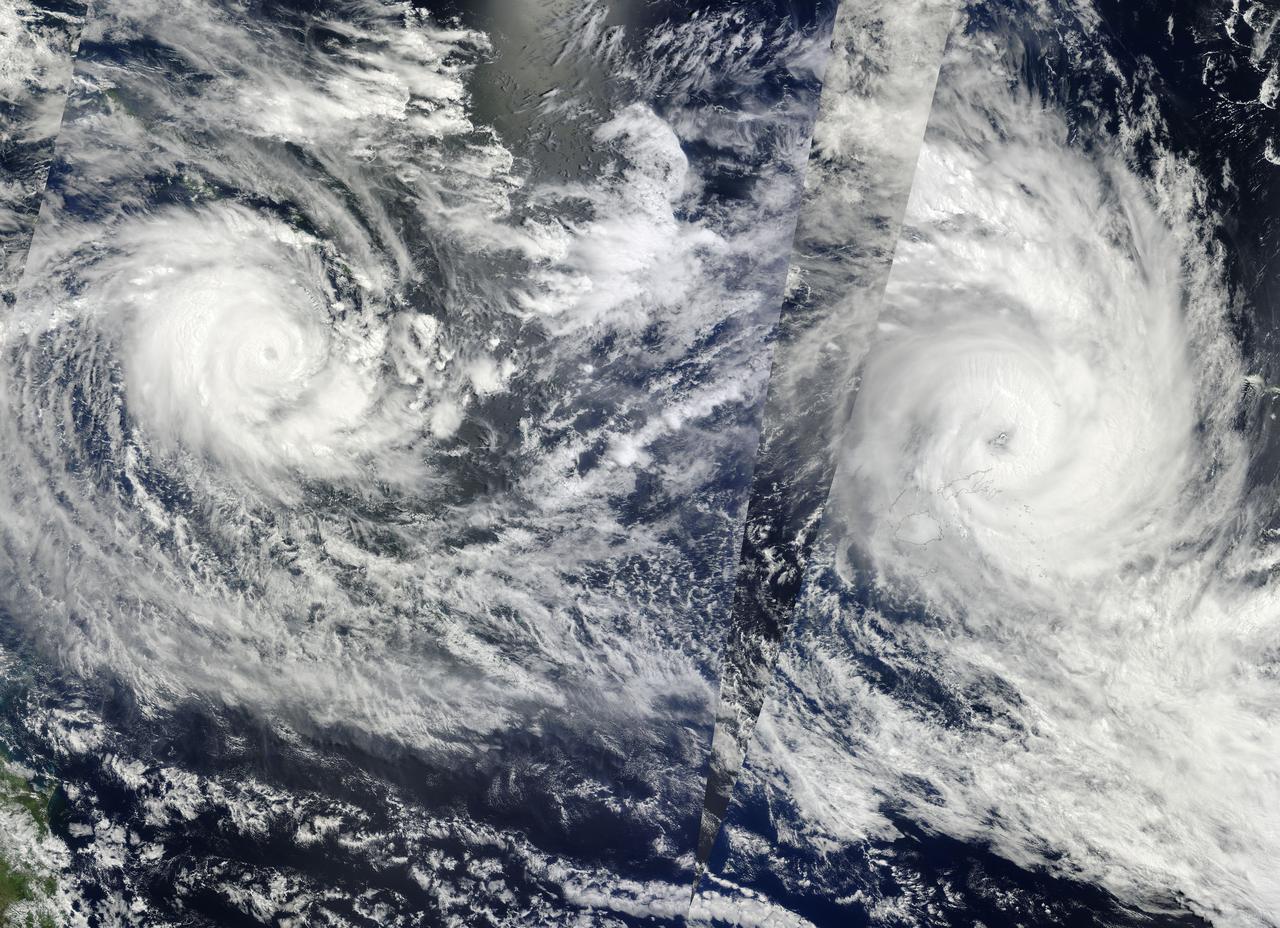
NASA Image acquired March 14 - 15, 2010 Two fierce tropical cyclones raged over the South Pacific Ocean in mid-March 2010, the U.S. Navy’s Joint Typhoon Warning Center (JTWC) reported. Over the Solomon Islands, Tropical Cyclone Ului had maximum sustained winds of 130 knots (240 kilometers per hour, 150 miles per hour) and gusts up to 160 knots (300 km/hr, 180 mph). Over Fiji, Tropical Cyclone Tomas had maximum sustained winds of 115 knots (215 km/hr, 132 mph) and gusts up to 140 knots (260 km/hr, 160 mph). The Moderate Resolution Imaging Spectroradiometer (MODIS) on NASA’s Terra and Aqua satellites captured both storms in multiple passes over the South Pacific on March 15, 2010, local time. The majority of the image is from the morning of March 15 (late March 14, UTC time) as seen by MODIS on the Terra satellite, with the right portion of the image having been acquired earliest. The wedge-shaped area right of center is from Aqua MODIS, and it was taken in the early afternoon of March 15 (local time). Although it packs less powerful winds, according to the JTWC, Tomas stretches across a larger area. It was moving over the northern Fiji islands when Terra MODIS captured the right portion of the image. According to early reports, Tomas forced more than 5,000 people from their homes while the islands sustained damage to crops and buildings. The JTWC reported that Tomas had traveled slowly toward the south and was passing over an area of high sea surface temperatures. (Warm seas provide energy for cyclones.) This storm was expected to intensify before transitioning to an extratropical storm. Ului is more compact and more powerful. A few hours before this image was taken, the storm had been an extremely dangerous Category 5 cyclone with sustained winds of 140 knots (260 km/hr, 160 mph). Ului degraded slightly before dealing the southern Solomon Islands a glancing blow. Initial news reports say that homes were damaged on the islands, but no one was injured. Like Tomas, Ului had been moving westward over an area of high sea surface temperatures. This storm was expected to continue moving westward before turning south and eventually weakening. The high-resolution image provided above is at 500 meters per pixel. The MODIS Rapid Response System provides this image at additional resolutions. NASA image by Jeff Schmaltz, MODIS Rapid Response Team, Goddard Space Flight Center. Caption by Michon Scott and Holli Riebeek. Instrument: Terra - MODIS To learn more about this image go here: <a href="http://earthobservatory.nasa.gov/IOTD/view.php?id=43154." rel="nofollow">earthobservatory.nasa.gov/IOTD/view.php?id=43154.</a>.
The winter of 2013 was among the driest on record for California, setting the stage for an active fire season. By August 26, the Rim Fire had made its way into the record books. At just 15 percent contained, the fire is now the 13th largest in California since records began in 1932. Apart from being large, the fire is also threatening one of the United States’ greatest natural treasures: Yosemite National Park. The Visible Infrared Imaging Radiometer Suite (VIIRS) on the Suomi NPP satellite tracked the growth of the fire between August 23 and August 26 in a series of nighttime images. The VIIRS day-night band is extremely sensitive to low light, making it possible to see the fire front from space. The brightest, most intense parts of the fire glow white, exceeding the brightness of the lights of Reno, Nevada to the north. Pale gray smoke streams north away from the fire throughout the sequence. The perimeter of the fire grows from day to day along different fronts, depending on winds and fire fighting efforts. On August 24, fire fighters focused their efforts on containing the western edge of the fire to prevent it from burning into Tuolumne City and the populated Highway 108 corridor. They also fought the eastern edge of the fire to protect Yosemite National Park. These efforts are evident in the image: Between August 23 and 24, the eastern edge of the fire held steady, and the western edge receded. The fire grew in the southeast. On the morning of August 25 fire managers reported that the fire was growing in the north and east. In the image, the most intense activity is just inside Yosemite National Park. Fire fighters reported that the Rim Fire continued to be extremely active on its eastern front on the morning of August 26, and this activity is visible in the image. By 8:00 a.m., the fire had burned 149,780 acres. The fire forced firefighters in Yosemite National Park to take measures to protect the Merced and Tuolumne Groves of Giant Sequoias, but the National Park Service reported that the trees were not in imminent danger. While parts of the park are closed, webcams show that most of the park has not been impacted. The Rim Fire started on the afternoon of August 17. It has destroyed 23 structures and threatened 4,500 other buildings. Its cause is under investigation. More details: <a href="http://1.usa.gov/18ilEAA" rel="nofollow">1.usa.gov/18ilEAA</a> NASA Earth Observatory image by Jesse Allen and Robert Simmon, using VIIRS Day Night Band data. Caption by Holli Riebeek. Instrument: Suomi NPP - VIIRS <b><a href="http://www.nasa.gov/audience/formedia/features/MP_Photo_Guidelines.html" rel="nofollow">NASA image use policy.</a></b> <b><a href="http://www.nasa.gov/centers/goddard/home/index.html" rel="nofollow">NASA Goddard Space Flight Center</a></b> enables NASA’s mission through four scientific endeavors: Earth Science, Heliophysics, Solar System Exploration, and Astrophysics. Goddard plays a leading role in NASA’s accomplishments by contributing compelling scientific knowledge to advance the Agency’s mission. <b>Follow us on <a href="http://twitter.com/NASA_GoddardPix" rel="nofollow">Twitter</a></b> <b>Like us on <a href="http://www.facebook.com/pages/Greenbelt-MD/NASA-Goddard/395013845897?ref=tsd" rel="nofollow">Facebook</a></b> <b>Find us on <a href="http://instagram.com/nasagoddard?vm=grid" rel="nofollow">Instagram</a></b>
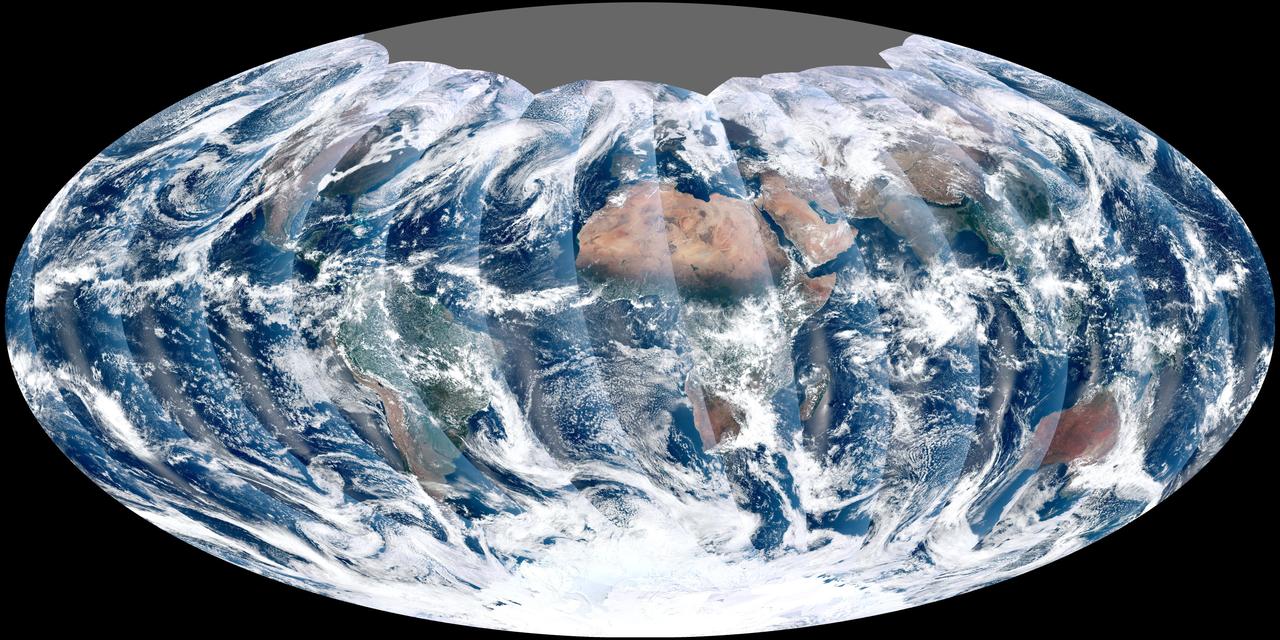
NASA acquired November 24, 2011 From its vantage 824 kilometers (512 miles) above Earth, the Visible Infrared Imager Radiometer Suite (VIIRS) on the NPOESS Preparatory Project (NPP) satellite gets a complete view of our planet every day. This image from November 24, 2011, is the first complete global image from VIIRS. The NPP satellite launched on October 28, 2011, and VIIRS acquired its first measurements on November 21. To date, the images are preliminary, used to gauge the health of the sensor as engineers continue to power it up for full operation. Rising from the south and setting in the north on the daylight side of Earth, VIIRS images the surface in long wedges measuring 3,000 kilometers (1,900 miles) across. The swaths from each successive orbit overlap one another, so that at the end of the day, the sensor has a complete view of the globe. The Arctic is missing because it is too dark to view in visible light during the winter. The NPP satellite was placed in a Sun-synchronous orbit, a unique path that takes the satellite over the equator at the same local (ground) time in every orbit. So, when NPP flies over Kenya, it is about 1:30 p.m. on the ground. When NPP reaches Gabon—about 3,000 kilometers to the west—on the next orbit, it is close to 1:30 p.m. on the ground. This orbit allows the satellite to maintain the same angle between the Earth and the Sun so that all images have similar lighting. The consistent lighting is evident in the daily global image. Stripes of sunlight (sunglint) reflect off the ocean in the same place on the left side of every swath. The consistent angle is important because it allows scientists to compare images from year to year without worrying about extreme changes in shadows and lighting. The image also shows a band of haze along the right side of every orbit swath. When light travels through the atmosphere, it bounces off particles or scatters, making the atmosphere look hazy. The scattering effect is most pronounced along the edge of the swath, where the sensor is looking at an angle through more of the atmosphere. Scientists can correct for this scattering effect, but need measurements from a range of wavelengths to do so. The degree to which light scatters depends partly on the wavelength of the light. Blue light scatters more than red light, for example, which is why the sky is blue. VIIRS measures 22 different wavelengths of light, but not all of the sensor’s detectors are operating at peak performance yet. Those measuring thermal infrared light are not yet cold enough to collect reliable measurements. Once VIIRS begins full operations, it will produce a range of measurements from ocean temperature to clouds to the locations of fires. These measurements will help extend the record from earlier sensors like the Moderate Resolution Imaging Spectroradiometer (MODIS). VIIRS is very similar to MODIS, but flies at a higher altitude to measure the whole planet without gaps. (MODIS daily measurements have gaps at the equator. See the MODIS image from November 24.) VIIRS also sees the Earth in less detail, 375 meters per pixel, compared to 250 meters per pixel for MODIS. Image by NASA’s NPP Land Product Evaluation and Testing Element. Caption by Holli Riebeek. Credit: <b><a href="http://www.earthobservatory.nasa.gov/" rel="nofollow"> NASA Earth Observatory</a></b> <b><a href="http://www.nasa.gov/audience/formedia/features/MP_Photo_Guidelines.html" rel="nofollow">NASA image use policy.</a></b> <b><a href="http://www.nasa.gov/centers/goddard/home/index.html" rel="nofollow">NASA Goddard Space Flight Center</a></b> enables NASA’s mission through four scientific endeavors: Earth Science, Heliophysics, Solar System Exploration, and Astrophysics. Goddard plays a leading role in NASA’s accomplishments by contributing compelling scientific knowledge to advance the Agency’s mission. <b>Follow us on <a href="http://twitter.com/NASA_GoddardPix" rel="nofollow">Twitter</a></b> <b>Like us on <a href="http://www.facebook.com/pages/Greenbelt-MD/NASA-Goddard/395013845897?ref=tsd" rel="nofollow">Facebook</a></b> <b>Find us on <a href="http://instagrid.me/nasagoddard/?vm=grid" rel="nofollow">Instagram</a></b>