
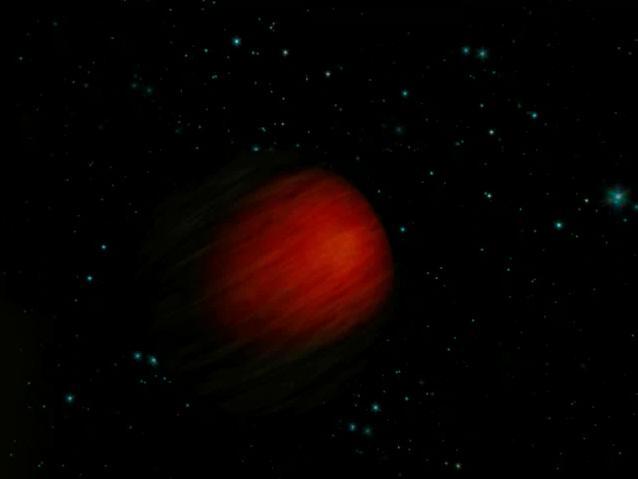
Hot Jupiters are exoplanets that orbit their stars so tightly that their temperatures are extremely high, reaching over 2,400 degrees Fahrenheit (1600 Kelvin). They are also tidally locked, so one side of the planet always faces the sun and the other is in permanent darkness. Research suggests that the "dayside" is largely free of clouds, while the "nightside" is heavily clouded. This illustration represents how hot Jupiters of different temperatures and different cloud compositions might appear to a person flying over the dayside of these planets on a spaceship, based on computer modeling. Cooler planets are entirely cloudy, whereas hotter planets have morning clouds only. Clouds of different composition have different colors, whereas the clear sky is bluer than on Earth. For the hottest planets, the atmosphere is hot enough on the evening side to glow like a charcoal. Figure 1 shows an approximation of what various hot Jupiters might look like based on a combination of computer modeling and data from NASA's Kepler Space Telescope. From left to right it shows: sodium sulfide clouds (1000 to 1200 Kelvin), manganese sulfide clouds (1200 to 1600 Kelvin), magnesium silicate clouds (1600 to 1800 Kelvin), magnesium silicate and aluminum oxide clouds (1800 Kelvin) and clouds composed of magnesium silicate, aluminum oxide, iron and calcium titanate (1900 to 2200 Kelvin). http://photojournal.jpl.nasa.gov/catalog/PIA21074

This composite image shows a hot spot in Jupiter's atmosphere. In the image on the left, taken on Sept. 16, 2020, by the Gemini North telescope on the island of Hawaii, the hot spot appears bright in the infrared at a wavelength of 5 microns. In the inset image on the right, taken by Juno's JunoCam visible-light imager, also on Sept. 16 during Juno's 29th perijove pass, the hot spot appears dark. Scientists have known of Jupiter's hot spots for a long time. On Dec. 7, 1995, the Galileo probe likely descended into a similar hot spot. To the naked eye, Jupiter's hot spots appear as dark, cloud-free areas in Jupiter's equatorial belt, but at infrared wavelengths, which are invisible to the human eye, they are extremely bright, revealing the warm, deep atmosphere below the clouds. High-resolution images of hot spots such as these are key both to understanding the role of storms and waves in Jupiter's atmosphere. Citizen scientist Brian Swift processed the images to enhance the color and contrast, with further processing by Tom Momary to map the JunoCam image to the Gemini data. The international Gemini North telescope is a 26.6-foot-diameter (8.1-meter-diameter) optical/infrared telescope optimized for infrared observations, and is managed for the NSF by the Association of Universities for Research in Astronomy (AURA). https://photojournal.jpl.nasa.gov/catalog/PIA24299

This composite image shows a hot spot in Jupiter's atmosphere. In the image on the left, taken on Nov. 8, 2020, by NASA's Infrared Telescope Facility (IRTF) on the island of Hawaii, the hot spot appears bright in the infrared. The inset image on the right, taken by the JunoCam visible-light imager (also on Nov. 8, during Juno's 30th perijove pass), the hot spot appears dark and is flanked by high light-colored clouds to the south and a bright white storm to the west. Jupiter's hot spots have been known for a long time. On Dec. 7, 1995, the Galileo probe likely descended into a similar hot spot. To the naked eye, Jupiter's hot spots appear as dark, cloud-free spots in Jupiter's equatorial belt, but at infrared wavelengths, they are extremely bright, revealing the warm, deep atmosphere below the clouds. High-resolution images of hot spots such as these are key to understanding the role of storms and waves in Jupiter's atmosphere and to solving the mystery of Jupiter's elusive water. Citizen scientist Kevin Gill processed the image to enhance the color and contrast, with further processing by Tom Momary to map the JunoCam image to the IRTF data. The NASA IRTF is a 10.5-foot-diameter (3.2-meter-diameter) telescope optimized for infrared observations and is managed for NASA by the Institute for Astronomy at the University of Hawai'i. https://photojournal.jpl.nasa.gov/catalog/PIA24300

Hot Jupiters, exoplanets around the same size as Jupiter that orbit very closely to their stars, often have cloud or haze layers in their atmospheres. This may prevent space telescopes from detecting atmospheric water that lies beneath the clouds, according to a study in the Astrophysical Journal. As much as half of the water in the atmospheres of these exoplanets may be blocked by these clouds or hazes, research suggests. The study, led by researchers at NASA's Jet Propulsion Laboratory, Pasadena, California, examined hot Jupiters that had been observed with the Hubble Space Telescope. http://photojournal.jpl.nasa.gov/catalog/PIA20687
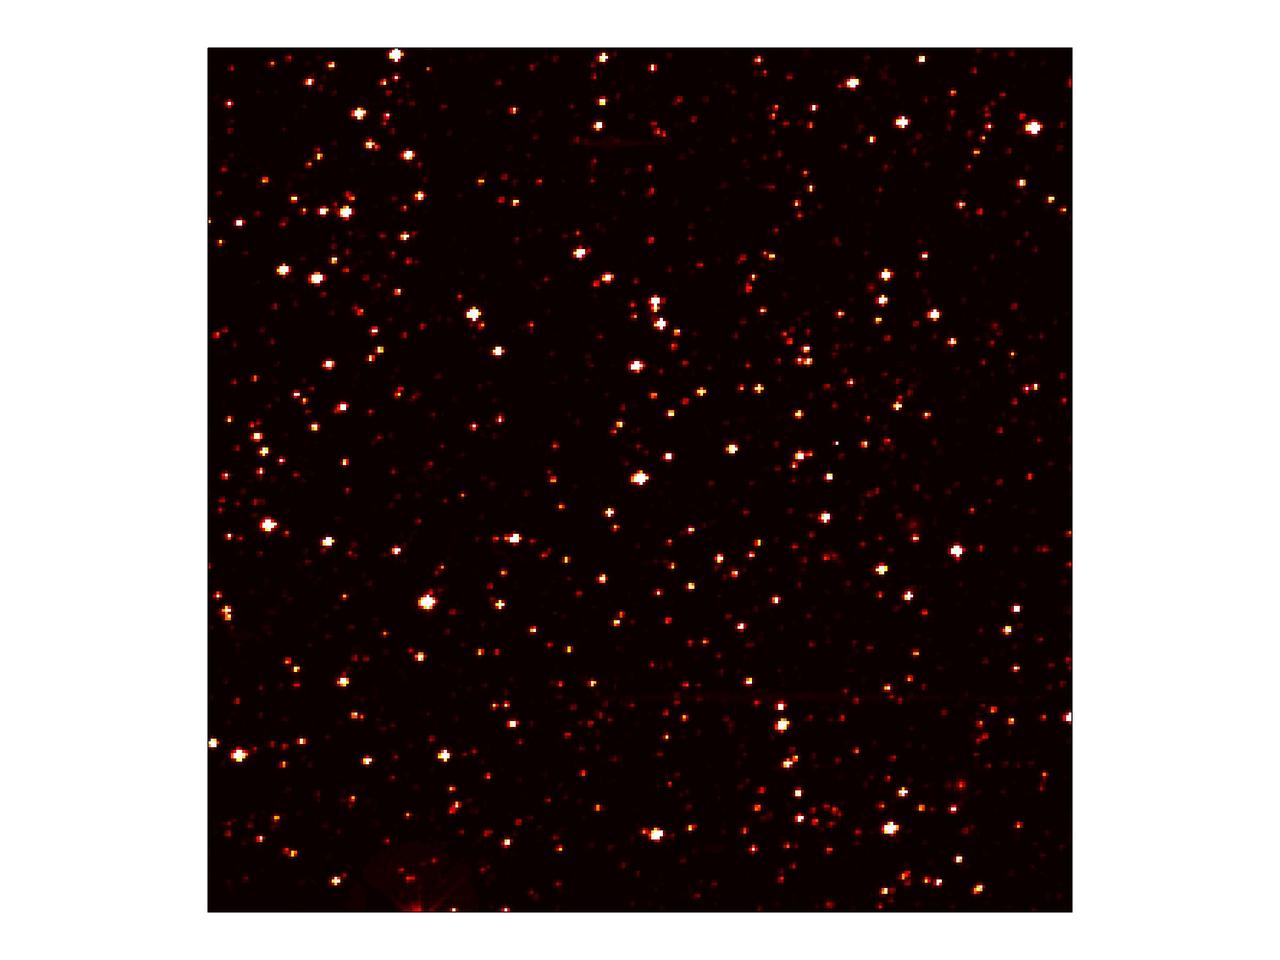
This image zooms into a small portion of NASA Kepler full field of view -- an expansive, 100-square-degree patch of sky in our Milky Way galaxy. At the center of the field is a star with a known "hot Jupiter" planet, named "TrES-2," zipping closely around it every 2.5 days. Kepler will observe TrES-2 and other known planets as a test to demonstrate that it is working properly, and to obtain new information about those planets. The area pictured is one-thousandth of Kepler's full field of view, and shows hundreds of stars at the very edge of the constellation Cygnus. The image has been color-coded so that brighter stars appear white, and fainter stars, red. It is a 60-second exposure, taken on April 8, 2009, one day after the spacecraft's dust cover was jettisoned. Kepler was designed to hunt for planets like Earth. The mission will spend the next three-and-a-half years staring at the same stars, looking for periodic dips in brightness. Such dips occur when planets cross in front of their stars from our point of view in the galaxy, partially blocking the starlight. To achieve the level of precision needed to spot planets as small as Earth, Kepler's images are intentionally blurred slightly. This minimizes the number of saturated stars. Saturation, or "blooming," occurs when the brightest stars overload the individual pixels in the detectors, causing the signal to spill out into nearby pixels. http://photojournal.jpl.nasa.gov/catalog/PIA11985
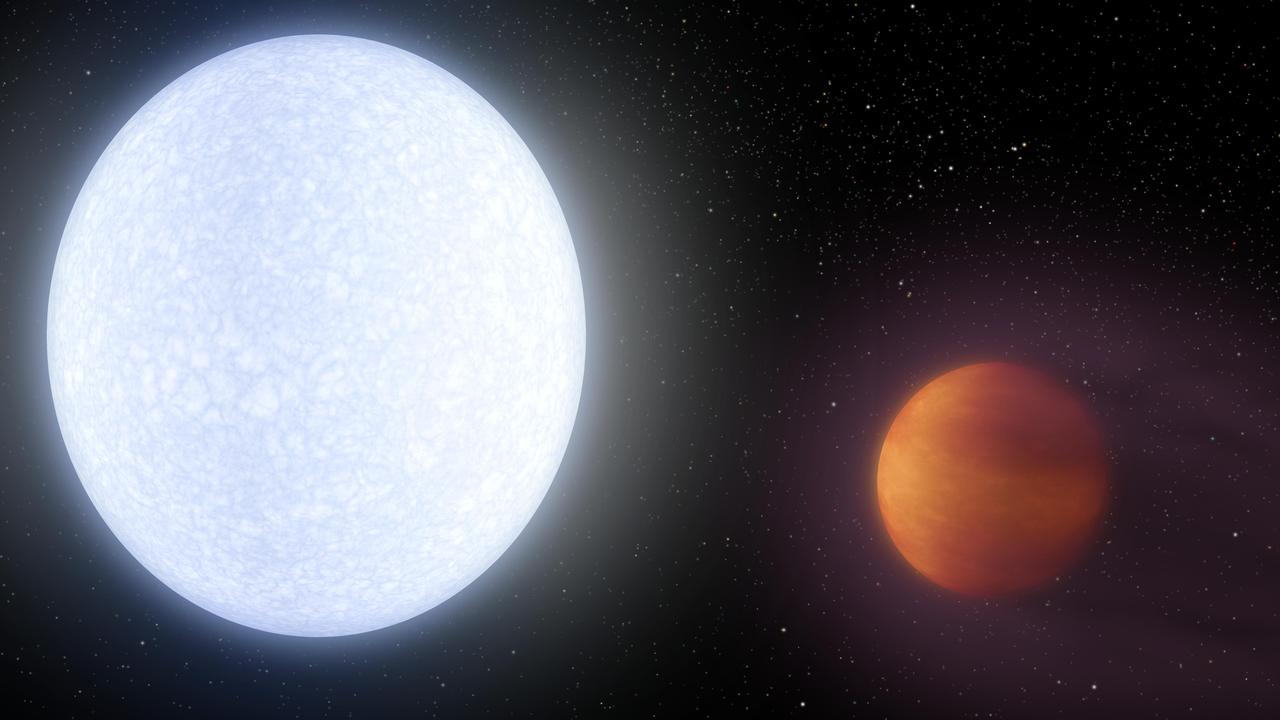
This artist's concept shows planet KELT-9b orbiting its host star, KELT-9. It is the hottest gas giant planet discovered so far. With a dayside temperature of more than 7,800 degrees Fahrenheit (4,600 Kelvin), KELT-9b is a planet that is hotter than most stars. But its star, called KELT-9, is even hotter -- a blue A-type star that is likely unraveling the planet through evaporation. KELT-9b is a gas giant 2.8 times more massive than Jupiter, but only half as dense. Scientists would expect the planet to have a smaller radius, but the extreme radiation from its host star has caused the planet's atmosphere to puff up like a balloon. The planet is also unusual in that it orbits perpendicular to the spin axis of the star. That would be analogous to the planet orbiting perpendicular to the plane of our solar system. One "year" on this planet is less than two days long. The KELT-9 star is only 300 million years old, which is young in star time. It is more than twice as large, and nearly twice as hot, as our sun. Given that the planet's atmosphere is constantly blasted with high levels of ultraviolet radiation, the planet may even be shedding a tail of evaporated planetary material like a comet. An animation is available at https://photojournal.jpl.nasa.gov/catalog/PIA21472

In this image, an artistic version of a hot Jupiter inspired by computer simulations has been inserted into a photo showing a Spitzer researcher, Heather Knutson, in a laboratory.

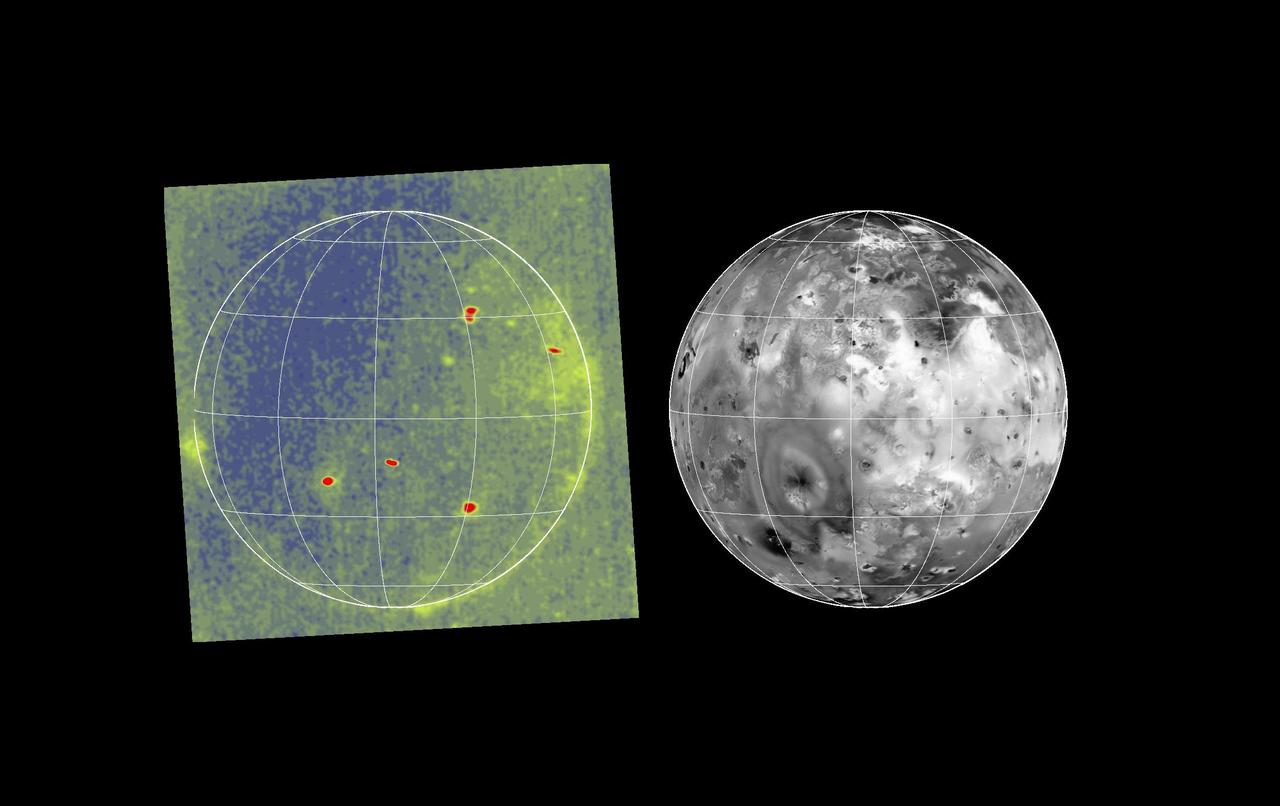
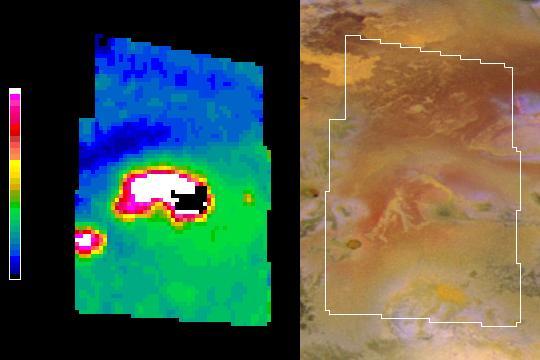
Volcanic hot spots are seen in this color temperature map of the Prometheus volcano on Jupiter moon Io created with data obtained by NASA Galileo and Voyager spacecraft.

New and older lava flows clustered in the Tvashtar region of Jupiter moon Io appeared as hot spots in a temperature map from NASA Galileo spacecraft in 1999.
Volcanic hot spots and auroral emissions glow on the darkside of Jupiter moon Io in the image at left. The image was taken by the camera onboard NASA Galileo spacecraft on 29 June, 1996 UT while Io was in Jupiter shadow. http://photojournal.jpl.nasa.gov/catalog/PIA00274
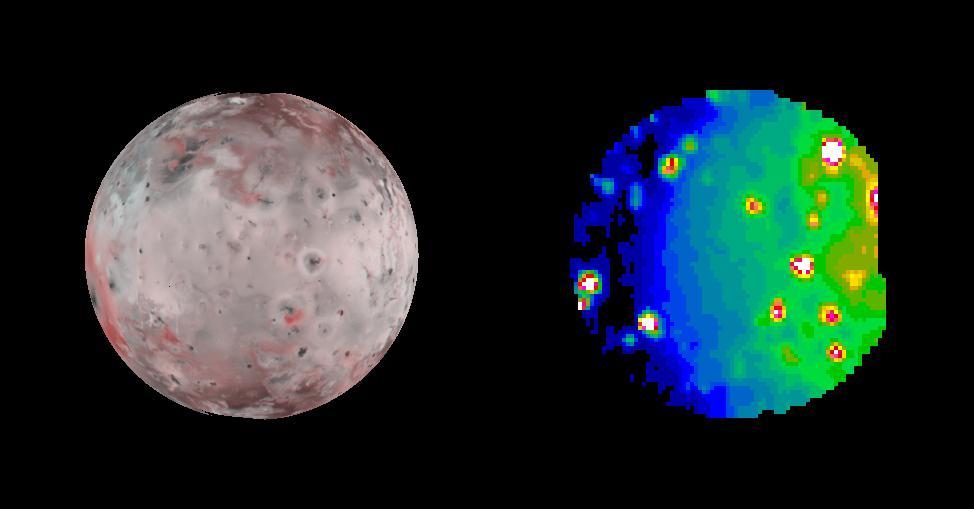
Hot eruption sites scattered across Jupiter moon Io stand out dramatically in an infrared image taken Oct. 13, 2001, by NASA Galileo spacecraft as it sped past this most volcanically active of all known worlds.

This diagram illustrates how astronomers using NASA Spitzer Space Telescope can capture the elusive spectra of hot-Jupiter planets. Spectra are an object light spread apart into its basic components, or wavelengths.
The Prometheus region of Jupiter moon Io was imaged by NASA Galileo spacecraft in 1999. The maps made from spectrometer data show the interplay between hot silicates on the surface and sulfur dioxide frost.
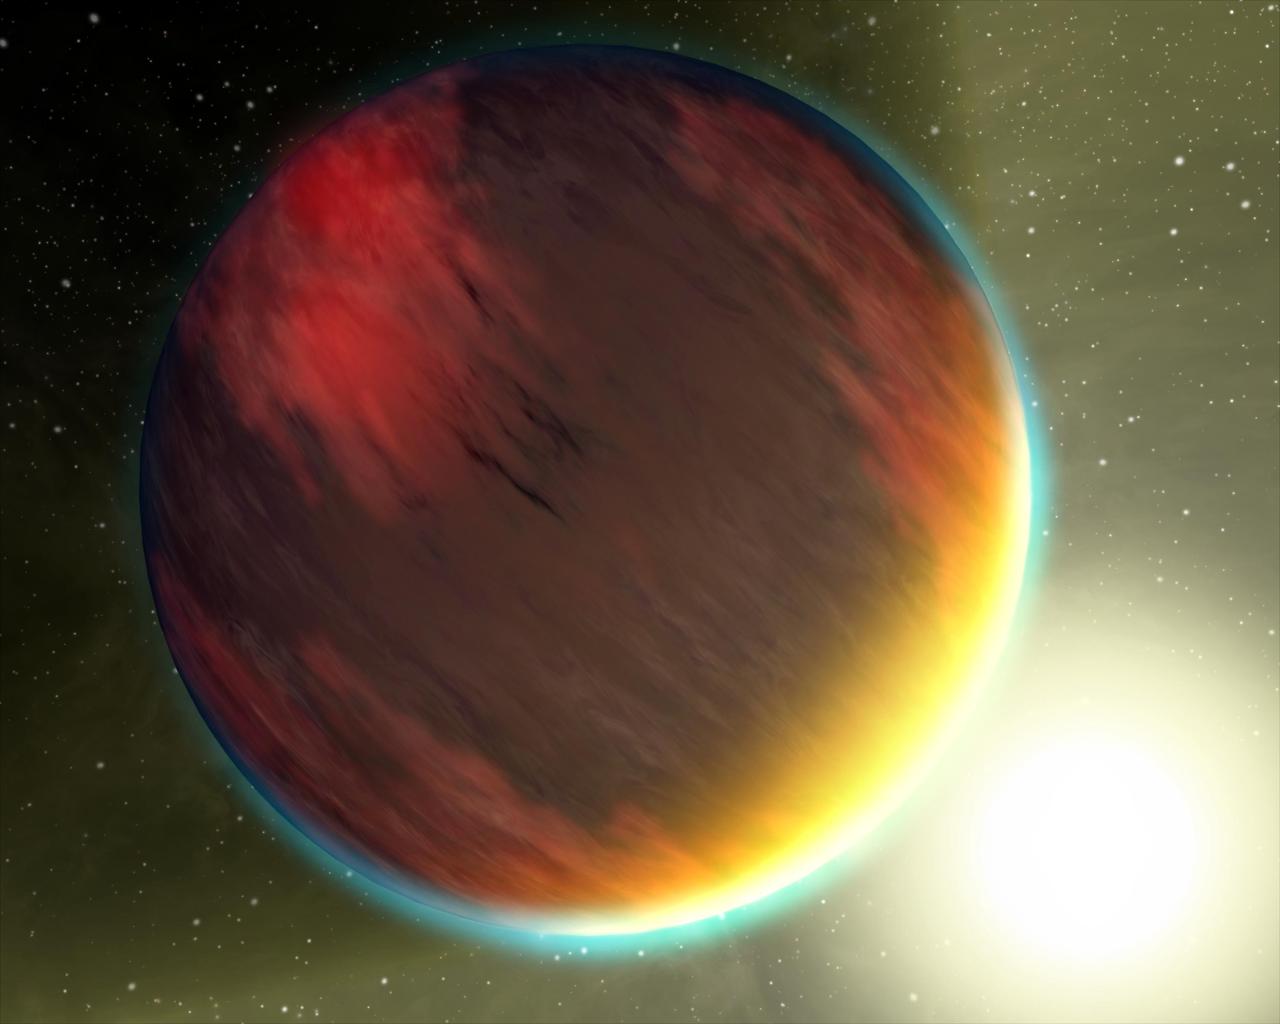
This artist concept, based on spectral observations from NASA Hubble Space Telescope and Spitzer Space Telescope, shows a cloudy Jupiter-like planet that orbits very close to its fiery hot star.

During the G7 encounter, NASA Galileo spacecraft observed the shadow of Europa on the clouds of Jupiter during Galileo fourth orbit. The bright spot in the clouds is an atmospheric hot spot.

This frame from an artist animation shows the clockwork-like orbits of a triple-star system called HD 188753, which was discovered to harbor a gas giant, or hot Jupiter, planet.
The dark hot spot in this false-color image from NASA Cassini spacecraft is a window deep into Jupiter atmosphere. All around it are layers of higher clouds, with colors indicating which layer of the atmosphere the clouds are in.
In August 2001, NASA Galileo spacecraft has returned imagery of a hot spot on Jupiter moon Io that was the source of a towering plume indicating a sulfur-dioxide concentration that may have been fallout from the plume.
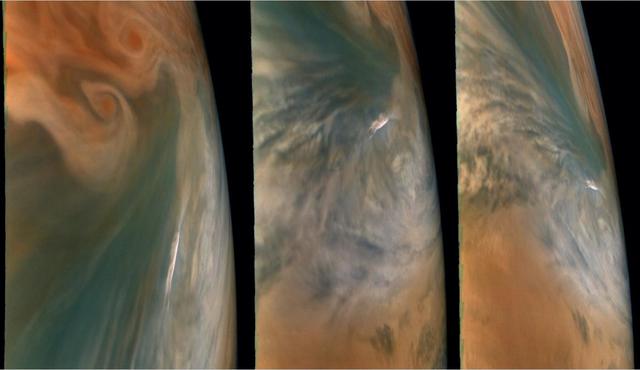
These images from NASA's Juno mission show three different views of a Jupiter "hot spot" — a break in Jupiter's cloud deck that provides a glimpse into Jupiter's deep atmosphere. Hot spots are flanked by clouds and active storms, and fueled by high-altitude electrical discharges recently discovered by Juno known as "shallow lightning." The pictures were taken by the JunoCam imager during its 29th close flyby of the giant planet on Sept. 16, 2020. Not all of Jupiter's clouds are the same. The planet is composed mostly of hydrogen and helium, and the vivid colors that appear in thick bands across Jupiter are likely plumes of sulfur compounds and phosphorus-containing gases rising from the planet's warmer interior. The small, bright cloud feature seen here is likely made of ammonia ice and water ice rising to a higher altitude than the surrounding features. The original JunoCam images used to produce these views were taken from altitudes between about 2,700 and 4,500 miles (4,300 and 7,200 kilometers) above Jupiter's cloud tops. Citizen scientist Brian Swift processed the images to enhance the color and contrast. https://photojournal.jpl.nasa.gov/catalog/PIA24298
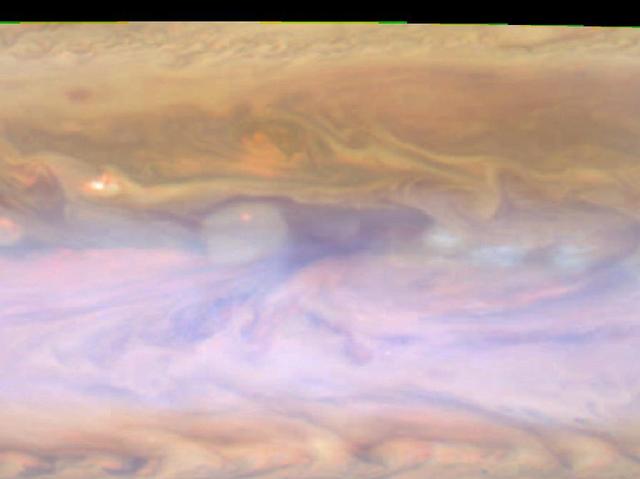
In this movie clip (of which the release image is a still frame), created from images taken by NASA's Cassini spacecraft, the blue region in the center is a relatively cloud-free area where thermal radiation from warmer, deeper levels emerges. NASA's Galileo probe in 1995 entered Jupiter's atmosphere in a similar area. http://photojournal.jpl.nasa.gov/catalog/PIA02875
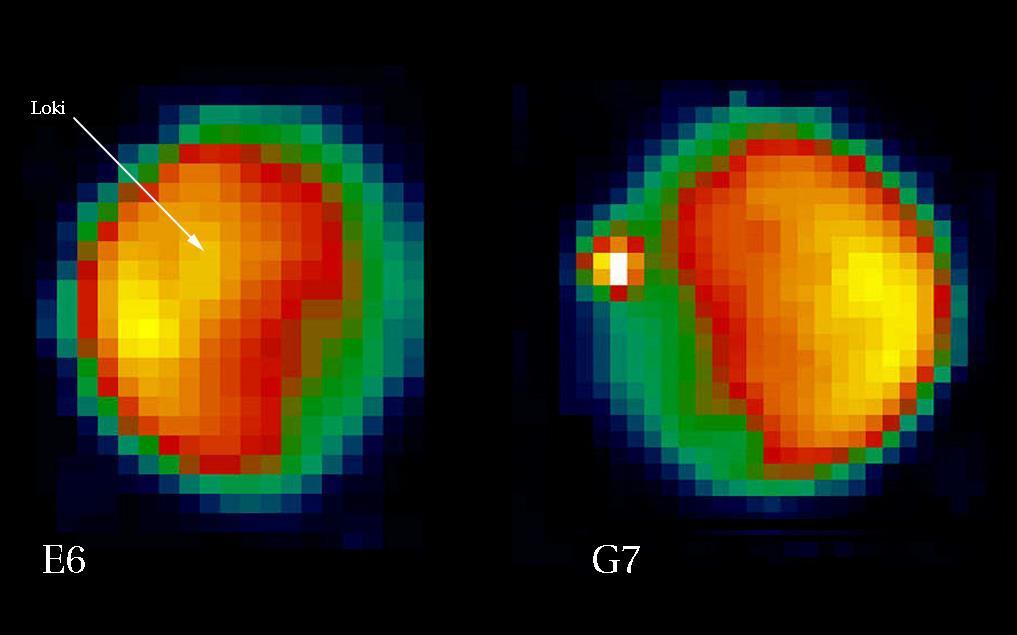
On Feb. 21, 1997, the Galileo spacecraft observed Io in daylight from a range of approximately 703,000 km 440,000 miles. Loki Patera, historically the most active and persistent hot spot on Io, is located on the hemisphere of Io always facing Jupiter.
This artist concept illustrates the hottest planet yet observed in the universe. The scorching ball of gas, a hot Jupiter called HD 149026b, is about 3 times hotter than the rocky surface of Venus, the hottest planet in our solar system.
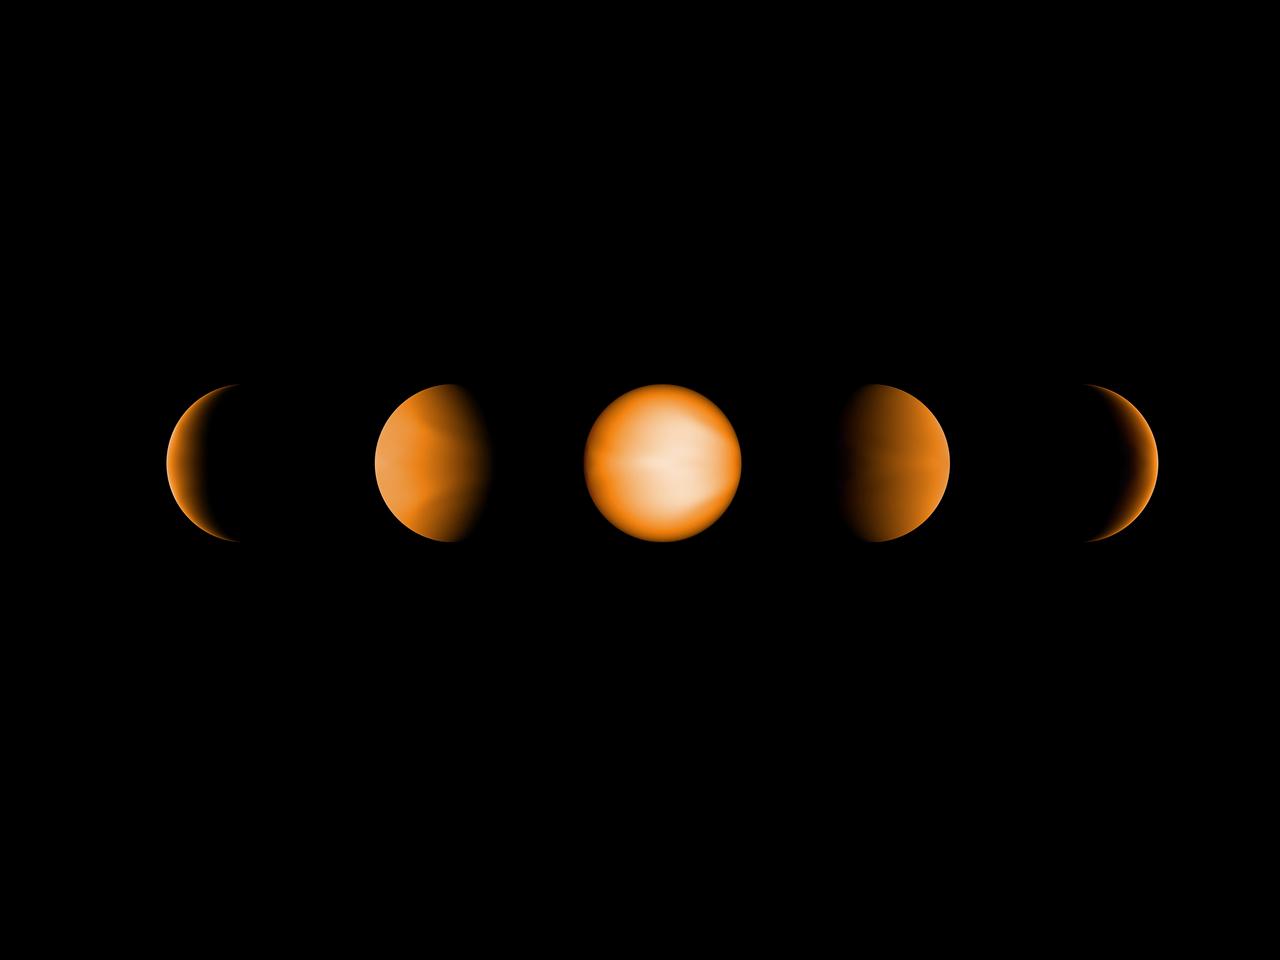
These simulated views of the ultrahot Jupiter WASP-121b show what the planet might look like to the human eye from five different vantage points, illuminated to different degrees by its parent star. The images were created using a computer simulation being used to help scientists understand the atmospheres of these ultra-hot planets. Ultrahot Jupiters reflect almost no light, rather like charcoal. However, the daysides of ultrahot Jupiters have temperatures of between 3600°F and 5400°F (2000°C and 3000°C), so the planets produce their own glow, like a hot ember. The orange color in this simulated image is thus from the planet's own heat. The computer model was based on observations of WASP-121b conducted using NASA's Spitzer and Hubble space telescopes. https://photojournal.jpl.nasa.gov/catalog/PIA22565
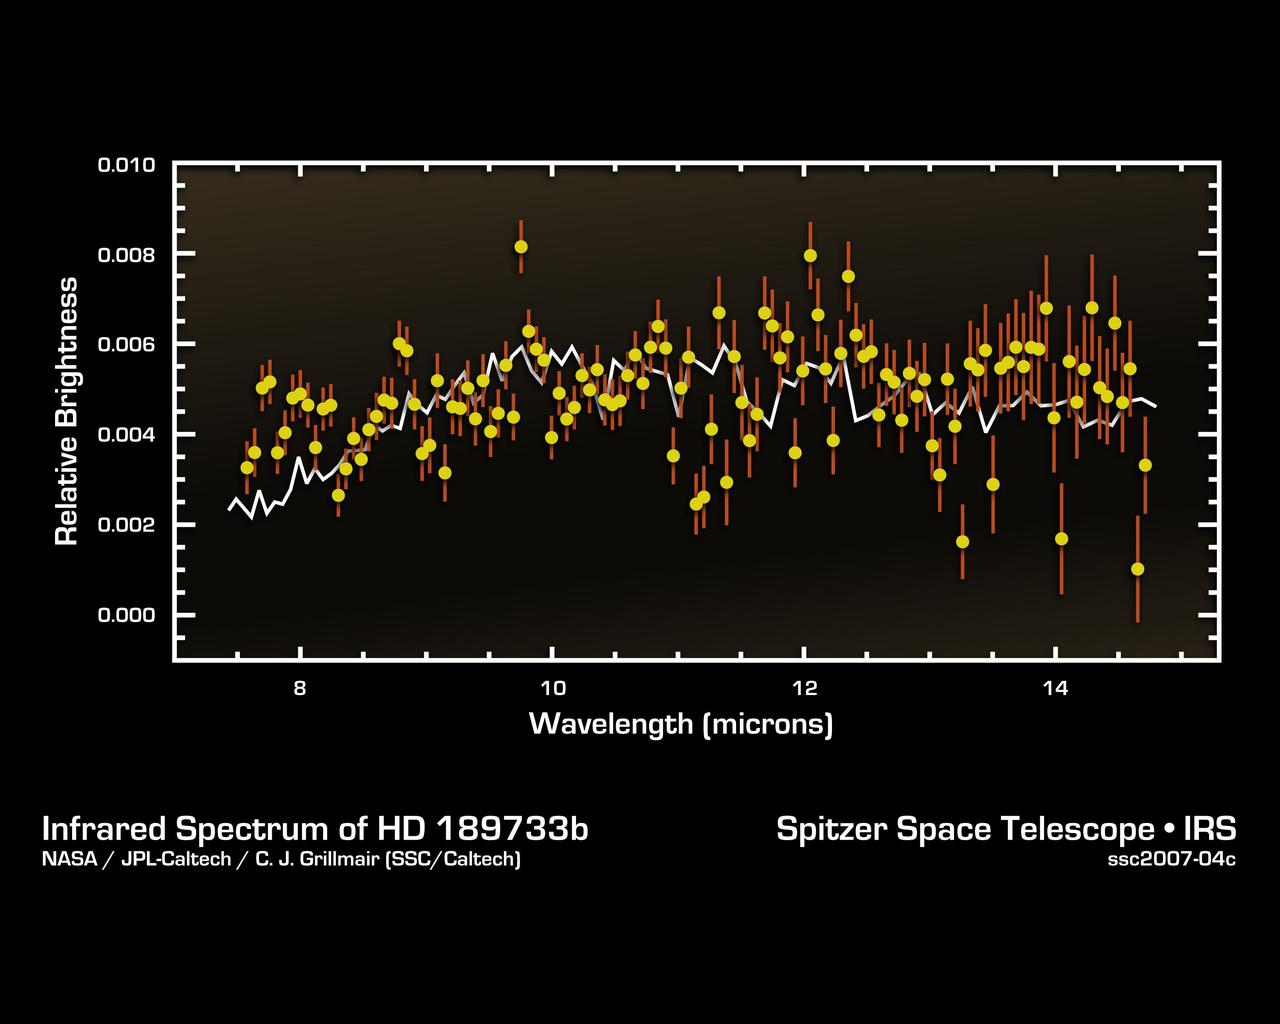
This infrared data from NASA's Spitzer Space Telescope -- called a spectrum -- tells astronomers that a distant gas planet, a so-called "hot Jupiter" called HD 189733b, might be smothered with high clouds. It is one of the first spectra of an alien world. A spectrum is created when an instrument called a spectrograph cracks light from an object open into a rainbow of different wavelengths. Patterns or ripples within the spectrum indicate the presence, or absence, of molecules making up the object. Astronomers using Spitzer's spectrograph were able to obtain infrared spectra for two so-called "transiting" hot-Jupiter planets using the "secondary eclipse" technique. In this method, the spectrograph first collects the combined infrared light from the planet plus its star, then, as the planet is eclipsed by the star, the infrared light of just the star. Subtracting the latter from the former reveals the planet's own rainbow of infrared colors. Astronomers were perplexed when they first saw the infrared spectrum above. It doesn't look anything like what theorists had predicted. Theorists thought the spectra of hot, Jupiter-like planets like this one would be filled with the signatures of molecules in the planets' atmospheres. But the spectrum doesn't show any molecules, and is instead what astronomers call "flat." For example, theorists thought there'd be a strong signature of water in the form of a big drop in the wavelength range between 7 and 10 microns. The fact that water is not detected may indicate that it is hidden underneath a thick blanket of high, dry clouds. The average brightness of the spectrum is also a bit lower than theoretical predictions, suggesting that very high winds are rapidly moving the terrific heat of the noonday sun from the day side of HD 189733b to the night side. This spectrum was produced by Dr. Carl Grillmair of NASA's Spitzer Science Center at the California Institute of Technology in Pasadena, Calif., and his colleagues. The data were taken by Spitzer's infrared spectrograph on November 22, 2006. http://photojournal.jpl.nasa.gov/catalog/PIA09199
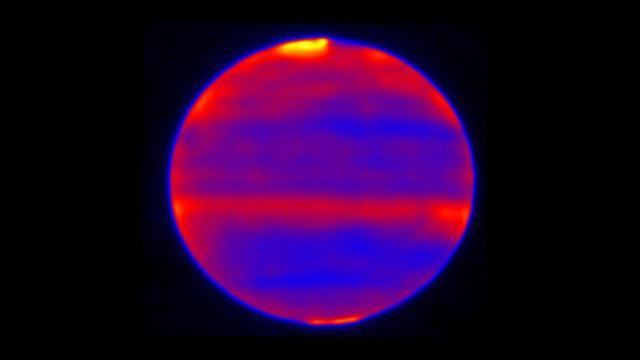
Sensitive to Jupiter's stratospheric temperatures, these infrared images were recorded by the Cooled Mid-Infrared Camera and Spectrograph (COMICS) at the Subaru Telescope on the summit of Mauna Kea, Hawaii. Scientists used red, blue and yellow to infuse this infrared image; regions of the atmosphere that are more yellow and red indicate the hotter areas. This highlights the auroral heating that occurs at Jupiter's poles, where energy from the solar wind and magnetosphere are deposited. This image was captured on Jan. 12, 2017. https://photojournal.jpl.nasa.gov/catalog/PIA22774
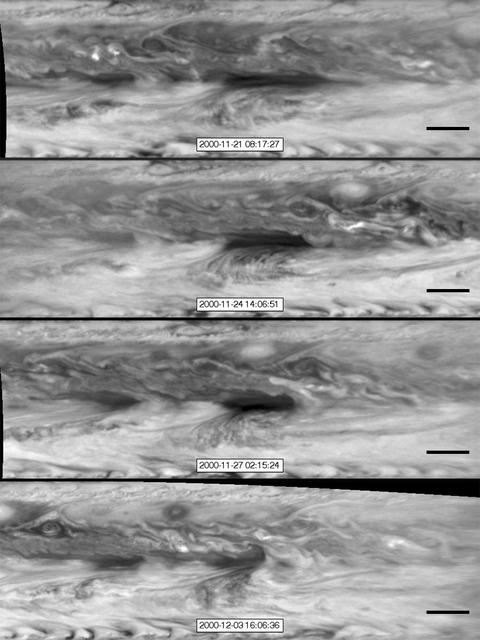
In this series of images from NASA Cassini spacecraft, a dark, rectangular hot spot interacts with a line of vortices that approaches from on the upper-right side. The interaction distorts the shape of the hot spot, leaving it diminished.
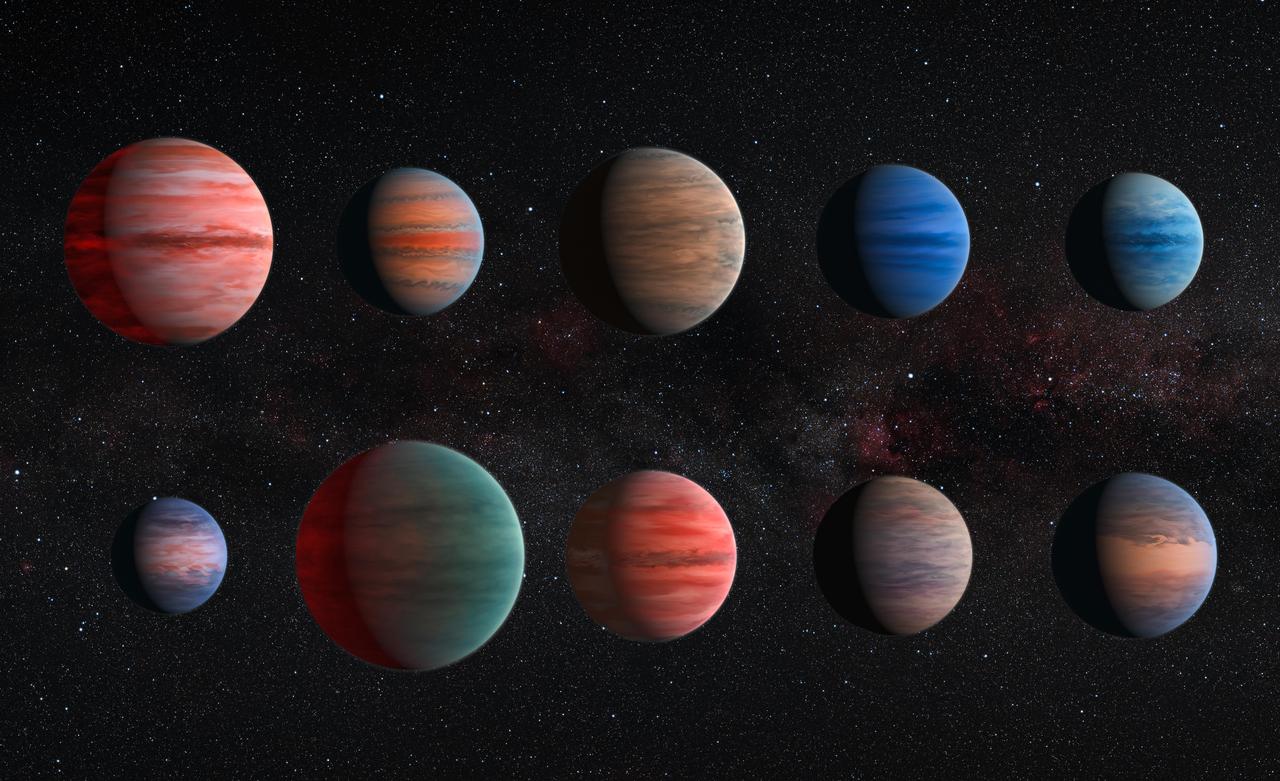
This image shows an artist's impression of the 10 hot Jupiter exoplanets studied using the Hubble and Spitzer space telescopes. From top left to lower left, these planets are WASP-12b, WASP-6b, WASP-31b, WASP-39b, HD 189733b, HAT-P-12b, WASP-17b, WASP-19b, HAT-P-1b and HD 209458b. The colors of the planets are for illustration purposes only. There is little scientific data on color with the exception of HD 189733b, which became known as the "blue planet." The planets are also depicted with a variety of different cloud properties. The wind patterns shown on these 10 planets, which resemble the visible structures on Jupiter, are based on theoretical models. The illustrations are to scale with each other. HAT-P-12b, the smallest of these planets, is approximately the size of Jupiter, while WASP-17b, the largest one in the sample, is almost twice the size. The hottest planets within the sample are portrayed with a glowing night side. This effect is strongest on WASP-12b, the hottest exoplanet in the sample, but also visible on WASP-19b and WASP-17b. It is also known that several of the planets exhibit strong Rayleigh scattering. This effect causes the blue hue of the daytime sky and the reddening of the sun at sunset on Earth. It is also visible as a blue edge on the planets WASP-6b, HD 189733b, HAT-P-12b and HD 209458b. http://photojournal.jpl.nasa.gov/catalog/PIA20056
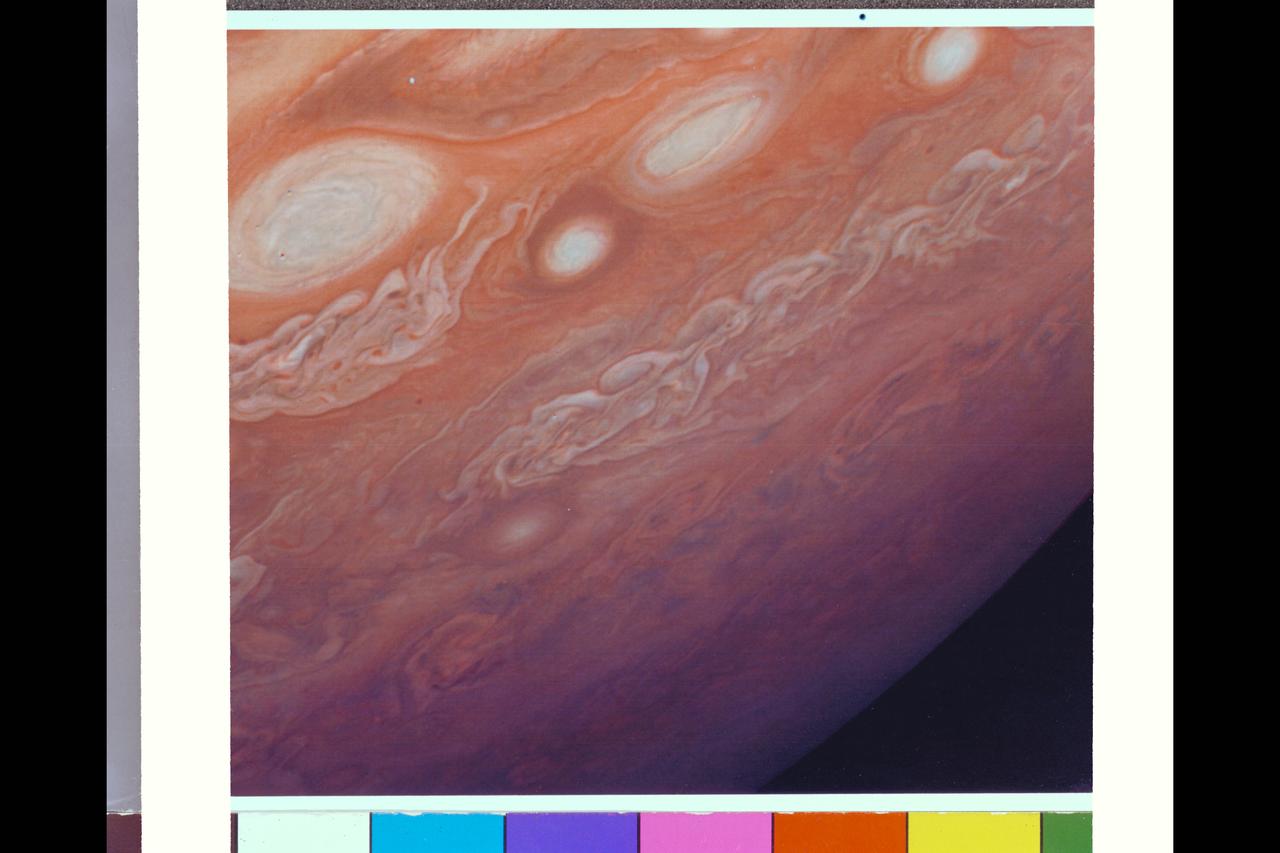
Range : 4.3 million km. ( 2.7 million miles ) This photograph taken from Voyager I, shows the area east of the Great Red Spot. The dark halo surrounding the bright spot, just to the right of the bright oval, is said by scientists to be, almost certainly, a five micron hot spot. This is a region of the atmosphere warmer than those around it. The dark halo may represent an area in which we are looking deeper into Jupiter's Atmosphere, although not yet completely understood.
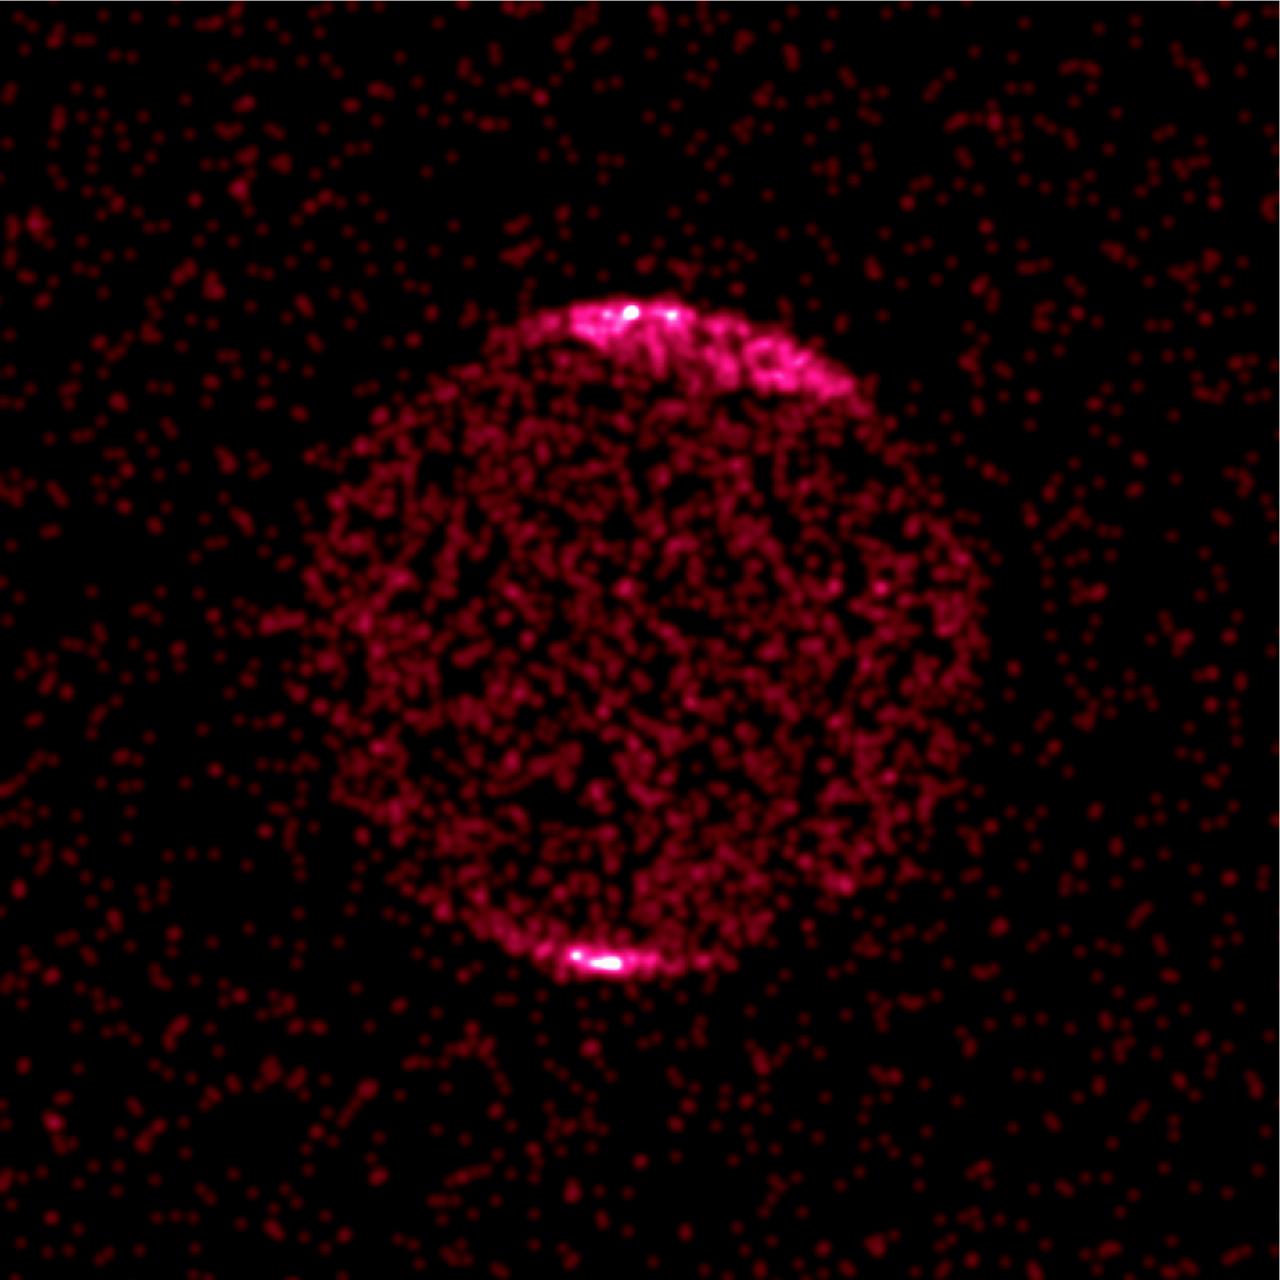
This Chandra image of Jupiter shows concentrations of aurora x-rays near the north and south poles due to a single `hot spot' that pulsates with a period of 45 minutes, similar to high-latitude radio pulsation previously detected by NASA's Galileo and Cassini spacecraft. Previous x-ray detections of Jupiter have been made with other x-ray telescopes, but did not reveal that the sources of the x-rays, energetic oxygen and sulfur ions, would be located so near the poles. Previous theories held that ions were mostly coming from Jupiter's moon, lo. Chandra's ability to pinpoint the source of the x-rays discards this theory since ions coming from near lo's orbit carnot reach the observed high latitudes. One possibility is that particles flowing out from the Sun are captured in the outer regions of Jupiter's magnetic field, then accelerated and directed toward its magnetic pole. Once captured, the ions would bounce back and forth in the magnetic field from Jupiter's north pole to the south pole in an oscillating motion that could explain the pulsation.
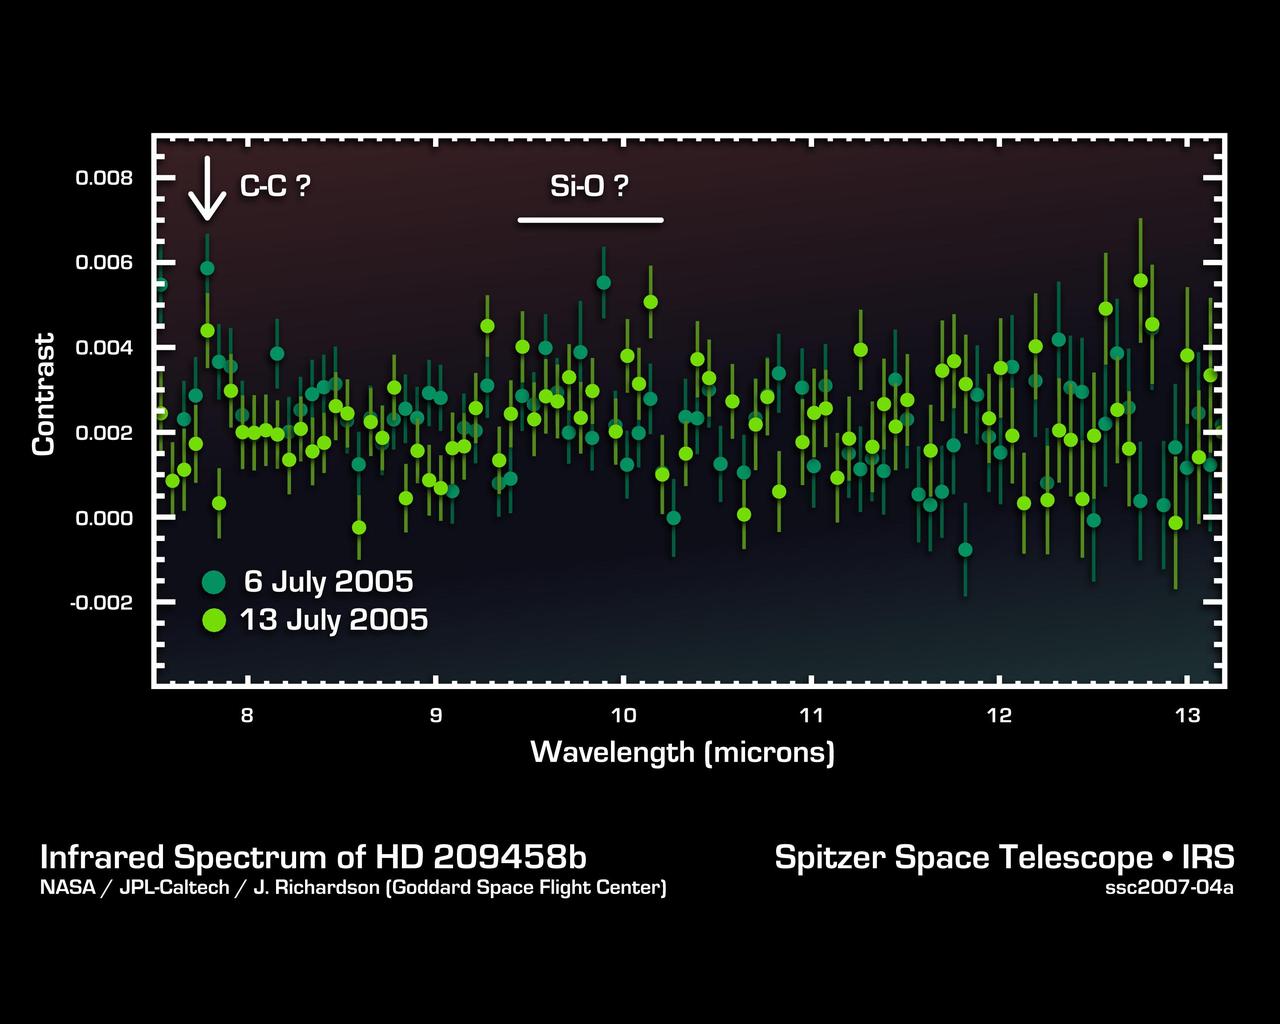
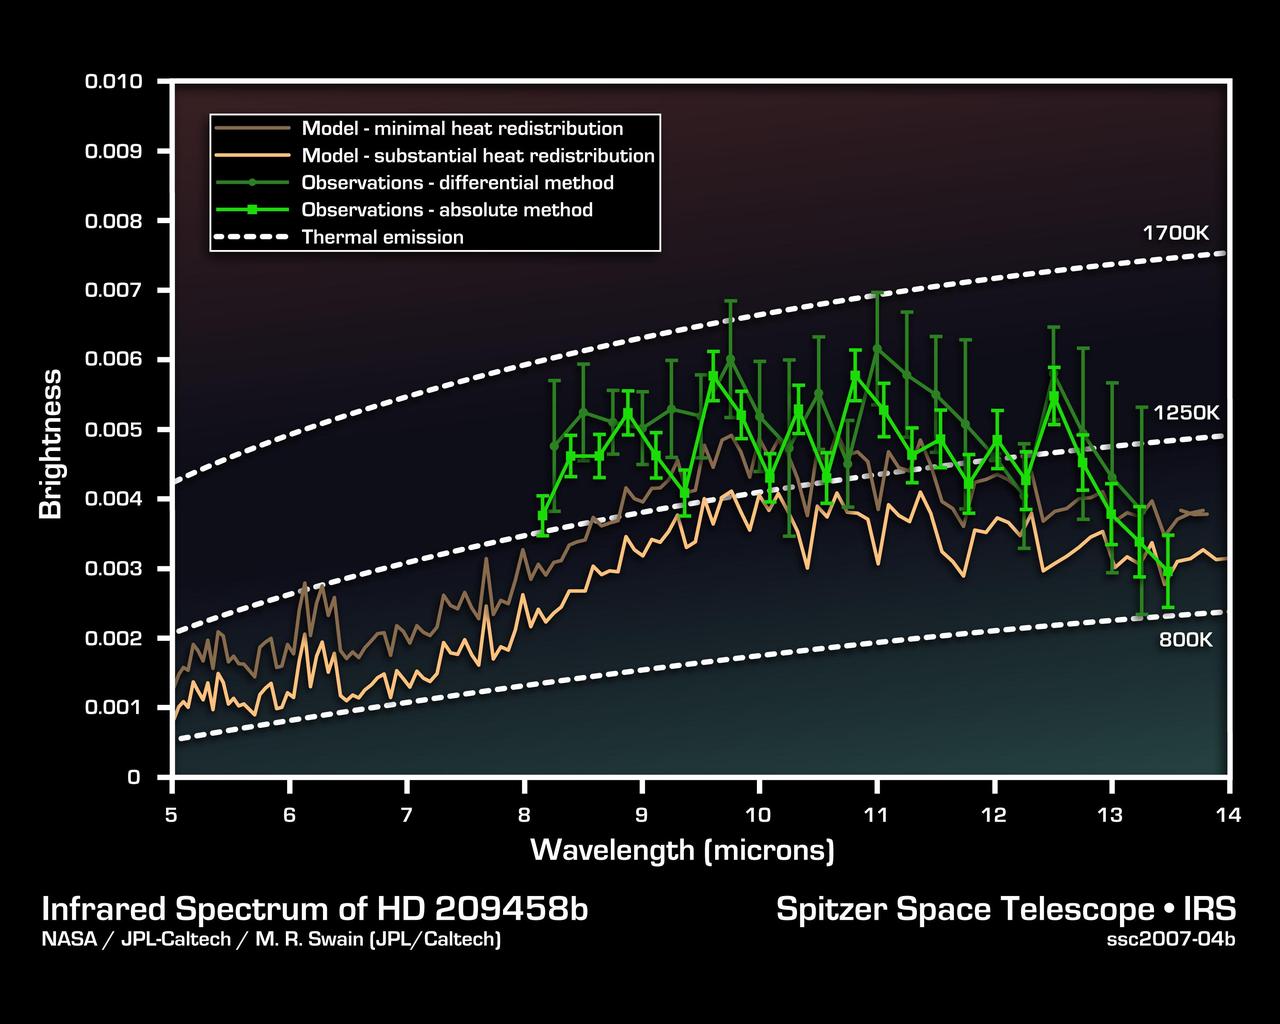
This infrared data from NASA's Spitzer Space Telescope -- called a spectrum -- tells astronomers that a distant gas planet, a so-called "hot Jupiter" called HD 209458b, might be smothered with high clouds. It is one of the first spectra of an alien world. A spectrum is created when an instrument called a spectrograph cracks light from an object open into a rainbow of different wavelengths. Patterns or ripples within the spectrum indicate the presence, or absence, of molecules making up the object. Astronomers using Spitzer's spectrograph were able to obtain infrared spectra for two so-called "transiting" hot-Jupiter planets using the "secondary eclipse" technique. In this method, the spectrograph first collects the combined infrared light from the planet plus its star, then, as the planet is eclipsed by the star, the infrared light of just the star. Subtracting the latter from the former reveals the planet's own rainbow of infrared colors. When astronomers first saw the infrared spectrum above, they were shocked. It doesn't look anything like what theorists had predicted. For example, theorists thought there'd be signatures of water in the wavelength ranges of 8 to 9 microns. The fact that water is not detected might indicate that it is hidden under a thick blanket of high, dry clouds. In addition, the spectrum shows signs of silicate dust -- tiny grains of sand -- in the wavelength range of 9 to 10 microns. This suggests that the planet's skies could be filled with high clouds of dust unlike anything seen in our own solar system. There is also an unidentified molecular signature at 7.78 microns. Future observations using Spitzer's spectrograph should be able to determine the nature of the mysterious feature. This spectrum was produced by Dr. Jeremy Richardson of NASA's Goddard Space Flight Center, Greenbelt, Md. and his colleagues. The data were taken by Spitzer's infrared spectrograph on July 6 and 13, 2005. http://photojournal.jpl.nasa.gov/catalog/PIA09197
This infrared data from NASA's Spitzer Space Telescope -- called a spectrum -- tells astronomers that a distant gas planet, a so-called "hot Jupiter" called HD 209458b, might be smothered with high clouds. It is one of the first spectra of an alien world. A spectrum is created when an instrument called a spectrograph cracks light from an object open into a rainbow of different wavelengths. Patterns or ripples within the spectrum indicate the presence, or absence, of molecules making up the object. Astronomers using Spitzer's spectrograph were able to obtain infrared spectra for two so-called "transiting" hot-Jupiter planets using the "secondary eclipse" technique. In this method, the spectrograph first collects the combined infrared light from the planet plus its star, then, as the planet is eclipsed by the star, the infrared light of just the star. Subtracting the latter from the former reveals the planet's own rainbow of infrared colors. When astronomers first saw the infrared spectrum above, they were shocked. It doesn't look anything like what theorists had predicted. For example, theorists thought there'd be signatures of water in the wavelength ranges of 8 to 9 microns. The fact that water is not detected might indicate that it is hidden under a thick blanket of high, dry clouds. In addition, the spectrum shows signs of silicate dust -- tiny grains of sand -- in the wavelength range of 9 to 10 microns. This suggests that the planet's skies could be filled with high clouds of dust unlike anything seen in our own solar system. There is also an unidentified molecular signature at 7.78 microns. Future observations using Spitzer's spectrograph should be able to determine the nature of the mysterious feature. This spectrum was produced by Dr. Jeremy Richardson of NASA's Goddard Space Flight Center, Greenbelt, Md. and his colleagues. The data were taken by Spitzer's infrared spectrograph on July 6 and 13, 2005. http://photojournal.jpl.nasa.gov/catalog/PIA09198
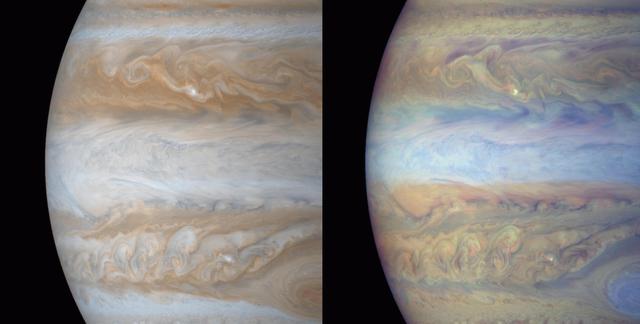
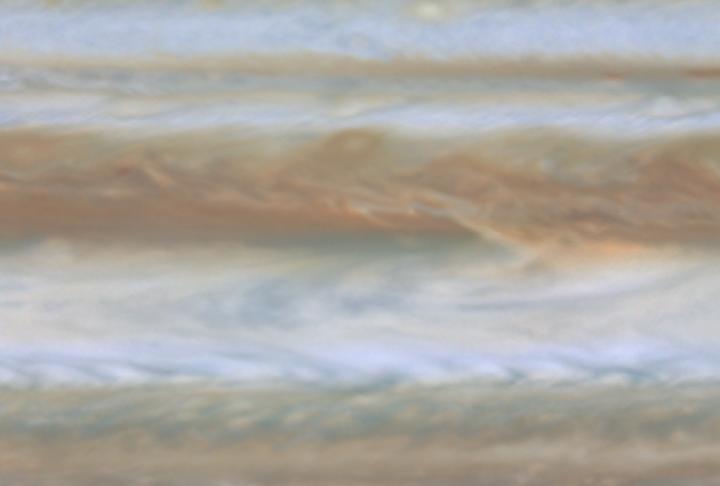
These color composite frames of the mid-section of Jupiter were of narrow angle images acquired on December 31, 2000, a day after Cassini's closest approach to the planet. The smallest features in these frames are roughly ~ 60 kilometers. The left is natural color, composited to yield the color that Jupiter would have if seen by the naked eye. The right frame is composed of 3 images: two were taken through narrow band filters centered on regions of the spectrum where the gaseous methane in Jupiter's atmosphere absorbs light, and the third was taken in a red continuum region of the spectrum, where Jupiter has no absorptions. The combination yields an image whose colors denote the height of the clouds. Red regions are deep water clouds, bright blue regions are high haze (like the blue covering the Great Red Spot). Small, intensely bright white spots are energetic lightning storms which have penetrated high into the atmosphere where there is no opportunity for absorption of light: these high cloud systems reflect all light equally. The darkest blue regions -- for example, the long linear regions which border the northern part of the equatorial zone, are the very deep "hot spots', seen in earlier images, from which Jovian thermal emission is free to escape to space. This is the first time that global images of Jupiter in all the methane and attendant continuum filters have been acquired by a spacecraft. From images like these, the stratigraphy of Jupiter's dynamic atmosphere will be determined. http://photojournal.jpl.nasa.gov/catalog/PIA02877
The Near-Infrared Mapping Spectrometer (NIMS) instrument looks at Jupiter's Great Red Spot, in these views from June 26, 1996. NIMS studies infrared wavelengths of light that our eye cannot see. These maps are at four different infrared wavelengths, each one picked to reveal something different about the atmosphere. The top image is a false color map of a wavelength that is at the red edge of our ability to see. It shows the shapes of features that we would see with our eyes. The second map is of ammonia ice, red showing where the most ice is, blue where none exists. The differences between this and the first image are due to the amount and size of ammonia ice crystals. The third map down is from a wavelength that shows cloud heights, with the highest clouds in red, and the lowest in blue. The bottom map uses a wavelength that shows the hot Jupiter shining through the clouds. Red represents the thinnest clouds, and blue is thickest where it is more difficult to see below. Comparing the bottom two images, note that the highest clouds are in the center of the Great Red Spot, while there are relatively few clouds around the edges. http://photojournal.jpl.nasa.gov/catalog/PIA00501
A huge area of Io's volcanic plains is shown in this Voyager 1 image mosaic. Numerous volcanic calderas and lava flows are visible here. Loki Patera, an active lava lake, is the large shield-shaped black feature. Heat emitted from Loki can be seen through telescopes all the way from Earth. These telescopic observations tell us that Loki has been active continuously (or at least every time astronomers have looked) since the Voyager 1 flyby in March 1979. The composition of Io's volcanic plains and lava flows has not been determined, but they could consist dominantly of sulfur with surface frosts of sulfur dioxide or of silicates (such as basalts) encrusted with sulfur and sulfur dioxide condensates. The bright whitish patches probably consist of freshly deposited SO2 frost. The black spots, including Loki, are probably hot sulfur lava, which may remain molten by intrusions of molten silicate magma, coming up from deeper within Io. The ultimate source of heat that keeps Io active is tidal frictional heating due to the continual flexure of Io by the gravity of Jupiter and Europa, another of Jupiter's satellites. http://photojournal.jpl.nasa.gov/catalog/PIA00320
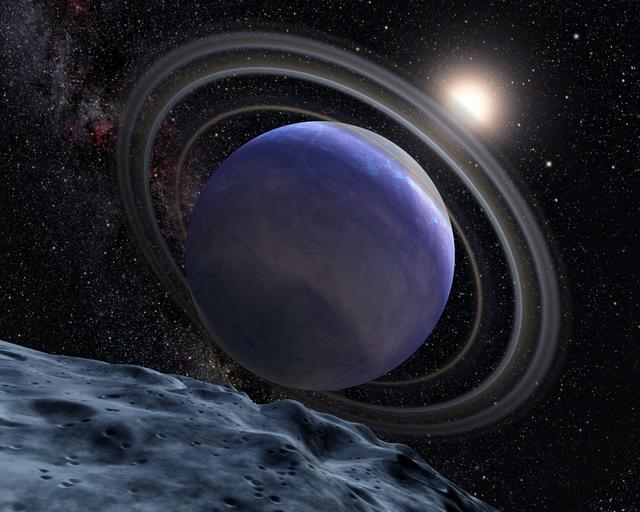
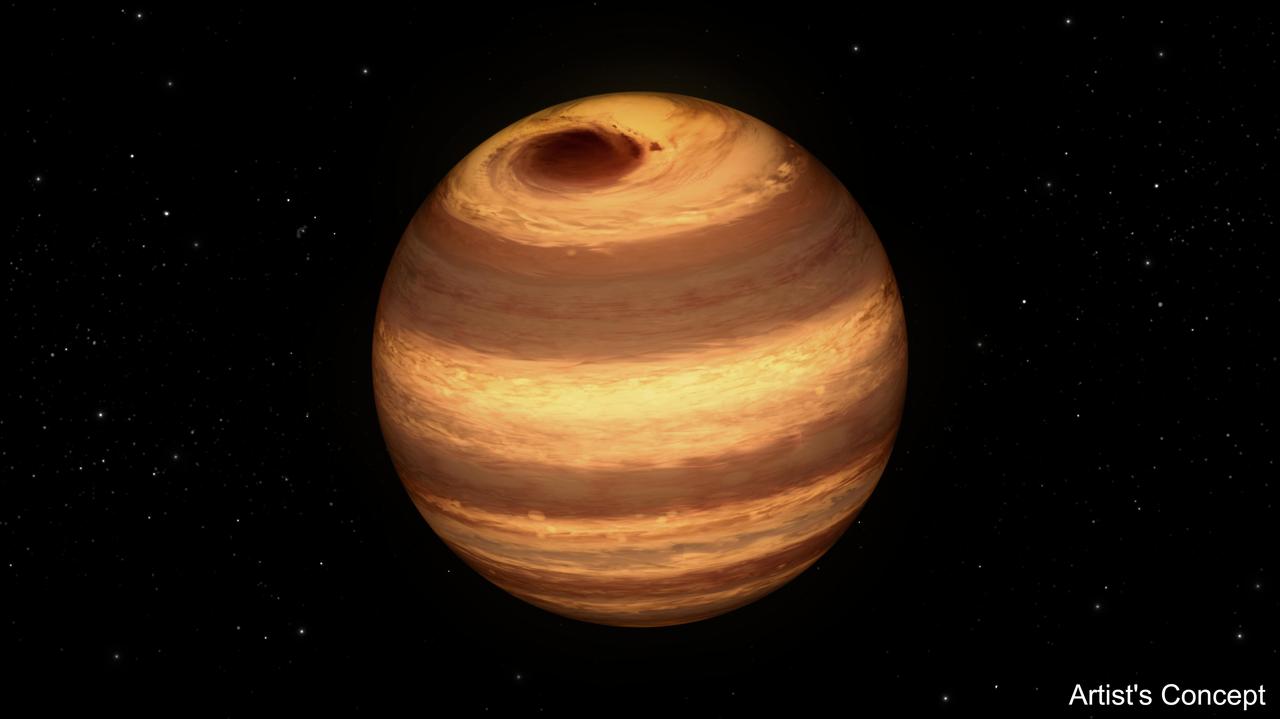
Release Date April 1, 2009 This is an artistic illustration of the giant planet HR 8799b. The planet was first discovered in 2007 at the Gemini North observatory. It was identified in the NICMOS archival data in a follow-up search of NICMOS archival data to see if Hubble had also serendipitously imaged it. The planet is young and hot, at a temperature of 1500 degrees Fahrenheit. It is slightly larger than Jupiter and may be at least seven times more massive. Analysis of the NICMOS data suggests the planet has water vapor in its atmosphere and is only partially cloud covered. It is not known if the planet has rings or moons, but circumplanetary debris is common among the outer planets of our solar system. Credit: NASA/Goddard Space Flight Center/ESA/G. Bacon (STScI) To learn more about the Hubble Space Telescope go here: <a href="http://www.nasa.gov/mission_pages/hubble/main/index.html" rel="nofollow">www.nasa.gov/mission_pages/hubble/main/index.html</a>
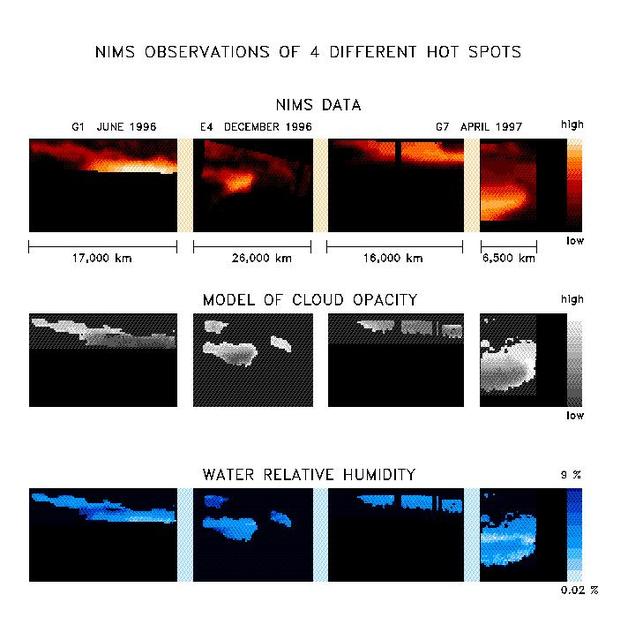
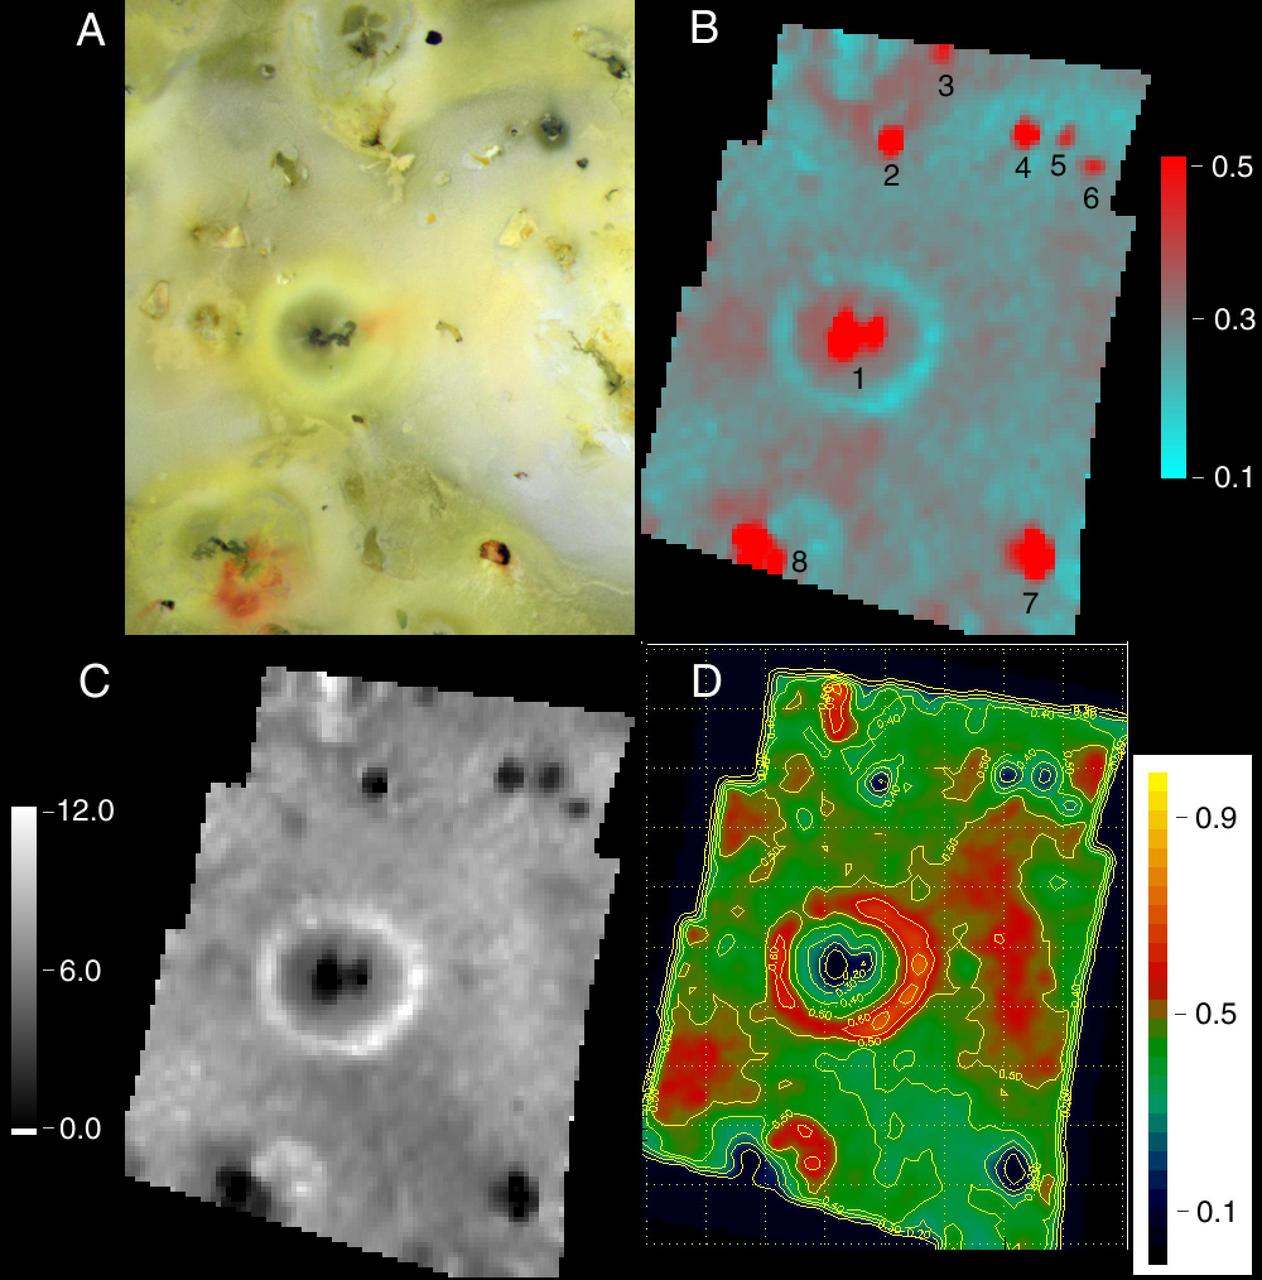
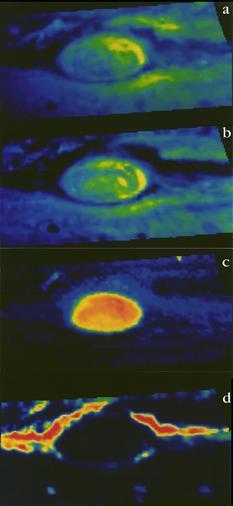
With the NIMS instrument high quality observations are being obtained from all parts of Jupiter. The images in the upper panel are taken at a wavelength of 4.8 microns. At this wavelength thermal radiation from about 100 km deep below the visible cloud deck is escaping, allowing us to study the deep atmospheric region. The overlying cloud deck absorbs a part of the radiation, but there are places where it is thin and more radiation can escape. These are called hot spot regions. Many hotspots regions occur in a zone between the equator and 15 degrees north latitude, the North Equatorial Belt (NEB), but thermal radiation is seen from much of the planet. The uniqueness of NIMS is that it is capable of observing the same spatial region at a maximum of 408 different wavelengths between 0.7 and 5.2 micron simultaneously. Every picture element (pixel) contains a spectrum of up to 408 wavelengths. The gases that compose the atmosphere leave there traces in the spectra. In this particular case, 48 wavelengths were available between 4.6 and 5.2 micron, and we see spectral signatures of water, ammonia, and phosphine. Also, the total amount of radiation is determined by the amount of overlying cloud, characterized by the cloud opacity. By means of model calculations, we can determine the amount of water and the cloud opacity for each individual spectrum. The amount ammonia and phosphine is more difficult to obtain because its influence on the spectra is weaker. The results of these calculations are shown in the form of maps in the next two panels. With NIMS, we can now have a detailed look at the spatial distribution of the water and ammonia amounts and the cloud opacity in the atmosphere. Not all the pixels from the observations have good spectra, so for some data points no reliable determination of the water and cloud opacity could be made. We find that the atmosphere is extremely dry in, and close to, the hot spot, with relative humidities between 0.02 % and 10 %, with the dryest places being inside the hot spot. This corroborates the in-situ Galileo Entry Probe measurements. The Probe entered the atmosphere, on December 5 1995, in a hot spot region. Whereas the Probe obtained only a very localized snapshot, with NIMS we can do observations of larger areas and over longer periods. The spatial distribution of water is more complex than expected. More detailed investigations will be necessary to fully understand these results. http://photojournal.jpl.nasa.gov/catalog/PIA01224
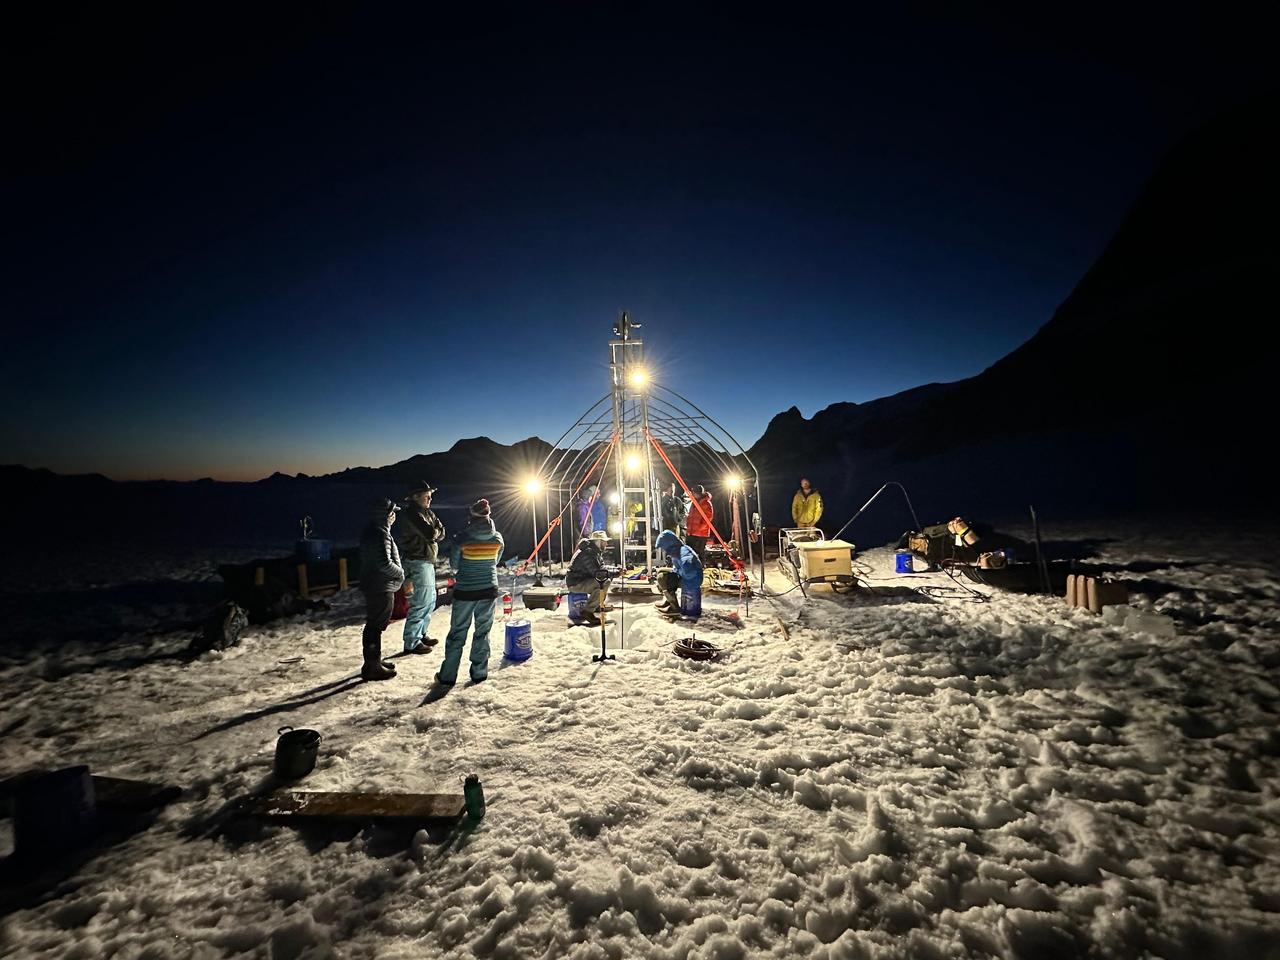
A group of researchers from NASA's Jet Propulsion Laboratory and other institutions spent two weeks on a glacier in Alaska in July 2023 for a project called ORCAA (Ocean Worlds Reconnaissance and Characterization of Astrobiological Analogs). Known as an analog mission, the project is working to answer science questions and test technology in preparation for a potential future mission to explore the surface or subsurface of icy moons like Jupiter's Europa and Saturn's Enceladus. Working at the Juneau Icefield, in coordination with the Juneau Icefield Research Project, the team used a hot-water drill to make a narrow hole in the glacier, melting its way progressively deeper. After three days, the drill reached bedrock, 890 feet (272 meters) below the surface. Science instruments were then sent down the borehole to take a variety of measurements and characterize the water environment. In 2025, the ORCAA team will return to the icefield and target a subglacial lake (a body of water inside the glacier) that has similarities to a reservoir scientists believe exists a few kilometers beneath the icy surface of Europa. ORCAA is funded by NASA's Planetary Science and Technology from Analog Research (PSTAR) program. https://photojournal.jpl.nasa.gov/catalog/PIA26345

This artist's concept shows what the TRAPPIST-1 planetary system may look like, based on available data about the planets' diameters, masses and distances from the host star. The system has been revealed through observations from NASA's Spitzer Space Telescope and the ground-based TRAPPIST (TRAnsiting Planets and PlanetesImals Small Telescope) telescope, as well as other ground-based observatories. The system was named for the TRAPPIST telescope. The seven planets of TRAPPIST-1 are all Earth-sized and terrestrial, according to research published in 2017 in the journal Nature. TRAPPIST-1 is an ultra-cool dwarf star in the constellation Aquarius, and its planets orbit very close to it. They are likely all tidally locked, meaning the same face of the planet is always pointed at the star, as the same side of our moon is always pointed at Earth. This creates a perpetual night side and perpetual day side on each planet. TRAPPIST-1b and c receive the most light from the star and would be the warmest. TRAPPIST-1e, f and g all orbit in the habitable zone, the area where liquid water is most likely to be detected. But any of the planets could potentially harbor liquid water, depending on their compositions. In the imagined planets shown here, TRAPPIST-1b is shown as a larger analogue to Jupiter's moon Io. TRAPPIST-1d is depicted with a narrow band of water near the terminator, the divide between a hot, dry day and an ice-covered night side. TRAPPIST-1e and TRAPPIST-1f are both shown covered in water, but with progressively larger ice caps on the night side. TRAPPIST-1g is portrayed with an atmosphere like Neptune's, although it is still a rocky world. TRAPPIST-1h, the farthest from the star, would be the coldest. It is portrayed here as an icy world, similar to Jupiter's moon Europa, but the least is known about it. http://photojournal.jpl.nasa.gov/catalog/PIA21422
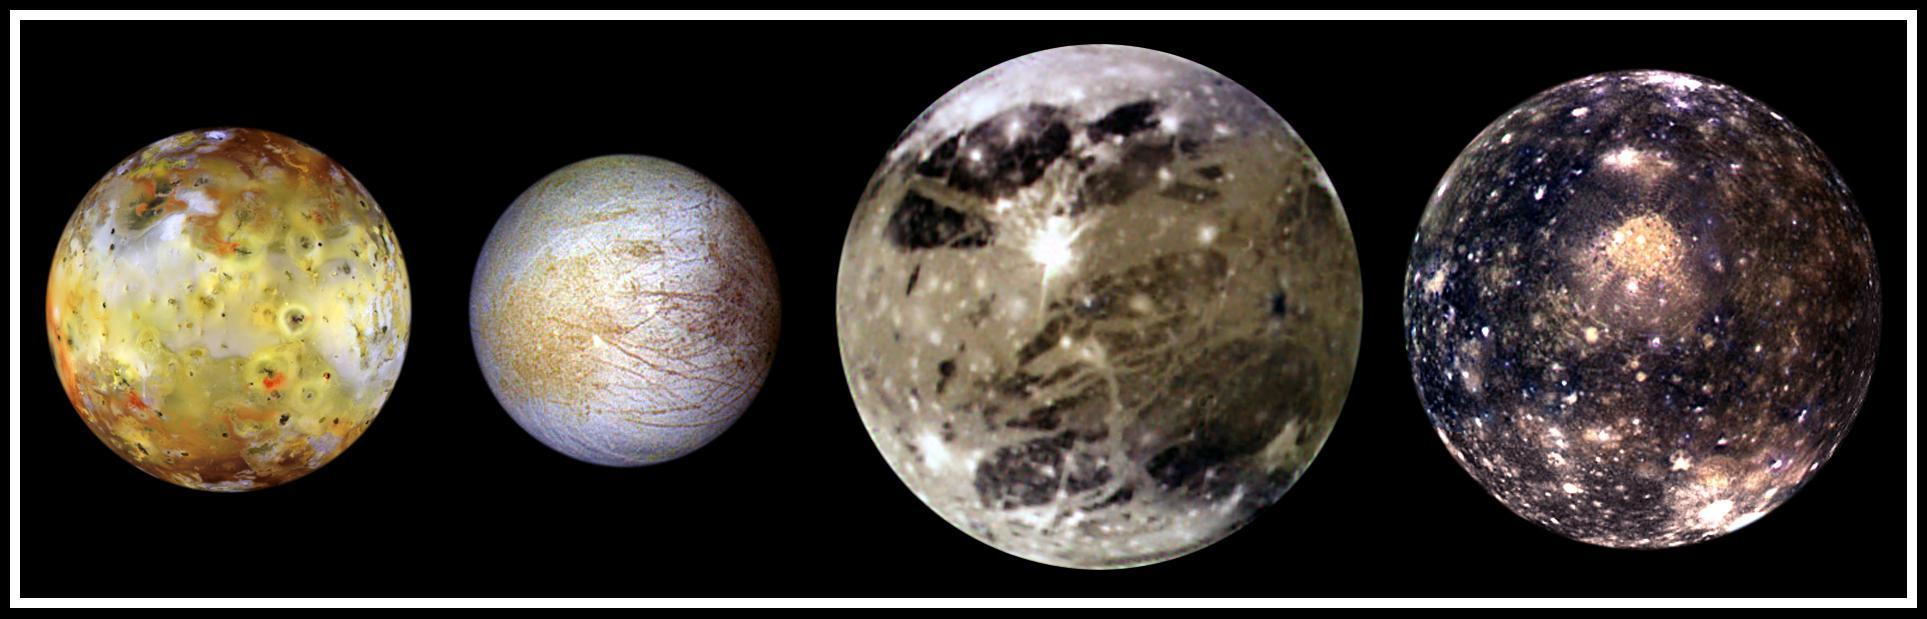
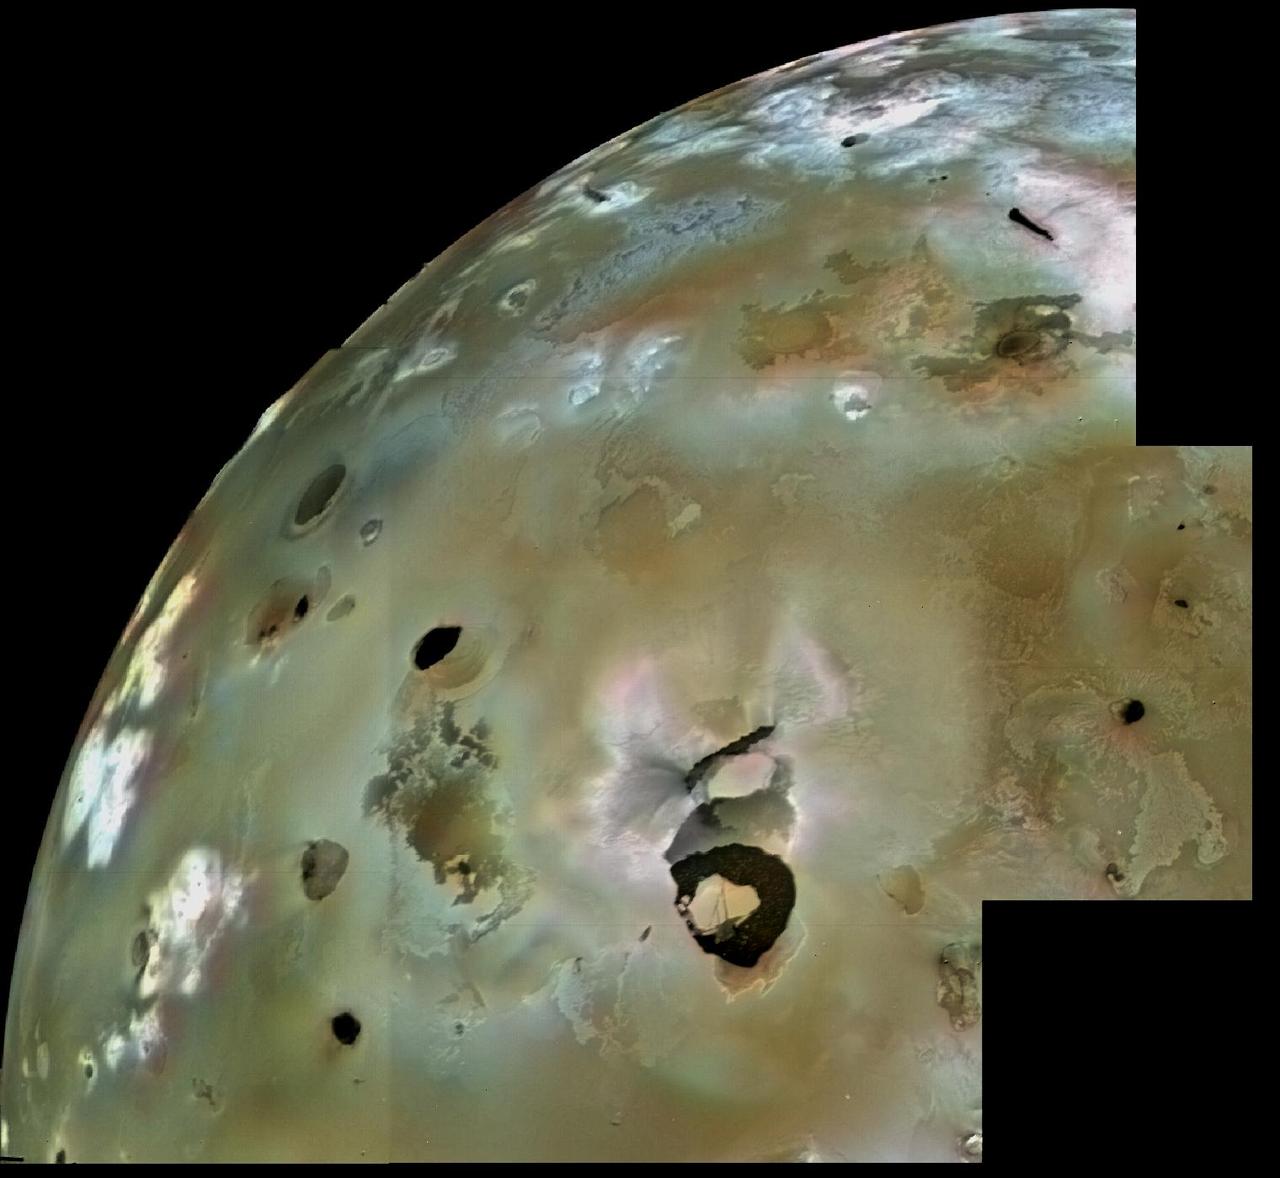
In this "family portrait," the four Galilean Satellites are shown to scale. These four largest moons of Jupiter shown in increasing distance from Jupiter are (left to right) Io, Europa, Ganymede, and Callisto. These global views show the side of volcanically active Io which always faces away from Jupiter, icy Europa, the Jupiter-facing side of Ganymede, and heavily cratered Callisto. The appearances of these neighboring satellites are amazingly different even though they are relatively close to Jupiter (350,000 kilometers for Io; 1, 800,000 kilometers for Callisto). These images were acquired on several orbits at very low "phase" angles (the sun, spacecraft, moon angle) so that the sun is illuminating the Jovian moons from completely behind the spacecraft, in the same way a full moon is viewed from Earth. The colors have been enhanced to bring out subtle color variations of surface features. North is to the top of all the images which were taken by the Solid State Imaging (SSI) system on NASA's Galileo spacecraft. Io, which is slightly larger than Earth's moon, is the most colorful of the Galilean satellites. Its surface is covered by deposits from actively erupting volcanoes, hundreds of lava flows, and volcanic vents which are visible as small dark spots. Several of these volcanoes are very hot; at least one reached a temperature of 2000 degrees Celsius (3600 degrees Fahrenheit) in the summer of 1997. Prometheus, a volcano located slightly right of center on Io's image, was active during the Voyager flybys in 1979 and is still active as Galileo images were obtained. This global view was obtained in September 1996 when Galileo was 485,000 kilometers from Io; the finest details that can be discerned are about 10 km across. The bright, yellowish and white materials located at equatorial latitudes are believed to be composed of sulfur and sulfur dioxide. The polar caps are darker and covered by a redder material. Europa has a very different surface from its rocky neighbor, Io. Galileo images hint at the possibility of liquid water beneath the icy crust of this moon. The bright white and bluish parts of Europa's surface are composed almost completely of water ice. In contrast, the brownish mottled regions on the right side of the image may be covered by salts (such as hydrated magnesium-sulfate) and an unknown red component. The yellowish mottled terrain on the left side of the image is caused by some other, unknown contaminant. This global view was obtained in June 1997 when Galileo was 1.25 million kilometers from Europa; the finest details that can be discerned are 25 kilometers across. Ganymede, larger than the planet Mercury, is the largest Jovian satellite. Its distinctive surface is characterized by patches of dark and light terrain. Bright frost is visible at the north and south poles. The very bright icy impact crater, Tros, is near the center of the image in a region known as Phrygia Sulcus. The dark area to the northwest of Tros is Perrine Regio; the dark terrain to the south and southeast is Nicholson Regio. Ganymede's surface is characterized by a high degree of crustal deformation. Much of the surface is covered by water ice, with a higher amount of rocky material in the darker areas. This global view was taken in September 1997 when Galileo was 1.68 million kilometers from Ganymede; the finest details that can be discerned are about 67 kilometers across. Callisto's dark surface is pocked by numerous bright impact craters. The large Valhalla multi-ring structure (visible near the center of the image) has a diameter of about 4,000 kilometers, making it one of the largest impact features in the Solar System. Although many crater rims exhibit bright icy "bedrock" material, a dark layer composed of hydrated minerals and organic components (tholins) is seen inside many craters and in other low lying areas. Evidence of tectonic and volcanic activity, seen on the other Galilean satellites, appears to be absent on Callisto. This global view was obtained in November 1997 when Galileo was 684,500 kilometers from Callisto; the finest details that can be discerned are about 27 kilometers across. http://photojournal.jpl.nasa.gov/catalog/PIA01400
This illustration shows a cool star, called W1906+40, marked by a raging storm near one of its poles. The storm is thought to be similar to the Great Red Spot on Jupiter. Scientists discovered it using NASA's Kepler and Spitzer space telescopes. The location of the storm is estimated to be near the north pole of the star based on computer models of the data. The telescopes cannot see the storm itself, but learned of its presence after observing how the star's light changes over time. The storm travels around with the star, making a full lap about every 9 hours. When it passes into a telescope's field of view, it causes light of particular infrared and visible wavelengths to dip in brightness. The storm has persisted for at least two years. Astronomers aren't sure why it has lasted so long. While planets are known to have cloudy storms, this is the best evidence yet for a star with the same type of storm. The star, W1906+40, belongs to a thermally cool class of objects called L-dwarfs. Some L-dwarfs are considered stars because they fuse atoms and generate light, as our sun does, while others, called brown dwarfs, are known as "failed stars" for their lack of atomic fusion. The L-dwarf W1906+40 is thought to be a star based on estimates of its age (the older the L-dwarf, the more likely it is a star). Its temperature is about 2,200 Kelvin (3,500 degrees Fahrenheit). That may sound scorching hot, but as far as stars go, it is relatively cool. Cool enough, in fact, for clouds to form in its atmosphere. W1906+40 is located 53 light-years away in the constellation Lyra. http://photojournal.jpl.nasa.gov/catalog/PIA20055

WASP-18b is an exoplanet located 325 light-years from Earth. The planet's mass is 10 times that of Jupiter, and it orbits its star once every 23 hours. A 2017 study found that this planet has a stratosphere that's loaded with carbon dioxide, but has no signs of water. A stratosphere is a layer of atmosphere in which temperature increases with higher altitudes. The study used NASA's Spitzer and Hubble space telescopes. https://photojournal.jpl.nasa.gov/catalog/PIA22087

This image from NASA Kepler mission shows the telescope full field of view an expansive star-rich patch of sky in the constellations Cygnus and Lyra stretching across 100 square degrees, or the equivalent of two side-by-side dips of the Big Dipper. A cluster of stars, called NGC 6791, and a star with a known planet, called TrES-2, are outlined. The cluster is eight billion years old, and located 13,000 light-years from Earth. It is called an open cluster because its stars are loosely bound and have started to spread out. TrES-2 is a hot Jupiter-like planet known to cross in front of, or transit, its star every 2.5 days. Kepler will hunt for transiting planets that are as small as Earth. Kepler was designed to hunt for planets like Earth. Of the approximately 4.5 million stars in the region pictured here, more than 100,000 were selected as candidates for Kepler's search. The mission will spend the next three-and-a-half years staring at these target stars, looking for periodic dips in brightness. Such dips occur when planets cross in front of their stars from our point of view in the galaxy, partially blocking the starlight. The area in the lower right of the image is brighter because it is closer to the plane of our galaxy and is jam-packed with stars. The area in upper left is farther from the galactic plane and contains fewer stars. The image has been color-coded so that brighter stars appear white, and fainter stars, red. It is a 60-second exposure, taken on April 8, 2009, one day after the spacecraft's dust cover was jettisoned. To achieve the level of precision needed to spot planets as small as Earth, Kepler's images are intentionally blurred slightly. This minimizes the number of saturated stars. Saturation, or "blooming," occurs when the brightest stars overload the individual pixels in the detectors, causing the signal to spill out into nearby pixels. These spills can be seen in the image as fine white lines extending above and below some of the brightest stars. Blooming is an expected side effect of Kepler's ultra-sensitive camera. Some of the lightly saturated stars are candidates for planet searches, while those that are heavily saturated are not. The grid lines across the picture show how the focal plane is laid out on Kepler's camera —the largest ever launched in space at 95 megapixels. There are 42 charge-coupled devices (CCDs), paired into square-shaped modules, whose outline can be seen in the image. A thin black line in each module shows adjacent pairs of CCDs. The thicker black lines that cross through the image are from structures holding the modules together, and were purposely oriented to block out the very brightest stars in Kepler's field of view. The four black corners of the image show where the fine-guidance sensors reside on the focal plane. These sensors are used to hold the telescope's gaze steady by measuring its position on the sky 10 times every second, and by feeding this information to the spacecraft's attitude control system. Ghost images also appear in the image, which are reflections off the lenses above the CCDs. These expected artifacts were mapped out during ground testing for Kepler, and will not affect science observations because they will be removed as the data are processed. http://photojournal.jpl.nasa.gov/catalog/PIA11984