
Scientists were excited to discover clear skies on a relatively small planet, about the size of Neptune, using the combined power of NASA Hubble, Spitzer and Kepler space telescopes.
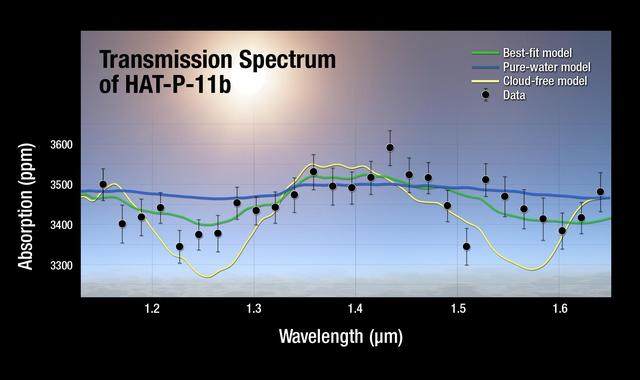
A plot of the transmission spectrum for exoplanet HAT-P-11b, with data from NASA Kepler, Hubble and Spitzer observatories combined. The results show a robust detection of water absorption in the Hubble data.

NASA Administrator Charles Bolden speaks at the 215th meeting of the American Astronomical Society (AAS) in Washington on Tuesday, Jan. 5, 2009. Throughout the meeting, NASA research and mission highlights will be presented from missions that include Kepler, the Spitzer Space Telescope, the Hubble Space Telescope, and the newly launched Wide-field Infrared Survey Explorer, or WISE. Photo Credit: (NASA/Bill Ingalls)

NASA Administrator Charles Bolden speaks at the 215th meeting of the American Astronomical Society (AAS) in Washington on Tuesday, Jan. 5, 2009. Throughout the meeting, NASA research and mission highlights will be presented from missions that include Kepler, the Spitzer Space Telescope, the Hubble Space Telescope, and the newly launched Wide-field Infrared Survey Explorer, or WISE. Photo Credit: (NASA/Bill Ingalls)

NASA Administrator Charles Bolden speaks at the 215th meeting of the American Astronomical Society (AAS) in Washington on Tuesday, Jan. 5, 2009. Throughout the meeting, NASA research and mission highlights will be presented from missions that include Kepler, the Spitzer Space Telescope, the Hubble Space Telescope, and the newly launched Wide-field Infrared Survey Explorer, or WISE. Photo Credit: (NASA/Bill Ingalls)
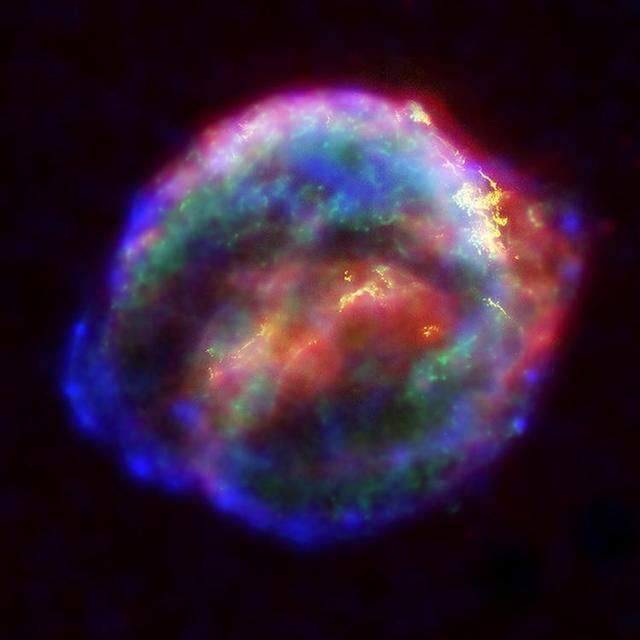
NASA's three Great Observatories -- the Hubble Space Telescope, the SpitzerSpace Telescope, and the Chandra X-ray Observatory -- joined forces to probe theexpanding remains of a supernova, called Kepler's supernova remnant, first seen 400 years ago by sky watchers, including astronomer Johannes Kepler. The combined image unveils a bubble-shaped shroud of gas and dust that is 14light-years wide and is expanding at 4 million miles per hour (2,000 kilometersper second). Observations from each telescope highlight distinct features of thesupernova remnant, a fast-moving shell of iron-rich material from the explodedstar, surrounded by an expanding shock wave that is sweeping up interstellar gasand dust. Each color in this image represents a different region of the electromagneticspectrum, from X-rays to infrared light. These diverse colors are shown in thepanel of photographs below the composite image. The X-ray and infrared datacannot be seen with the human eye. By color-coding those data and combining themwith Hubble's visible-light view, astronomers are presenting a more completepicture of the supernova remnant. Visible-light images from the Hubble telescope (colored yellow) reveal where the supernova shock wave is slamming into the densest regions of surrounding gas.The bright glowing knots are dense clumps from instabilities that form behindthe shock wave. The Hubble data also show thin filaments of gas that look likerippled sheets seen edge-on. These filaments reveal where the shock wave isencountering lower-density, more uniform interstellar material. The Spitzer telescope shows microscopic dust particles (colored red) that havebeen heated by the supernova shock wave. The dust re-radiates the shock wave'senergy as infrared light. The Spitzer data are brightest in the regionssurrounding those seen in detail by the Hubble telescope. The Chandra X-ray data show regions of very hot gas, and extremely high-energyparticles. The hottest gas (higher-energy X-rays, colored blue) is locatedprimarily in the regions directly behind the shock front. These regions alsoshow up in the Hubble observations, and also align with the faint rim of glowingmaterial seen in the Spitzer data. The X-rays from the region on the lower left(colored blue) may be dominated by extremely high-energy electrons that wereproduced by the shock wave and are radiating at radio through X-ray wavelengthsas they spiral in the intensified magnetic field behind the shock front. CoolerX-ray gas (lower-energy X-rays, colored green) resides in a thick interior shelland marks the location of heated material expelled from the exploded star. Kepler's supernova, the last such object seen to explode in our Milky Waygalaxy, resides about 13,000 light-years away in the constellation Ophiuchus. The Chandra observations were taken in June 2000, the Hubble in August 2003;and the Spitzer in August 2004. http://photojournal.jpl.nasa.gov/catalog/PIA06907
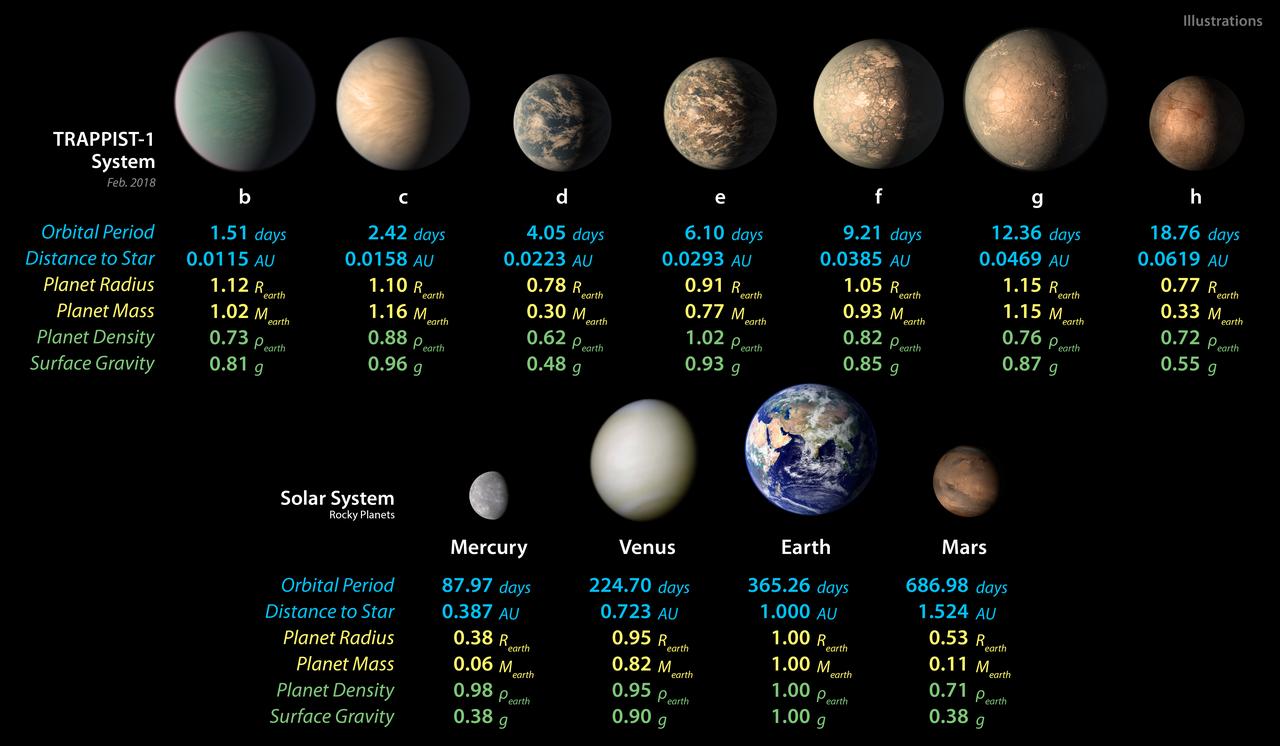
This chart shows, on the top row, artist concepts of the seven planets of TRAPPIST-1 with their orbital periods, distances from their star, radii, masses, densities and surface gravity as compared to those of Earth. These numbers are current as of February 2018. On the bottom row, the same numbers are displayed for the bodies of our inner solar system: Mercury, Venus, Earth and Mars. The TRAPPIST-1 planets orbit their star extremely closely, with periods ranging from 1.5 to only about 20 days. This is much shorter than the period of Mercury, which orbits our sun in about 88 days. The masses and densities of the TRAPPIST-1 planets were determined by careful measurements of slight variations in the timings of their orbits using extensive observations made by NASA's Spitzer and Kepler space telescopes, in combination with data from Hubble and a number of ground-based telescopes. These measurements are the most precise to date for any system of exoplanets. In this illustration, the relative sizes of the planets are all shown to scale. https://photojournal.jpl.nasa.gov/catalog/PIA22094
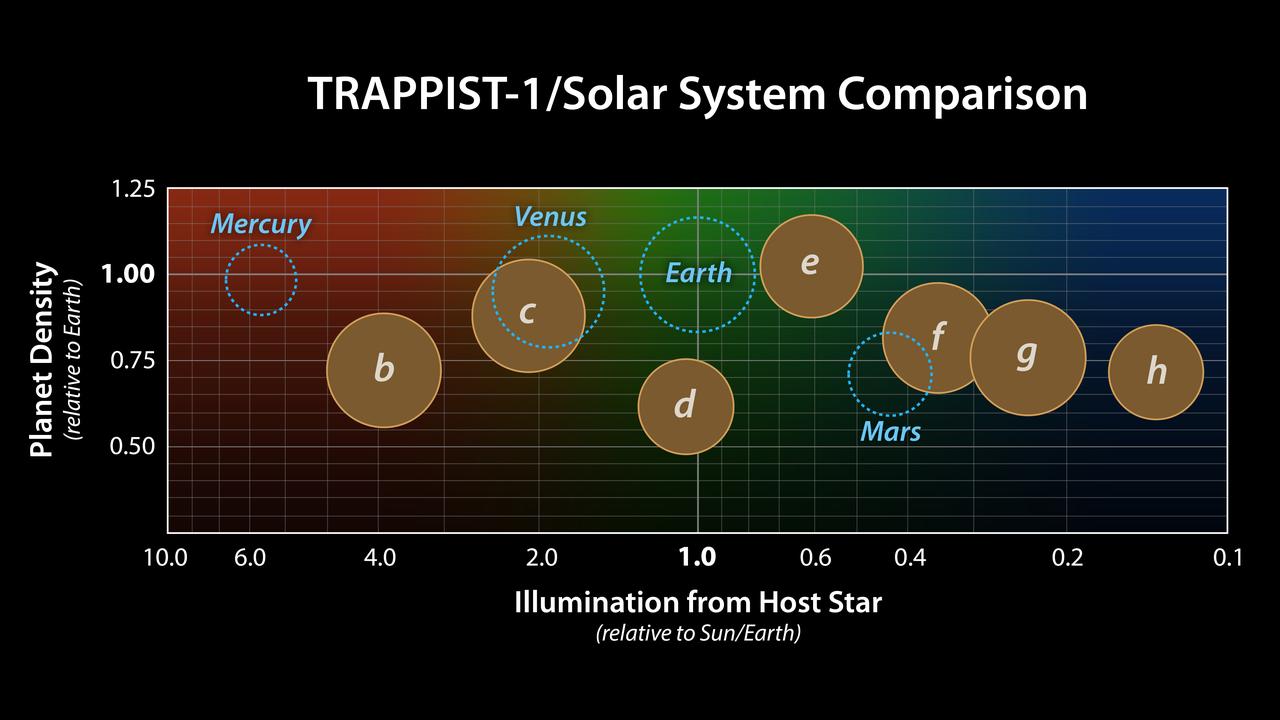
This graph presents known properties of the seven TRAPPIST-1 exoplanets (labeled b through h), showing how they stack up to the inner rocky worlds in our own solar system. The horizontal axis shows the level of illumination that each planet receives from its host star. TRAPPIST-1 is a mere 9 percent the mass of our Sun, and its temperature is much cooler. But because the TRAPPIST-1 planets orbit so closely to their star, they receive comparable levels of light and heat to Earth and its neighboring planets. The vertical axis shows the densities of the planets. Density, calculated based on a planet's mass and volume, is the first important step in understanding a planet's composition. The plot shows that the TRAPPIST-1 planet densities range from being similar to Earth and Venus at the upper end, down to values comparable to Mars at the lower end. The relative sizes of the planets are indicated by the circles. The masses and densities of the TRAPPIST-1 planets were determined by careful measurements of slight variations in the timings of their orbits using extensive observations made by NASA's Spitzer and Kepler space telescopes, in combination with data from Hubble and a number of ground-based telescopes. These measurements are the most precise to date for any system of exoplanets. By comparing these measurements with theoretical models of how planets form and evolve, researchers have determined that they are all rocky in overall composition. Estimates suggest the lower-density planets could have large quantities of water -- as much as 5 percent by mass for TRAPPIST-1d. Earth, in comparison, has only about 0.02 percent of its mass in the form of water. https://photojournal.jpl.nasa.gov/catalog/PIA22095

This graph presents measured properties of the seven TRAPPIST-1 exoplanets (labeled b through h), showing how they stack up with one another as well as with Earth and the other inner rocky worlds in our own solar system. The relative sizes of the planets are indicated by the circles. All of the known TRAPPIST-1 planets are larger than Mars, with five of them within 15% of the diameter of Earth. The vertical axis shows the uncompressed densities of the planets. Density, calculated from a planet's mass and volume, is the first important step in understanding its composition. Uncompressed density takes into account that the larger a planet is, the more its own gravity will pack the planet's material together and increase its density. Uncompressed density, therefore, usually provides a better means of comparing the composition of planets. The plot shows that the uncompressed densities of the TRAPPIST-1 planets are similar to one another, suggesting they may have all have a similar composition. The four rocky planets in our own solar system show more variation in density compared to the seven TRAPPIST-1 planets. Mercury, for example, contains a much higher percentage of iron than the other three rocky planets and thus has a much higher uncompressed density. The horizontal axis shows the level of illumination that each planet receives from its host star. The TRAPPIST-1 star is a mere 9% the mass of our Sun, and its temperature is much cooler. But because the TRAPPIST-1 planets orbit so closely to their star, they receive comparable levels of light and heat to Earth and its neighboring planets. The corresponding "habitable zones" — regions where an Earth-like planet could potentially support liquid water on its surface — of the two planetary systems are indicated near the top of the plot. The the two zones do not line up exactly because the cooler TRAPPIST-1 star emitting more of its light in the form of infrared radiation that is more efficiently absorbed by an Earth-like atmosphere. Since it takes less illumination to reach the same temperatures, the habitable zone shifts farther away from the star. The masses and densities of the TRAPPIST-1 planets were determined by measurements of slight variations in the timings of their orbits using extensive observations made by NASA's Spitzer and Kepler space telescopes, in combination with data from Hubble and a number of ground-based telescopes. The latest analysis, which includes Spitzer's complete record of over 1,000 hours of TRAPPIST-1 observations, has reduced the uncertainties of the mass measurements to a mere 3-6%. These are among the most accurate measurements of planetary masses anywhere outside of our solar system. https://photojournal.jpl.nasa.gov/catalog/PIA24371