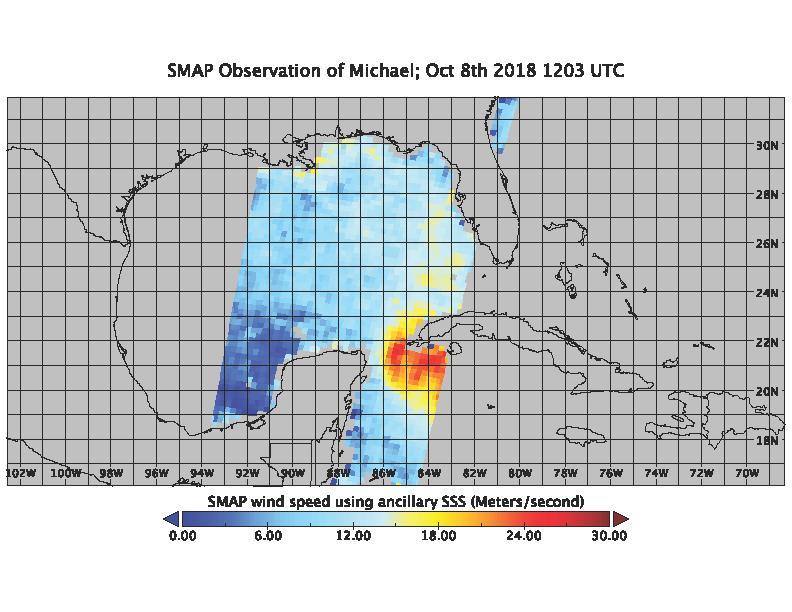
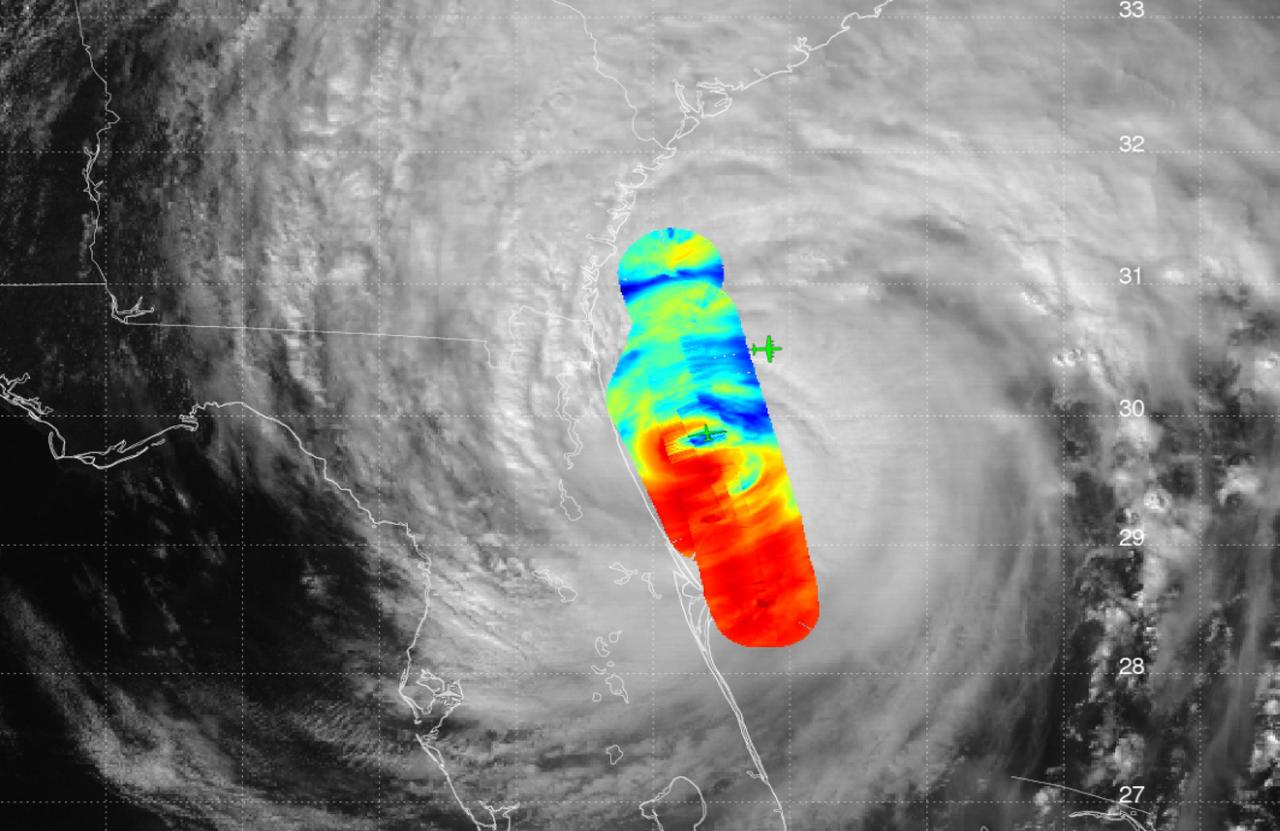
On the morning of Oct. 8, 2018, the NASA Soil Moisture Active Passive (SMAP) Radiometer got a snapshot of Hurricane Michael, which has intensified to a Category 2 hurricane over the warm waters of the Gulf of Mexico. The radiance acquired by the SMAP L-band Microwave Radiometer can see through clouds and rains, and is sensitive to the extreme ocean surface winds under a tropical storm or hurricane. Areas in red represent higher wind speeds; areas in blue have lower wind speeds. https://photojournal.jpl.nasa.gov/catalog/PIA22747

Composite image of category 5 Hurricane Patricia, off the Pacific coast of Mexico, from 06:00 UTC on Friday, 23 October 2015. At 8 a.m. EDT on October 23, 2015, the National Hurricane Center said that Hurricane Patricia had grown into a monster hurricane. In fact, it is the strongest eastern north pacific hurricane on record. At 8 a.m. EDT (1200 UTC) on Oct. 23, the eye of Hurricane Patricia was located near latitude 17.3 North, longitude 105.6 West. That's about 145 miles (235 km) southwest of Manzanillo, Mexico and about 215 miles (345 km) south of Cabo Corrientes, Mexico. Patricia was moving toward the north-northwest near 12 mph (19 kph) and a turn toward the north is expected later this morning, followed by a turn toward the north-northeast this afternoon. On the forecast track, the core of Patricia will make landfall in the hurricane warning area today, October 23, 2015 during the afternoon or evening. Maximum sustained winds remain near 200 mph (325 kph) with higher gusts. The National Hurricane Center (NHC) said that Patricia is a category 5 hurricane on the Saffir-Simpson Hurricane Wind Scale. Some fluctuations in intensity are possible today, but Patricia is expected to remain an extremely dangerous category 5 hurricane through landfall. Hurricane force winds extend outward up to 30 miles (45 km) from the center and tropical storm force winds extend outward up to 175 miles (280 km). The estimated minimum central pressure is 880 millibars. Copyright: 2015 EUMETSAT. Infrared data from the geostationary satellites of EUMETSAT and NOAA overlays a computer-generated model of the Earth, containing NASA's Blue Marble Next Generation imagery <b><a href="http://www.nasa.gov/audience/formedia/features/MP_Photo_Guidelines.html" rel="nofollow">NASA image use policy.</a></b> <b><a href="http://www.nasa.gov/centers/goddard/home/index.html" rel="nofollow">NASA Goddard Space Flight Center</a></b> enables NASA’s mission through four scientific endeavors: Earth Science, Heliophysics, Solar System Exploration, and Astrophysics. Goddard plays a leading role in NASA’s accomplishments by contributing compelling scientific knowledge to advance the Agency’s mission. <b>Follow us on <a href="http://twitter.com/NASAGoddardPix" rel="nofollow">Twitter</a></b> <b>Like us on <a href="http://www.facebook.com/pages/Greenbelt-MD/NASA-Goddard/395013845897?ref=tsd" rel="nofollow">Facebook</a></b> <b>Find us on <a href="http://instagrid.me/nasagoddard/?vm=grid" rel="nofollow">Instagram</a></b>
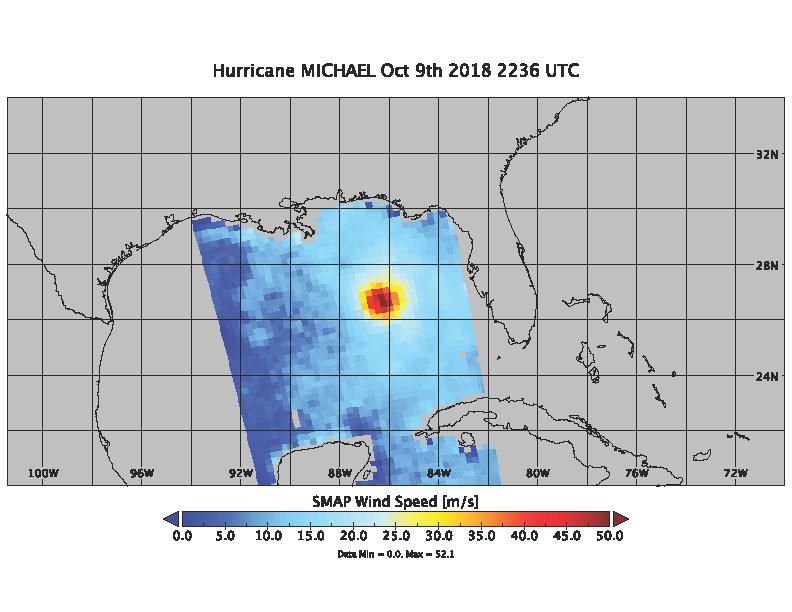
On Oct. 9, 2018 at about 4:30pm EDT, the NASA Soil Moisture Active Passive (SMAP) Radiometer got one more snap shot of Hurricane Michael. The radiance acquired by the SMAP L-band Microwave Radiometer can see through clouds and rain, and is sensitive to the extreme ocean surface winds under a tropical storm or hurricane. Hurricane Michael made landfall in the Florida panhandle Wednesday as a major Category 4 storm. https://photojournal.jpl.nasa.gov/catalog/PIA22751
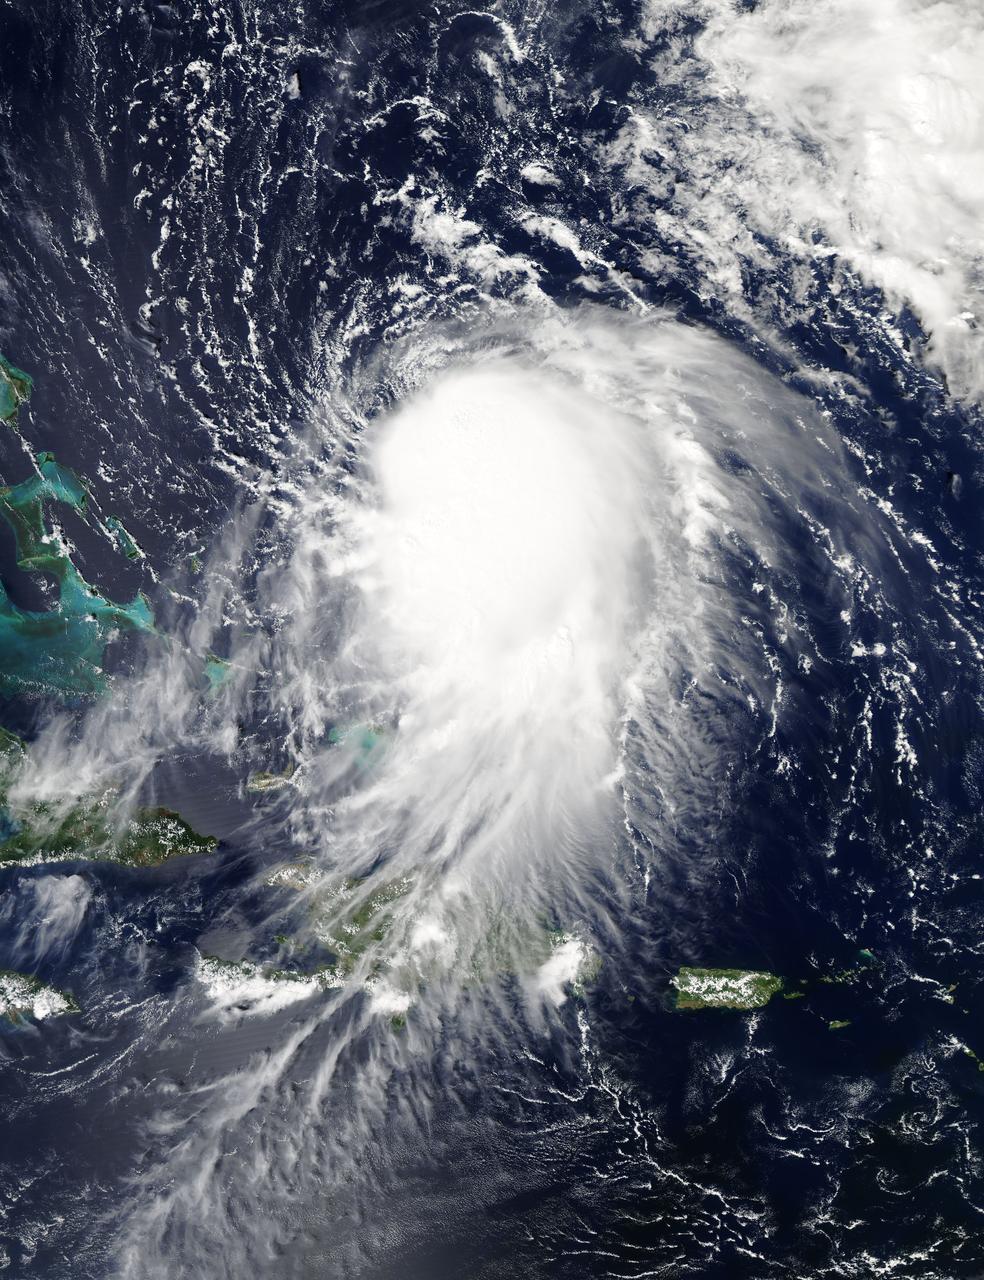
This is a visible image of Major Hurricane Matthew taken from NASA's Terra satellite on Oct. 7 at 12 p.m. EDT as it continued moving along Florida's East Coast. Matthew was a Category 3 hurricane at the time of this image. Credit: NASA's Goddard MODIS Rapid Response Team
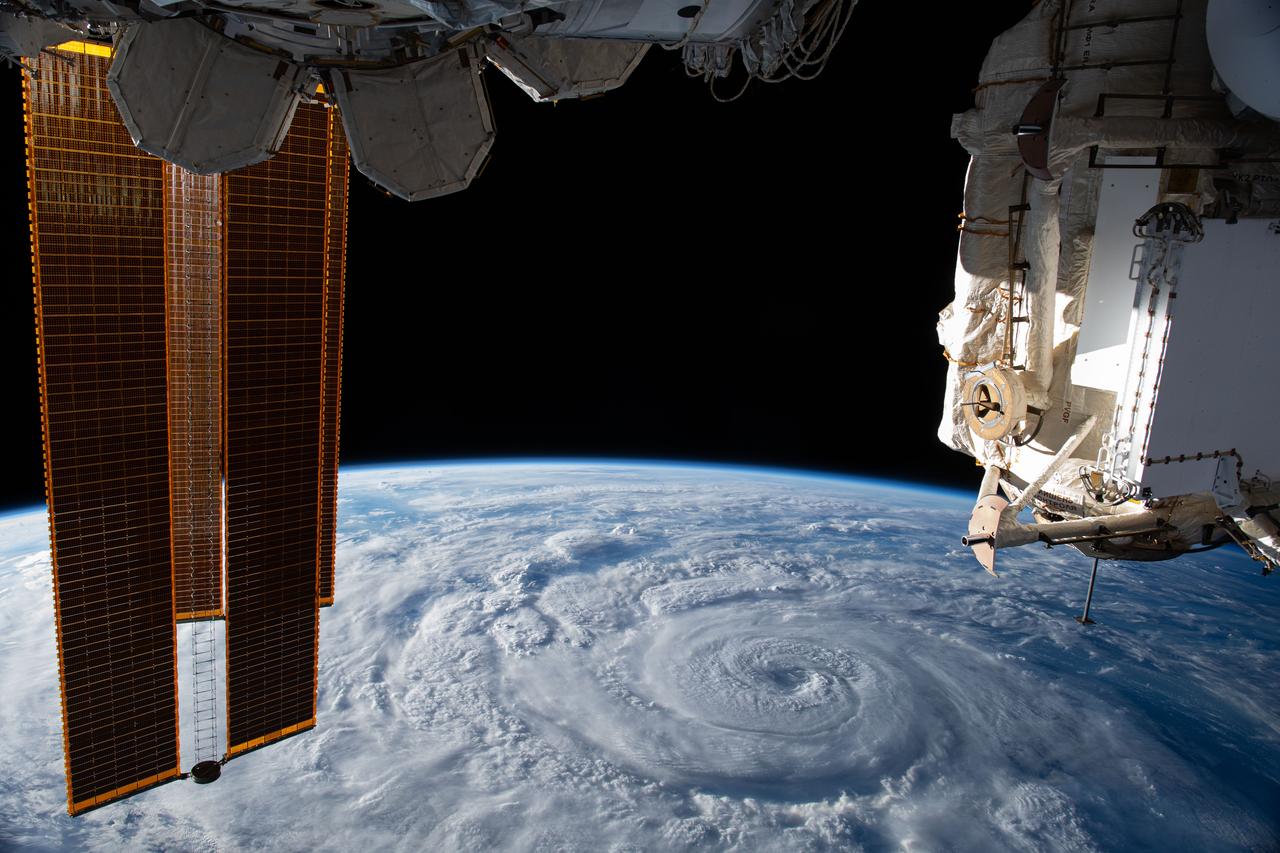
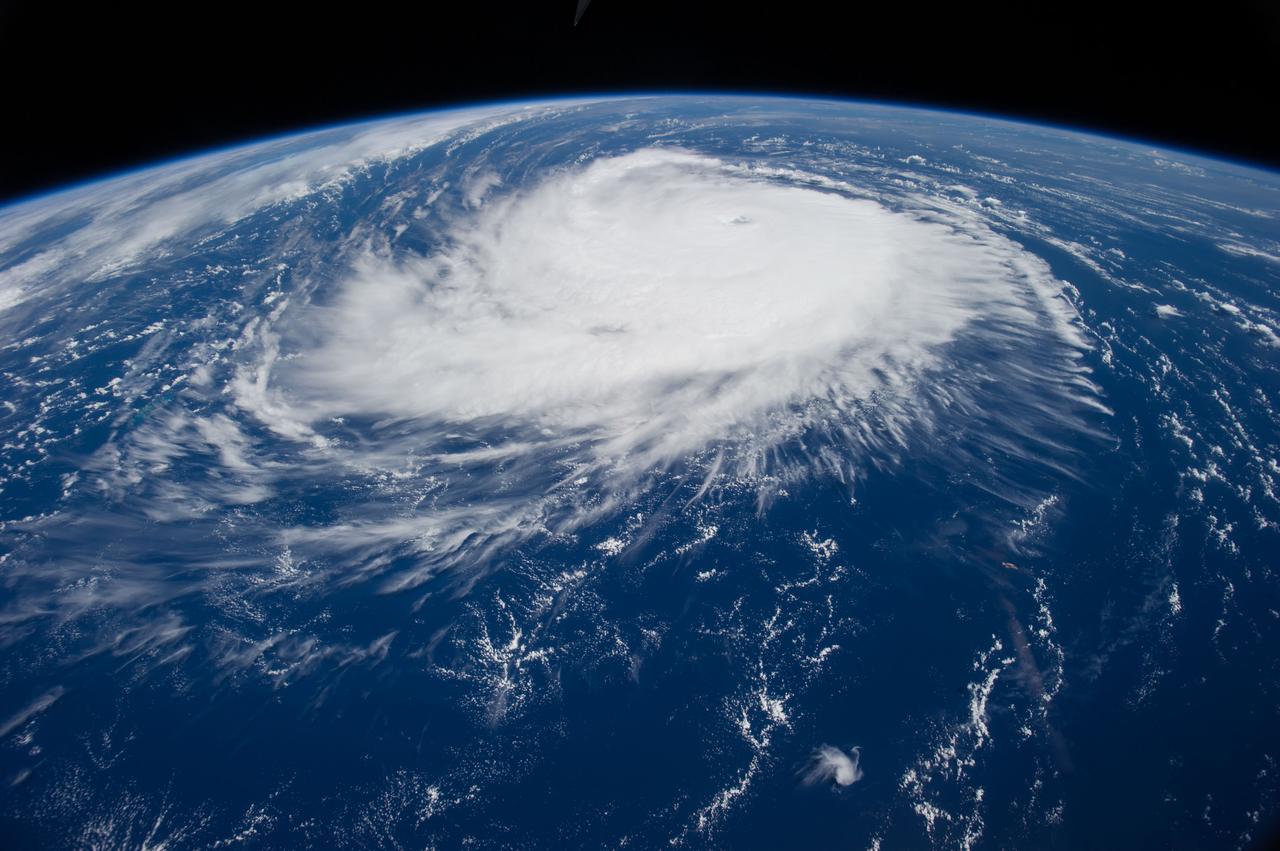
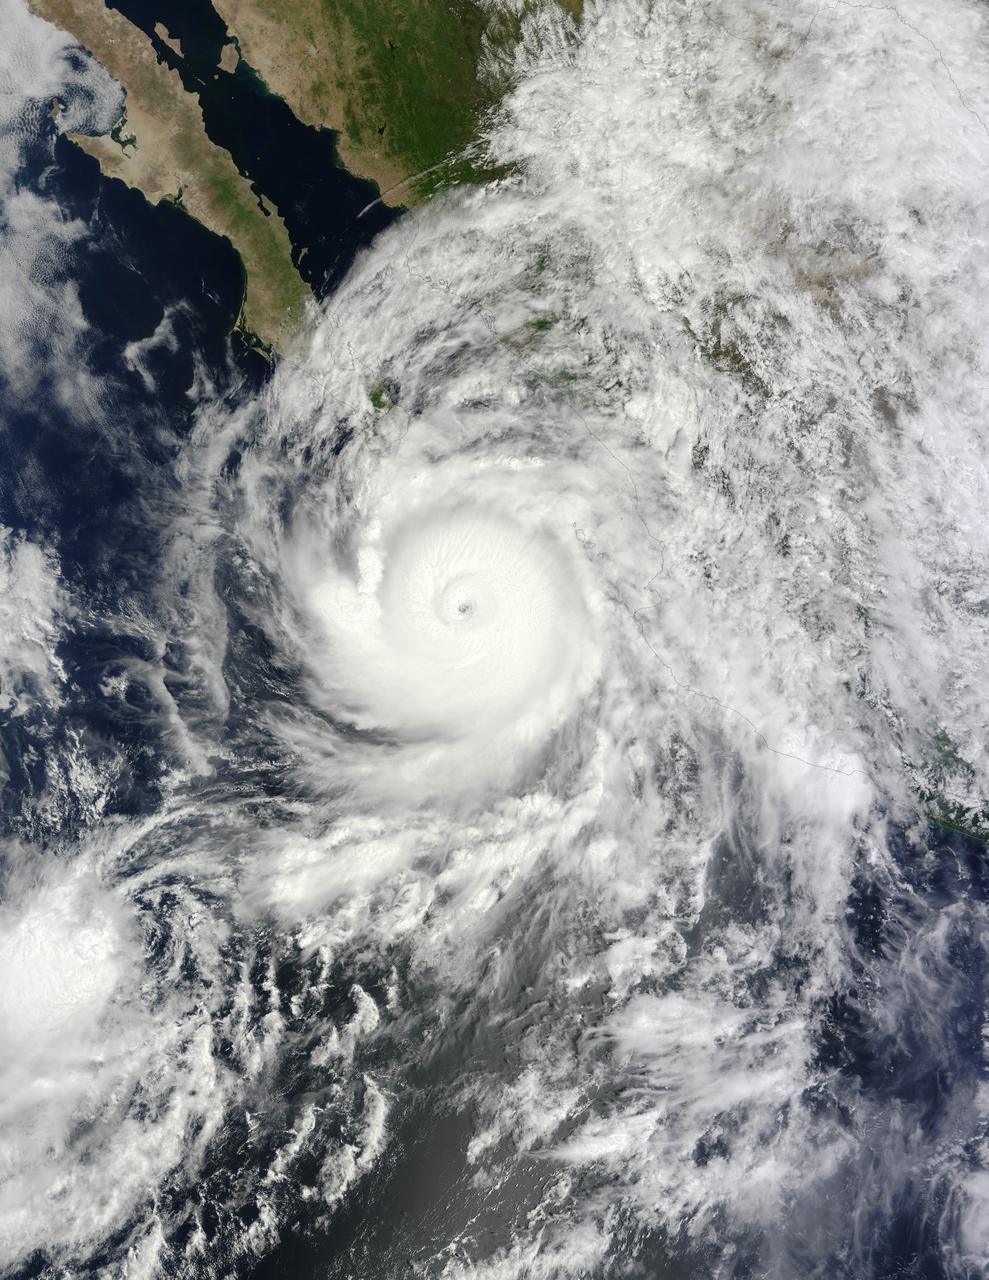
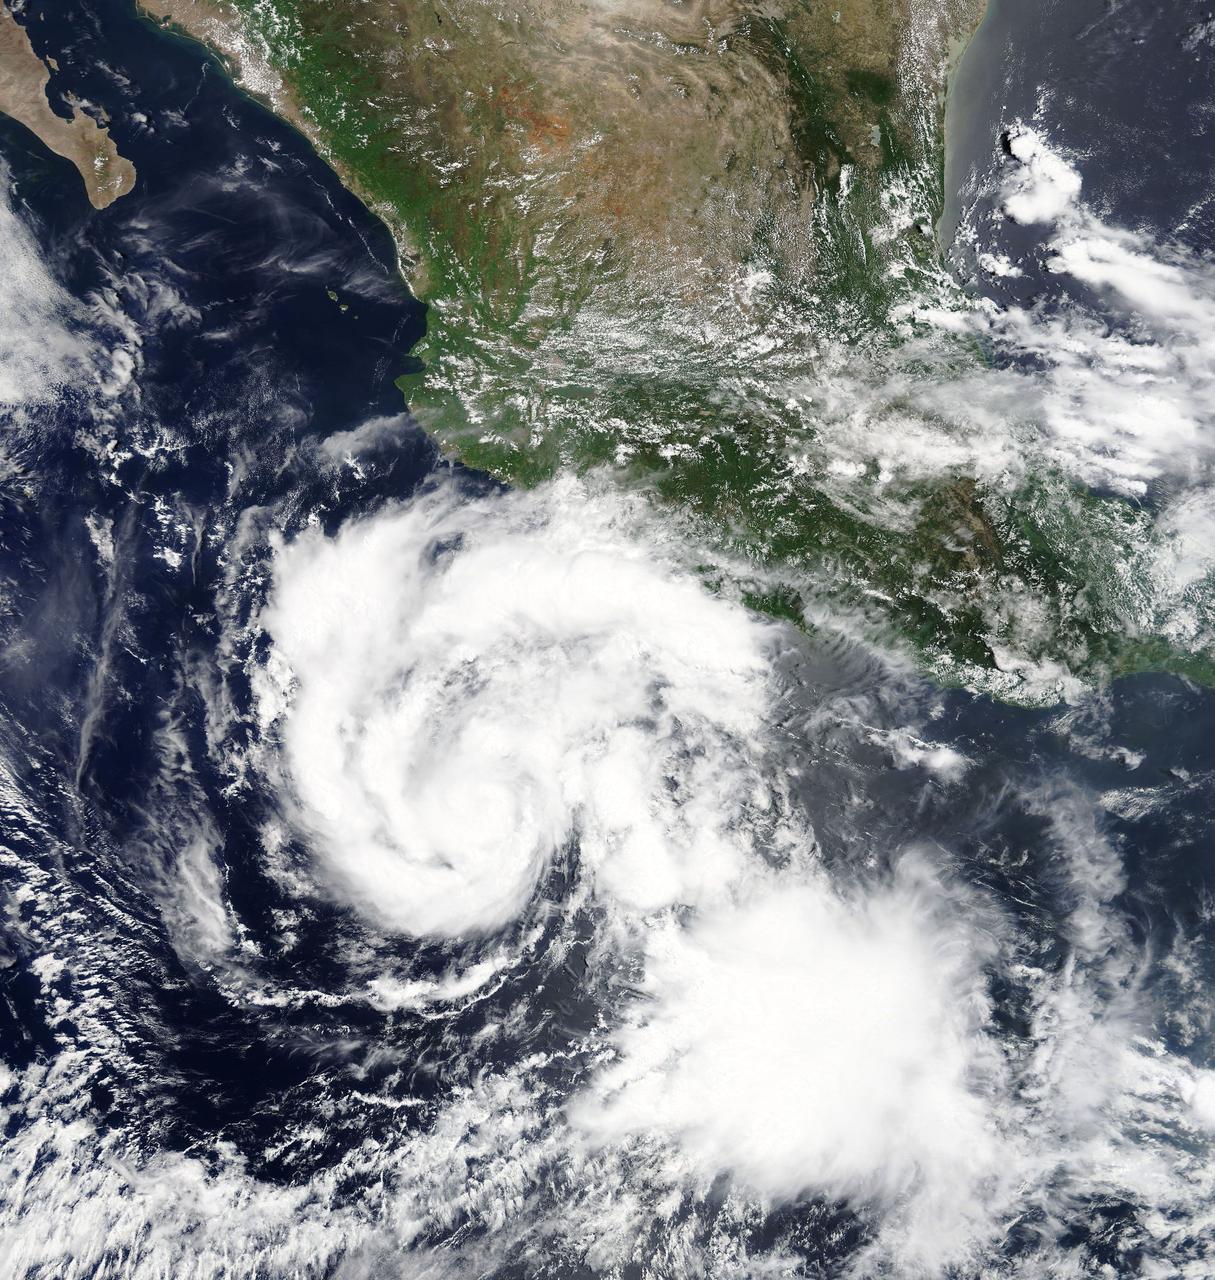
iss063e074380 (Aug. 19, 2020) --- Hurricane Genevieve is pictured off the Pacific coast of Mexico from the International Space Station.
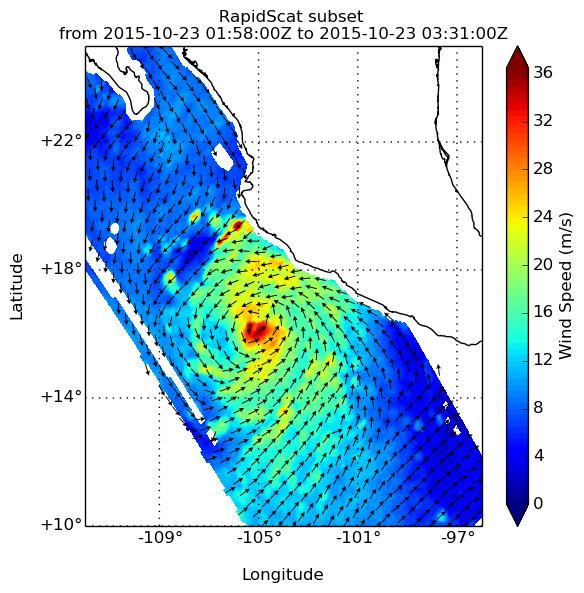
NASA's ISS-RapidScat passed over Hurricane Patricia at about 3:00 AM GMT on Oct. 23, 2015. A Hurricane Warning was in effect from San Blas to Punta San Telmo. A Hurricane Watch was in effect from east of Punta San Telmo to Lazaro Cardenas and a Tropical Storm Warning was in effect from east of Punta San Telmo to Lazaro Cardenas. Patricia was moving toward the north-northwest near 12 mph (19 kph) and a turn toward the north is expected later this morning, followed by a turn toward the north-northeast this afternoon. On the forecast track, the core of Patricia will make landfall in the hurricane warning area today, Oct. 23, 2015, during the afternoon or evening. http://photojournal.jpl.nasa.gov/catalog/PIA20031

This full-disk image from NOAA’s GOES-13 satellite was captured at 14:45 UTC (10:45 a.m. EDT) and shows Hurricane Patricia off the coast of Mexico on September 23, 2015. At 8 a.m. EDT on October 23, 2015, the National Hurricane Center said that Hurricane Patricia had grown into a monster hurricane. In fact, it is the strongest eastern north pacific hurricane on record. At 8 a.m. EDT (1200 UTC) on Oct. 23, the eye of Hurricane Patricia was located near latitude 17.3 North, longitude 105.6 West. That's about 145 miles (235 km) southwest of Manzanillo, Mexico and about 215 miles (345 km) south of Cabo Corrientes, Mexico. Patricia was moving toward the north-northwest near 12 mph (19 kph) and a turn toward the north is expected later this morning, followed by a turn toward the north-northeast this afternoon. On the forecast track, the core of Patricia will make landfall in the hurricane warning area today, October 23, 2015 during the afternoon or evening. Maximum sustained winds remain near 200 mph (325 kph) with higher gusts. The National Hurricane Center (NHC) said that Patricia is a category 5 hurricane on the Saffir-Simpson Hurricane Wind Scale. Some fluctuations in intensity are possible today, but Patricia is expected to remain an extremely dangerous category 5 hurricane through landfall. Hurricane force winds extend outward up to 30 miles (45 km) from the center and tropical storm force winds extend outward up to 175 miles (280 km). The estimated minimum central pressure is 880 millibars. <b><a href="http://www.nasa.gov/audience/formedia/features/MP_Photo_Guidelines.html" rel="nofollow">NASA image use policy.</a></b> <b><a href="http://www.nasa.gov/centers/goddard/home/index.html" rel="nofollow">NASA Goddard Space Flight Center</a></b> enables NASA’s mission through four scientific endeavors: Earth Science, Heliophysics, Solar System Exploration, and Astrophysics. Goddard plays a leading role in NASA’s accomplishments by contributing compelling scientific knowledge to advance the Agency’s mission. <b>Follow us on <a href="http://twitter.com/NASAGoddardPix" rel="nofollow">Twitter</a></b> <b>Like us on <a href="http://www.facebook.com/pages/Greenbelt-MD/NASA-Goddard/395013845897?ref=tsd" rel="nofollow">Facebook</a></b> <b>Find us on <a href="http://instagrid.me/nasagoddard/?vm=grid" rel="nofollow">Instagram</a></b>
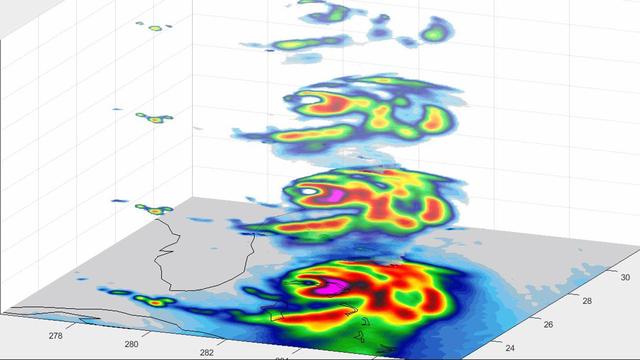
MISR's stereo anaglyph shows a three-dimensional view of Michael and combines two of MISR's nine camera angles. Using 3D red-blue glasses, you can see the 3D effect. Apparent in the 3D stereo anaglyph as well as the height field are a number of bright "clumps." These are groups of strong thunderstorms embedded within the larger circulation of the hurricane. Known as "vortical hot towers" the presence of these features indicates rapid transport of heat energy from the ocean surface into the storm, typically indicative of rapid intensification of the hurricane. In fact, between 11 a.m. and 2 p.m. EDT, while MISR imaged the hurricane, the estimated central pressure dropped 8 hPa and the maximum sustained winds increased about 12 mph (19 kph) and over the next 24 hours Hurricane Michael intensified from a Category 2 to a Category 4 storm. The National Hurricane Center clocked Michael's sustained wind speed at 150 mph (240 kph) just before noon local time on Wednesday. It is expected to bring strong winds, storm surge and heavy rain to much of the southeast. https://photojournal.jpl.nasa.gov/catalog/PIA22748
This image shows Hurricane Lane as viewed by NASA's Multi-angle Imaging SpectroRadiometer (MISR) central, downward-looking camera. These data were captured during Terra orbit 99382. https://photojournal.jpl.nasa.gov/catalog/PIA22494

View of Hurricane Edouard. Photo was taken during Expedition 41.

View of Hurricane Edouard. Photo was taken during Expedition 41.
View of Hurricane Edouard. Photo was taken during Expedition 41.
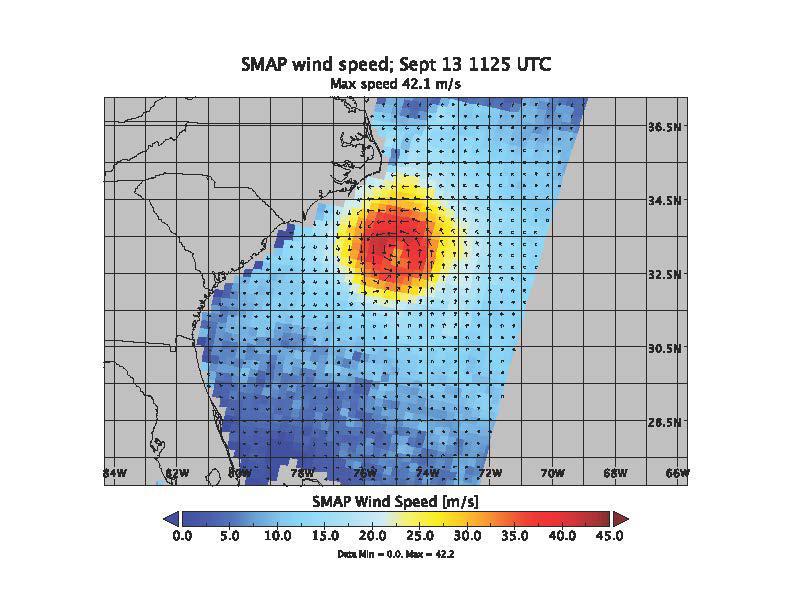
SMAP wind estimates over Hurricane Florence on Sept. 12, 2018 at 10:49 UTC and on Sept. 13, 2018 at 11:25 UTC. We see weakening of the hurricane from the 12th to the 13th; however, the overall size and energy of the storm has increased. The brightness temperatures have been shown to yield unprecedented sensitivity to extreme wind speeds as compared to conventional Ku and C-band scatterometers. https://photojournal.jpl.nasa.gov/catalog/PIA22699
Hurricane Celia as observed by NASA's spaceborne Atmospheric Infrared Sounder (AIRS). This image shows Celia on July 23 in visible light, as you would perceive it from space. Located in the eastern north Pacific Ocean off the coast of Mexico, Celia's winds have now dissipated to highs of 40 mph. Celia was the first hurricane of the eastern north Pacific season. Figure 1 is a daylight snapshot taken on July 19; Celia as tropical storm, winds at 50mph. Figure 2 is a daylight snapshot taken on July 21; Celia has a small eye with an 80-90% closed eyewall; sustained winds at 75mph with gusts reaching 92mph; Celia is upgraded to hurricane status. http://photojournal.jpl.nasa.gov/catalog/PIA00438
At about 10:45 p.m. Mountain Daylight Time (MDT) on September 14, 2014, Hurricane Odile made landfall as a Category 3 storm near Cabo San Lucas, Mexico. According to the U.S. National Hurricane Center, Odile arrived with wind speeds of 110 knots (204 kilometers or 127 miles per hour). The storm tied Olivia (1967) as the strongest hurricane to make landfall in the state of Baja California Sur in the satellite era. The Moderate Resolution Imaging Spectroradiometer (MODIS) on NASA’s Terra satellite acquired this natural-color view of the storm at about noon MDT on September 14, when it was still southeast of the Baja California peninsula. Unisys Weather reported that the Category 4 storm had maximum sustained wind speeds of 115 knots (213 kilometers per hour) at the time. Odile had weakened to a Category 2 hurricane by 6 a.m. MDT on September 15. The storm was expected to continue weakening as it moved up the peninsula and over the area’s rough terrain, according to weather blogger Jeff Masters. Meteorologists noted that while damaging winds posed the biggest threat in the short term, inland areas of the U.S. Southwest could face heavy rainfall by September 16. The rain expected from Odile came one week after the U.S. Southwest experienced flash floods from the remnants of Hurricane Norbert. According to weather and climate blogger Eric Holthaus, those floods did little to relieve the area’s ongoing drought. NASA image by Jeff Schmaltz, LANCE/EOSDIS Rapid Response. Caption by Kathryn Hansen. Instrument(s): Terra - MODIS Read more: <a href="http://earthobservatory.nasa.gov/IOTD/view.php?id=84378&eocn=home&eoci=iotd_title" rel="nofollow">earthobservatory.nasa.gov/IOTD/view.php?id=84378&eocn...</a> <b><a href="http://www.nasa.gov/audience/formedia/features/MP_Photo_Guidelines.html" rel="nofollow">NASA image use policy.</a></b> <b><a href="http://www.nasa.gov/centers/goddard/home/index.html" rel="nofollow">NASA Goddard Space Flight Center</a></b> enables NASA’s mission through four scientific endeavors: Earth Science, Heliophysics, Solar System Exploration, and Astrophysics. Goddard plays a leading role in NASA’s accomplishments by contributing compelling scientific knowledge to advance the Agency’s mission. <b>Follow us on <a href="http://twitter.com/NASAGoddardPix" rel="nofollow">Twitter</a></b> <b>Like us on <a href="http://www.facebook.com/pages/Greenbelt-MD/NASA-Goddard/395013845897?ref=tsd" rel="nofollow">Facebook</a></b> <b>Find us on <a href="http://instagram.com/nasagoddard?vm=grid" rel="nofollow">Instagram</a></b>

NASA's CloudSat satellite flew over Hurricane Maria on Sept. 17, 2017, at 1:23 p.m. EDT (17:23 UTC) as the storm had just strengthened into a hurricane in the Atlantic Ocean. Hurricane Maria contained estimated maximum sustained winds of 75 miles per hour (65 knots) and had a minimum barometric pressure of 986 millibars. CloudSat flew over Maria through the center of the rapidly intensifying storm, directly through an overshooting cloud top (a dome-shaped protrusion that shoots out of the top of the anvil cloud of a thunderstorm). CloudSat reveals the vertical extent of the overshooting cloud top, showing the estimated height of the cloud to be 11 miles (18 kilometers). Areas of high reflectivity with deep red and pink colors extend well above 9 miles (15 kilometers) in height, showing large amounts of water being drawn upward high into the atmosphere. A movie is available at https://photojournal.jpl.nasa.gov/catalog/PIA21961
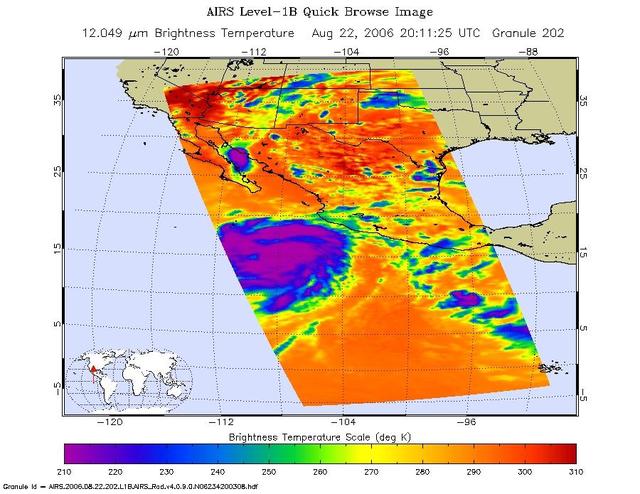
This is an infrared image of Hurricane Ileana in the Eastern Pacific, from the Atmospheric Infrared Sounder (AIRS) on NASA's Aqua satellite on August 22, 2006. This AIRS image shows the temperature of the cloud tops or the surface of the Earth in cloud-free regions. The lowest temperatures (in purple) are associated with high, cold cloud tops that make up the top of the storm. The infrared signal does not penetrate through clouds. Where there are no clouds the AIRS instrument reads the infrared signal from the surface of the Earth, revealing warmer temperatures (red). http://photojournal.jpl.nasa.gov/catalog/PIA00509
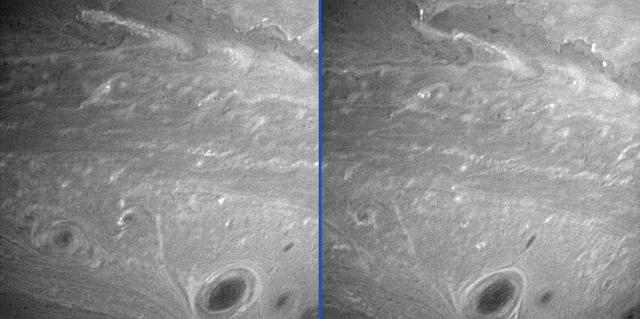
Saturn Anti-Hurricanes
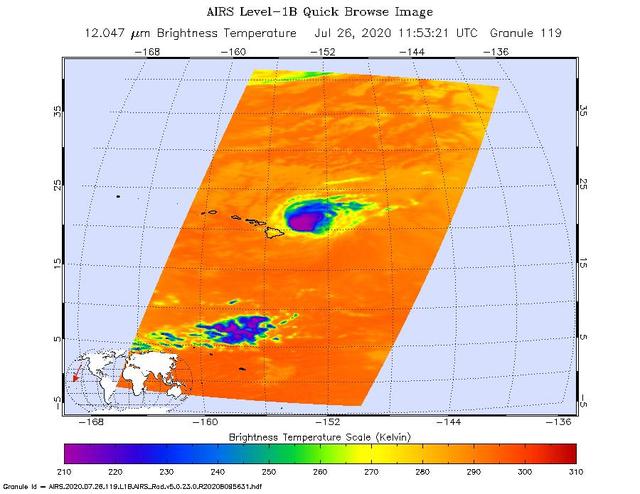
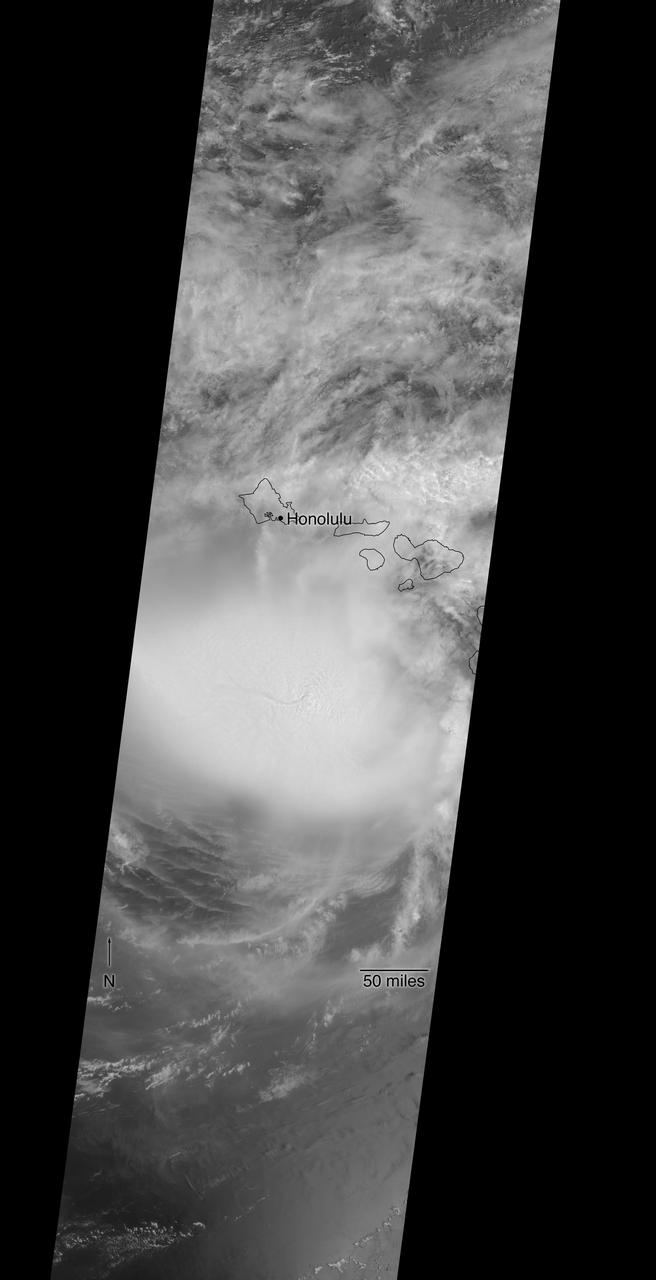
NASA's Atmospheric Infrared Sounder (AIRS) was monitoring Hurricane Douglas as it took aim at the Hawaiian Islands on July 26. Perched on NASA's Aqua satellite, AIRS is an instrument that studies Earth's weather and climate. As of 11 a.m. local time, Douglas was sweeping toward Hawaii with the potential to directly hit portions of the islands, from Maui to Kauai, in the late afternoon or evening. The purple areas in the AIRS image — taken at 1:53 a.m. local time on July 26 — indicate very cold clouds high in the atmosphere generally linked to heavy rainfall. Warmer clouds closer to Earth's surface show up as green and blue, and orange areas indicate cloud-free parts of the sky. The Category 1 hurricane was packing maximum sustained winds of 85 mph (140 kph) on the morning of July 26. Douglas' storm surge is forecast to push water levels as high as 3 feet (0.9 meters) above normal tides. The storm could dump as much as 15 inches (38 centimeters) of rain onto isolated parts of the Hawaiian Islands. https://photojournal.jpl.nasa.gov/catalog/PIA23785
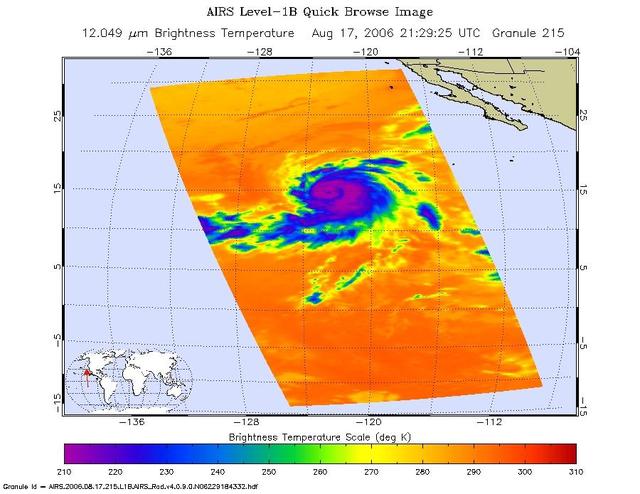
Infrared, microwave, and visible/near-infrared images of Hurricane Hector in the eastern Pacific were created with data from the Atmospheric Infrared Sounder (AIRS) on NASA's Aqua satellite on August 17, 2006. The infrared AIRS image shows the temperature of the cloud tops or the surface of the Earth in cloud-free regions. The lowest temperatures (in purple) are associated with high, cold cloud tops that make up the top of the hurricane. The infrared signal does not penetrate through clouds. Where there are no clouds the AIRS instrument reads the infrared signal from the surface of the Earth, revealing warmer temperatures (red). At the time the data were taken from which these images were made, Hector is a well organized storm, with the strongest convection in the SE quadrant. The increasing vertical wind shear in the NW quadrant is appearing to have an effect. Maximum sustained winds are at 85 kt, gusts to 105 kt. Estimated minimum central pressure is 975 mbar. The microwave image is created from microwave radiation emitted by Earth's atmosphere and received by the instrument. It shows where the heaviest rainfall is taking place (in blue) in the storm. Blue areas outside of the storm where there are either some clouds or no clouds, indicate where the sea surface shines through. The "visible" image is created from data acquired by the visible light/near-infrared sensor on the AIRS instrument. http://photojournal.jpl.nasa.gov/catalog/PIA00507
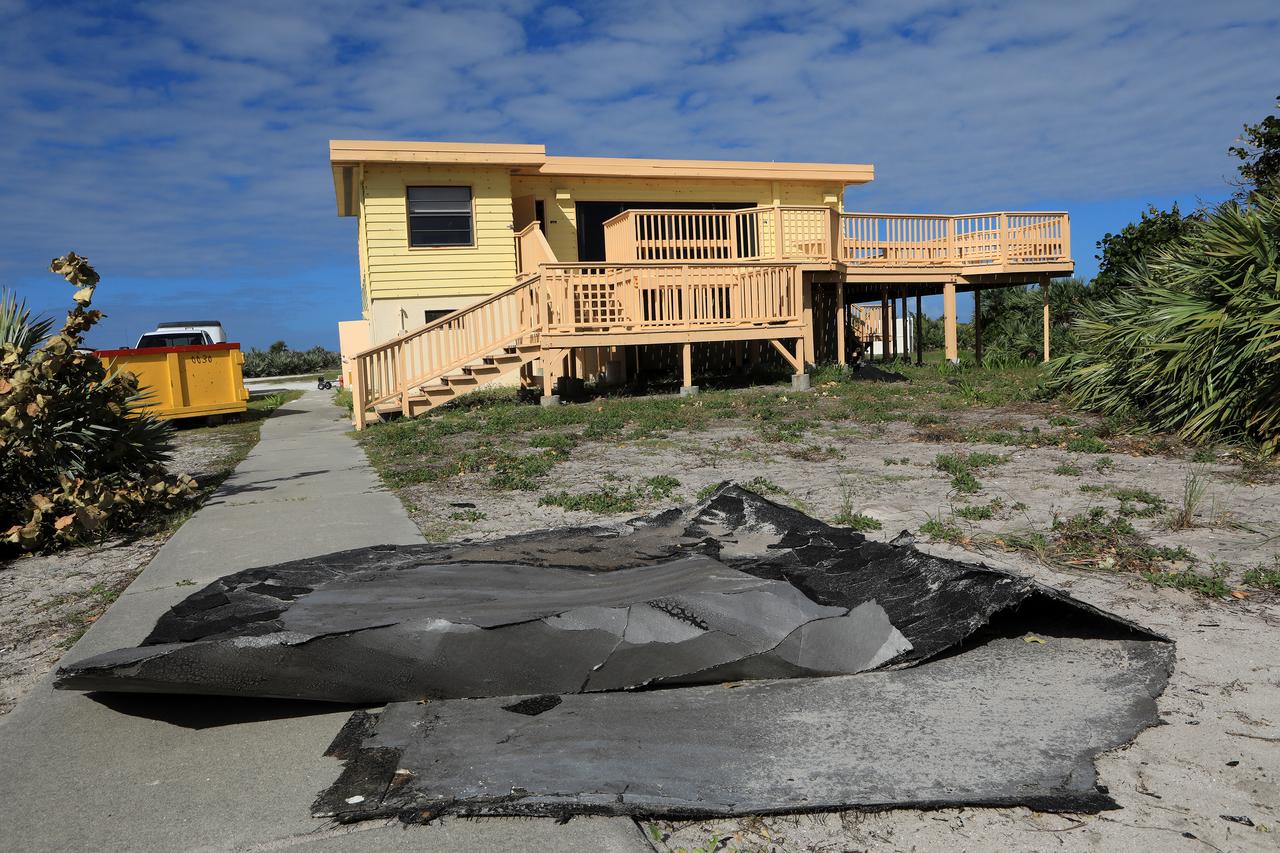
Roofing materials, blown loose by Hurricane Matthew, lie on the ground behind the Beach House at NASA’s Kennedy Space Center in Florida. Members of the Disaster Assessment and Recovery Team (DART) are working on repairs to the facility following Hurricane Matthew, which passed to the east of Kennedy on Oct. 6 and 7, 2016. The center received some isolated roof damage, damaged support buildings, a few downed power lines, and limited water intrusion. Beach erosion also occurred, although the storm surge was less than expected.
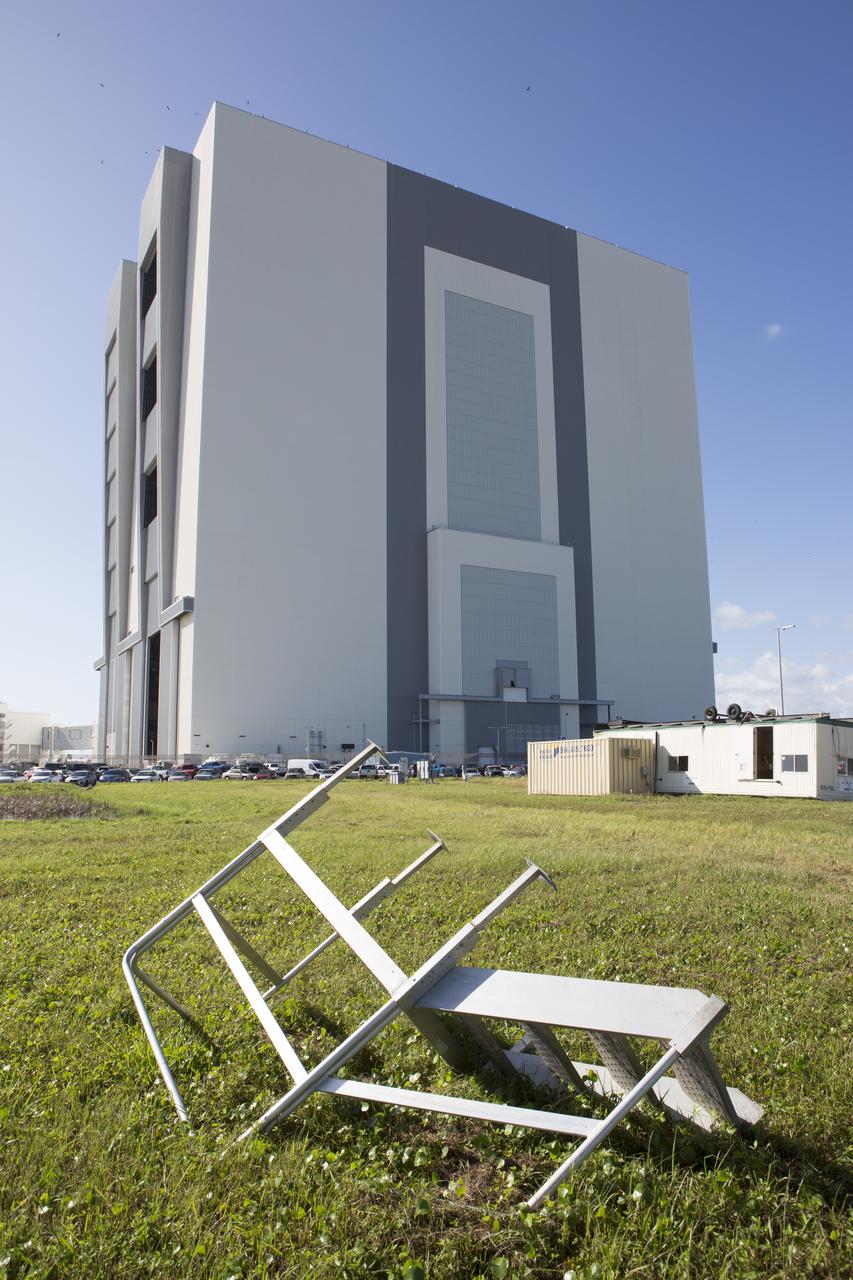
A small staircase, toppled and relocated by Hurricane Matthew, is seen in front of the Vehicle Assembly Building at NASA's Kennedy Space Center in Florida. Assessments and repairs are in progress at various structures and facilities across the spaceport, part of the ongoing recovery from Hurricane Matthew, which passed to the east of Kennedy on Oct. 6 and 7, 2016. The center received some isolated roof damage, damaged support buildings, a few downed power lines, and limited water intrusion. Beach erosion also occurred, although the storm surge was less than expected.
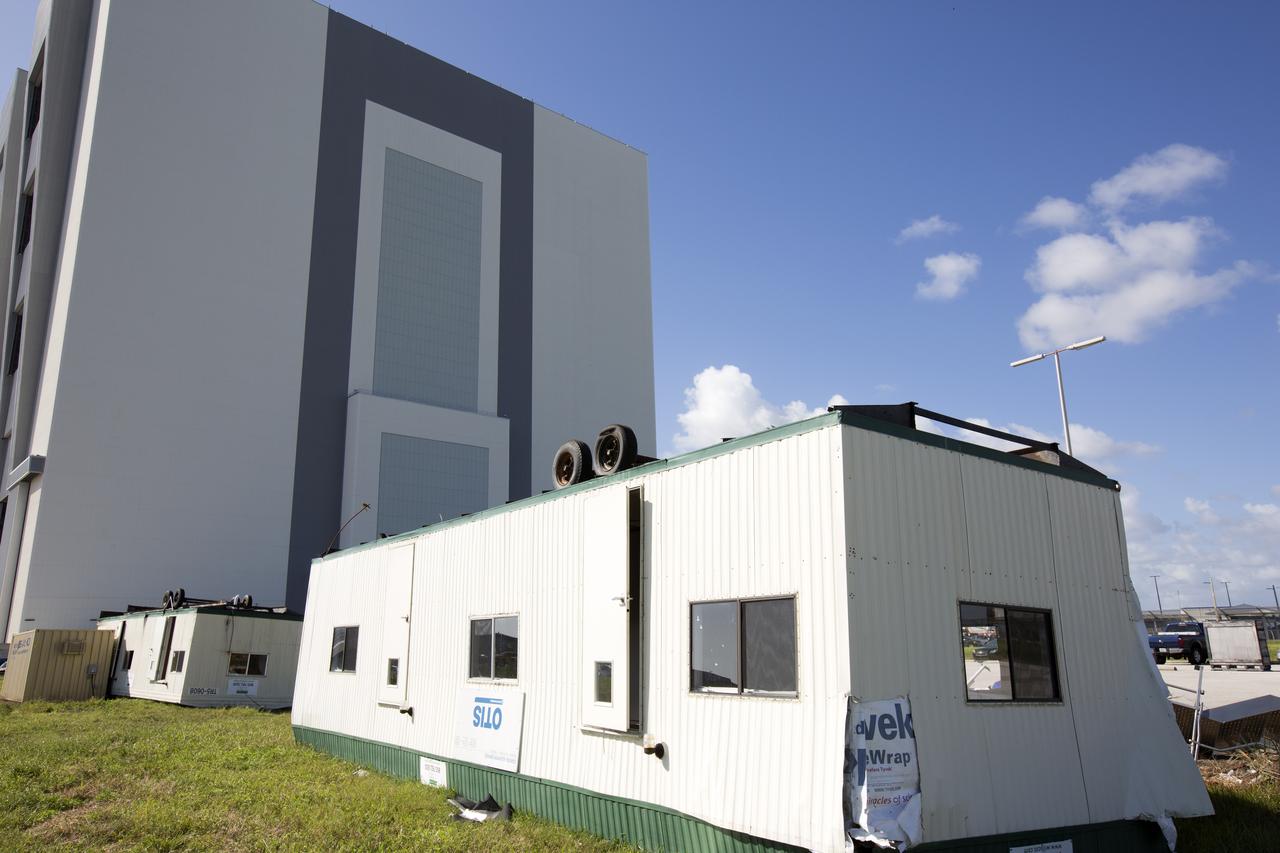
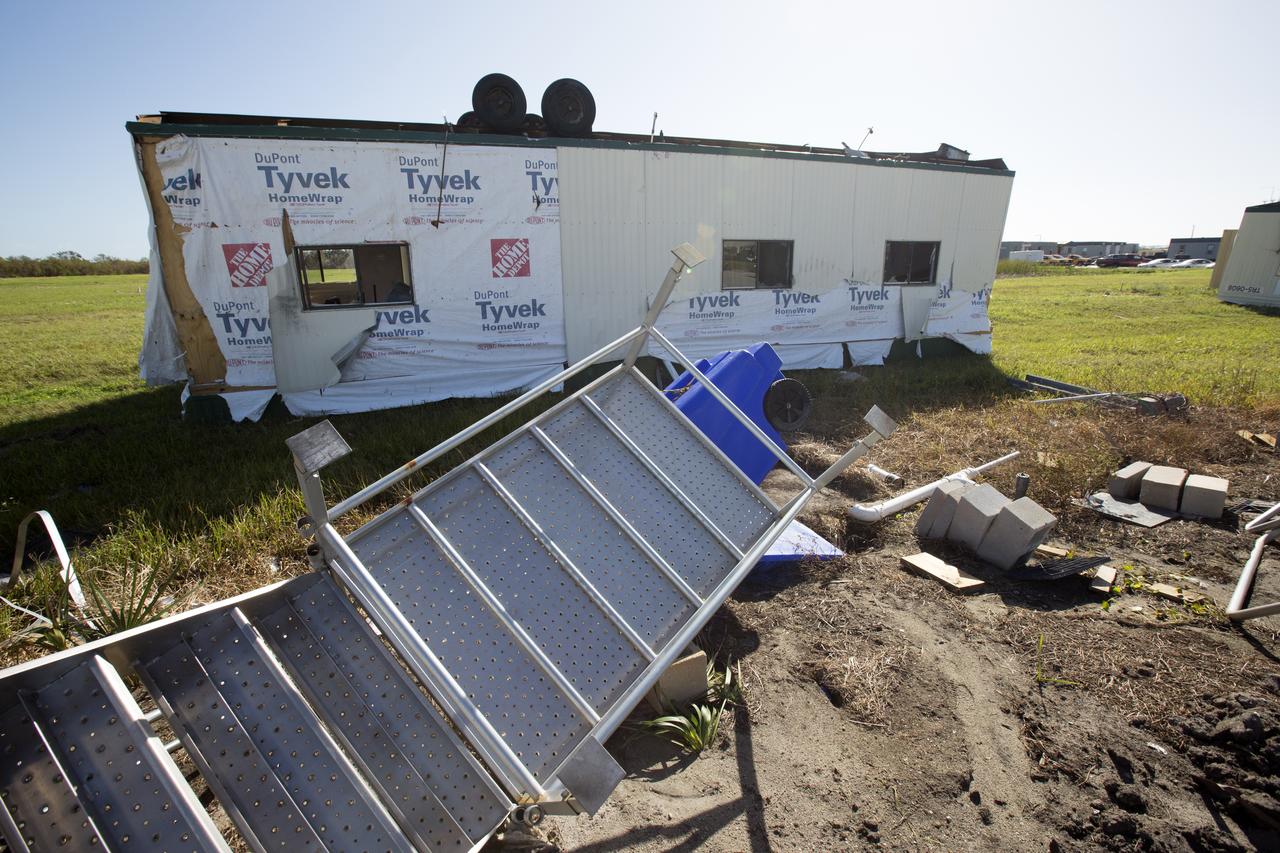
A construction trailer damaged by Hurricane Matthew is seen in the Launch Complex 39 area at NASA's Kennedy Space Center in Florida. Assessments and repairs are in progress at various structures and facilities across the spaceport, part of the ongoing recovery from Hurricane Matthew, which passed to the east of Kennedy on Oct. 6 and 7, 2016. The center received some isolated roof damage, damaged support buildings, a few downed power lines, and limited water intrusion. Beach erosion also occurred, although the storm surge was less than expected.
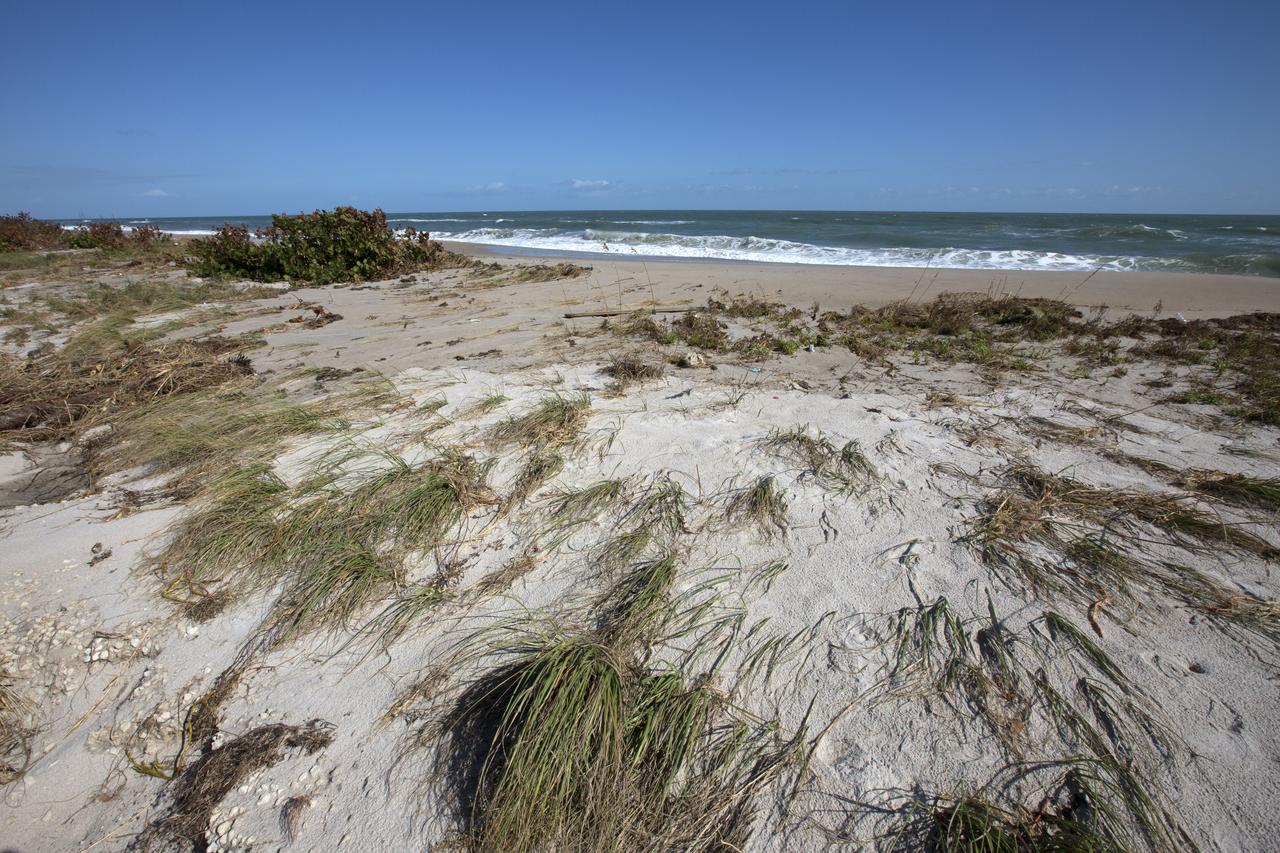
Beach erosion caused by Hurricane Matthew is visible along the Atlantic shoreline at NASA’s Kennedy Space Center in Florida. Although some sections of shoreline suffered erosion, recently restored portions of beach fared well. Hurricane Matthew, a Category 3 storm, passed to the east of Kennedy on Oct. 6 and 7, 2016. The center received some isolated roof damage, damaged support buildings, a few downed power lines, and limited water intrusion.
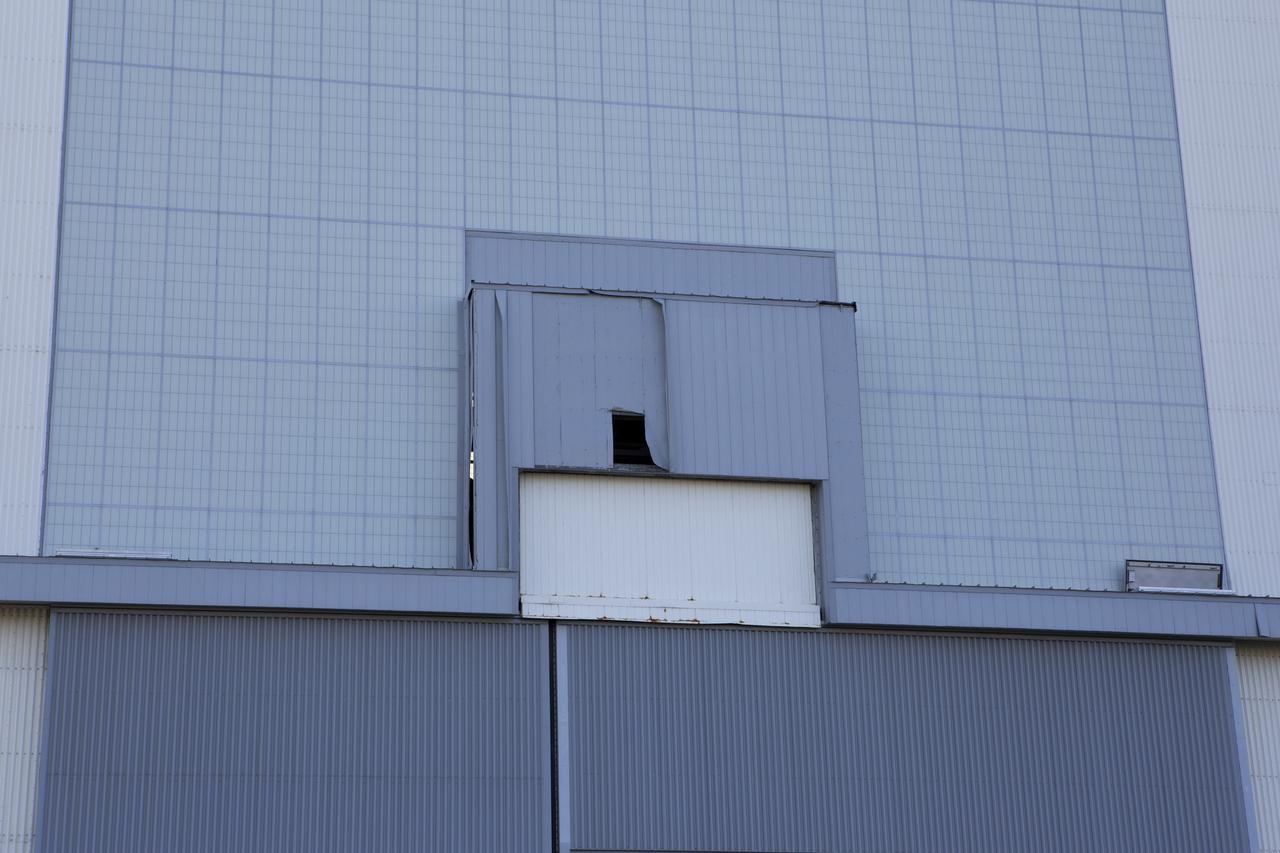
A hole caused by Hurricane Matthew is visible in a section of door on the Vehicle Assembly Building at NASA's Kennedy Space Center in Florida. Assessments and repairs are in progress at various structures and facilities across the spaceport, part of the ongoing recovery from Hurricane Matthew, which passed to the east of Kennedy on Oct. 6 and 7, 2016. The center received some isolated roof damage, damaged support buildings, a few downed power lines, and limited water intrusion. Beach erosion also occurred, although the storm surge was less than expected.
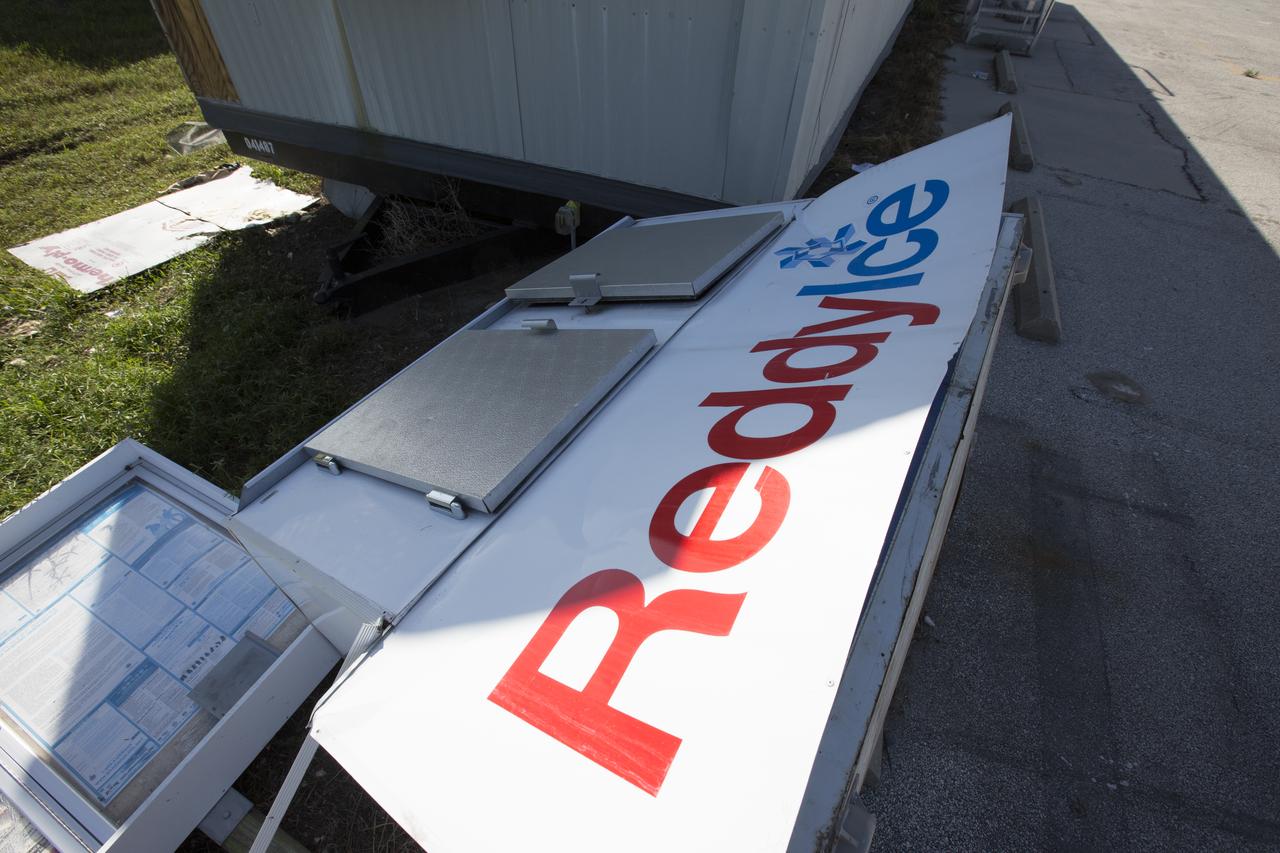
An ice dispenser damaged by Hurricane Matthew is seen in the Launch Complex 39 area at NASA's Kennedy Space Center in Florida. Assessments and repairs are in progress at various structures and facilities across the spaceport, part of the ongoing recovery from Hurricane Matthew, which passed to the east of Kennedy on Oct. 6 and 7, 2016. The center received some isolated roof damage, damaged support buildings, a few downed power lines, and limited water intrusion. Beach erosion also occurred, although the storm surge was less than expected.
A construction trailer damaged by Hurricane Matthew is seen in the Launch Complex 39 area at NASA's Kennedy Space Center in Florida. Assessments and repairs are in progress at various structures and facilities across the spaceport, part of the ongoing recovery from Hurricane Matthew, which passed to the east of Kennedy on Oct. 6 and 7, 2016. The center received some isolated roof damage, damaged support buildings, a few downed power lines, and limited water intrusion. Beach erosion also occurred, although the storm surge was less than expected.
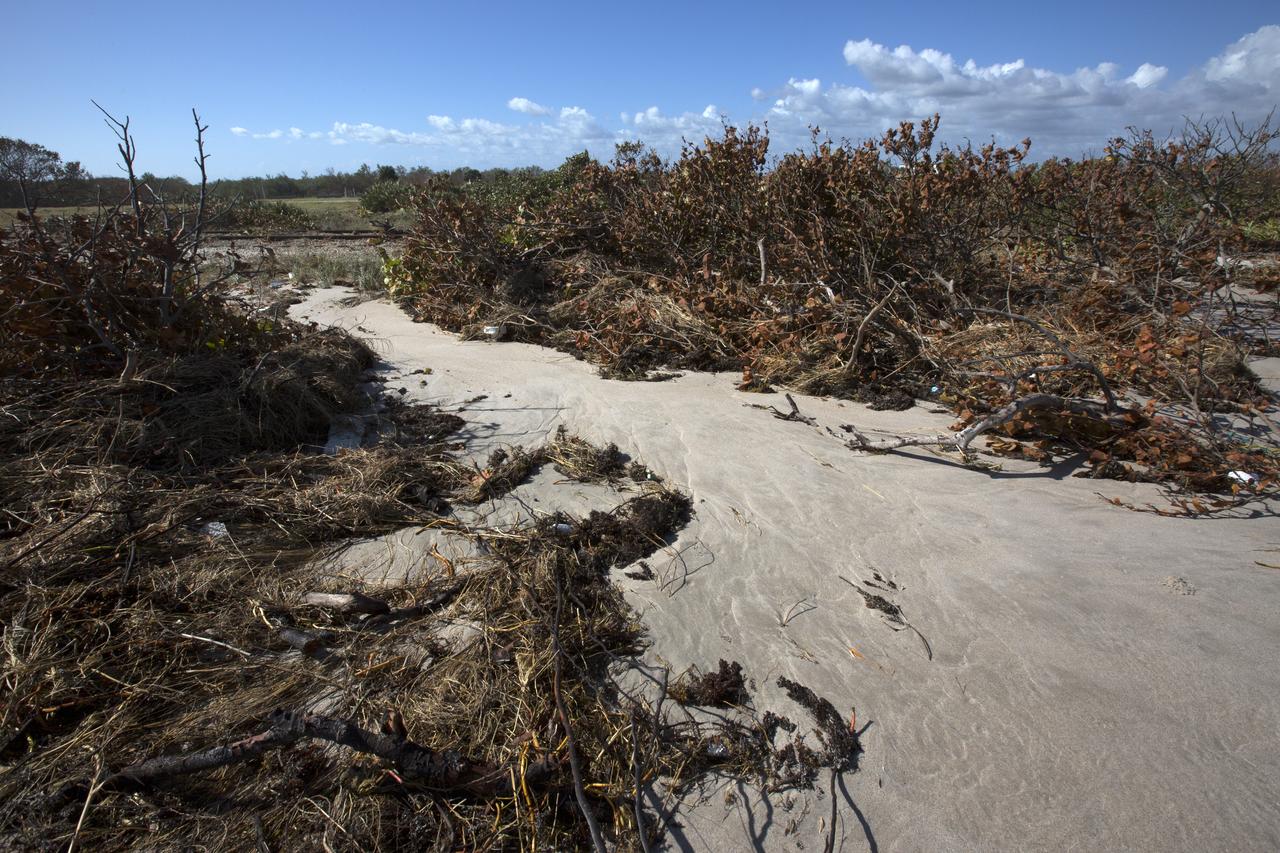
Plant debris caused by Hurricane Matthew is strewn across the dune line along the Atlantic shoreline at NASA’s Kennedy Space Center in Florida. Although some sections of shoreline suffered erosion, recently restored portions of beach fared well. Hurricane Matthew, a Category 3 storm, passed to the east of Kennedy on Oct. 6 and 7, 2016. The center received some isolated roof damage, damaged support buildings, a few downed power lines, and limited water intrusion.
A construction trailer damaged by Hurricane Matthew is seen in the Launch Complex 39 area at NASA's Kennedy Space Center in Florida. Assessments and repairs are in progress at various structures and facilities across the spaceport, part of the ongoing recovery from Hurricane Matthew, which passed to the east of Kennedy on Oct. 6 and 7, 2016. The center received some isolated roof damage, damaged support buildings, a few downed power lines, and limited water intrusion. Beach erosion also occurred, although the storm surge was less than expected.
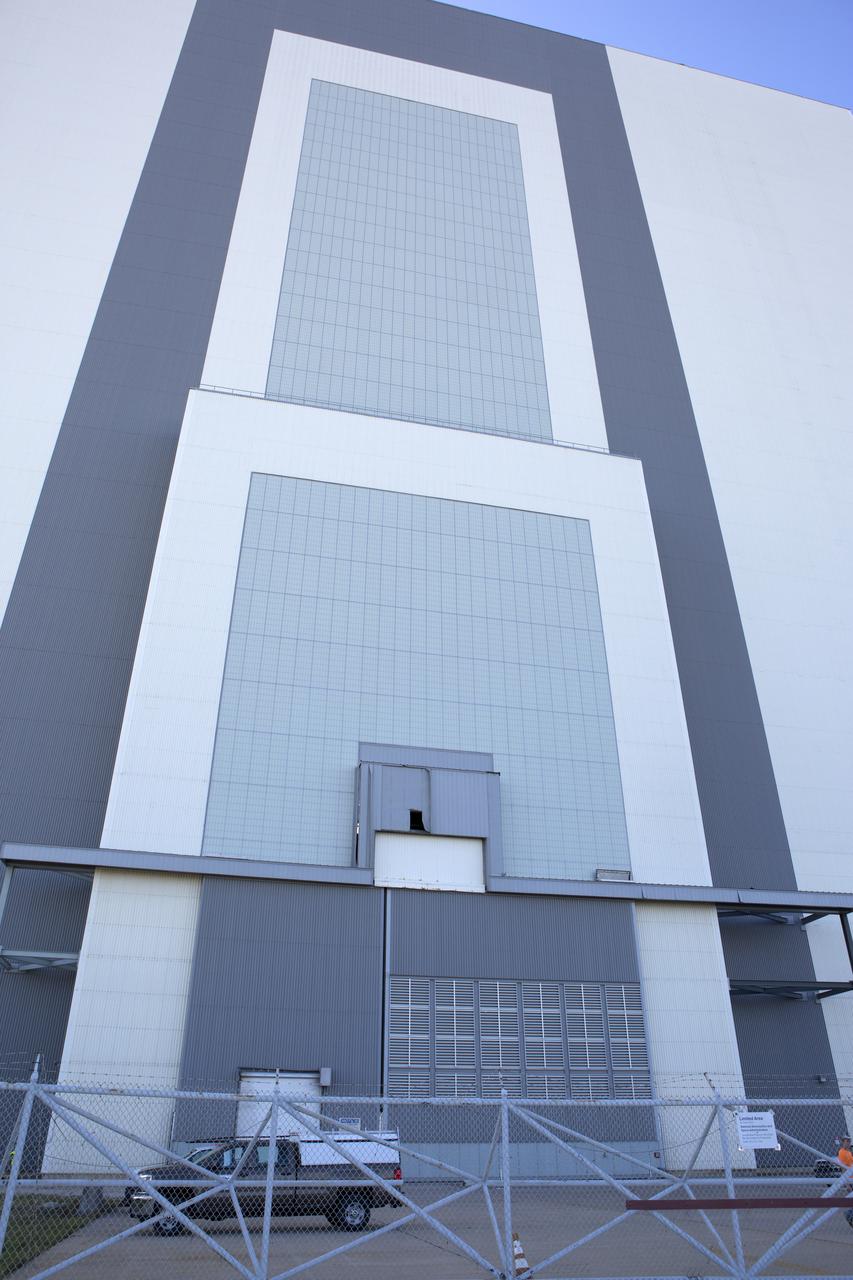
A hole caused by Hurricane Matthew is visible in a section of door on the Vehicle Assembly Building at NASA's Kennedy Space Center in Florida. Assessments and repairs are in progress at various structures and facilities across the spaceport, part of the ongoing recovery from Hurricane Matthew, which passed to the east of Kennedy on Oct. 6 and 7, 2016. The center received some isolated roof damage, damaged support buildings, a few downed power lines, and limited water intrusion. Beach erosion also occurred, although the storm surge was less than expected.

Roofing materials, blown loose by Hurricane Matthew, are visible on the ground below the deck of the Beach House at NASA’s Kennedy Space Center in Florida. Members of the Disaster Assessment and Recovery Team (DART) are working on repairs to the facility following Hurricane Matthew, which passed to the east of Kennedy on Oct. 6 and 7, 2016. The center received some isolated roof damage, damaged support buildings, a few downed power lines, and limited water intrusion. Beach erosion also occurred, although the storm surge was less than expected.
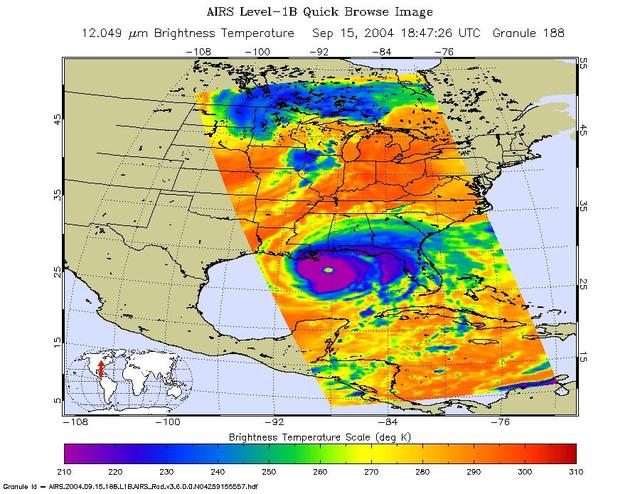
Hurricane Ivan is the most powerful hurricane to hit the Caribbean in 10 years. On September 7 and 8 it damaged 90 percent of the homes in Grenada and killed at least 16 people as it swept over Grenada, Barbados and the other islands in the area. By Thursday morning on September 9, Ivan's sustained winds reached 160 mph making it a rare category 5 hurricane on the Saffir-Simpson scale. By Monday September 13, Ivan is blamed for 67 deaths and skirts western Cuba with winds clocked at 156 mph. The National Hurricane Center predicted the eye of Ivan will make landfall across Mobile Bay in Alabama late Wednesday or early Thursday. These images of Hurricane Ivan were acquired by the AIRS infrared, microwave, and visible sensors on September 15 at 1:30 pm local time as the storm moves in to Alabama. Ivan at category 4 strength is about 150 miles south of Mobile, Alabama and is moving north at 14 mph. Maximum sustained winds are reported to be at 135 mph and extend 105 miles from the center, while tropical storm-force winds extend 290 miles from the center. Ivan pounded the Gulf coast all day Wednesday, and is expected to make landfall between midnight and 3am in Mobile Bay, Alabama. This image shows how the storm looks through an AIRS Infrared window channel, and reveals a very large eye - about 75 km (50 miles) across. Window channels measure the temperature of the cloud tops or the surface of the Earth in cloud-free regions. The lowest temperatures are associated with high, cold cloud tops that make up the top of the hurricane. The infrared signal does not penetrate through clouds, so the purple color indicates the cool cloud tops of the storm. In cloud-free areas, the infrared signal is retrieved at the Earth's surface, revealing warmer temperatures. Cooler areas are pushing to purple and warmer areas are pushing to red. http://photojournal.jpl.nasa.gov/catalog/PIA00431
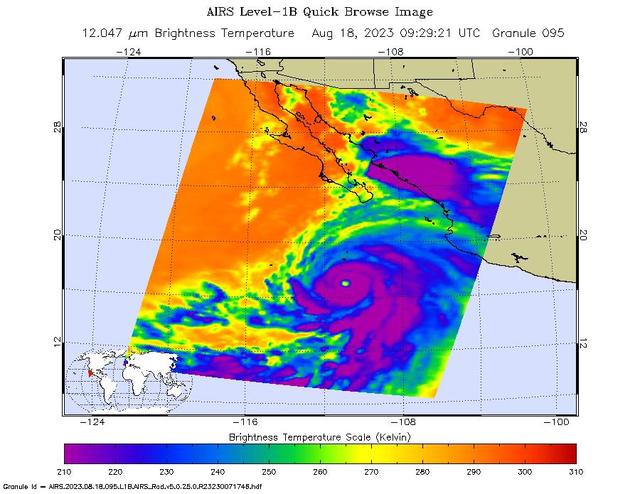
NASA's Atmospheric Infrared Sounder (AIRS) captured Hurricane Hilary on the morning of Aug. 18, 2023, when it was a Category 4 storm roughly 470 miles (760 kilometers) south of Baja California. Hilary could be the first tropical storm to make landfall in California since 1939, according to the National Weather Service. Hilary grew from a tropical storm into a Category 2 hurricane within 24 hours on Aug. 17. Another period of rapid intensification – an increase in maximum sustained wind speed of at least 30 knots (35 mph) within 24 hours – occurred Aug. 17-18. The animation shows some of this rapid growth, with images taken by AIRS Aug. 15-18. This intensification was driven by very warm ocean surface waters and weak wind shear, a term for vertical changes in wind speed. Strong wind shear can keep hurricanes from forming, or can tear them apart. AIRS measures cloud temperatures in infrared wavelengths, which can reveal information about the atmosphere not visible to the human eye. Hilary shows several indicators of a powerful hurricane: a well-defined eye surrounded by a ring of very cold clouds in purple, with warmer outer regions seen in yellows and oranges. Purple and violet areas are colder, between about minus 82 degrees Fahrenheit and minus 46 F (minus 63 degrees Celsius to minus 44 C). Blue and green regions are roughly minus 28 F to 26 F (minus 33 C to minus 3 C). The cooler parts of the clouds are associated with very heavy rainfall. Most hurricanes in the Pacific Ocean off Mexico travel westward, following tropical trade winds. Occasionally, one of these storms will head northward. Hurricane Hilary is being steered by a weak low-pressure system off the coast of California, an area normally dominated by high pressure and an atmospheric circulation pattern that would deflect storms from the region. The current forecast from the National Hurricane Center has Hilary closely following the western coastline of the Baja California peninsula, weakening as it moves north. Rainfall projections for Southern California range from 2 inches (5 centimeters) in coastal areas to 8 or more inches (20 or more centimeters) in local mountains. For comparison, San Diego and Los Angeles receive no rain in August most years, and the wettest parts of the local mountains receive about 1 inch (3 centimeters) of rain over a normal summer. In conjunction with the Advanced Microwave Sounding Unit (AMSU), AIRS senses emitted infrared and microwave radiation from Earth to provide a 3D look at the planet's weather and climate. Working in tandem, the two instruments make simultaneous observations down to Earth's surface. With more than 2,000 channels sensing different regions of the atmosphere, the system creates a global, 3D map of atmospheric temperature and humidity, cloud amounts and heights, greenhouse gas concentrations, and many other atmospheric phenomena. Launched into Earth orbit in 2002 aboard NASA's Aqua spacecraft, the AIRS and AMSU instruments are managed by NASA's Jet Propulsion Laboratory in Southern California, under contract to NASA. JPL is a division of Caltech. Animation available at https://photojournal.jpl.nasa.gov/catalog/PIA25779
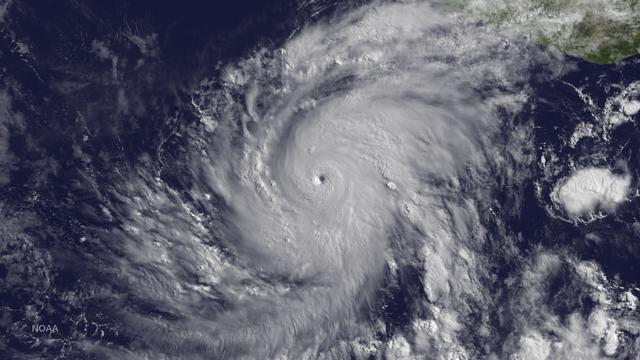
Blanca has rapidly intensified with an increase in wind speed of 60 knots since 1200Z on June 2. The hurricane has developed a distinct pinhole eye in visible images surrounded by very deep convection. There is an opportunity for Blanca to intensify further since the hurricane is located within an ideal environment of low shear and high ocean heat content. Beyond 48 hours, the hurricane will encounter lower SSTs and a gradual weakening should begin. During the next 24 hours, the hurricane should begin a northwestward track with some increase in forward speed becoming a potential threat to Baja California in a few days. This image was taken by GOES East at 1445Z on June 3, 2015. Credit: <a href="http://svs.gsfc.nasa.gov/index.html" rel="nofollow">NASA/Goddard Space Flight Center Scientific Visualization Studio</a> <b><a href="http://www.nasa.gov/audience/formedia/features/MP_Photo_Guidelines.html" rel="nofollow">NASA image use policy.</a></b> <b><a href="http://www.nasa.gov/centers/goddard/home/index.html" rel="nofollow">NASA Goddard Space Flight Center</a></b> enables NASA’s mission through four scientific endeavors: Earth Science, Heliophysics, Solar System Exploration, and Astrophysics. Goddard plays a leading role in NASA’s accomplishments by contributing compelling scientific knowledge to advance the Agency’s mission. <b>Follow us on <a href="http://twitter.com/NASAGoddardPix" rel="nofollow">Twitter</a></b> <b>Like us on <a href="http://www.facebook.com/pages/Greenbelt-MD/NASA-Goddard/395013845897?ref=tsd" rel="nofollow">Facebook</a></b> <b>Find us on <a href="http://instagrid.me/nasagoddard/?vm=grid" rel="nofollow">Instagram</a></b>
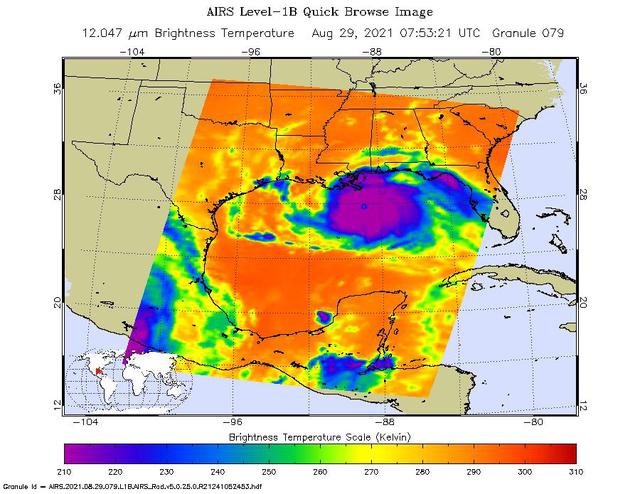
NASA's Atmospheric Infrared Sounder (AIRS), aboard the Aqua satellite, caught views of Hurricane Ida as the high-end Category 4 storm swept ashore around noon local time on Aug. 29, 2021, near Port Fourchon, Louisiana. One snapshot showed the hurricane around 3 a.m. that day while it was still over the Gulf of Mexico. The second view (Figure 1) caught the storm around 1:45 p.m. local time. In the infrared AIRS imagery, purple areas indicate very cold clouds carried high into the atmosphere by towering thunderstorms. These regions are also associated with heavy rainfall. Blue and green indicate warmer areas with shallower rain clouds. The orange and red areas represent mostly cloud-free air. The eye of the hurricane is seen just over the Louisiana coast as a small blue-green area in the middle of the large patch of purple in the after-landfall image. AIRS, in conjunction with the Advanced Microwave Sounding Unit (AMSU), senses emitted infrared and microwave radiation from Earth to provide a three-dimensional look at the planet's weather and climate. Working in tandem, the two instruments make simultaneous observations down to Earth's surface. With more than 2,000 channels sensing different regions of the atmosphere, the system creates a global, three-dimensional map of atmospheric temperature and humidity, cloud amounts and heights, greenhouse gas concentrations, and many other atmospheric phenomena. Launched into Earth orbit in 2002 aboard NASA's Aqua spacecraft, the AIRS and AMSU instruments are managed by NASA's Jet Propulsion Laboratory in Southern California, under contract to NASA. JPL is a division of Caltech. https://photojournal.jpl.nasa.gov/catalog/PIA24538
Hilary is a small but strengthening hurricane, with hurricane-force winds extending outward up to 10 miles (20 km) from the center. Tropical-storm-force winds extending outward up to 60 miles (95 km). Hilary began when Tropical Depression 9E formed on July 21. By July 22 at 11 p.m. EDT, the depression strengthened into a tropical storm and was re-named Hilary. At 5 a.m. EDT on Monday, July 24, 2017, Hilary rapidly intensified into a hurricane. NASA's Moderate Resolution Imaging Spectroradiometer, or MODIS, instrument aboard NASA’s Terra satellite captured a true color image of Hurricane Hilary on July 24 at 11 a.m. EDT. The image revealed a better organized tropical cyclone. The National Hurricane Center (NHC) noted "Satellite images indicate that Hilary has a small central core of convection, with both the visible and infrared channels suggesting that an eye is trying to form. Microwave data also show an incomplete eyewall." At 11 a.m. EDT (1500 UTC), the center of Hurricane Hilary was located near 14.1 degrees north latitude and 104.2 degrees west longitude. That's about 340 miles (545 km) south of Manzanillo, Mexico. Hilary is moving toward the west-northwest near 8 mph (13 kph), and the National Hurricane Center said this general motion with some increase in forward speed is expected over the next 48 hours. Maximum sustained winds have increased to near 80 mph (130 kph) with higher gusts. The estimated minimum central pressure is 989 millibars. The National Hurricane Center expects Hilary to become a major hurricane on Tuesday, July 25. For updated forecasts, visit: <a href="http://www.nhc.noaa.gov" rel="nofollow">www.nhc.noaa.gov</a>.
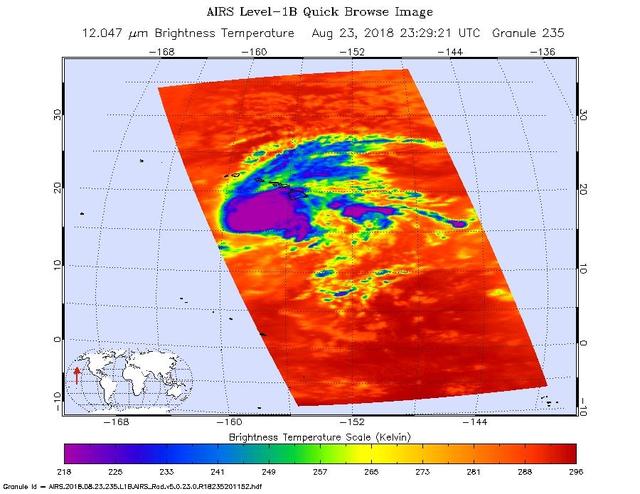
This image shows Hurricane Lane as observed by the Atmospheric Infrared Sounder (AIRS) instrument on NASA's Aqua satellite on Thursday, Aug. 23, 2018. Purple shows very cold clouds high in the atmosphere above the center of the hurricane, blue and green show the warmer temperatures of lower clouds surrounding the storm center; and orange and red areas have almost no clouds. No eye is seen in this image, which means it was either too small for AIRS to detect or it was covered by high, cold clouds. Figure 1 was observed on Aug. 22, 2018. Purple shows very cold clouds high in the atmosphere above the center of the hurricane, blue and green show the warmer temperatures of lower clouds surrounding the storm center; and orange and red areas have almost no clouds. The eye of the storm is clearly visible. https://photojournal.jpl.nasa.gov/catalog/PIA22493
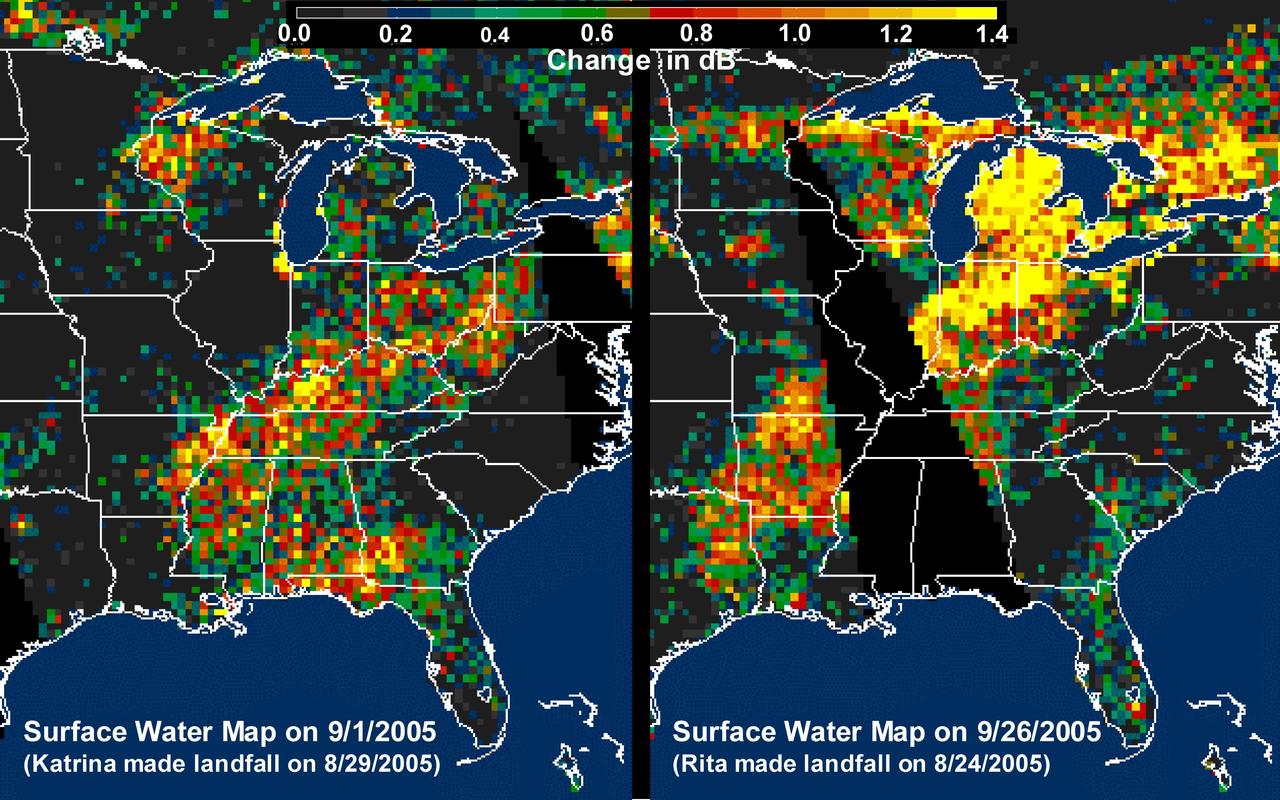
The above images, derived from NASA QuikScat satellite data, show the extensive pattern of rain water deposited by Hurricanes Katrina and Rita on land surfaces over several states in the southern and eastern United States. These results demonstrate the capability of satellite scatterometers to monitor changes in surface water on land. The color scale depicts increases in radar backscatter (in decibels) between the current measurement and the mean of measurements obtained during the previous two weeks. The backscatter can be calibrated to measure increases in surface soil moisture resulting from rainfall. The yellow color corresponds to an increase of approximately 10 percent or more in surface soil moisture according to the calibration site of Lonoke, Ark. The two hurricanes deposited excessive rainfall over extensive regions of the Mississippi River basin. Basins the size of the Mississippi can take up to several weeks before such excess rainfall significantly increases the amount of river discharge in large rivers such as the Mississippi. With hurricane season not over until November 30, the potential exists for significant flooding, particularly if new rain water is deposited by new hurricanes when river discharge peaks up as a result of previous rainfalls. River discharge should be closely monitored to account for this factor in evaluating potential flood conditions in the event of further hurricanes. http://photojournal.jpl.nasa.gov/catalog/PIA03029
In this animation, TEMPEST-D — a weather-observing satellite the size of a cereal box — captured imagery of Hurricane Dorian off the coast of Florida at 2 a.m. EDT on Sep. 3, 2019 (11 p.m. PDT on Sept. 2, 2019). At a vantage point 250 miles (400 kilometers) above the storm, the CubeSat used its miniaturized radio-wave-based instrument to see through the clouds, revealing different depths of the hurricane with areas with heavy rainfall and moisture being pulled into the storm. The green colors indicate moisture spiraling into the storm's center, and the yellow, red and pink areas correspond to the most intense rainfall. TEMPEST-D — short for Temporal Experiment for Storms and Tropical Systems Demonstration — is an experiment in shrinking weather satellites to a size that makes them inexpensive enough to produce in multiples. The goal is eventual real-time storm coverage with many small satellites that can track storms around the world. Movie available at https://photojournal.jpl.nasa.gov/catalog/PIA23431
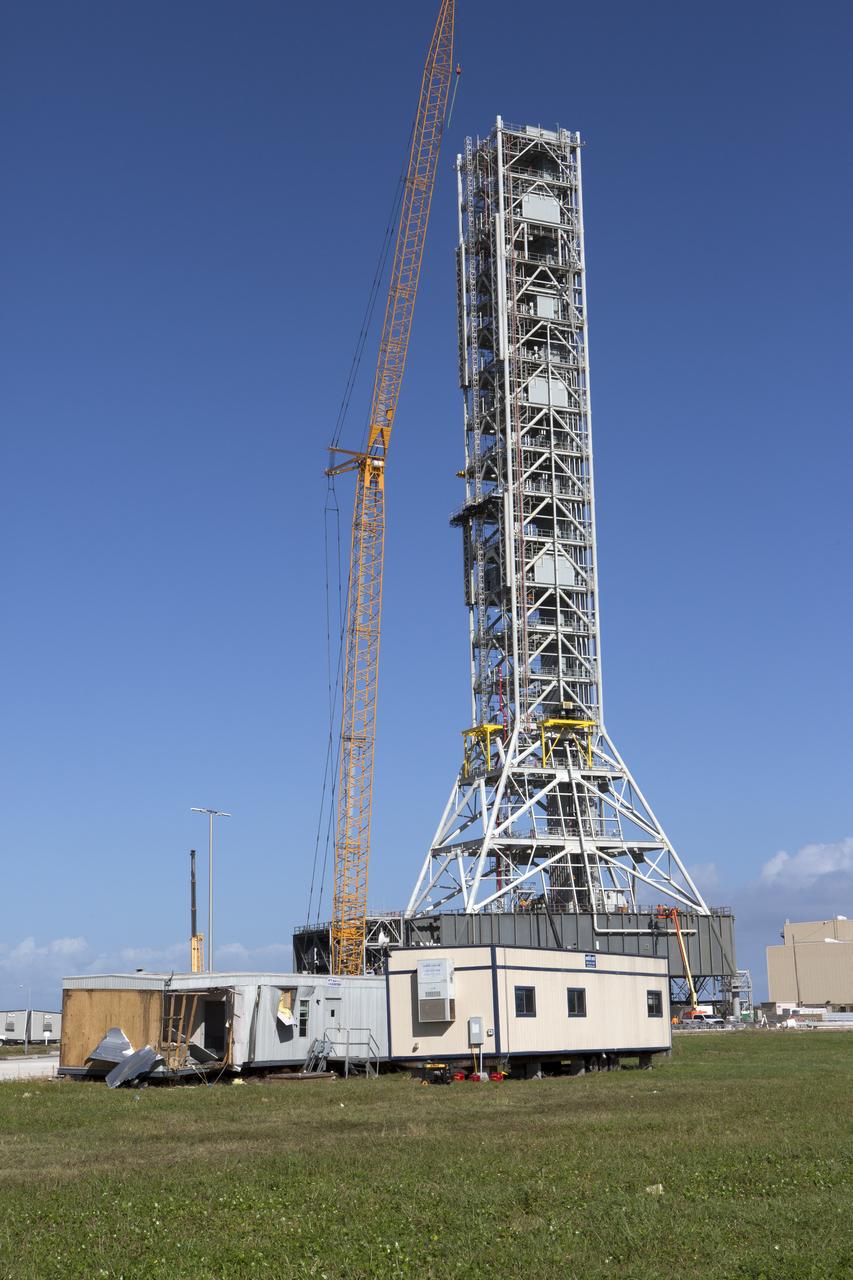
A construction trailer damaged by Hurricane Matthew is seen in front of the Mobile Launcher within the Launch Complex 39 area at NASA's Kennedy Space Center in Florida. Assessments and repairs are in progress at various structures and facilities across the spaceport, part of the ongoing recovery from Hurricane Matthew, which passed to the east of Kennedy on Oct. 6 and 7, 2016. The center received some isolated roof damage, damaged support buildings, a few downed power lines, and limited water intrusion. Beach erosion also occurred, although the storm surge was less than expected.
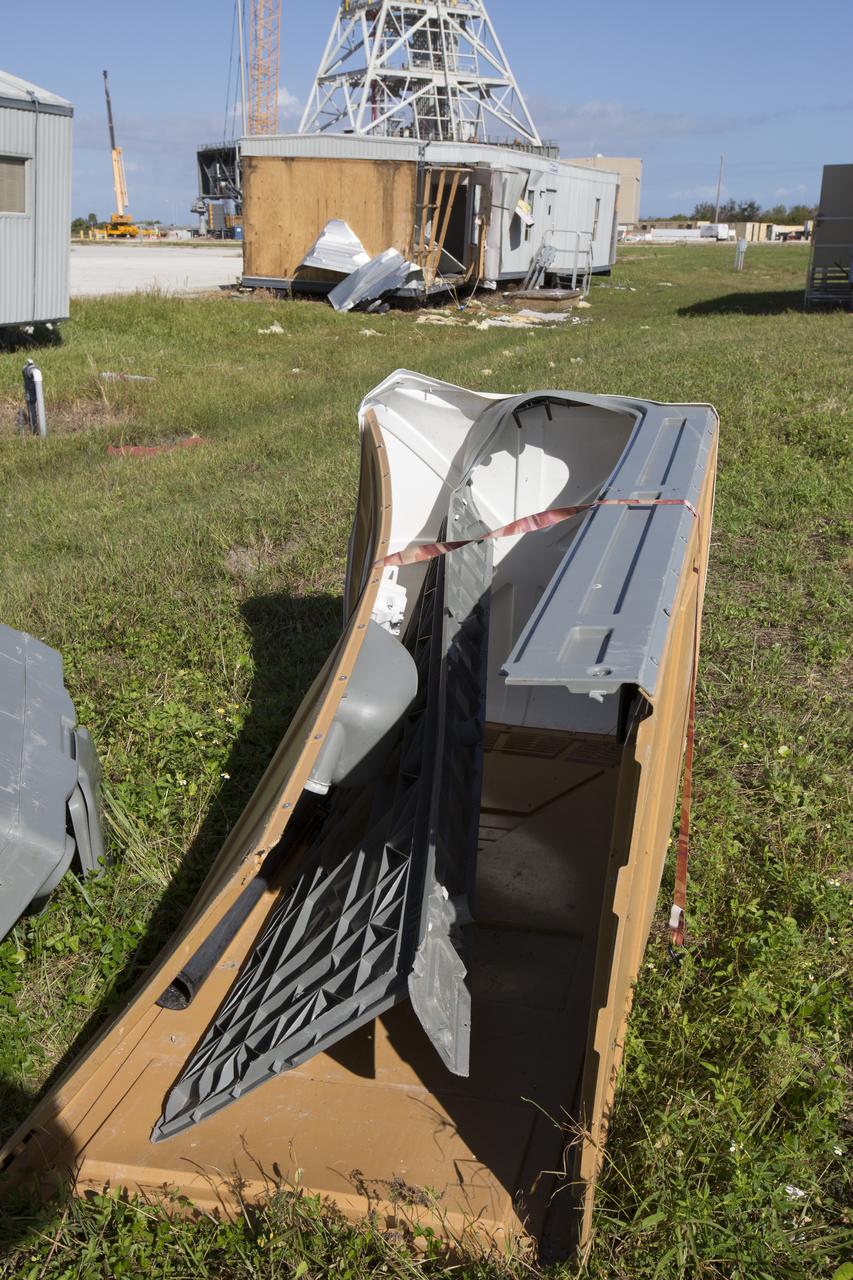
A damaged construction trailer and several pieces of associated debris, aftermath of Hurricane Matthew, are seen near the Mobile Launcher in the Launch Complex 39 area at NASA's Kennedy Space Center in Florida. Assessments and repairs are in progress at various structures and facilities across the spaceport, part of the ongoing recovery from Hurricane Matthew, which passed to the east of Kennedy on Oct. 6 and 7, 2016. The center received some isolated roof damage, damaged support buildings, a few downed power lines, and limited water intrusion. Beach erosion also occurred, although the storm surge was less than expected.
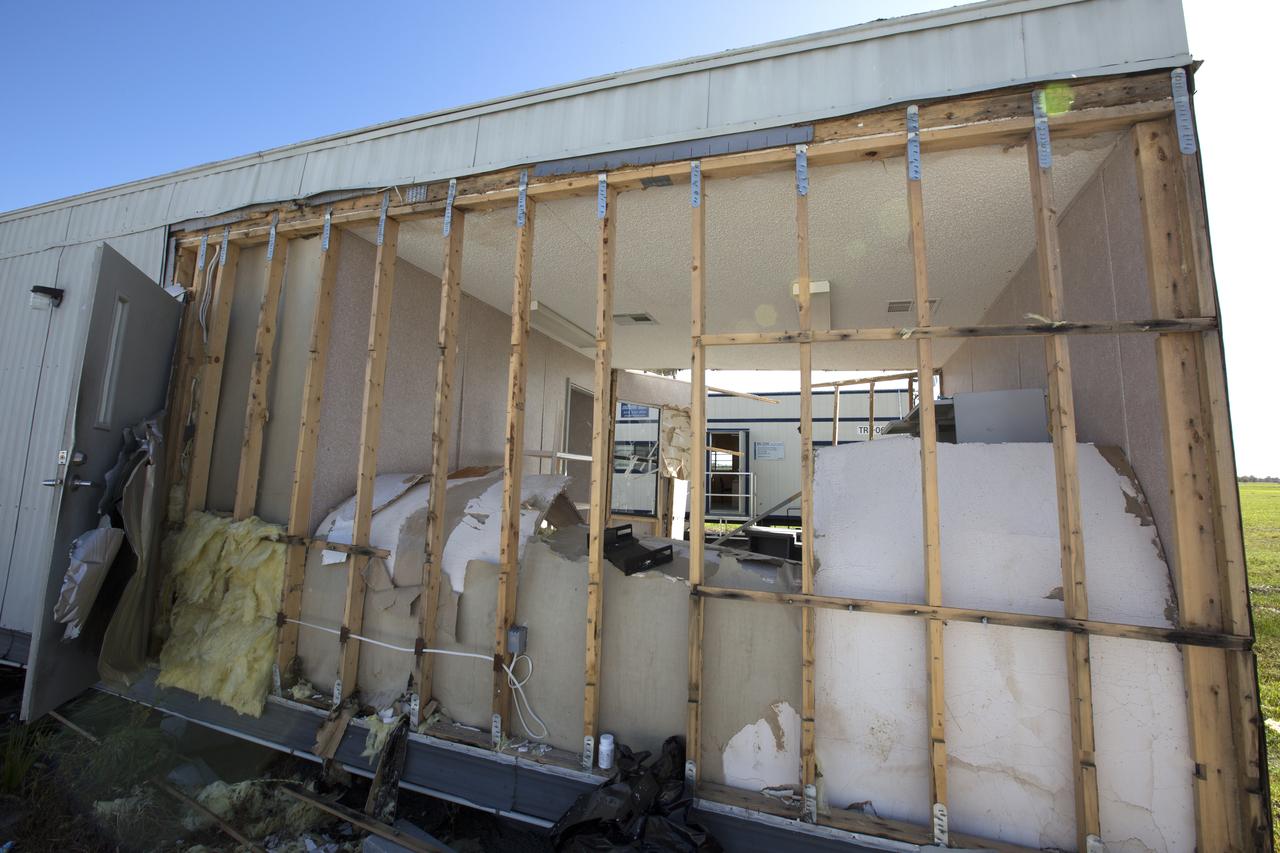
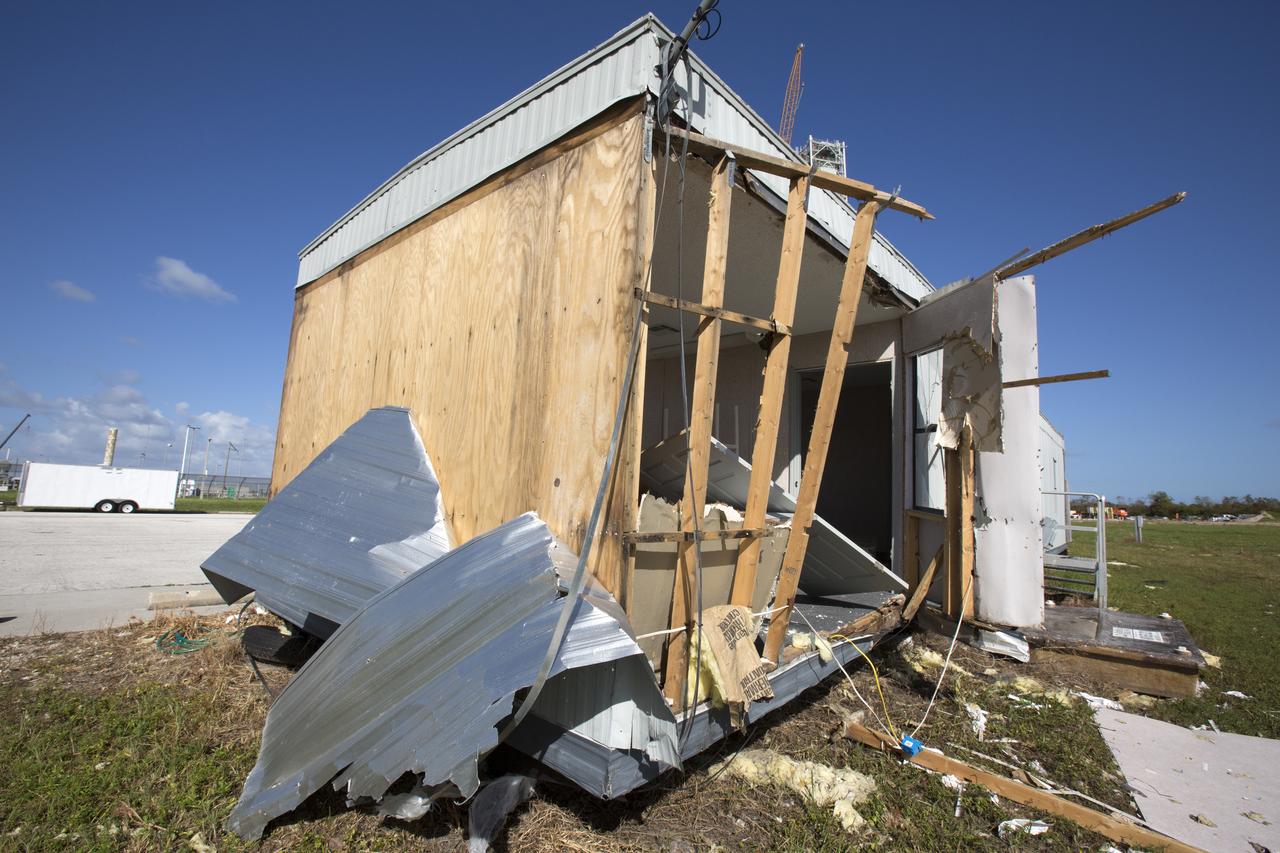
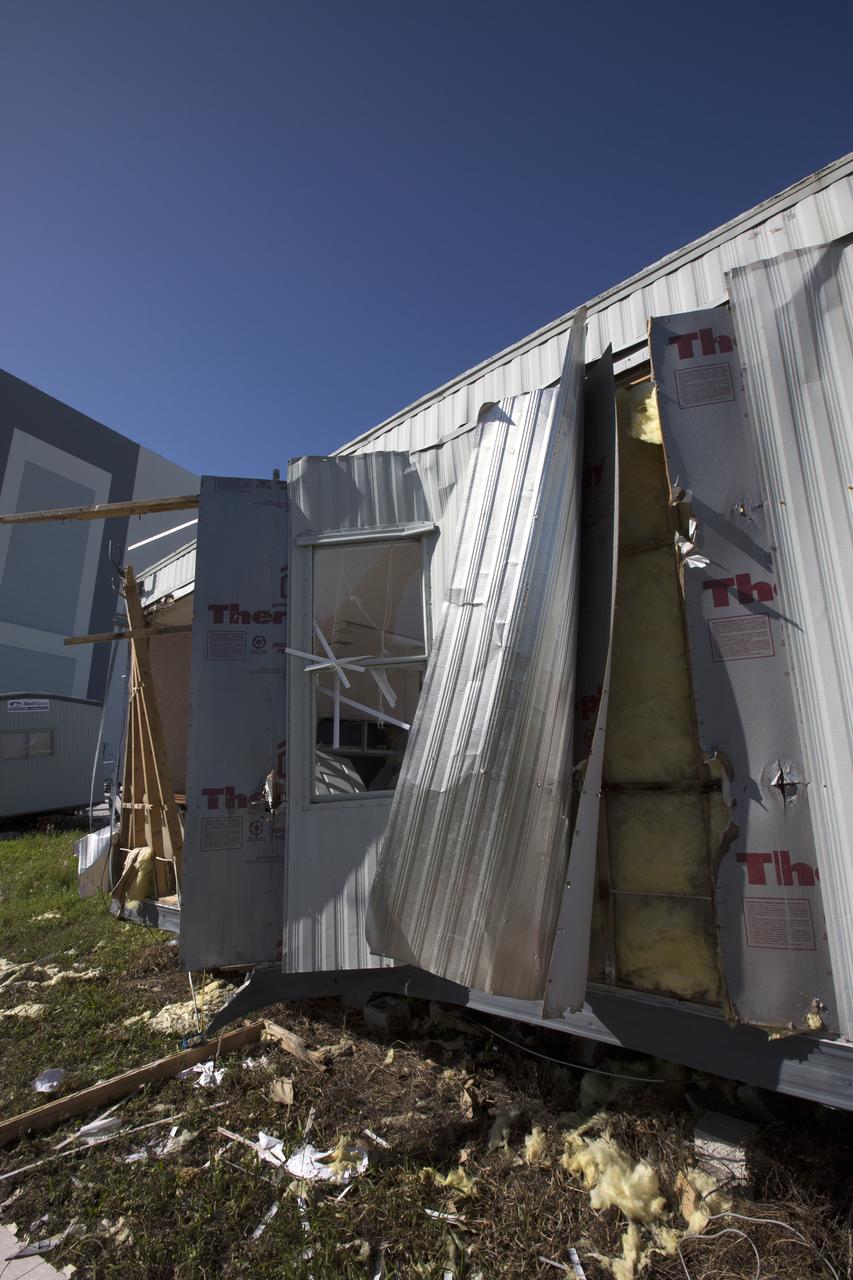
Hurricane Matthew tore away a section of wall on a support building in the Launch Complex 39 area at NASA's Kennedy Space Center in Florida. Assessments and repairs are in progress at various structures and facilities across the spaceport, part of the ongoing recovery from Hurricane Matthew, which passed to the east of Kennedy on Oct. 6 and 7, 2016. The center received some isolated roof damage, damaged support buildings, a few downed power lines, and limited water intrusion. Beach erosion also occurred, although the storm surge was less than expected.
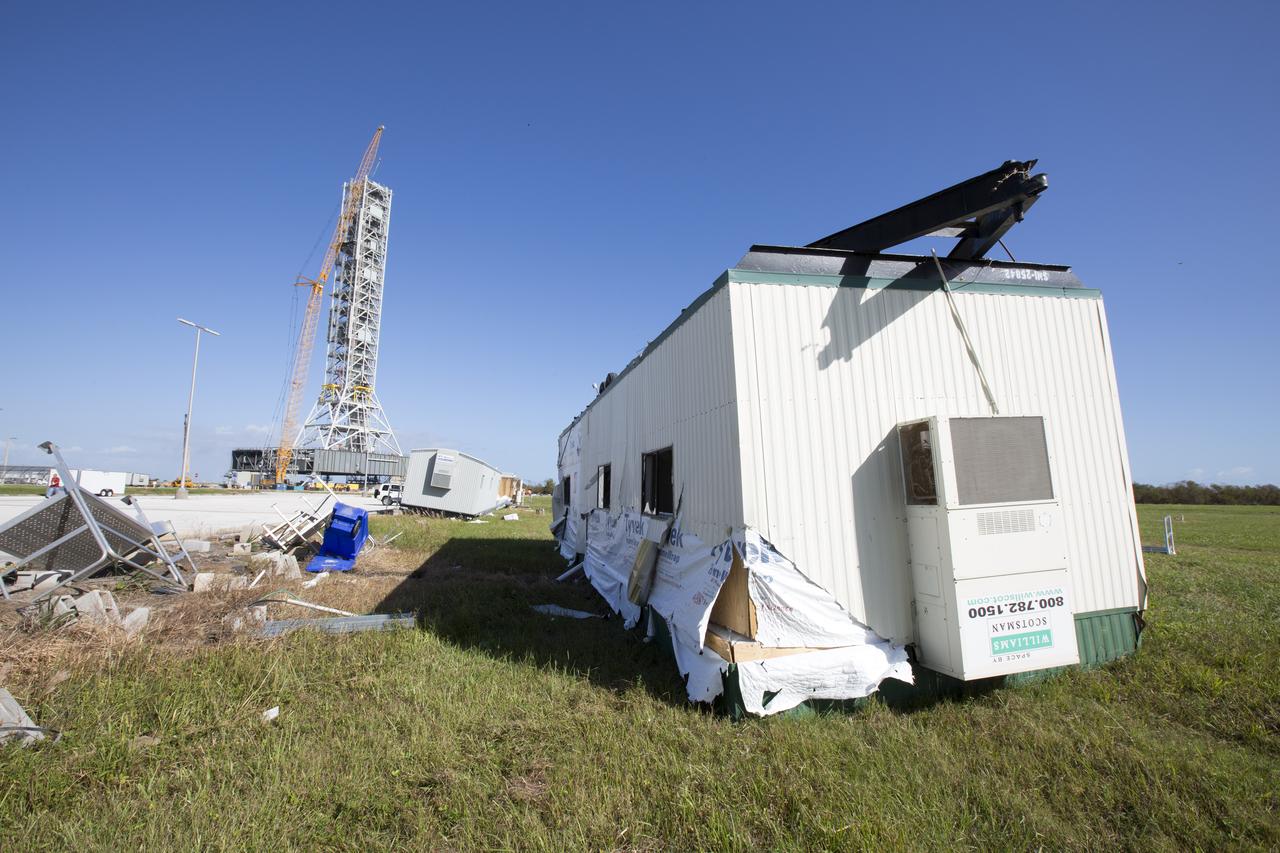
A damaged construction trailer and several pieces of associated debris, aftermath of Hurricane Matthew, are seen in front of the Mobile Launcher in the Launch Complex 39 area at NASA's Kennedy Space Center in Florida. Assessments and repairs are in progress at various structures and facilities across the spaceport, part of the ongoing recovery from Hurricane Matthew, which passed to the east of Kennedy on Oct. 6 and 7, 2016. The center received some isolated roof damage, damaged support buildings, a few downed power lines, and limited water intrusion. Beach erosion also occurred, although the storm surge was less than expected.
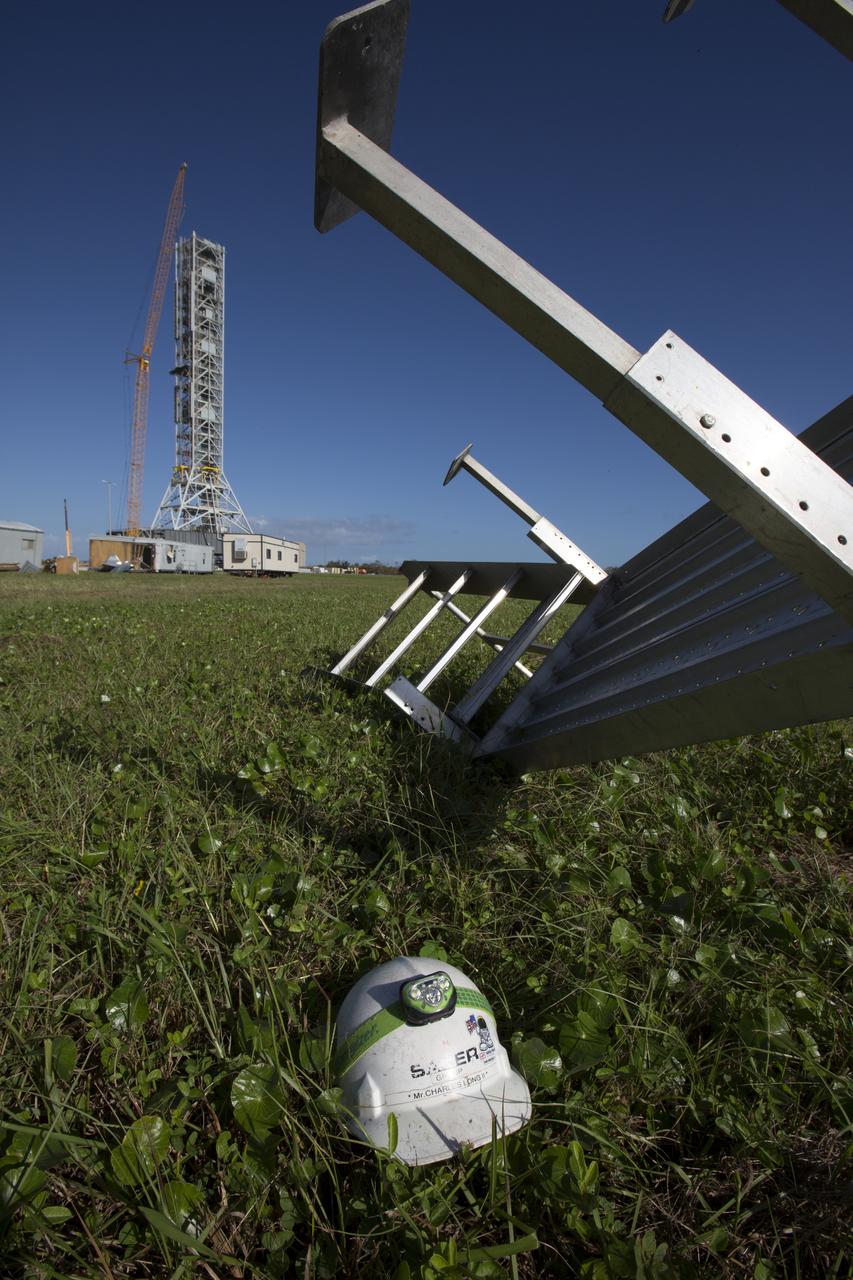
A construction helmet and staircase, both relocated by Hurricane Matthew, is seen in front of the Vehicle Assembly Building at NASA's Kennedy Space Center in Florida. Assessments and repairs are in progress at various structures and facilities across the spaceport, part of the ongoing recovery from Hurricane Matthew, which passed to the east of Kennedy on Oct. 6 and 7, 2016. The center received some isolated roof damage, damaged support buildings, a few downed power lines, and limited water intrusion. Beach erosion also occurred, although the storm surge was less than expected.
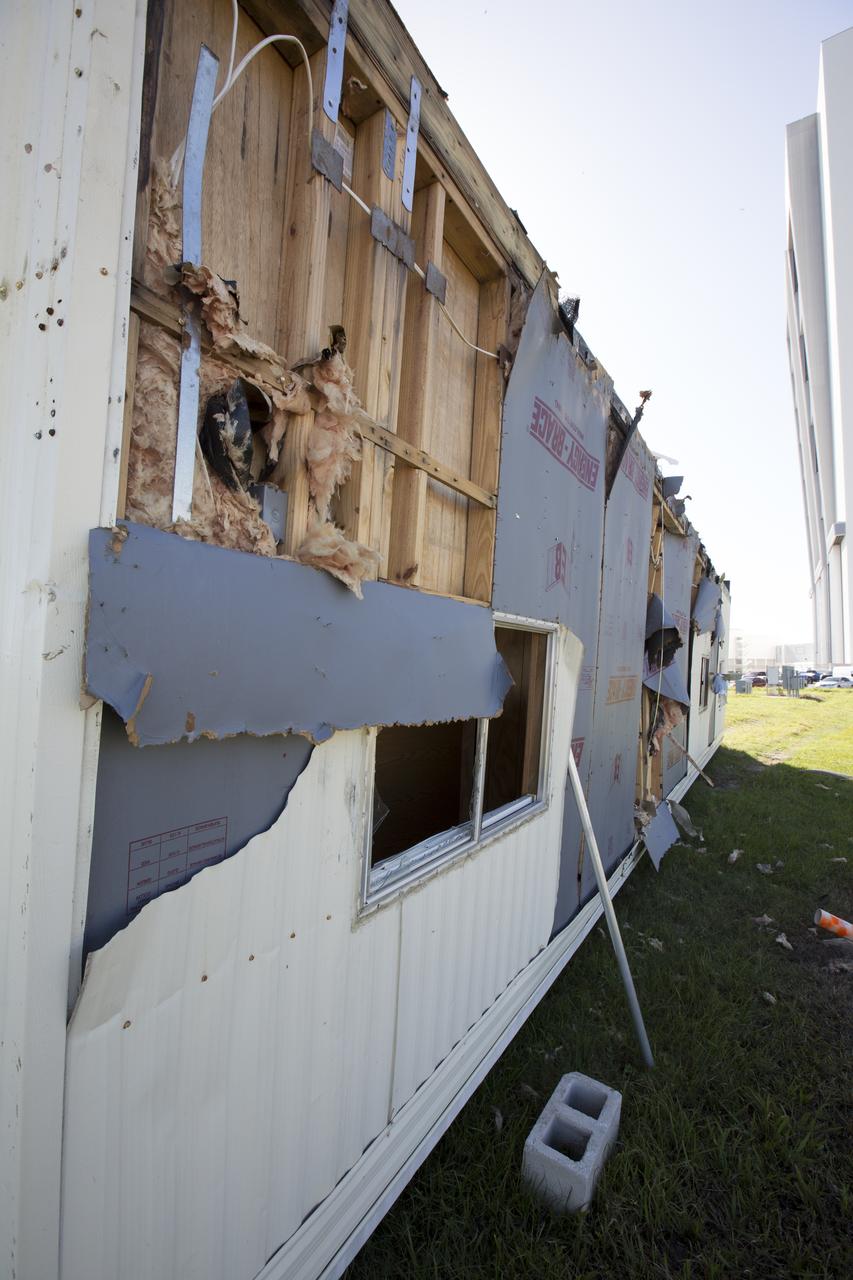
Siding damage caused by Hurricane Matthew is seen inside a support building in the Launch Complex 39 area at NASA's Kennedy Space Center in Florida. Assessments and repairs are in progress at various structures and facilities across the spaceport, part of the ongoing recovery from Hurricane Matthew, which passed to the east of Kennedy on Oct. 6 and 7, 2016. The center received some isolated roof damage, damaged support buildings, a few downed power lines, and limited water intrusion. Beach erosion also occurred, although the storm surge was less than expected.
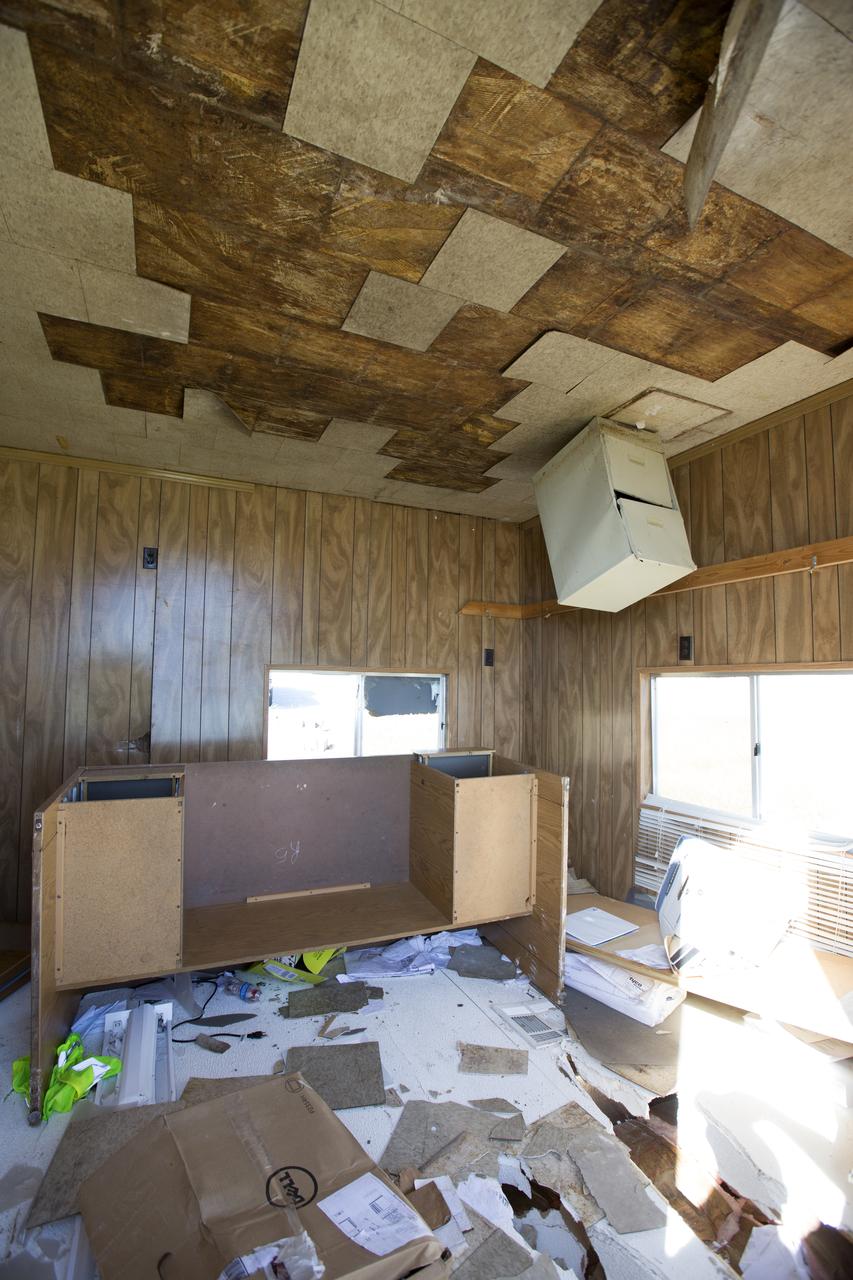
Ceiling and furniture damage caused by Hurricane Matthew is seen inside a support building in the Launch Complex 39 area at NASA's Kennedy Space Center in Florida. Assessments and repairs are in progress at various structures and facilities across the spaceport, part of the ongoing recovery from Hurricane Matthew, which passed to the east of Kennedy on Oct. 6 and 7, 2016. The center received some isolated roof damage, damaged support buildings, a few downed power lines, and limited water intrusion. Beach erosion also occurred, although the storm surge was less than expected.
A damaged construction trailer and several pieces of associated debris, aftermath of Hurricane Matthew, are seen in front of the Mobile Launcher in the Launch Complex 39 area at NASA's Kennedy Space Center in Florida. Assessments and repairs are in progress at various structures and facilities across the spaceport, part of the ongoing recovery from Hurricane Matthew, which passed to the east of Kennedy on Oct. 6 and 7, 2016. The center received some isolated roof damage, damaged support buildings, a few downed power lines, and limited water intrusion. Beach erosion also occurred, although the storm surge was less than expected.
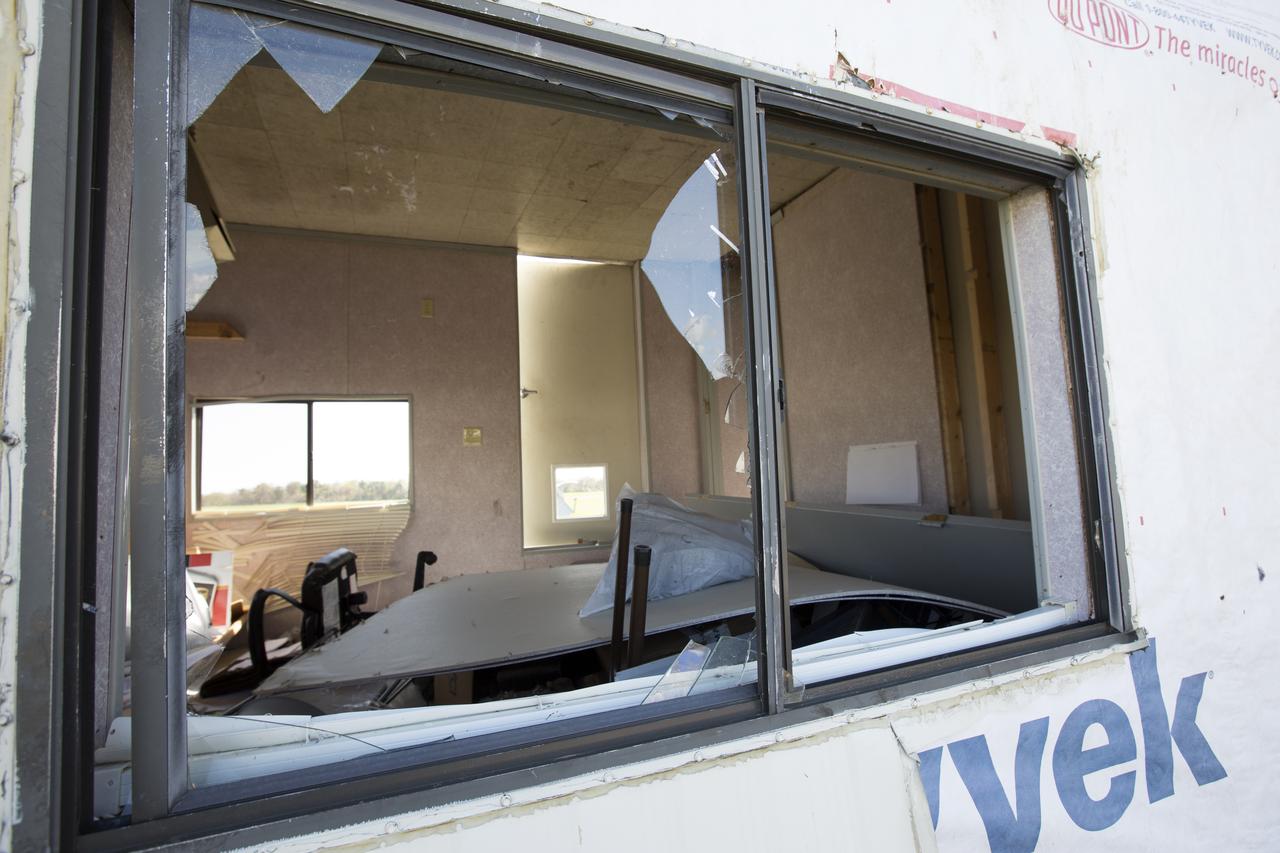
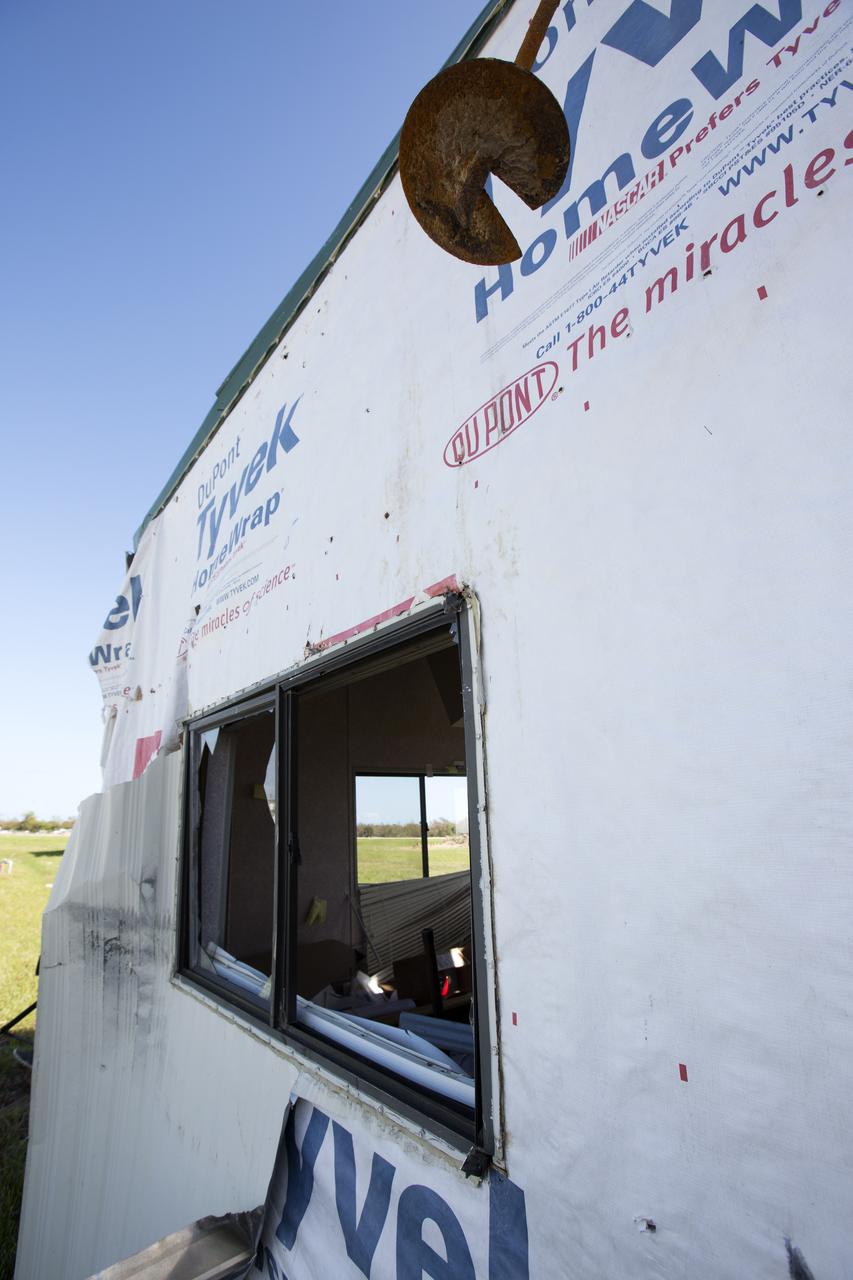
A broken window caused by Hurricane Matthew is seen inside a support building in the Launch Complex 39 area at NASA's Kennedy Space Center in Florida. Assessments and repairs are in progress at various structures and facilities across the spaceport, part of the ongoing recovery from Hurricane Matthew, which passed to the east of Kennedy on Oct. 6 and 7, 2016. The center received some isolated roof damage, damaged support buildings, a few downed power lines, and limited water intrusion. Beach erosion also occurred, although the storm surge was less than expected.
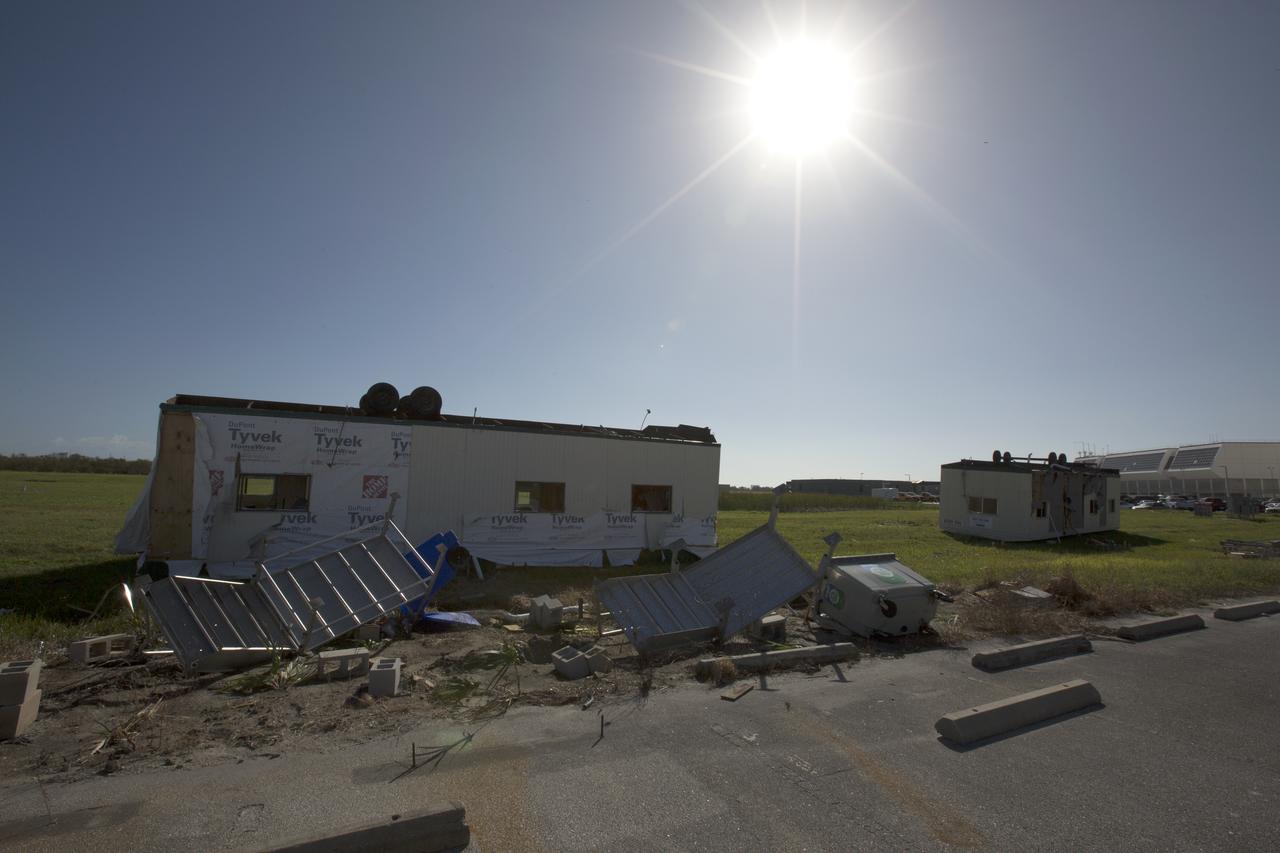
Damaged construction trailers and several pieces of associated debris, aftermath of Hurricane Matthew, are seen in front of the Mobile Launcher in the Launch Complex 39 area at NASA's Kennedy Space Center in Florida. Assessments and repairs are in progress at various structures and facilities across the spaceport, part of the ongoing recovery from Hurricane Matthew, which passed to the east of Kennedy on Oct. 6 and 7, 2016. The center received some isolated roof damage, damaged support buildings, a few downed power lines, and limited water intrusion. Beach erosion also occurred, although the storm surge was less than expected.
Siding damage caused by Hurricane Matthew is seen inside a support building in the Launch Complex 39 area at NASA's Kennedy Space Center in Florida. Assessments and repairs are in progress at various structures and facilities across the spaceport, part of the ongoing recovery from Hurricane Matthew, which passed to the east of Kennedy on Oct. 6 and 7, 2016. The center received some isolated roof damage, damaged support buildings, a few downed power lines, and limited water intrusion. Beach erosion also occurred, although the storm surge was less than expected.
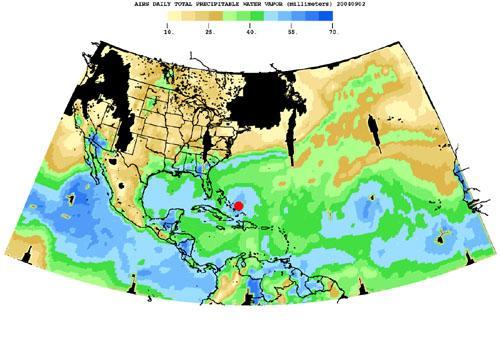
Born in the Atlantic, Hurricane Frances became a category 4 hurricane on August 31, 2004, as seen by the Atmospheric Infrared Sounding System AIRS on NASA Aqua. Expectations are the hurricane will hit the Space Coast of Florida in Brevard County early Sunday morning. This frame from a movie is a time-series of maps that show AIRS observations of the total amount of water vapor present in the atmospheric column above each point of the Earth's surface. If all the water vapor in the column were forced to fall as rain, the depth of the resulting puddle on the surface at that point is equal to the value shown on the map. Fifty millimeters (mm) is about 2 inches. The large band of maximum water vapor in the neighborhood of the equator is the Intertropical Convergence Zone (ITCZ), a region of strong convection and powerful thunderstorms. The movie (see PIA00433) shows the total precipitable water vapor from August 23 through September 2, 2004. You can see Hurricane Frances as it moves through the Caribbean toward Florida, and the changes in intensity are visible. The eye has been marked with a red spot. The water vapor encompassed by the hurricane is also the result of the very strong convection which is an integral part of the formation and intensification of tropical storms. If you look at the last frame of the movie in the lower right corner, you can see the emergence of a new tropical storm. Ivan makes its debut in the Atlantic. http://photojournal.jpl.nasa.gov/catalog/PIA00433
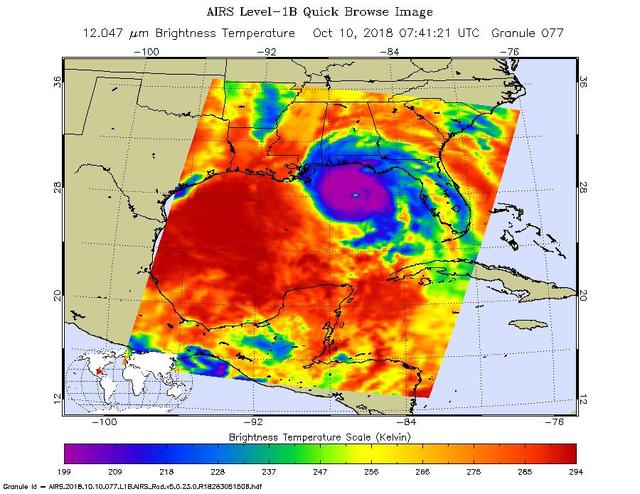
This image from the Atmospheric Infrared Sounder (AIRS) shows the temperature of clouds or the surface in and around Hurricane Michael as it approaches northwestern Florida around 3 AM local time on Tuesday, October 10, 2018. The storm shows all the hallmarks of a powerful, mature hurricane. The large purple area indicates very cold clouds at about -90 F (-68 C) carried high into the atmosphere by deep thunderstorms. These storm clouds are associated with very heavy rainfall. At the center of the cold clouds is the distinct, much warmer eye of the hurricane seen in green. The extensive areas of red away from the storm indicate temperatures of around 60 F (15 C), typical of the surface of the Earth at night. These red areas are mostly cloud-free, with the clear air caused by air motion outward from the cold clouds near the storm center then downward in the surrounding areas. Michael has developed quickly into a dangerous Category 4 storm, with sustained wind of 150 miles per hour. It is currently coming ashore on the Florida Panhandle as the strongest hurricane in that region in recorded history. https://photojournal.jpl.nasa.gov/catalog/PIA22749
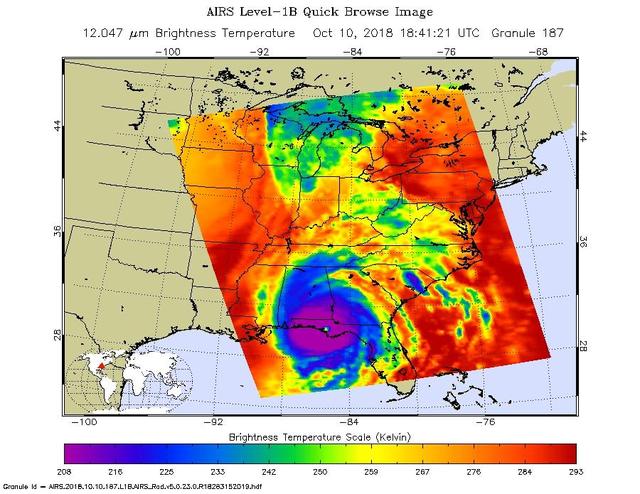
This image from NASA's Atmospheric Infrared Sounder (AIRS) shows the temperature of clouds or the surface in and around Hurricane Michael as the storm made landfall in the Florida panhandle on Wed, Oct 10, 2018. The large purple area indicates very cold clouds carried high into the atmosphere by deep thunderstorms. These storm clouds are associated with heavy rainfall. The warmer eye of the hurricane, located at the center of the cold clouds, is shown in green. The red areas are mostly cloud-free areas, with the clear air caused by air motion outward from the cold clouds near the storm center then downward in the surrounding areas. Michael made landfall as a Category 4 storm with maximum sustained winds of 155 mph (250 kph). https://photojournal.jpl.nasa.gov/catalog/PIA22752
Hurricane Matthew, currently an extremely dangerous Category 4 storm on the Saffir-Simpson Hurricane Wind Scale, continues to bear down on the southeastern United States. At 11:27 a.m. PDT (2:27 p.m. EDT and 18:23 UT) today, NASA's Atmospheric Infrared Sounder (AIRS) instrument aboard NASA's Aqua satellite observed the storm as its eye was passing over the Bahamas. An AIRS false-color infrared image shows that the northeast and southwest quadrants of the storm had the coldest cloud tops, denoting the regions of the storm where the strongest precipitation was occurring at the time. Data from the Advanced Microwave Sounding Unit (AMSU), another of AIRS' suite of instruments, indicate that the northeast quadrant, which appears smaller in the infrared image, likely had the most intense rain bands at the time. The AIRS infrared image shows that at the time of the image the storm had full circulation, with a small eye surrounded by a thick eye wall and can be seen at http://photojournal.jpl.nasa.gov/catalog/PIA21092.
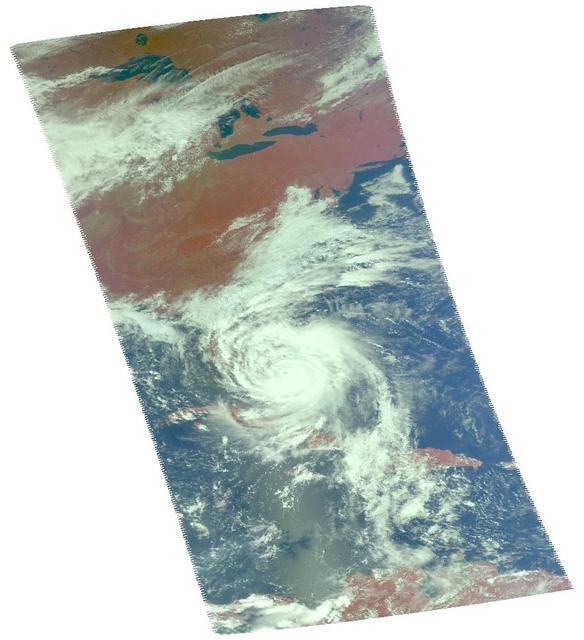
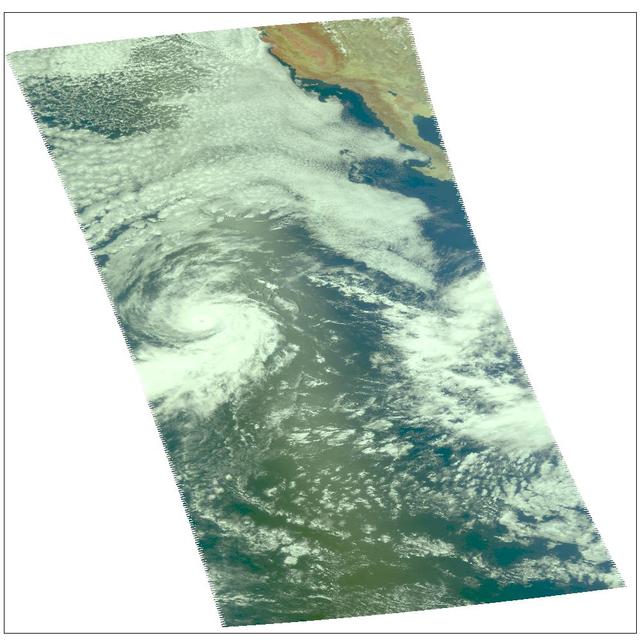
On the afternoon of Sept. 1, 2016, Tropical Storm Hermine strengthened into a Category 1 hurricane as it approached the coast of Florida. Hermine began life as Tropical Depression Nine, originating off the coast of Cuba on Aug. 28. After heading northwest into the Gulf of Mexico, it took a right turn toward Florida and on Wednesday, Aug. 31, was upgraded to a tropical storm before strengthening to a hurricane a day later. Winds are currently sustained near 75 miles (121 kilometers) per hour, and the storm is expected to make landfall tonight or early tomorrow. Florida Governor Rick Scott has declared a state of emergency in 51 counties, while Georgia Governor Nathan Deal has done the same for 56 counties in his state. Localized flooding is already occurring in some areas of Florida, which has not had a direct landfall by a hurricane in 11 years. After moving across Florida and Georgia, the storm is currently forecast to continue northward along the coast of the Eastern seaboard. On Sept. 1, at 12:30 p.m. EDT, the Multi-angle Imaging SpectroRadiometer (MISR) instrument aboard NASA's Terra spacecraft passed over the area. This natural-color image from MISR's vertical-pointing camera shows the large, loosely organized hurricane. At the time, the center of the storm was located about 200 miles (325 kilometers) to the west of Sarasota on the Florida coast. The image is 235 miles (378 kilometers) in width. Also included is a 3D stereo anaglyph, made by combining data from MISR's vertical-pointing and 46-degree forward-pointing camera. The image has been rotated so that north is to the left in order to enable stereo viewing. With the aid of red-blue glasses (with the red lens over the left eye), it is possible to observe the storm in three dimensions. Note the towering central thunderstorms around the eye in comparison to the low clouds visible within it. These data were acquired during Terra orbit 88865. http://photojournal.jpl.nasa.gov/catalog/PIA20898
These two images show Hurricane Isabel as viewed by AIRS and SeaWinds scatterometers on NASA ADEOS-2 and QuikScat satellites in September, 2003. AIRS data are used to create global three-dimensional maps of temperature, humidity and clouds, while scatterometers measure surface wind speed and direction. http://photojournal.jpl.nasa.gov/catalog/PIA00429
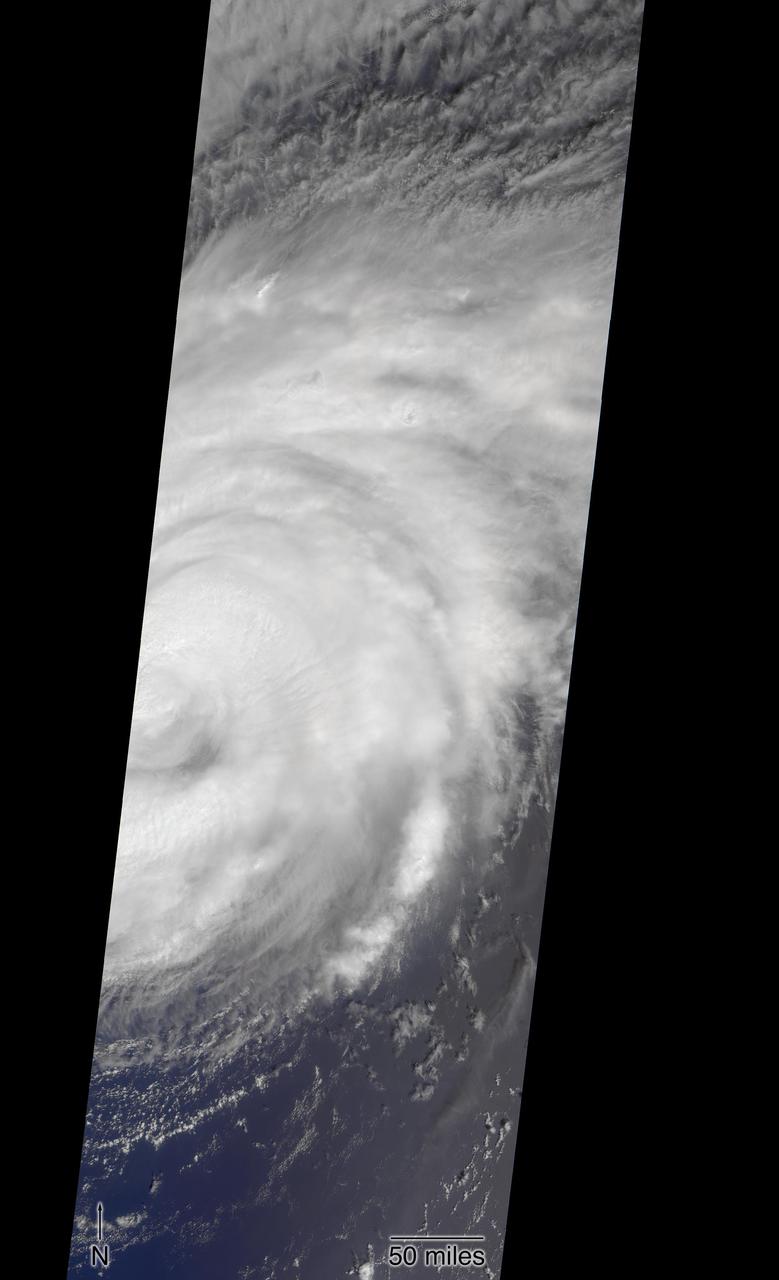
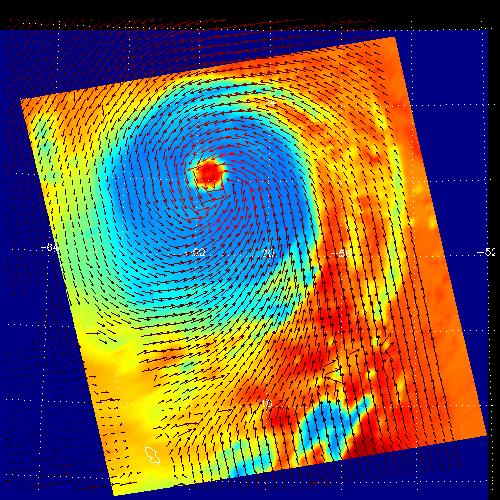
NASA's Multi-angle Imaging SpectroRadiometer (MISR) passed over Hurricane Florence as it approached the eastern coast of the United States on Thursday, September 13, 2018. At the time the image was acquired, Florence was a large Category 2 storm and coastal areas were already being hit with tropical-storm-force winds. The MISR instrument, flying onboard NASA's Terra satellite, carries nine cameras that observe Earth at different angles. It takes about seven minutes for all the cameras to observe the same location. The motion of the clouds during that time is used to compute wind speed at the cloud tops. These images show Florence as viewed by the central, downward-looking camera (left) and the storm's wind speeds (right). In the right image, the length of the arrows is proportional to wind speed and their colors show the altitude of the cloud tops in kilometers. The data show that the cloud top winds near the center of the storm were approximately 70 mph (113 kph), and the maximum cloud-top wind speed throughout the storm was 90 mph (145 kph). The wind data also shows that the lowest clouds are moving counter-clockwise, indicating inflow into the southern part of the hurricane, while the high clouds to the north of the hurricane show a clockwise outflow. https://photojournal.jpl.nasa.gov/catalog/PIA22700
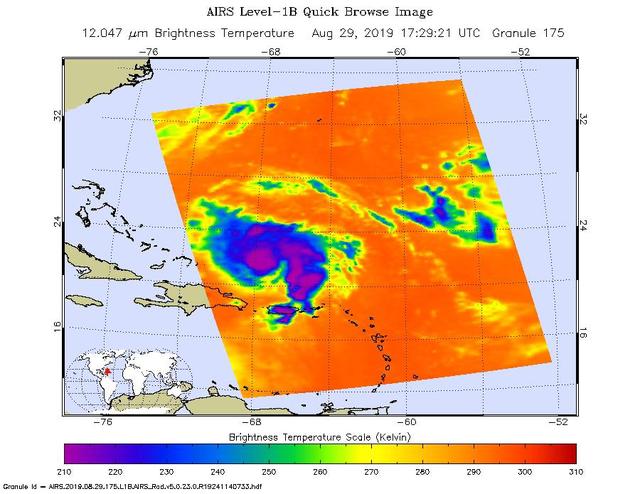
An infrared image of Hurricane Dorian, as seen by the AIRS instrument aboard NASA's Aqua satellite at 1:30 p.m. EDT (10:30 a.m. PDT) on Aug. 29, 2019. The large purple areas are cold clouds, carried high into the atmosphere by deep thunderstorms. Blue and green show warmer areas with less rain clouds, while orange and red represent mostly cloud-free air. https://photojournal.jpl.nasa.gov/catalog/PIA23358
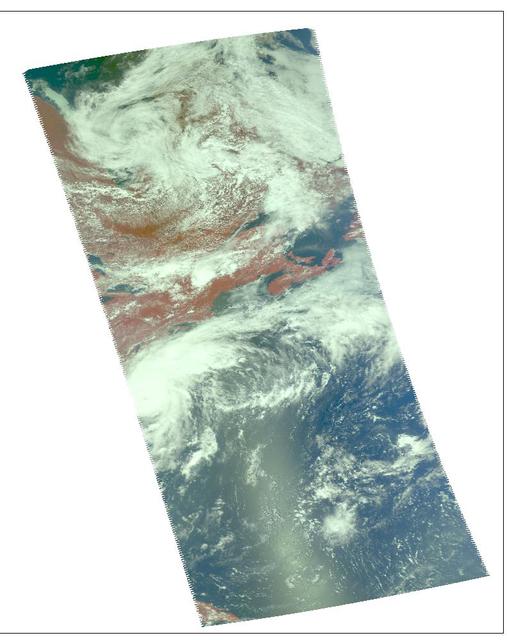
Hurricane Darby as observed by the Atmospheric Infrared Sounder AIRS onboard NASA Aqua in July, 2004. This daylight image of Hurricane Darby on July 28 was made with the visible sensor in the AIRS instrument suite. After reaching sustained winds on July 27 of 100 knots (115 mph) with gusts to 120 knots (138 mph), the intensity of the storm is now lowered to 75 knots (86 mph). Located in the eastern north Pacific Ocean located about 1,165 miles west-southwest of the southern tip of Baja California, the storm continues its west/northwest path at 14 knots (16mph). Figure 1 is a daylight snapshot from AIRS visible/near-infrared sensor before Darby became a tropical storm. Darby is in the upper right-hand corner. Circulation is not apparent because the storm was not organized sufficiently to allow the nascent eye to appear. At this time, winds were approximately 35 mph. Figure 2 is an AIRS infrared image. Darby falls on the edge of two AIRS data granules, which have been "stitched" together in this image. Storm intensity is lowered to 75 knots (86 mph), down from 100 knots (115 mph). http://photojournal.jpl.nasa.gov/catalog/PIA00439
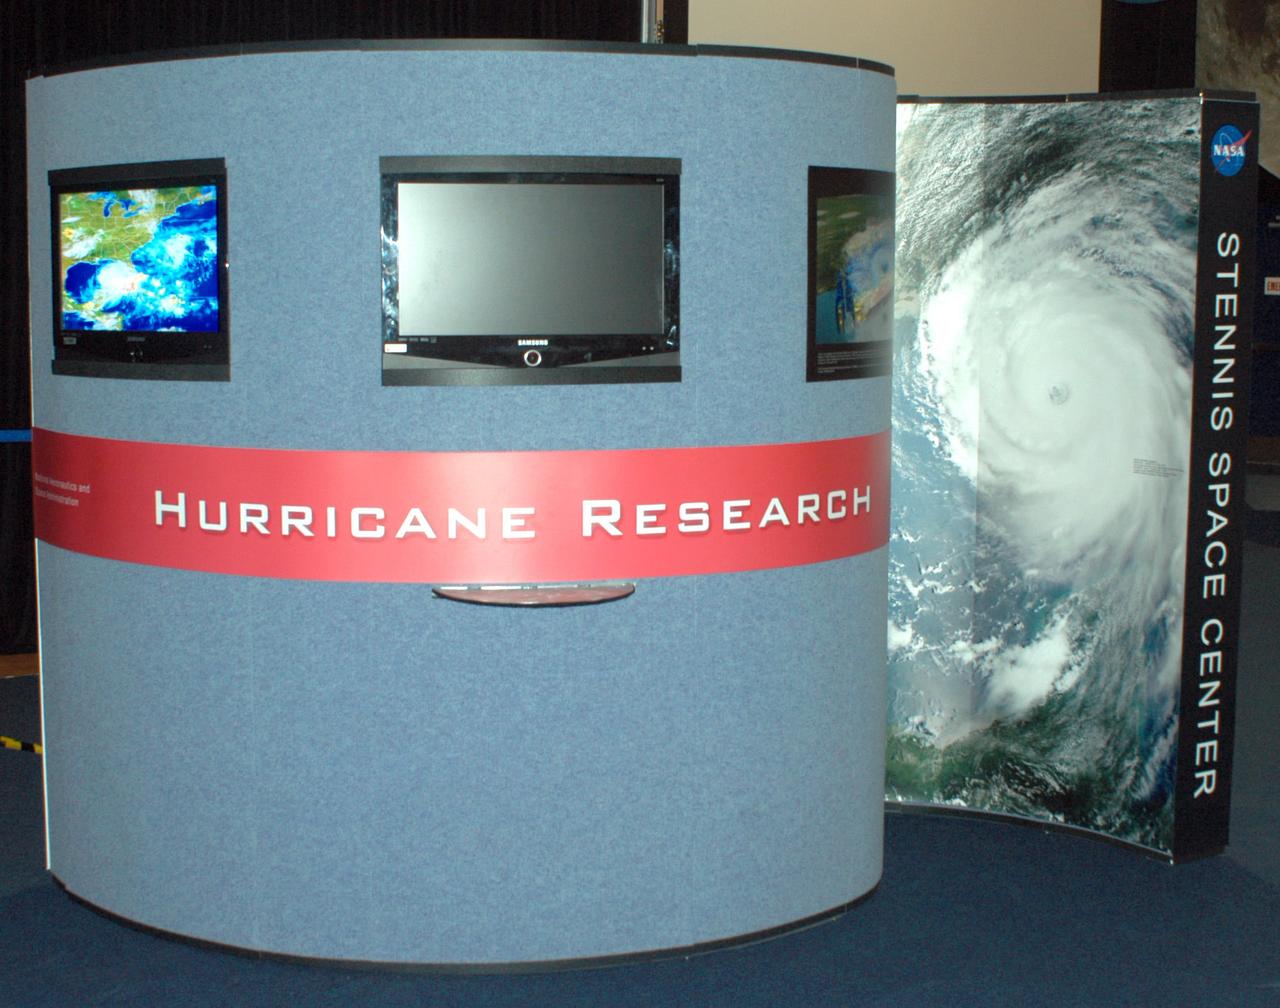
A new exhibit in StenniSphere depicting NASA's role in hurricane prediction and research and SSC's role in helping the region recover from Hurricane Katrina. The cyclone-shaped exhibit focuses on the effects of the Aug. 29, 2005 storm and outlines how NASA is working to improve weather forecasting. Through photos, 3-D models and digital animations, the exhibit tells the story of what happened inside the storm and how NASA's scientific research can increase the accuracy of hurricane tracking and modeling.

Read more from: <a href="http://go.nasa.gov/2duxEeZ" rel="nofollow">go.nasa.gov/2duxEeZ</a> On October 4, 2016, Hurricane Matthew made landfall on southwestern Haiti as a category-4 storm—the strongest storm to hit the Caribbean nation in more than 50 years. Just hours after landfall, the Moderate Resolution Imaging Spectroradiometer (MODIS) on NASA’s Terra satellite acquired this natural-color image. At the time, Matthew had top sustained winds of about 230 kilometers (145 miles) per hour. Earlier on October 4, temperature data collected by MODIS on NASA’s Aqua satellite revealed that the cloud tops around Matthew were very cold (at least -57° Celsius, or -70° Fahrenheit). Cold cloud tops are known to produce heavy rainfall. The National Hurricane Center called for 380 to 500 millimeters (15 to 20 inches) of rain in Southern Haiti and in the southwestern Dominican Republic. The northward movement of the storm should bring the center of Matthew over eastern Cuba late on October 4. Dangerous conditions can extend far beyond a storm’s center. According to National Hurricane Center forecasters, Matthew is “likely to produce devastating impacts from storm surge, extreme winds, heavy rains, flash floods, and/or mudslides in portions of the watch and warning areas in Haiti, Cuba, and the Bahamas.” NASA Earth Observatory image by Joshua Stevens, using MODIS data from the Land Atmosphere Near real-time Capability for EOS (LANCE). Caption by Kathryn Hansen.
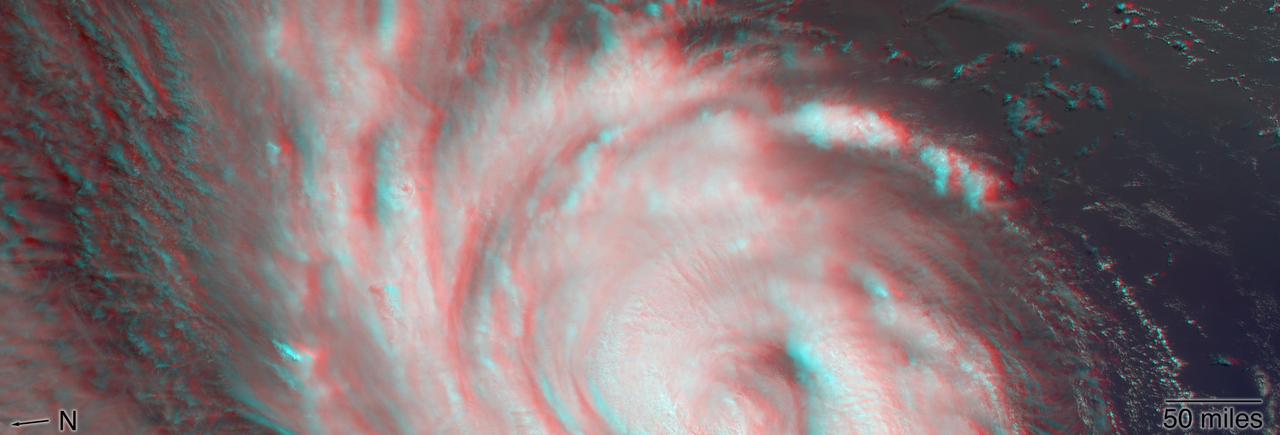
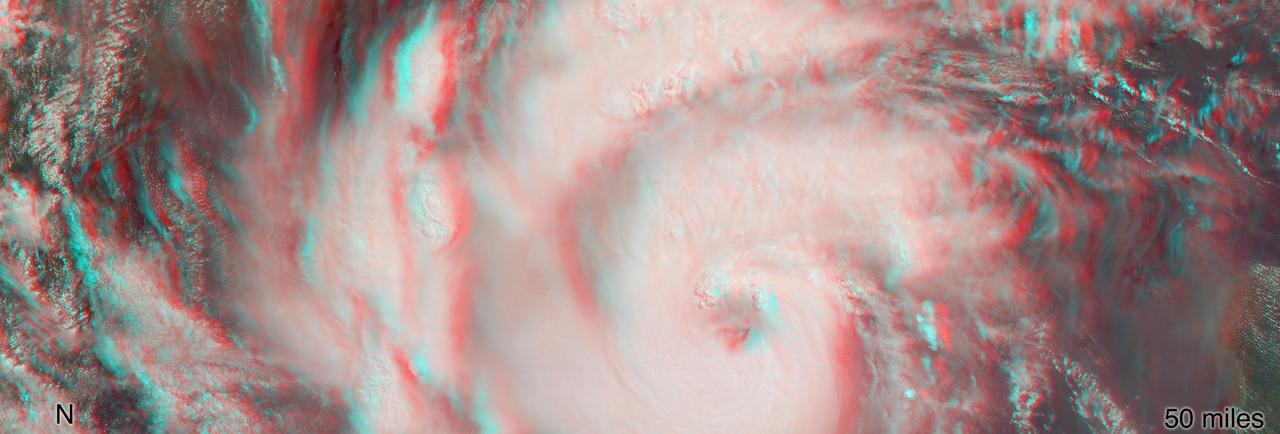
NASA's Multi-angle Imaging SpectroRadiometer (MISR) passed over Hurricane Florence as it approached the eastern coast of the United States on Thursday, September 13, 2018. At the time the image was acquired, Florence was a large Category 2 storm and coastal areas were already being hit with tropical-storm-force winds. The MISR instrument, flying onboard NASA's Terra satellite, carries nine cameras that observe Earth at different angles. It takes about seven minutes for all the cameras to observe the same location. This stereo anaglyph shows a 3D view of Florence. You will need red-blue 3D glasses, with the red lens placed over the left eye, to view the effect. The anaglyph shows the high clouds associated with strong thunderstorms in the eyewall of hurricane and individual strong thunderstorms in the outer rain bands. These smaller storms can sometimes spawn tornadoes. https://photojournal.jpl.nasa.gov/catalog/PIA22701
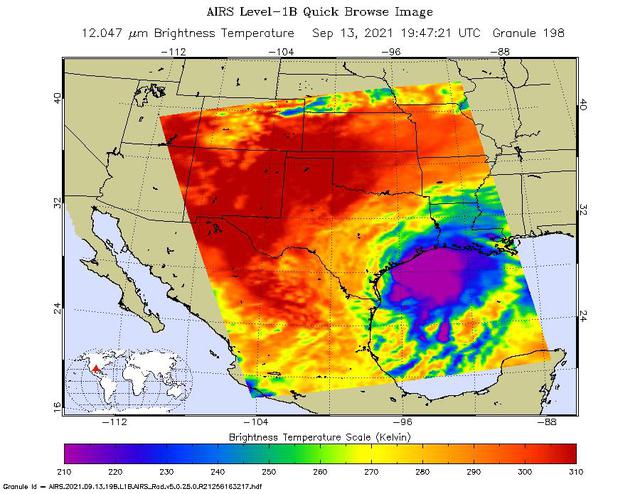
NASA's Atmospheric Infrared Sounder (AIRS) captured views of Hurricane Nicholas before and after it made landfall about 10 miles west-southwest of Sargent Beach, Texas, on Tuesday, Sept. 14, 2021. One image showed Nicholas approaching the Texas coast as a tropical storm in the early afternoon on Monday, Sept. 13, 2021. The storm strengthened to a Category 1 hurricane on Monday night and made landfall Tuesday morning around 12:30 a.m. CDT. The second AIRS image (Figure 1) captured Hurricane Nicholas shortly after landfall around 2:53 a.m. CDT. In the infrared AIRS images, the large purple areas indicate very cold clouds carried high into the atmosphere by lofty thunderstorms that are also associated with heavy rainfall. Warmer areas with shallower rain clouds are shown in blue and green. The orange and red areas represent mostly cloud-free air. AIRS, in conjunction with the Advanced Microwave Sounding Unit (AMSU), senses emitted infrared and microwave radiation from Earth to provide a three-dimensional look at the planet's weather and climate. Working in tandem, the two instruments make simultaneous observations down to Earth's surface. With more than 2,000 channels sensing different regions of the atmosphere, the system creates a global, three-dimensional map of atmospheric temperature and humidity, cloud amounts and heights, greenhouse gas concentrations, and many other atmospheric phenomena. Launched into Earth orbit in 2002 aboard NASA's Aqua spacecraft, the AIRS and AMSU instruments are managed by NASA's Jet Propulsion Laboratory in Southern California, under contract to NASA. JPL is a division of Caltech. https://photojournal.jpl.nasa.gov/catalog/PIA24532
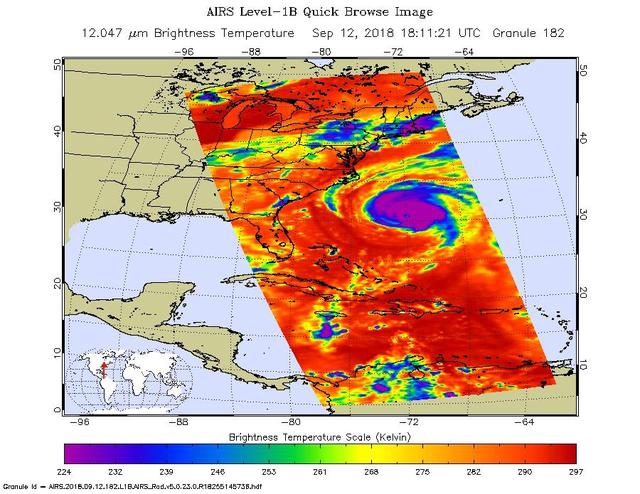
This image, taken at 1:35 pm local time on Tuesday, September 11, 2018 by the Atmospheric Infrared Sounder (AIRS) onboard NASA's Aqua satellite shows Hurricane Florence whose strong winds are expected to reach the Carolina coast late Thursday. Florence intensified from a Category 2 to a Category 4 storm in a matter of hours. As of Tuesday evening, Florence had maximum sustained winds of 140 mph (225 kph). Figure 1 shows Hurricane Florence in visible light, much as our eyes would see it. This is a classic image of a strong hurricane, with a well-defined eye near the center of a large, thick cloud shield containing bands of very thick clouds, and high, thin clouds far from the storm where air flows away from the thick rain clouds. AIRS has more than 2,000 "channels" that capture various hues of infrared, and this image represents the temperature of the cloud tops and the ocean surface (called "brightness temperature" in the image). Purple shows very cold clouds high in the atmosphere, blue and green show the warmer temperatures of lower clouds, and red shows the surface. Florence has the characteristics of a mature, powerful hurricane: an extensive, nearly symmetric ring of deep, cold rain clouds in purple; slightly shallower rain clouds in the outer perimeter seen in green; a large area of cloud-free air flowing away from the storm in red; and a well-defined eye (seen as the greenish spot near the center) where warm low clouds can be seen below. https://photojournal.jpl.nasa.gov/catalog/PIA22698
On the morning of October 4, 2016, Hurricane Matthew passed over the island nation of Haiti. A Category 4 storm, it made landfall around 7 a.m. local time (5 a.m. PDT/8 a.m. EDT) with sustained winds over 145 mph. This is the strongest hurricane to hit Haiti in over 50 years. On October 4, at 10:30 a.m. local time (8:30 a.m. PDT/11:30 a.m. EDT), the Multi-angle Imaging SpectroRadiometer (MISR) instrument aboard NASA's Terra satellite passed over Hurricane Matthew. This animation was made from images taken by MISR's downward-pointing (nadir) camera is 235 miles (378 kilometers) across, which is much narrower than the massive diameter of Matthew, so only the hurricane's eye and a portion of the storm's right side are visible. Haiti is completely obscured by Matthew's clouds, but part of the Bahamas is visible to the north. Several hot towers are visible within the central part of the storm, and another at the top right of the image. Hot towers are enormous thunderheads that punch through the tropopause (the boundary between the lowest layer of the atmosphere, the troposphere, and the next level, the stratosphere). The rugged topography of Haiti causes uplift within the storm, generating these hot towers and fueling even more rain than Matthew would otherwise dump on the country. MISR has nine cameras fixed at different angles, which capture images of the same point on the ground within about seven minutes. This animation was created by blending images from these nine cameras. The change in angle between the images causes a much larger motion from south to north than actually exists, but the rotation of the storm is real motion. From this animation, you can get an idea of the incredible height of the hot towers, especially the one to the upper right. The counter-clockwise rotation of Matthew around its closed (cloudy) eye is also visible. These data were acquired during Terra orbit 89345. An animation is available at http://photojournal.jpl.nasa.gov/catalog/PIA21070
NASA's CloudSat satellite flew over Hurricane Irma on Sept. 6, 2017 at 1:45 p.m. EDT (17:45 UTC) as the storm was approaching Puerto Rico in the Atlantic Ocean. Hurricane Irma contained estimated maximum sustained winds of 185 miles per hour (160 knots) with a minimum pressure of 918 millibars. CloudSat transected the eastern edge of Hurricane Irma's eyewall, revealing details of the storm's cloud structure beneath its thick canopy of cirrus clouds. The CloudSat Cloud Profiling Radar excels in detecting the organization and placement of cloud layers beneath a storm's cirrus canopy, which are not readily detected by other satellite sensors. The CloudSat overpass reveals the inner details beneath the cloud tops of this large system; intense areas of convection with moderate to heavy rainfall (deep red and pink colors), cloud-free areas (moats) in between the inner and outer cloud bands of Hurricane Irma and cloud top heights averaging around 9 to 10 miles (15 to 16 kilometers). Lower values of reflectivity (areas of green and blue) denote smaller-sized ice and water particle sizes typically located at the top of a storm system (in the anvil area). The Cloud Profiling Radar loses signal at around 3 miles (5 kilometers) in height (in the melting layer) due to water (ice) particles larger than 0.12 inches (3 millimeters) in diameter. Moderate to heavy rainfall occurs in these areas where signal weakening is detectable. Smaller cumulus and cumulonimbus cloud types are evident as CloudSat moves farther south, beneath the thick cirrus canopy. An animation is available at https://photojournal.jpl.nasa.gov/catalog/PIA21947
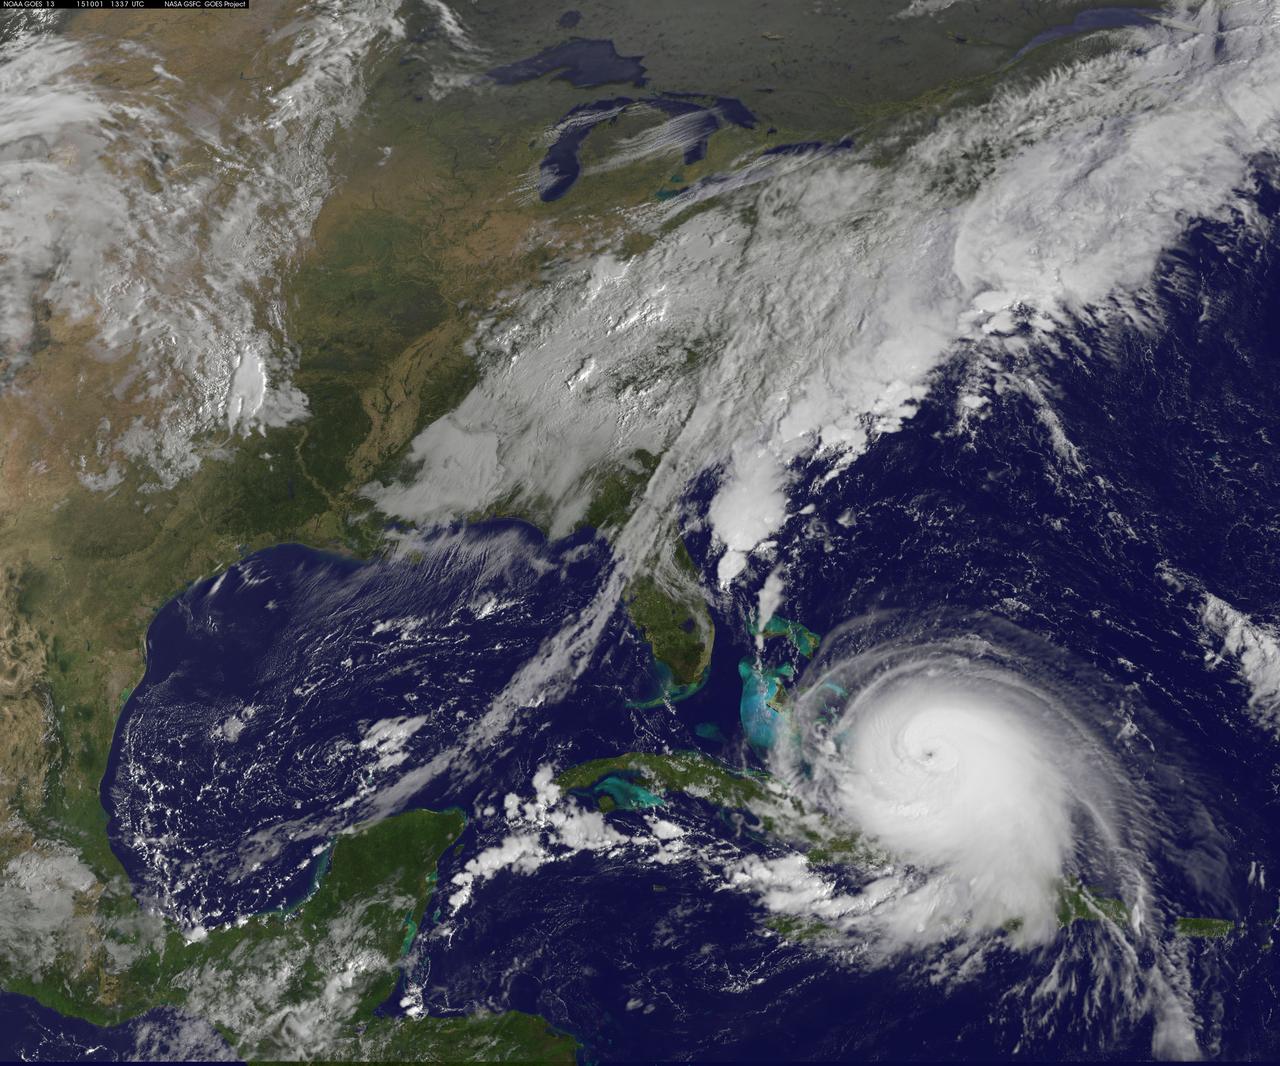
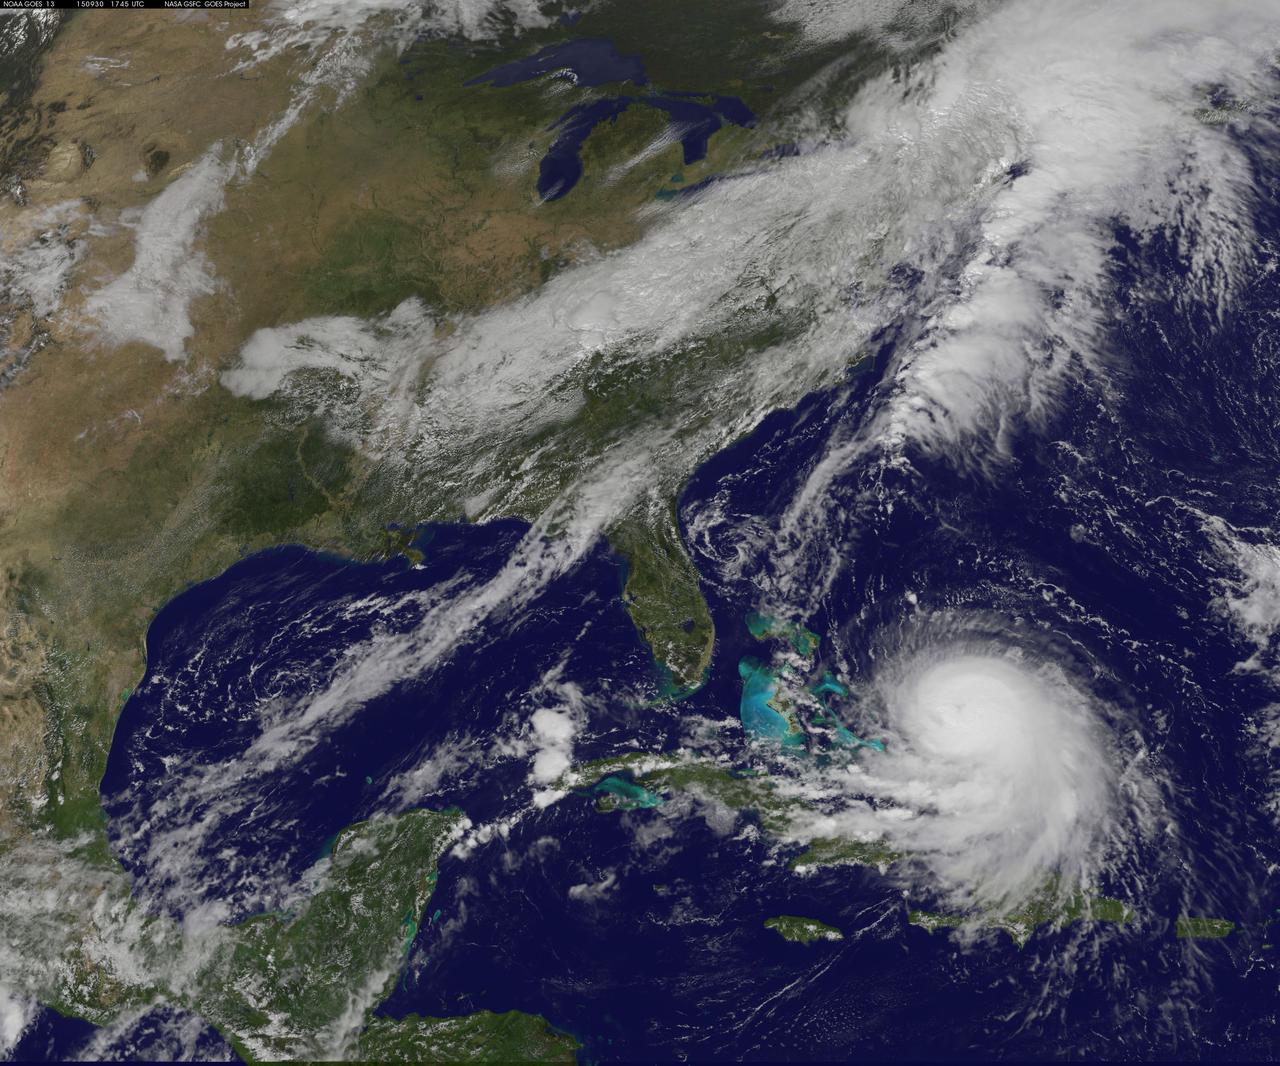
Hurricane Joaquin continued to intensify in the Bahamas on October 1 and NASA and NOAA satellites have been providing valuable data on the storm. NASA's GPM and Terra satellites and NOAA's GOES-East satellite provided rainfall, cloud extent, cloud height and other data to forecasters. Joaquin became a major hurricane today, October 1, reaching Category 3 status on the Saffir-Simpson Wind Scale. On October 1 at 1330 UTC (9:30 a.m. EDT) NOAA's GOES-East satellite captured this visible image of Hurricane Joaquin covering the southern Bahamas and extending over southeastern Cuba, and the island of Hispaniola (which includes Haiti and the Dominican Republic). Joaquin's eye had become completely visible now that the storm had reached Category 3 status. On October 1, a Hurricane Warning was in effect for the Central Bahamas, Northwestern Bahamas including the Abacos, Berry Islands, Eleuthera, Grand Bahama Island, and New Providence, The Acklins, Crooked Island, and Mayaguana in the southeastern Bahamas. A Hurricane Watch was in effect for Bimini and Andros Island, and a Tropical Storm Warning was in effect for the remainder of the southeastern Bahamas excluding the Turks and Caicos Islands and Andros Island. According to NHC, at 8 a.m. EDT (1200 UTC), the center of Hurricane Joaquin was located near latitude 23.2 North, longitude 73.7 West. That's just 10 miles (15 km) north of Samana Cays, Bahamas and about 75 miles (120 km) southeast of San Salvador, Bahamas. Joaquin was moving toward the west-southwest near 5 mph (7 kph), and this motion is expected to continue today. NHC noted that a turn toward the west- northwest is forecast tonight (Oct. 1), followed by a turn toward the north and an increase in forward speed on Friday, Oct. 2. On the forecast track, the center of Joaquin will move near or over portions of the central Bahamas today and tonight and pass near or over portions of the northwestern Bahamas on Friday. Maximum sustained winds are near 120 mph (195 km/h) with higher gusts. Joaquin is a category 3 hurricane on the Saffir-Simpson Hurricane Wind Scale. Some strengthening is forecast in the next day or so, with some fluctuations in intensity possible on Friday. Hurricane force winds extend outward up to 35 miles (55 km) from the center and tropical storm force winds extend outward up to 140 miles (220 km). The minimum central pressure just extrapolated by an Air Force Reserve Hurricane Hunter aircraft is 942 millibars. For updated forecasts, watches and warnings visit the National Hurricane Center (NHC) website: <a href="http://www.nhc.noaa.gov" rel="nofollow">www.nhc.noaa.gov</a>. Credit: NASA/NOAA GOES Project <b><a href="http://www.nasa.gov/audience/formedia/features/MP_Photo_Guidelines.html" rel="nofollow">NASA image use policy.</a></b> <b><a href="http://www.nasa.gov/centers/goddard/home/index.html" rel="nofollow">NASA Goddard Space Flight Center</a></b> enables NASA’s mission through four scientific endeavors: Earth Science, Heliophysics, Solar System Exploration, and Astrophysics. Goddard plays a leading role in NASA’s accomplishments by contributing compelling scientific knowledge to advance the Agency’s mission. <b>Follow us on <a href="http://twitter.com/NASAGoddardPix" rel="nofollow">Twitter</a></b> <b>Like us on <a href="http://www.facebook.com/pages/Greenbelt-MD/NASA-Goddard/395013845897?ref=tsd" rel="nofollow">Facebook</a></b> <b>Find us on <a href="http://instagrid.me/nasagoddard/?vm=grid" rel="nofollow">Instagram</a></b>
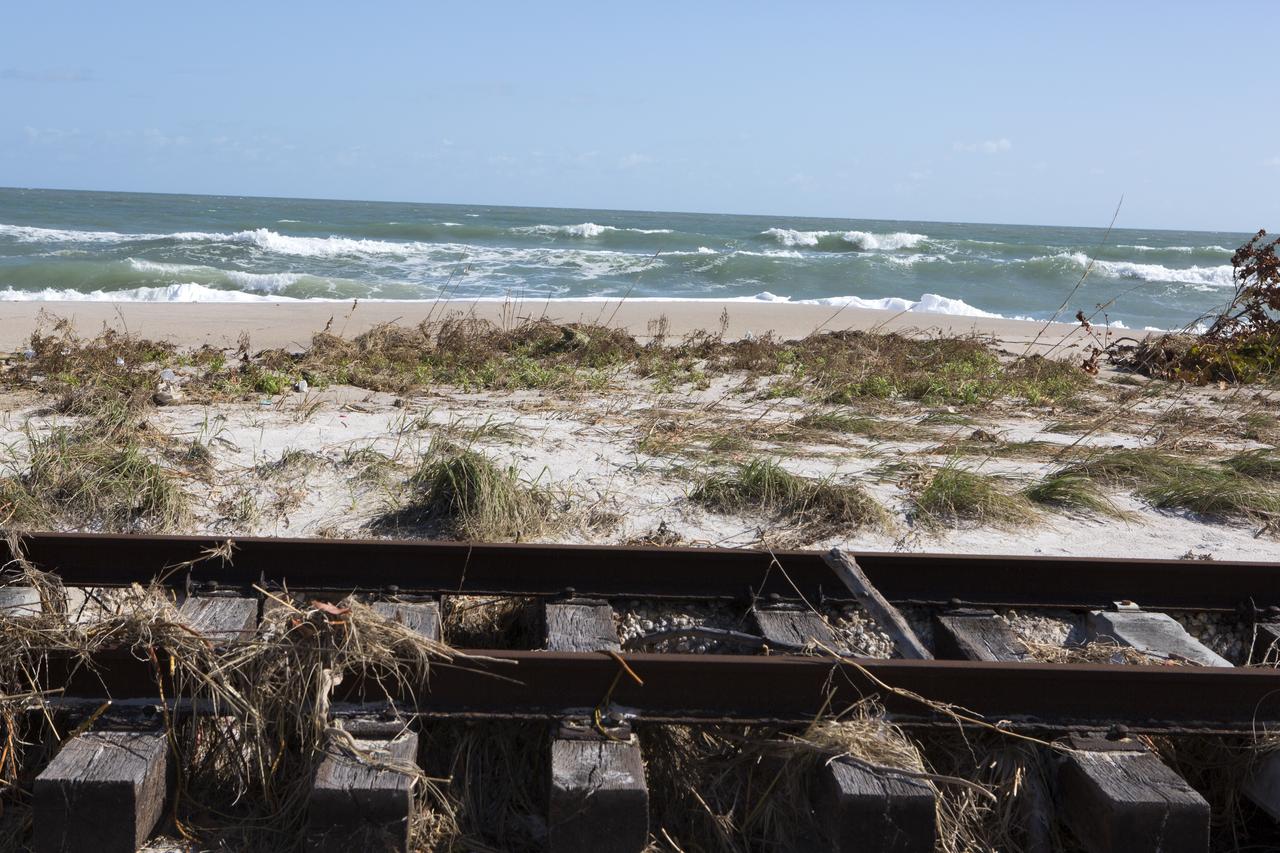
Plant debris left behind by Hurricane Matthew covers a stretch of the NASA Railroad near Launch Pads 39A and B at Kennedy Space Center in Florida. A portion of the line near the ocean was used during the Apollo era, although some portions were used to deliver commodities to the nearby Cape Canaveral Air Force Station through the end of the Titan program. NASA determined it was financially and ecologically advantageous to leave the tracks in place. Hurricane Matthew, a Category 3 storm, passed to the east of Kennedy on Oct. 6 and 7, 2016. The center received some isolated roof damage, damaged support buildings, a few downed power lines, and limited water intrusion. Beach erosion also occurred, although the storm surge was less than expected.

Plant debris left behind by Hurricane Matthew covers a stretch of the NASA Railroad at Kennedy Space Center in Florida. A portion of the line near the ocean was used during the Apollo era, although some portions were used to deliver commodities to the nearby Cape Canaveral Air Force Station through the end of the Titan program. NASA determined it was financially and ecologically advantageous to leave the tracks in place. Hurricane Matthew, a Category 3 storm, passed to the east of Kennedy on Oct. 6 and 7, 2016. The center received some isolated roof damage, damaged support buildings, a few downed power lines, and limited water intrusion. Beach erosion also occurred, although the storm surge was less than expected.
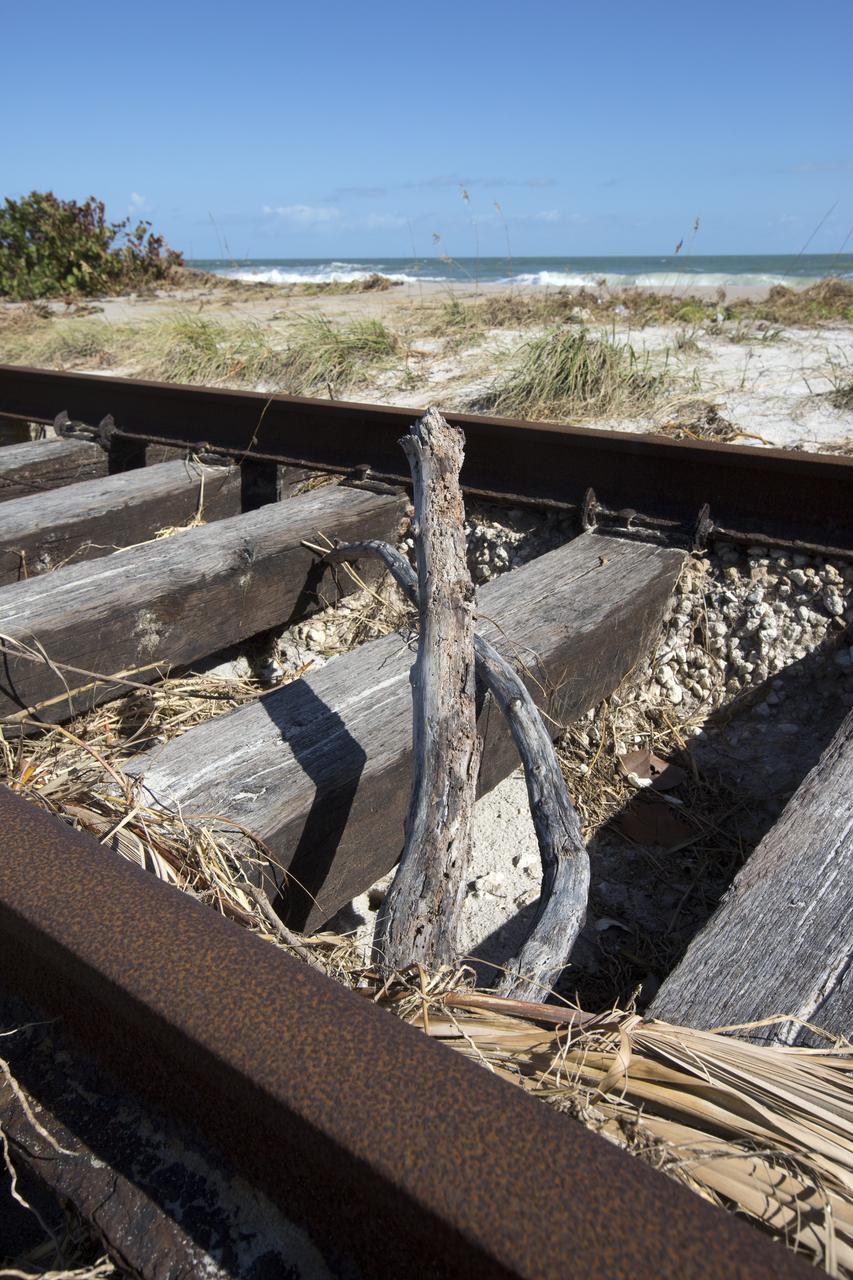
Plant debris and ground erosion left behind by Hurricane Matthew affect a stretch of the NASA Railroad at Kennedy Space Center in Florida. A portion of the line near the ocean was used during the Apollo era, although some portions were used to deliver commodities to the nearby Cape Canaveral Air Force Station through the end of the Titan program. NASA determined it was financially and ecologically advantageous to leave the tracks in place. Hurricane Matthew, a Category 3 storm, passed to the east of Kennedy on Oct. 6 and 7, 2016. The center received some isolated roof damage, damaged support buildings, a few downed power lines, and limited water intrusion. Beach erosion also occurred, although the storm surge was less than expected.
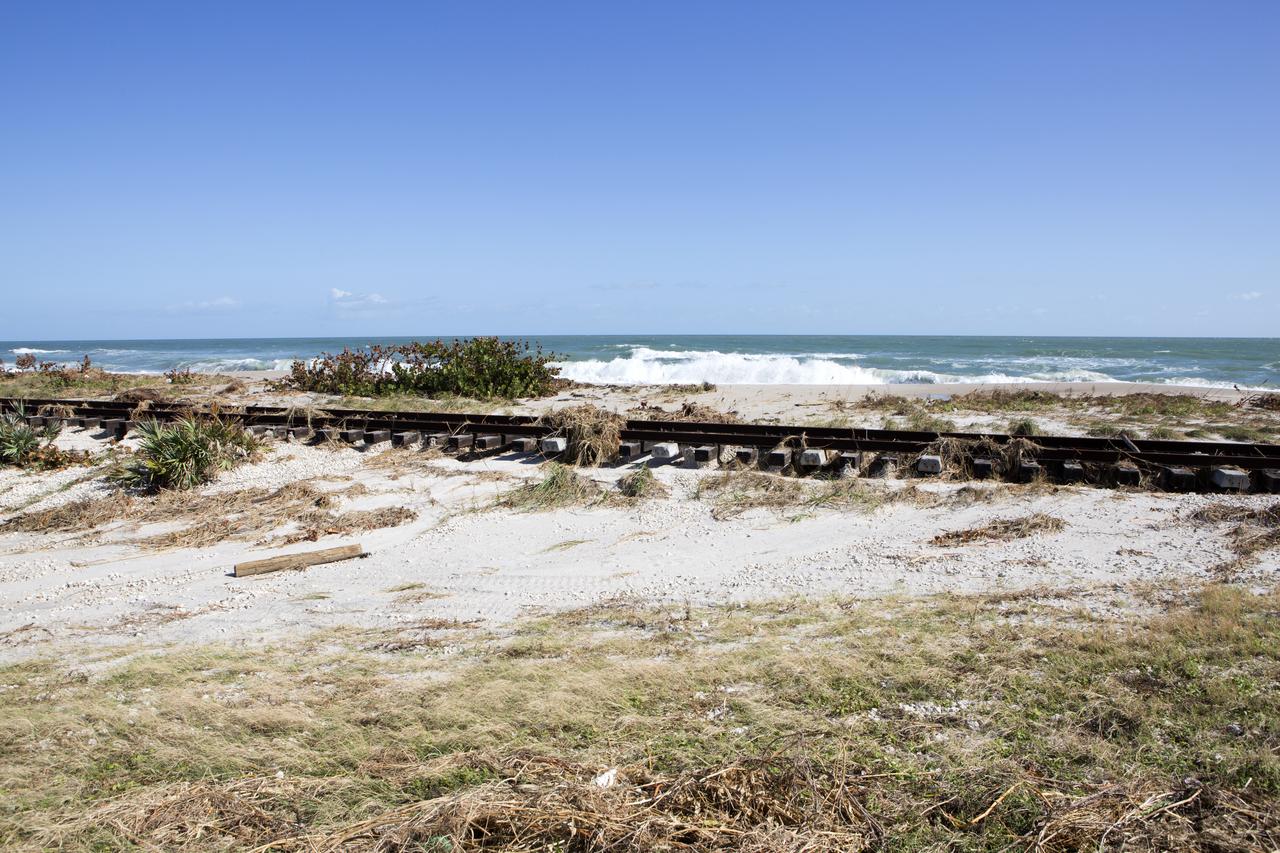
Plant debris left behind by Hurricane Matthew covers a stretch of the NASA Railroad near Launch Pads 39A and B at Kennedy Space Center in Florida. A portion of the line near the ocean was used during the Apollo era, although some portions were used to deliver commodities to the nearby Cape Canaveral Air Force Station through the end of the Titan program. NASA determined it was financially and ecologically advantageous to leave the tracks in place. Hurricane Matthew, a Category 3 storm, passed to the east of Kennedy on Oct. 6 and 7, 2016. The center received some isolated roof damage, damaged support buildings, a few downed power lines, and limited water intrusion. Beach erosion also occurred, although the storm surge was less than expected.
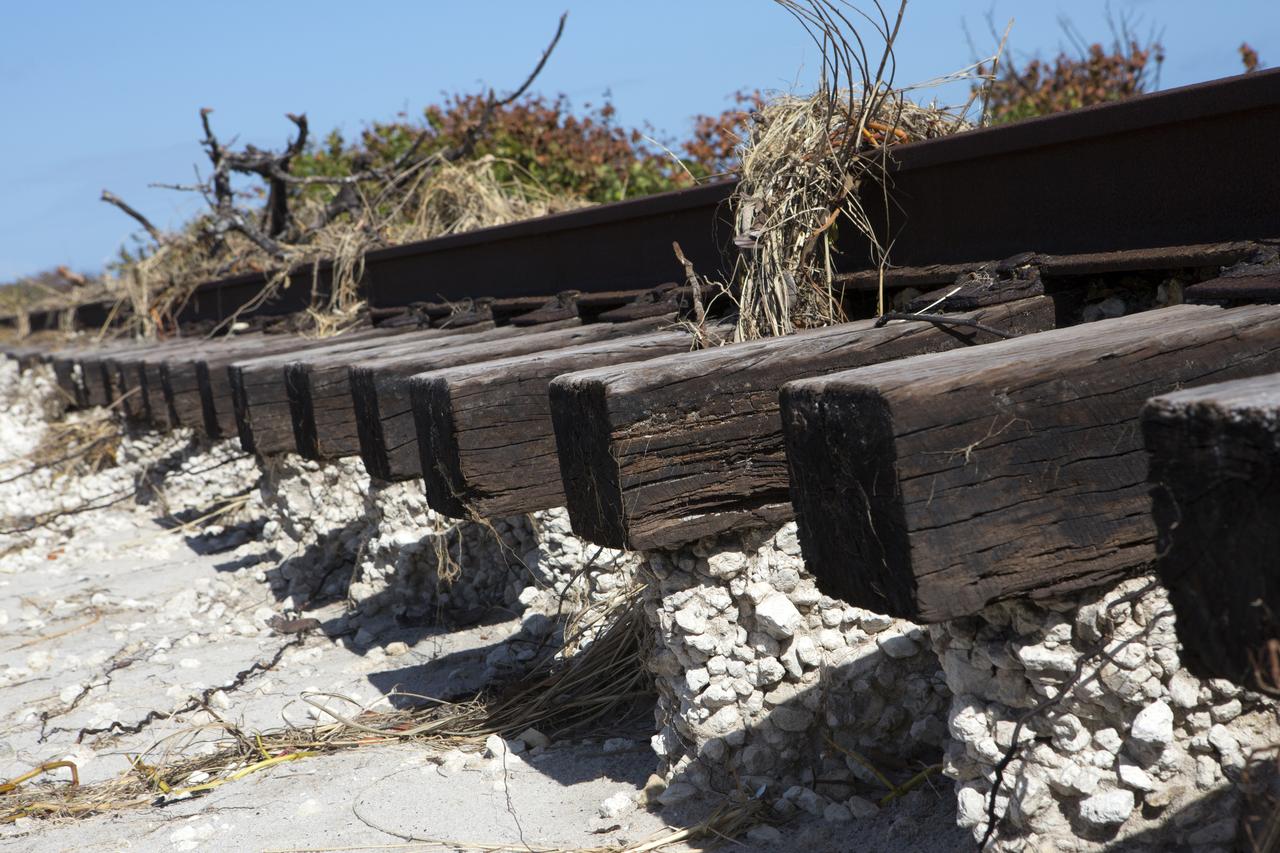
Plant debris and ground erosion left behind by Hurricane Matthew affect a stretch of the NASA Railroad at Kennedy Space Center in Florida. A portion of the line near the ocean was used during the Apollo era, although some portions were used to deliver commodities to the nearby Cape Canaveral Air Force Station through the end of the Titan program. NASA determined it was financially and ecologically advantageous to leave the tracks in place. Hurricane Matthew, a Category 3 storm, passed to the east of Kennedy on Oct. 6 and 7, 2016. The center received some isolated roof damage, damaged support buildings, a few downed power lines, and limited water intrusion. Beach erosion also occurred, although the storm surge was less than expected.
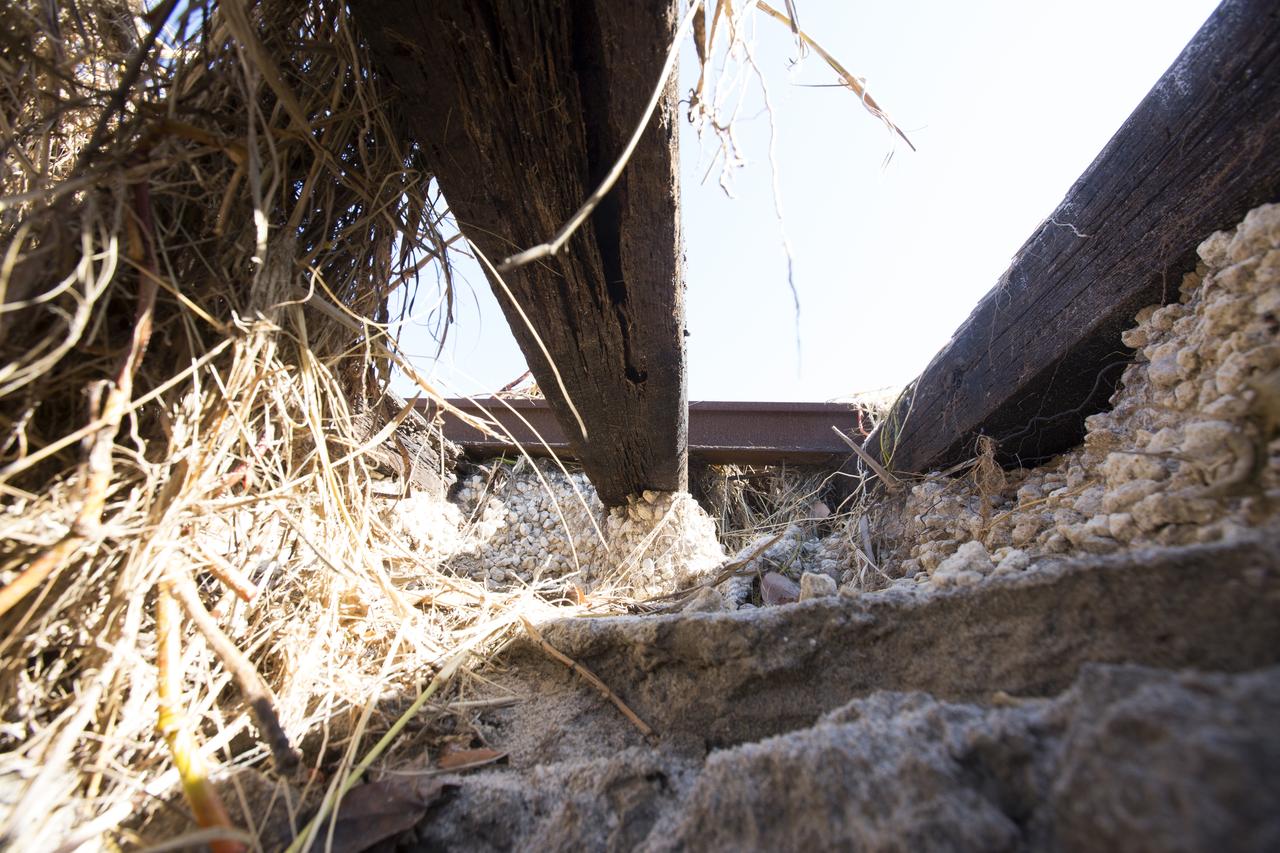
Erosion caused by Hurricane Matthew has worn away sections of the ground beneath the NASA Railroad at Kennedy Space Center in Florida. A portion of the line near the ocean was used during the Apollo era, although some portions were used to deliver commodities to the nearby Cape Canaveral Air Force Station through the end of the Titan program. NASA determined it was financially and ecologically advantageous to leave the tracks in place. Hurricane Matthew, a Category 3 storm, passed to the east of Kennedy on Oct. 6 and 7, 2016. The center received some isolated roof damage, damaged support buildings, a few downed power lines, and limited water intrusion. Beach erosion also occurred, although the storm surge was less than expected.
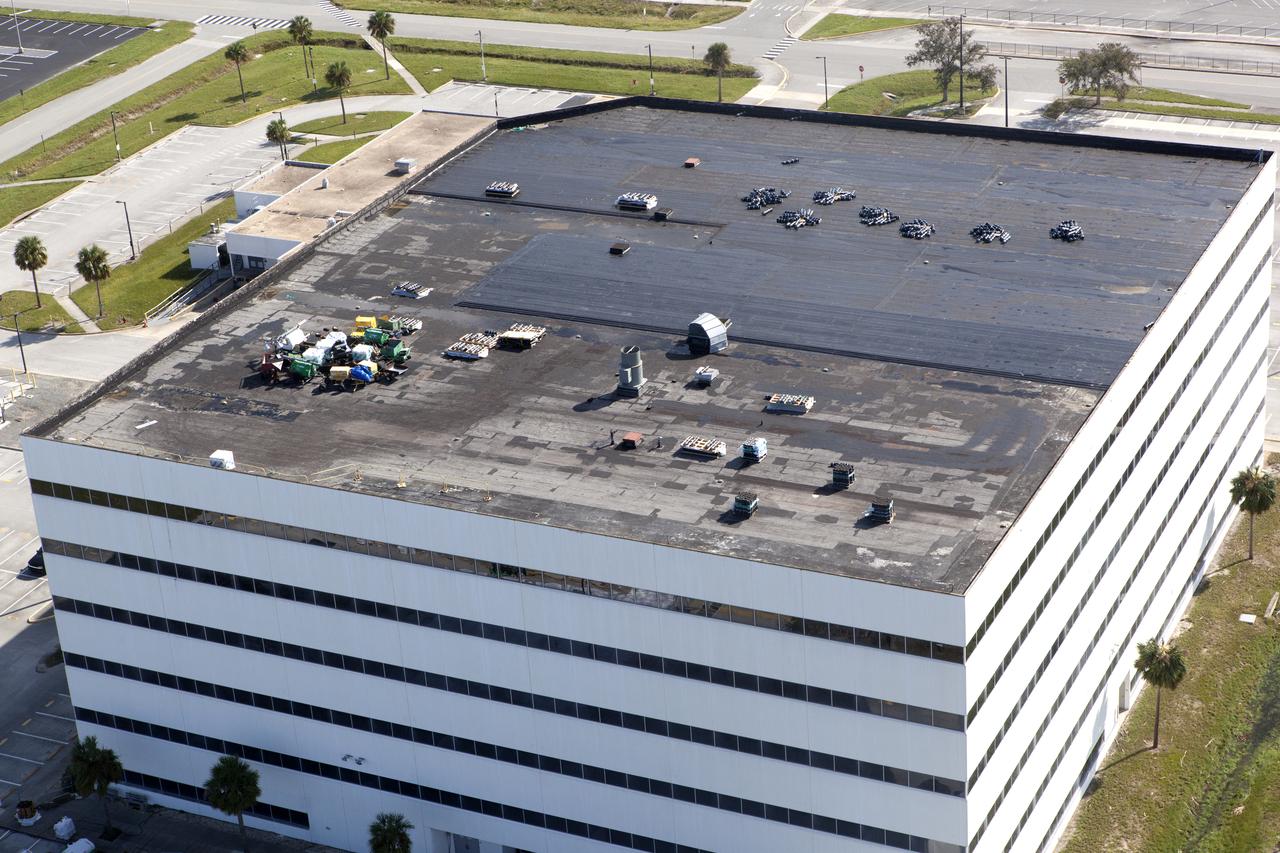
The Operations Support Building I (OSB I) is seen during an aerial survey of NASA's Kennedy Space Center in Florida on September 12, 2017. The roof of the building is currently undergoing repair from Hurricane Matthew. The survey was performed to identify structures and facilities that may have sustained damage from Hurricane Irma as the storm passed Kennedy on September 10, 2017. NASA closed the center ahead of the storm's onset and only a small team of specialists known as the Rideout Team was on the center as the storm approached and passed.
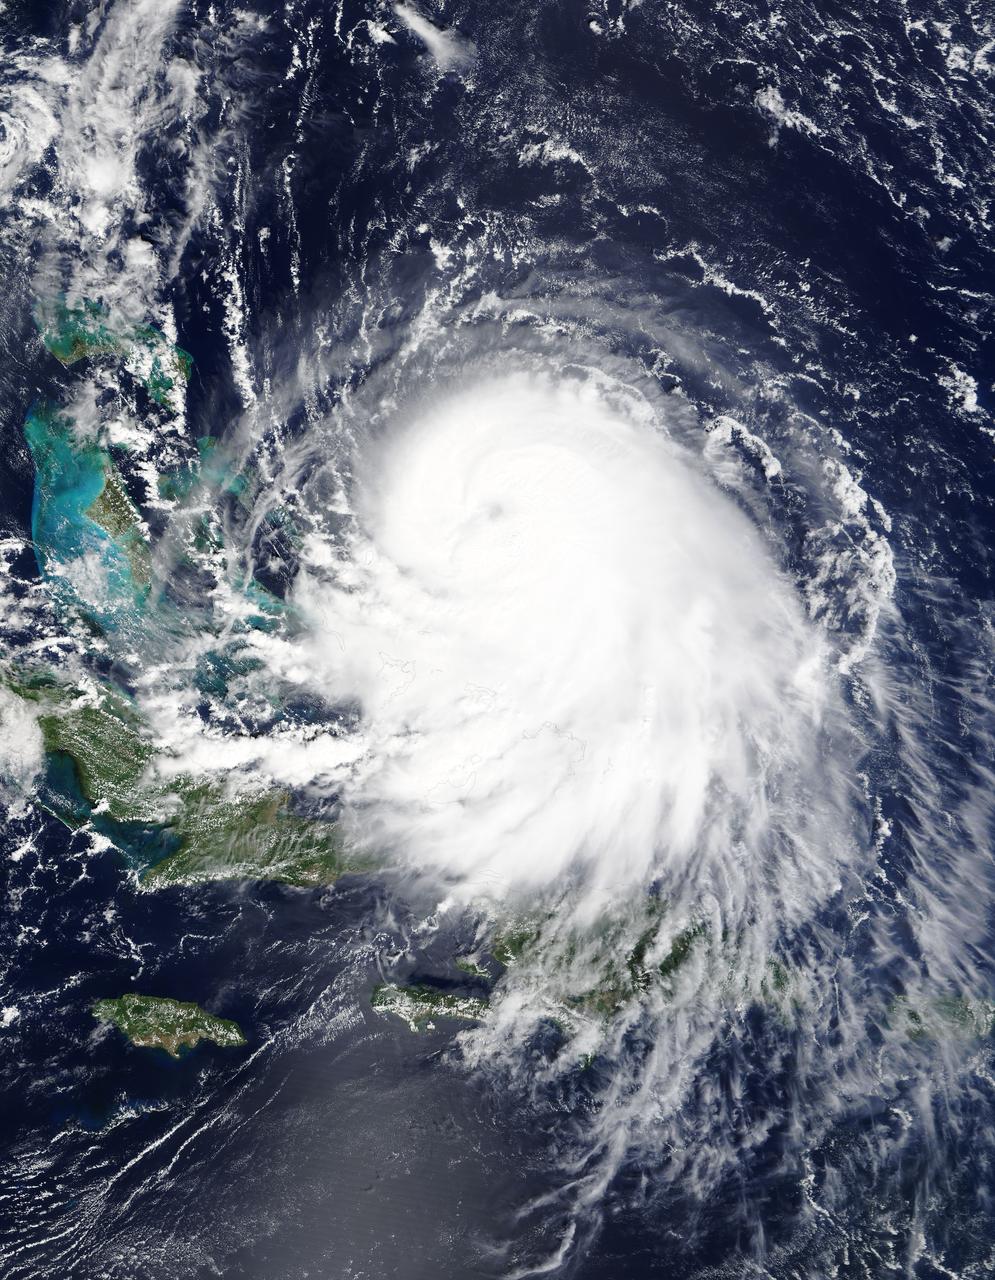
The MODIS instrument on NASA's Terra satellite captured Hurricane Joaquin off the Bahamas at 15:45 UTC (11:45 a.m. EDT) on September 30, 2015. Credit: NASA/GSFC/Jeff Schmaltz/MODIS Land Rapid Response Team At 11 a.m. EDT (1500 UTC) on Wednesday, September 30, 2015 the center of Hurricane Joaquin was located near latitude 24.7 North, longitude 72.6 West. That puts the center of Joaquin about 215 miles (345 km) east-northeast of the Central Bahamas. Joaquin became a tropical storm Monday evening (EDT), September 29 when it was midway between the Bahamas and Bermuda. By 8 a.m. EDT on September 30, it strengthened into a hurricane and has become the third hurricane of the Atlantic Hurricane season. On September 30, the National Hurricane Center issued a Hurricane Warning for the central Bahamas including Cat Island, the Exumas, Long Island, Rum Cay, and San Salvador. A Hurricane Watch is in effect for the northwestern Bahamas including the Abacos, Berry Islands, Bimini, Eleuthera, Grand Bahama Island, and New Providence, but excluding Andros Island. <b><a href="http://www.nasa.gov/audience/formedia/features/MP_Photo_Guidelines.html" rel="nofollow">NASA image use policy.</a></b> <b><a href="http://www.nasa.gov/centers/goddard/home/index.html" rel="nofollow">NASA Goddard Space Flight Center</a></b> enables NASA’s mission through four scientific endeavors: Earth Science, Heliophysics, Solar System Exploration, and Astrophysics. Goddard plays a leading role in NASA’s accomplishments by contributing compelling scientific knowledge to advance the Agency’s mission. <b>Follow us on <a href="http://twitter.com/NASAGoddardPix" rel="nofollow">Twitter</a></b> <b>Like us on <a href="http://www.facebook.com/pages/Greenbelt-MD/NASA-Goddard/395013845897?ref=tsd" rel="nofollow">Facebook</a></b> <b>Find us on <a href="http://instagrid.me/nasagoddard/?vm=grid" rel="nofollow">Instagram</a></b>
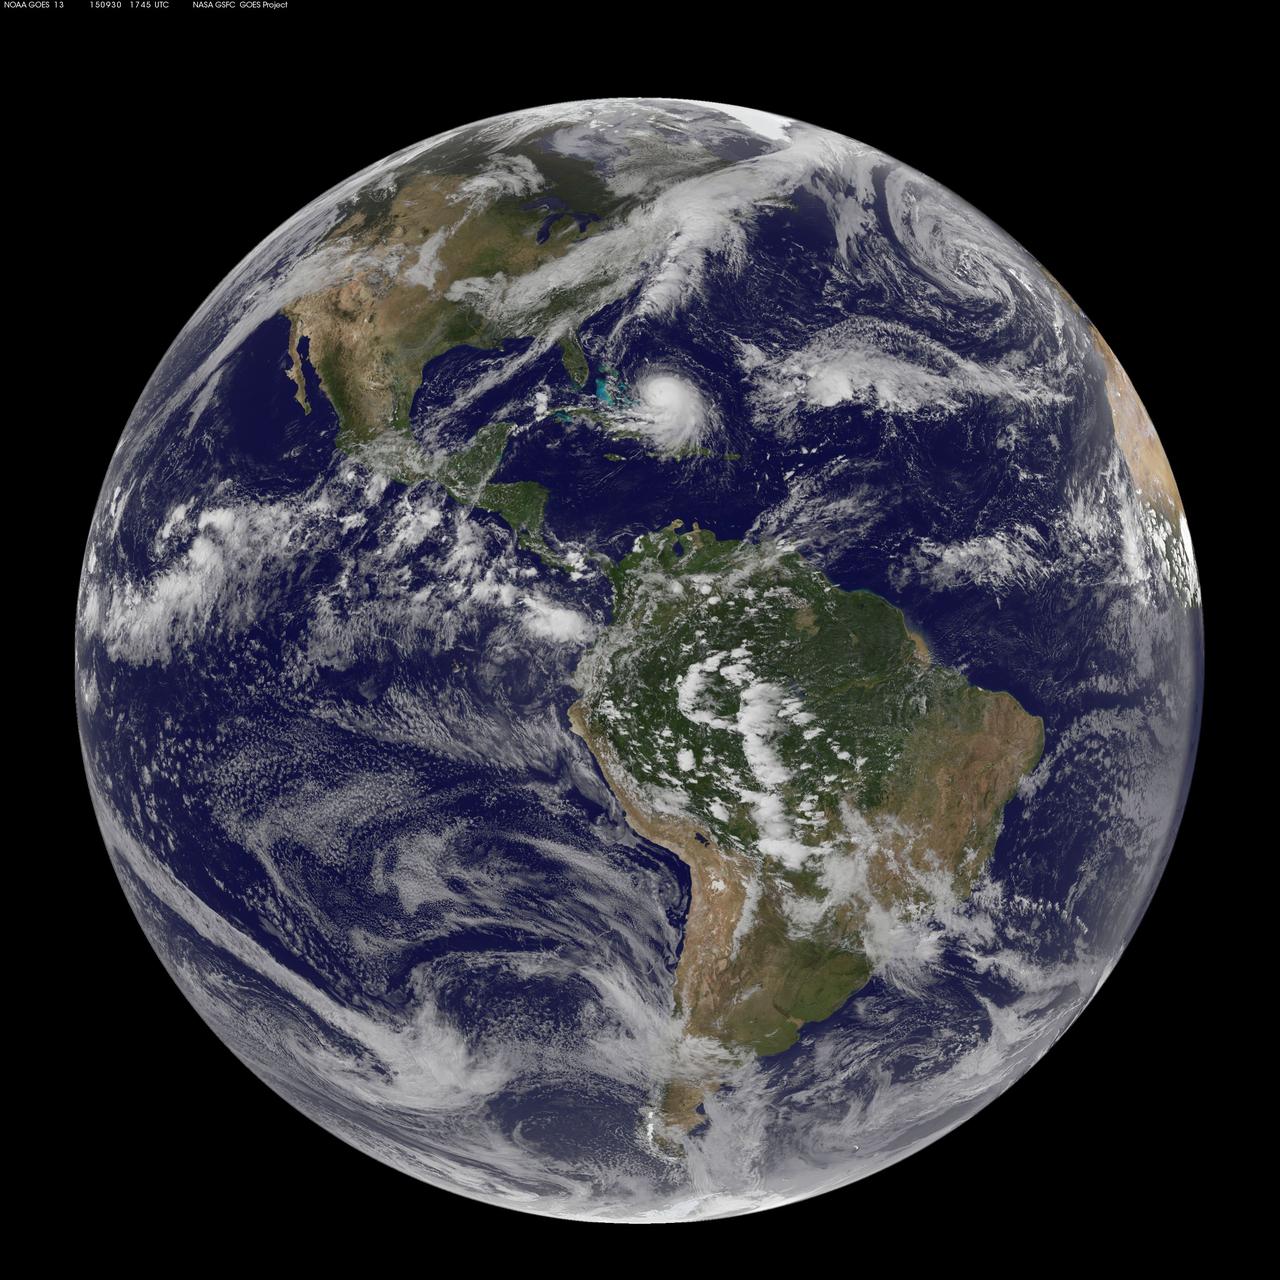
NOAA's GOES-East satellite captured this visible image of Hurricane Joaquin east of the Bahamas on Sept. 30 at 1745 UTC (1:45 p.m. EDT). Credit: NASA/NOAA GOES Project At 11 a.m. EDT (1500 UTC) on Wednesday, September 30, 2015 the center of Hurricane Joaquin was located near latitude 24.7 North, longitude 72.6 West. That puts the center of Joaquin about 215 miles (345 km) east-northeast of the Central Bahamas. Joaquin became a tropical storm Monday evening (EDT), September 29 when it was midway between the Bahamas and Bermuda. By 8 a.m. EDT on September 30, it strengthened into a hurricane and has become the third hurricane of the Atlantic Hurricane season. On September 30, the National Hurricane Center issued a Hurricane Warning for the central Bahamas including Cat Island, the Exumas, Long Island, Rum Cay, and San Salvador. A Hurricane Watch is in effect for the northwestern Bahamas including the Abacos, Berry Islands, Bimini, Eleuthera, Grand Bahama Island, and New Providence, but excluding Andros Island. <b><a href="http://www.nasa.gov/audience/formedia/features/MP_Photo_Guidelines.html" rel="nofollow">NASA image use policy.</a></b> <b><a href="http://www.nasa.gov/centers/goddard/home/index.html" rel="nofollow">NASA Goddard Space Flight Center</a></b> enables NASA’s mission through four scientific endeavors: Earth Science, Heliophysics, Solar System Exploration, and Astrophysics. Goddard plays a leading role in NASA’s accomplishments by contributing compelling scientific knowledge to advance the Agency’s mission. <b>Follow us on <a href="http://twitter.com/NASAGoddardPix" rel="nofollow">Twitter</a></b> <b>Like us on <a href="http://www.facebook.com/pages/Greenbelt-MD/NASA-Goddard/395013845897?ref=tsd" rel="nofollow">Facebook</a></b> <b>Find us on <a href="http://instagrid.me/nasagoddard/?vm=grid" rel="nofollow">Instagram</a></b>
NOAA's GOES-East satellite captured this visible image of Hurricane Joaquin east of the Bahamas on Sept. 30 at 1745 UTC (1:45 p.m. EDT). Credit: NASA/NOAA GOES Project At 11 a.m. EDT (1500 UTC) on Wednesday, September 30, 2015 the center of Hurricane Joaquin was located near latitude 24.7 North, longitude 72.6 West. That puts the center of Joaquin about 215 miles (345 km) east-northeast of the Central Bahamas. Joaquin became a tropical storm Monday evening (EDT), September 29 when it was midway between the Bahamas and Bermuda. By 8 a.m. EDT on September 30, it strengthened into a hurricane and has become the third hurricane of the Atlantic Hurricane season. On September 30, the National Hurricane Center issued a Hurricane Warning for the central Bahamas including Cat Island, the Exumas, Long Island, Rum Cay, and San Salvador. A Hurricane Watch is in effect for the northwestern Bahamas including the Abacos, Berry Islands, Bimini, Eleuthera, Grand Bahama Island, and New Providence, but excluding Andros Island. <b><a href="http://www.nasa.gov/audience/formedia/features/MP_Photo_Guidelines.html" rel="nofollow">NASA image use policy.</a></b> <b><a href="http://www.nasa.gov/centers/goddard/home/index.html" rel="nofollow">NASA Goddard Space Flight Center</a></b> enables NASA’s mission through four scientific endeavors: Earth Science, Heliophysics, Solar System Exploration, and Astrophysics. Goddard plays a leading role in NASA’s accomplishments by contributing compelling scientific knowledge to advance the Agency’s mission. <b>Follow us on <a href="http://twitter.com/NASAGoddardPix" rel="nofollow">Twitter</a></b> <b>Like us on <a href="http://www.facebook.com/pages/Greenbelt-MD/NASA-Goddard/395013845897?ref=tsd" rel="nofollow">Facebook</a></b> <b>Find us on <a href="http://instagrid.me/nasagoddard/?vm=grid" rel="nofollow">Instagram</a></b>
These images of hurricane Alex were captured on August 3, 2004 at 1:30pm EDT. Located in the Atlantic Ocean located about 80 miles south-southeast of Charleston, South Carolina, Alex is now a category 2 hurricane with maximum sustained winds were near 100 mph (161 kph). Alex's center was about 65 miles (104 kilometers) northeast of Cape Hatteras and moving away from the U.S. coast. http://photojournal.jpl.nasa.gov/catalog/PIA00440
NASA's Aqua satellite captured this image of Joaquin near the Bahamas on Sept. 29 at 18:10 UTC (2:10 p.m. EDT). Credit: NASA Goddard MODIS Rapid Response Team At 11 a.m. EDT (1500 UTC) on Wednesday, September 30, 2015 the center of Hurricane Joaquin was located near latitude 24.7 North, longitude 72.6 West. That puts the center of Joaquin about 215 miles (345 km) east-northeast of the Central Bahamas. Joaquin became a tropical storm Monday evening (EDT), September 29 when it was midway between the Bahamas and Bermuda. By 8 a.m. EDT on September 30, it strengthened into a hurricane and has become the third hurricane of the Atlantic Hurricane season. On September 30, the National Hurricane Center issued a Hurricane Warning for the central Bahamas including Cat Island, the Exumas, Long Island, Rum Cay, and San Salvador. A Hurricane Watch is in effect for the northwestern Bahamas including the Abacos, Berry Islands, Bimini, Eleuthera, Grand Bahama Island, and New Providence, but excluding Andros Island. <b><a href="http://www.nasa.gov/audience/formedia/features/MP_Photo_Guidelines.html" rel="nofollow">NASA image use policy.</a></b> <b><a href="http://www.nasa.gov/centers/goddard/home/index.html" rel="nofollow">NASA Goddard Space Flight Center</a></b> enables NASA’s mission through four scientific endeavors: Earth Science, Heliophysics, Solar System Exploration, and Astrophysics. Goddard plays a leading role in NASA’s accomplishments by contributing compelling scientific knowledge to advance the Agency’s mission. <b>Follow us on <a href="http://twitter.com/NASAGoddardPix" rel="nofollow">Twitter</a></b> <b>Like us on <a href="http://www.facebook.com/pages/Greenbelt-MD/NASA-Goddard/395013845897?ref=tsd" rel="nofollow">Facebook</a></b> <b>Find us on <a href="http://instagrid.me/nasagoddard/?vm=grid" rel="nofollow">Instagram</a></b>
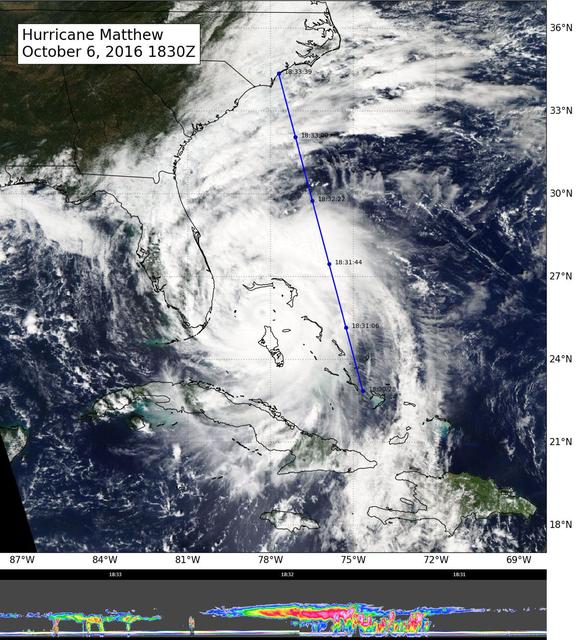
NASA's CloudSat flew east of Hurricane Matthew's center on Oct. 6 at 11:30 a.m. PDT (2:30 p.m. EDT), intersecting parts of Matthew's outer rain bands and revealing Matthew's anvil clouds (thick cirrus cloud cover), with cumulus and cumulonimbus clouds beneath (lower image). Reds/pinks are larger water/ice droplets. http://photojournal.jpl.nasa.gov/catalog/PIA21095
JPL's High-Altitude Monolithic Microwave Integrated Circuit Sounding Radiometer (HAMSR) instrument captured this look inside Hurricane Matthew's spiral clouds on Oct. 7, 2016, flying on a NASA Global Hawk unmanned aircraft. Red colors show cloud bands without precipitation; blues show rain bands. http://photojournal.jpl.nasa.gov/catalog/PIA21093
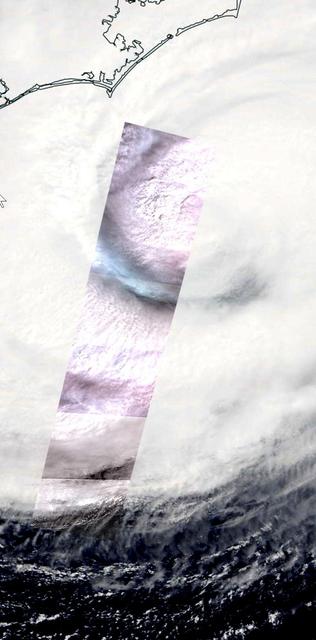
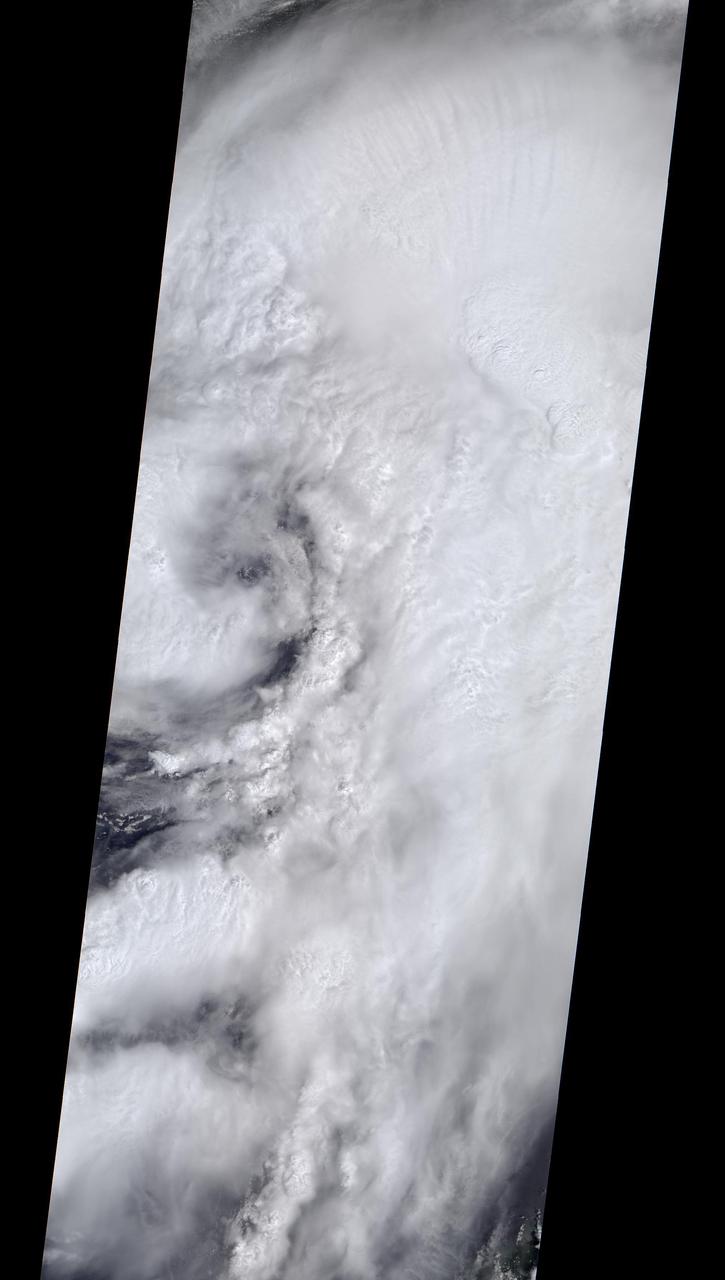
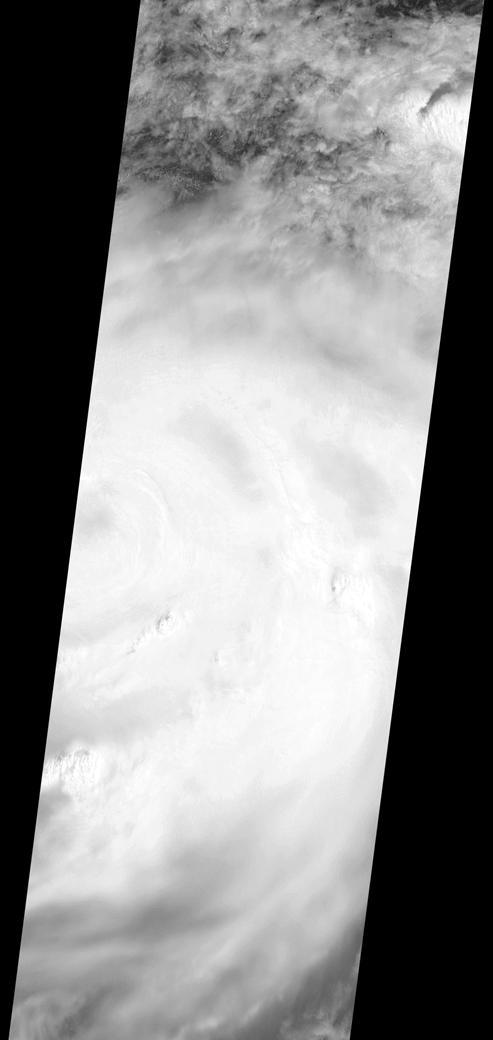
On Thursday, Sept. 13, 2018, the Advanced Spaceborne Thermal Emission and Reflection (ASTER) instrument onboard NASA's Terra spacecraft acquired this image swath over Hurricane Florence as the storm headed for the Eastern seaboard and the Carolinas. The image is a long strip of six individual ASTER scenes, taken in the visible wavelength region. The background is the simultaneously acquired MODIS visible image. The ASTER swath covers an area of 37 by 244 miles (60 by 360 kilometers) acquired at 11:48 am EDT, and is centered at 32.9 degrees north, 76.4 degrees west. https://photojournal.jpl.nasa.gov/catalog/PIA22651
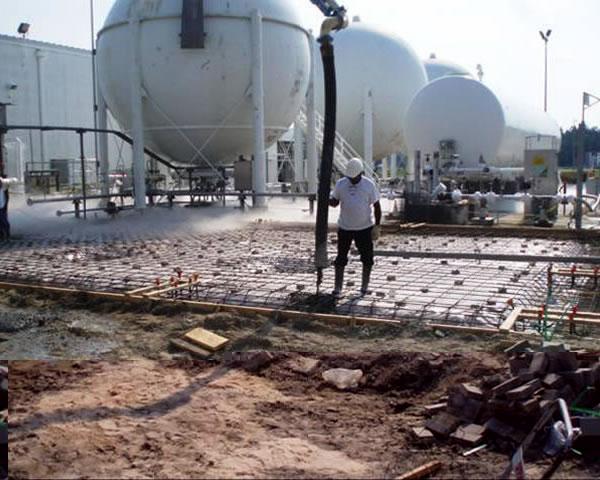
Workers install a bulk diesel storage tank for use at Stennis Space Center. Installation of additional diesel storage tanks is part of the center's hurricane-related risk mitigation work.
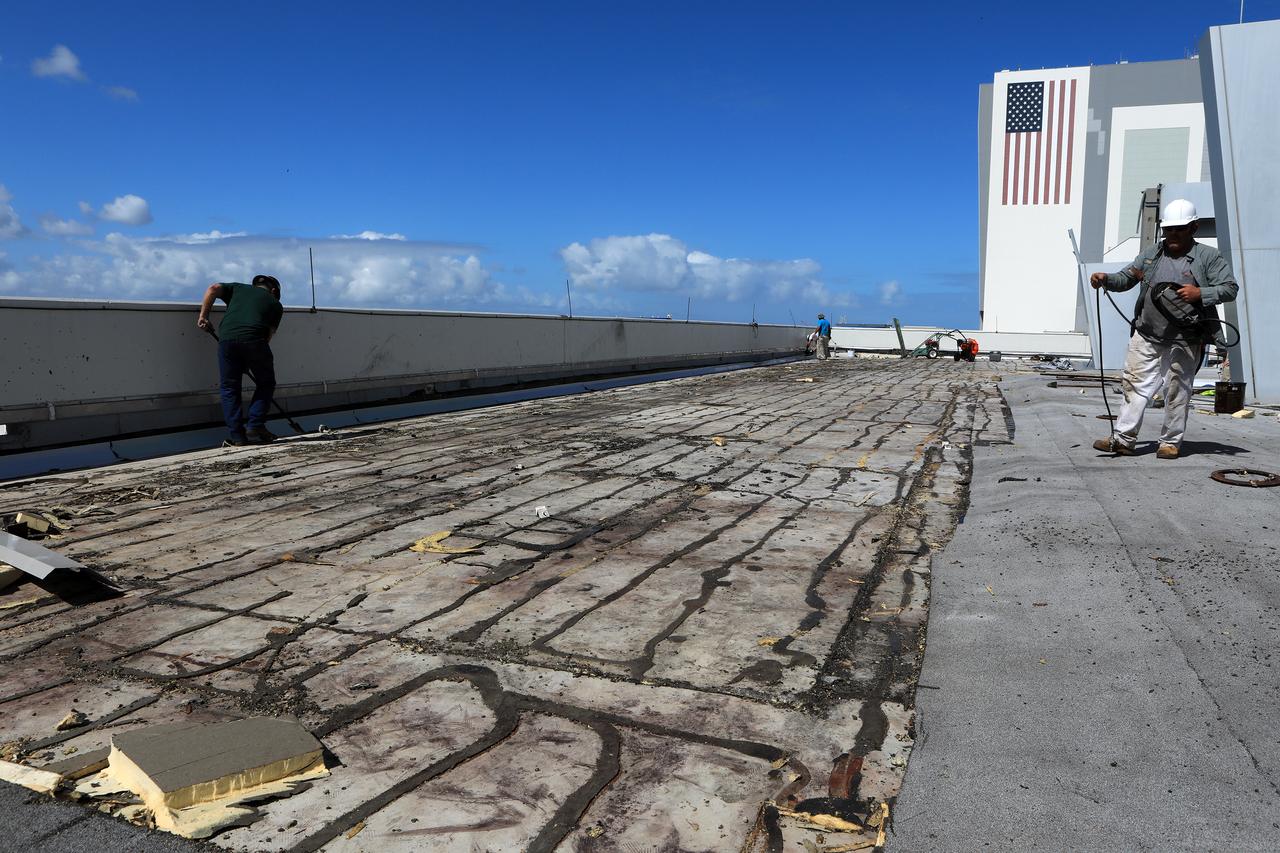
Members of the Disaster Assessment and Recovery Team (DART) repair a section of roof atop the Operations Support Building II at NASA’s Kennedy Space Center in Florida. The effort is part of the spaceport’s ongoing recovery from Hurricane Matthew, which passed to the east of Kennedy on Oct. 6 and 7, 2016. The center received some isolated roof damage, damaged support buildings, a few downed power lines, and limited water intrusion. Beach erosion also occurred, although the storm surge was less than expected.
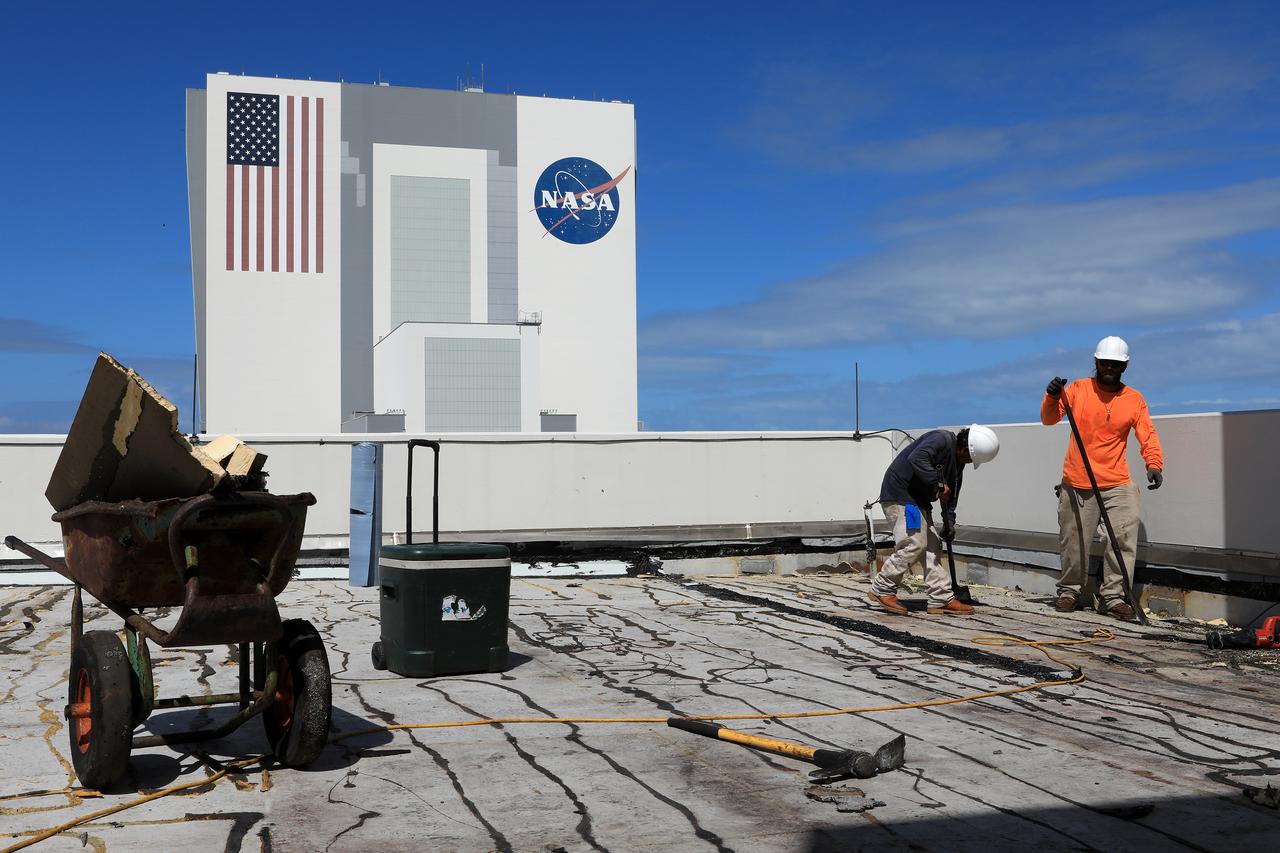
Members of the Disaster Assessment and Recovery Team (DART) repair a section of roof atop the Operations Support Building II at NASA’s Kennedy Space Center in Florida. The effort is part of the spaceport’s ongoing recovery from Hurricane Matthew, which passed to the east of Kennedy on Oct. 6 and 7, 2016. The center received some isolated roof damage, damaged support buildings, a few downed power lines, and limited water intrusion. Beach erosion also occurred, although the storm surge was less than expected.
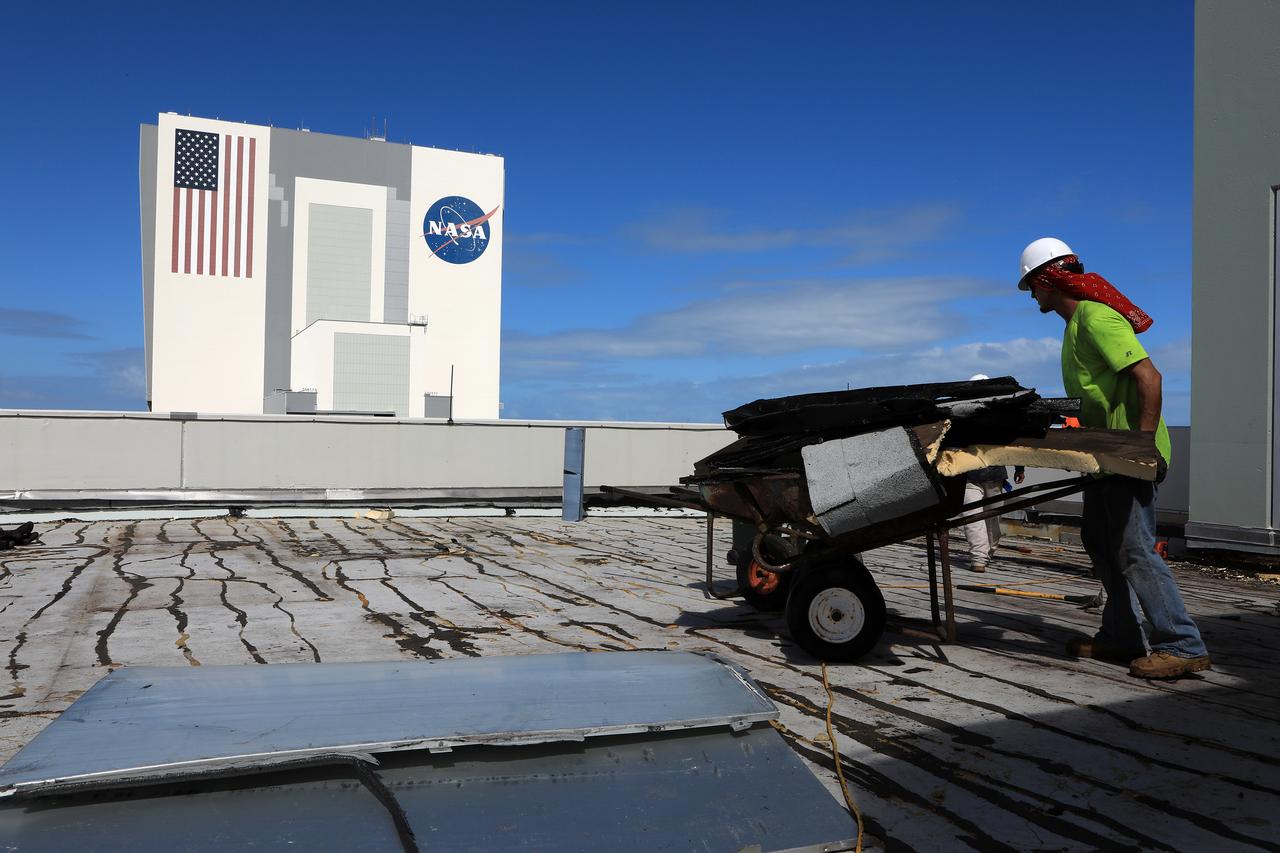
Members of the Disaster Assessment and Recovery Team (DART) repair a section of roof atop the Operations Support Building II at NASA’s Kennedy Space Center in Florida. The effort is part of the spaceport’s ongoing recovery from Hurricane Matthew, which passed to the east of Kennedy on Oct. 6 and 7, 2016. The center received some isolated roof damage, damaged support buildings, a few downed power lines, and limited water intrusion. Beach erosion also occurred, although the storm surge was less than expected.
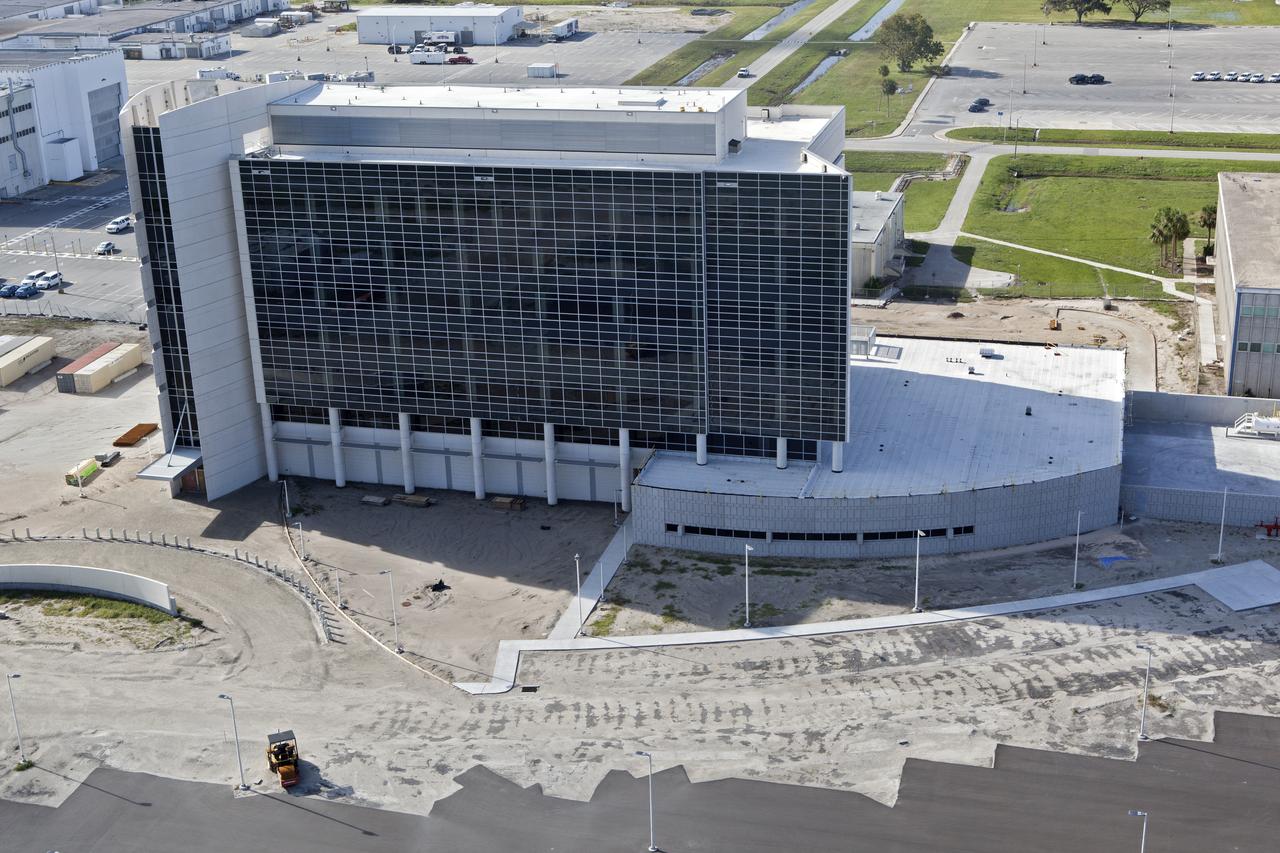
The Central Campus construction site is seen during an aerial survey of NASA's Kennedy Space Center in Florida on September 12, 2017. The survey was performed to identify structures and facilities that may have sustained damage from Hurricane Irma as the storm passed Kennedy on September 10, 2017. NASA closed the center ahead of the storm’s onset and only a small team of specialists known as the Rideout Team was on the center as the storm approached and passed.
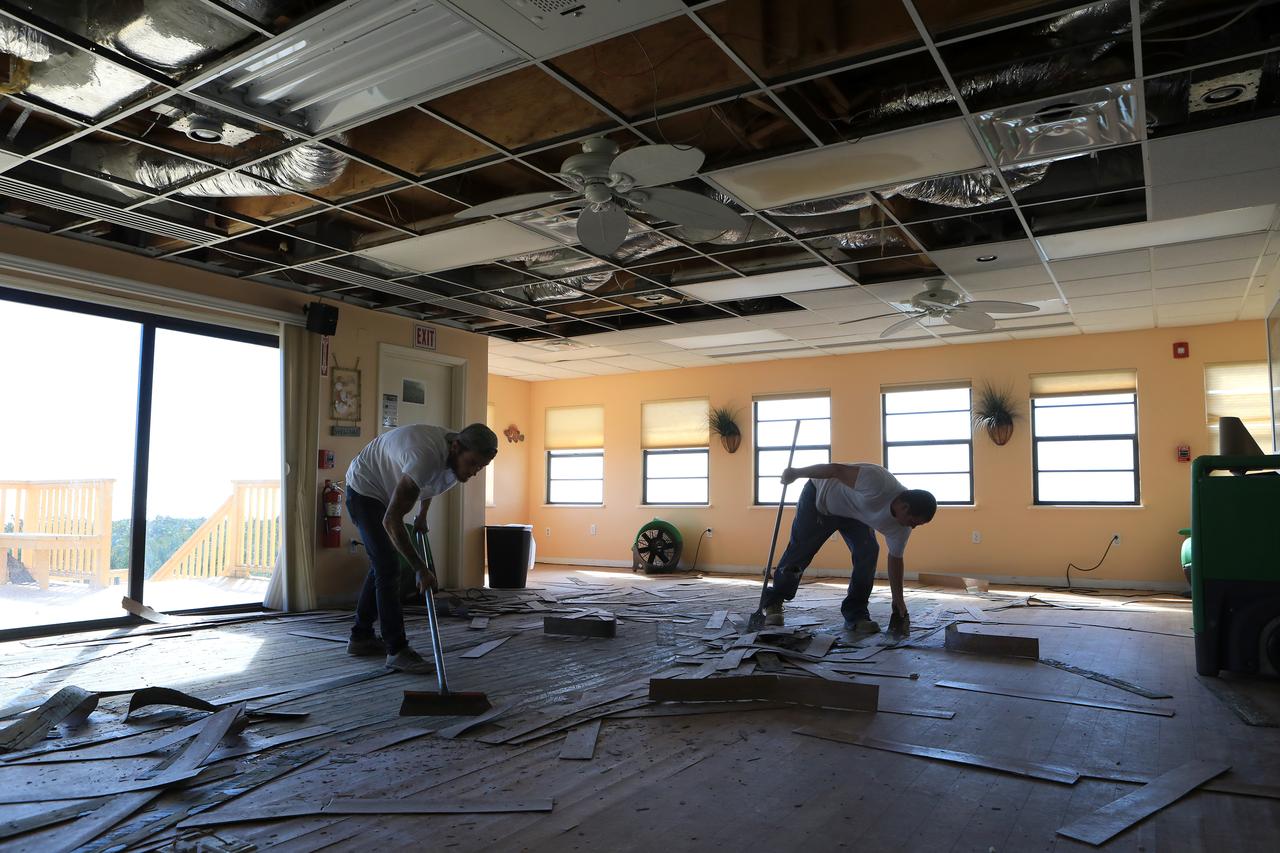
Members of the Disaster Assessment and Recovery Team (DART) work on flooring repairs to the Beach House at NASA’s Kennedy Space Center in Florida. The effort is part of the spaceport’s ongoing recovery from Hurricane Matthew, which passed to the east of Kennedy on Oct. 6 and 7, 2016. The center received some isolated roof damage, damaged support buildings, a few downed power lines, and limited water intrusion. Beach erosion also occurred, although the storm surge was less than expected.
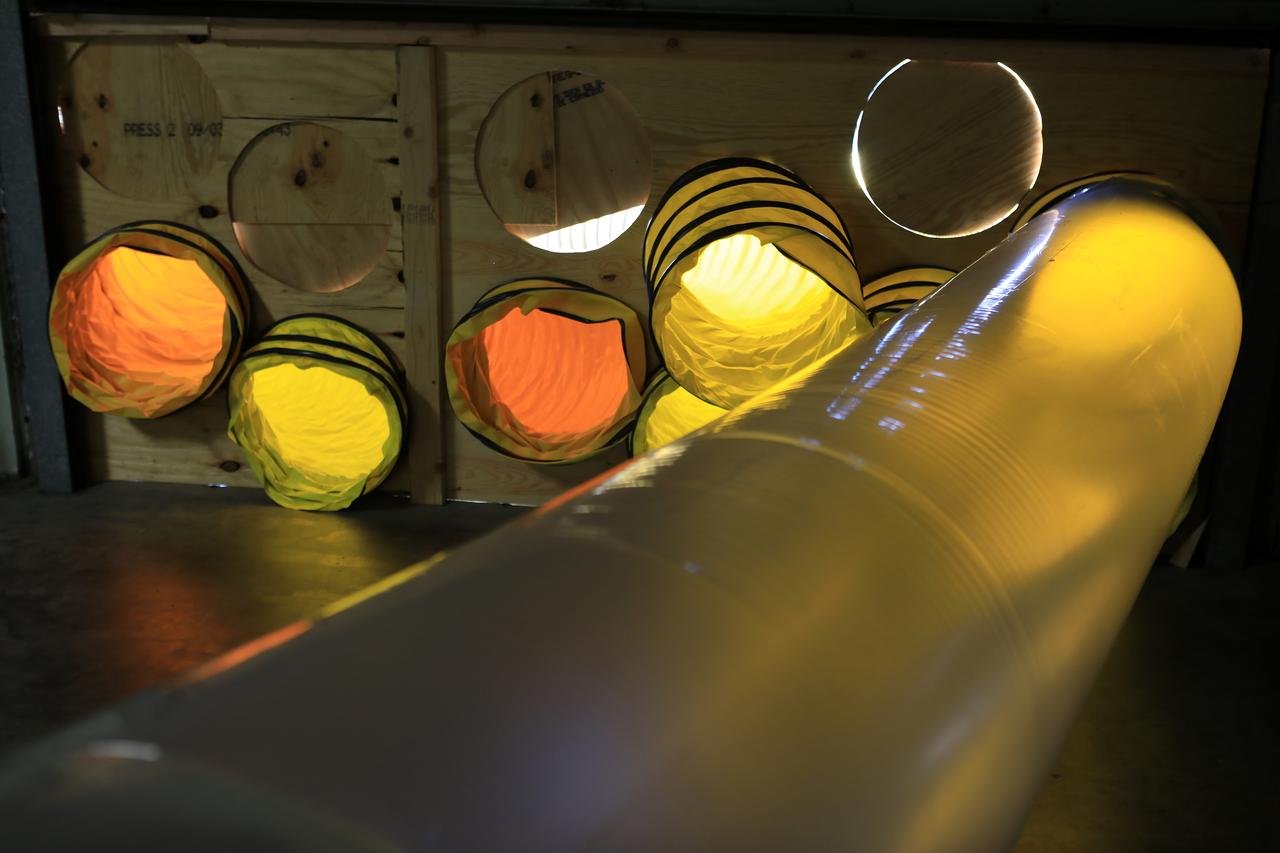
Tubing provides ventilation through boarded-up windows on the Operations Support Building II at NASA’s Kennedy Space Center in Florida. Members of the Disaster Assessment and Recovery Team (DART) are working on repairs to the facility following Hurricane Matthew, which passed to the east of Kennedy on Oct. 6 and 7, 2016. The center received some isolated roof damage, damaged support buildings, a few downed power lines, and limited water intrusion. Beach erosion also occurred, although the storm surge was less than expected.
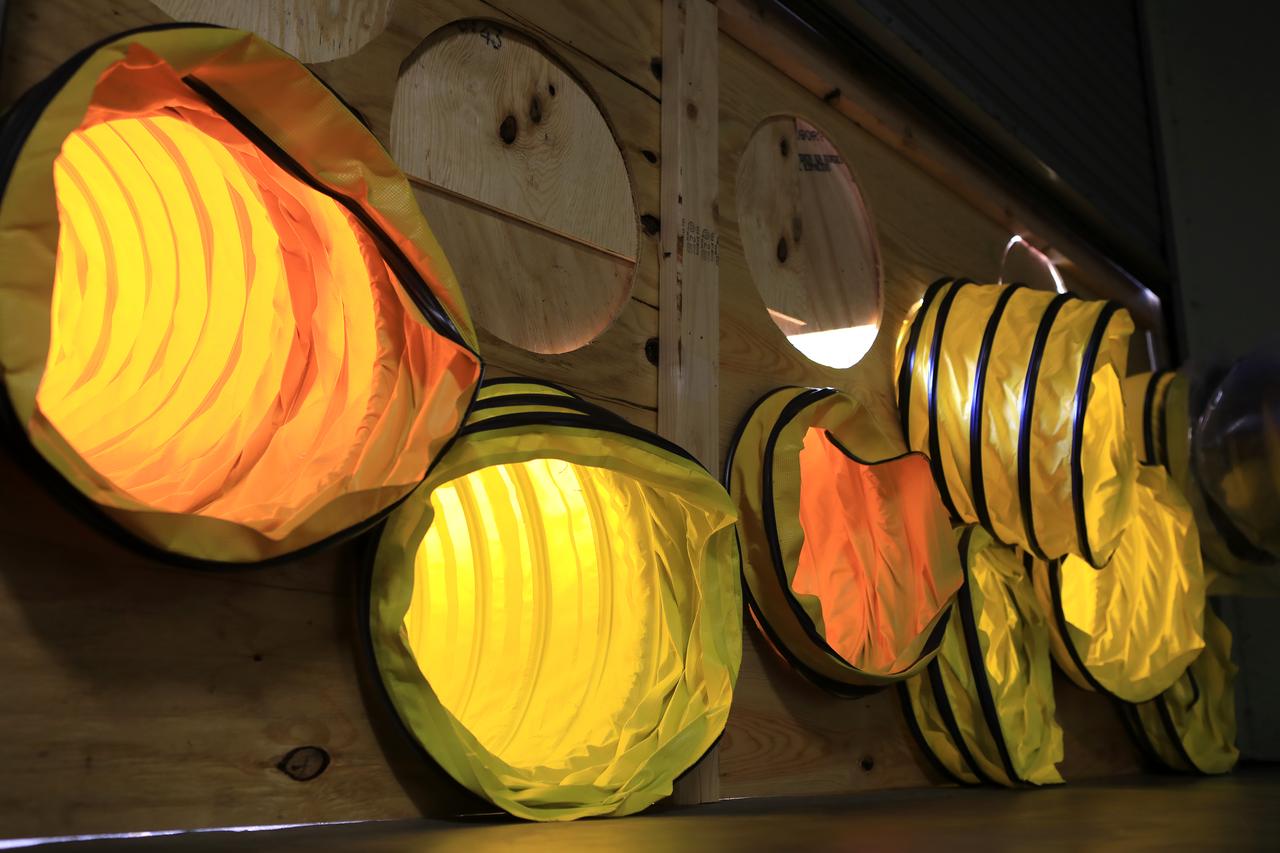
Tubing provides ventilation through boarded-up windows on the Operations Support Building II at NASA’s Kennedy Space Center in Florida. Members of the Disaster Assessment and Recovery Team (DART) are working on repairs to the facility following Hurricane Matthew, which passed to the east of Kennedy on Oct. 6 and 7, 2016. The center received some isolated roof damage, damaged support buildings, a few downed power lines, and limited water intrusion. Beach erosion also occurred, although the storm surge was less than expected.
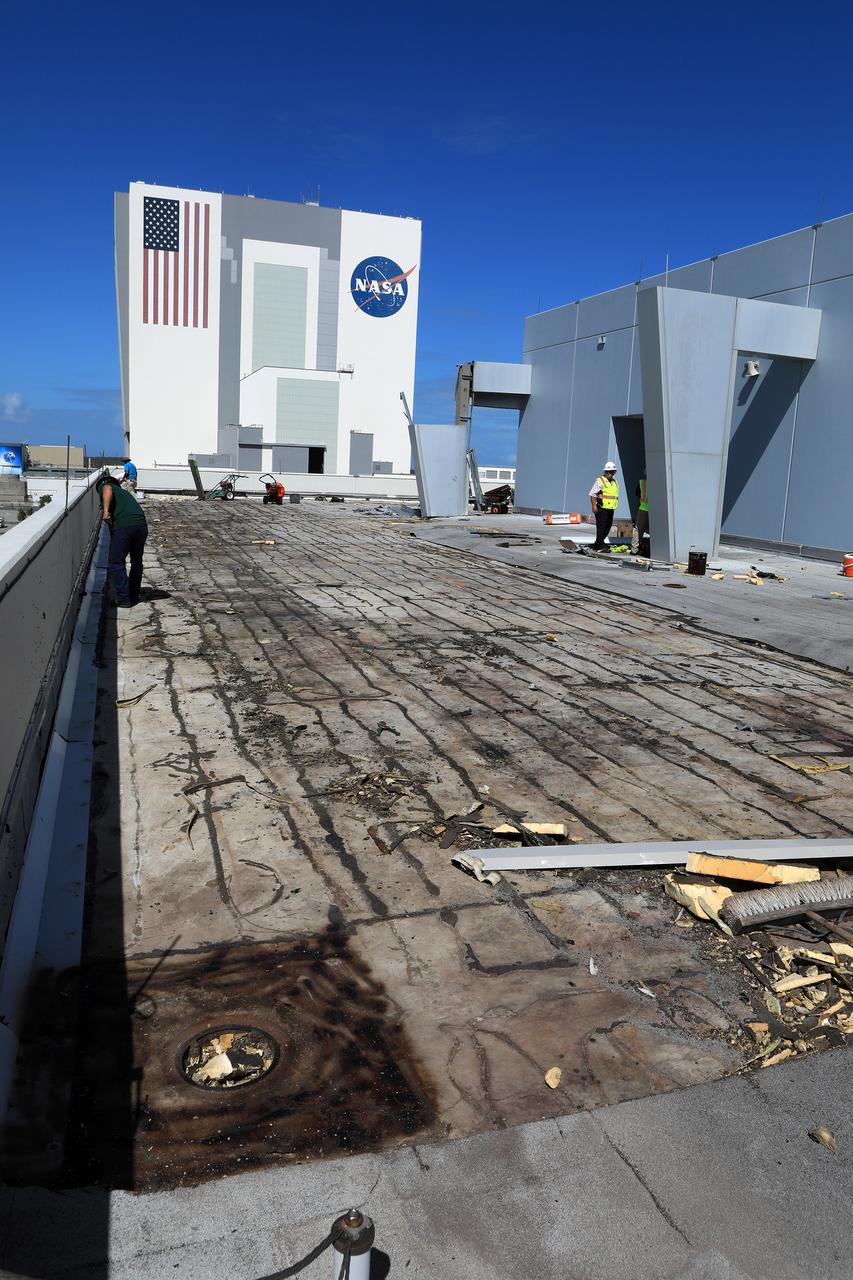
Members of the Disaster Assessment and Recovery Team (DART) repair a section of roof atop the Operations Support Building II at NASA’s Kennedy Space Center in Florida. The effort is part of the spaceport’s ongoing recovery from Hurricane Matthew, which passed to the east of Kennedy on Oct. 6 and 7, 2016. The center received some isolated roof damage, damaged support buildings, a few downed power lines, and limited water intrusion. Beach erosion also occurred, although the storm surge was less than expected.
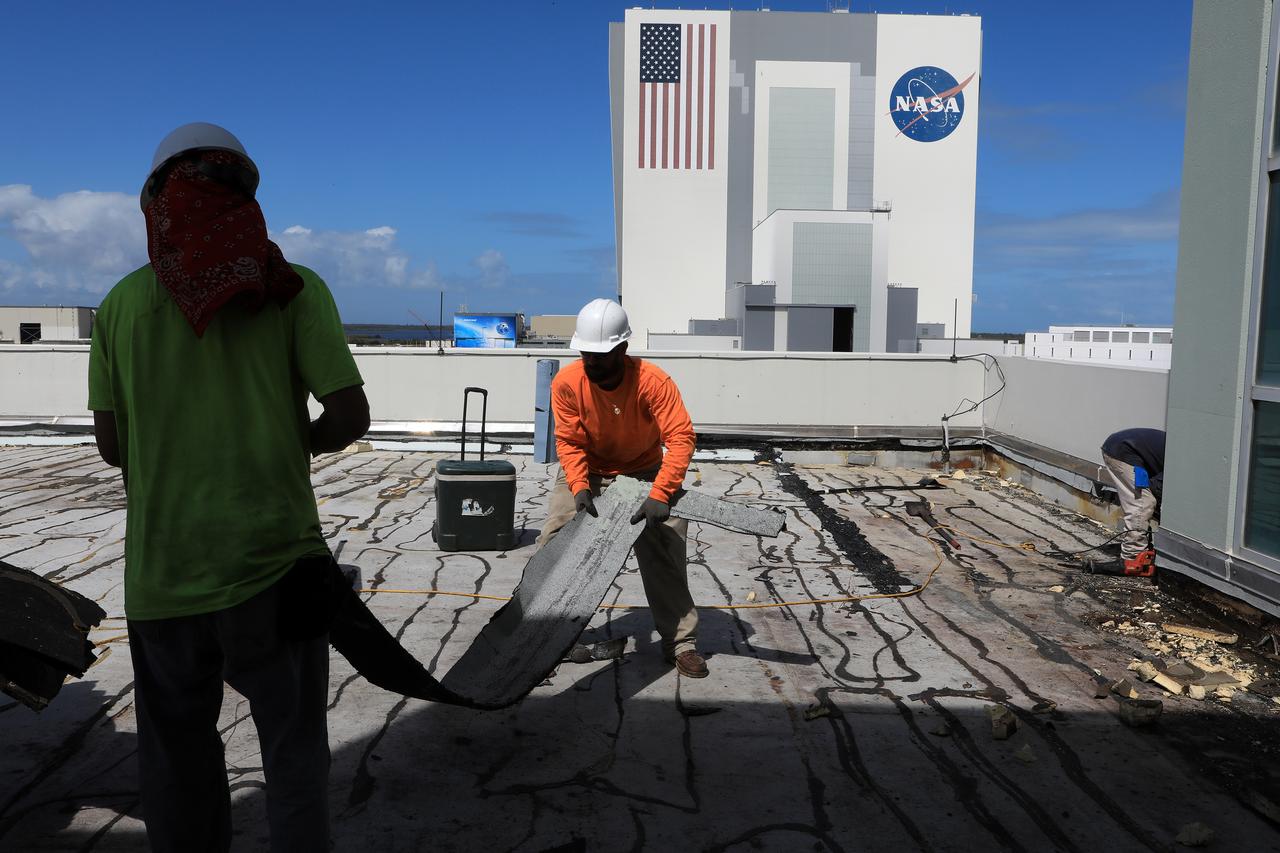
Members of the Disaster Assessment and Recovery Team (DART) repair a section of roof atop the Operations Support Building II at NASA’s Kennedy Space Center in Florida. The effort is part of the spaceport’s ongoing recovery from Hurricane Matthew, which passed to the east of Kennedy on Oct. 6 and 7, 2016. The center received some isolated roof damage, damaged support buildings, a few downed power lines, and limited water intrusion. Beach erosion also occurred, although the storm surge was less than expected.
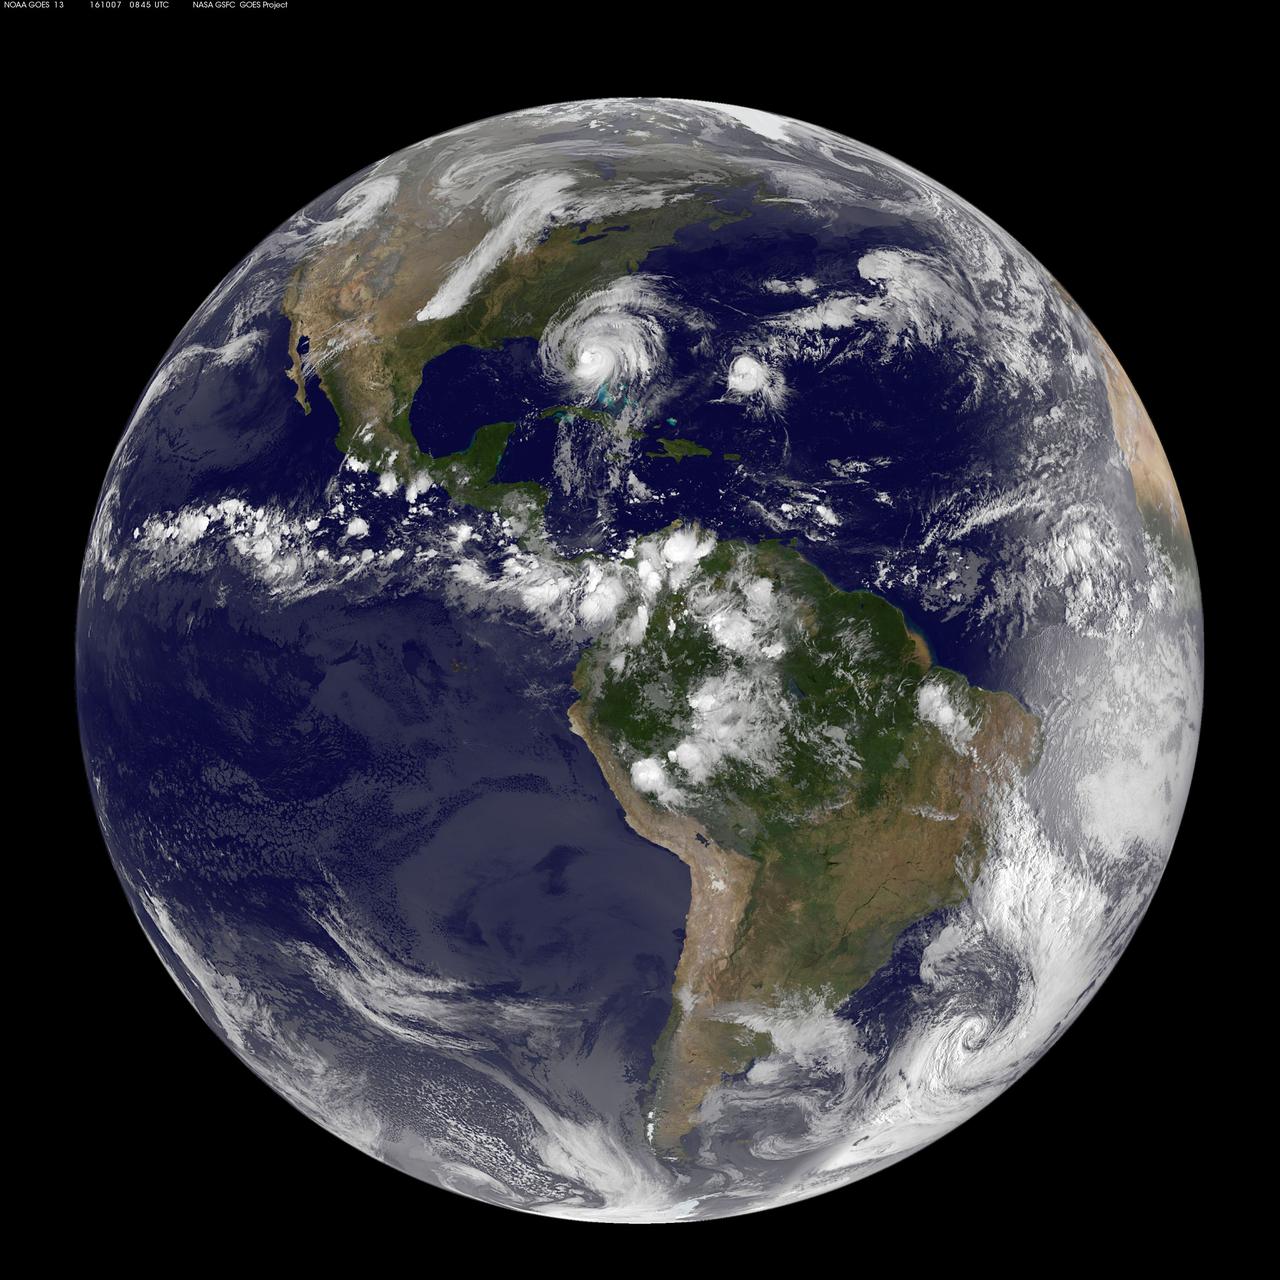
The most recent view of Matthew from space shows this massive storm converging on the Florida coast. This visible image was captured Oct. 7 at 4:45 a.m. EDT from NOAA's GOES-East satellite. Read more about Hurricane Matthew at <a href="http://www.nasa.gov/matthew" rel="nofollow">www.nasa.gov/matthew</a> Credits: NASA/NOAA GOES Project

Members of the Disaster Assessment and Recovery Team (DART) repair a section of roof atop the Operations Support Building II at NASA’s Kennedy Space Center in Florida. The effort is part of the spaceport’s ongoing recovery from Hurricane Matthew, which passed to the east of Kennedy on Oct. 6 and 7, 2016. The center received some isolated roof damage, damaged support buildings, a few downed power lines, and limited water intrusion. Beach erosion also occurred, although the storm surge was less than expected.
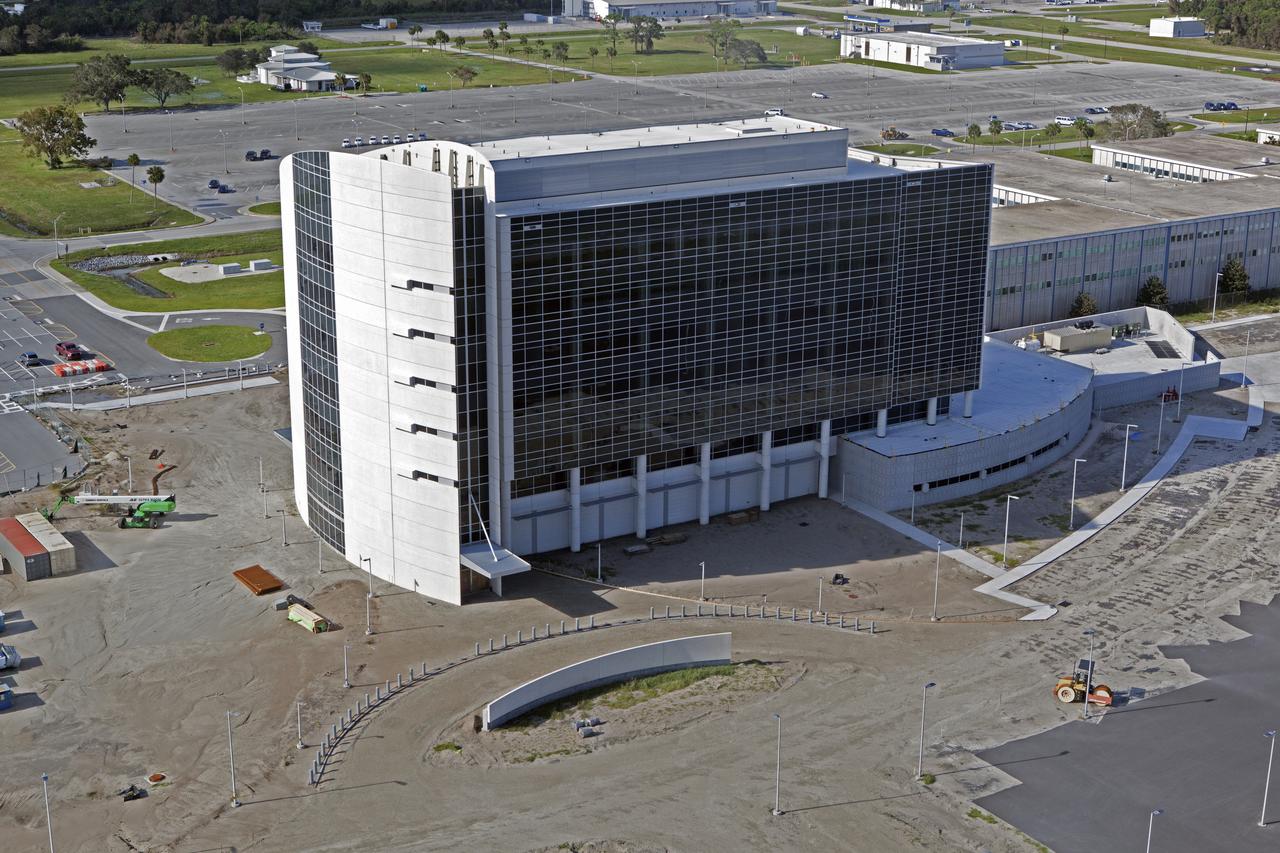
The Central Campus construction site is seen during an aerial survey of NASA's Kennedy Space Center in Florida on September 12, 2017. The survey was performed to identify structures and facilities that may have sustained damage from Hurricane Irma as the storm passed Kennedy on September 10, 2017. NASA closed the center ahead of the storm’s onset and only a small team of specialists known as the Rideout Team was on the center as the storm approached and passed.
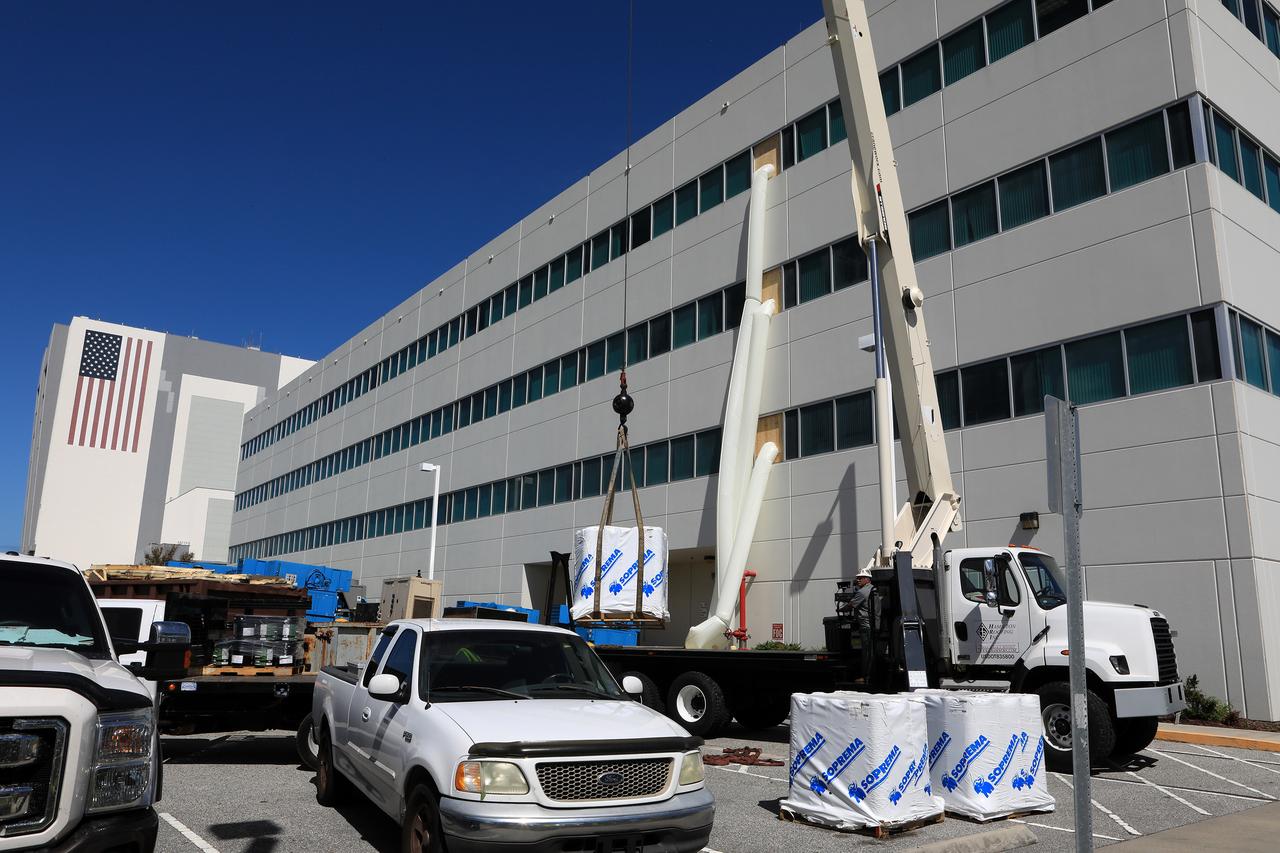
Members of the Disaster Assessment and Recovery Team (DART) work on repairs to the Operations Support Building II at NASA’s Kennedy Space Center in Florida. The effort is part of the spaceport’s ongoing recovery from Hurricane Matthew, which passed to the east of Kennedy on Oct. 6 and 7, 2016. The center received some isolated roof damage, damaged support buildings, a few downed power lines, and limited water intrusion. Beach erosion also occurred, although the storm surge was less than expected.
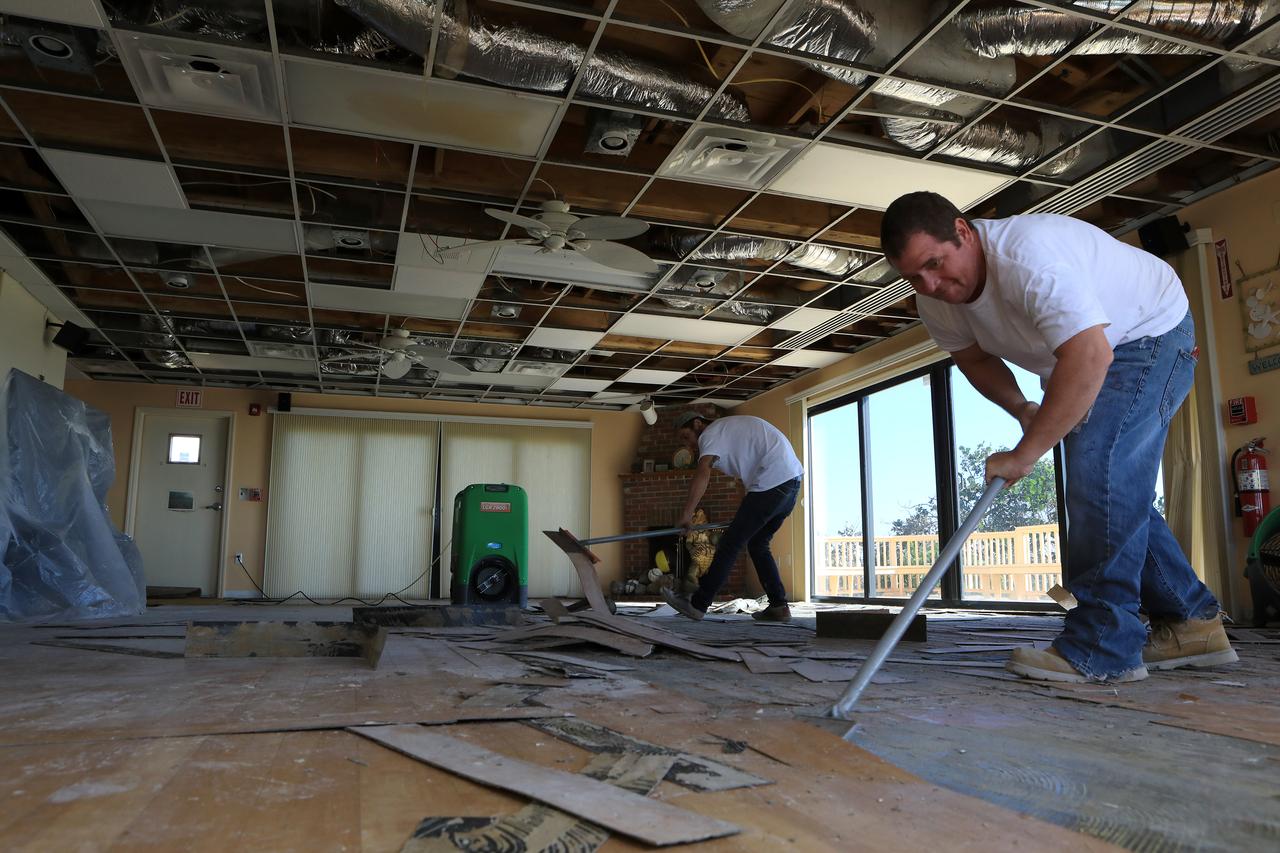
Members of the Disaster Assessment and Recovery Team (DART) work on flooring repairs to the Beach House at NASA’s Kennedy Space Center in Florida. The effort is part of the spaceport’s ongoing recovery from Hurricane Matthew, which passed to the east of Kennedy on Oct. 6 and 7, 2016. The center received some isolated roof damage, damaged support buildings, a few downed power lines, and limited water intrusion. Beach erosion also occurred, although the storm surge was less than expected.
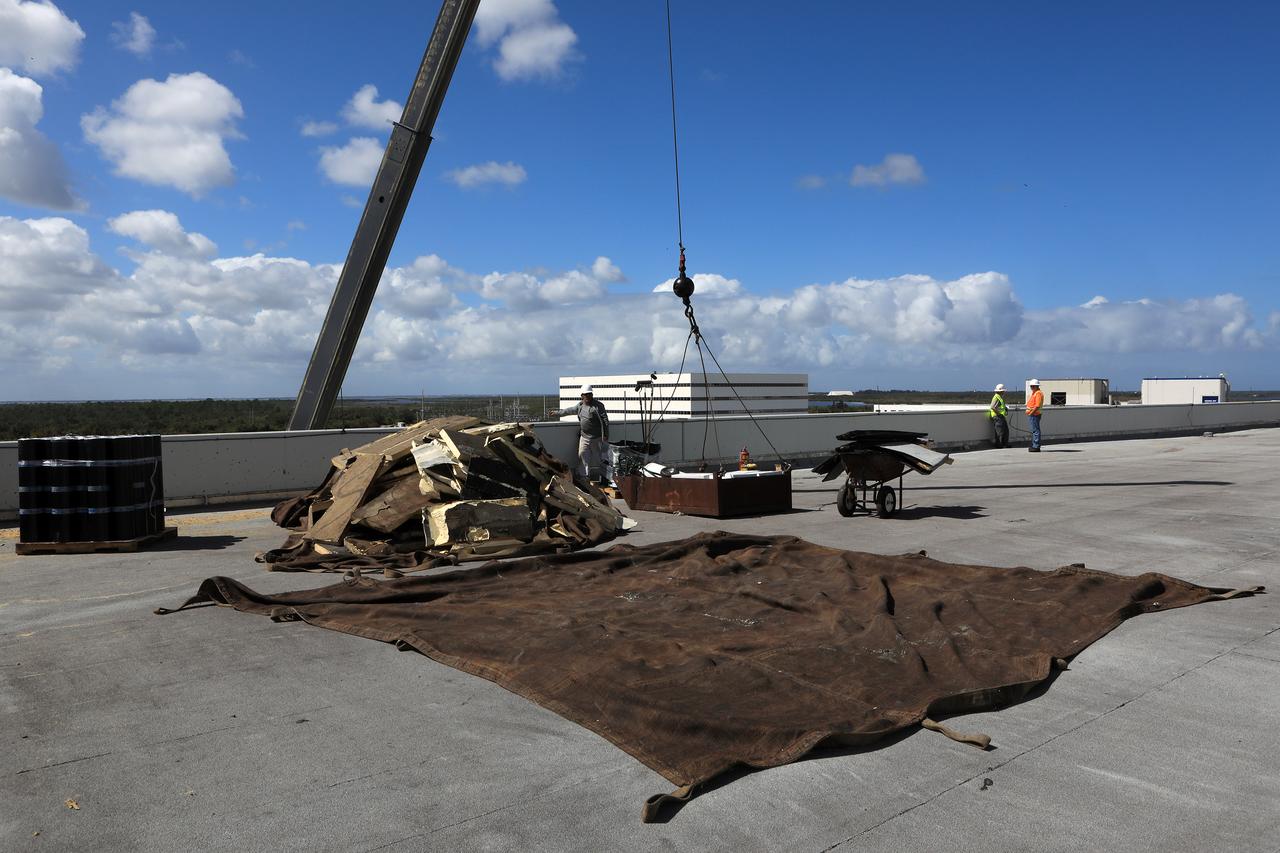
Members of the Disaster Assessment and Recovery Team (DART) repair a section of roof atop the Operations Support Building II at NASA’s Kennedy Space Center in Florida. The effort is part of the spaceport’s ongoing recovery from Hurricane Matthew, which passed to the east of Kennedy on Oct. 6 and 7, 2016. The center received some isolated roof damage, damaged support buildings, a few downed power lines, and limited water intrusion. Beach erosion also occurred, although the storm surge was less than expected.
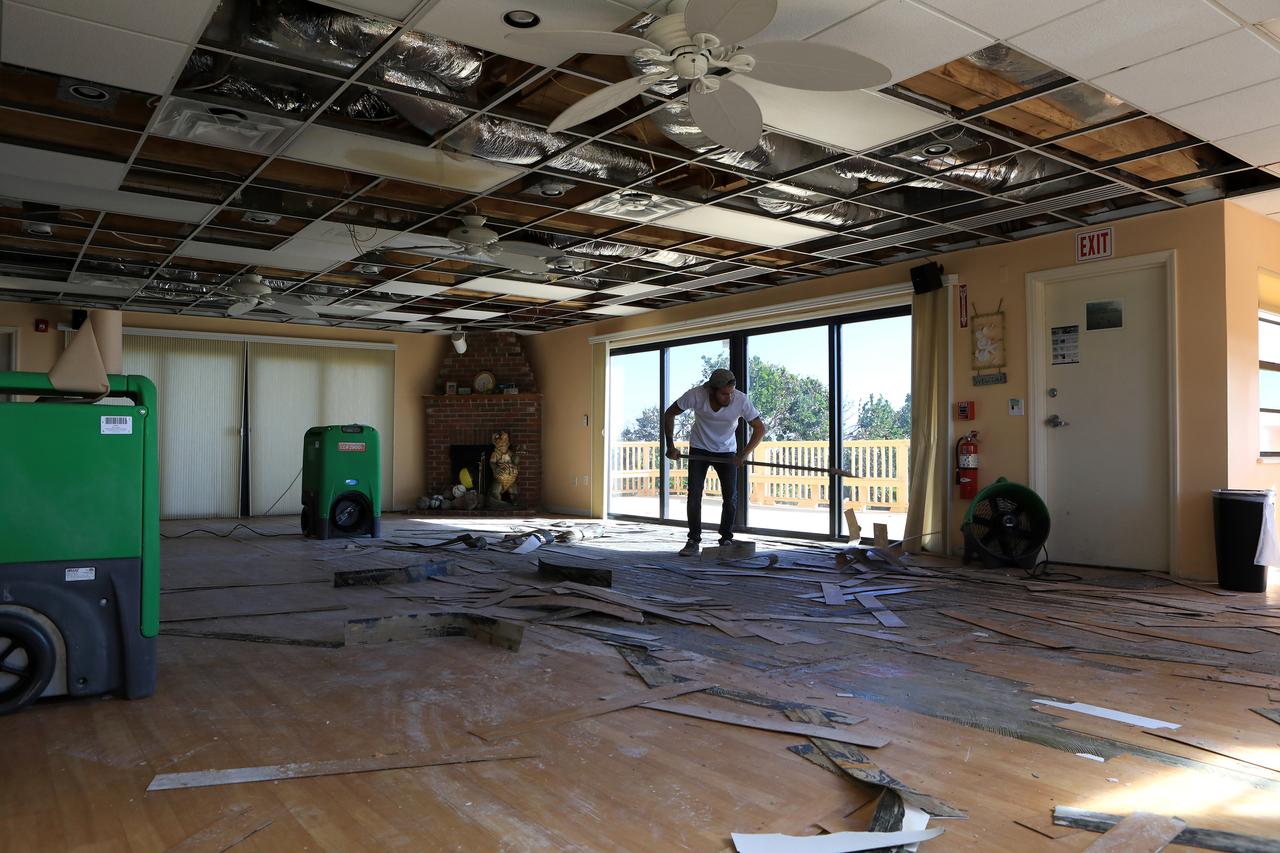
Members of the Disaster Assessment and Recovery Team (DART) work on flooring repairs to the Beach House at NASA’s Kennedy Space Center in Florida. The effort is part of the spaceport’s ongoing recovery from Hurricane Matthew, which passed to the east of Kennedy on Oct. 6 and 7, 2016. The center received some isolated roof damage, damaged support buildings, a few downed power lines, and limited water intrusion. Beach erosion also occurred, although the storm surge was less than expected.
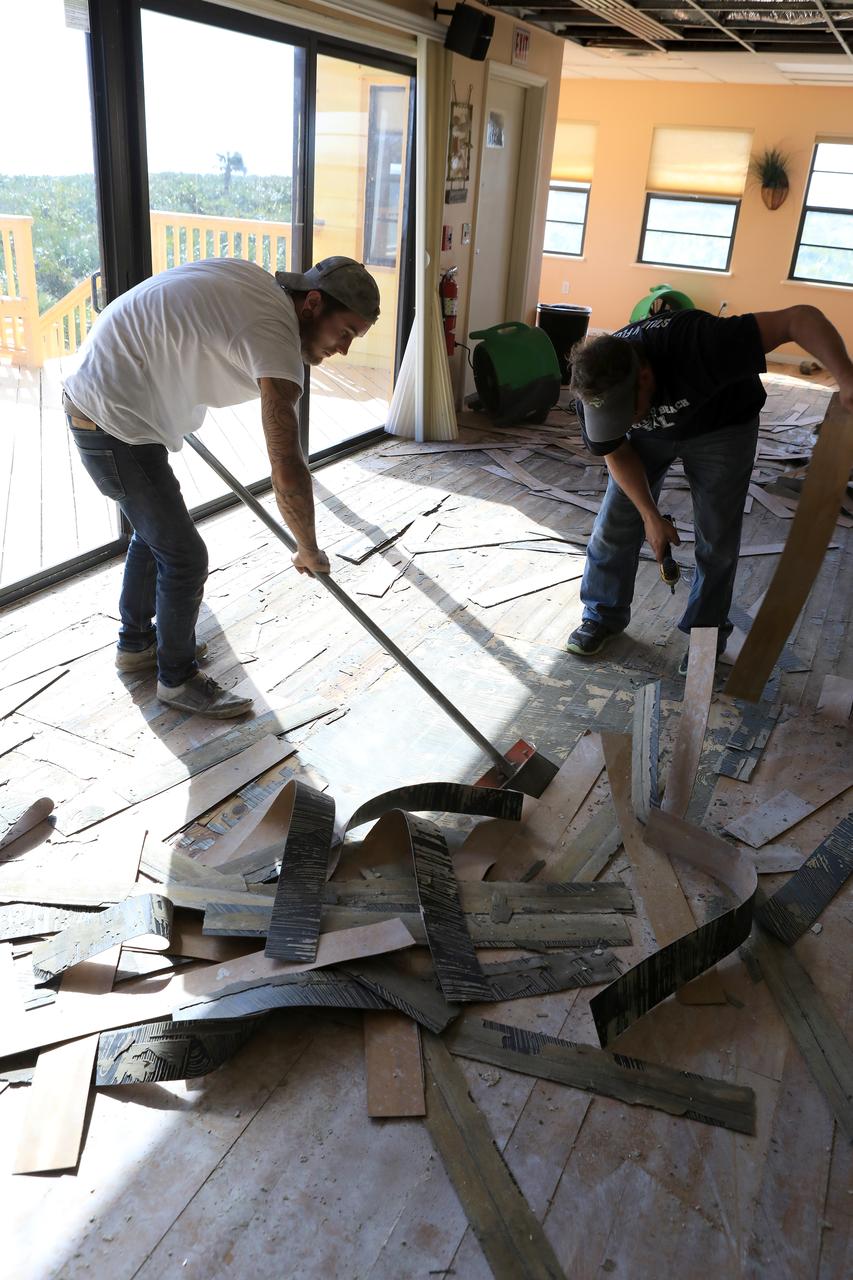
Members of the Disaster Assessment and Recovery Team (DART) work on flooring repairs to the Beach House at NASA’s Kennedy Space Center in Florida. The effort is part of the spaceport’s ongoing recovery from Hurricane Matthew, which passed to the east of Kennedy on Oct. 6 and 7, 2016. The center received some isolated roof damage, damaged support buildings, a few downed power lines, and limited water intrusion. Beach erosion also occurred, although the storm surge was less than expected.