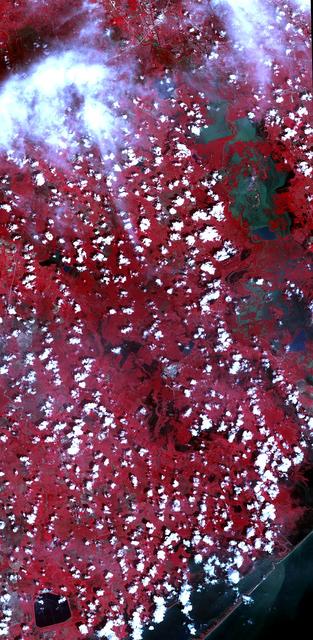
On Sept. 5, 2017, the Advanced Spaceborne Thermal Emission and Reflection Radiometer (ASTER) instrument on NASA's Terra spacecraft captured this image of the area around Bay City, Texas, about 50 miles (80 kilometers) southwest of Houston. Hurricane Harvey caused extensive inland flooding, seen as dark blue areas where the water is relatively clear, and green-grey where the water carries sediment. The image covers an area of 32 by 65 miles (52 by 105 kilometers), and is centered at 29.2 degrees north, 95.8 degrees west. https://photojournal.jpl.nasa.gov/catalog/PIA21940
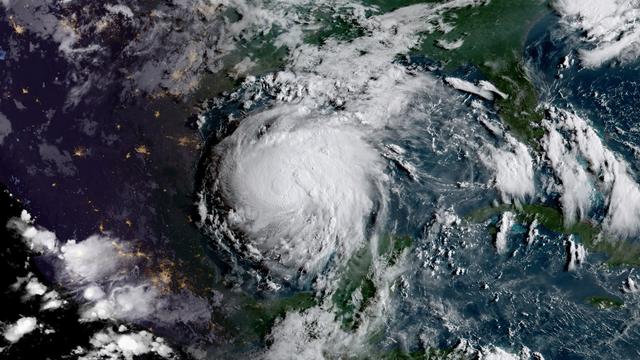
On Aug. 24, the National Hurricane Center noted that Hurricane Harvey was quickly strengthening and is forecast to be a category 3 Hurricane when it approaches the middle Texas coast. In addition, life-threatening storm surge and freshwater flooding expected. On Aug. 24, many warnings and watches were in effect: A Storm Surge Warning is in effect from Port Mansfield to San Luis Pass Texas. A Storm Surge Watch is in effect from south of Port Mansfield Texas to the mouth of the Rio Grande River and from north of San Luis Pass to High Island, Texas. A Hurricane Warning is in effect from Port Mansfield to Matagorda, Texas. A Tropical Storm Warning is in effect from north of Matagorda to High Island, Texas and south of Port Mansfield, Texas to the Mouth of the Rio Grande. A Hurricane Watch is in effect from south of Port Mansfield, Texas to the Mouth of the Rio Grande. A Tropical Storm Watch is in effect from south of the mouth of the Rio Grande to Boca de Catan, Mexico. GOES-16 captured this geocolor image of Tropical Storm Harvey in the Gulf of Mexico this morning, August 24, 2017. Geocolor imagery enhancement shown here displays geostationary satellite data in different ways depending on whether it is day or night. This image, captured as daylight moves into the area, offers a blend of both, with nighttime features on the left side of the image and daytime on the right. Credit: NOAA/NASA GOES Project
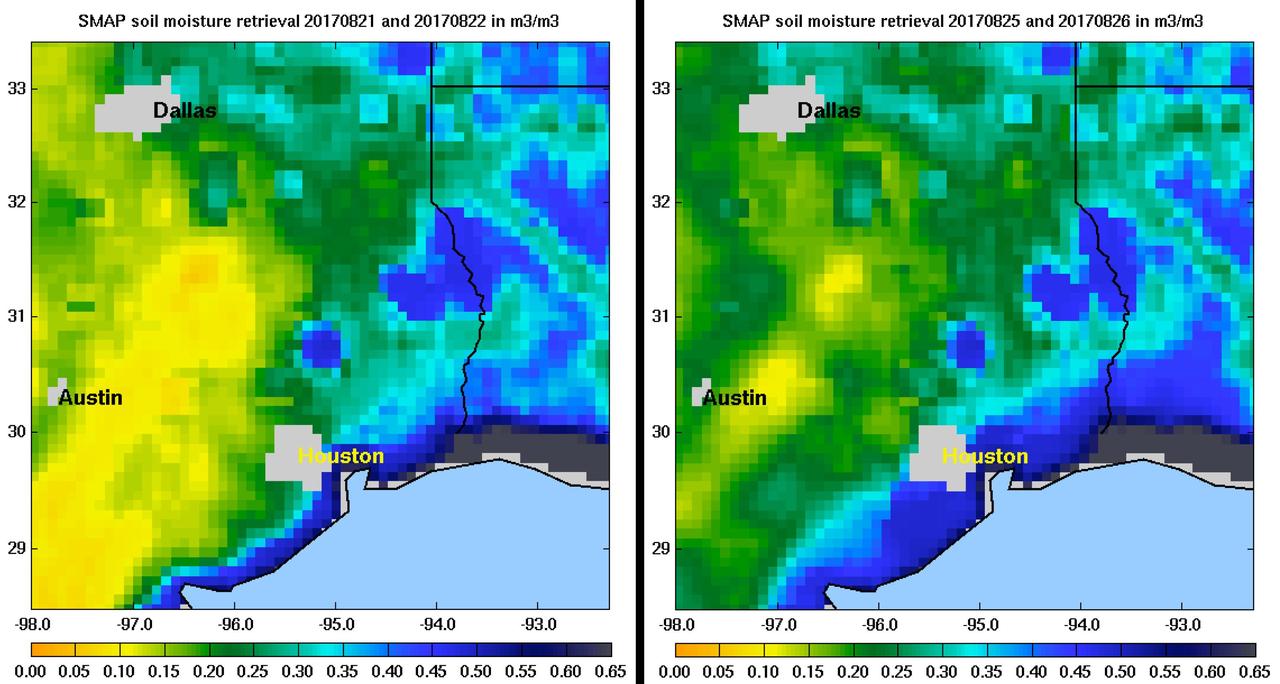
Images of soil moisture conditions in Texas near Houston, generated by NASA's Soil Moisture Active Passive (SMAP) satellite before and after the landfall of Hurricane Harvey can be used to monitor changing ground conditions due to Harvey's rainfall. As seen in the left panel, SMAP observations show that soil surface conditions were already very wet a few days before the hurricane made landfall (August 21/22), with moisture levels in the 20 to 40 percent range. Such saturated soil surfaces contributed to the inability of water to infiltrate more deeply into soils, thereby increasing the likelihood of flooding. After Harvey made landfall, the southwest portion of Houston became exceptionally wet, as seen in the right panel image from August 25/26, signaling the arrival of heavy rains and widespread flooding. https://photojournal.jpl.nasa.gov/catalog/PIA21926
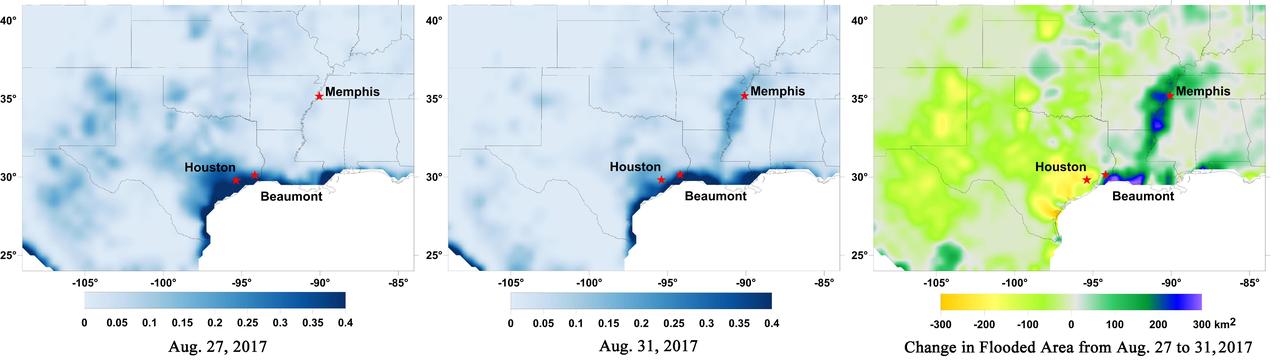
Data from NASA's Soil Moisture Active Passive (SMAP) satellite have been used to create new surface flooding maps of Southeast Texas and the Tennessee Valley following Hurricane Harvey. The SMAP observations detect the proportional cover of surface water within the satellite sensor's field of view. This sequence of images shows changes in the extent of surface flooding from successive five-day SMAP observation composite images. Widespread flooding can be seen in the Houston metropolitan area on Aug. 27 following record rainfall from the Category 4 hurricane, which made landfall on Aug. 25th, 2017 (left image). Flood waters around Houston had substantially receded by Aug. 31 (middle image), while flooding had increased across Louisiana, eastern Arkansas, and western Tennessee as then Tropical Storm Harvey passed over the area. The far right image shows the change in flooded area between Aug. 27 and Aug. 31, with regions showing the most flooding recession depicted in yellow and orange shades and those where flooding had increased depicted in blue shades. The SMAP satellite has a low-frequency (L-band) microwave radiometer with enhanced capabilities for detecting surface water changes in nearly all weather conditions and under low-to-moderate vegetation cover. SMAP provides global coverage with one-to-three-day repeat sampling that is well suited for global monitoring of inland surface water cover dynamics. https://photojournal.jpl.nasa.gov/catalog/PIA21951
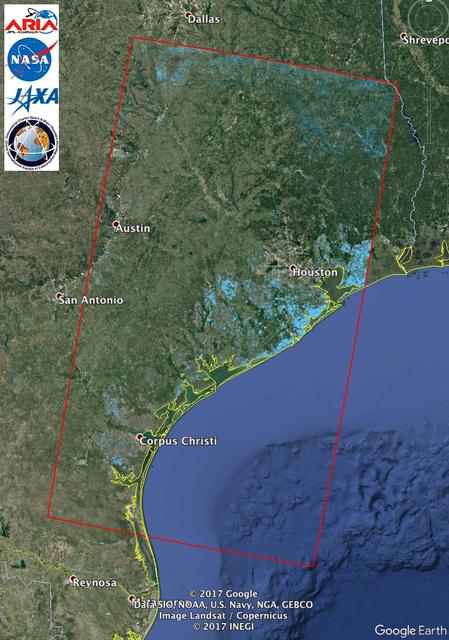
The Advanced Rapid Imaging and Analysis (ARIA) team at NASA's Jet Propulsion Laboratory in Pasadena, California, used synthetic aperture radar imagery from the Japan Aerospace Exploration Agency's (JAXA) ALOS-2 satellite to create this Flood Proxy Map depicting areas of Southeastern Texas that are likely flooded as a result of Hurricane Harvey (shown by light blue pixels). The map is derived images taken before (July 30, 2017) and after (Aug. 27, 2017) Hurricane Harvey made landfall. The map covers an area of 220 by 400 miles (350 by 640 kilometers). Each pixel measures about 55 yards (50 meters) across. Local ground observations provided anecdotal preliminary validation. The results are also cross-validated with ARIA Sentinel-1 flood proxy map v0.2. The map should be used as guidance, and may be less reliable over urban areas. ALOS-2 data were accessed through the International Charter. https://photojournal.jpl.nasa.gov/catalog/PIA21931
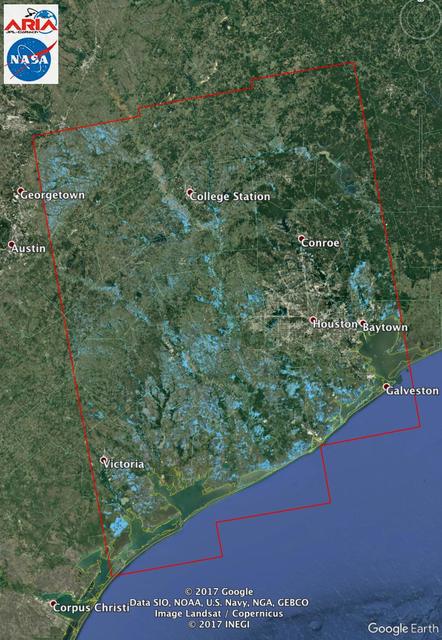
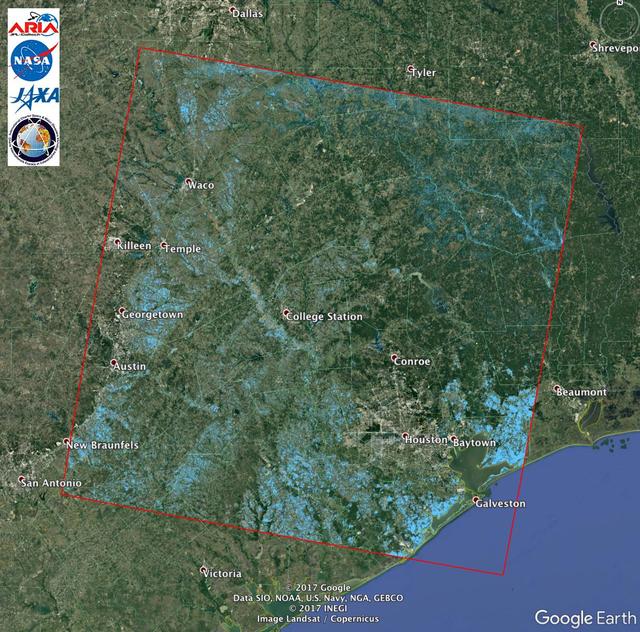
The Advanced Rapid Imaging and Analysis (ARIA) team at NASA's Jet Propulsion Laboratory in Pasadena, California, used synthetic aperture radar imagery from the European Space Agency's (ESA) Sentinel-1 satellite to create this Flood Proxy Map of Southeastern Texas, showing areas that are likely flooded as a result of Hurricane Harvey (light blue pixels). The images used to create the map were taken before (Aug. 5, 2017) and after (Aug. 29, 2017) Hurricane Harvey made landfall. The map covers an area of 155 by 211 miles (250 by 340 kilometers). Each pixel measures about 33 yards (30 meters) across. Local ground observations provided anecdotal preliminary validation. The results were also cross-validated with the ARIA ALOS-2 flood proxy map v0.2. The map should be used as guidance, and may be less reliable over urban areas. Sentinel-1 data were accessed through the Copernicus Open Access Hub. Contains modified Copernicus Sentinel data 2017. https://photojournal.jpl.nasa.gov/catalog/PIA21932
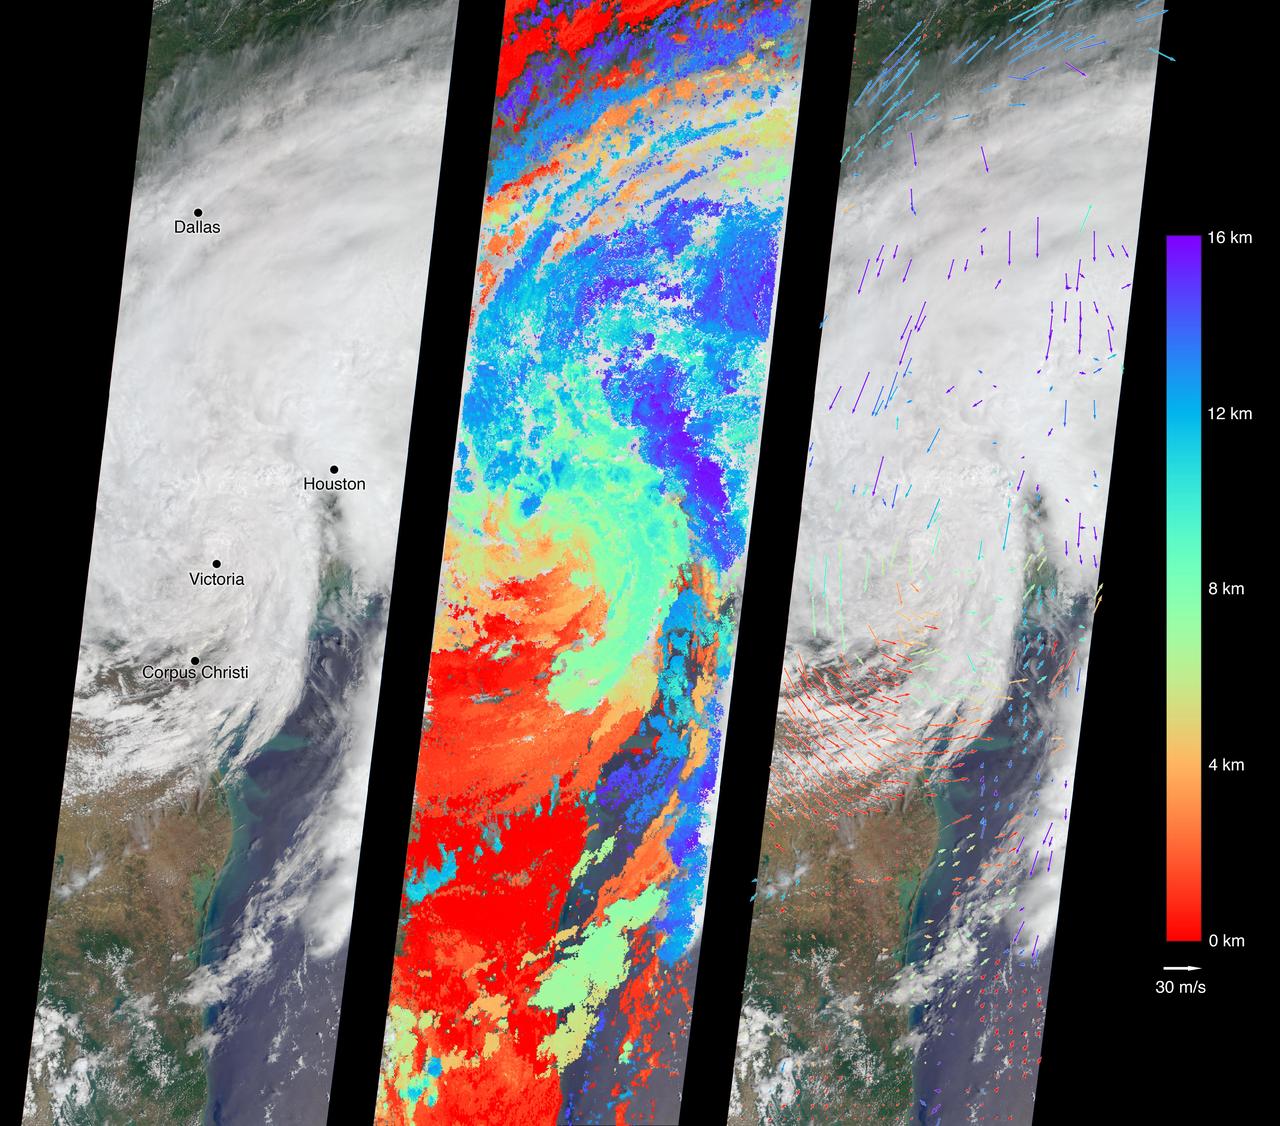
On Aug. 27, 2017, the Multi-angle Imaging SpectroRadiometer (MISR) instrument on NASA's Terra satellite passed over then-Tropical Storm Harvey about noon local time, the day after the storm first made landfall in Texas as a Category 4 hurricane. The MISR instrument is equipped with nine cameras that observe Earth at different angles over a time period of seven minutes. Geometric information from the multiple camera views is used to compute the cloud top heights, and motion of the clouds during the image sequence is used to calculate wind speed. This composite image shows the storm as viewed by the central, downward-looking camera (left), as well as the cloud top heights in kilometers (center) and the wind speeds (right) superimposed on the image. The length of the arrows is proportional to the wind speed, while their color shows the altitude at which the winds were calculated. Also included is an animation made by combining all nine images from the MISR cameras, showing the motion of the storm during the seven-minute period. At this time, the center of the tropical storm was located just northwest of the city of Victoria and maximum wind speeds on the ground were around 40 miles per hour (65 kilometers per hour) according to the National Oceanic and Atmospheric Administration (NOAA), which matches well with the near-surface winds calculated by MISR to the west of Corpus Christi. In the 36 hours or so since it had made landfall, Harvey had weakened considerably -- these images show that the eye had disappeared and much of the circular motion of storm had dissipated, as shown by the calculated wind directions. However, the area of very high clouds and strong winds near Houston shows that the storm was continuing to produce powerful rain bands. At this point, hydrographs managed by NOAA in downtown Houston were already recording flood stage at both the Buffalo Bayou (28 feet or 8.5 meters as of 12:15 p.m. CDT August 27) and the White Oak Bayou (40 feet or 12 meters at last record that morning). The MISR data show the storm clouds reaching an altitude of about 10 miles (16 kilometers). These data were captured during Terra orbit 94108. An animation is available at https://photojournal.jpl.nasa.gov/catalog/PIA21927
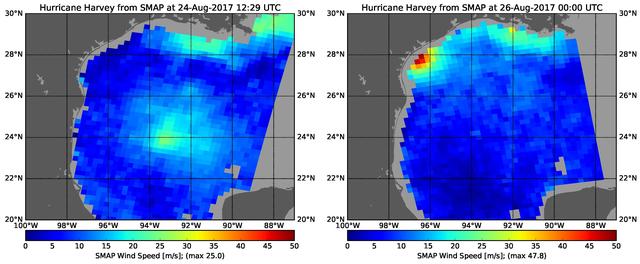
The rapid intensification of Hurricane Harvey is seen in this pair of images of ocean surface wind speeds as observed by the radiometer instrument aboard NASA's Soil Moisture Active Passive (SMAP) satellite at 7:29 a.m. CDT Aug. 24th, 2017 (left) and at 7 p.m. CDT Aug. 26th (right). Color indicates wind speed, with red being highest and blue lowest. The images show Harvey's maximum wind speeds increased from approximately 56 miles per hour (25 meters per second) to about 107 miles per hour (47.8 meters per second) in the 36 hours just before landfall. The higher wind speeds estimated near the mouth of the Mississippi River are erroneous and are due to errors in the ancillary sea-surface-salinity data product used by SMAP to estimate extreme wind speeds. https://photojournal.jpl.nasa.gov/catalog/PIA21884
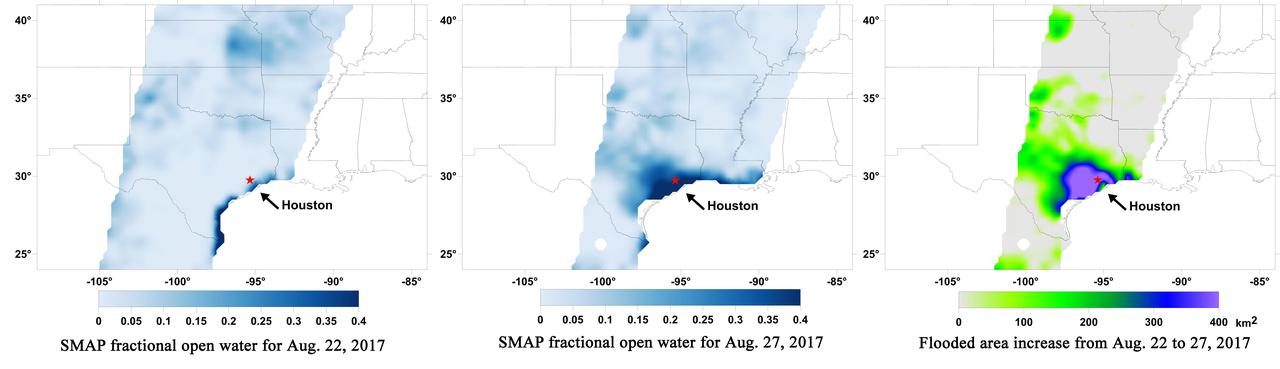
A new series of images generated with data from NASA's Soil Moisture Active Passive (SMAP) satellite illustrate the surface flooding caused by Hurricane Harvey from before its initial landfall through August 27, 2017. The SMAP observations detect the proportion of the ground covered by surface water within the satellite's field of view. The sequence of images depicts successive satellite orbital swath observations showing the surface water conditions on August 22, before Harvey's landfall (left), and then on Aug. 27, two days after landfall (middle). The resulting increase in surface flooding from record rainfall over the three-day period, shown at right, depicts regionally heavy flooding around the Houston metropolitan area. The hardest hit areas (blue and purple shades) cover more than 23,000 square miles (about 59,600 square kilometers) and indicate a more than 1,000-fold increase in surface water cover from rainfall-driven flooding. SMAP's low-frequency (L-band) microwave radiometer features enhanced capabilities for detecting surface water changes in nearly all weather conditions and under low-to-moderate vegetation cover. The satellite provides global coverage with one to three-day repeat sampling, which is well suited for monitoring dynamic inland waters around the world. https://photojournal.jpl.nasa.gov/catalog/PIA21930
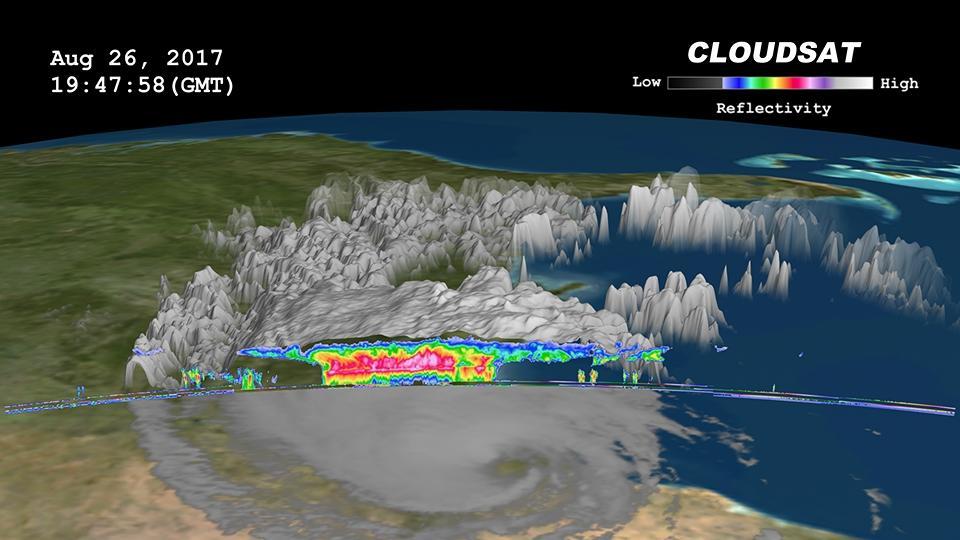
Click on the image for larger animation NASA's CloudSat satellite flew over then-Tropical Storm Harvey on Aug. 26, 2017, at 2:45 p.m. CDT (19:45 UTC) as the storm was nearly stationary over south Texas. At that time, Harvey contained estimated maximum sustained winds of 69 miles per hour (60 knots). CloudSat flew over Harvey northeast of the storm center through an area of moderate to heavy rainfall in the outer rainbands. As seen in the image and animation, large amounts of liquid and ice water (denoted by the red and pink colors) are visible beneath the cloud tops. The lack of a radar signal (attenuation) beneath the melting layer (located around 3 miles, or 5 kilometers, above ground) can be seen in the heavier areas of precipitation, since CloudSat's cloud profiling radar (CPR) signal dampens when precipitation particles are larger than 0.12 inches (3 millimeters) in size. Smaller cumulus and cumulonimbus clouds are seen north of the area of moderate to heavy precipitation. The cirrus canopy (anvil clouds) extends outward from the storm system (shown in blue and green colors). An animation is available at https://photojournal.jpl.nasa.gov/catalog/PIA17392
The Advanced Rapid Imaging and Analysis (ARIA) team at NASA's Jet Propulsion Laboratory in Pasadena, California, created this Flood Proxy Map depicting areas of Southeastern Texas that are likely flooded as a result of Hurricane Harvey, shown by light blue pixels. The map is derived from synthetic aperture radar amplitude images from the Japan Aerospace Exploration Agency's (JAXA) ALOS-2 PALSAR-2 satellite, taken before (July 30, 2017) and after (August 27, 2017) Hurricane Harvey made landfall. The map covers an area of 135 square miles (350 square kilometers). Each pixel measures about 538 square feet (50 square meters). Local ground observations provided anecdotal preliminary validation. This flood proxy map should be used as guidance to identify areas that are likely flooded, and may be less reliable over urban areas. ALOS-2 data were accessed through the International Charter. https://photojournal.jpl.nasa.gov/catalog/PIA21928
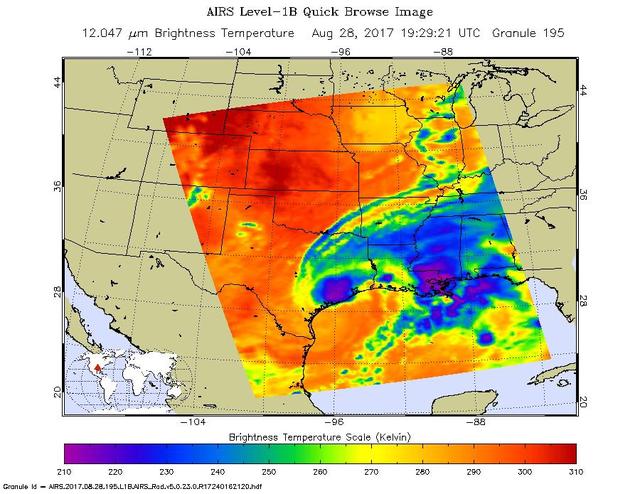
The latest infrared image from NASA's Atmospheric Infrared Sounder (AIRS) instrument aboard NASA's Aqua satellite illustrates the growing flood threat from now Tropical Storm Harvey. In the false-color image, acquired at 2:29 p.m. CDT (19:29 UTC) on Aug. 28, 2017, a large area of dark blue and purple centered along the southeastern Texas coast denotes the coldest cloud top temperatures and strongest thunderstorms. A second area of intense precipitation is visible over southeastern Louisiana. Harvey has reemerged over the Gulf of Mexico, but the National Hurricane Center forecasts only a small amount of strengthening before the storm moves slowly north and inland again. https://photojournal.jpl.nasa.gov/catalog/PIA21885