NASA's CloudSat satellite flew over Hurricane Maria on Sept. 17, 2017, at 1:23 p.m. EDT (17:23 UTC) as the storm had just strengthened into a hurricane in the Atlantic Ocean. Hurricane Maria contained estimated maximum sustained winds of 75 miles per hour (65 knots) and had a minimum barometric pressure of 986 millibars. CloudSat flew over Maria through the center of the rapidly intensifying storm, directly through an overshooting cloud top (a dome-shaped protrusion that shoots out of the top of the anvil cloud of a thunderstorm). CloudSat reveals the vertical extent of the overshooting cloud top, showing the estimated height of the cloud to be 11 miles (18 kilometers). Areas of high reflectivity with deep red and pink colors extend well above 9 miles (15 kilometers) in height, showing large amounts of water being drawn upward high into the atmosphere. A movie is available at https://photojournal.jpl.nasa.gov/catalog/PIA21961
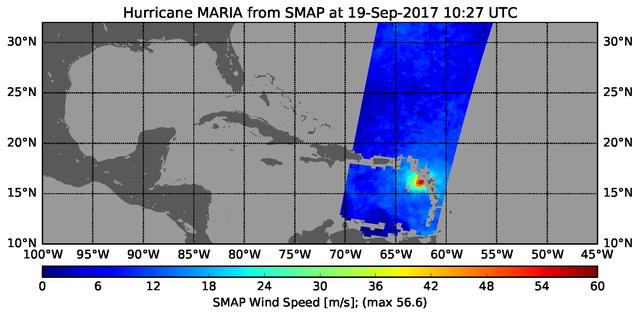
The radiometer instrument on NASA's Soil Moisture Active Passive (SMAP) spacecraft captured this image of Hurricane Maria at 6:27 a.m. EDT on Sept. 19, 2017 (10:27 UTC), showing an estimated maximum surface wind speed of 126.6 miles per hour (56.6 meters per second). While Maria was already a Category 5 hurricane at the time of this observation, it is an extremely tightly organized hurricane and SMAP cannot fully resolve its highest winds due to the 25-mile (40-kilometer) resolution of SMAP. https://photojournal.jpl.nasa.gov/catalog/PIA21960
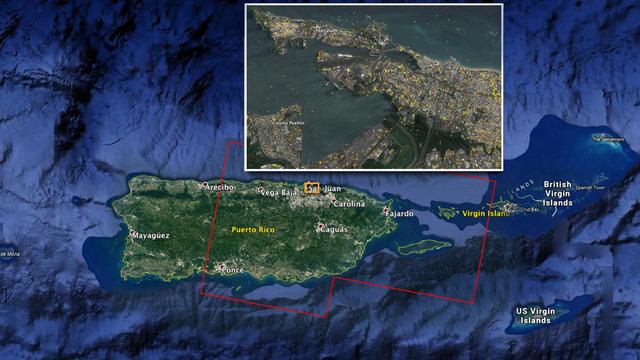
The Advanced Rapid Imaging and Analysis (ARIA) team at NASA's Jet Propulsion Laboratory in Pasadena, California, and Caltech, also in Pasadena, created this Damage Proxy Map (DPM) depicting areas of Eastern Puerto Rico that are likely damaged (shown by red and yellow pixels) as a result of Hurricane Maria (a Category 4 hurricane at landfall in Puerto Rico on Sept. 20, 2017). The map is derived from synthetic aperture radar (SAR) images from the Copernicus Sentinel-1A and Sentinel-1B satellites, operated by the European Space Agency (ESA). The images were taken before (March 25, 2017) and after (Sept. 21, 2017) the storm's landfall. The map was delivered to responding agencies, including the Federal Emergency Management Agency (FEMA), on Sept. 22, 2017. FEMA combined the map with building infrastructure data to estimate a damage density map, which was sent to its Urban Search and Rescue teams in the field in Puerto Rico. The map covers an area of 105 by 60 miles (169 by 96 kilometers), shown by the large red polygon in the figure. The inset, denoted by the orange rectangle, shows the extent of damage in and around the capital city of San Juan. Each pixel measures about 98 feet (30 meters) across. The color variation from yellow to red indicates increasingly more significant ground surface change. Preliminary validation was done by comparing the map with anecdotal reports of damage. This damage proxy map should be used as guidance to identify damaged areas, and may be less reliable over vegetated and flooded areas. Sentinel-1 data were accessed through the Copernicus Open Access Hub. The image contains modified Copernicus Sentinel data (2017), processed by ESA and analyzed by the NASA-JPL/Caltech ARIA team. This research was carried out at JPL under a contract with NASA. https://photojournal.jpl.nasa.gov/catalog/PIA21964
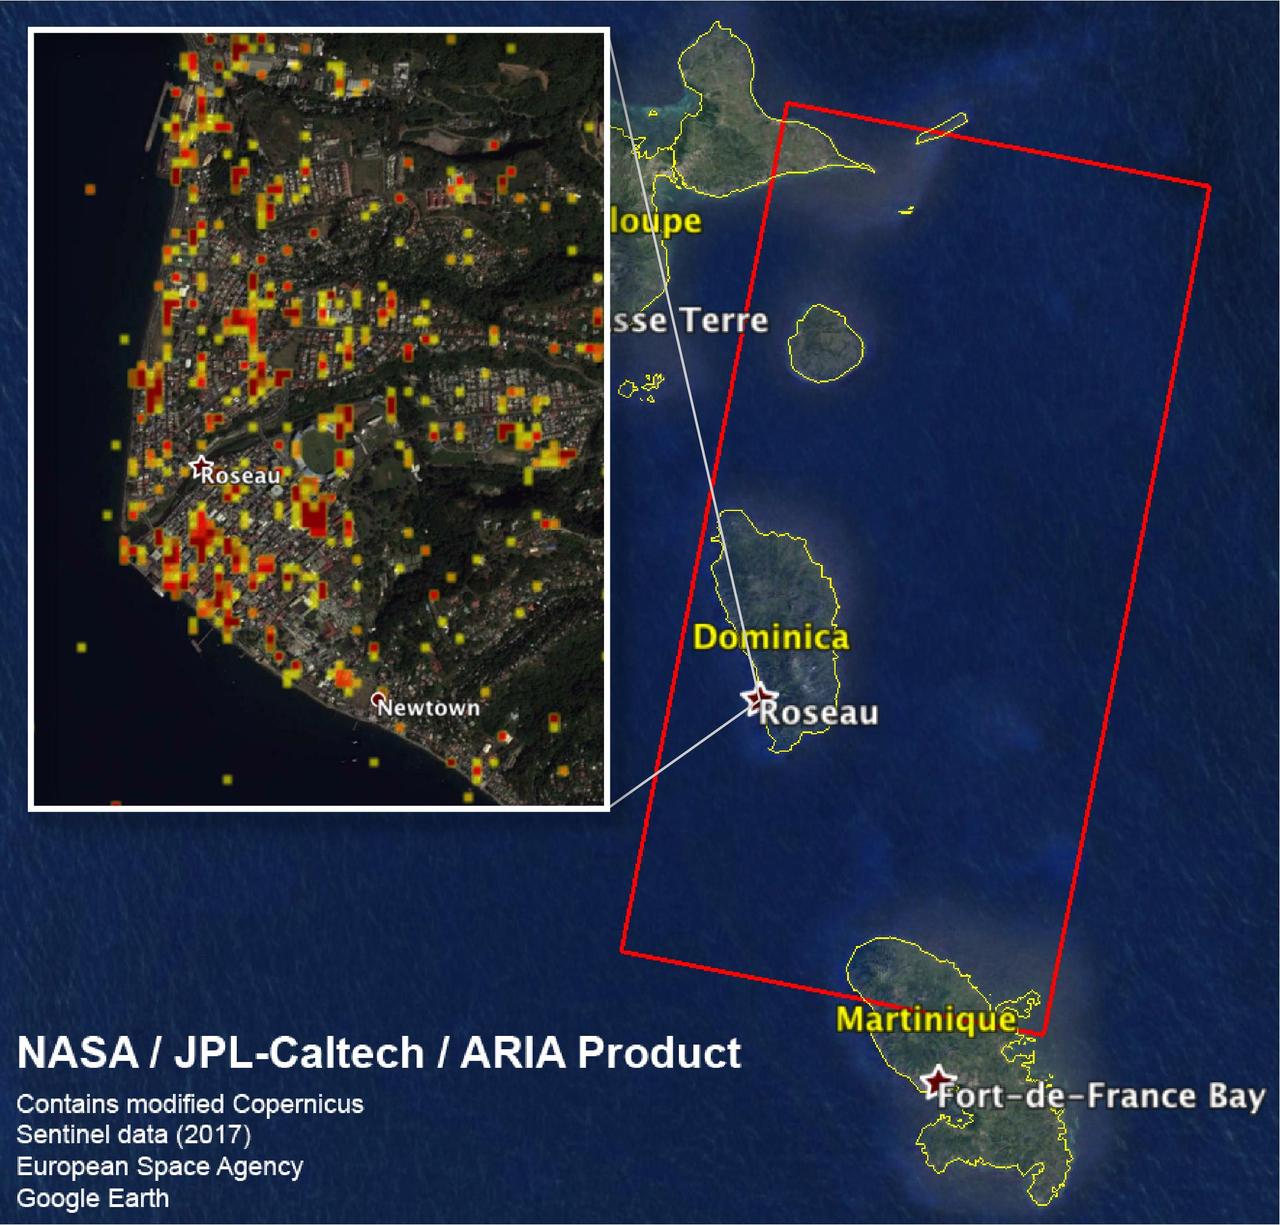
The Advanced Rapid Imaging and Analysis (ARIA) team at NASA's Jet Propulsion Laboratory in Pasadena, California, and Caltech, also in Pasadena, created this Damage Proxy Map (DPM) depicting areas including the Commonwealth of Dominica, that are likely damaged (shown by red and yellow pixels) as a result of Hurricane Maria (a Category 5 storm at landfall in Dominica on Sept. 18, 2017). The map is derived from synthetic aperture radar (SAR) images from the Copernicus Sentinel-1 satellites, operated by the European Space Agency (ESA). The images were taken before (March 27, 2017) and after (Sept. 23, 2017) the landfall of the storm. The map covers the area within the large red polygon, which measures 53 by 106 miles (85 by 170 kilometers). Each pixel measures about 98 feet (30 meters) across. The color variation from yellow to red indicates increasingly more significant ground surface change. Preliminary validation was done by comparing the data to a crowdsourced map by Clemson Center for Geospatial Technologies and optical satellite imagery feom DigitalGlobe. This damage proxy map should be used as guidance to identify damaged areas, and may be less reliable over vegetated areas. Sentinel-1 data were accessed through the Copernicus Open Access Hub. The image contains modified Copernicus Sentinel data (2017), processed by ESA and analyzed by the NASA/JPL-Caltech ARIA team. This research was carried out at JPL under a contract with NASA. https://photojournal.jpl.nasa.gov/catalog/PIA22037
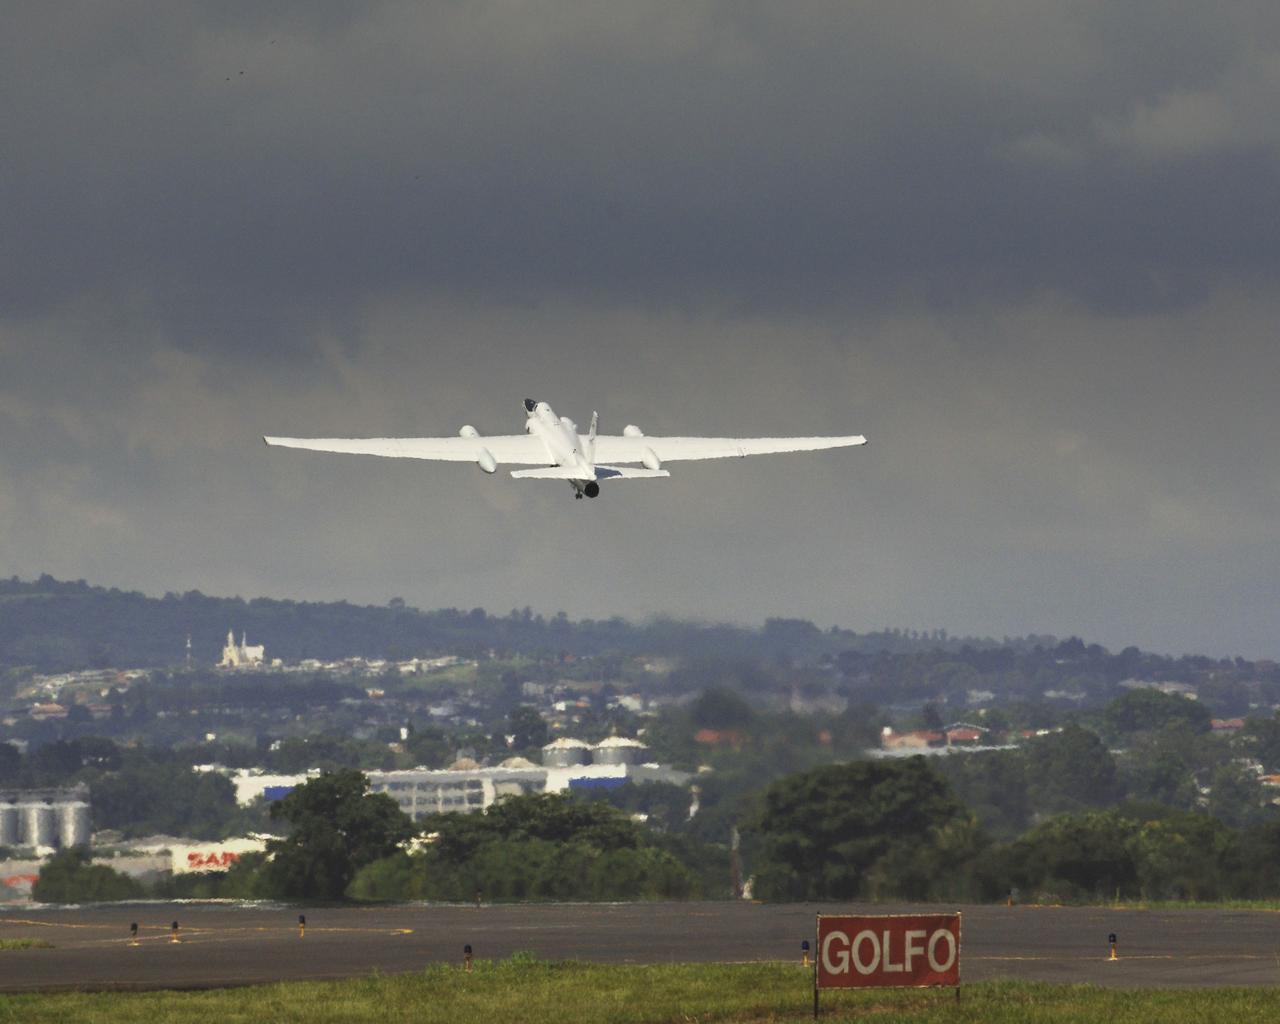
The NASA ER-2 airplane flew over hurricane Dennis as part of the Tropical Cloud Systems and Processes "TSCP" Mission. This 28-day field mission sponsored by NASA's Science Mission Directorate is studying the bursting conditions for tropical storms, hurricanes and related phenomena. The flight originated from TSCP's base-of-operations in San Juan Santa Maria airport in San Jose, Costa Rica. Photo Credit: "NASA/Bill Ingalls"