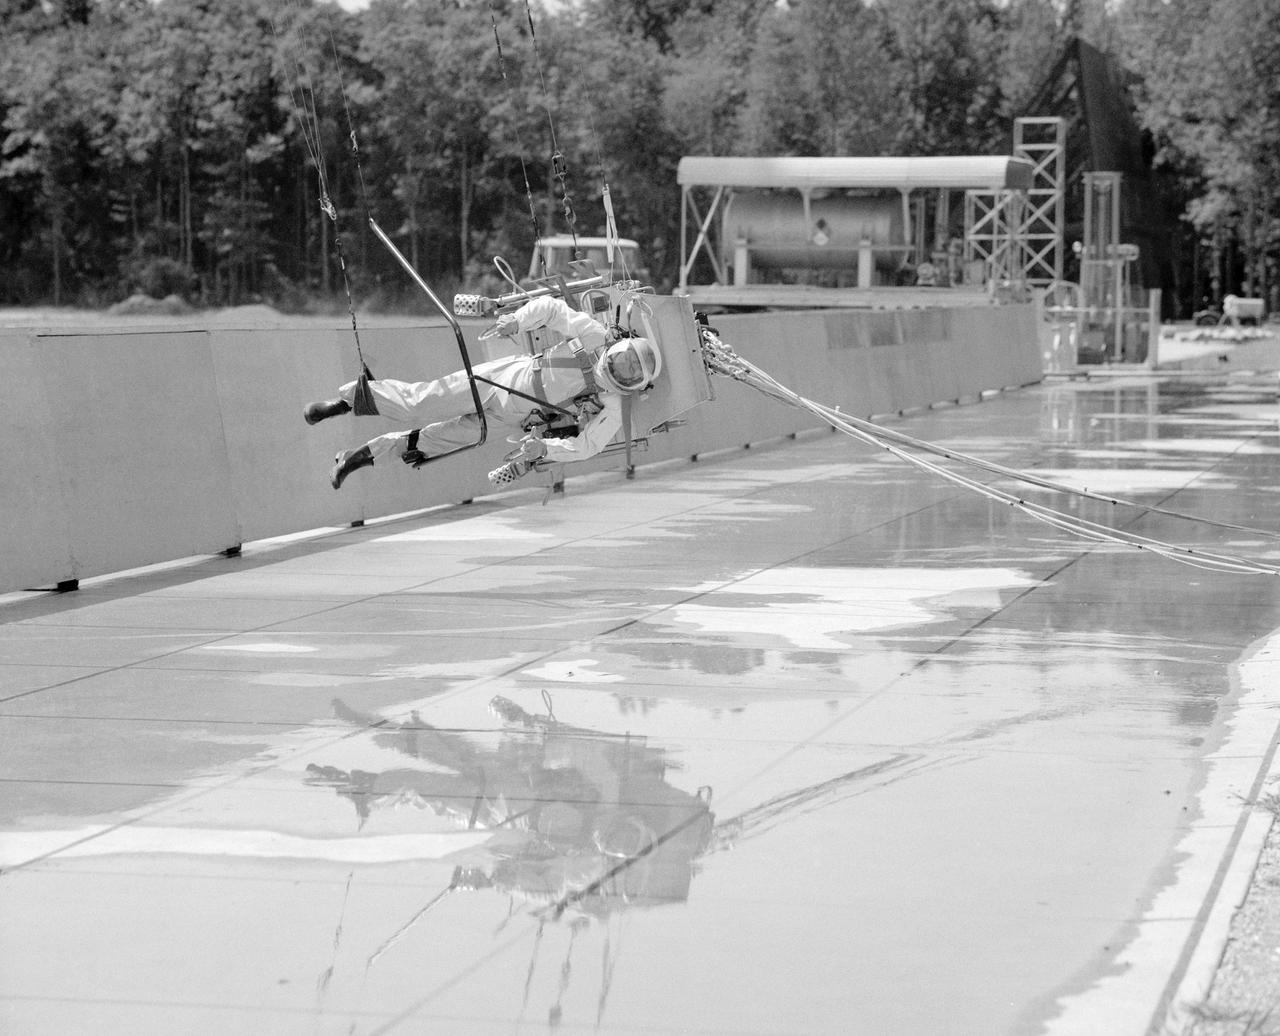
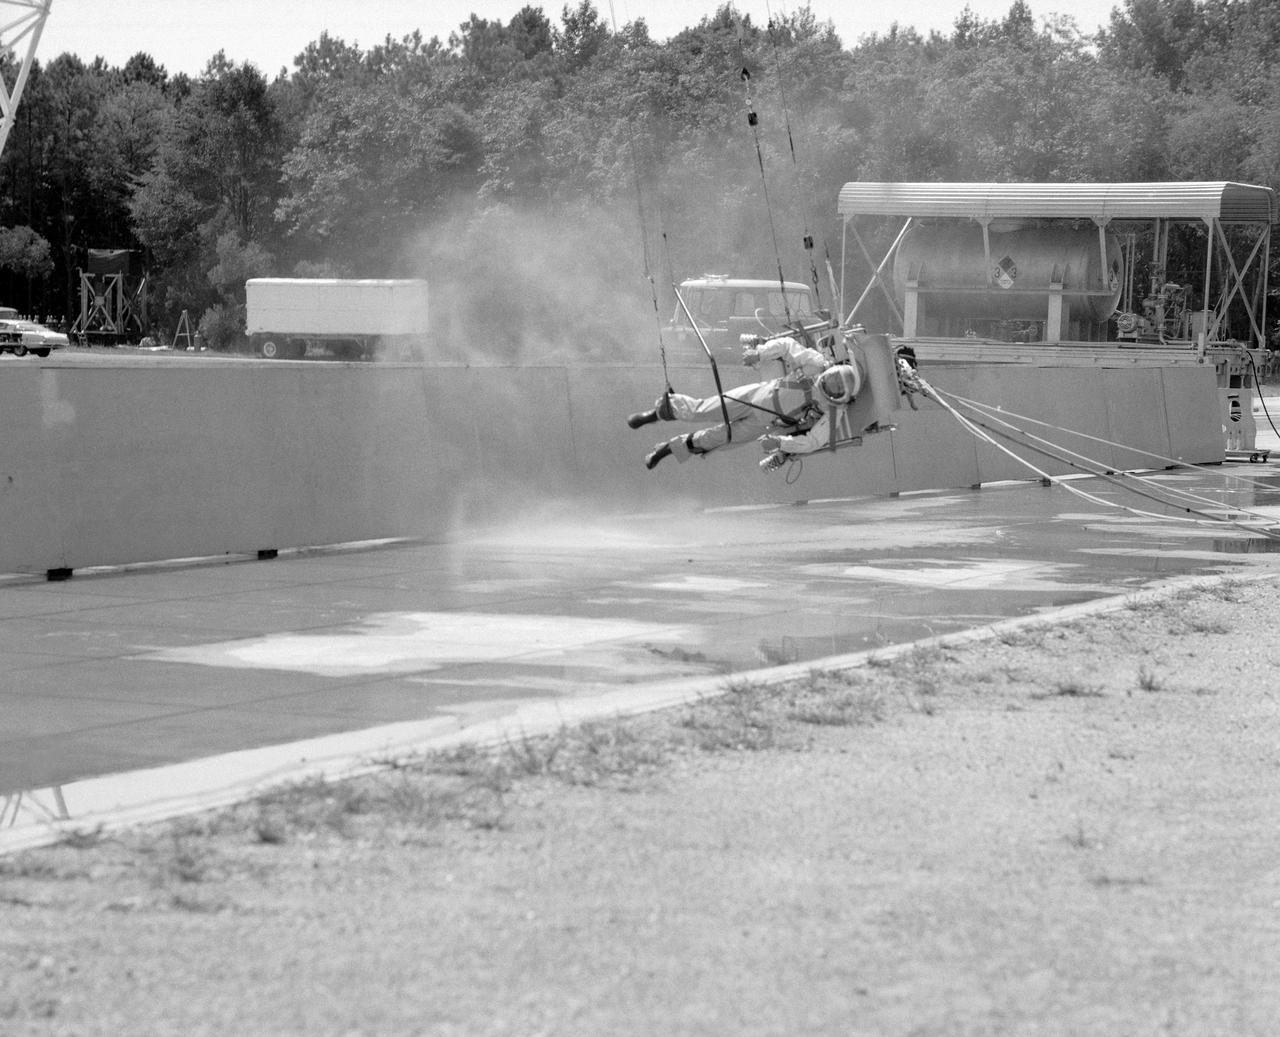
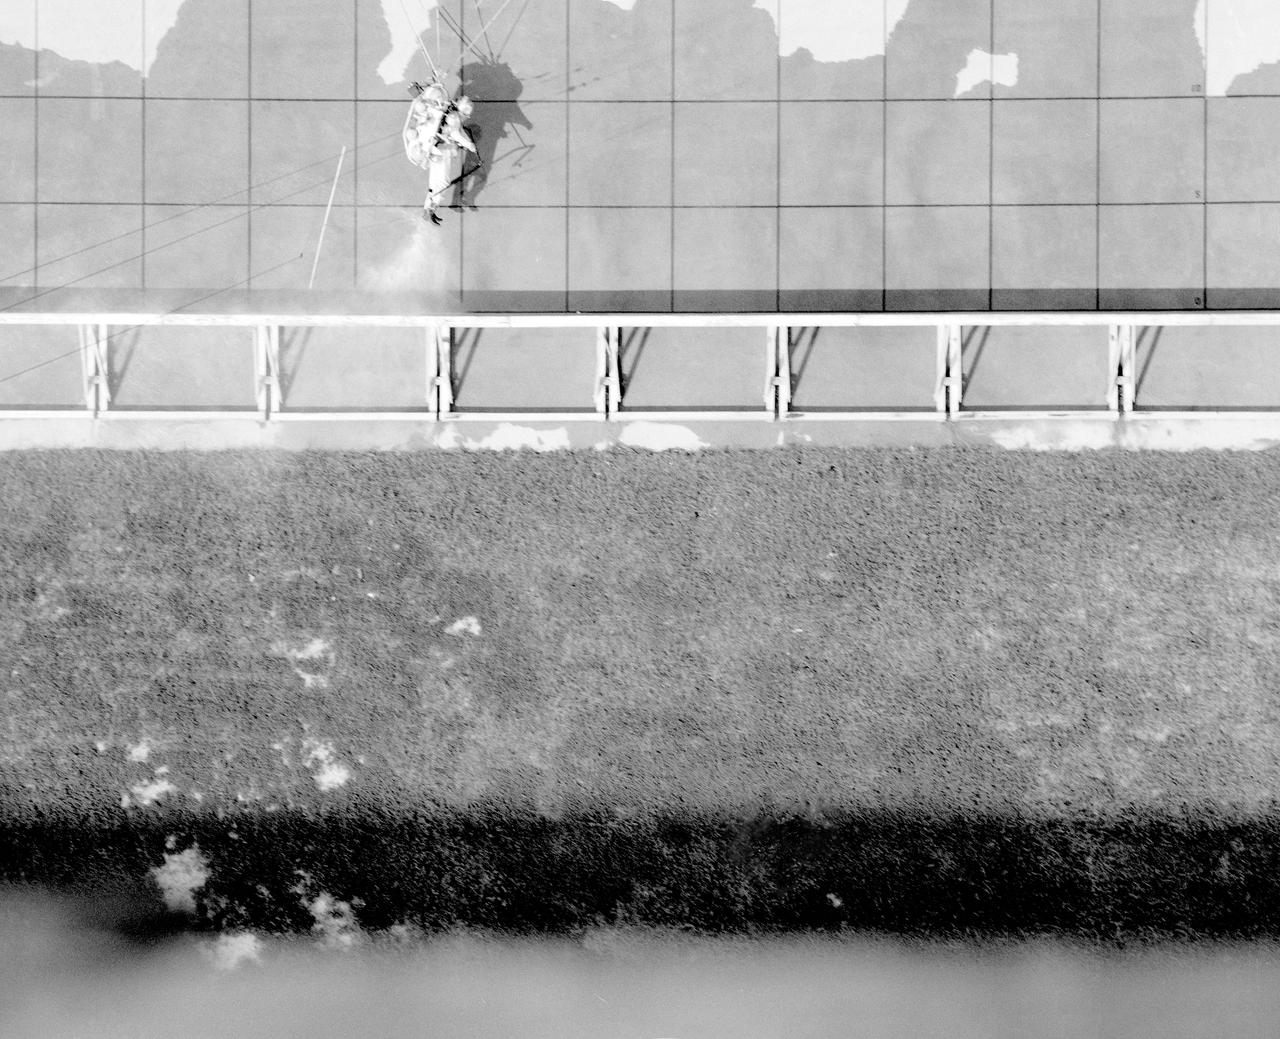
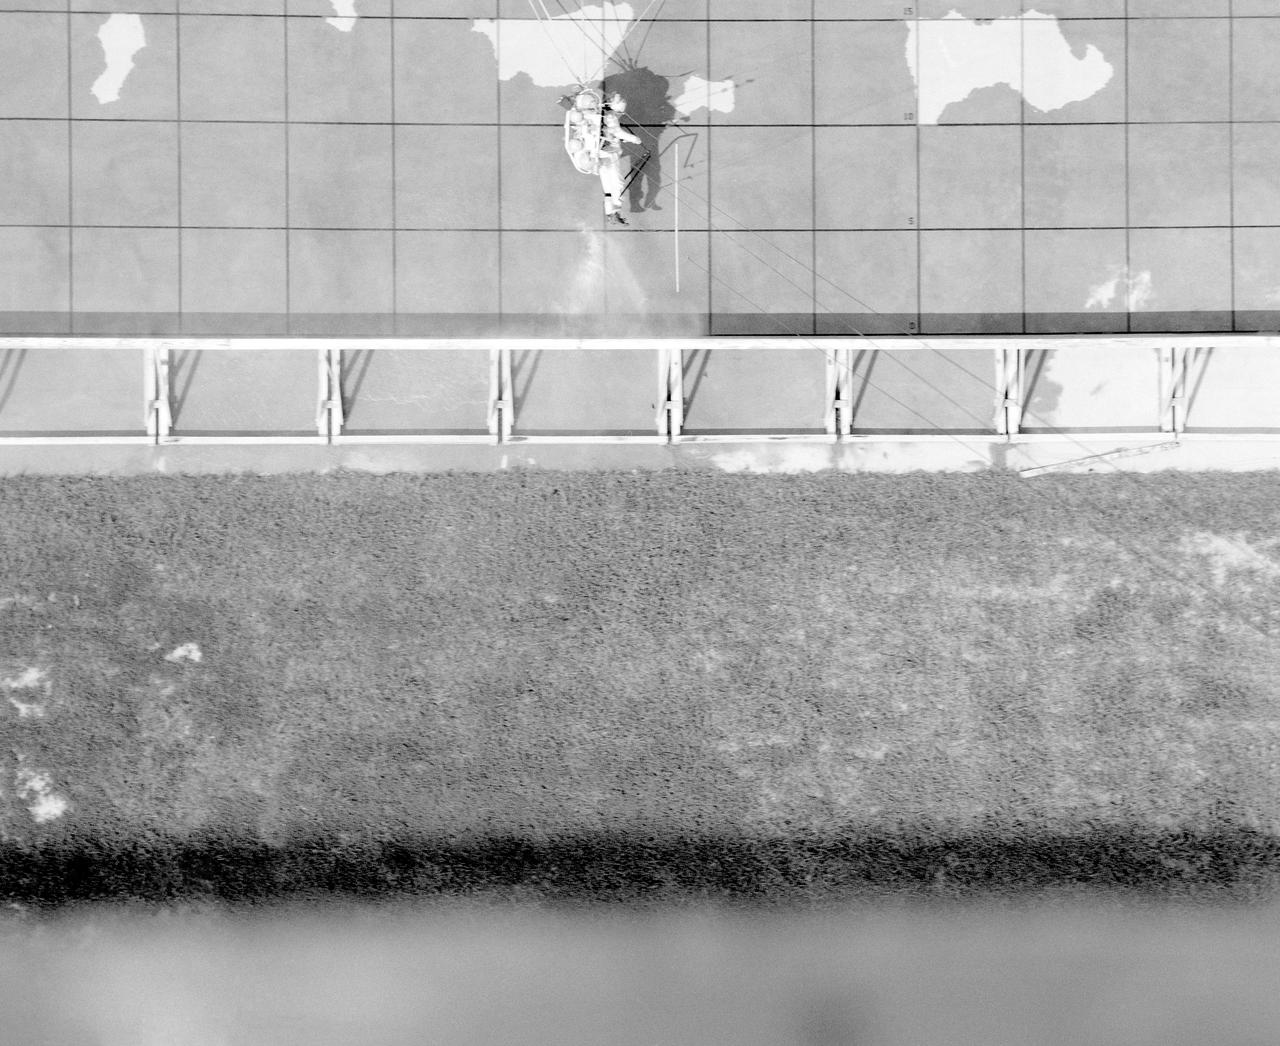
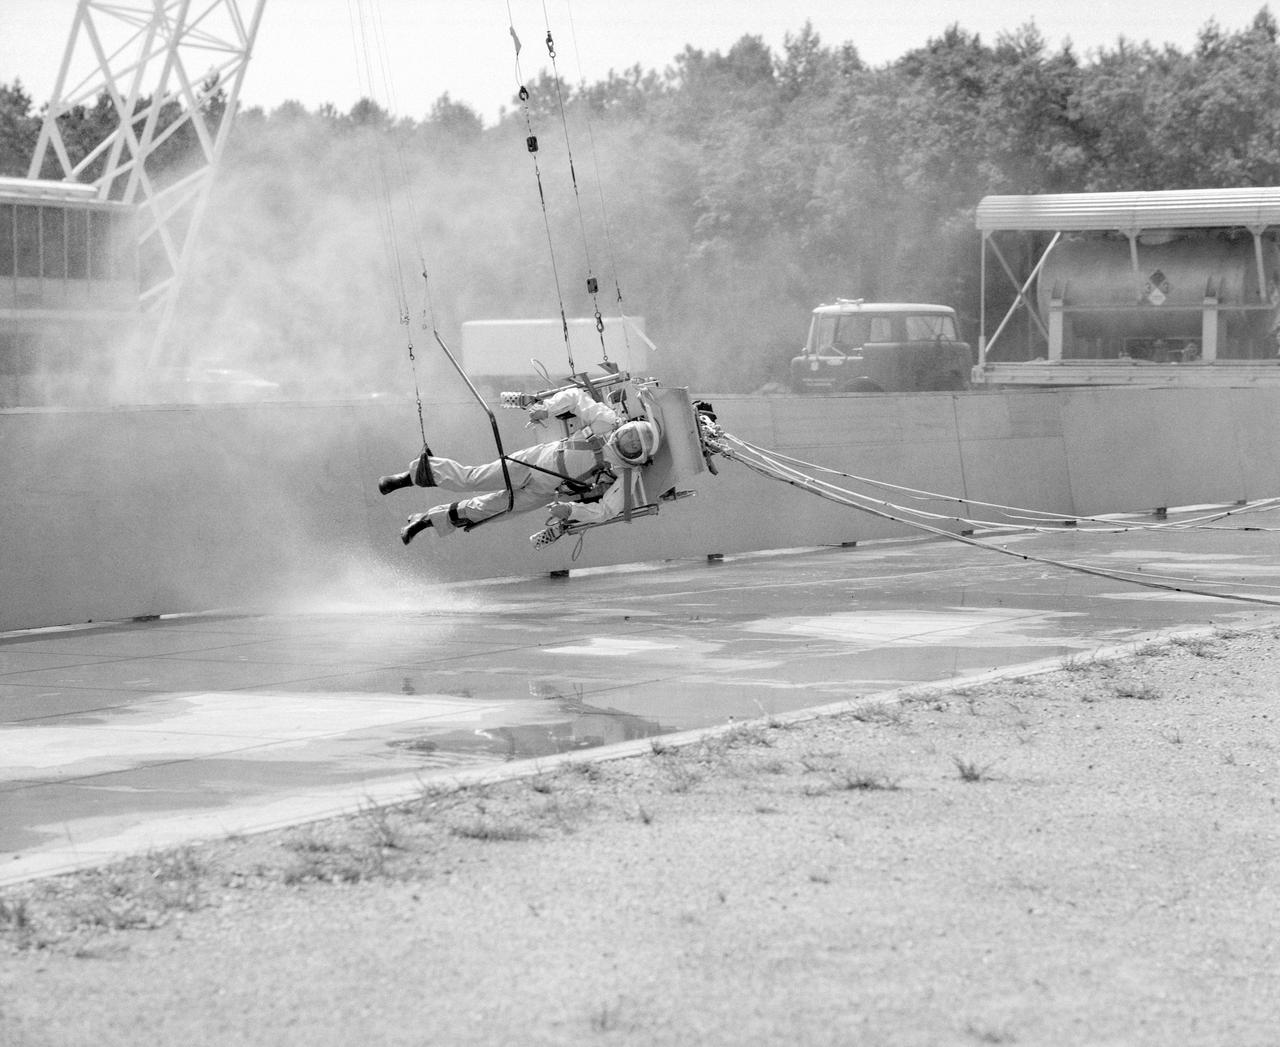
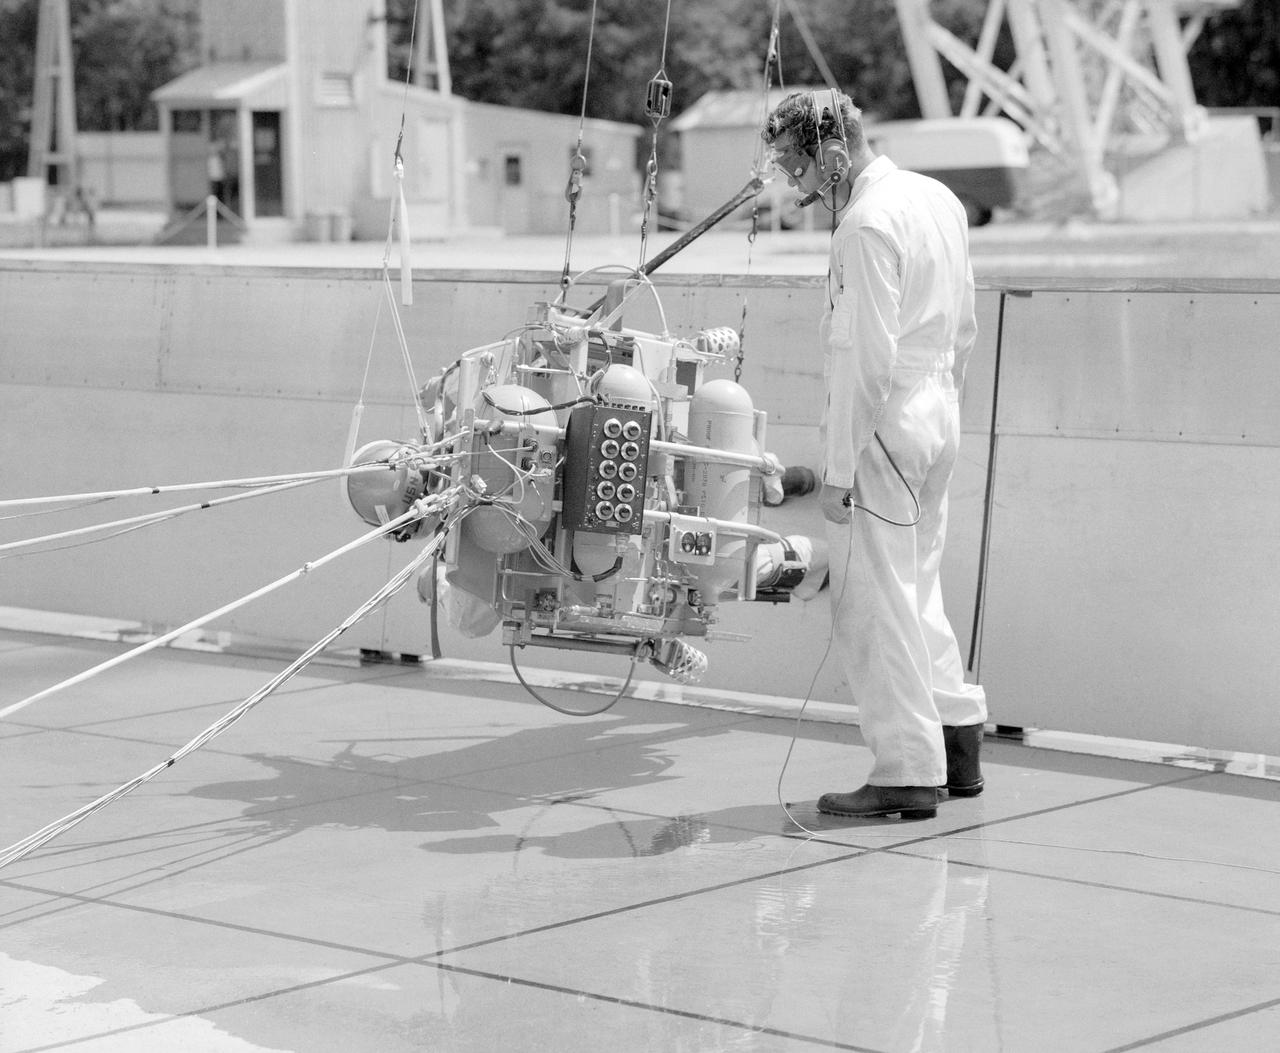
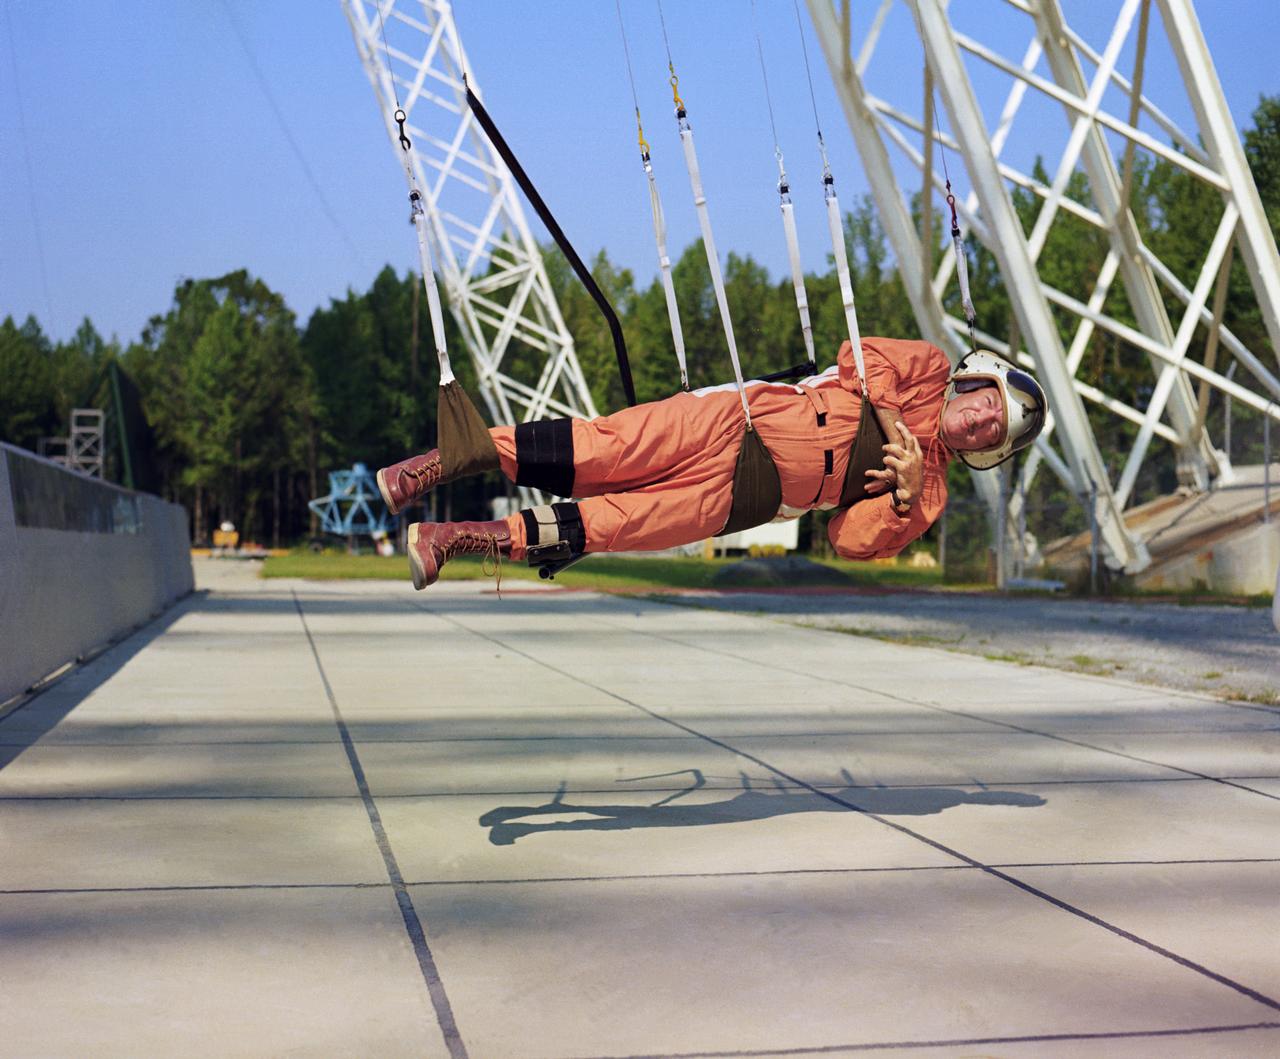
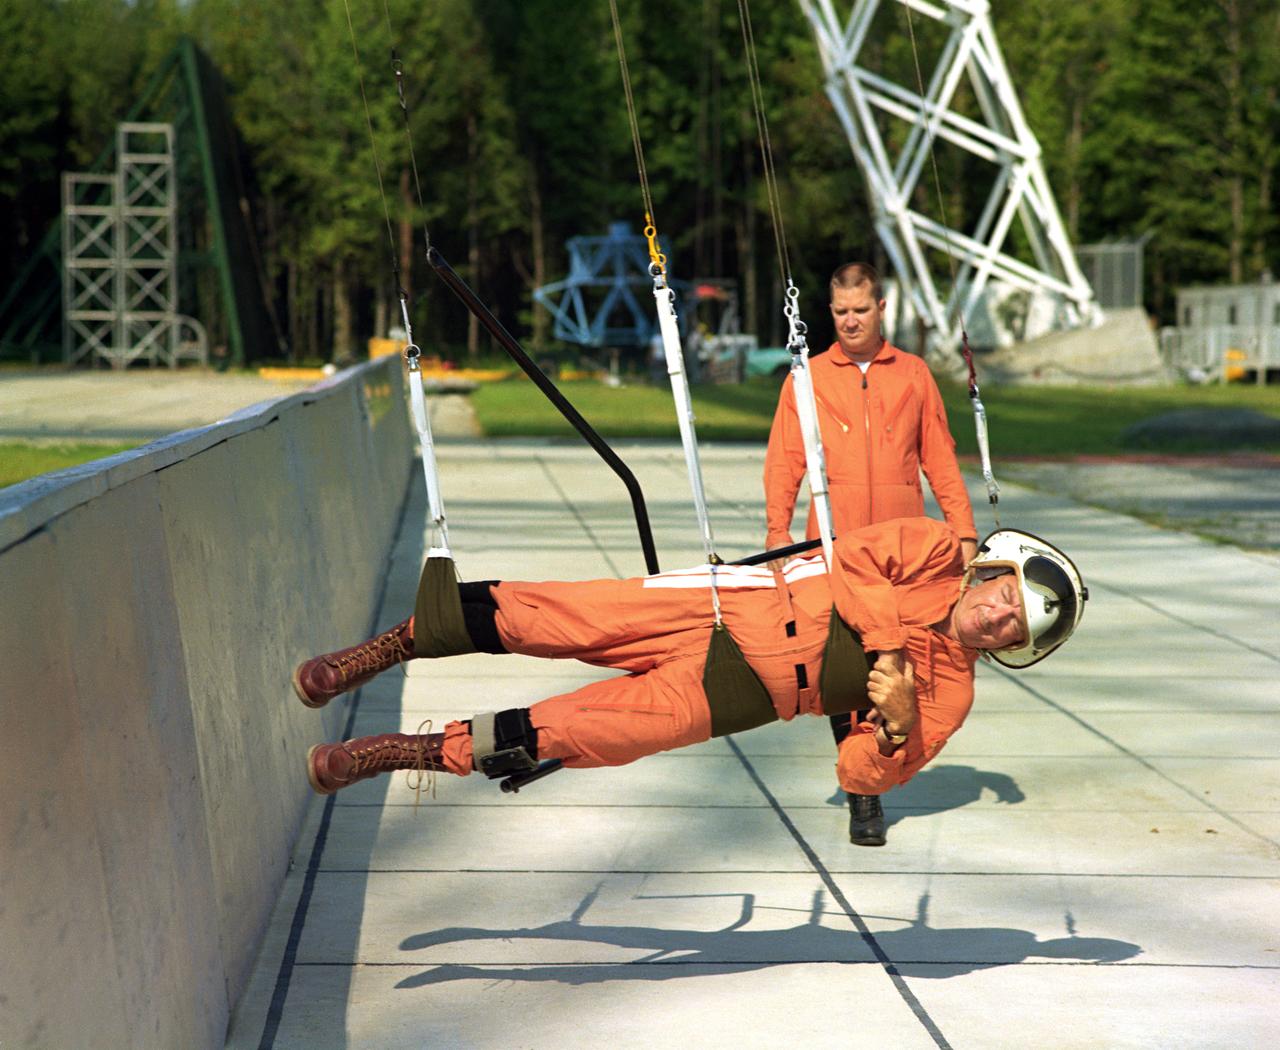
ICARUS - Lunar Walker with Pilot Dick Yenni. Yenni in ICARUS rig for jet propelled lunar mobility, at Lunar Landing Research Facility gantry.
ICARUS - Lunar Walker with Pilot Dick Yenni. Yenni in ICARUS rig for jet propelled lunar mobility, at Lunar Landing Research Facility gantry.
ICARUS - Lunar Walker with Pilot Dick Yenni. Yenni in ICARUS rig for jet propelled lunar mobility, at Lunar Landing Research Facility gantry.
ICARUS - Lunar Walker with Pilot Dick Yenni. Yenni in ICARUS rig for jet propelled lunar mobility, at Lunar Landing Research Facility gantry.
ICARUS - Lunar Walker with Pilot Dick Yenni. Yenni in ICARUS rig for jet propelled lunar mobility, at Lunar Landing Research Facility gantry.
ICARUS - Lunar Walker with Pilot Dick Yenni. Yenni in ICARUS rig for jet propelled lunar mobility, at Lunar Landing Research Facility or Gantry.
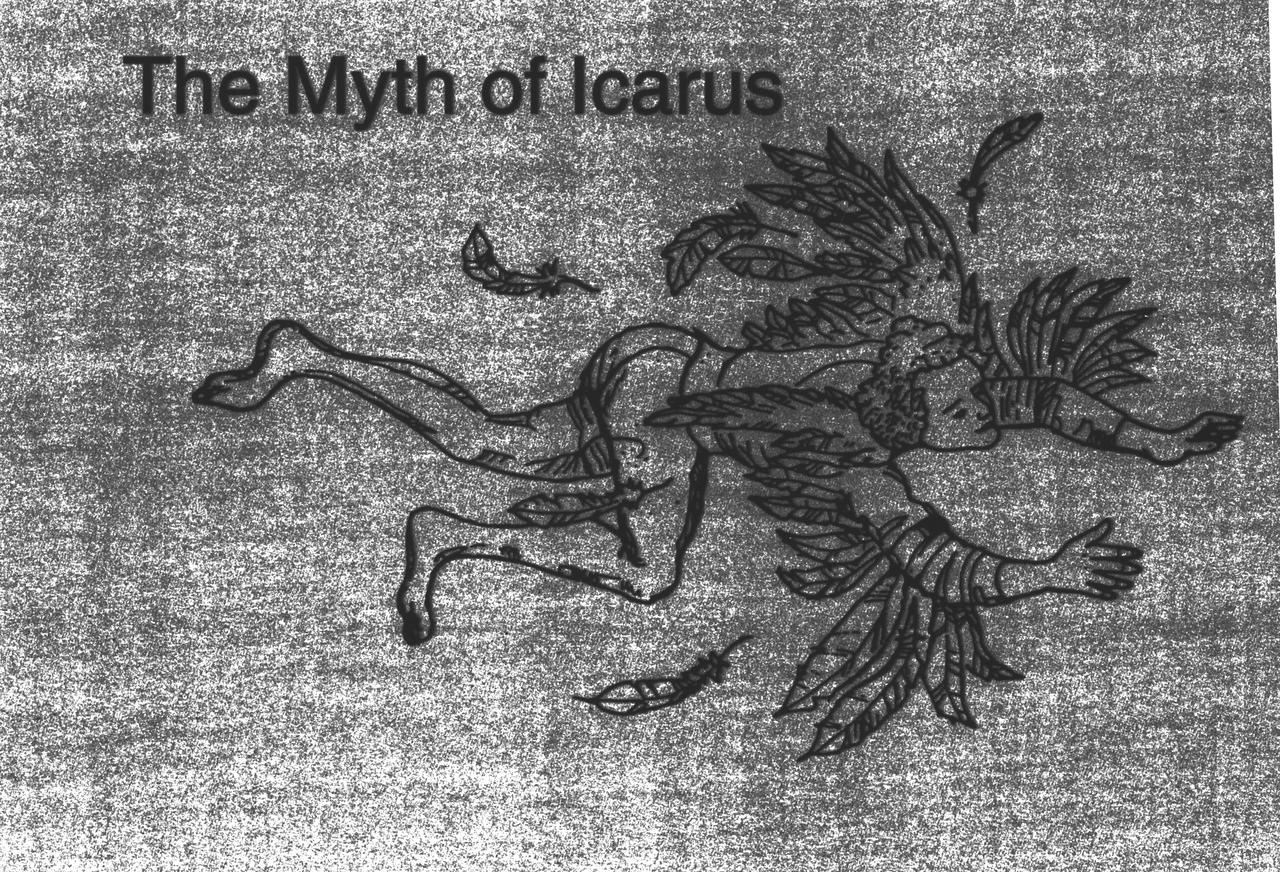
Ever since humans first saw birds soar through the sky, they have wanted to fly. The ancient Greeks and Romans pictured many of their gods with winged feet, and imagined mythological winged animals. According to the legend of Daedalus and Icarus, the father and son escaped prison by attaching wings made of wax and feathers to their bodies. Unfortunately, Icarus flew too near the sun, and the heat caused the wax and feathers to melt. The feathers fell off, and Icarus plummeted to the sea. Daedalus landed safely in Sicily.
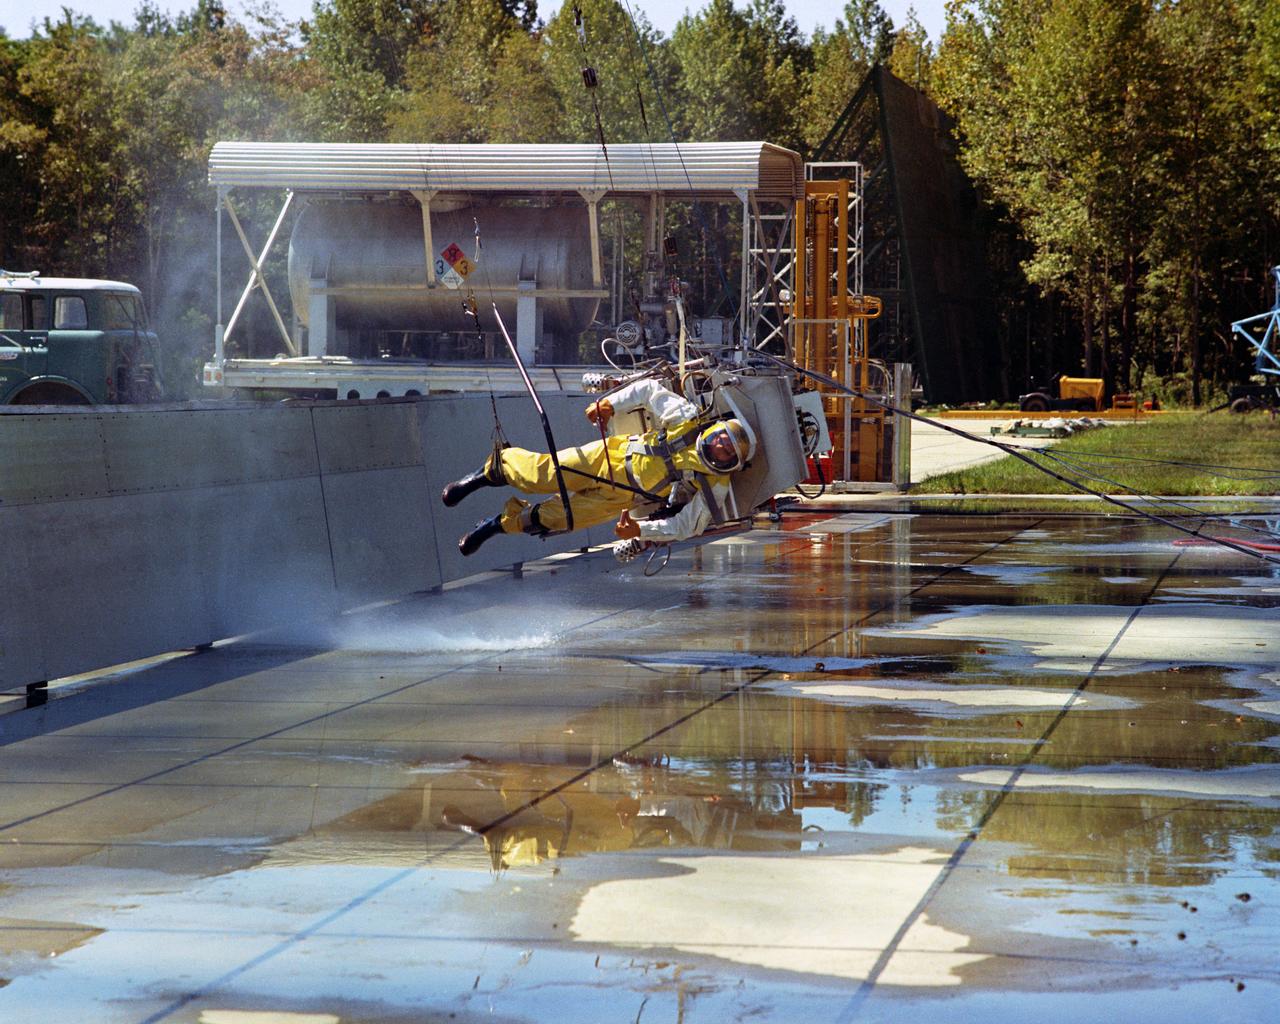
Icarus Lunar Walker,Lunar Landing Research Facility. Langley study of the backpack propulsion unit, by Bell Aerosystems. Icarus full scale test at Lunar Landing Research Facility - low gravity simulator. A NASA Langley researcher moon walks under the Lunar Landing Research Facility's gantry. More information on this can be read in the Document. "STUDIES OF PILOTING PROBLEMS OF ONE-MAN FLYING UNITS OPERATED IN SIMULATED LUNAR GRAVITY" BY Donald E. Hewes
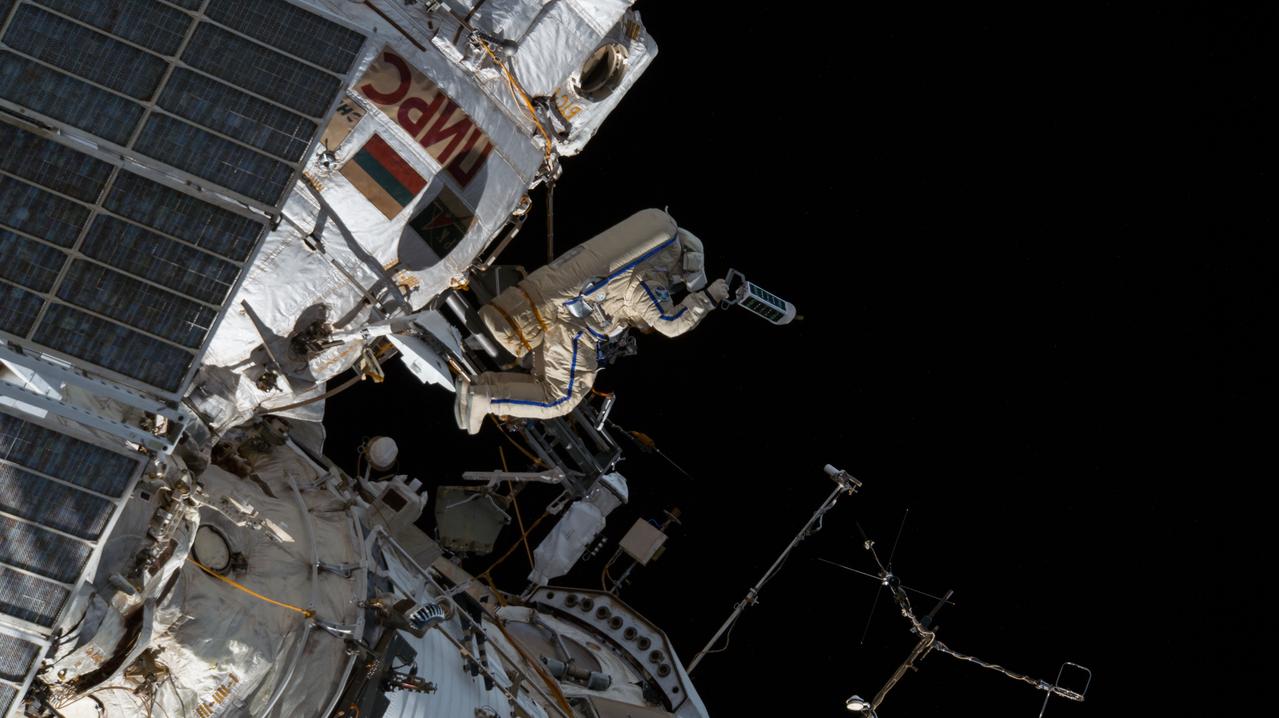
![iss056e142697 (8/15/2018) --- A view of Cosmonaut in red-striped Orlan suit, as he works to install Payload “ICARUS” on URM-D work station on PI.II of SM [PO] during ISS Extravehicular Activity 45 (EVA 45). ICARUS is a collaborative project between Roscosmos and the German aerospace center (DLR) to study the migratory patterns of small animals tagged on earth with GPS hardware.](https://images-assets.nasa.gov/image/iss056e142697/iss056e142697~medium.jpg)
iss056e142697 (8/15/2018) --- A view of Cosmonaut in red-striped Orlan suit, as he works to install Payload “ICARUS” on URM-D work station on PI.II of SM [PO] during ISS Extravehicular Activity 45 (EVA 45). ICARUS is a collaborative project between Roscosmos and the German aerospace center (DLR) to study the migratory patterns of small animals tagged on earth with GPS hardware.

iss056e142981 (Aug. 15, 2018) --- Roscosmos cosmonaut Sergey Prokopyev lays cable for the installation of the Icarus animal-tracking experiment on the Zvezda service module during a spacewalk that lasted 7 hours 46 minutes. Fellow cosmonaut Oleg Artemyev (out of frame) joined Prokopyev during the spacewalk which also saw the deployment of four nano-satellites and the retrieval of a materials exposure experiment on the Russian segment of the International Space Station.

iss056e139457 (Aug. 15, 2018) --- Roscosmos cosmonaut Sergey Prokopyev hand-deploys one of two Tanyusha nano-satellites just outside of the Pirs docking compartment airlock during a spacewalk that lasted 7 hours 46 minutes. Fellow cosmonaut Oleg Artemyev (out of frame) joined Prokopyev during the spacewalk which also saw the installation of the Icarus animal-tracking experiment and the retrieval of a materials exposure experiment on the Russian segment of the International Space Station.
iss056e139456 (Aug. 15, 2018) --- Roscosmos cosmonaut Sergey Prokopyev hand-deploys one of two Tanyusha nano-satellites just outside of the Pirs docking compartment airlock during a spacewalk that lasted 7 hours 46 minutes. Fellow cosmonaut Oleg Artemyev (out of frame) joined Prokopyev during the spacewalk which also saw the installation of the Icarus animal-tracking experiment and the retrieval of a materials exposure experiment on the Russian segment of the International Space Station.

iss056e142739 (Aug. 15, 2018) --- Roscosmos cosmonaut Sergey Prokopyev lays cable for the installation of the Icarus animal-tracking experiment on the Zvezda service module during a spacewalk that lasted 7 hours 46 minutes. Fellow cosmonaut Oleg Artemyev (out of frame) joined Prokopyev during the spacewalk which also saw the deployment of four nano-satellites and the retrieval of a materials exposure experiment on the Russian segment of the International Space Station.
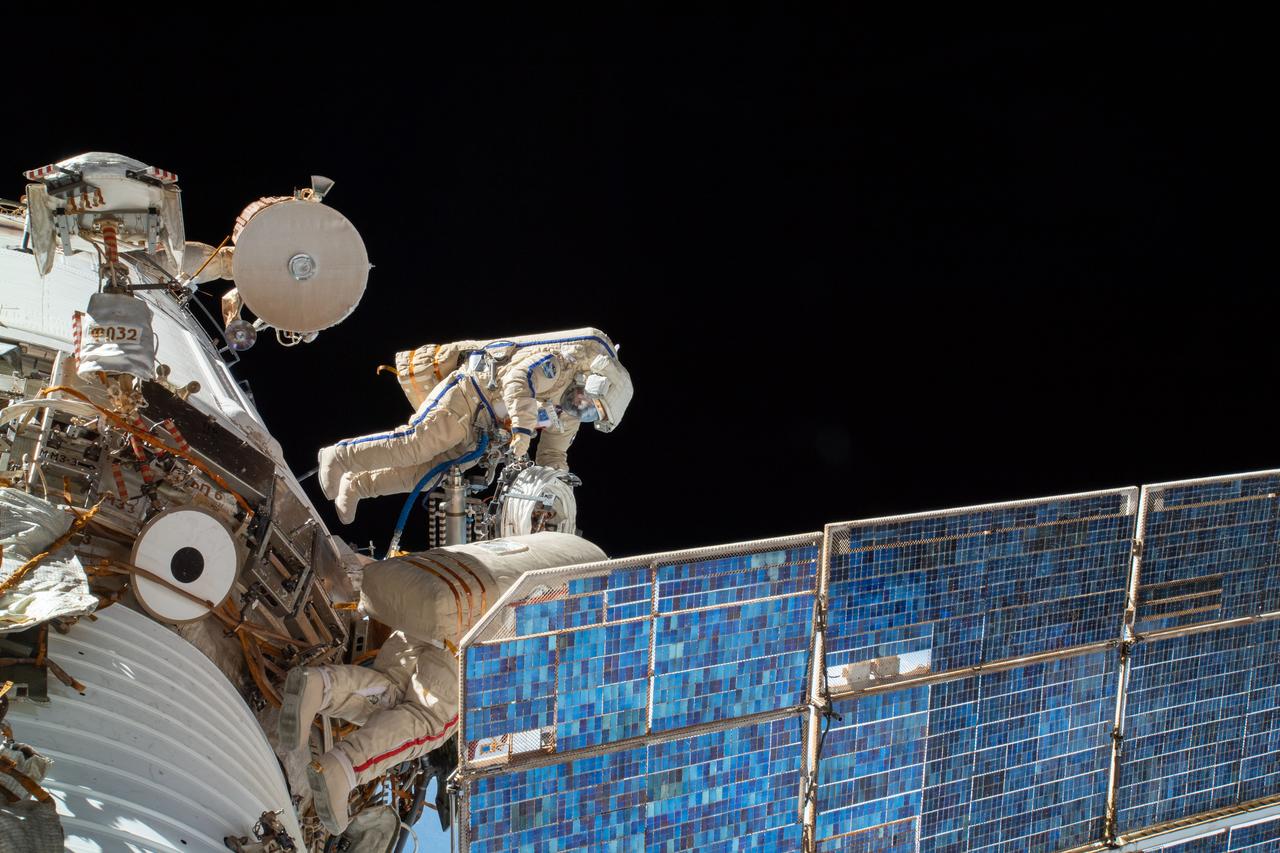
iss056e142790 (Aug. 15, 2018) --- Roscosmos cosmonaut Sergey Prokopyev lays cable for the installation of the Icarus animal-tracking experiment on the Zvezda service module during a spacewalk that lasted 7 hours 46 minutes. Fellow cosmonaut Oleg Artemyev (out of frame) joined Prokopyev during the spacewalk which also saw the deployment of four nano-satellites and the retrieval of a materials exposure experiment on the Russian segment of the International Space Station.
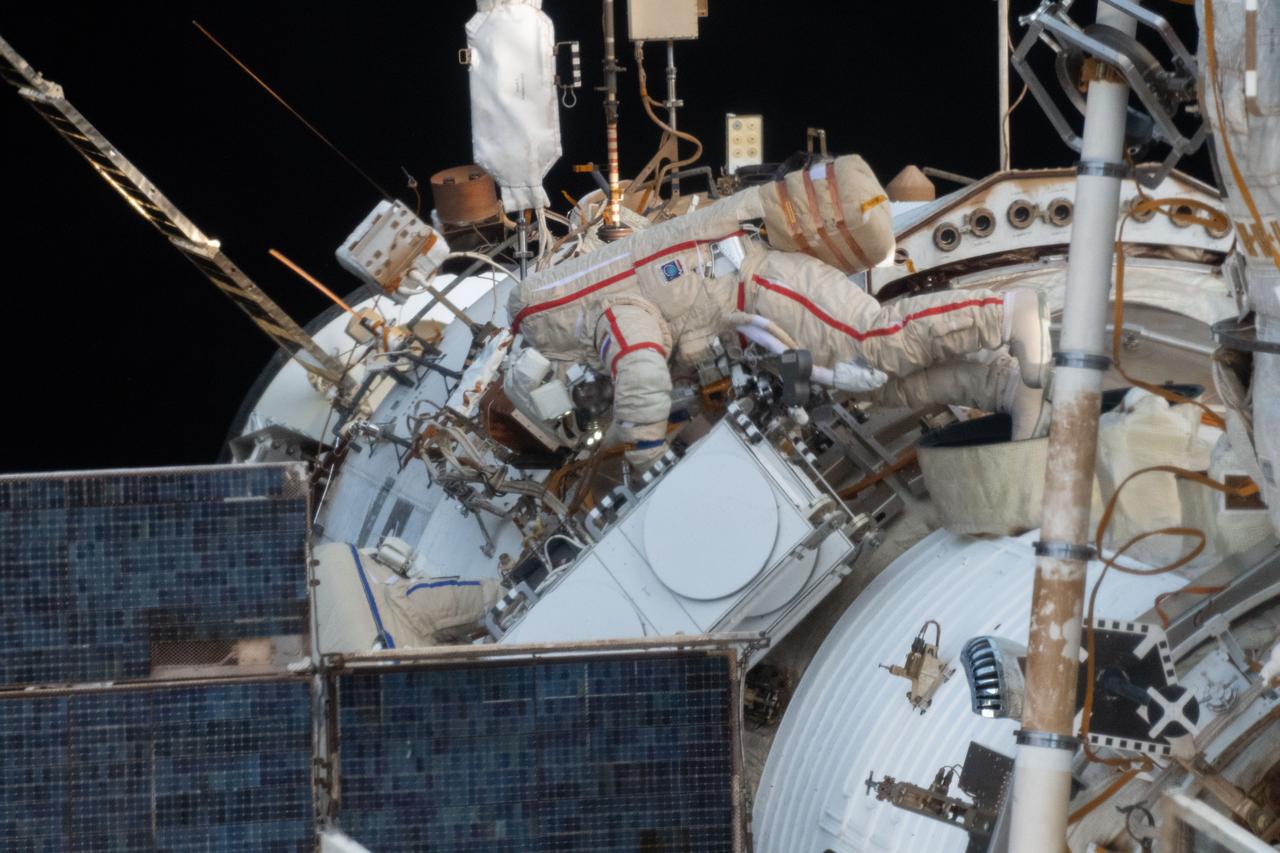
iss056e142673 (Aug. 15, 2018) --- Roscosmos cosmonaut Oleg Artemyev works to install the Icarus animal-tracking experiment on the Zvezda service module during a spacewalk that lasted 7 hours 46 minutes. Fellow cosmonaut Sergey Prokopyev (out of frame) joined Artemyev during the spacewalk which also saw the deployment of four nano-satellites and the retrieval of a materials exposure experiment on the Russian segment of the International Space Station.

This orthographic projection view from NASA MESSENGER spacecraft provides a look at Mercury north polar region. The yellow regions in many of the craters mark locations that show evidence for water ice, as detected by Earth-based radar observations from Arecibo Observatory in Puerto Rico. MESSENGER has collected compelling new evidence that the deposits are indeed water ice, including imaging within the permanently shaded interiors of some of the craters, such as Prokofiev and Fuller. Instrument: Mercury Dual Imaging System (MDIS) Arecibo Radar Image: In yellow (Harmon et al., 2011, Icarus 211, 37-50) http://photojournal.jpl.nasa.gov/catalog/PIA19411
Walter Cronkite in the Reduced Gravity Simulator. Various views of Cronkite in the Lunar Landing Research Facility's Reduced Gravity Simulator which was used to train the astronauts for weightlessness. L68-8308 Caption: "During a 1968 visit to Langley, then CBS News Anchorman Walter Cronkite tries out the Reduced Gravity Simulator, a series of cable-supported slings designed to approximate the Moon's gravity, 1/6th that of Earth's." Photograph published in Winds of Change, 75th Anniversary NASA publication, p 91, by James Schultz.
Walter Cronkite in the Reduced Gravity Simulator. Various views of Cronkite in the Lunar Landing Research Facility's Reduced Gravity Simulator which was used to train the astronauts for weightlessness. L68-8308 Caption: "During a 1968 visit to Langley, then CBS News Anchorman Walter Cronkite tries out the Reduced Gravity Simulator, a series of cable-supported slings designed to approximate the Moon's gravity, 1/6th that of Earth's." Photograph published in Winds of Change, 75th Anniversary NASA publication, p 91, by James Schultz.
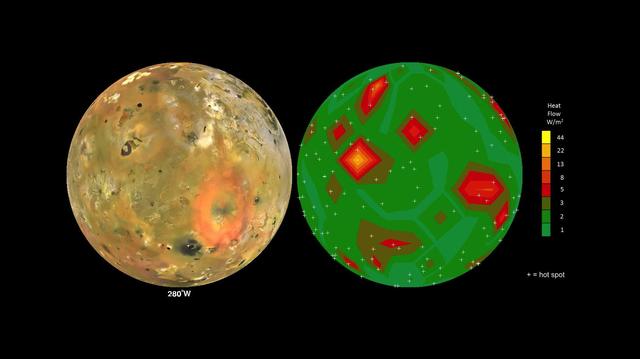
This frame from an animation shows Jupiter volcanic moon Io as seen by NASA Voyager and Galileo spacecraft (at left) and the pattern of heat flow from 242 active volcanoes (at right). The red and yellow areas are places where local heat flow is greatest -- the result of magma erupting from Io's molten interior onto the surface. The map is the result of analyzing decades of observations from spacecraft and ground-based telescopes. It shows Io's usual volcanic thermal emission, excluding the occasional massive but transient "outburst" eruption; in other words, this is what Io looks like most of the time. This heat flow map will be used to test models of interior heating. The map shows that areas of enhanced volcanic heat flow are not necessarily correlated with the number of volcanoes in a particular region and are poorly correlated with expected patterns of heat flow from current models of tidal heating -- something that is yet to be explained. This research is published in association with a 2015 paper in the journal Icarus by A. Davies et al., titled "Map of Io's Volcanic Heat Flow," (http://dx.doi.org/10.1016/j.icarus.2015.08.003.) http://photojournal.jpl.nasa.gov/catalog/PIA19655
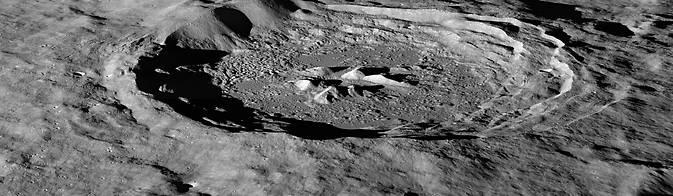
Space travel is difficult and expensive – it would cost thousands of dollars to launch a bottle of water to the moon. The recent discovery of hydrogen-bearing molecules, possibly including water, on the moon has explorers excited because these deposits could be mined if they are sufficiently abundant, sparing the considerable expense of bringing water from Earth. Lunar water could be used for drinking or its components – hydrogen and oxygen – could be used to manufacture important products on the surface that future visitors to the moon will need, like rocket fuel and breathable air. Recent observations by NASA's Lunar Reconnaissance Orbiter (LRO) spacecraft indicate these deposits may be slightly more abundant on crater slopes in the southern hemisphere that face the lunar South Pole. "There’s an average of about 23 parts-per-million-by-weight (ppmw) more hydrogen on Pole-Facing Slopes (PFS) than on Equator-Facing Slopes (EFS)," said Timothy McClanahan of NASA's Goddard Space Flight Center in Greenbelt, Maryland. This is the first time a widespread geochemical difference in hydrogen abundance between PFS and EFS on the moon has been detected. It is equal to a one-percent difference in the neutron signal detected by LRO's Lunar Exploration Neutron Detector (LEND) instrument. McClanahan is lead author of a paper about this research published online October 19 in the journal Icarus. Read more: <a href="http://1.usa.gov/1uaa8s2" rel="nofollow">1.usa.gov/1uaa8s2</a> Photo caption: LRO image of the moon's Hayn Crater, located just northeast of Mare Humboldtianum, dramatically illuminated by the low Sun casting long shadows across the crater floor. Image Credit: NASA/GSFC/Arizona State University <b><a href="http://www.nasa.gov/audience/formedia/features/MP_Photo_Guidelines.html" rel="nofollow">NASA image use policy.</a></b> <b><a href="http://www.nasa.gov/centers/goddard/home/index.html" rel="nofollow">NASA Goddard Space Flight Center</a></b> enables NASA’s mission through four scientific endeavors: Earth Science, Heliophysics, Solar System Exploration, and Astrophysics. Goddard plays a leading role in NASA’s accomplishments by contributing compelling scientific knowledge to advance the Agency’s mission. <b>Follow us on <a href="http://twitter.com/NASAGoddardPix" rel="nofollow">Twitter</a></b> <b>Like us on <a href="http://www.facebook.com/pages/Greenbelt-MD/NASA-Goddard/395013845897?ref=tsd" rel="nofollow">Facebook</a></b> <b>Find us on <a href="http://instagram.com/nasagoddard?vm=grid" rel="nofollow">Instagram</a></b>
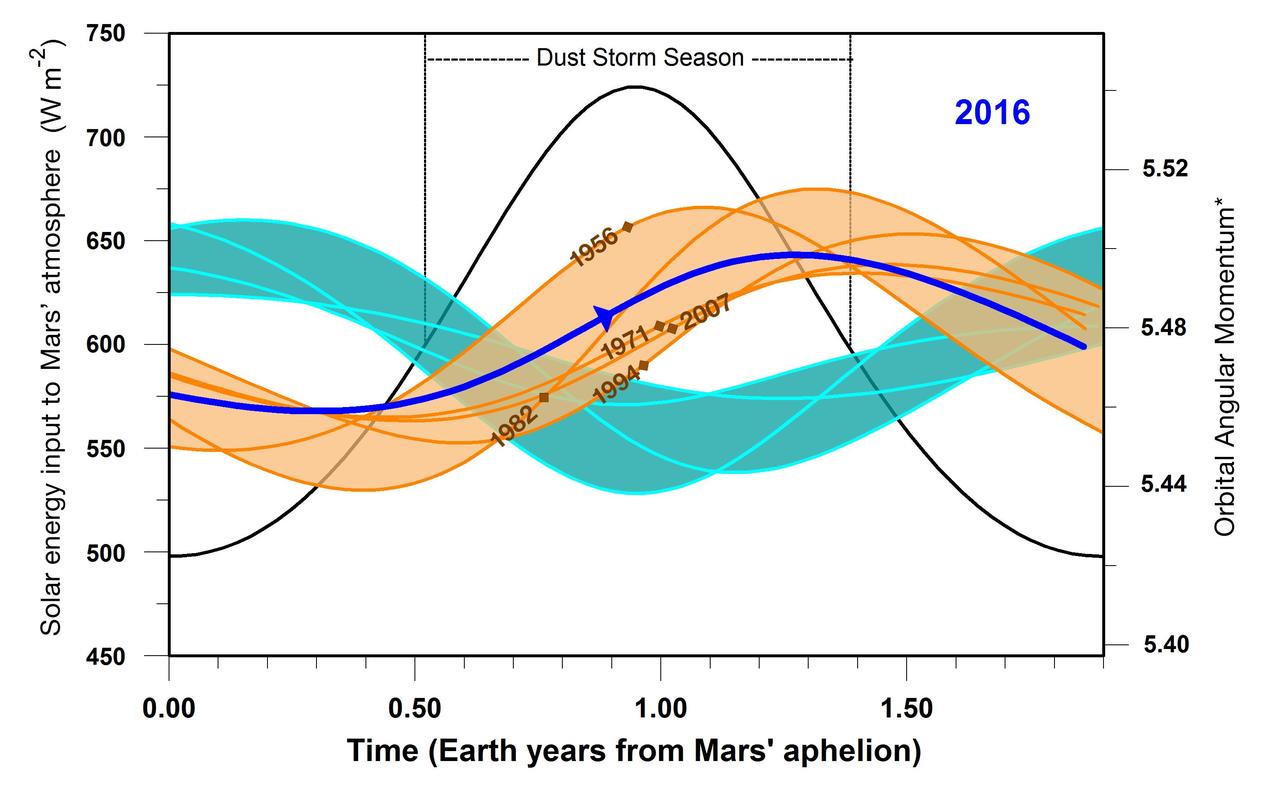
This graphic indicates a similarity between 2016 (dark blue line) and five past years in which Mars has experienced a global dust storm (orange lines and band), compared to years with no global dust storm (blue-green lines and band). The arrow nearly midway across in the dark blue line indicates the Mars time of year in late September 2016. A key factor in the graph is the orbital angular momentum of Mars, which would be steady in a system of only one planet orbiting the sun, but varies due to relatively small effects of having other planets in the solar system. The horizontal scale is time of year on Mars, starting at left with the planet's farthest distance from the sun in each orbit. This point in the Mars year, called "Mars aphelion," corresponds to late autumn in the southern hemisphere. Numeric values on the horizontal axis are in Earth years; each Mars year lasts for about 1.9 Earth years. The vertical scale bar at left applies only to the black-line curve on the graph. The amount of solar energy entering Mars' atmosphere (in watts per square meter) peaks at the time of year when Mars is closest to the sun, corresponding to late spring in the southern hemisphere. The duration of Mars' dust storm season, as indicated, brackets the time of maximum solar input to the atmosphere. The scale bar at right, for orbital angular momentum, applies to the blue, brown and blue-green curves on the graph. The values are based on mass, velocity and distance from the gravitational center of the solar system. Additional information on the units is in a 2015 paper in the journal Icarus, from which this graph is derived. The band shaded in orange is superimposed on the curves of angular momentum for five Mars years that were accompanied by global dust storms in 1956, 1971, 1982, 1994 and 2007. Brown diamond symbols on the curves for these years in indicate the times when the global storms began. The band shaded blue-green lies atop angular momentum curves for six years when no global dust storms occurred: 1939, 1975, 1988, 1998, 2000 and 2011. Note that in 2016, as in the pattern of curves for years with global dust storms, the start of the dust storm season corresponded to a period of increasing orbital angular momentum. In years with no global storm, angular momentum was declining at that point. Observations of whether dust from regional storms on Mars spreads globally in late 2016 or early 2017 will determine whether this correspondence holds up for the current Mars year. http://photojournal.jpl.nasa.gov/catalog/PIA20855