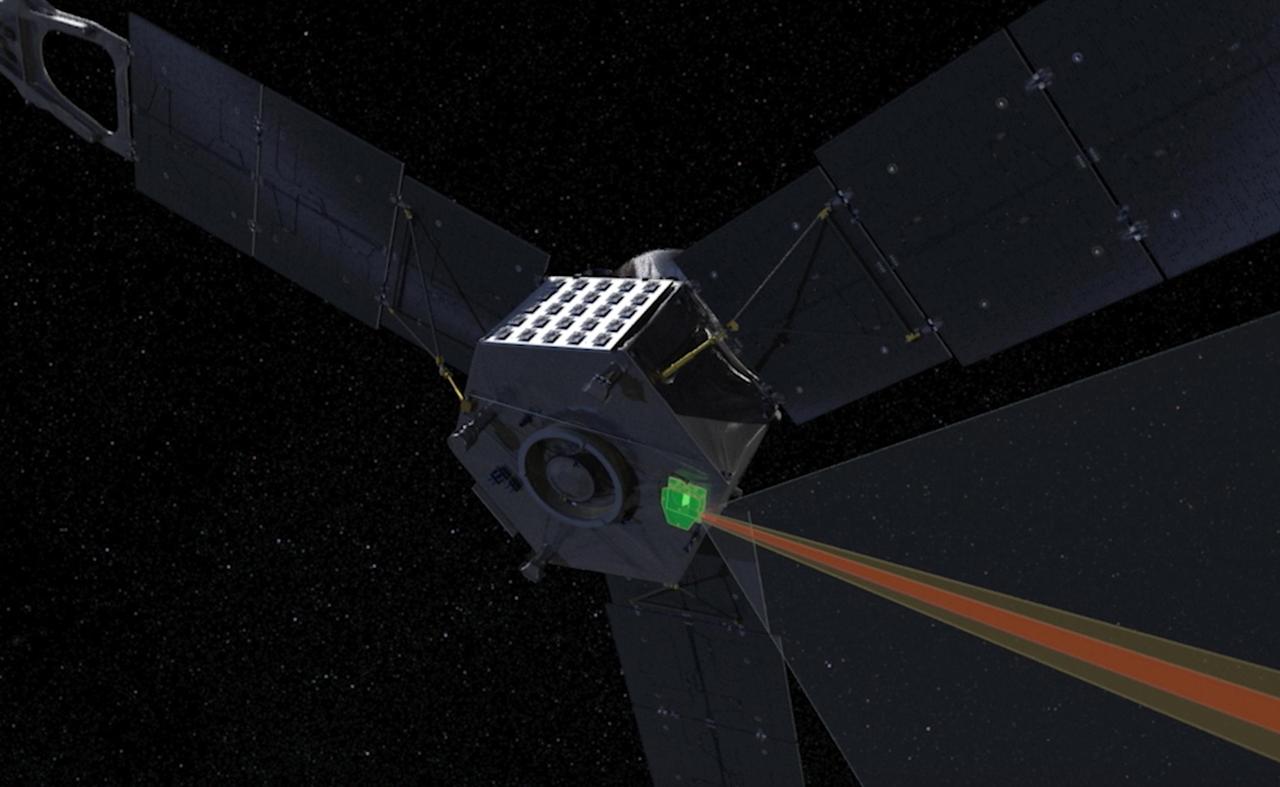
This computer-generated image depicts the Jovian Infrared Auroral Mapper (JIRAM) instrument aboard NASA's Juno spacecraft. The JIRAM instrument measures heat radiated from the planet at an infrared wavelength of around 5 microns. https://photojournal.jpl.nasa.gov/catalog/PIA23594
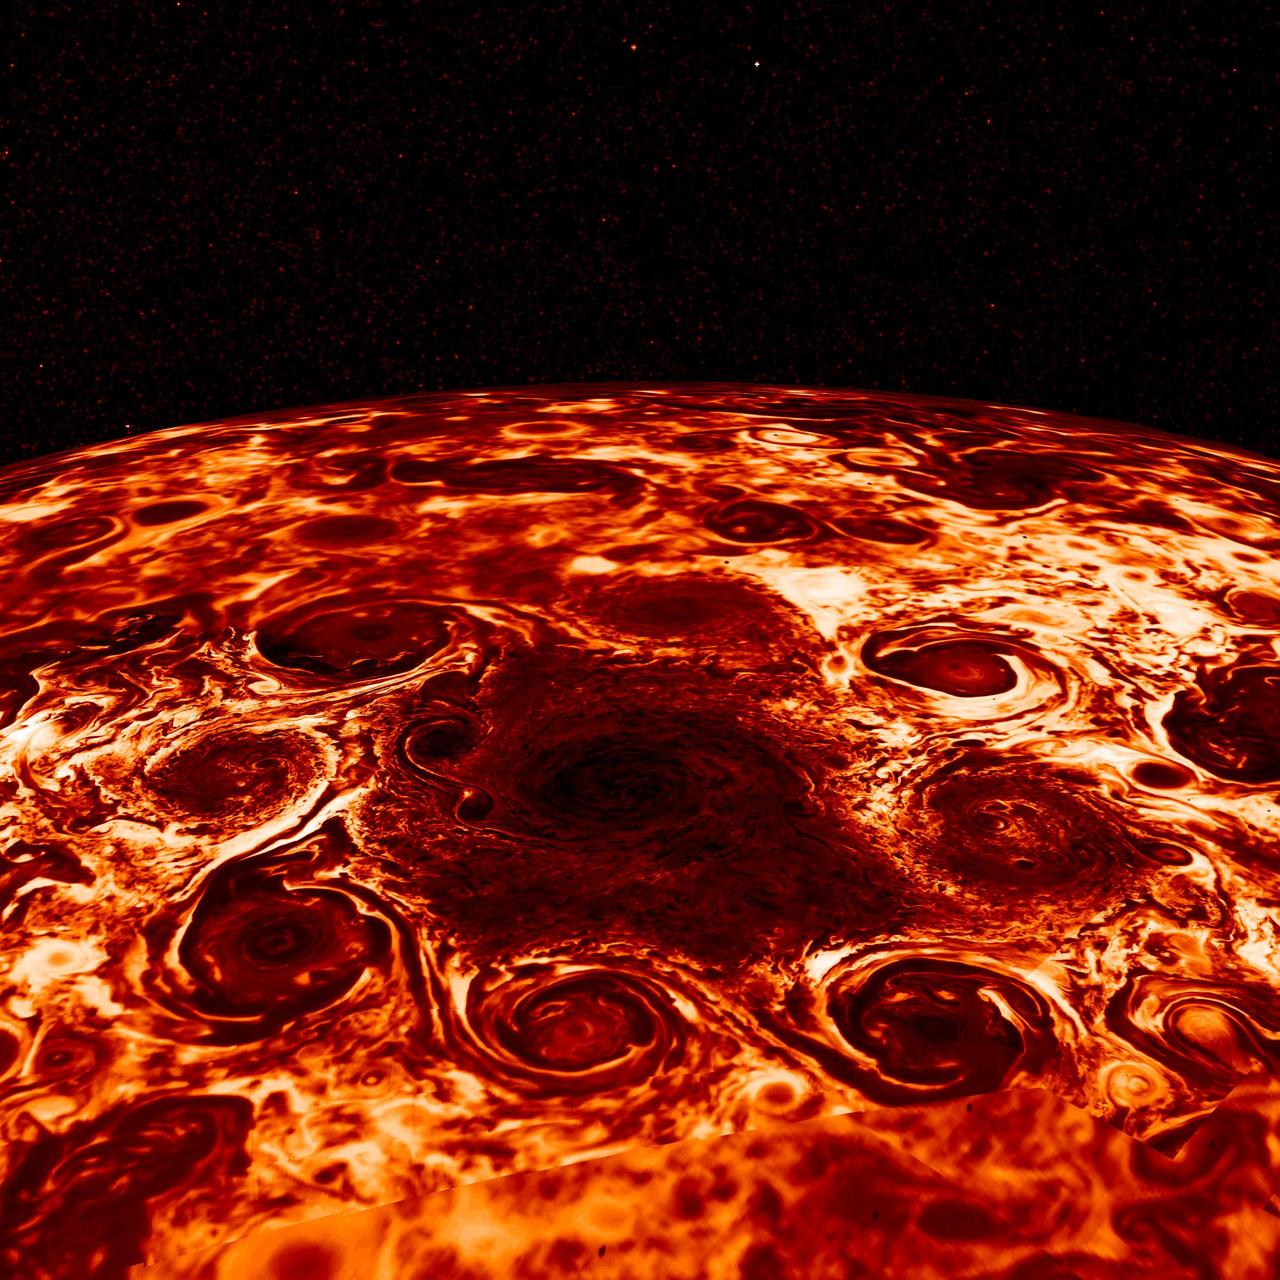
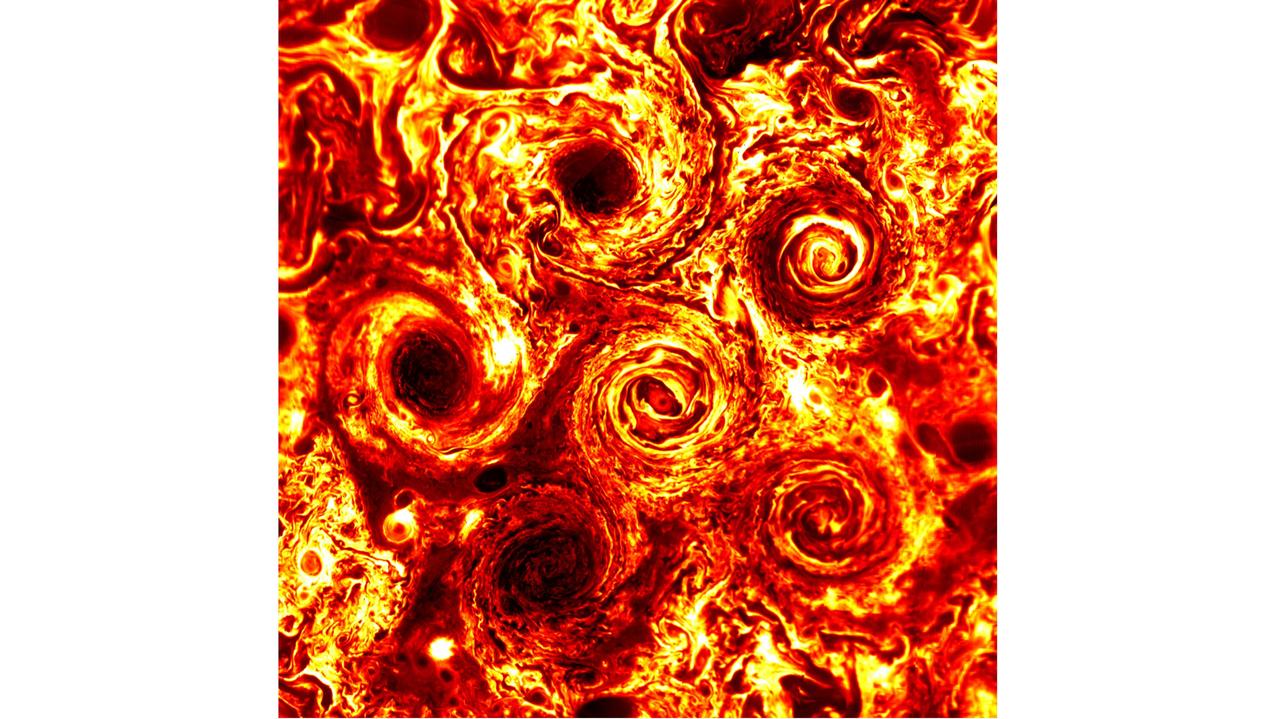
In this composite image, derived from data collected by the Jovian Infrared Auroral Mapper (JIRAM) instrument aboard NASA's Juno mission to Jupiter, shows the central cyclone at the planet's north pole and the eight cyclones that encircle it. JIRAM collects data in infrared, and the colors in this composite represent radiant heat: the yellow (thinner) clouds are about 9 degrees Fahrenheit (-13°Celsius) in brightness temperature and the dark red (thickest) are around -181 degrees Fahrenheit (83°Celsius). https://photojournal.jpl.nasa.gov/catalog/PIA22335
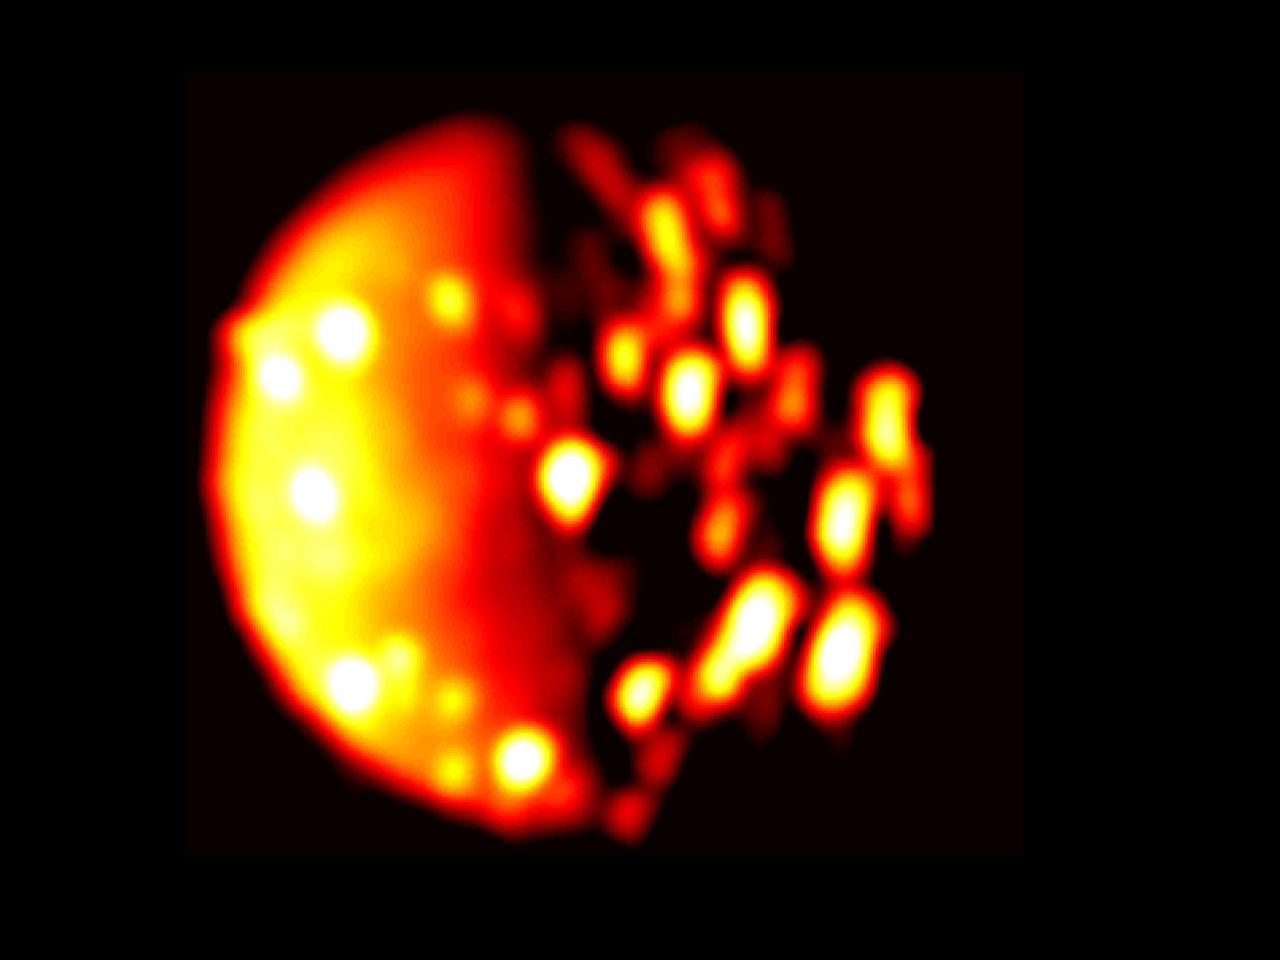
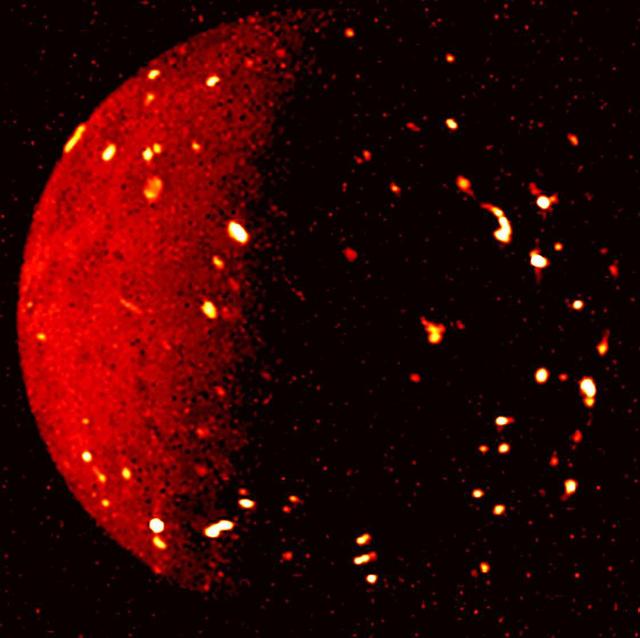
This infrared image of the southern hemisphere of Jupiter's moon Io was derived from data collected by the Jovian Infrared Auroral Mapper (JIRAM) instrument aboard NASA's Juno spacecraft on Dec. 16, 2017, when the spacecraft was about 290,000 miles (470,000 kilometers) from the Jovian moon. In this infrared image, the brighter the color the higher the temperature recorded by JIRAM. An animation is available at https://photojournal.jpl.nasa.gov/catalog/PIA22599
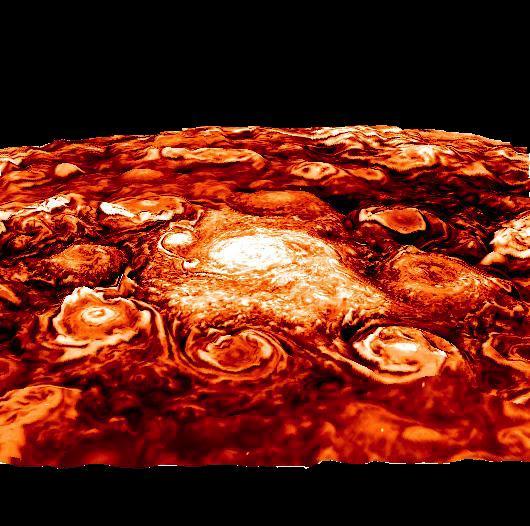
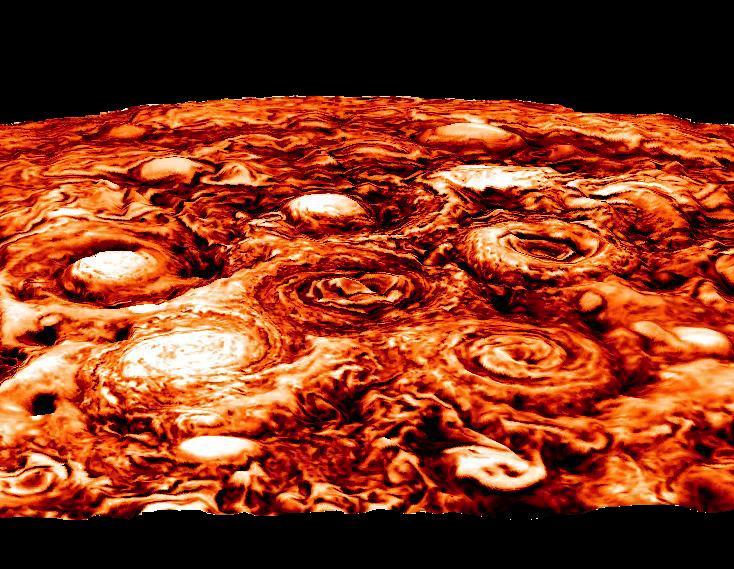
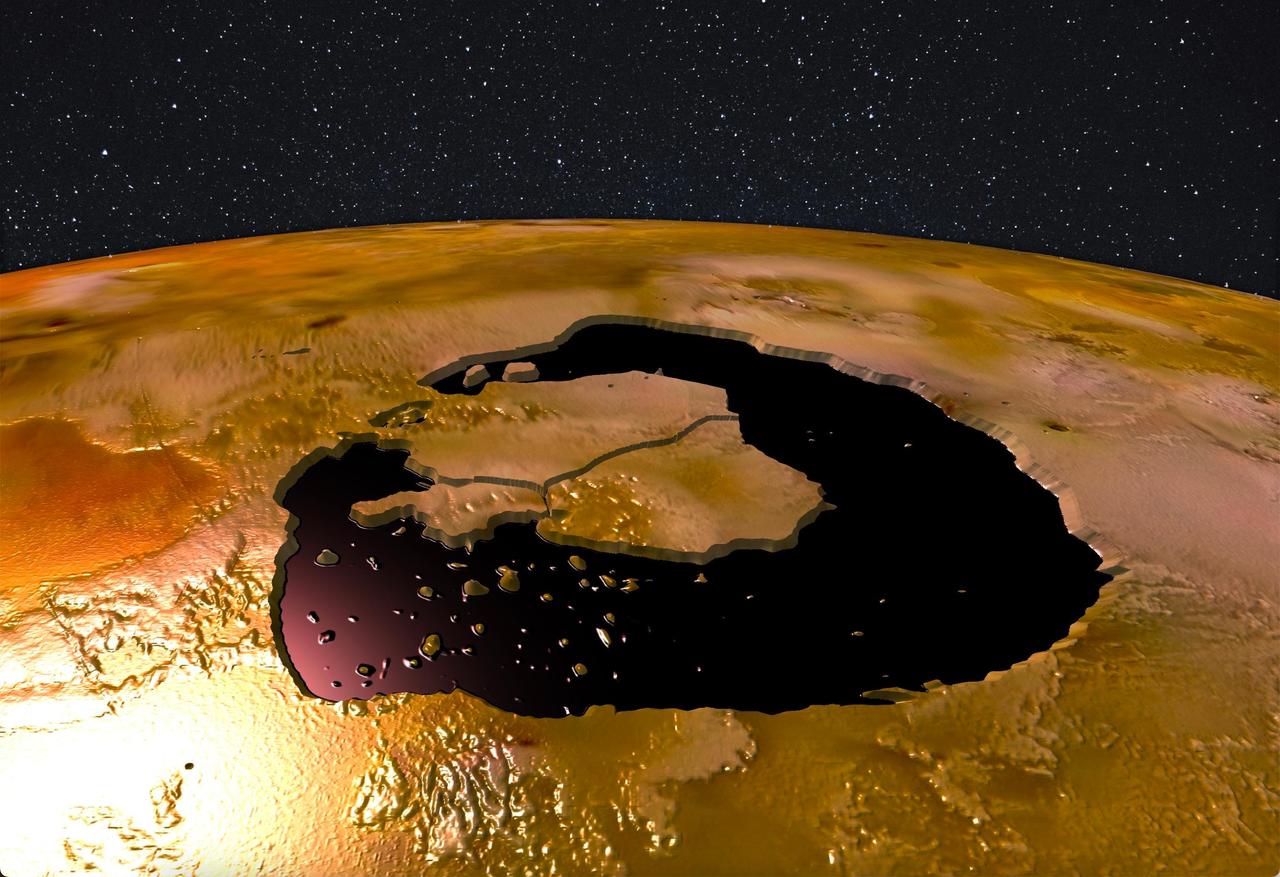
This computer-generated image is based on an infrared image of Jupiter's north polar region that was acquired on February 2, 2017, by the Jovian Infrared Auroral Mapper (JIRAM) instrument aboard Juno during the spacecraft's fourth pass over Jupiter. The image shows the structure of the cyclonic pattern observed over Jupiter's North pole: a central cyclone surrounded by eight circumpolar cyclones with diameters ranging from 2,500 to 2,900 miles (4,000 to 4,600 kilometers) across. JIRAM is able to collect images in the infrared wavelengths around 5 micrometers (µm) by measuring the intensity of the heat coming out of the planet. The heat from a planet that is radiated into space is called the radiance. This image is an enhancement of the original JIRAM image. In order to give the picture a 3-D shape, the enhancement starts from the idea that where the radiance has its highest value, there are no clouds and JIRAM can see deeper into the atmosphere. Consequently, all the other areas of the image are originally shaded more or less by clouds of different thickness. Then, to create these pictures, the originals have been inverted to give the thicker clouds the whitish color and the third dimension as the clouds we normally see here in the Earth's atmosphere. https://photojournal.jpl.nasa.gov/catalog/PIA22336

This annotated image highlights the location of the new heat source in the southern hemisphere of the Jupiter moon Io. The image was generated from data collected on Dec. 16, 2017, by the Jovian Infrared Auroral Mapper (JIRAM) instrument aboard NASA's Juno mission when the spacecraft was about 290,000 miles (470,000 kilometers) from the Jovian moon. In this infrared image, the brighter the color the higher the temperature recorded by JIRAM. An animation is available at https://photojournal.jpl.nasa.gov/catalog/PIA22600
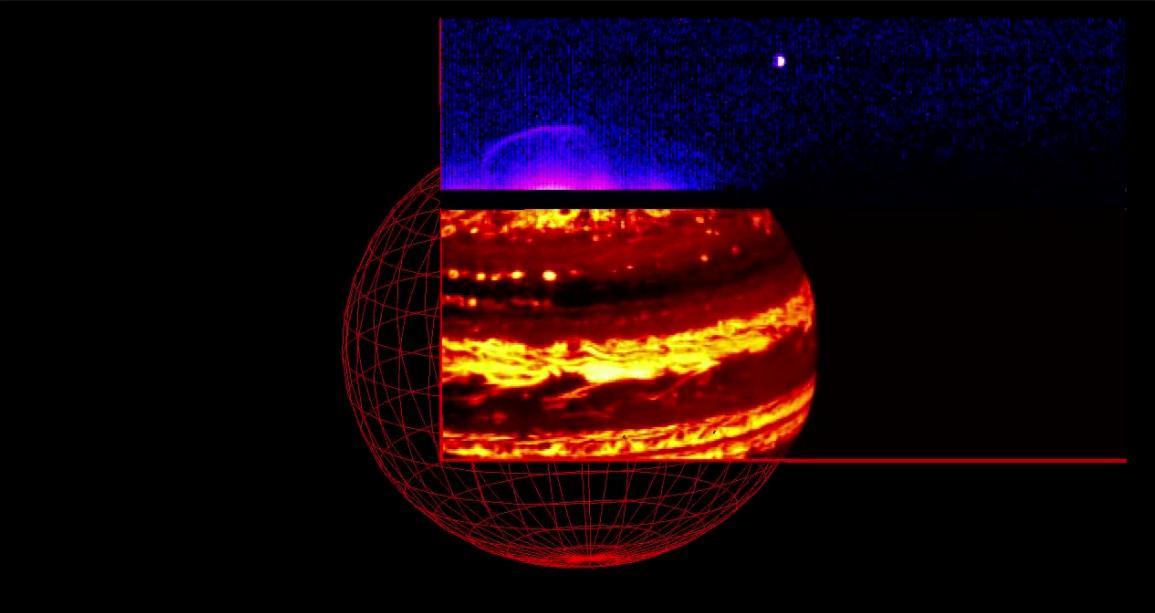
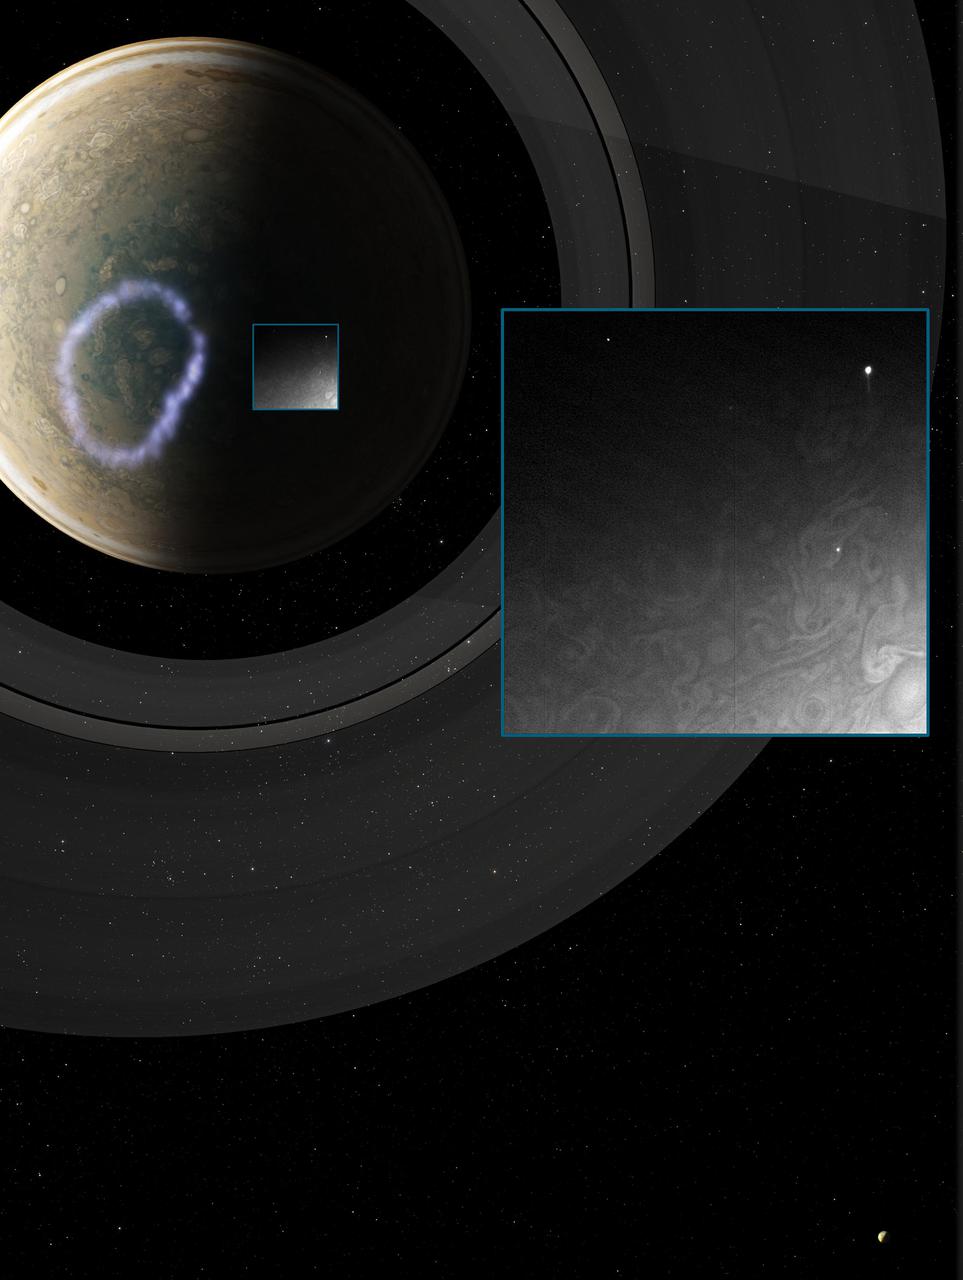
As NASA's Juno spacecraft approached Jupiter on Aug. 27, 2016, the Jovian Infrared Auroral Mapper (JIRAM) instrument captured the planet's glow in infrared light. The video is composed of 580 images collected over a period of about nine hours while Jupiter completed nearly a full rotation on its axis. The video shows the two parts composing the JIRAM imager: the lower one, in a red color scale, is used for mapping the planet's thermal emission at wavelengths around 4.8 microns; the upper one, in a blue color scale, is used to map the auroras at wavelengths around 3.45 microns. In this case the exposure time of the imager was optimized to observe the planet's thermal emission. However, it is possible to see a faint aurora and Jupiter's moon Io approaching the planet. The Great Red Spot is also visible just south of the planet's equator. A movie is available at http://photojournal.jpl.nasa.gov/catalog/PIA21036
The JIRAM (Jovian Infrared Auroral Mapper) instrument aboard NASA's Juno spacecraft captured this view of the south polar region of Jupiter's volcanic moon Io during a flyby on Dec. 27, 2024. JIRAM "sees" infrared light not visible to the human eye. This animation shows actual data from JIRAM, with minimal processing. The bright spots indicate locations with higher temperatures caused by volcanic activity, including an area with such a strong signal that it saturated the sensor. The gray areas resulted when Io left JIRAM's field of view during the observation. Animation available at https://photojournal.jpl.nasa.gov/catalog/PIA26594
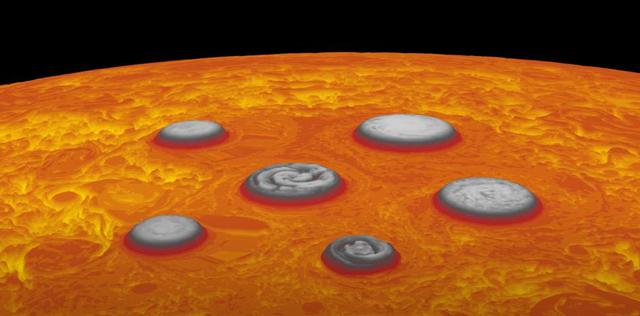
This computer-generated image shows the structure of the cyclonic pattern observed over Jupiter's south pole. Like in the North, Jupiter's south pole also contains a central cyclone, but it is surrounded by five cyclones with diameters ranging from 3,500 to 4,300 miles (5,600 to 7,000 kilometers) in diameter. Almost all the polar cyclones (at both poles), are so densely packed that their spiral arms come in contact with adjacent cyclones. However, as tightly spaced as the cyclones are, they have remained distinct, with individual morphologies over the seven months of observations detailed in the paper. The data used in generating this image was collected by the Jovian Infrared Auroral Mapper (JIRAM) instrument aboard the Juno spacecraft during the fourth Juno pass over Jupiter on Feb. 2, 2017. JIRAM is able to collect images in the infrared wavelengths around 5 micrometers (µm) by measuring the intensity of the heat coming out of the planet. The heat from the planet is radiated to space and it is called radiance. This image is an enhancement of the original JIRAM image. In order to give the picture a 3-D shape, the enhancement starts from the idea that the radiance has its highest value where there are no clouds and JIRAM can see deeper into the atmosphere. Consequently, all the other areas of the image are originally shaded more or less by clouds of different thickness. Then, to create these pictures, the originals have been inverted to give the thicker clouds the whitish color and the third dimension that we see with normal clouds here in the Earth's atmosphere. https://photojournal.jpl.nasa.gov/catalog/PIA22337
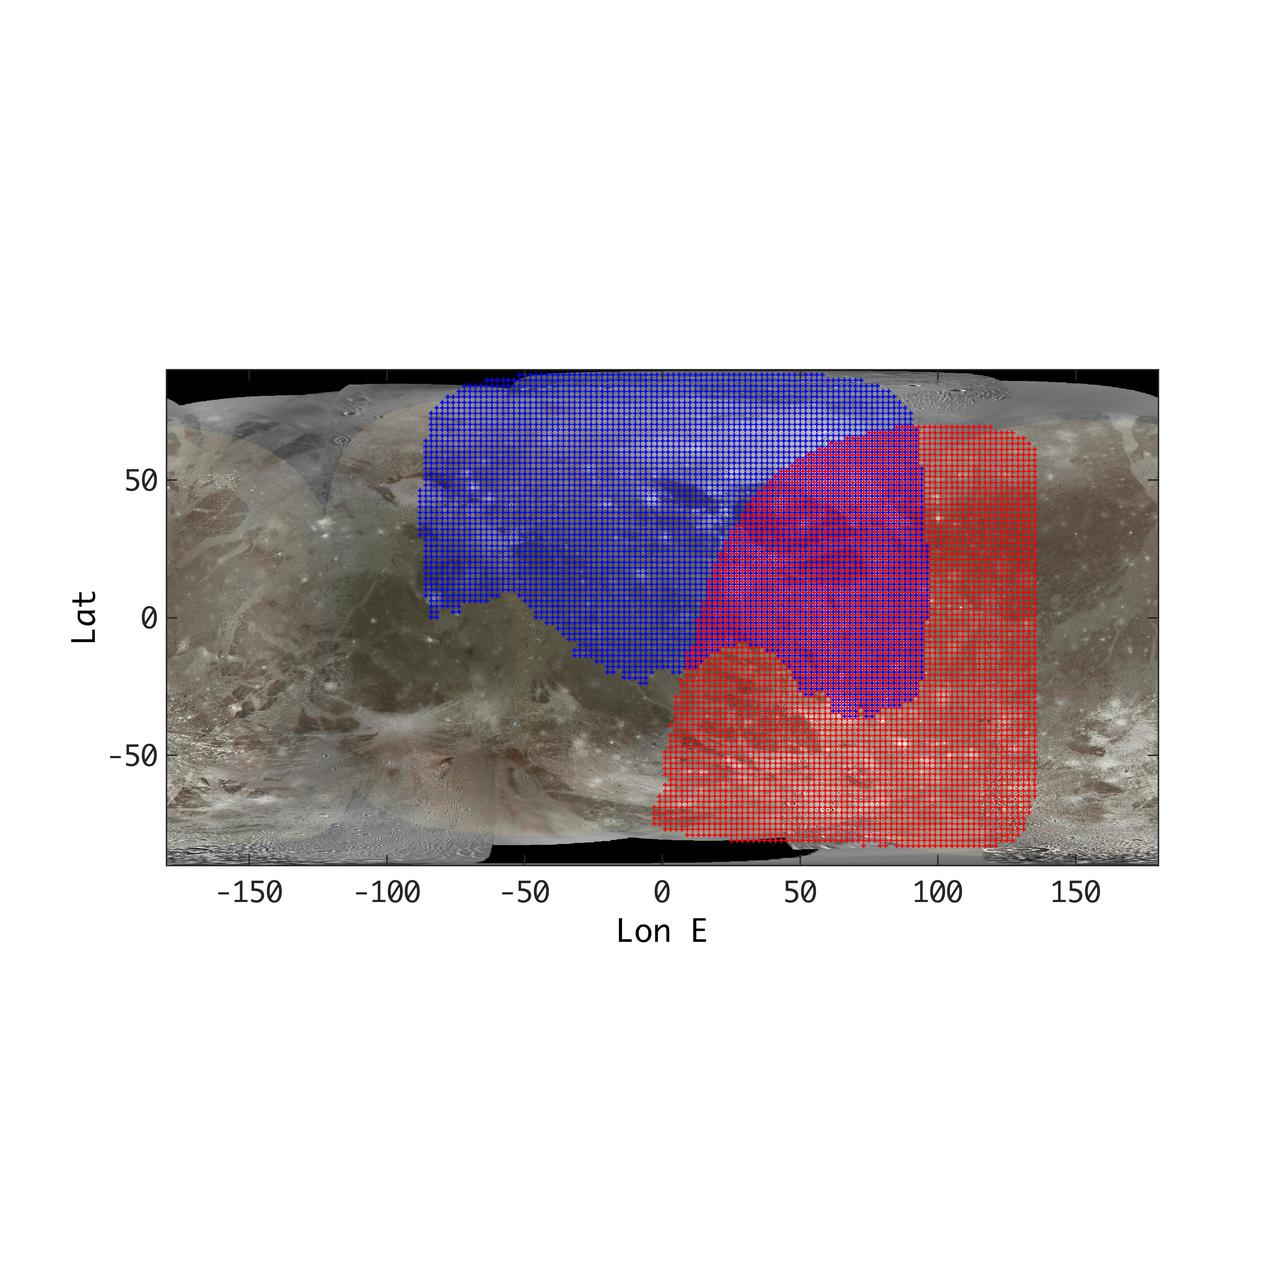
This annotated map of depicts the areas on the surface of Jupiter's moon Ganymede that were imaged by the Jovian Infrared Auroral Mapper (JIRAM) instrument aboard NASA's Juno spacecraft during two close approaches of the moon. The region shaded in blue depicts the area JIRAM covered as Juno flew past at a distance of 62,000 miles (100,000 kilometers) on Dec. 26, 2019. The infrared camera took 40 images during the encounter. The region shaded in red illustrates JIRAM coverage during the July 20, 2021, flyby, when Juno came within 31,000 miles (50,000 kilometers) of Ganymede's surface and JIRAM took 14 infrared images. The different observational geometry of the flybys provided an opportunity to see the north polar region for the first time as well as compare the diversity in composition between Ganymede's low and high latitudes. JIRAM "sees" in infrared light not visible to the human eye, providing information on Ganymede's icy shell and the composition of the ocean of liquid water beneath. It was designed to capture the infrared light emerging from deep inside Jupiter, probing the weather layer down to 30 to 45 miles (50 to 70 kilometers) below Jupiter's cloud tops. https://photojournal.jpl.nasa.gov/catalog/PIA24792
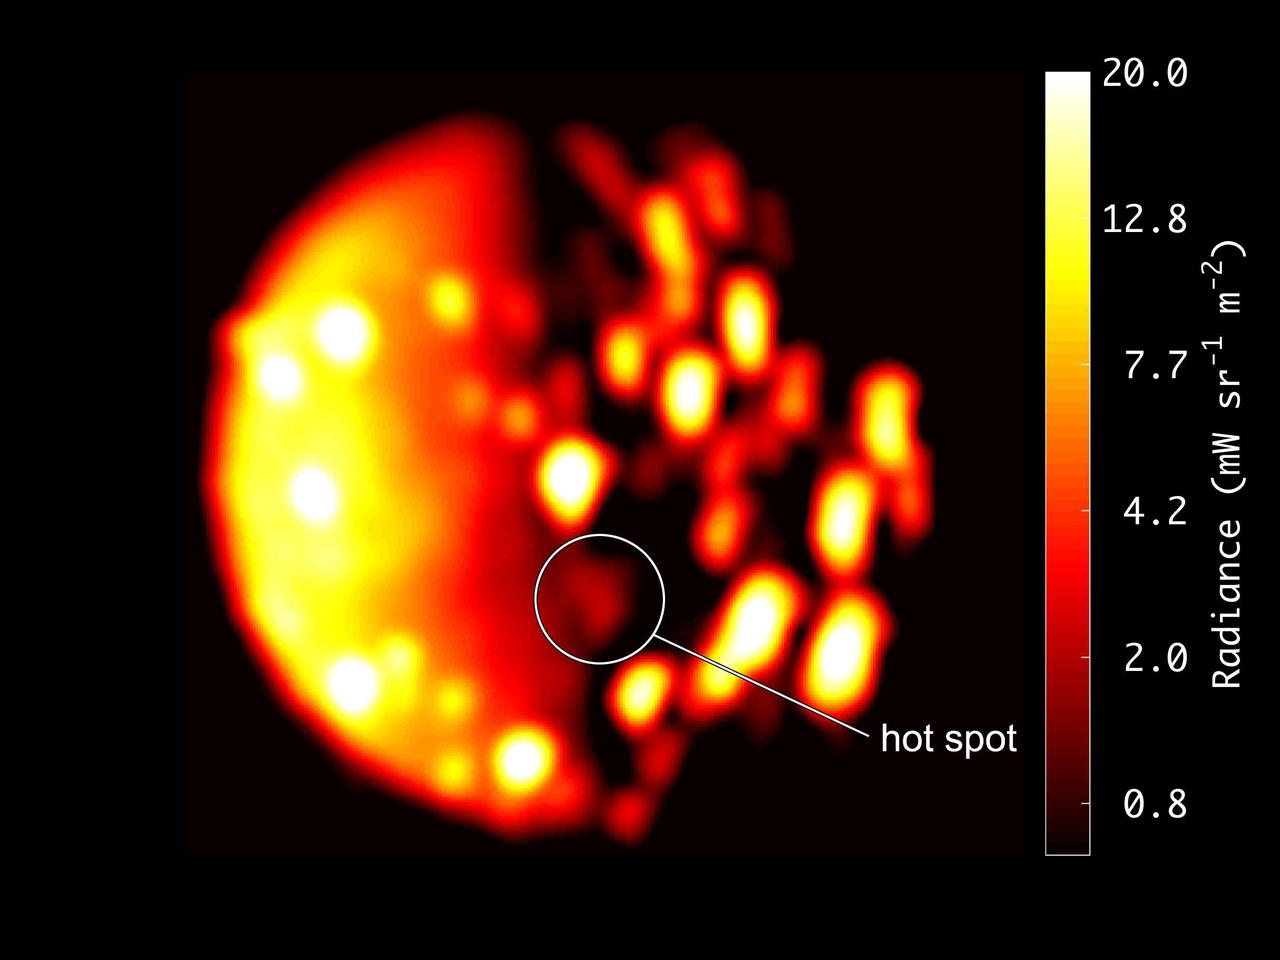
This annotated image highlights the location of the new heat source close to the south pole of Io. The image was generated from data collected on Dec. 16, 2017, by the Jovian Infrared Auroral Mapper (JIRAM) instrument aboard NASA's Juno mission when the spacecraft was about 290,000 miles (470,000 kilometers) from the Jovian moon. The scale to the right of image depicts of the range of temperatures displayed in the infrared image. Higher recorded temperatures are characterized in brighter colors -- lower temperatures in darker colors. An animation is available at https://photojournal.jpl.nasa.gov/catalog/PIA22601
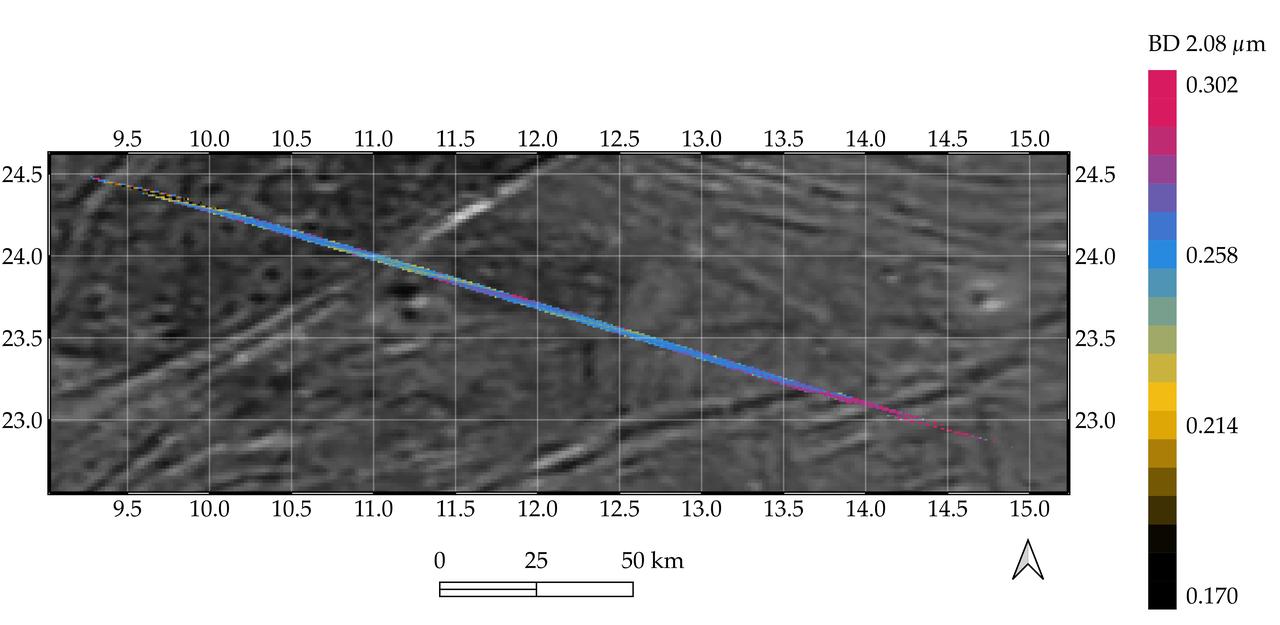
Processed data from the Jovian InfraRed Auroral Mapper (JIRAM) spectrometer aboard NASA's Juno mission is superimposed on a mosaic of optical images from the agency's Galileo and Voyager spacecraft that shows grooved terrain on Jupiter's moon Ganymede. This composite image covers a portion of Phrygia Suclus, northeast of Nanshe Catena, on Ganymede. The data was taken by Juno during its June 7, 2021, flyby of the icy moon. The JIRAM data is represented by the colored line running from the upper left to lower right in the graphic. The line depicts an increase in intensity of the spectral signature of a non-ice compound, possibly ammonium chloride, in the groove at the lower right of the image. JIRAM "sees" infrared light not visible to the human eye. It measures heat radiated from the planet at an infrared wavelengths. https://photojournal.jpl.nasa.gov/catalog/PIA26075
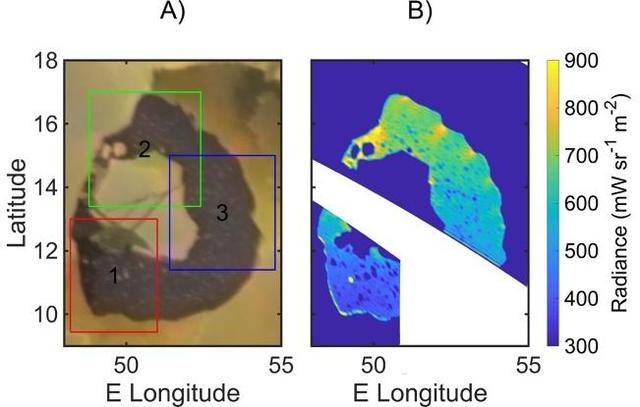
A map of infrared radiance in Loki Patera on Jupiter's moon Io, as measured by the Jovian Infrared Auroral Mapper (JIRAM) instrument aboard NASA's Juno spacecraft, right, and by NASA's Voyager 1, left. https://photojournal.jpl.nasa.gov/catalog/PIA26525

In this annotated infrared image, the five cyclones surrounding a sixth directly over Jupiter's south pole form a pentagonal pattern. The image was taken on Feb. 2, 2017, by the Jovian Infrared Auroral Mapper (JIRAM) instrument aboard NASA's Juno spacecraft. The JIRAM instrument measures heat radiated from the planet at an infrared wavelength of around 5 microns. https://photojournal.jpl.nasa.gov/catalog/PIA23557

To give some sense of the immense scale of cyclones arranged in a hexagonal pattern at Jupiter's south pole, an outline of the continental United States is superimposed over the central cyclone and an outline of Texas is superimposed over the newest cyclone. The hexagonal arrangement of the cyclones is large enough to dwarf the Earth. The JIRAM image was obtained during the 23rd science pass of the Juno spacecraft over Jupiter, on November 4, 2019. The JIRAM instrument measures heat radiated from the planet at an infrared wavelength of around 5 microns. https://photojournal.jpl.nasa.gov/catalog/PIA23560
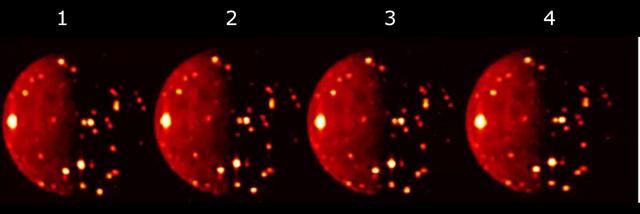
Data used to generate this composite image of volcanic activity on the Jovian moon Io was obtained by the JIRAM (Jovian Infrared Auroral Mapper) instrument aboard NASA's Juno spacecraft during a flyby of the moon on Oct. 16, 2021. JIRAM took the four images over a short time interval to observe volcanic activity on the moon from different view angles. JIRAM data collected over time could provide information on changes to Io's surface, including the number of active volcanoes or variations in their intensity. JIRAM "sees" infrared light not visible to the human eye. In this composite image, the measurements of thermal emission radiated from the planet were in the infrared wavelength of around 5 microns. https://photojournal.jpl.nasa.gov/catalog/PIA25886
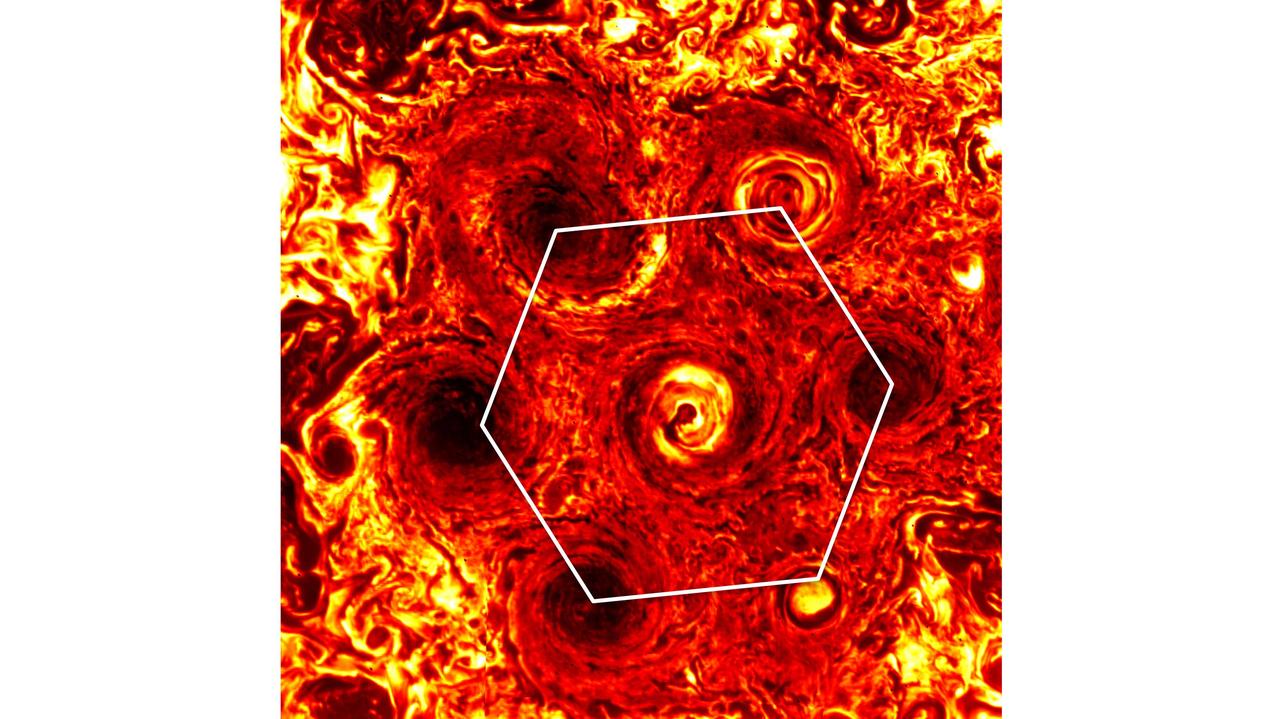
In this annotated infrared image, six cyclones form a hexagonal pattern around a central cyclone at Jupiter's south pole. The image was generated from data collected on Nov. 4, 2019, by the Jovian Infrared Auroral Mapper (JIRAM) instrument aboard NASA's Juno mission during its 23rd science pass of the planet. The JIRAM instrument measures heat radiated from the planet at an infrared wavelength of around 5 microns. https://photojournal.jpl.nasa.gov/catalog/PIA23559
NASA's Juno mission captured this infrared view of Jupiter's volcanic moon Io on July 5, 2022, when the spacecraft was about 50,000 miles (80,000 kilometers) away. This infrared image was derived from data collected by the Jovian Infrared Auroral Mapper (JIRAM) instrument aboard Juno. In this image, the brighter the color the higher the temperature recorded by JIRAM. https://photojournal.jpl.nasa.gov/catalog/PIA25698
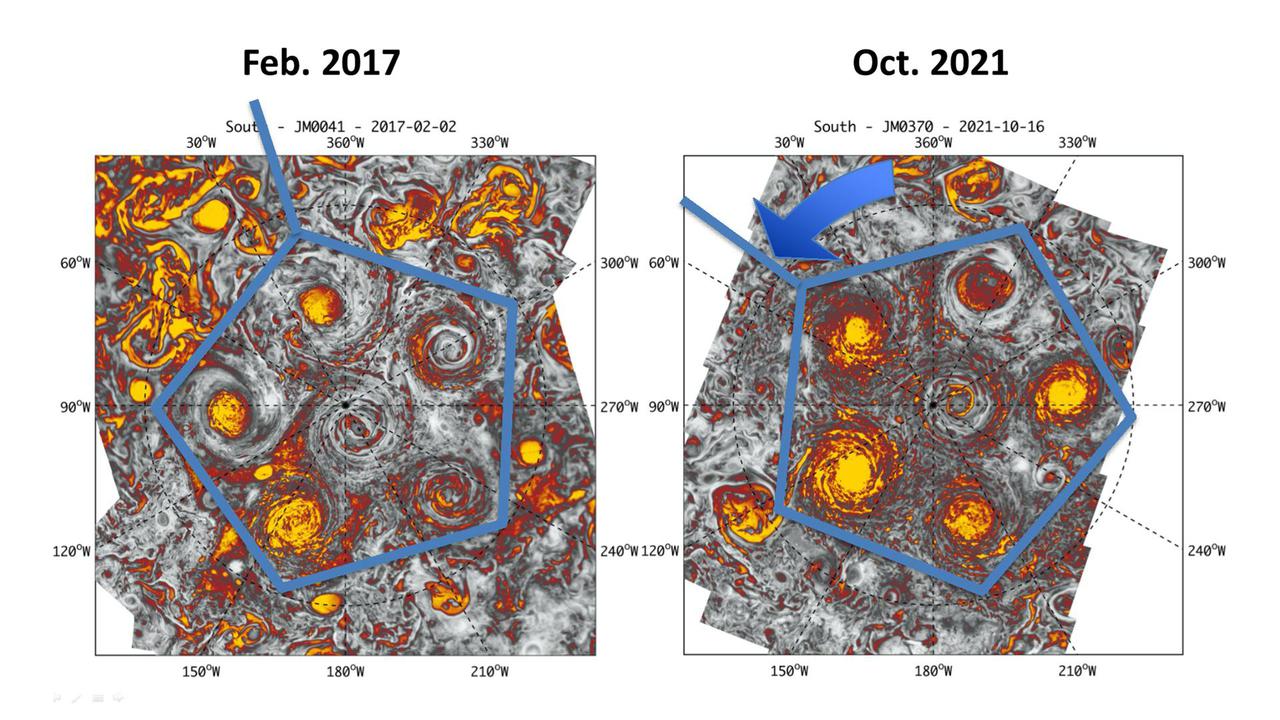
This annotated composite image depicts the movement of the polar and circumpolar cyclones of Jupiter's south pole between 2016 (left) and 2021 (right) as seen by the Jovian Infrared Auroral Mapper (JIRAM) instrument aboard NASA's Juno spacecraft. In both images, five cyclones are arranged as a pentagon, with a sixth cyclone in the center (south pole). JIRAM "sees" in infrared light not visible to the human eye. It was designed to capture the infrared light emerging from deep inside Jupiter, probing the weather layer down to 30 to 45 miles (50 to 70 kilometers) below Jupiter's cloud tops. https://photojournal.jpl.nasa.gov/catalog/PIA24967

A massive hot spot near the south pole of Io can be seen near the center of this annotated image taken by the JIRAM infrared imager aboard NASA's Juno on Dec. 27, 2024, during the spacecraft's flyby of the Jovian moon. The hot spot is larger than Earth's Lake Superior. At the time of closest approach during the flyby, Juno came within about 46,200 miles (74,400 kilometers) of the moon. JIRAM, short for Jovian Infrared Auroral Mapper, was contributed to the Juno mission by the Italian Space Agency. https://photojournal.jpl.nasa.gov/catalog/PIA26527
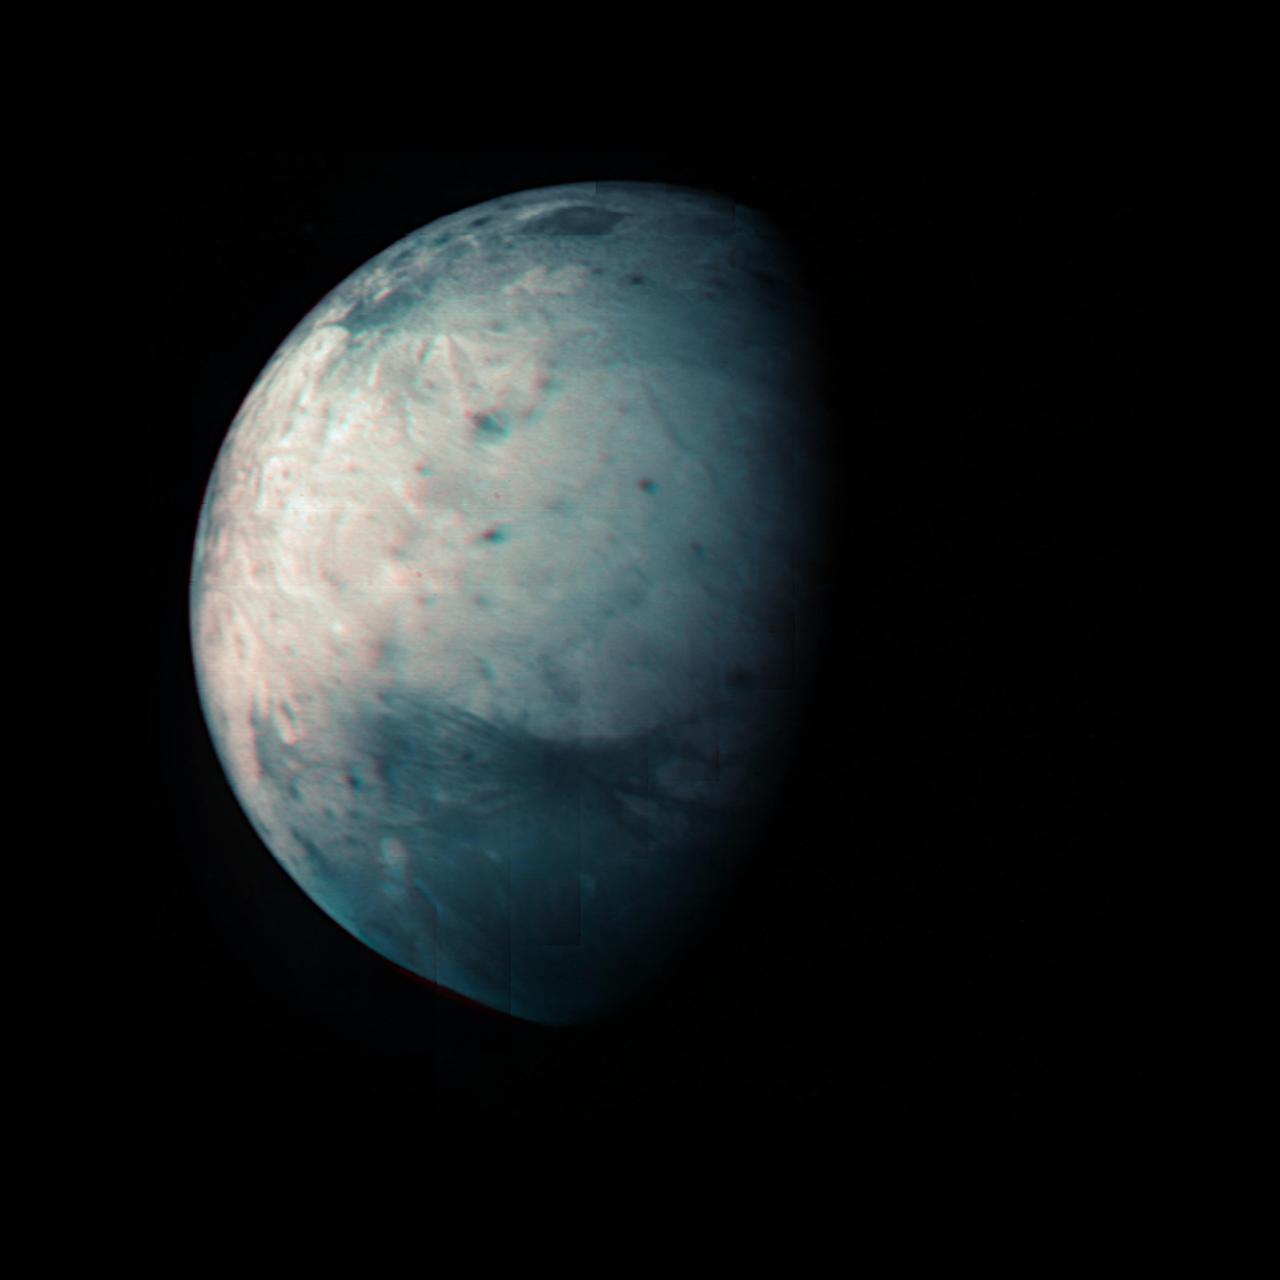
This infrared view of Ganymede was obtained by the Jovian Infrared Auroral Mapper (JIRAM) instrument aboard NASA's Juno spacecraft during its July 20th, 2021, flyby. JIRAM "sees" in infrared light not visible to the human eye, providing information on Ganymede's icy shell and the composition of the ocean of liquid water beneath. It was designed to capture the infrared light emerging from deep inside Jupiter, probing the weather layer down to 30 to 45 miles (50 to 70 kilometers) below Jupiter's cloud tops. During the flyby, Juno came within 31,136 miles (50,109 kilometers) of the icy orb. Together with the previous observational geometries provided, this data gives the opportunity for JIRAM to see different regions for the first time, as well as to compare the diversity in composition between the low and high latitudes. Because Ganymede has no atmosphere to impede the solar wind, or progress of charged particles from the Sun, the surface at its poles is constantly being bombarded by plasma from Jupiter's gigantic magnetosphere. The bombardment has a dramatic effect on Ganymede's ice: Ice is crystallized by heating at the equator and amorphized by particle radiation at the polar regions. https://photojournal.jpl.nasa.gov/catalog/PIA24791
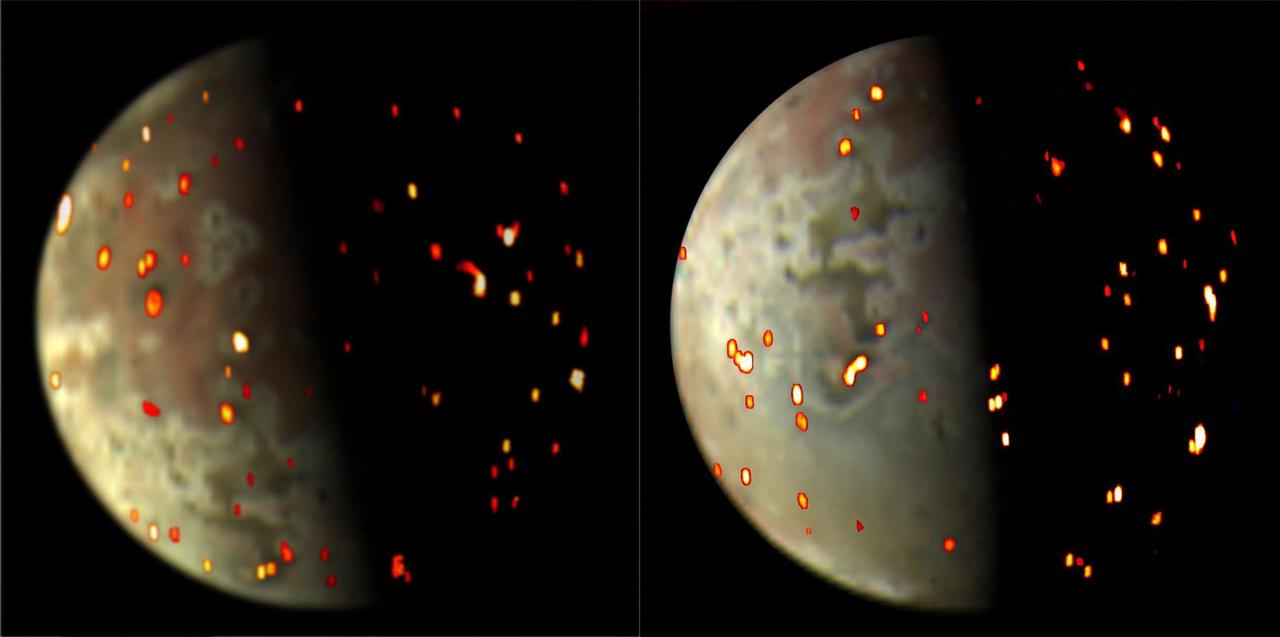
These composite views depicting volcanic activity on Io were generated using both visible light and infrared data collected by NASA's Juno spacecraft during flybys of the Jovian moon on Dec. 14, 2022 (left) and March 1, 2023. In both views, the view of the moon (in mottled grays and browns) is provided by the JunoCam imager. The overlays of reds, yellows and bright whites is data from spacecraft's JIRAM (Jovian Infrared Auroral Mapper) instrument. The JIRAM data on the left was collected from an altitude of about 50,000 miles (80,000 kilometers), with a spatial resolution of around 12 miles (20 kilometers) per pixel. The JIRAM data annotated into the right JunoCam image was acquired at an altitude of about 36,000 miles (58,000 kilometers) and has a spatial resolution of 9 miles (15 kilometers) per pixel. JIRAM "sees" infrared light not visible to the human eye. It measures heat radiated from the planet at an infrared wavelength of around 5 microns. Annotated views like these can help the Juno science team better understand location and variations in the active volcanoes on the moon's surface. https://photojournal.jpl.nasa.gov/catalog/PIA25888
In this animation, forces created by movement toward the south pole of a circumpolar cyclone (farthest right) results in the temporary shift in location by the polar cyclone – the central cyclone directly over the pole – and the four other circumpolar cyclones. Data used to generate this animation was acquired by the Jovian Infrared Auroral Mapper (JIRAM) instrument aboard NASA's Juno spacecraft. JIRAM "sees" in infrared light not visible to the human eye. It was designed to capture the infrared light emerging from deep inside Jupiter, probing the weather layer down to 30 to 45 miles (50 to 70 kilometers) below Jupiter's cloud tops. Movie available at https://photojournal.jpl.nasa.gov/catalog/PIA24969
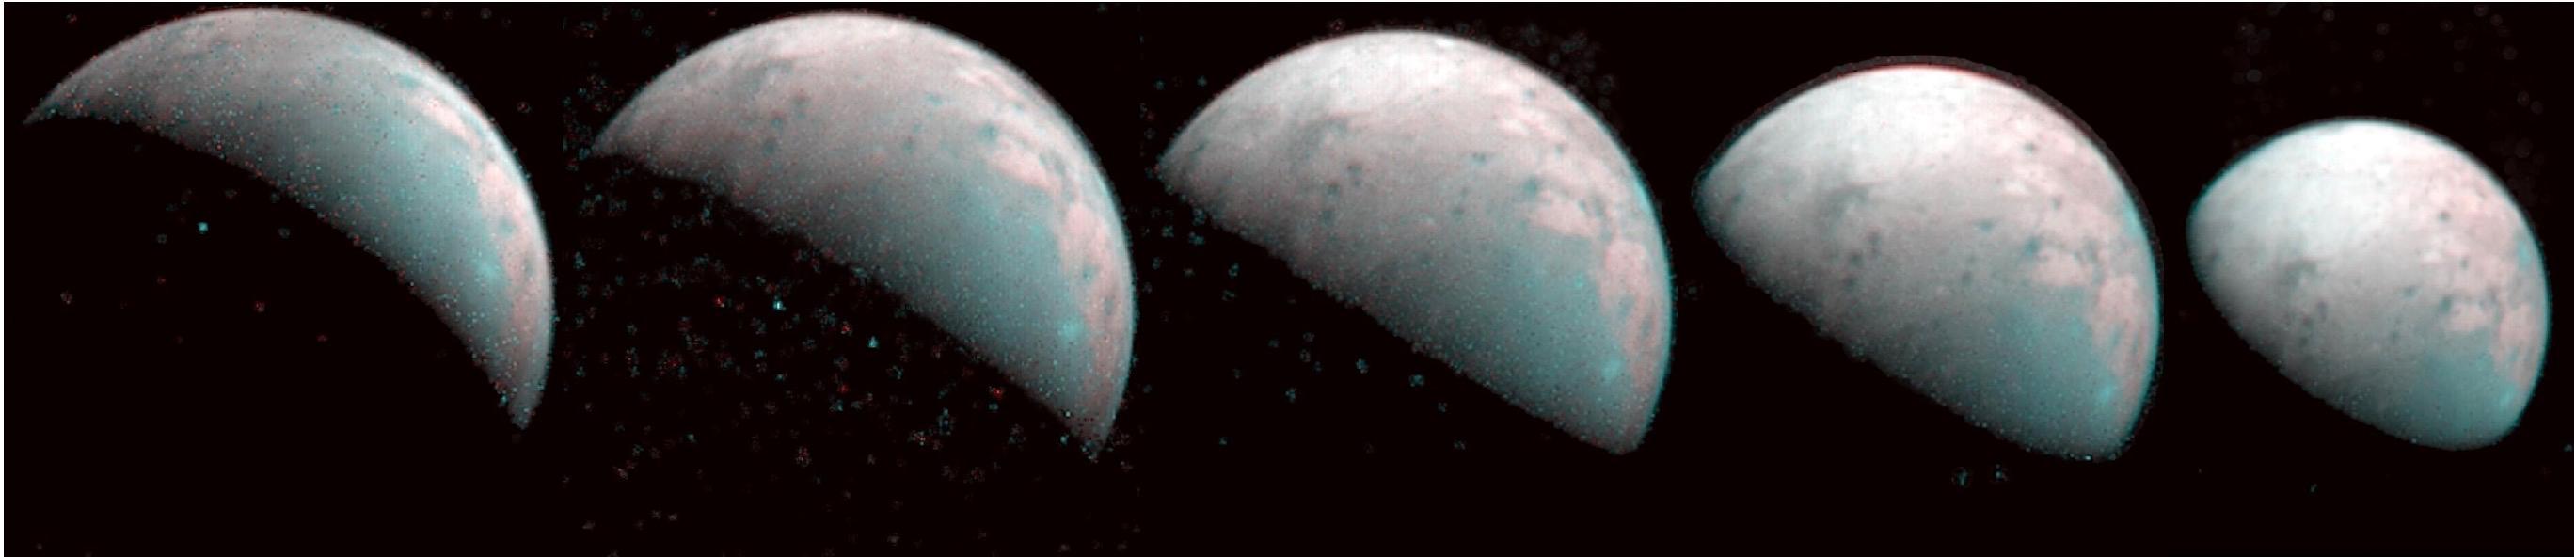
The north pole of Jupiter's giant moon Ganymede can be seen in this composite image of infrared data from the Jovian Infrared Auroral Mapper (JIRAM) instrument aboard NASA's Juno spacecraft. Five infrared images were taken every 20 minutes, beginning at time of closest approach (far left) on Dec. 26, 2019, when Juno was about 62,000 miles (100,000 kilometers) distant. The infrared imagery provides the first infrared mapping of the massive moon's northern frontier. As Ganymede has no atmosphere to impede the progress of charged particles from the Sun, the surface at its poles is constantly being bombarded by plasma from Jupiter's gigantic magnetosphere. The bombardment has a dramatic effect on Ganymede's ice. Frozen water molecules detected at both poles have no appreciable order to their arrangement, and the amorphous ice has a different infrared signature than the crystalline ice found at Ganymede's equator. JIRAM was designed to capture the infrared light emerging from deep inside Jupiter, probing the weather layer down to 30 to 45 miles (50 to 70 kilometers) below Jupiter's cloud tops. https://photojournal.jpl.nasa.gov/catalog/PIA23988
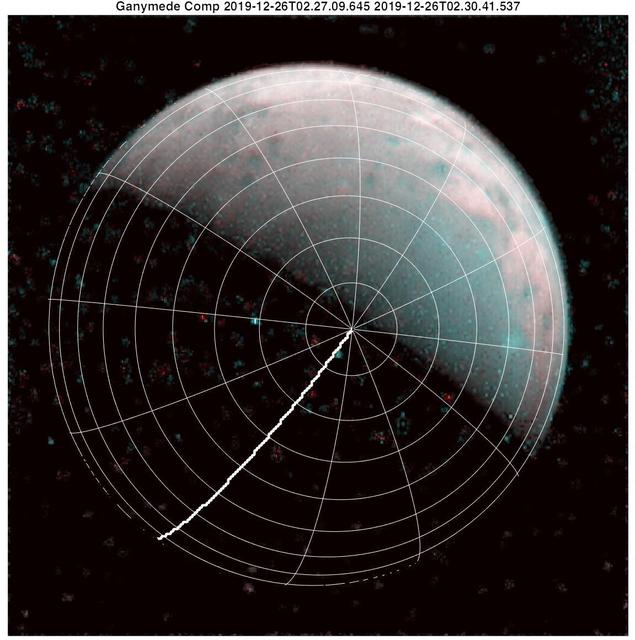
The north pole of Ganymede can be seen in center of this annotated image taken by the JIRAM infrared imager aboard NASA's Juno spacecraft on Dec. 26, 2019. Longitudinal lines appear every 30-degrees. The thick line is 0-degrees longitude. At the time the data for this image was captured, Juno was flying in the proximity of the north pole of the Jovian moon. https://photojournal.jpl.nasa.gov/catalog/PIA23987
Lava islands within Loki Patera on Jupiter's moon Io are depicted in an artist's concept that's based on data from the Jovian Infrared Auroral Mapper (JIRAM) instrument about NASA's Juno spacecraft. https://photojournal.jpl.nasa.gov/catalog/PIA26485
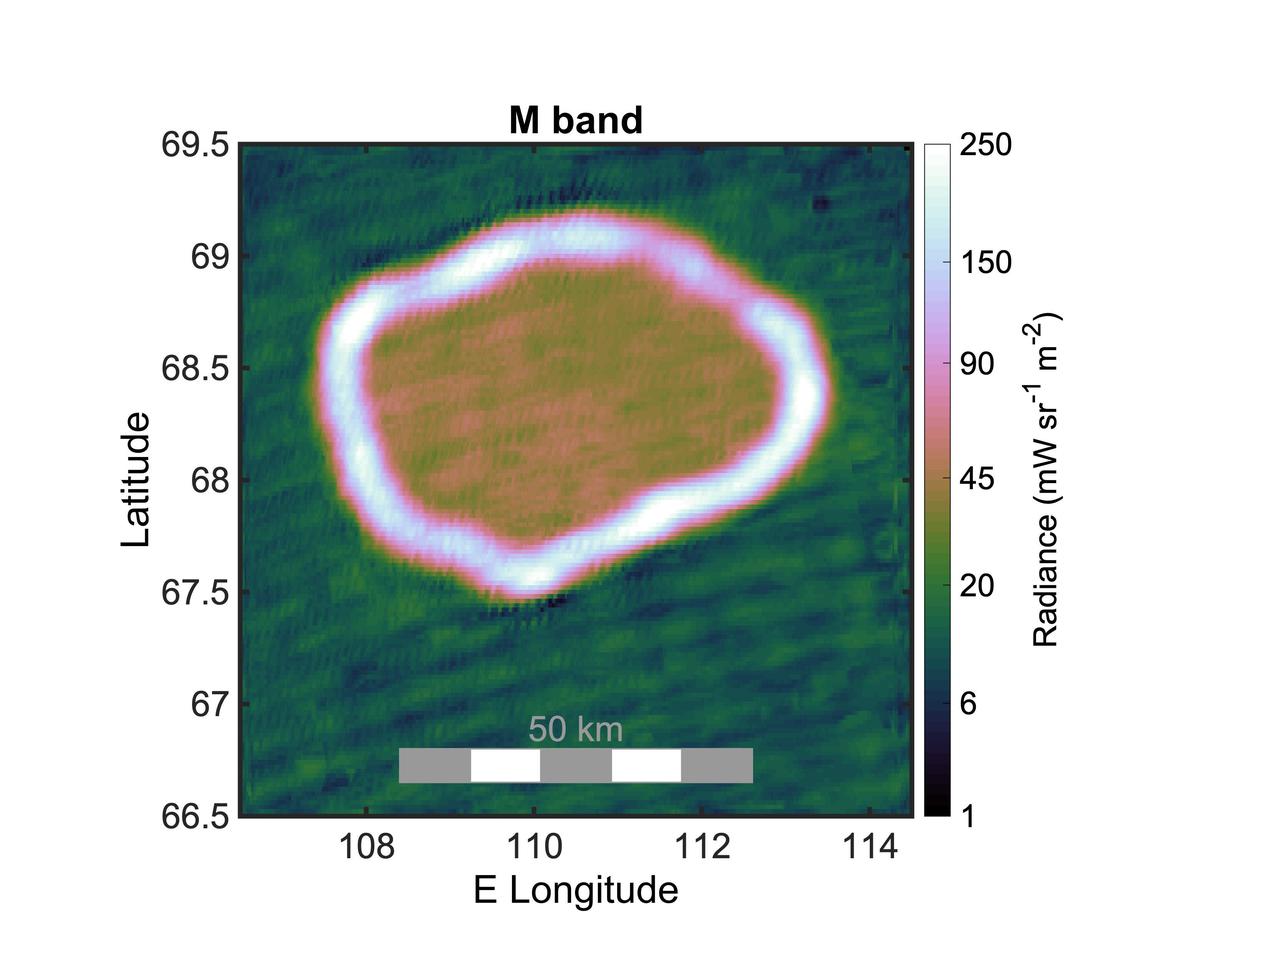
This graphic shows the infrared radiance of Chors Patera, a lava lake on Jupiter's moon Io. It was created using infrared data collected by the JIRAM (Jovian Infrared Auroral Mapper) instrument aboard NASA's Juno spacecraft during a flyby of the moon on Oct. 15, 2023. The lake is about 31 miles (50 kilometers) wide. Juno scientists believe the majority of the lake is covered with a thick crust of molten material (appearing red/green in graphic, inside the white ring) that is approximately minus 45 degrees Fahrenheit (minus 43 degrees Celsius) at its surface. The white ring indicates where lava from Io's interior is directly exposed to space, providing the geologic feature's hottest thermal signature: between 450 and 1,350 F (232 and 732 C). The area in green, outside the lava lake, is very cold: about minus 225 F (minus 143 C). JIRAM "sees" infrared light not visible to the human eye. In this composite image, the measurements of thermal emissions radiated from the planet were in the infrared wavelength between 4.5 and 5 microns. https://photojournal.jpl.nasa.gov/catalog/PIA26371

A new, smaller cyclone can be seen at the lower right of this infrared image of Jupiter's south pole taken on Nov. 4, 2019, during the 23rd science pass of the planet by NASA's Juno spacecraft. The image was captured by Juno's Jovian Infrared Auroral Mapper (JIRAM) instrument, which instrument measures heat radiated from the planet at an infrared wavelength of around 5 microns. https://photojournal.jpl.nasa.gov/catalog/PIA23558
Six cyclones can be seen at Jupiter's south pole in this infrared image taken on Feb. 2, 2017, during the 3rd science pass of NASA's Juno spacecraft. Juno's Jovian Infrared Auroral Mapper (JIRAM) instrument measures heat radiated from the planet at an infrared wavelength of around 5 microns. https://photojournal.jpl.nasa.gov/catalog/PIA23556

This animation depicts the invisible forces at work at Jupiter's south pole that keep the five circumpolar cyclones there in position relative to each other and to the polar cyclone – the central cyclone directly over the pole. Blue arrows depict the forces that drive the cyclones southward, toward the polar cyclone. Green arrows depict the rejections force generated by the polar cyclone, preventing the circumpolar cyclones from occupying the pole position. Pink arrows demonstrate mutual forces the circumpolar cyclones project, causing them to remain an equal distance from one another, in a pentagonal configuration. Data used to generate this animation was acquired by the Jovian Infrared Auroral Mapper (JIRAM) instrument aboard NASA's Juno spacecraft. JIRAM "sees" in infrared light not visible to the human eye. It was designed to capture the infrared light emerging from deep inside Jupiter, probing the weather layer down to 30 to 45 miles (50 to 70 kilometers) below Jupiter's cloud tops. Movie available at https://photojournal.jpl.nasa.gov/catalog/PIA24968
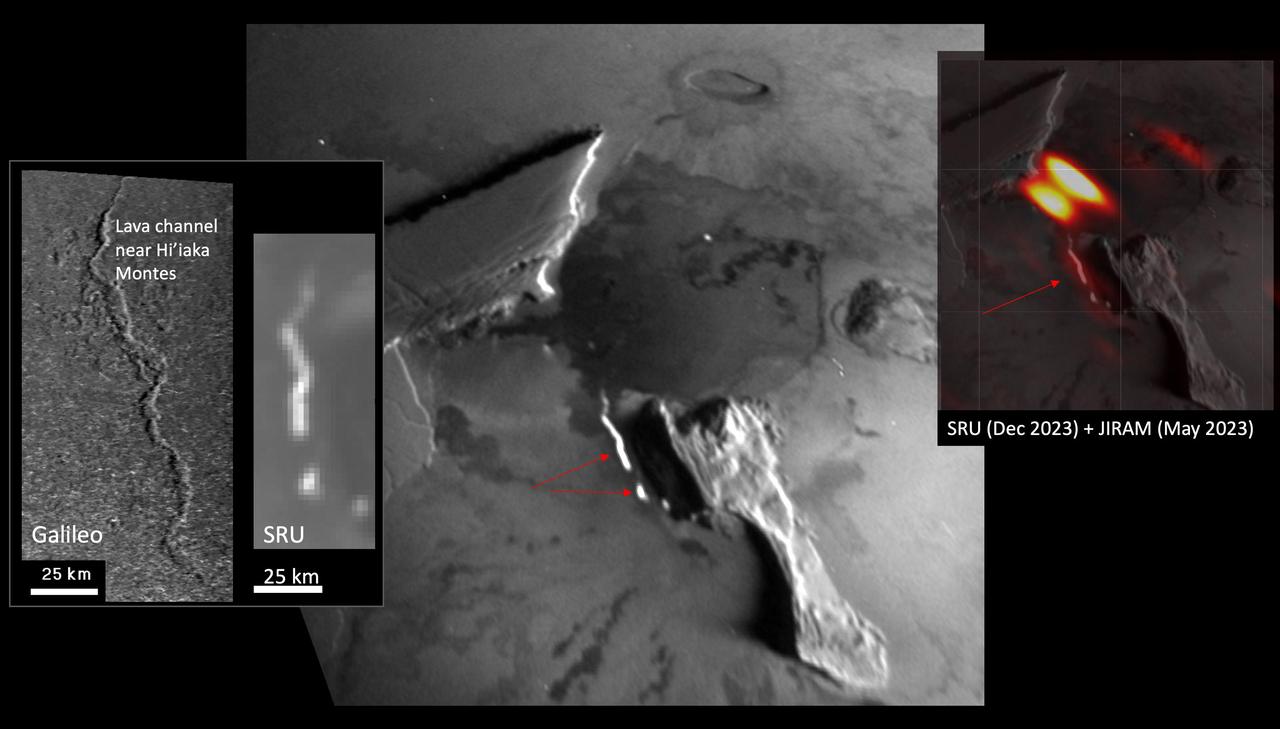
The Stellar Reference Unit (SRU) on NASA's Juno spacecraft made this first-of-a-kind observation on Dec. 30, 2023, of an elongated, 40-mile-long (65-kilometer-long), curvy thermal emission feature and a shorter linear emission segment to the west of South Zal Mons. The resolution is 0.6 miles (1 kilometer) per pixel. The feature is suspected to be an active lava channel, given the similarity of its morphology to that of the two previously identified lava channels on Io. The shape of the Ionian lava channel near Hi'iaka Montes is compared to the SRU emission feature in the left panel. Juno's infrared camera, JIRAM, observed a long thermal emission "hot spot" at lower resolution (19 miles, or 30 kilometers, per pixel) in May 2023 at the same location (JIRAM infrared data is overlaid on the SRU image in the right panel, illustrating the overlap). https://photojournal.jpl.nasa.gov/catalog/PIA26523
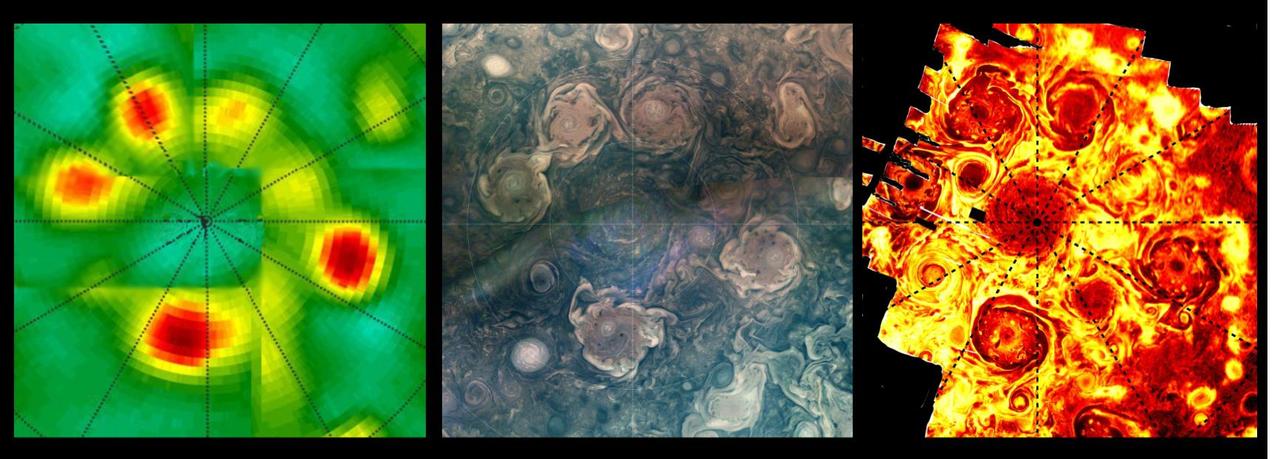
This composite shows views of Jupiter's northern polar cyclones in three different wavelengths of light – microwave, visible, and ultraviolet – as captured by NASA's Juno mission. These differing perspectives allowed Juno scientists to deduce that all Jovian polar cyclones are not created equal. The infrared image, on the far right, was derived from data collected by the spacecraft's Jovian Infrared Auroral Mapper (JIRAM) instrument. The composite image at center was collected by the JunoCam visible-light imager. Though taken with separate instruments that record different wavelengths of light, both images depict Jupiter's northern polar storms as well defined and of similar size. The data on the left, collected by Juno's Microwave Radiometer (MWR), shows the polar storms in another light. MWR enables Juno to see deep into Jupiter by recording the planet's microwave emissions. In the MWR graphic, the polar storms at the 4 and 6 o'clock positions have bright microwave signatures, indicating they extend well beneath the cloud tops, at least 62 miles (100 kilometers) below. The size of those two storms is comparable to what's found in the visible light and infrared light images, but the other storms, as seen through MWR, have a notably reduced emissions intensity. Another disparity in the MWR graphic versus visible light and infrared can be seen in how the central cyclone is depicted by the data. In the infrared and visible light images, the central cyclone is evident; with MWR data, it all but disappears. This disparity indicates that the central cyclone's subsurface structure must be very different from the surrounding storms. JIRAM "sees" in infrared light not visible to the human eye. It captures the infrared glow from the heat of Jupiter's upper atmosphere, probing the top of the weather layer, and gaps in the clouds allow glimpses as deep as 30 to 45 miles (50 to 70 kilometers) below Jupiter's cloud tops. JunoCam's visible light images catch reflected sunlight, with a view that is very similar to what a human eye would see if a person could ride along with Juno. JunoCam's raw images are available for the public to peruse and process into image products at https://missionjuno.swri.edu/junocam/processing. Like JIRAM, the MWR instrument records the glow of Jupiter's atmosphere, but the brightness results from the temperature at depths below anything achievable with previous spacecraft or Earth-based observations. The MWR's six radio channels peer progressively deeper below the visible cloud tops, with a range from the top of the clouds (for the highest frequency channel) to 200 miles (320 kilometers) or more below (for the lowest frequency channel). https://photojournal.jpl.nasa.gov/catalog/PIA26295
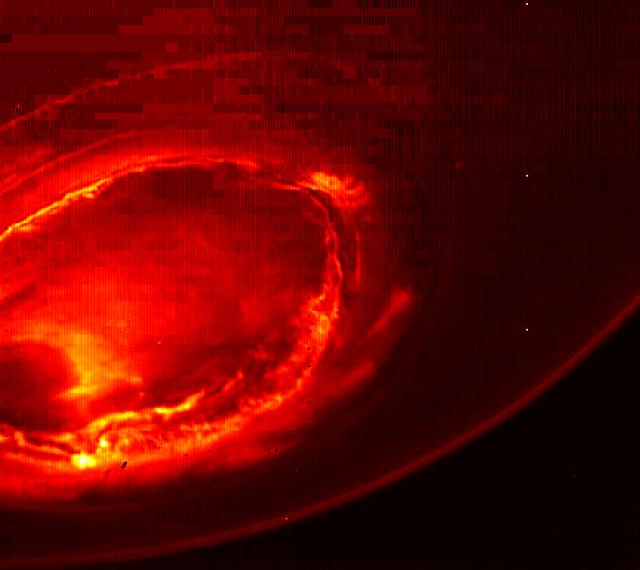
This infrared image gives an unprecedented view of the southern aurora of Jupiter, as captured by NASA's Juno spacecraft on August 27, 2016. The planet's southern aurora can hardly be seen from Earth due to our home planet's position in respect to Jupiter's south pole. Juno's unique polar orbit provides the first opportunity to observe this region of the gas-giant planet in detail. Juno's Jovian Infrared Auroral Mapper (JIRAM) camera acquired the view at wavelengths ranging from 3.3 to 3.6 microns -- the wavelengths of light emitted by excited hydrogen ions in the polar regions. The view is a mosaic of three images taken just minutes apart from each other, about four hours after the perijove pass while the spacecraft was moving away from Jupiter. http://photojournal.jpl.nasa.gov/catalog/PIA21033
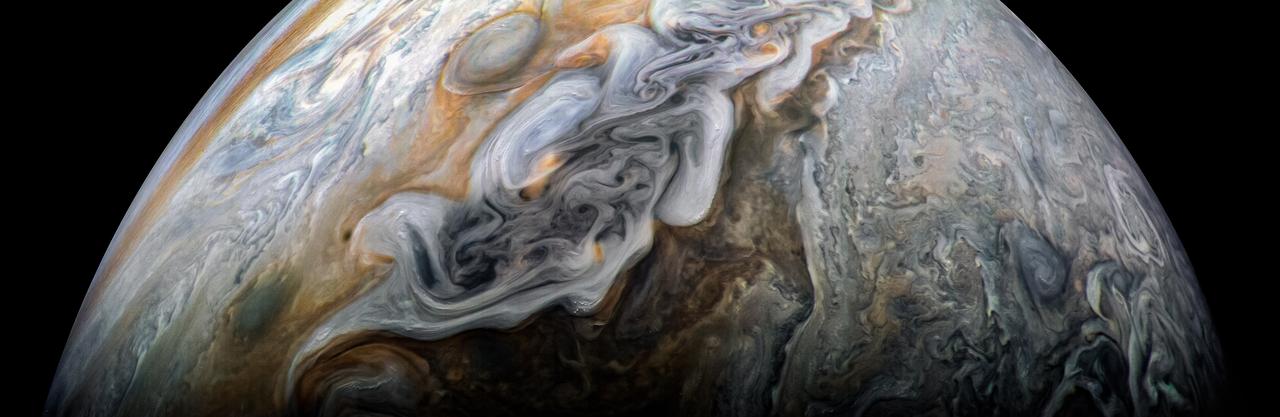
This image captures the intensity of the jets and vortices in Jupiter's North North Temperate Belt. NASA's Juno spacecraft took this color-enhanced image at 10:31 p.m. PDT on May 23, 2018 (1:31 a.m. EDT on May 24), as Juno performed its 13th close flyby of Jupiter. At the time, the spacecraft was about 4,900 miles (7,900 kilometers) from the tops of the clouds of the gas giant planet at a northern latitude of about 41 degrees. The view is oriented with south on Jupiter toward upper left and north toward lower right. The North North Temperate Belt is the prominent reddish-orange band left of center. It rotates in the same direction as the planet and is predominantly cyclonic, which in the northern hemisphere means its features spin in a counter-clockwise direction. Within the belt are two gray-colored anticyclones. To the left of the belt is a brighter band (the North North Temperate Zone) with high clouds whose vertical relief is accentuated by the low angle of sunlight near the terminator. These clouds are likely made of ammonia-ice crystals, or possibly a combination of ammonia ice and water. Although the region as a whole appears chaotic, there is an alternating pattern of rotating, lighter-colored features on the zone's north and south sides. Scientists think the large-scale dark regions are places where the clouds are deeper, based on infrared observations made at the same time by Juno's JIRAM experiment and Earth-based supporting observations. Those observations show warmer, and thus deeper, thermal emission from these regions. To the right of the bright zone, and farther north on the planet, Jupiter's striking banded structure becomes less evident and a region of individual cyclones can be seen, interspersed with smaller, darker anticyclones. https://photojournal.jpl.nasa.gov/catalog/PIA22423 . - Enhanced image by Kevin M. Gill (CC-BY) based on images provided courtesy of NASA/JPL-Caltech/SwRI/MSSS
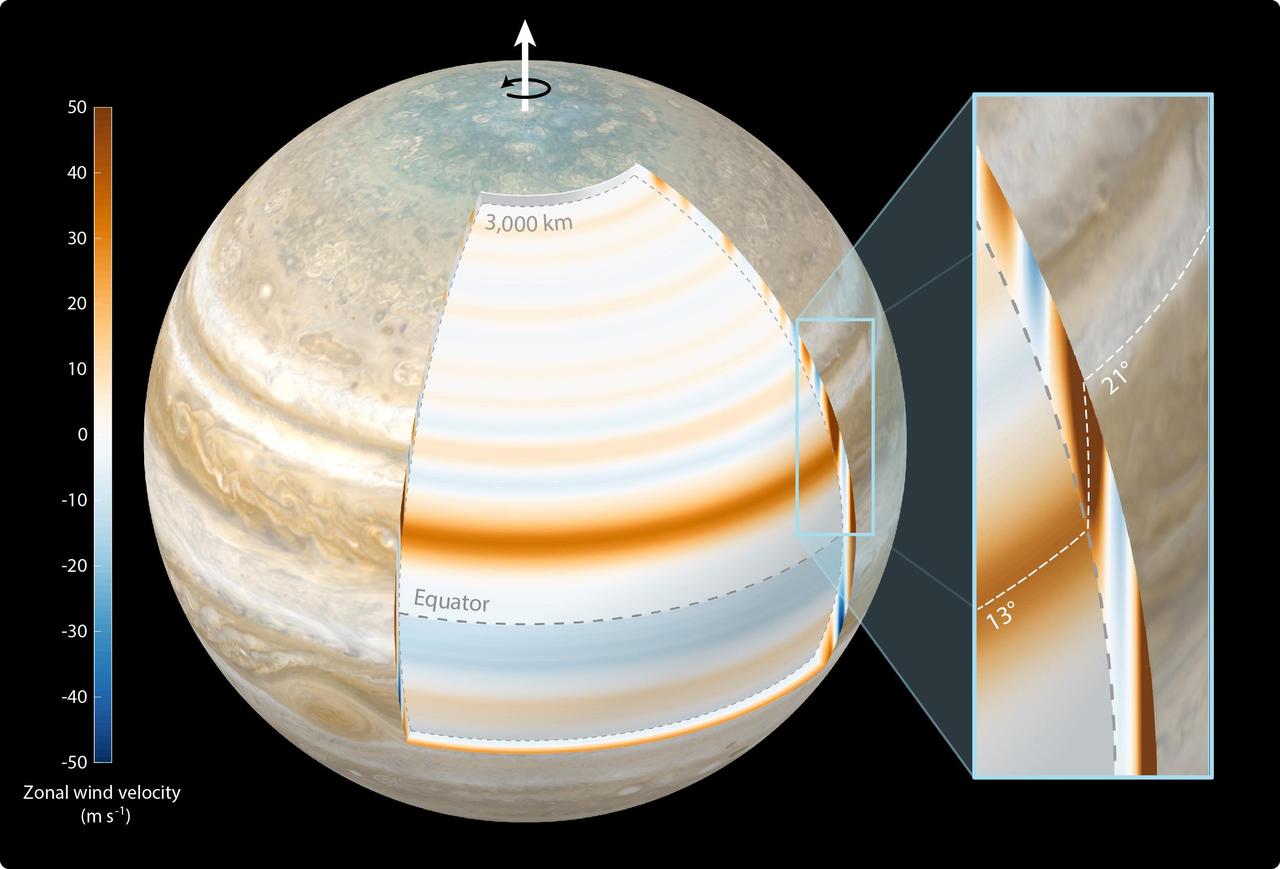
This composite illustration depicts scientists' findings that Jupiter's atmospheric winds penetrate the planet in a cylindrical manner and parallel to the planet's spin axis. The study, published in Nature Astronomy in October 2023, used gravity data from NASA's Juno mission. The top layer of Jupiter's atmosphere – the cloud level – was generated for this illustration using a combination of visible light images from Juno and NASA's Cassini mission. The annotated cutout reveals the gas giant's zonal winds at a depth of 1,800 miles (3,000 kilometers) below cloud level. In the cutout, Jupiter's belts are depicted with blue bands, the zones with reddish bands. The annotated close-up view at right shows the most dominant jet recorded by Juno. At cloud level, the jet is located at 21 degrees north latitude, above the planet's equator. However, at 1,800 miles (3,000 kilometers) below cloud level the jet is positioned at 13 degrees north latitude. The dashed white line represents the location of the jet's maximum velocity at all depths, showing its cylindrical structure. The color bar at left indicates the velocity of the zonal winds in meters per second at 1,800 miles (3,000 kilometers) below cloud level. https://photojournal.jpl.nasa.gov/catalog/PIA26076
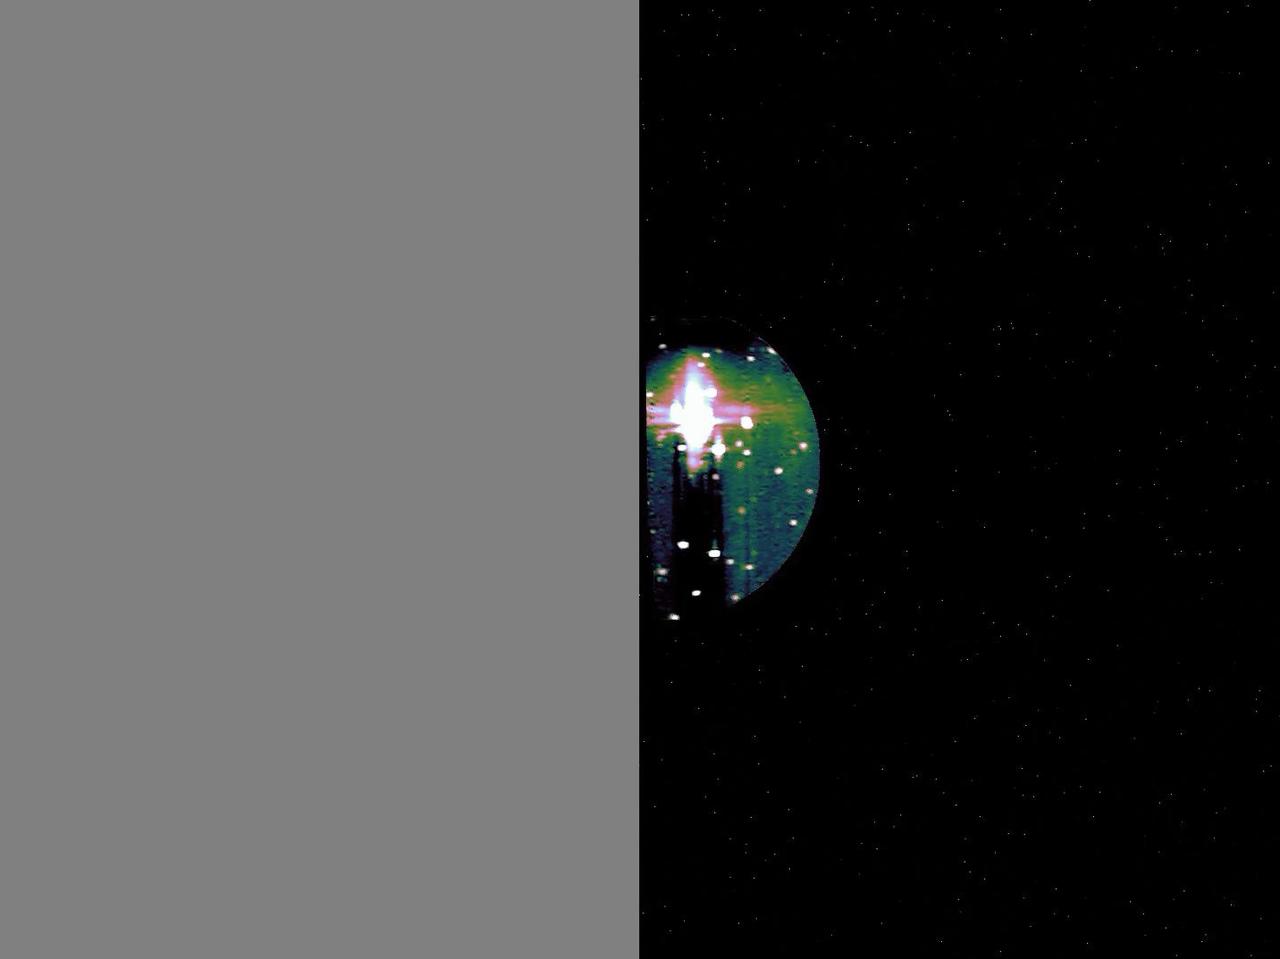
This image is the first observation of "shallow lightning" flashes — signatures of high-altitude Jovian thunderstorms that may fundamentally influence the composition of Jupiter's atmosphere. The image of was acquired by NASA's Juno mission using the spacecraft's sensitive Stellar Reference Unit navigation camera during Juno's 10th science flyby on Feb. 7, 2018. The solar-powered Jupiter explorer launched on Aug. 5, 2011 and went into orbit around the gas giant on July 4, 2016. https://photojournal.jpl.nasa.gov/catalog/PIA24301