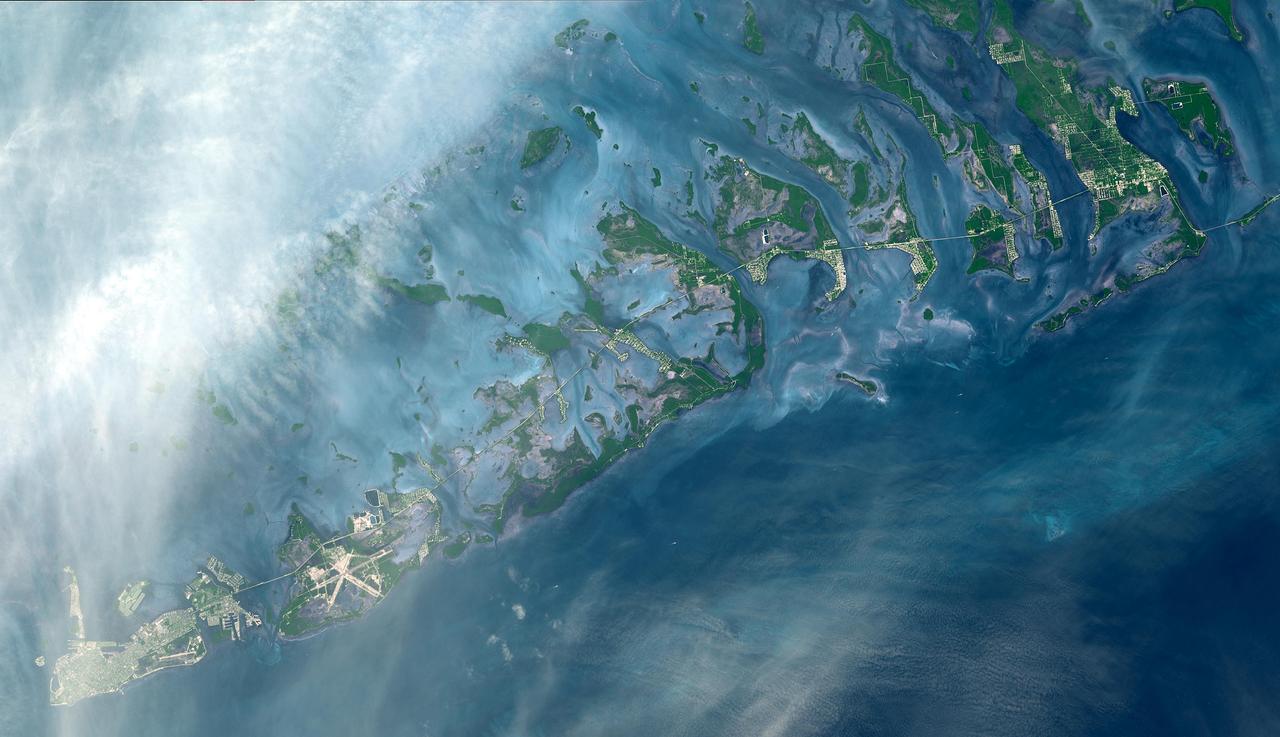
The Florida Keys are a chain of islands, islets and reefs extending from Virginia Key to the Dry Tortugas for about 309 kilometers (192 miles). The keys are chiefly limestone and coral formations. The larger islands of the group are Key West (with its airport), Key Largo, Sugarloaf Key, and Boca Chica Key. A causeway extends from the mainland to Key West. This image was acquired on October 28, 2001, by the Advanced Spaceborne Thermal Emission and Reflection Radiometer (ASTER) on NASA's Terra satellite. With its 14 spectral bands from the visible to the thermal infrared wavelength region, and its high spatial resolution of 15 to 90 meters (about 50 to 300 feet), ASTER images Earth to map and monitor the changing surface of our planet. http://photojournal.jpl.nasa.gov/catalog/PIA03890

ISS017-E-008188 (29 May 2008) --- Dry Tortugas islands near Florida are featured in this image photographed by an Expedition 17 crewmember on the International Space Station. The Dry Tortugas are a group of islands located approximately 75 miles west of Key West, Florida; they form the western end of the Florida Keys in the Gulf of Mexico. Like the Keys, the Dry Tortugas are formed primarily of coral reefs over older limestone formations. The islands were named "Dry Tortugas" upon discovery by Ponce de Leon in 1513 -- "tortugas" means turtles in Spanish, and the islands are "dry" as no fresh water is found on them. From the air, the islands present an atoll-like arrangement, however no central volcanic structure is present. The islands are only accessible by boat or seaplane; nevertheless they have been designated the Dry Tortugas National Park, and are visited by hundreds every year. This view highlights three islands in the group; Bush Key, Hospital Key, and Garden Key -- the site of Fort Jefferson. Fort Jefferson is a Civil War era fort, perhaps most notable for being the prison of Dr. Samuel Mudd, who set the broken leg of John Wilkes Booth following Booth's assassination of President Lincoln. The fort itself is currently undergoing extensive restoration to prevent collapse of the hexagonal outer walls (center). The islands stand out due to brown and light tan carbonate sands visible above the Gulf of Mexico water surface. Light blue-green irregular masses in the image surrounding the islands are coral reef tops visible below the water surface.
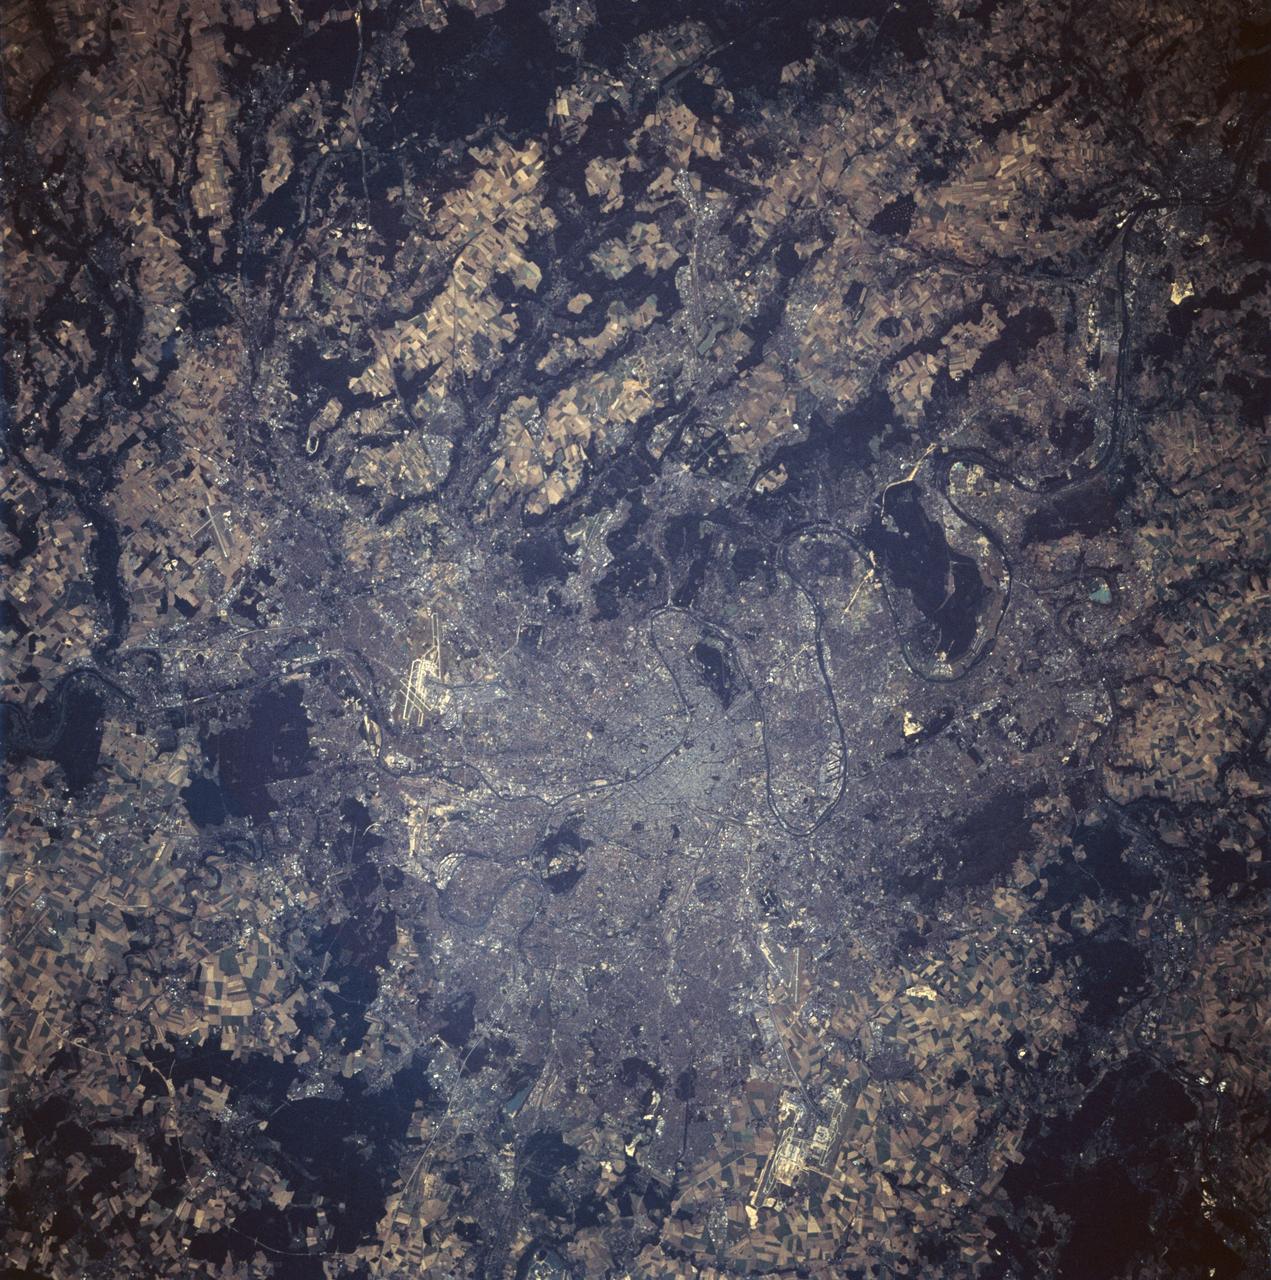
STS047-94-010 (12 - 20 Sept 1992) --- This 250mm Hasselblad color photo of Paris, France recorded during this mission, shows urban land uses in great detail. Several airports are clear, including the two major international airports of Orly and Le Bourget. Paris was founded in pre-Roman times on an island in the Seine River and continued as a Roman outpost. The easily defensible location was one of the keys to the growth of this island city. The city expanded from its island state to become a major urban center in Europe because of its location, its easy access by river traffic, and its productive hinterland.
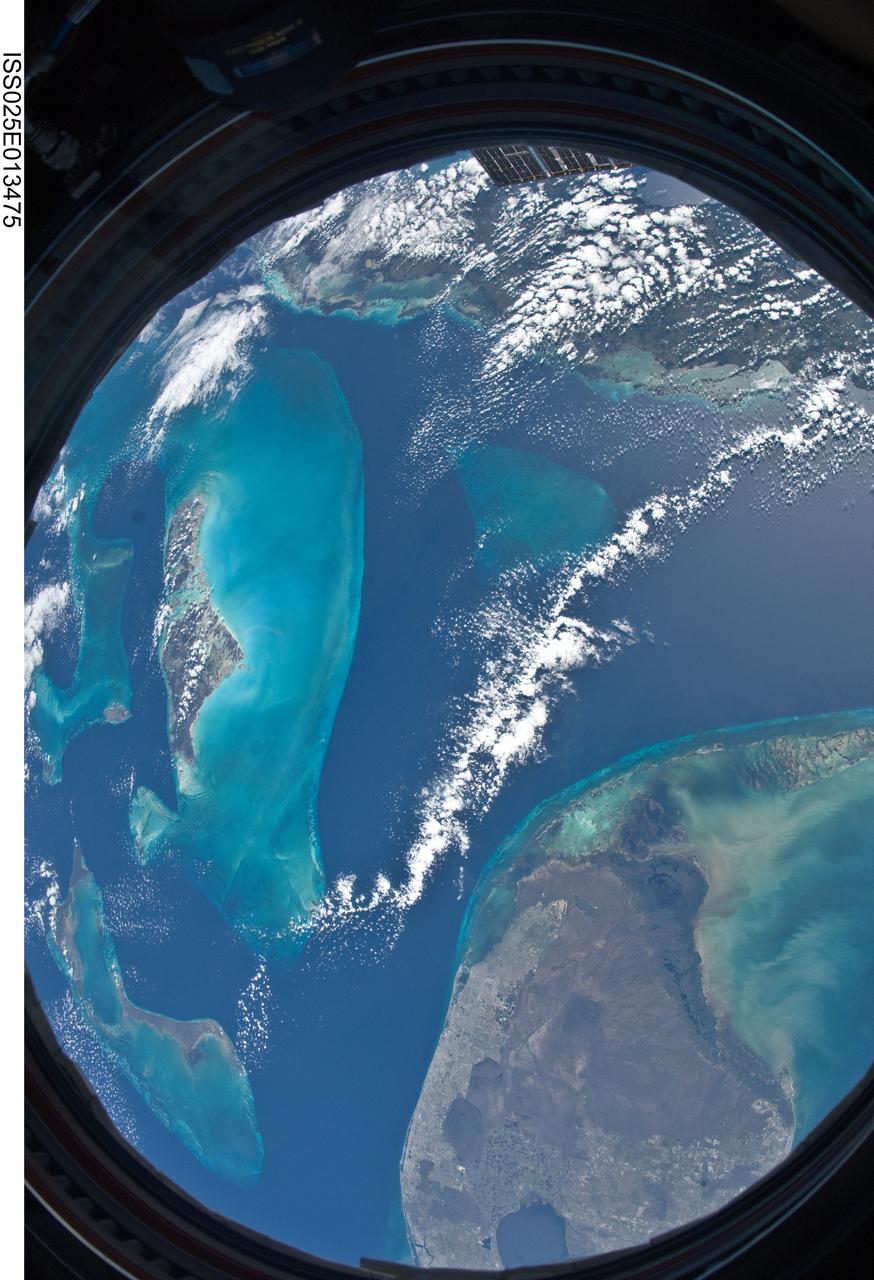
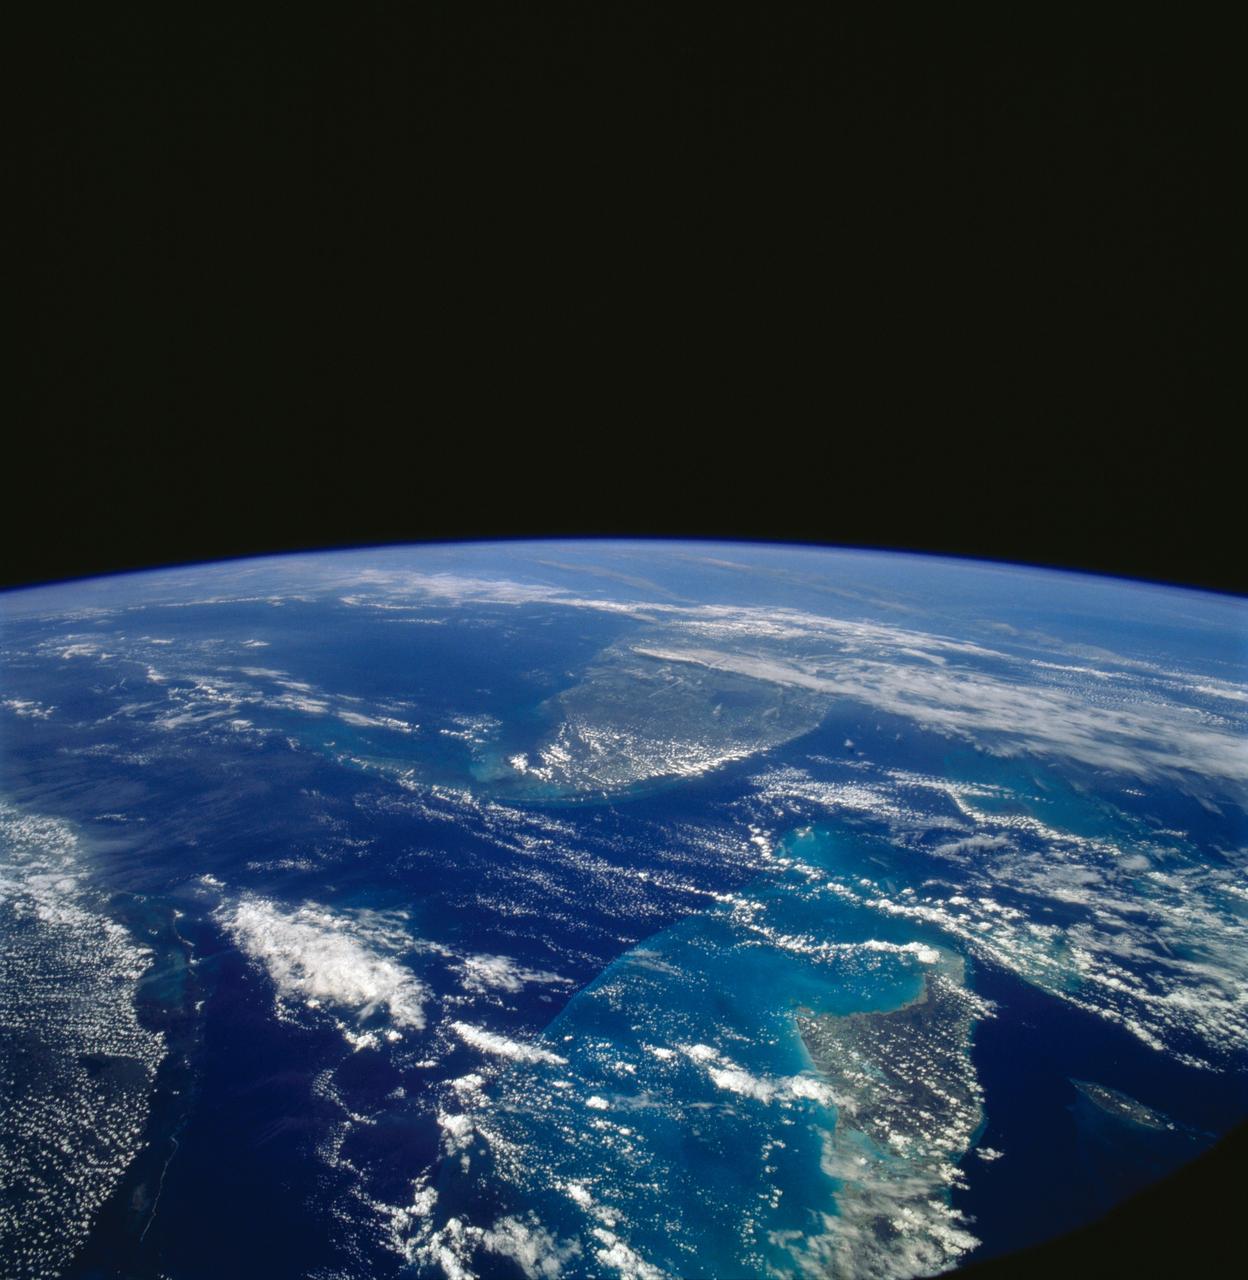
ISS025-E-013475 (9 Nov. 2010) --- Parts of the Atlantic, Gulf of Mexico and Caribbean Sea are easily noted in this unusual circular shaped image exposed by one of the Expedition 25 crew members aboard the International Space Station 220 miles above Earth. A 16mm f/2.8D lens gives this image a fish-eye effect, and the frame of the Cupola window adds to the circular shape. The southern portion of the Florida peninsula, including the elongated metropolitan Miami area, Lake Okeechobee and the Florida Keys, lies just a few kilometers away from islands in the Bahamas chain and the "Tongue of the Ocean." Andros is the largest visible island to the left of center.
STS112-705-011 (7-18 October 2002) --- The light-blue region in the middle of this view, photographed from the Space Shuttle Atlantis, is the shallow flat platform known as the Great Bahama Bank. The platform is covered by less than 100 feet of water. Andros Island, the biggest island in the Bahamas chain, is the highest part of this platform and appears partly under cloud cover in the center of the view. The edges of the platform are steep, dropping off thousands of feet into the ocean depths, the deepest water indicated by deep blues. The 50-mile-wide Strait of Florida is the deep water along the left and lower sides of the view. The Key Largo part of the Florida Peninsula appears in the extreme lower left.

This unique photo offers a view of the Florida peninsula, western Bahamas, north central Cuba and the deep blue waters of the Gulf Stream, that hugs the east coast of Florida (27.0N, 82.0W). In addition to being an excellent photograph for showing the geographical relationships between the variety of landforms in this scene, the typical effect of the land-sea breeze is very much in evidence as few clouds over water, cumulus build up over landmass.
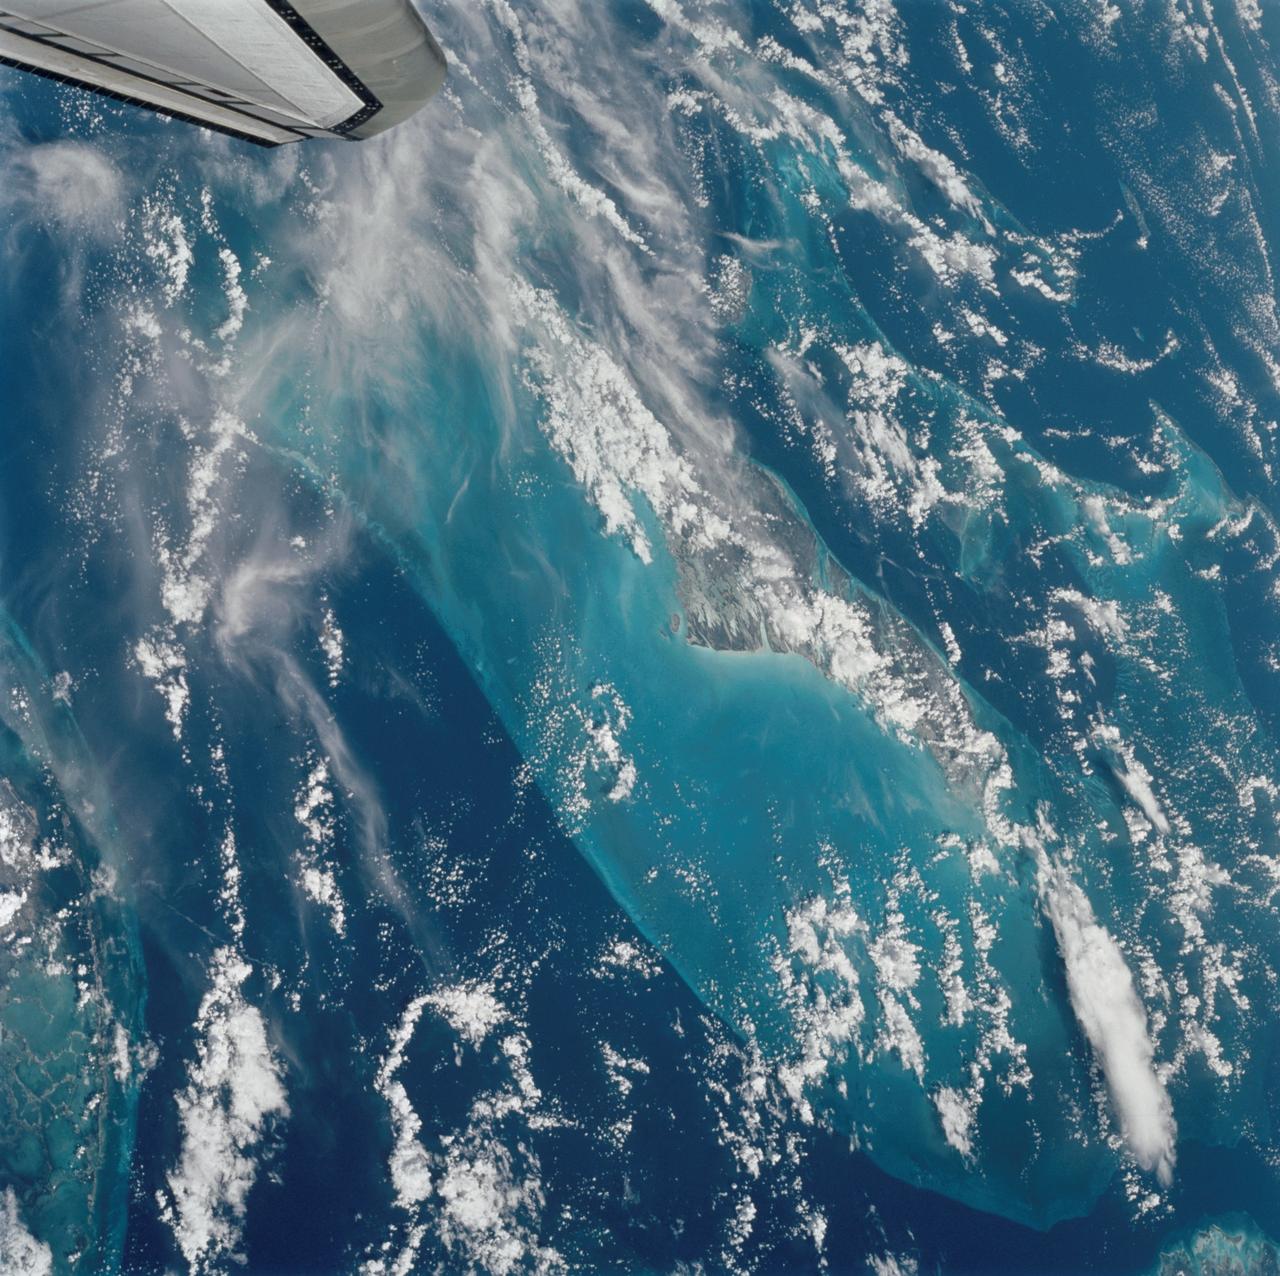
STS058-107-046 (18 Oct-1 Nov 1993) --- Clouds streak across central Florida in this striking photograph which includes the Florida Peninsula, Andros Island of the northern Bahamas and Cuba (lower left). The light blue, shallow bank of the Bahamas contrast with the deeper blue waters of the Florida strait. The city of Miami is obscured by clouds, but one can see the Florida Keys stretching off to the left. Much of the rest of the southeast coast is barely visible under haze.

KENNEDY SPACE CENTER, FLA. - Key officials are poised to cut the ribbon officially dedicating the new Security gates on Kennedy Parkway (Gate 2) and NASA Parkway (Gate 3). From left are Wally Schroeder, with Jones, Edmunds & Associates; Bobby Porter, with Oneida Construction; Daniel Tweed, NASA project manager; Jim Kennedy, Center director; and William Sample, SGS deputy program manager. The new gates were activated Aug. 1, allowing the general public to have access to the new Space Commerce Way, which will provide access to the Research Park and KSC Visitor Complex, and providing an alternate route for the general public between Titusville and Merritt Island that is accessible 24 hours a day. The gates are staffed 24 hours daily.
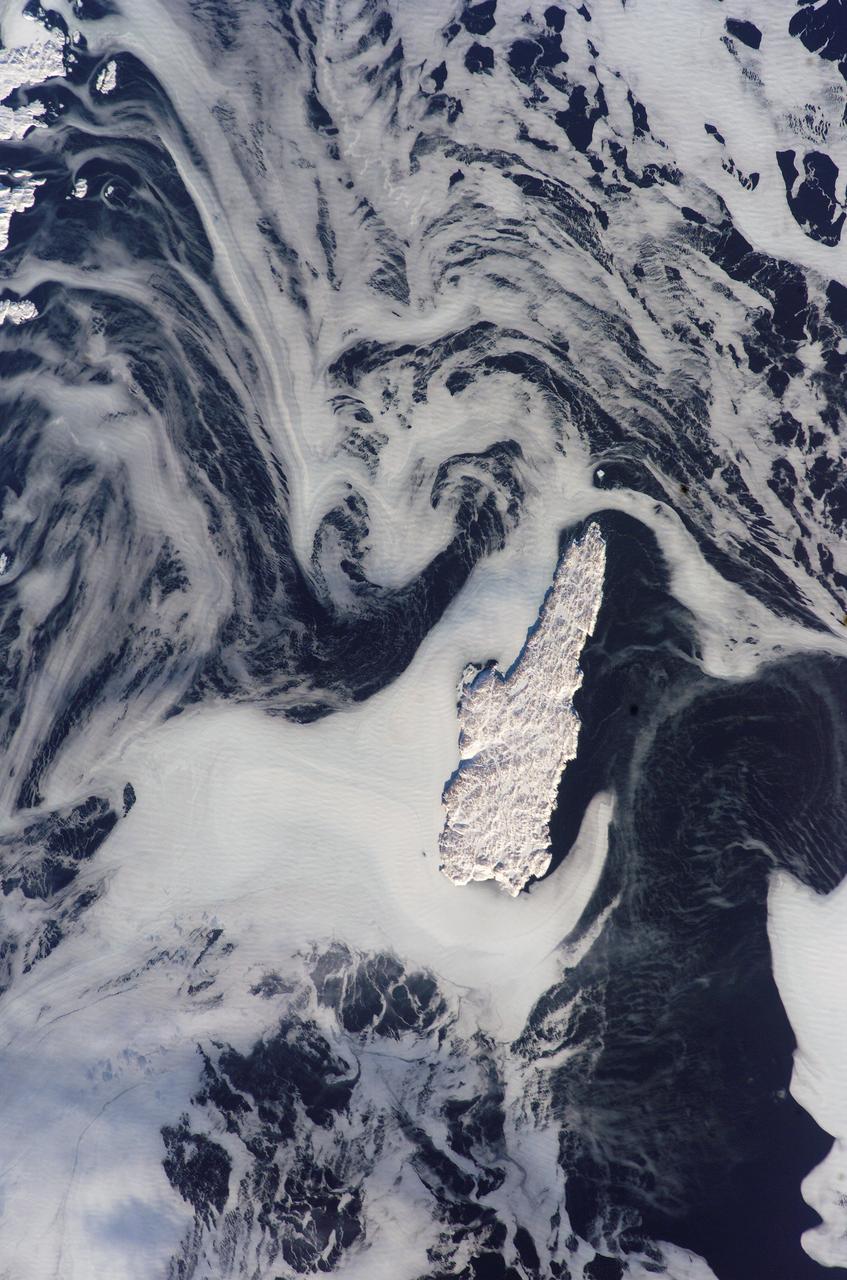
ISS012-E-15918 (24 Jan. 2006) --- Belle Isle and a portion of Newfoundland, Canada are featured in this image photographed by an Expedition 12 crew member on the International Space Station. Belle Isle (center) is surrounded by sea ice in this recent winter view. Belle Isle lies in the strait between the Island of Newfoundland and Labrador (the mainland portion of Canada’s province of Newfoundland). Small islands along the coast of Labrador appear in the top left corner. In this key location Belle Isle lies on the shortest shipping lanes between the Great Lakes and Europe, and also on the main north-south shipping route to Hudson Bay and the Northwest Territories. Snow and ice in this recent winter view obliterate the dozens of glacier-scoured lakes that dot the surface of the island. The single community of Belle Isle Landing on the southeast tip is equally hard to see. Ice patterns also show that the island lies at the meeting point of two sea currents. The Labrador Current flows from the northwest (top left), and a smaller current, driven by dominant westerly winds, flows from the southwest (lower left) out of the narrow Belle Isle Strait (out of frame lower left). Flow lines in sea ice indicate the sense of movement of the ice. Ice floes embedded in the Labrador Current appear in the upper part of the image as a relatively open pattern. Sea ice with a denser pattern enters from the lower left corner, banking against the west side of Belle Isle. Tendrils flow around capes at either end of the island, with an ice-free “shadow” on the opposite, downstream side. Eddies (center) in the ice patterns show where the currents interact, north and west of the island.

This composite image shows a hot spot in Jupiter's atmosphere. In the image on the left, taken on Sept. 16, 2020, by the Gemini North telescope on the island of Hawaii, the hot spot appears bright in the infrared at a wavelength of 5 microns. In the inset image on the right, taken by Juno's JunoCam visible-light imager, also on Sept. 16 during Juno's 29th perijove pass, the hot spot appears dark. Scientists have known of Jupiter's hot spots for a long time. On Dec. 7, 1995, the Galileo probe likely descended into a similar hot spot. To the naked eye, Jupiter's hot spots appear as dark, cloud-free areas in Jupiter's equatorial belt, but at infrared wavelengths, which are invisible to the human eye, they are extremely bright, revealing the warm, deep atmosphere below the clouds. High-resolution images of hot spots such as these are key both to understanding the role of storms and waves in Jupiter's atmosphere. Citizen scientist Brian Swift processed the images to enhance the color and contrast, with further processing by Tom Momary to map the JunoCam image to the Gemini data. The international Gemini North telescope is a 26.6-foot-diameter (8.1-meter-diameter) optical/infrared telescope optimized for infrared observations, and is managed for the NSF by the Association of Universities for Research in Astronomy (AURA). https://photojournal.jpl.nasa.gov/catalog/PIA24299
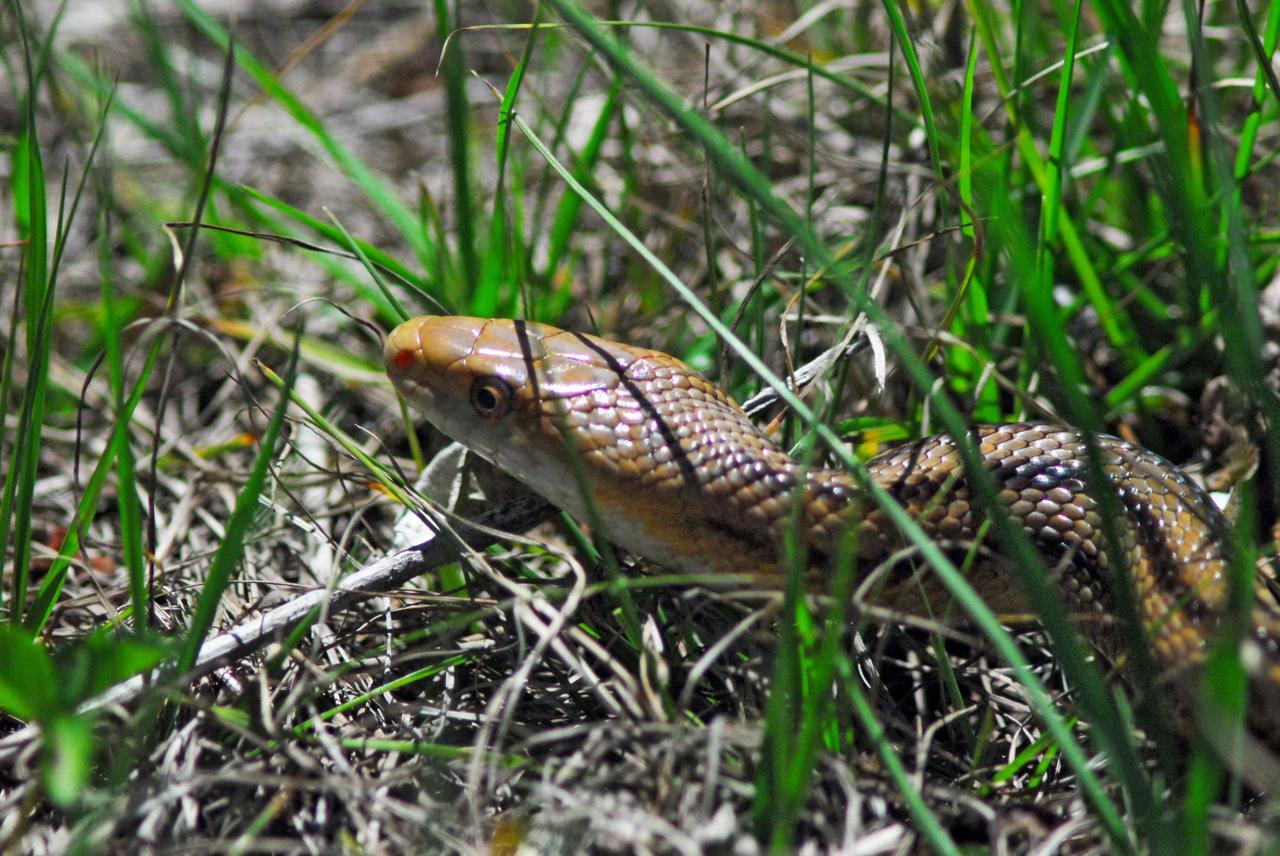
KENNEDY SPACE CENTER, FLA. -- What may be a yellow rat snake slithers through the grass on Kennedy Space Center. Yellow rat snakes are found throughout most of Florida and the Keys. They also live in a narrow strip along the Atlantic coast through Georgia, South Carolina and North Carolina. They are often found in warm southern swamps, and are also common in abandoned buildings and barns. Besides rats, yellow rat snakes will eat a wide variety of small mammals, birds, and eggs. They are considered the best tree climbing snake in Florida. The scales on their bellies are squared off, which aids them tremendously with climbing. They are strong constrictors, and kill their prey by suffocation. KSC shares a boundary with the Merritt Island Wildlife Nature Refuge. The refuge is a habitat for more than 310 species of birds, 25 mammals, 117 fishes and 65 amphibians and reptiles. In addition, the Refuge supports 19 endangered or threatened wildlife species on Federal or State lists, more than any other single refuge in the U.S. Photo credit: NASA/Dimitri Gerondidakis

This composite image shows a hot spot in Jupiter's atmosphere. In the image on the left, taken on Nov. 8, 2020, by NASA's Infrared Telescope Facility (IRTF) on the island of Hawaii, the hot spot appears bright in the infrared. The inset image on the right, taken by the JunoCam visible-light imager (also on Nov. 8, during Juno's 30th perijove pass), the hot spot appears dark and is flanked by high light-colored clouds to the south and a bright white storm to the west. Jupiter's hot spots have been known for a long time. On Dec. 7, 1995, the Galileo probe likely descended into a similar hot spot. To the naked eye, Jupiter's hot spots appear as dark, cloud-free spots in Jupiter's equatorial belt, but at infrared wavelengths, they are extremely bright, revealing the warm, deep atmosphere below the clouds. High-resolution images of hot spots such as these are key to understanding the role of storms and waves in Jupiter's atmosphere and to solving the mystery of Jupiter's elusive water. Citizen scientist Kevin Gill processed the image to enhance the color and contrast, with further processing by Tom Momary to map the JunoCam image to the IRTF data. The NASA IRTF is a 10.5-foot-diameter (3.2-meter-diameter) telescope optimized for infrared observations and is managed for NASA by the Institute for Astronomy at the University of Hawai'i. https://photojournal.jpl.nasa.gov/catalog/PIA24300
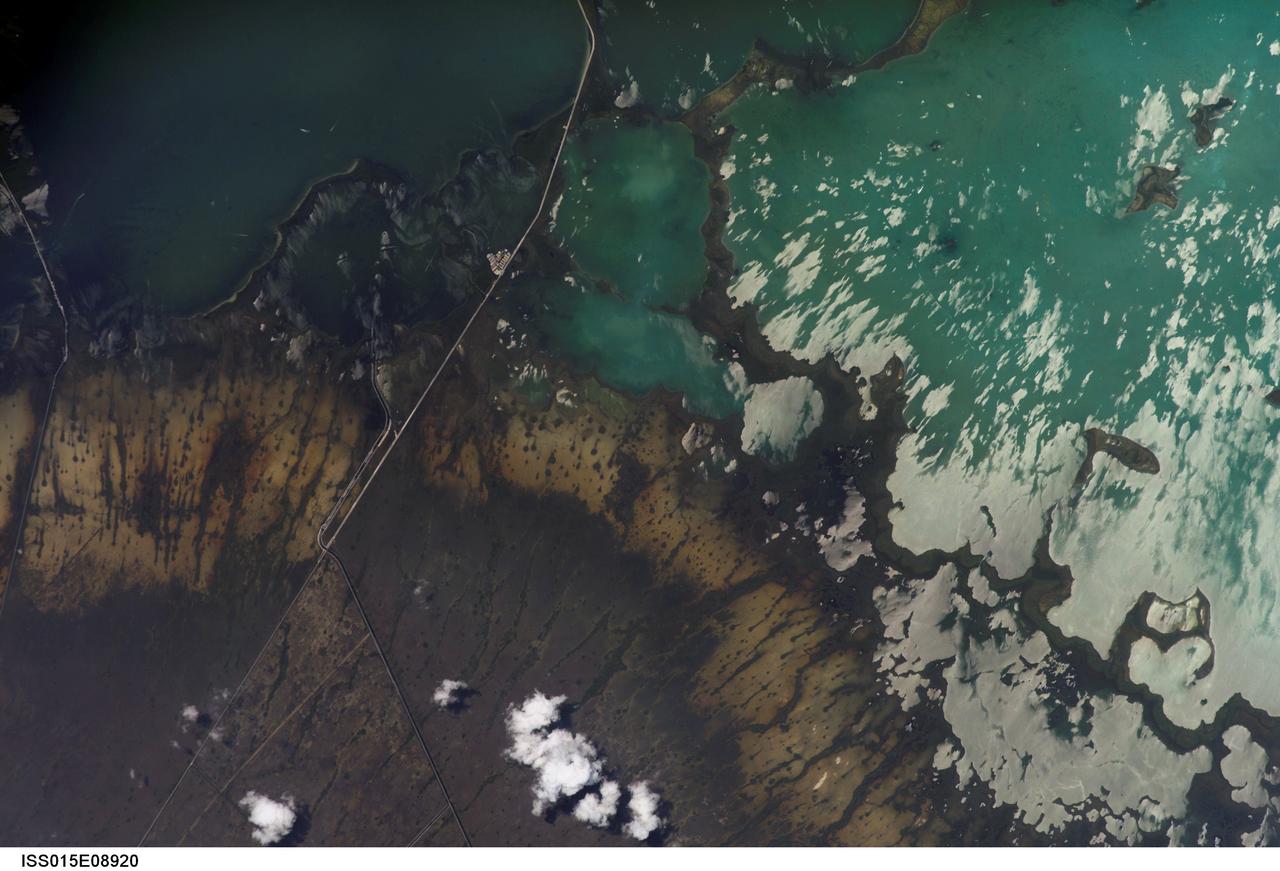
ISS015-E-08920 (19 May 2007) --- Southern Everglades National Park, Florida is featured in this image photographed by an Expedition 15 crewmember on the International Space Station. Everglades National Park in southern Florida is the largest subtropical wilderness in the United States. Known as the "river of grass", the Everglades wetlands and wooded uplands host a variety of endangered species including crocodiles, manatees, and panthers. During the late 19th and 20th centuries, the original 11,000 square miles of wetlands were viewed as useless swampland in need of reclamation. The success of reclamation efforts -- for agriculture and urban expansion in southern Florida -- has led to the loss of approximately 50 per cent of the original wetlands and 90 per cent of wading bird species. Today, an extensive restoration effort is underway to return portions of the Everglades to a more natural state and prevent further ecosystem degradation. This view highlights the southern Everglades estuarine ecosystem where the wetlands meet Florida Bay. Thin fingers of land and small islands (keys) host mangrove, hardwood hammocks, marsh and prairie (mainly dark to light green in the image). The tan and grayish-brown areas are dominantly scrub, marshland and prairie; small green "dots" and narrow lines in this region are isolated mangrove and hardwood stands indicating the general direction of slow water flow toward the bay. The silver-gray regions are water surfaces highlighted by sunglint. The roadway forming the western boundary of the National Park is US Route 1 connecting the Miami metropolitan area to the north (not shown) with the Florida Keys to the south (not shown). A small built feature visible along the roadway is a fishing camp.
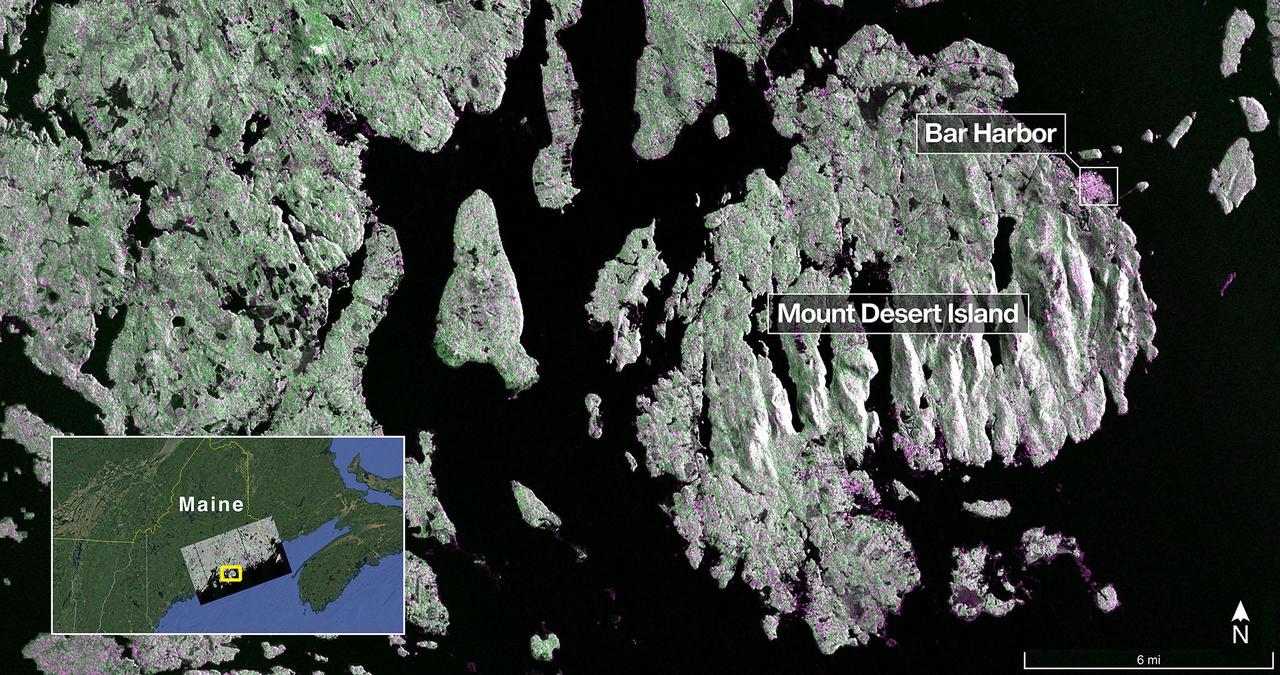
The NISAR (NASA-ISRO Synthetic Aperture Radar) Earth-observing radar satellite's L-band synthetic aperture radar (SAR) system captured this image of Mount Desert Island off the Maine coast on Aug. 21, 2025. Dark areas represent water, green areas are forest, and magenta areas are hard or regular surfaces, such as bare ground or buildings. The bright magenta area on the island's northeast end is the town of Bar Harbor. The satellite is a joint effort between NASA and the Indian Space Research Organisation (ISRO) and is the first satellite to combine L-band and S-band radar systems. The L-band system uses a 10-inch (25-centimeter) wavelength that enables its signal to penetrate forest canopies and measure soil moisture as well as motion of ice surfaces and land down to fractions of an inch – a key measurement in understanding how the land surface moves before, during, and after earthquakes, volcanic eruptions, and landslides. The S-band radar, provided by ISRO's Space Applications Centre, uses a 4-inch (10-centimeter) microwave signal that's more sensitive to small vegetation, which makes it effective at monitoring certain types of agriculture and grassland ecosystems. Data used to create the image was collected during NISAR's commissioning phase, when the spacecraft's systems and instruments are powered on and tested. The NISAR mission will begin science operations in November, roughly 90 days after its July 30, 2025, launch from Satish Dhawan Space Centre on India's southeastern coast. Observations from NISAR will benefit humanity by helping researchers around the world better understand changes in our planet's surface, including its ice sheets, glaciers, and sea ice. It also will capture changes in forest and wetland ecosystems and track movement and deformation of our planet's crust by phenomena such as earthquakes, landslides, and volcanic activity. The global and rapid coverage from NISAR will provide unprecedented support for disaster response, producing data to assist in mitigating and assessing damage, with observations before and after catastrophic events available in short time frames. https://photojournal.jpl.nasa.gov/catalog/PIA26616

The Visible Infrared Imaging Radiometer Suite (VIIRS) on the Suomi NPP satellite captured this view of extensive sea-ice fracturing off the northern coast of Alaska. The event began in late-January and spread west toward Banks Island throughout February and March 2013. Visualizations of the Arctic often give the impression that the ice cap is a continuous sheet of stationary, floating ice. In fact, it is a collection of smaller pieces that constantly shift, crack, and grind against one another as they are jostled by winds and ocean currents. Especially during the summer—but even during the height of winter—cracks—or leads—open up between pieces of ice. That was what was happening on the left side of the animation (seen here: <a href="http://bit.ly/10kE7sh" rel="nofollow">bit.ly/10kE7sh</a>) in late January. A high-pressure weather system was parked over the region, producing warmer temperatures and winds that flowed in a southwesterly direction. That fueled the Beaufort Gyre, a wind-driven ocean current that flows clockwise. The gyre was the key force pulling pieces of ice west past Point Barrow, the northern nub of Alaska that protrudes into the Beaufort Sea. “A fracturing event in this area is not unusual because the Beaufort Gyre tends to push ice away from Banks Island and the Canadian Archipelago,” explained Walt Meier of the National Snow & Ice Data Center (NSIDC). “Point Barrow can act like a ‘pin point’ where the ice catches and fractures to the north and east.” In February, however, a series of storms passing over central Alaska exacerbated the fracturing. Strong westerly winds prompted several large pieces of ice to break away in an arc-shaped wave that moved progressively east. By the end of February, large pieces of ice had fractured all the way to the western coast of Banks Island, a distance of about 1,000 kilometers (600 miles). The data used to create the animation came from the longwave infrared (thermal) portion of the electromagnetic spectrum, so the animation illustrates how much heat the surface was emitting as VIIRS surveyed the area. Cooler areas (sea ice) appear white, while warmer areas (open water) are dark. The light gray plume near the cracks is warmer, moister air escaping from the ocean and blowing downwind. Clouds do not show up well in the VIIRS thermal band, so the storms that fueled the fracturing are not readily visible. While fracturing events are common, few events sprawl across such a large area or produce cracks as long and wide as those seen here. The age of the sea ice in this area was one of the key reasons this event became so widespread. “The region is covered almost completely by seasonal or first-year ice—ice that has formed since last September,” said Meier. “This ice is thinner and weaker than the older, multi-year ice, so it responds more readily to winds and is more easily broken up.” NASA Earth Observatory images by Jesse Allen using VIIRS day-night band data from the Suomi National Polar-orbiting Partnership. Suomi NPP is the result of a partnership between NASA, the National Oceanic and Atmospheric Administration, and the Department of Defense. Caption by Adam Voiland. Instrument: Suomi NPP - VIIRS For more info go to: <a href="http://earthobservatory.nasa.gov/IOTD/view.php?id=80752" rel="nofollow">earthobservatory.nasa.gov/IOTD/view.php?id=80752</a> Credit: <b><a href="http://www.earthobservatory.nasa.gov/" rel="nofollow"> NASA Earth Observatory</a></b> <b><a href="http://www.nasa.gov/audience/formedia/features/MP_Photo_Guidelines.html" rel="nofollow">NASA image use policy.</a></b> <b><a href="http://www.nasa.gov/centers/goddard/home/index.html" rel="nofollow">NASA Goddard Space Flight Center</a></b> enables NASA’s mission through four scientific endeavors: Earth Science, Heliophysics, Solar System Exploration, and Astrophysics. Goddard plays a leading role in NASA’s accomplishments by contributing compelling scientific knowledge to advance the Agency’s mission. <b>Follow us on <a href="http://twitter.com/NASA_GoddardPix" rel="nofollow">Twitter</a></b> <b>Like us on <a href="http://www.facebook.com/pages/Greenbelt-MD/NASA-Goddard/395013845897?ref=tsd" rel="nofollow">Facebook</a></b> <b>Find us on <a href="http://instagram.com/nasagoddard?vm=grid" rel="nofollow">Instagram</a></b>

The Visible Infrared Imaging Radiometer Suite (VIIRS) on the Suomi NPP satellite captured this view of extensive sea-ice fracturing off the northern coast of Alaska. The event began in late-January and spread west toward Banks Island throughout February and March 2013. Visualizations of the Arctic often give the impression that the ice cap is a continuous sheet of stationary, floating ice. In fact, it is a collection of smaller pieces that constantly shift, crack, and grind against one another as they are jostled by winds and ocean currents. Especially during the summer—but even during the height of winter—cracks—or leads—open up between pieces of ice. That was what was happening on the left side of the animation (seen here: <a href="http://bit.ly/10kE7sh" rel="nofollow">bit.ly/10kE7sh</a>) in late January. A high-pressure weather system was parked over the region, producing warmer temperatures and winds that flowed in a southwesterly direction. That fueled the Beaufort Gyre, a wind-driven ocean current that flows clockwise. The gyre was the key force pulling pieces of ice west past Point Barrow, the northern nub of Alaska that protrudes into the Beaufort Sea. “A fracturing event in this area is not unusual because the Beaufort Gyre tends to push ice away from Banks Island and the Canadian Archipelago,” explained Walt Meier of the National Snow & Ice Data Center (NSIDC). “Point Barrow can act like a ‘pin point’ where the ice catches and fractures to the north and east.” In February, however, a series of storms passing over central Alaska exacerbated the fracturing. Strong westerly winds prompted several large pieces of ice to break away in an arc-shaped wave that moved progressively east. By the end of February, large pieces of ice had fractured all the way to the western coast of Banks Island, a distance of about 1,000 kilometers (600 miles). The data used to create the animation came from the longwave infrared (thermal) portion of the electromagnetic spectrum, so the animation illustrates how much heat the surface was emitting as VIIRS surveyed the area. Cooler areas (sea ice) appear white, while warmer areas (open water) are dark. The light gray plume near the cracks is warmer, moister air escaping from the ocean and blowing downwind. Clouds do not show up well in the VIIRS thermal band, so the storms that fueled the fracturing are not readily visible. While fracturing events are common, few events sprawl across such a large area or produce cracks as long and wide as those seen here. The age of the sea ice in this area was one of the key reasons this event became so widespread. “The region is covered almost completely by seasonal or first-year ice—ice that has formed since last September,” said Meier. “This ice is thinner and weaker than the older, multi-year ice, so it responds more readily to winds and is more easily broken up.” NASA Earth Observatory images by Jesse Allen using VIIRS day-night band data from the Suomi National Polar-orbiting Partnership. Suomi NPP is the result of a partnership between NASA, the National Oceanic and Atmospheric Administration, and the Department of Defense. Caption by Adam Voiland. Instrument: Suomi NPP - VIIRS For more info go to: <a href="http://earthobservatory.nasa.gov/IOTD/view.php?id=80752" rel="nofollow">earthobservatory.nasa.gov/IOTD/view.php?id=80752</a> Credit: <b><a href="http://www.earthobservatory.nasa.gov/" rel="nofollow"> NASA Earth Observatory</a></b> <b><a href="http://www.nasa.gov/audience/formedia/features/MP_Photo_Guidelines.html" rel="nofollow">NASA image use policy.</a></b> <b><a href="http://www.nasa.gov/centers/goddard/home/index.html" rel="nofollow">NASA Goddard Space Flight Center</a></b> enables NASA’s mission through four scientific endeavors: Earth Science, Heliophysics, Solar System Exploration, and Astrophysics. Goddard plays a leading role in NASA’s accomplishments by contributing compelling scientific knowledge to advance the Agency’s mission. <b>Follow us on <a href="http://twitter.com/NASA_GoddardPix" rel="nofollow">Twitter</a></b> <b>Like us on <a href="http://www.facebook.com/pages/Greenbelt-MD/NASA-Goddard/395013845897?ref=tsd" rel="nofollow">Facebook</a></b> <b>Find us on <a href="http://instagram.com/nasagoddard?vm=grid" rel="nofollow">Instagram</a></b>

The Visible Infrared Imaging Radiometer Suite (VIIRS) on the Suomi NPP satellite captured this view of extensive sea-ice fracturing off the northern coast of Alaska. The event began in late-January and spread west toward Banks Island throughout February and March 2013. Visualizations of the Arctic often give the impression that the ice cap is a continuous sheet of stationary, floating ice. In fact, it is a collection of smaller pieces that constantly shift, crack, and grind against one another as they are jostled by winds and ocean currents. Especially during the summer—but even during the height of winter—cracks—or leads—open up between pieces of ice. That was what was happening on the left side of the animation (seen here: <a href="http://bit.ly/10kE7sh" rel="nofollow">bit.ly/10kE7sh</a>) in late January. A high-pressure weather system was parked over the region, producing warmer temperatures and winds that flowed in a southwesterly direction. That fueled the Beaufort Gyre, a wind-driven ocean current that flows clockwise. The gyre was the key force pulling pieces of ice west past Point Barrow, the northern nub of Alaska that protrudes into the Beaufort Sea. “A fracturing event in this area is not unusual because the Beaufort Gyre tends to push ice away from Banks Island and the Canadian Archipelago,” explained Walt Meier of the National Snow & Ice Data Center (NSIDC). “Point Barrow can act like a ‘pin point’ where the ice catches and fractures to the north and east.” In February, however, a series of storms passing over central Alaska exacerbated the fracturing. Strong westerly winds prompted several large pieces of ice to break away in an arc-shaped wave that moved progressively east. By the end of February, large pieces of ice had fractured all the way to the western coast of Banks Island, a distance of about 1,000 kilometers (600 miles). The data used to create the animation came from the longwave infrared (thermal) portion of the electromagnetic spectrum, so the animation illustrates how much heat the surface was emitting as VIIRS surveyed the area. Cooler areas (sea ice) appear white, while warmer areas (open water) are dark. The light gray plume near the cracks is warmer, moister air escaping from the ocean and blowing downwind. Clouds do not show up well in the VIIRS thermal band, so the storms that fueled the fracturing are not readily visible. While fracturing events are common, few events sprawl across such a large area or produce cracks as long and wide as those seen here. The age of the sea ice in this area was one of the key reasons this event became so widespread. “The region is covered almost completely by seasonal or first-year ice—ice that has formed since last September,” said Meier. “This ice is thinner and weaker than the older, multi-year ice, so it responds more readily to winds and is more easily broken up.” NASA Earth Observatory images by Jesse Allen using VIIRS day-night band data from the Suomi National Polar-orbiting Partnership. Suomi NPP is the result of a partnership between NASA, the National Oceanic and Atmospheric Administration, and the Department of Defense. Caption by Adam Voiland. Instrument: Suomi NPP - VIIRS For more info go to: <a href="http://earthobservatory.nasa.gov/IOTD/view.php?id=80752" rel="nofollow">earthobservatory.nasa.gov/IOTD/view.php?id=80752</a> Credit: <b><a href="http://www.earthobservatory.nasa.gov/" rel="nofollow"> NASA Earth Observatory</a></b> <b><a href="http://www.nasa.gov/audience/formedia/features/MP_Photo_Guidelines.html" rel="nofollow">NASA image use policy.</a></b> <b><a href="http://www.nasa.gov/centers/goddard/home/index.html" rel="nofollow">NASA Goddard Space Flight Center</a></b> enables NASA’s mission through four scientific endeavors: Earth Science, Heliophysics, Solar System Exploration, and Astrophysics. Goddard plays a leading role in NASA’s accomplishments by contributing compelling scientific knowledge to advance the Agency’s mission. <b>Follow us on <a href="http://twitter.com/NASA_GoddardPix" rel="nofollow">Twitter</a></b> <b>Like us on <a href="http://www.facebook.com/pages/Greenbelt-MD/NASA-Goddard/395013845897?ref=tsd" rel="nofollow">Facebook</a></b> <b>Find us on <a href="http://instagram.com/nasagoddard?vm=grid" rel="nofollow">Instagram</a></b>
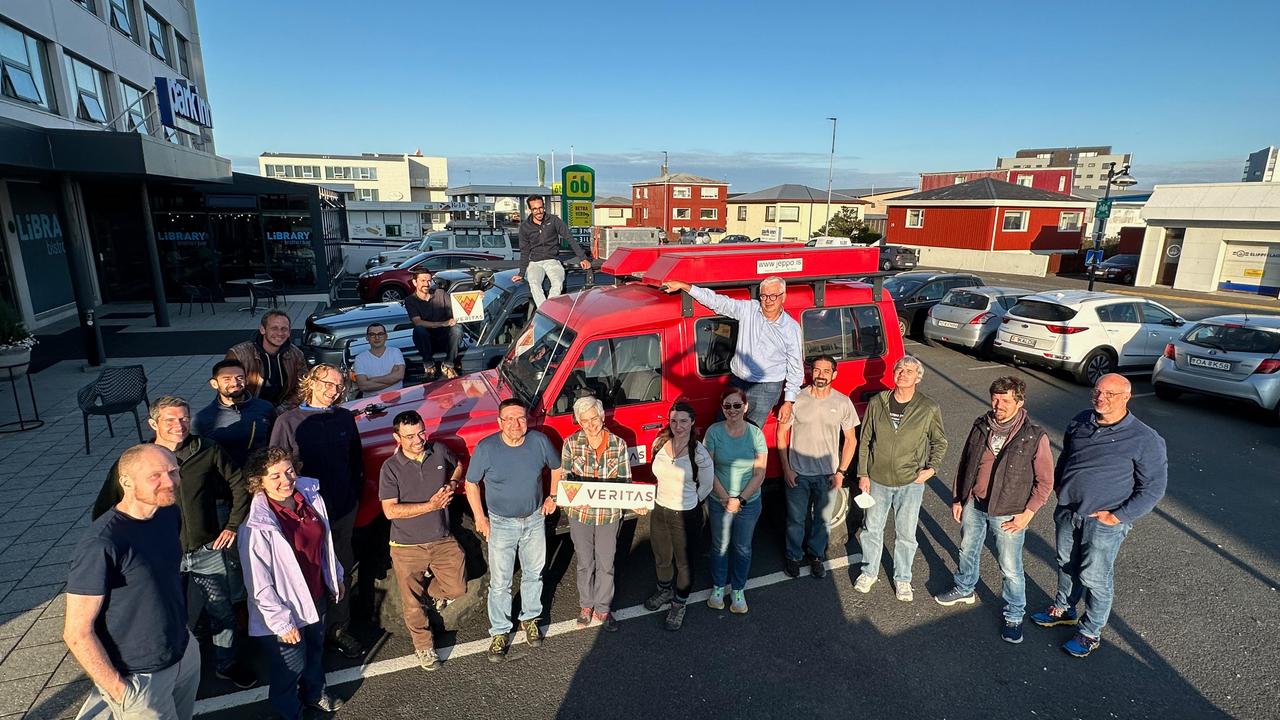
Members of the VERITAS science team pause for a photograph on July 31, 2023, after arriving in Iceland to begin a two-week campaign to study the volcanic island's geology to help the team prepare for NASA's VERITAS (short for Venus Emissivity, Radio science, InSAR, Topography, And Spectroscopy) mission to Venus. From July 30 to Aug. 14, 2023, the international science team, including local participation from the University of Iceland, worked to lay the groundwork for the science that will ultimately be done from Venus orbit. At center, holding the VERITAS mission identifier is the mission's principal investigator and the science team lead, Sue Smrekar, of NASA's Jet Propulsion Laboratory in Southern California. Flanking her are science team members from multiple U.S., Italian, and German institutions, including members of the German Aerospace Center (DLR) Flugzeug Synthetic Aperture Radar (F-SAR) airplane team. The DLR F-SAR team was tasked with collecting synthetic-aperture radar data of the regions studied by the field team. A key objective of the campaign is to refine change detection algorithms that will be used to look for global surface change (such as volcanic activity) between NASA's Magellan radar mission from the 1990s and VERITAS, as well as between VERITAS and the ESA (European Space Agency) EnVision mission to Venus, both of which are targeting the early 2030s for launch. NASA's VERITAS is an orbiter designed to peer through Venus' thick atmosphere with a suite of powerful instruments to create global maps of the planet's surface, including topography, radar images, rock type, and gravity, as well as detect surface changes. VERITAS is designed to understand what processes are currently active, search for evidence of past and current interior water, and understand the geologic evolution of the planet, illuminating how rocky planets throughout the galaxy evolve. VERITAS and NASA's Deep Atmosphere Venus Investigation of Noble gases, Chemistry, and Imaging (DAVINCI) mission were selected in 2021 under NASA's Discovery Program as the agency's next missions to Venus. The Discovery Program is managed by the Planetary Missions Program Office at NASA's Marshall Space Flight Center in Huntsville, Alabama, for the Planetary Science Division of NASA's Science Mission Directorate in Washington. https://photojournal.jpl.nasa.gov/catalog/PIA25835
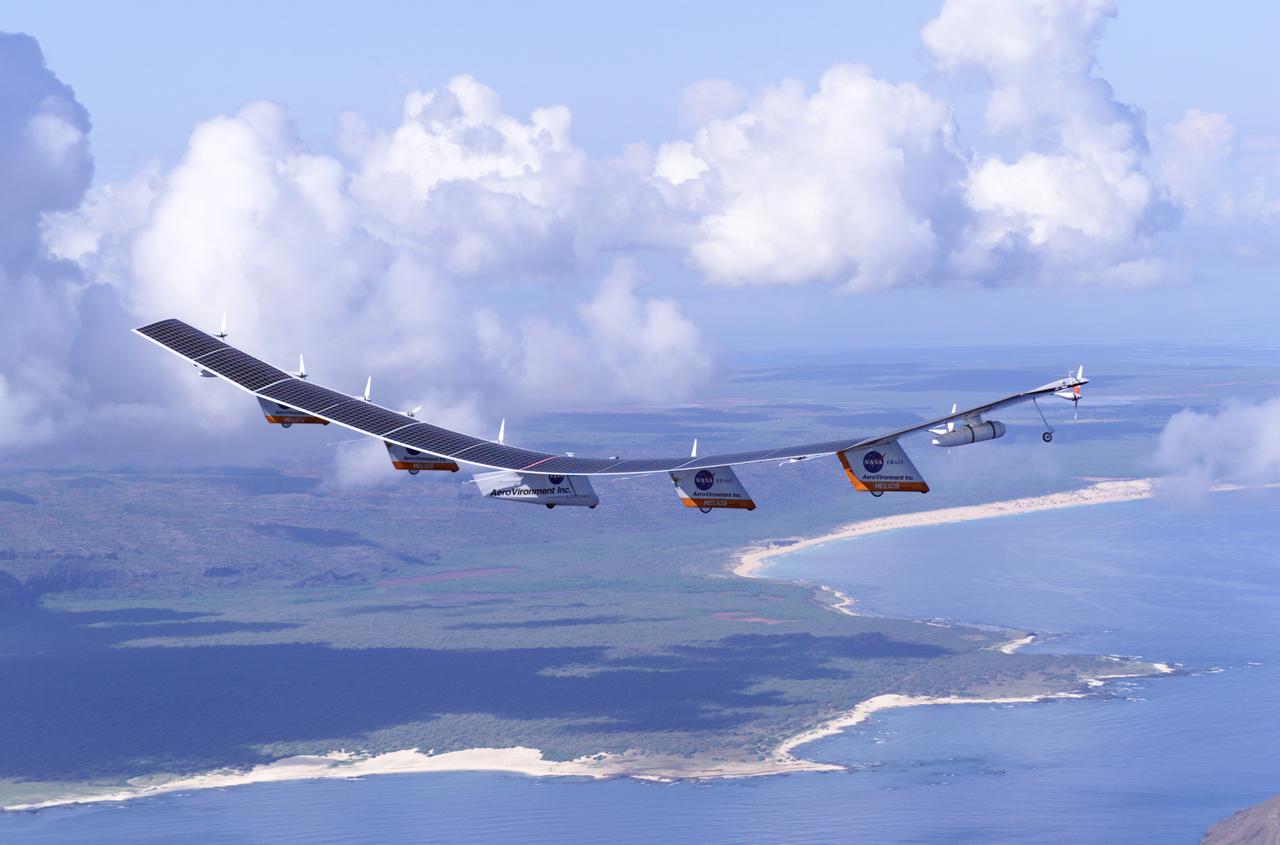
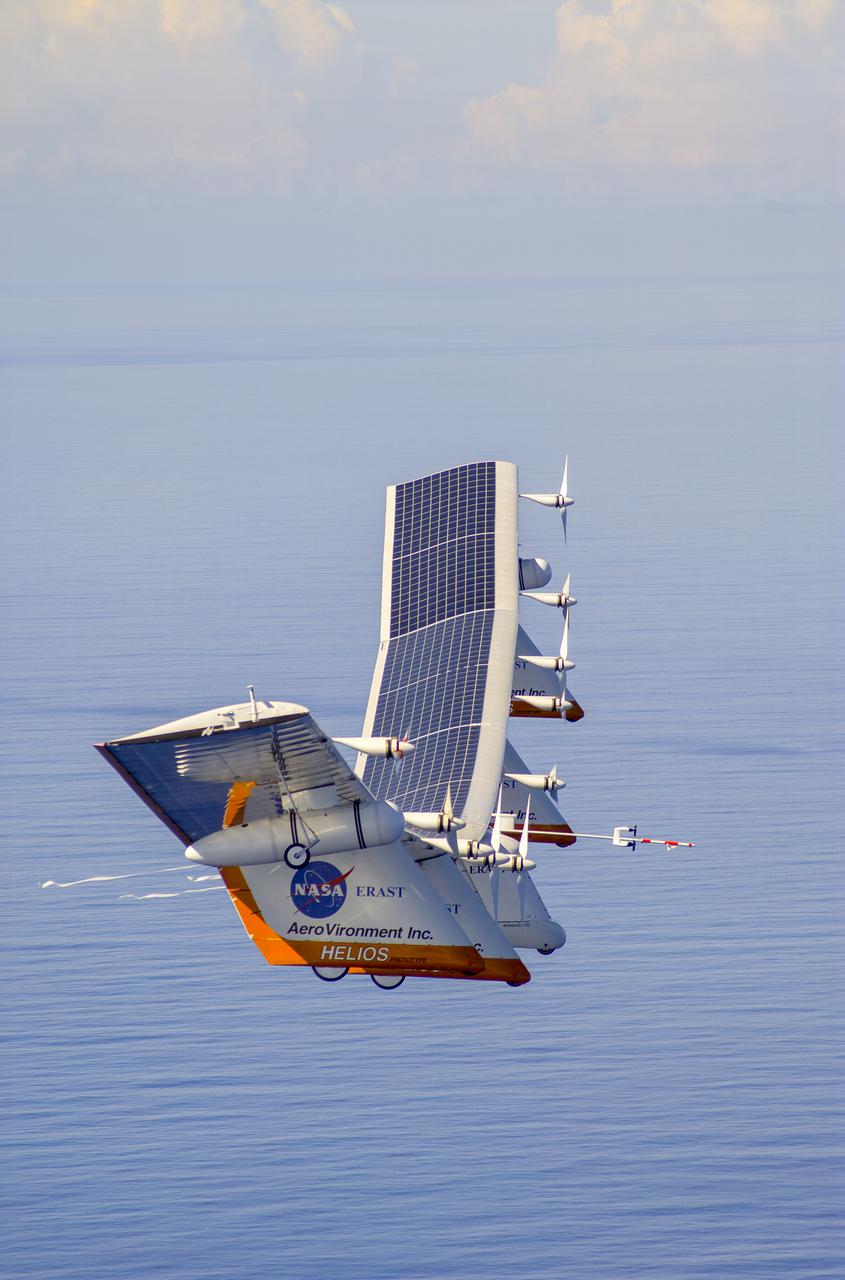
The first flight of a large aircraft to be powered by electric fuel cells began with a takeoff at 8:43 a.m. HST today from the Hawaiian island of Kauai. The Helios Prototype flying wing, built by AeroVironment, Inc., of Monrovia, Calif., as part of NASA's Environmental Research Aircraft and Sensor Technology (ERAST) program, used solar panels to power its 10 electric motors for takeoff and during daylight portions of its planned 20-hour shakedown flight. As sunlight diminishes, Helios will switch to a fuel cell system to continue flight into the night. The takeoff set the stage for a two-day Helios endurance flight in the stratosphere planned for mid-July. The Helios wing, spanning 247 feet and weighing about 2,400 pounds, is giving NASA and industry engineers confidence that remotely piloted aircraft will be able to stay aloft for weeks at a time, providing environmental monitoring capabilities and telecommunications relay services. Helios is an all-electric airplane. In addition to being non-polluting, Helios can fly above storms, and use the power of the sun to stay aloft during daylight. Key to the success of this type of aircraft is the ability to fly in darkness, using fuel cells when sunlight cannot furnish energy. Helios flew over the Navy's Pacific Missile Range Facility where favorable sun exposure and test ranges closed to other air traffic benefited the NASA research effort. In 2003 the aircraft was lost to a crash.
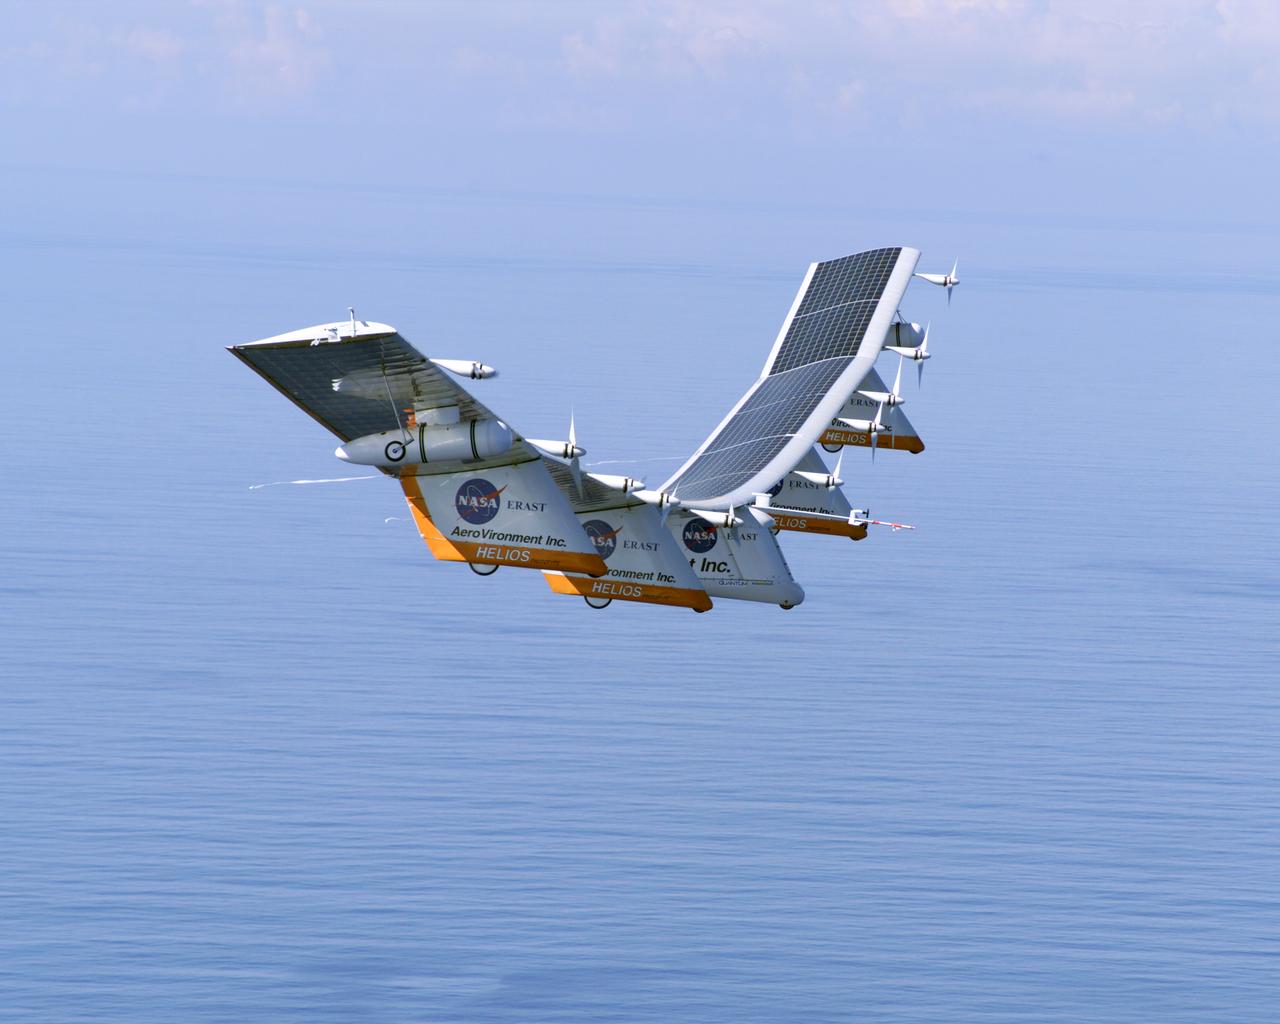
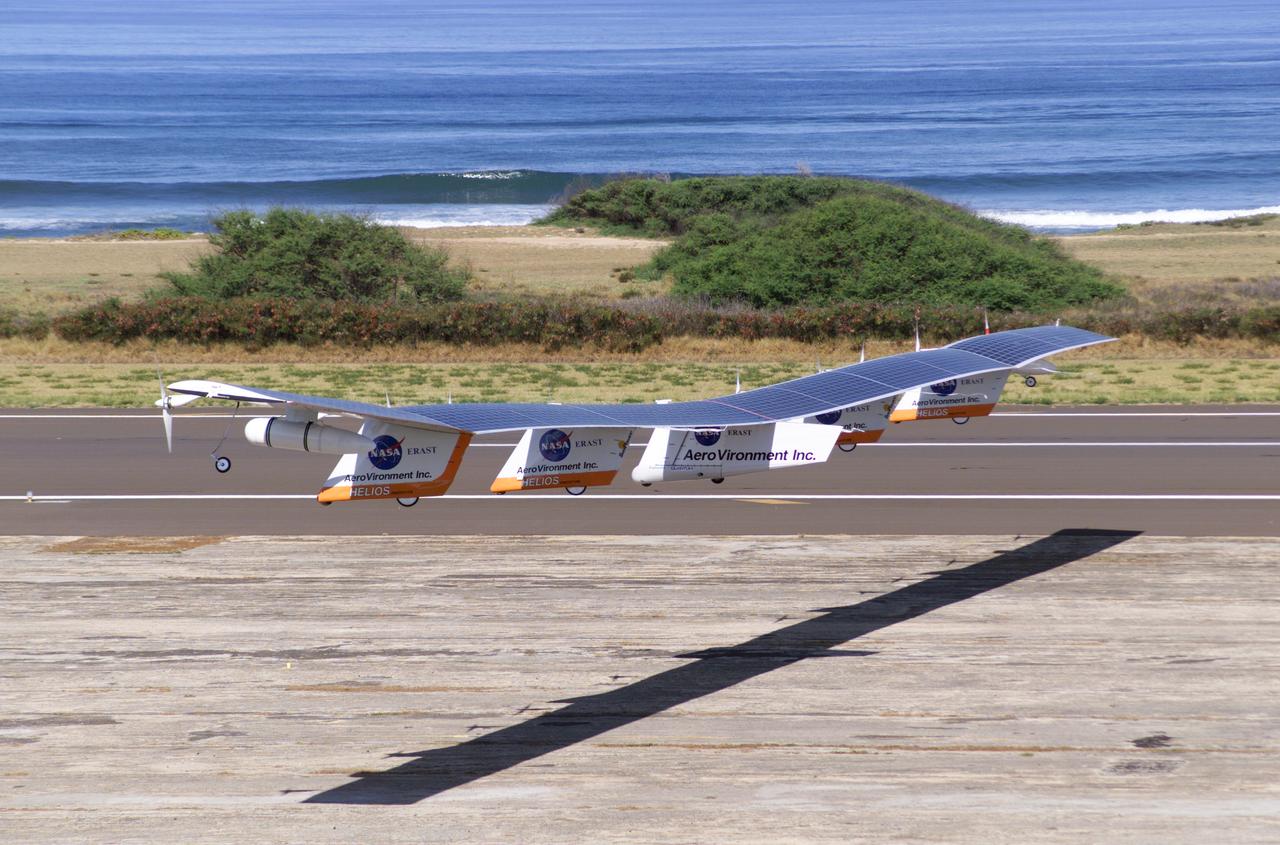
The first flight of a large aircraft to be powered by electric fuel cells began with a takeoff at 8:43 a.m. HST today from the Hawaiian island of Kauai. The Helios Prototype flying wing, built by AeroVironment, Inc., of Monrovia, Calif., as part of NASA's Environmental Research Aircraft and Sensor Technology (ERAST) program, used solar panels to power its 10 electric motors for takeoff and during daylight portions of its planned 20-hour shakedown flight. As sunlight diminishes, Helios will switch to a fuel cell system to continue flight into the night. The takeoff set the stage for a two-day Helios endurance flight in the stratosphere planned for mid-July. The Helios wing, spanning 247 feet and weighing about 2,400 pounds, is giving NASA and industry engineers confidence that remotely piloted aircraft will be able to stay aloft for weeks at a time, providing environmental monitoring capabilities and telecommunications relay services. Helios is an all-electric airplane. In addition to being non-polluting, Helios can fly above storms, and use the power of the sun to stay aloft during daylight. Key to the success of this type of aircraft is the ability to fly in darkness, using fuel cells when sunlight cannot furnish energy. Helios flew over the Navy's Pacific Missile Range Facility where favorable sun exposure and test ranges closed to other air traffic benefited the NASA research effort. In 2003 the aircraft was lost to a crash.
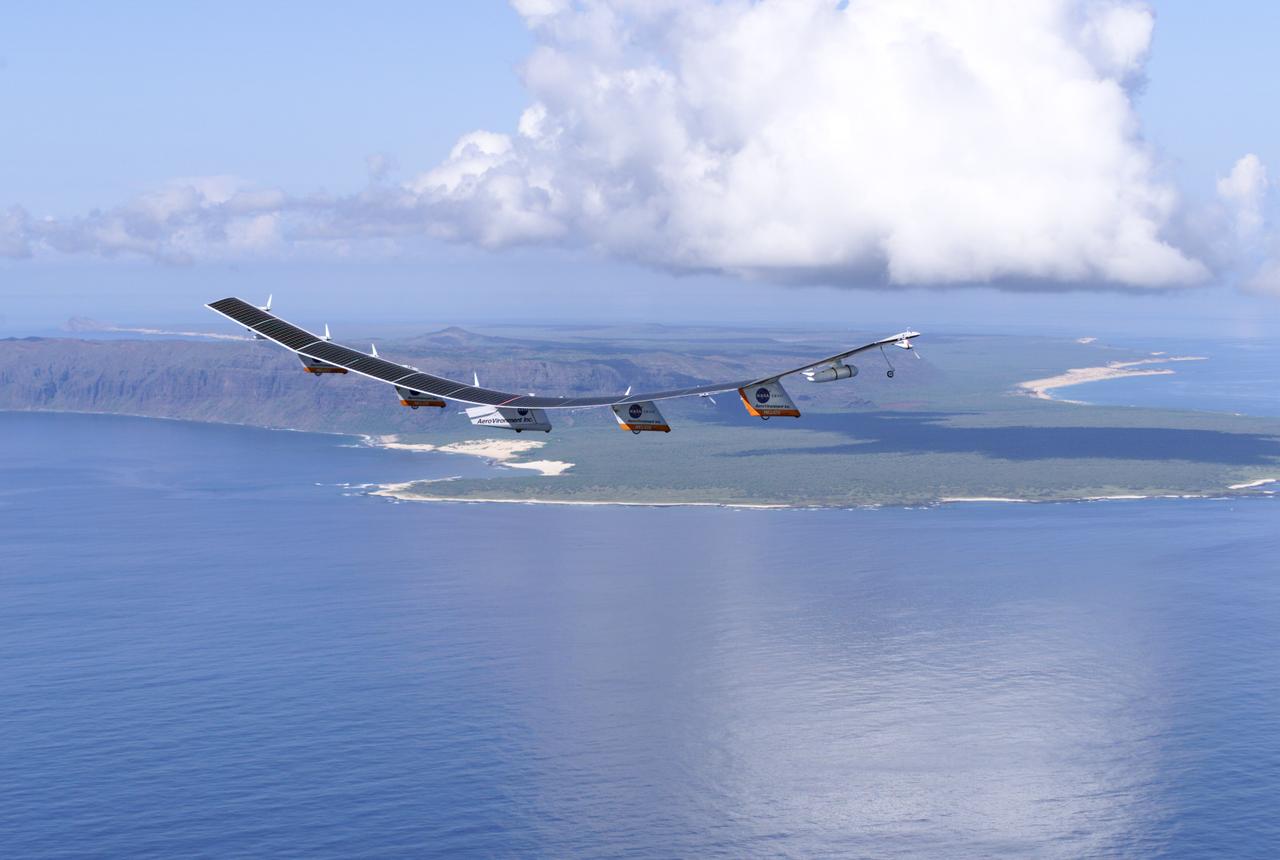
The first flight of a large aircraft to be powered by electric fuel cells began with a takeoff at 8:43 a.m. HST today from the Hawaiian island of Kauai. The Helios Prototype flying wing, built by AeroVironment, Inc., of Monrovia, Calif., as part of NASA's Environmental Research Aircraft and Sensor Technology (ERAST) program, used solar panels to power its 10 electric motors for takeoff and during daylight portions of its planned 20-hour shakedown flight. As sunlight diminishes, Helios will switch to a fuel cell system to continue flight into the night. The takeoff set the stage for a two-day Helios endurance flight in the stratosphere planned for mid-July. The Helios wing, spanning 247 feet and weighing about 2,400 pounds, is giving NASA and industry engineers confidence that remotely piloted aircraft will be able to stay aloft for weeks at a time, providing environmental monitoring capabilities and telecommunications relay services. Helios is an all-electric airplane. In addition to being non-polluting, Helios can fly above storms, and use the power of the sun to stay aloft during daylight. Key to the success of this type of aircraft is the ability to fly in darkness, using fuel cells when sunlight cannot furnish energy. Helios flew over the Navy's Pacific Missile Range Facility where favorable sun exposure and test ranges closed to other air traffic benefited the NASA research effort. In 2003 the aircraft was lost to a crash.
The first flight of a large aircraft to be powered by electric fuel cells began with a takeoff at 8:43 a.m. HST today from the Hawaiian island of Kauai. The Helios Prototype flying wing, built by AeroVironment, Inc., of Monrovia, Calif., as part of NASA's Environmental Research Aircraft and Sensor Technology (ERAST) program, used solar panels to power its 10 electric motors for takeoff and during daylight portions of its planned 20-hour shakedown flight. As sunlight diminishes, Helios will switch to a fuel cell system to continue flight into the night. The takeoff set the stage for a two-day Helios endurance flight in the stratosphere planned for mid-July. The Helios wing, spanning 247 feet and weighing about 2,400 pounds, gave NASA and industry engineers confidence that remotely piloted aircraft would be able to stay aloft for weeks at a time, providing environmental monitoring capabilities and telecommunications relay services. Helios was an all-electric airplane. In addition to being non-polluting, Helios flew above storms, and used the power of the sun to stay aloft during daylight. Key to the success of this type of aircraft was the ability to fly in darkness, using fuel cells when sunlight cannot furnish energy. Helios flew over the Navy's Pacific Missile Range Facility where favorable sun exposure and test ranges closed to other air traffic benefited the NASA research effort. In 2003 the aircraft was lost to a crash.
The first flight of a large aircraft to be powered by electric fuel cells began with a takeoff at 8:43 a.m. HST today from the Hawaiian island of Kauai. The Helios Prototype flying wing, built by AeroVironment, Inc., of Monrovia, Calif., as part of NASA's Environmental Research Aircraft and Sensor Technology (ERAST) program, used solar panels to power its 10 electric motors for takeoff and during daylight portions of its planned 20-hour shakedown flight. As sunlight diminishes, Helios will switch to a fuel cell system to continue flight into the night. The takeoff set the stage for a two-day Helios endurance flight in the stratosphere planned for mid-July. The Helios wing, spanning 247 feet and weighing about 2,400 pounds, is giving NASA and industry engineers confidence that remotely piloted aircraft will be able to stay aloft for weeks at a time, providing environmental monitoring capabilities and telecommunications relay services. Helios is an all-electric airplane. In addition to being non-polluting, Helios can fly above storms, and use the power of the sun to stay aloft during daylight. Key to the success of this type of aircraft is the ability to fly in darkness, using fuel cells when sunlight cannot furnish energy. Helios flew over the Navy's Pacific Missile Range Facility where favorable sun exposure and test ranges closed to other air traffic benefited the NASA research effort. In 2003 the aircraft was lost to a crash.
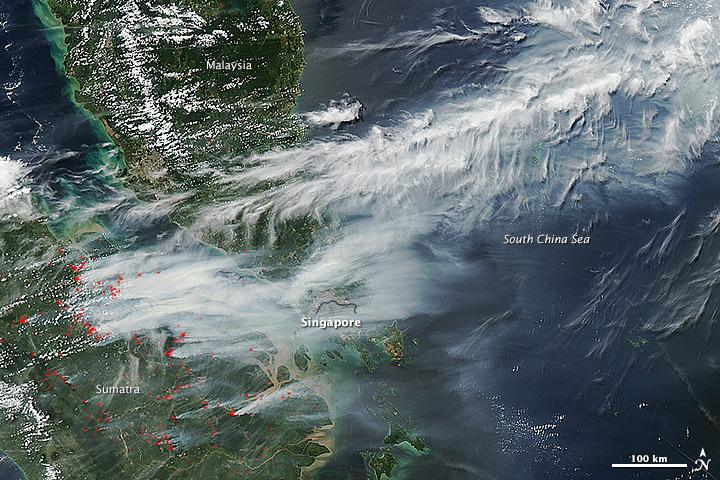
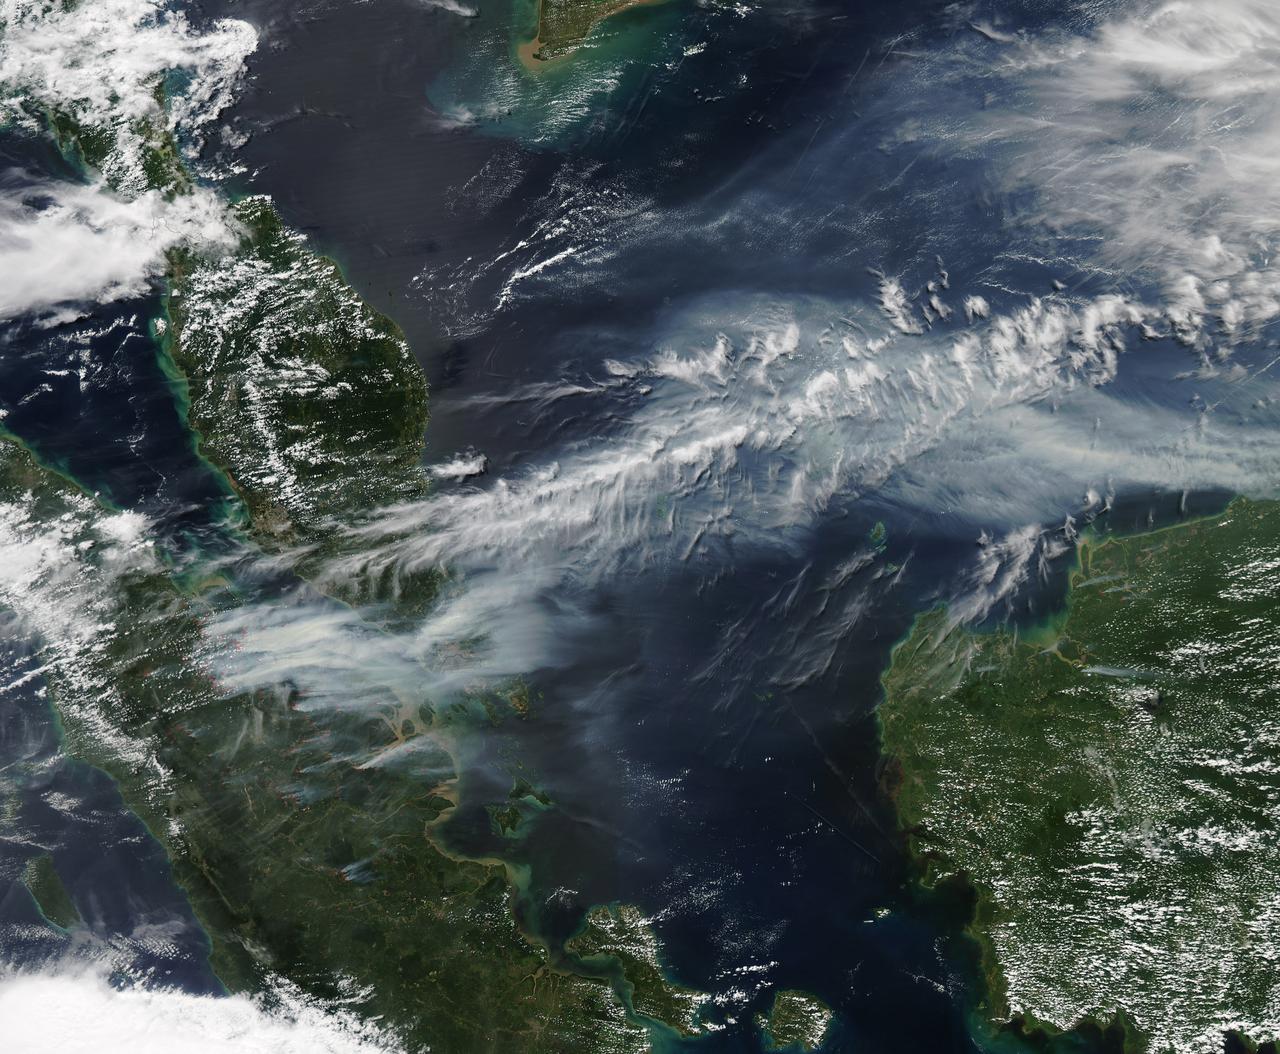
On June 19, 2013, NASA’s Aqua satellite captured a striking image of smoke billowing from illegal wildfires on the Indonesian island of Sumatra. The smoke blew east toward southern Malaysia and Singapore, and news media reported that thick clouds of haze had descended on Singapore, pushing pollution levels to record levels. Singapore’s primary measure of pollution, the Pollutant Standards Index (PSI)—a uniform measure of key pollutants similar to the Air Quality Index (AQI) used by the U.S. Environmental Protection Agency—spiked to 371 on the afternoon of June 20, 2013, the highest level ever recorded. The previous record occurred in 1997, when the index hit 226. Health experts consider any level above 300 to be “hazardous” to human health. Levels above 200 are considered “very unhealthy.” The image above was captured by the Moderate Resolution Imaging Spectroradiometer (MODIS), an instrument that observes the entire surface of Earth’s every 1 to 2 days. The image was captured during the afternoon at 6:30 UTC (2:30 p.m. local time). Though local laws prohibit it, farmers in Sumatra often burn forests during the dry season to prepare soil for new crops. The BBC reported that Singapore’s Prime Minister Lee Hsien Loong warned that the haze could “easily last for several weeks and quite possibly longer until the dry season ends in Sumatra.” NASA image by Jeff Schmaltz, LANCE/EOSDIS Rapid Response. Caption by Adam Voiland. Credit: <b><a href="http://www.earthobservatory.nasa.gov/" rel="nofollow"> NASA Earth Observatory</a></b> Instrument: Aqua - MODIS <b><a href="http://www.nasa.gov/audience/formedia/features/MP_Photo_Guidelines.html" rel="nofollow">NASA image use policy.</a></b> <b><a href="http://www.nasa.gov/centers/goddard/home/index.html" rel="nofollow">NASA Goddard Space Flight Center</a></b> enables NASA’s mission through four scientific endeavors: Earth Science, Heliophysics, Solar System Exploration, and Astrophysics. Goddard plays a leading role in NASA’s accomplishments by contributing compelling scientific knowledge to advance the Agency’s mission. <b>Follow us on <a href="http://twitter.com/NASA_GoddardPix" rel="nofollow">Twitter</a></b> <b>Like us on <a href="http://www.facebook.com/pages/Greenbelt-MD/NASA-Goddard/395013845897?ref=tsd" rel="nofollow">Facebook</a></b> <b>Find us on <a href="http://instagram.com/nasagoddard?vm=grid" rel="nofollow">Instagram</a></b>
On June 19, 2013, NASA’s Aqua satellite captured a striking image of smoke billowing from illegal wildfires on the Indonesian island of Sumatra. The smoke blew east toward southern Malaysia and Singapore, and news media reported that thick clouds of haze had descended on Singapore, pushing pollution levels to record levels. Singapore’s primary measure of pollution, the Pollutant Standards Index (PSI)—a uniform measure of key pollutants similar to the Air Quality Index (AQI) used by the U.S. Environmental Protection Agency—spiked to 371 on the afternoon of June 20, 2013, the highest level ever recorded. The previous record occurred in 1997, when the index hit 226. Health experts consider any level above 300 to be “hazardous” to human health. Levels above 200 are considered “very unhealthy.” The image above was captured by the Moderate Resolution Imaging Spectroradiometer (MODIS), an instrument that observes the entire surface of Earth’s every 1 to 2 days. The image was captured during the afternoon at 6:30 UTC (2:30 p.m. local time). Though local laws prohibit it, farmers in Sumatra often burn forests during the dry season to prepare soil for new crops. The BBC reported that Singapore’s Prime Minister Lee Hsien Loong warned that the haze could “easily last for several weeks and quite possibly longer until the dry season ends in Sumatra.” NASA image by Jeff Schmaltz, LANCE/EOSDIS Rapid Response. Caption by Adam Voiland. Credit: <b><a href="http://www.earthobservatory.nasa.gov/" rel="nofollow"> NASA Earth Observatory</a></b> Instrument: Aqua - MODIS <b><a href="http://www.nasa.gov/audience/formedia/features/MP_Photo_Guidelines.html" rel="nofollow">NASA image use policy.</a></b> <b><a href="http://www.nasa.gov/centers/goddard/home/index.html" rel="nofollow">NASA Goddard Space Flight Center</a></b> enables NASA’s mission through four scientific endeavors: Earth Science, Heliophysics, Solar System Exploration, and Astrophysics. Goddard plays a leading role in NASA’s accomplishments by contributing compelling scientific knowledge to advance the Agency’s mission. <b>Follow us on <a href="http://twitter.com/NASA_GoddardPix" rel="nofollow">Twitter</a></b> <b>Like us on <a href="http://www.facebook.com/pages/Greenbelt-MD/NASA-Goddard/395013845897?ref=tsd" rel="nofollow">Facebook</a></b> <b>Find us on <a href="http://instagram.com/nasagoddard?vm=grid" rel="nofollow">Instagram</a></b>
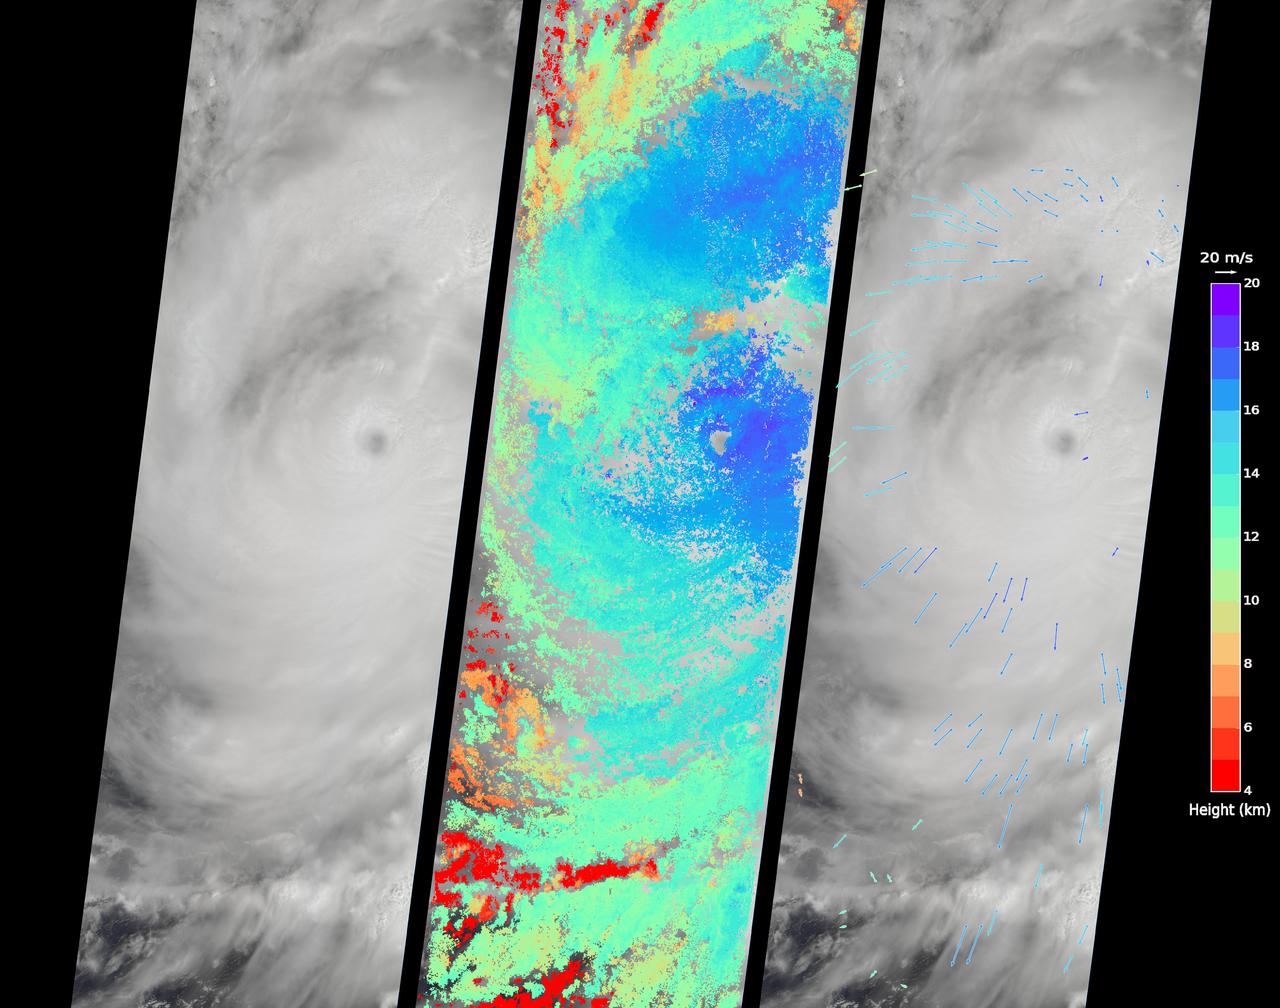
On Sept. 14, 2016, the eye of Super Typhoon Meranti passed just south of Taiwan. The enormous storm, classified as a Category 5 typhoon at the time, still caused much disruption on the island. Nearly 500,000 homes lost power, schools were closed, and most flights were cancelled. Maximum wind speeds were 180 miles per hour (290 kilometers per hour) as the storm passed, and more than 25 inches (64 centimeters) of rain fell on some areas of the country. However, the storm did not pass over Taiwan's mountainous landscape, which would have weakened it. That means it will remain strong as it heads toward mainland China, unlike Super Typhoon Nepartak in July, which weakened from a Category 5 typhoon to a tropical storm after crossing Taiwan. Meranti is currently maintaining Category 4 strength and is expected to make landfall near Shantou, Guangdong province, on Thursday, September 15. The coast of China is more vulnerable to storm surges than Taiwan due to shallower coastal waters and recent rainfall. There is risk of substantial flooding. On Sept. 14, at 10:45 AM local time, the Multi-angle Imaging SpectroRadiometer (MISR) instrument aboard NASA's Terra satellite passed directly over the eye of Meranti. On the left is a natural-color image from MISR's nadir-pointing camera. At this time the eye of Meranti was just off the southern tip of Taiwan, which is invisible under the clouds. The coast of China is barely visible through the clouds in the upper left portion of the image. The small eye and dense high clouds are both markers of the storm's power. MISR's nine cameras, each pointed at a different angle, can be used to determine the heights of clouds based on geometric shifts among the nine images. The middle panel shows these stereo-derived cloud top heights superimposed on the natural color image. The clouds of the central core of Typhoon Meranti have heights ranging between 16 and 20 kilometers (10 and 12.5 miles). It takes about seven minutes for all nine cameras to image the same location on the ground, and wind velocity can be calculated from the motion of the clouds over this seven-minute period. The right panel plots these wind velocities as vectors which indicate both direction and speed. The length of the arrow corresponds to the wind speed, which can be compared to the reference 20 meters per second (45 miles per hour) arrow in the key. Hurricanes and typhoons in the Northern Hemisphere rotate counterclockwise due to the Earth's rotation, but these wind vectors mainly show motion outward from the eye at the storm tops. This is due to the fact that hurricanes draw in moist air at low altitudes, which then flows upwards and outwards around the eye reversing direction. These data were acquired during Terra orbit 88865. http://photojournal.jpl.nasa.gov/catalog/PIA17309
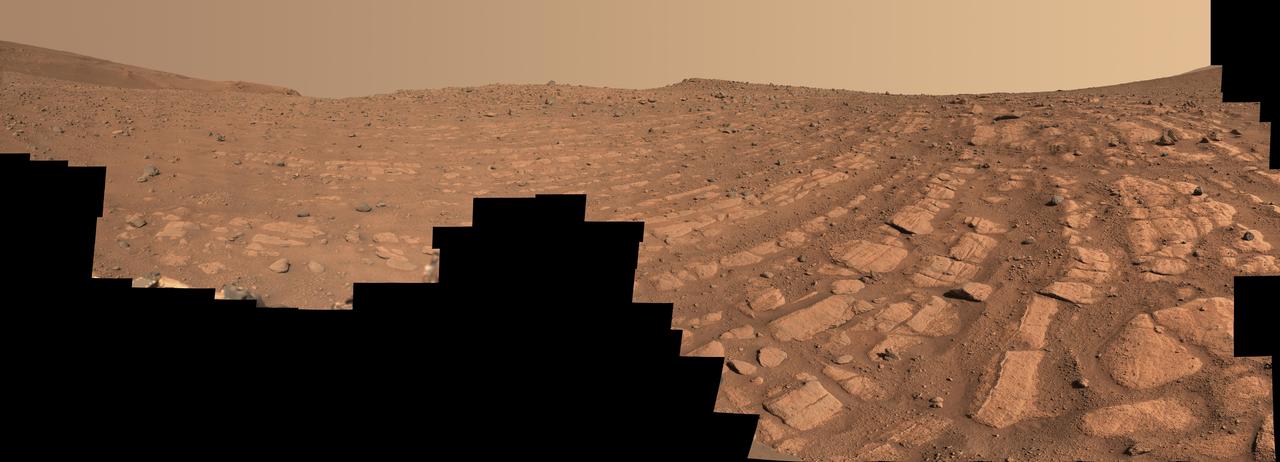
Scientists think that the bands of rocks seen in this image may have been formed by a very fast, deep river – the first of its kind evidence has been found for on Mars. NASA's Perseverance Mars rover captured this mosaic at a location nicknamed "Skrinkle Haven" using its Mastcam-Z camera between Feb. 28 and March 9, 2023 (between the 721st and 729th Martian days, or sols, of the mission). The mosaic is made up of 203 individual images that were stitched together after being sent back from Mars. This natural color view is approximately how the scene would appear to an average person if they were on Mars. "Skrinkle Haven" offers the clearest example of these curved rock layers – called "the curvilinear unit" – that had previously only been seen from space. Scientists are now debating what kind of powerfully flowing water formed those curves: a river like the Mississippi, which winds snakelike across the landscape, or a braided river like Nebraska's Platte, which forms small islands of sediment called sandbars. When viewed from the ground, the curved layers are arranged in rows, and appear to ripple out across the landscape. They could be the remnants of a river's banks that shifted over time – or the remnants of sandbars that formed in the river. The layers were likely much taller in the past; scientists suspect that after these piles of sediment turned to rock, they were sand-blasted by wind over the course of eons and carved down to their present size. Arizona State University leads the operations of the Mastcam-Z instrument, working in collaboration with Malin Space Science Systems in San Diego, on the design, fabrication, testing, and operation of the cameras, and in collaboration with the Niels Bohr Institute of the University of Copenhagen on the design, fabrication, and testing of the calibration targets. A key objective for Perseverance's mission on Mars is astrobiology, including the search for signs of ancient microbial life. The rover will characterize the planet's geology and past climate, pave the way for human exploration of the Red Planet, and be the first mission to collect and cache Martian rock and regolith (broken rock and dust). Subsequent NASA missions, in cooperation with ESA (European Space Agency), would send spacecraft to Mars to collect these sealed samples from the surface and return them to Earth for in-depth analysis. The Mars 2020 Perseverance mission is part of NASA's Moon to Mars exploration approach, which includes Artemis missions to the Moon that will help prepare for human exploration of the Red Planet. https://photojournal.jpl.nasa.gov/catalog/PIA25829

In May 2014, two new studies concluded that a section of the land-based West Antarctic ice sheet had reached a point of inevitable collapse. Meanwhile, fresh observations from September 2014 showed sea ice around Antarctica had reached its greatest extent since the late 1970s. To better understand such dynamic and dramatic differences in the region's land and sea ice, researchers are travelling south to Antarctica this month for the sixth campaign of NASA’s Operation IceBridge. The airborne campaign, which also flies each year over Greenland, makes annual surveys of the ice with instrumented research aircraft. Instruments range from lasers that map the elevation of the ice surface, radars that "see" below it, and downward looking cameras to provide a natural-color perspective. The Digital Mapping System (DMS) camera acquired the above photo during the mission’s first science flight on October 16, 2009. At the time of the image, the DC-8 aircraft was flying at an altitude of 515 meters (1,700 feet) over heavily compacted first-year sea ice along the edge of the Amundsen Sea. Since that first flight, much has been gleaned from IceBridge data. For example, images from an IceBridge flight in October 2011 revealed a massive crack running about 29 kilometers (18 miles) across the floating tongue of Antarctica's Pine Island Glacier. The crack ultimately led to a 725-square-kilometer (280-square-mile) iceberg. In 2012, IceBridge data was a key part of a new map of Antarctica called Bedmap2. By combining surface elevation, ice thickness, and bedrock topography, Bedmap2 gives a clearer picture of Antarctica from the ice surface down to the land surface. Discoveries have been made in Greenland, too, including the identification of a 740-kilometer-long (460-mile-long) mega canyon below the ice sheet. Repeated measurements of land and sea ice from aircraft extend the record of observations once made by NASA’s Ice, Cloud, and Land Elevation Satellite, or ICESat, which stopped functioning in 2009. In addition to extending the ICESat record, IceBridge also sets the stage for ICESat-2, which is scheduled for launch in 2017. Credit: IceBridge DMS L0 Raw Imagery courtesy of the Digital Mapping System (DMS) team/NASA DAAC at the National Snow and Ice Data Center More info: <a href="http://earthobservatory.nasa.gov/IOTD/view.php?id=84549" rel="nofollow">earthobservatory.nasa.gov/IOTD/view.php?id=84549</a> <a href="http://earthobservatory.nasa.gov/IOTD/view.php?id=84549" rel="nofollow">earthobservatory.nasa.gov/IOTD/view.php?id=84549</a>