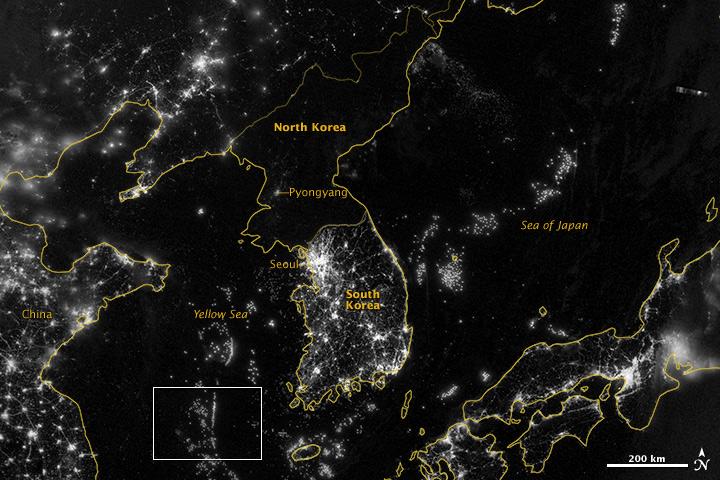
NASA image acquired September 24, 2012 City lights at night are a fairly reliable indicator of where people live. But this isn’t always the case, and the Korean Peninsula shows why. As of July 2012, South Korea’s population was estimated at roughly 49 million people, and North Korea’s population was estimated at about half that number. But where South Korea is gleaming with city lights, North Korea has hardly any lights at all—just a faint glimmer around Pyongyang. On September 24, 2012, the Visible Infrared Imaging Radiometer Suite (VIIRS) on the Suomi NPP satellite captured this nighttime view of the Korean Peninsula. This imagery is from the VIIRS “day-night band,” which detects light in a range of wavelengths from green to near-infrared and uses filtering techniques to observe signals such as gas flares, auroras, wildfires, city lights, and reflected moonlight. The wide-area image shows the Korean Peninsula, parts of China and Japan, the Yellow Sea, and the Sea of Japan. The white inset box encloses an area showing ship lights in the Yellow Sea. Many of the ships form a line, as if assembling along a watery border. Following the 1953 armistice ending the Korean War, per-capita income in South Korea rose to about 17 times the per-capital income level of North Korea, according to the U.S. Central Intelligence Agency. Worldwide, South Korea ranks 12th in electricity production, and 10th in electricity consumption, per 2011 estimates. North Korea ranks 71st in electricity production, and 73rd in electricity consumption, per 2009 estimates. NASA Earth Observatory image by Jesse Allen and Robert Simmon, using VIIRS Day-Night Band data from the Suomi National Polar-orbiting Partnership. Suomi NPP is the result of a partnership between NASA, the National Oceanic and Atmospheric Administration, and the Department of Defense. Caption by Michon Scott. Instrument: Suomi NPP - VIIRS Credit: <b><a href="http://www.earthobservatory.nasa.gov/" rel="nofollow"> NASA Earth Observatory</a></b> <b>Click here to view all of the <a href="http://earthobservatory.nasa.gov/Features/NightLights/" rel="nofollow"> Earth at Night 2012 images </a></b> <b>Click here to <a href="http://earthobservatory.nasa.gov/NaturalHazards/view.php?id=79796" rel="nofollow"> read more </a> about this image </b> <b><a href="http://www.nasa.gov/audience/formedia/features/MP_Photo_Guidelines.html" rel="nofollow">NASA image use policy.</a></b> <b><a href="http://www.nasa.gov/centers/goddard/home/index.html" rel="nofollow">NASA Goddard Space Flight Center</a></b> enables NASA’s mission through four scientific endeavors: Earth Science, Heliophysics, Solar System Exploration, and Astrophysics. Goddard plays a leading role in NASA’s accomplishments by contributing compelling scientific knowledge to advance the Agency’s mission. <b>Follow us on <a href="http://twitter.com/NASA_GoddardPix" rel="nofollow">Twitter</a></b> <b>Like us on <a href="http://www.facebook.com/pages/Greenbelt-MD/NASA-Goddard/395013845897?ref=tsd" rel="nofollow">Facebook</a></b> <b>Find us on <a href="http://instagram.com/nasagoddard?vm=grid" rel="nofollow">Instagram</a></b>
NASA image acquired September 24, 2012 City lights at night are a fairly reliable indicator of where people live. But this isn’t always the case, and the Korean Peninsula shows why. As of July 2012, South Korea’s population was estimated at roughly 49 million people, and North Korea’s population was estimated at about half that number. But where South Korea is gleaming with city lights, North Korea has hardly any lights at all—just a faint glimmer around Pyongyang. On September 24, 2012, the Visible Infrared Imaging Radiometer Suite (VIIRS) on the Suomi NPP satellite captured this nighttime view of the Korean Peninsula. This imagery is from the VIIRS “day-night band,” which detects light in a range of wavelengths from green to near-infrared and uses filtering techniques to observe signals such as gas flares, auroras, wildfires, city lights, and reflected moonlight. The wide-area image shows the Korean Peninsula, parts of China and Japan, the Yellow Sea, and the Sea of Japan. The white inset box encloses an area showing ship lights in the Yellow Sea. Many of the ships form a line, as if assembling along a watery border. Following the 1953 armistice ending the Korean War, per-capita income in South Korea rose to about 17 times the per-capital income level of North Korea, according to the U.S. Central Intelligence Agency. Worldwide, South Korea ranks 12th in electricity production, and 10th in electricity consumption, per 2011 estimates. North Korea ranks 71st in electricity production, and 73rd in electricity consumption, per 2009 estimates. NASA Earth Observatory image by Jesse Allen and Robert Simmon, using VIIRS Day-Night Band data from the Suomi National Polar-orbiting Partnership. Suomi NPP is the result of a partnership between NASA, the National Oceanic and Atmospheric Administration, and the Department of Defense. Caption by Michon Scott. Instrument: Suomi NPP - VIIRS Credit: <b><a href="http://www.earthobservatory.nasa.gov/" rel="nofollow"> NASA Earth Observatory</a></b> <b>Click here to view all of the <a href="http://earthobservatory.nasa.gov/Features/NightLights/" rel="nofollow"> Earth at Night 2012 images </a></b> <b>Click here to <a href="http://earthobservatory.nasa.gov/NaturalHazards/view.php?id=79796" rel="nofollow"> read more </a> about this image </b> <b><a href="http://www.nasa.gov/audience/formedia/features/MP_Photo_Guidelines.html" rel="nofollow">NASA image use policy.</a></b> <b><a href="http://www.nasa.gov/centers/goddard/home/index.html" rel="nofollow">NASA Goddard Space Flight Center</a></b> enables NASA’s mission through four scientific endeavors: Earth Science, Heliophysics, Solar System Exploration, and Astrophysics. Goddard plays a leading role in NASA’s accomplishments by contributing compelling scientific knowledge to advance the Agency’s mission. <b>Follow us on <a href="http://twitter.com/NASA_GoddardPix" rel="nofollow">Twitter</a></b> <b>Like us on <a href="http://www.facebook.com/pages/Greenbelt-MD/NASA-Goddard/395013845897?ref=tsd" rel="nofollow">Facebook</a></b> <b>Find us on <a href="http://instagram.com/nasagoddard?vm=grid" rel="nofollow">Instagram</a></b>
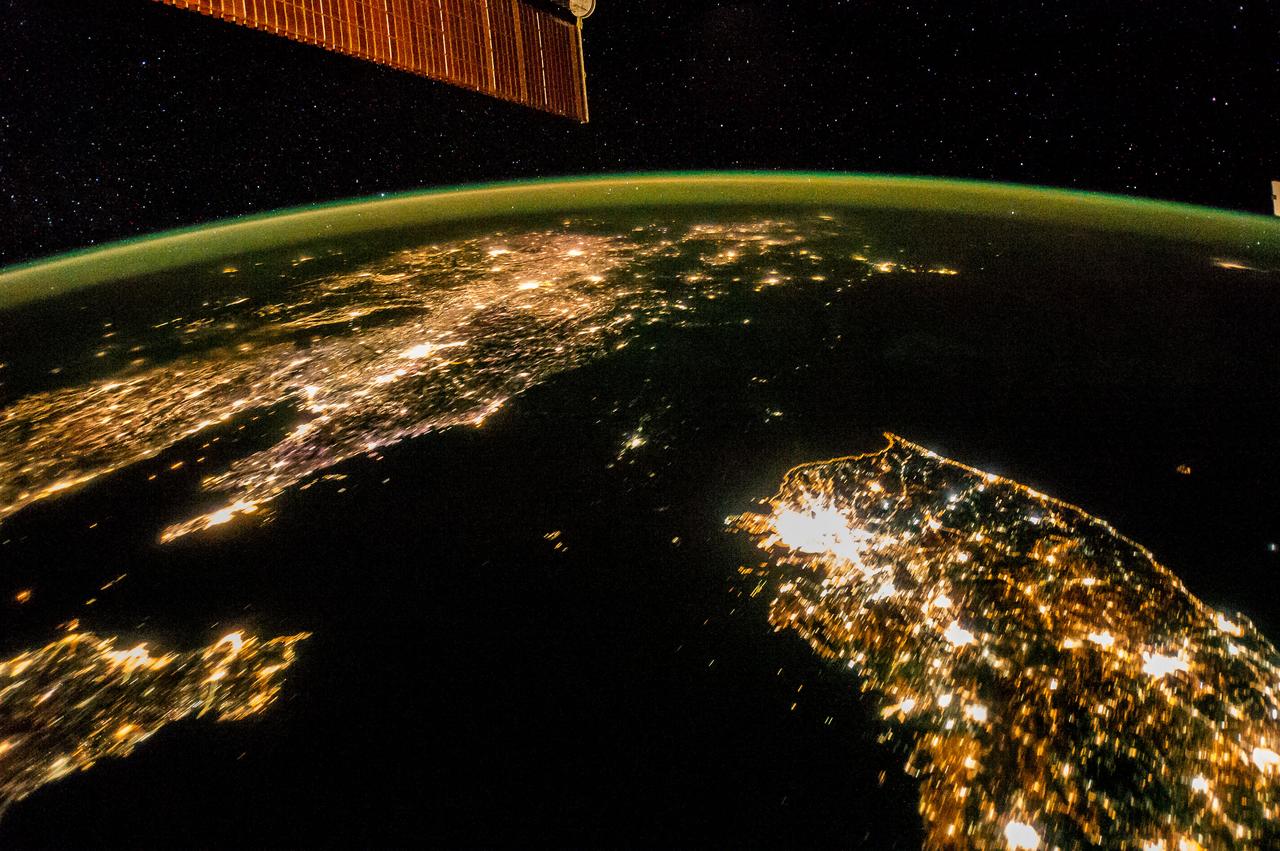
iss073e0824280 (Sept. 14, 2025) --- The well-lit border (center) between South Korea and the less-illuminated North Korea is framed by the moonlit Sea of Japan (bottom) and the Yellow Sea (top), which is dotted with the bright lights of fishing boats. These lights are used to attract nocturnal fish, including anchovies, mackerel, and squid. The International Space Station was orbiting 262 miles above the Bohai Sea at approximately 12:43 a.m. local time when this photograph was taken.
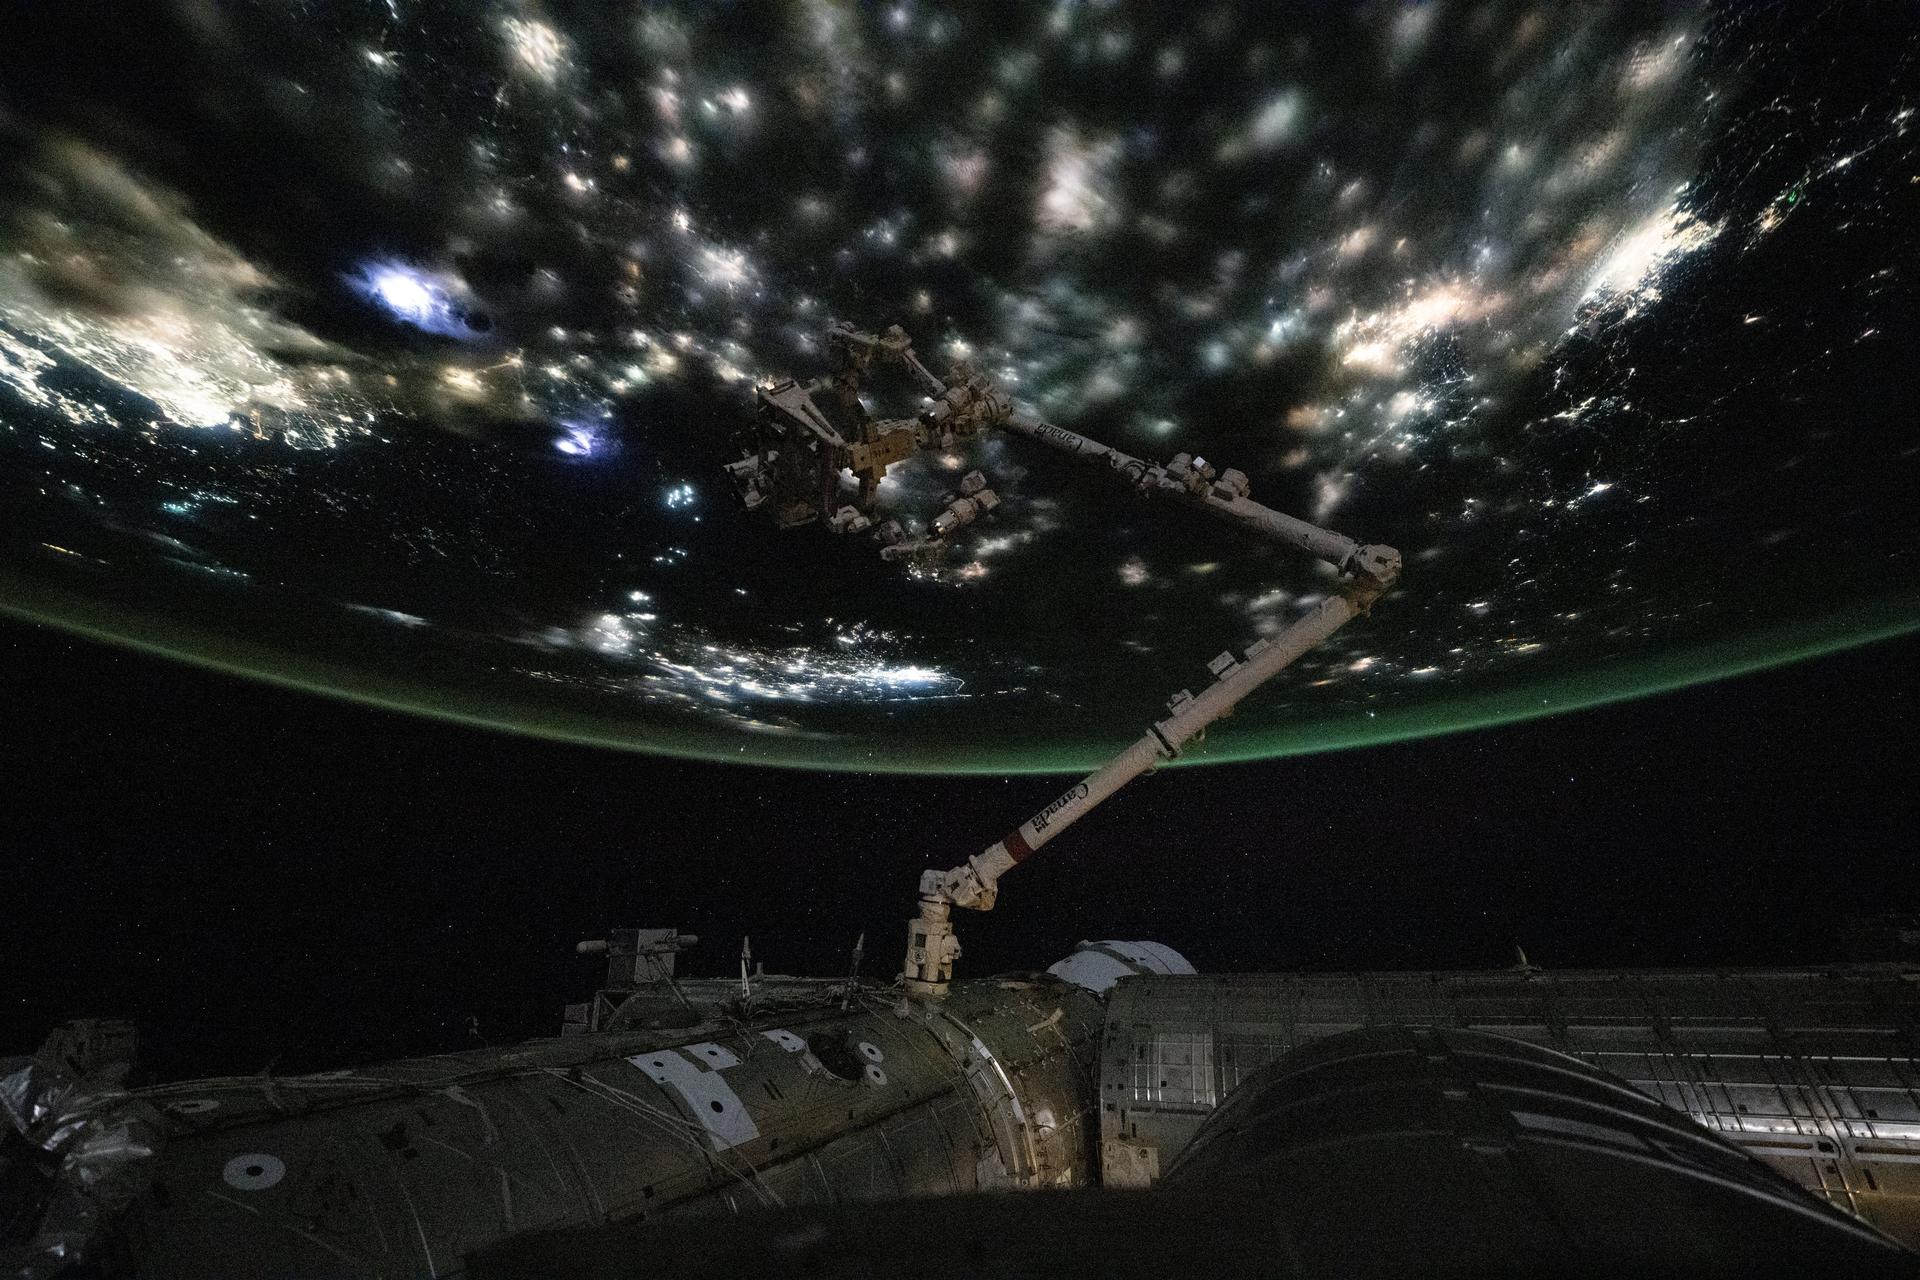
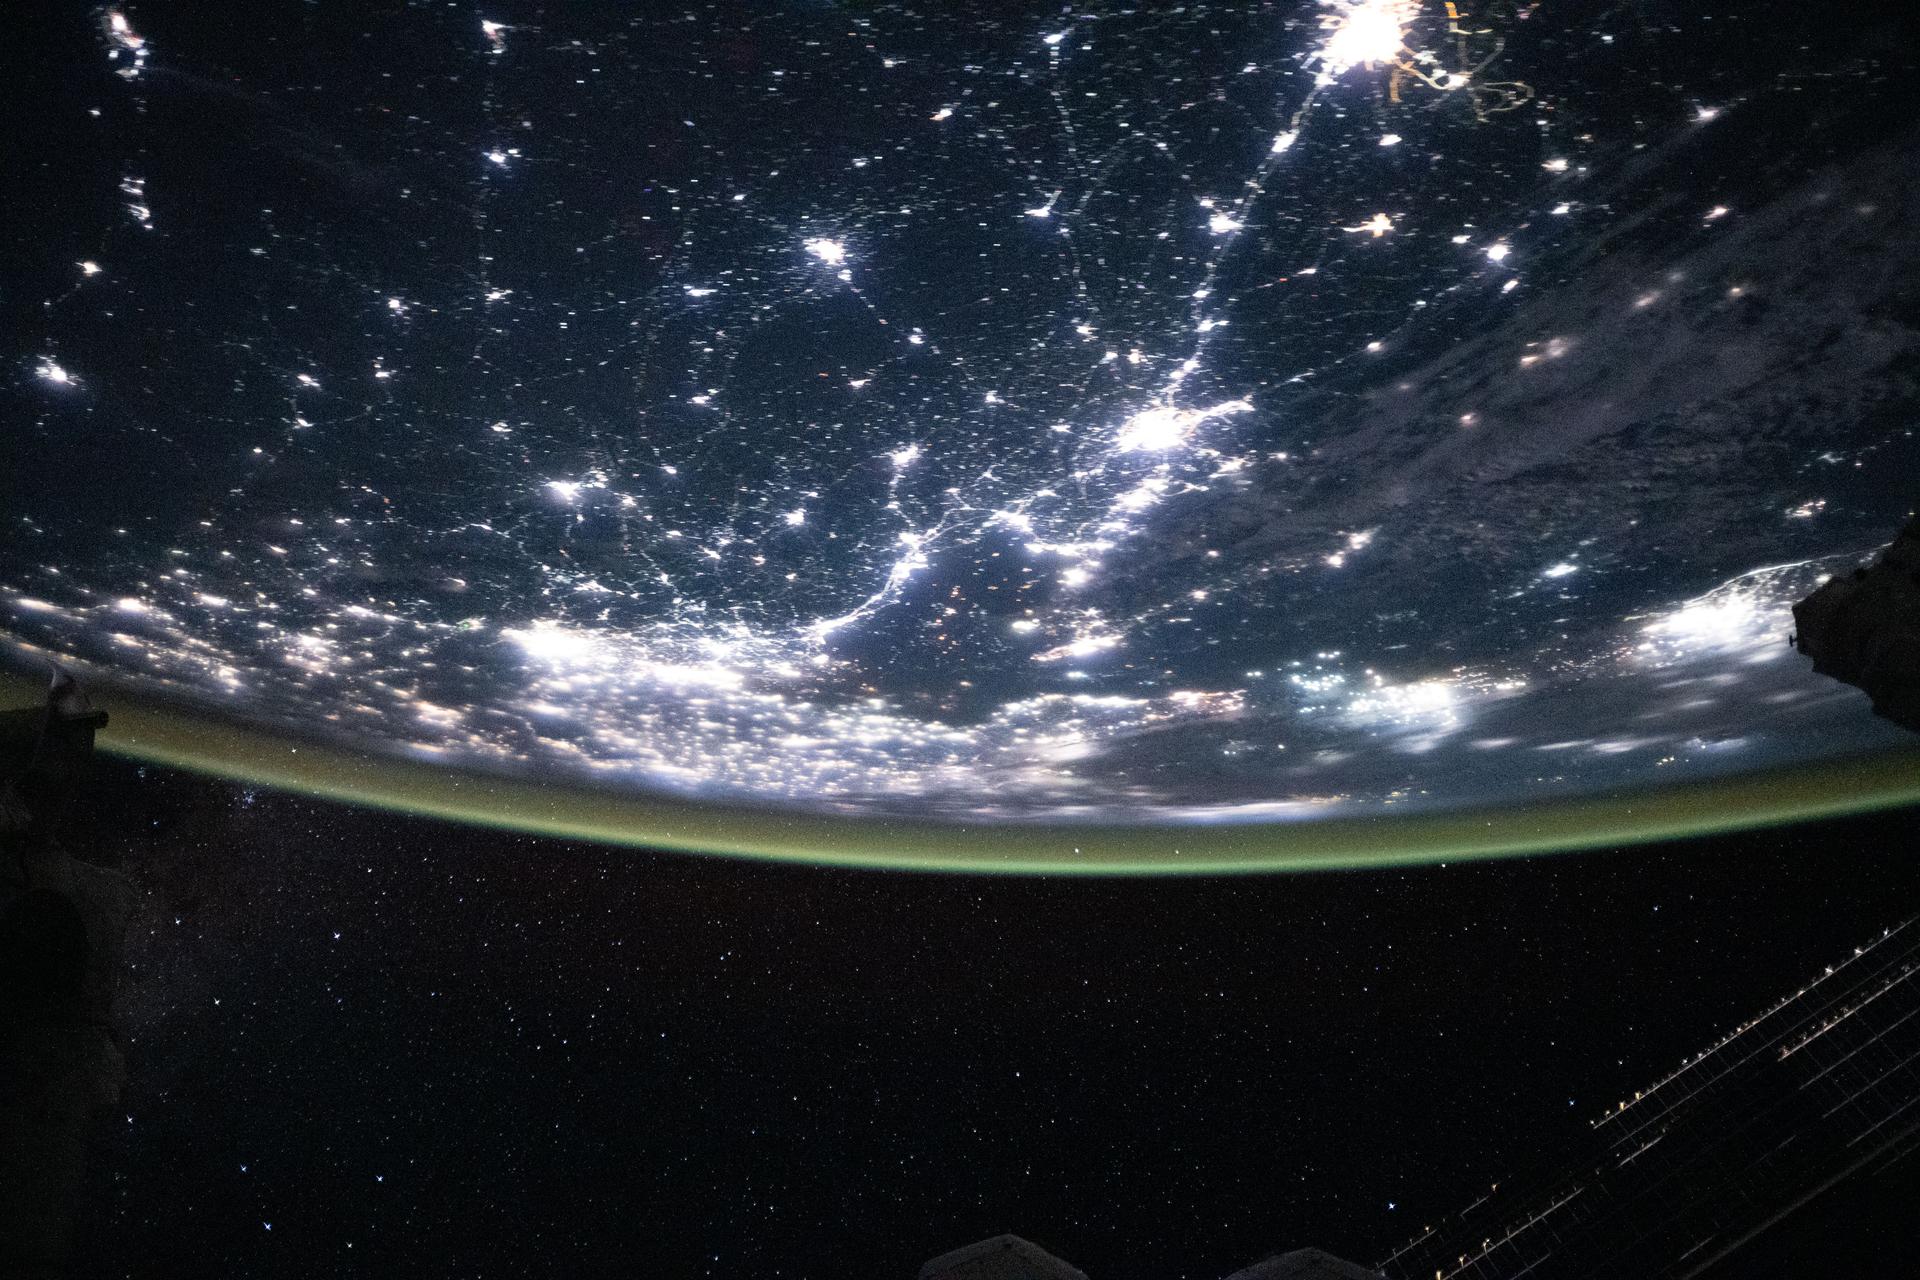
iss073e0742298 (Aug. 30, 2025) --- City lights beneath the clouds highlight the North China Plain near the Yellow Sea, where concentrated points of light mark fishing boats using illumination to attract anchovies, squid, sardines, and other species. Across the Yellow Sea, urban areas in South Korea are visible beneath a diffuse atmospheric glow near the horizon. In the foreground, the Canadarm2 robotic arm extends from a grapple fixture on the International Space Station's Harmony module.
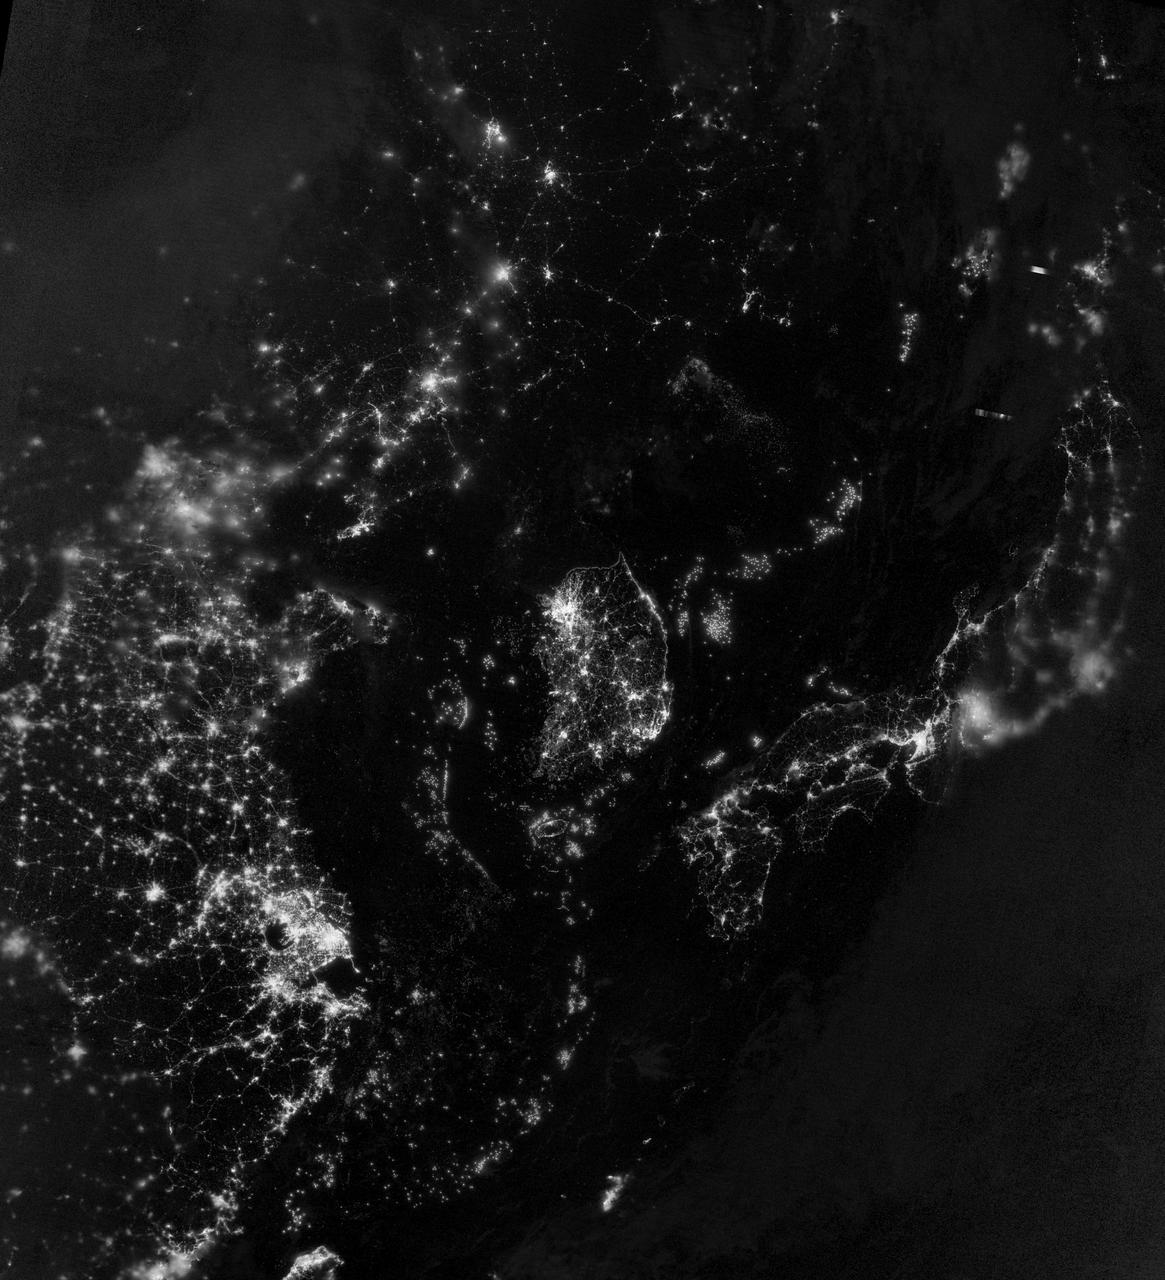
ISS038-E-038300 (30 Jan. 2014) --- Flying over East Asia, an Expedition 38 crew member on the International Space Station took this night image of the Korean Peninsula. Unlike daylight images, city lights at night illustrate dramatically the relative economic importance of cities, as gauged by relative size. In this north-looking view, it is immediately obvious that greater Seoul is a major city and that the port of Gunsan is minor by comparison. There are 25.6 million people in the Seoul metropolitan area-more than half of South Korea's citizens-while Gunsan's population is 280,000. North Korea is almost completely dark compared to neighboring South Korea and China. The darkened land appears as if it were a patch of water joining the Yellow Sea to the Sea of Japan. The capital city, Pyongyang, appears like a small island, despite a population of 3.26 million (as of 2008). The light emission from Pyongyang is equivalent to the smaller towns in South Korea. Coastlines are often very apparent in night imagery, as shown by South Korea's eastern shoreline. But the coast of North Korea is difficult to detect. These differences are illustrated in per capita power consumption in the two countries, with South Korea at 10,162 kilowatt hours and North Korea at 739 kilowatt hours.
iss073e0820756 (Sept. 14, 2025) --- The densely urbanized region surrounding the Bohai Sea (center) on China's east coast includes several major metropolitan areas, from Beijing (left center) to Changchun (top right), and Seoul, South Korea (far right). A yellow-green airglow blankets Earth's horizon in this image captured from the International Space Station as it orbited 263 miles above the surface at approximately 11:06 p.m. local time.
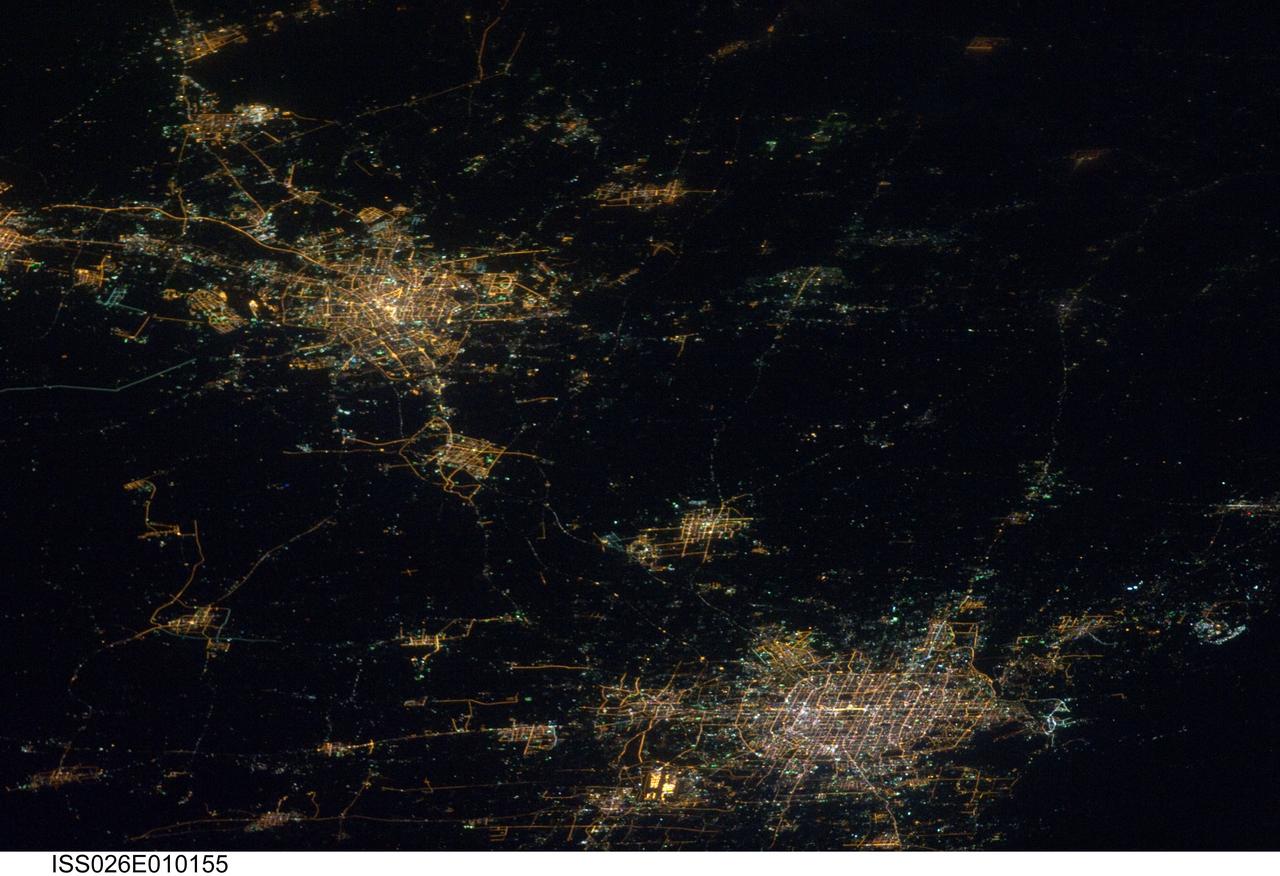
ISS026-E-010155 (14 Dec. 2010) --- Cities at night in northern China are featured in this image photographed by an Expedition 26 crew member on the International Space Station. This striking photograph features two of China’s most populous cities—Beijing and Tianjin—both located in the northern part of the country near the Bohai Gulf. The United Nations estimated 2010 population for the Beijing metropolitan area is approximately 12 million, with the population of the Tianjin metropolitan area estimated to be over 7 million. Taken at night time, the image dramatically indicates the developed extent of both metropolitan areas. The smaller city of Langfang, located midway between Beijing and Tianjin, also is clearly visible as are several other smaller developed areas to the northeast. The dark regions surrounding the well-lit urban areas are mainly agricultural fields, with wheat and corn being the major crops. Beijing (also known as Peking) is one of the recognized ancient capital cities—and the current capital—of the People’s Republic of China. The regular grid pattern of the city is clearly visible at lower upper right; concentric rings of major roadways around the city center have been added as the metropolitan area has expanded. Tianjin is a major trade center with connection to seaports on the Bohai Gulf. The city was established following the integration of the Grand Canal of China, a major artificial waterway extending from Beijing southwards to Hangzhou over a distance of 1,176 kilometers. This image was acquired by astronauts onboard the space station when it was located approximately 630 kilometers away (ground distance) over the Yellow Sea near the western coastline of North Korea. The flattened perspective of the urban areas is a result of the viewing angle and distance from the ISS. The city light patterns are very clear, indicating that there was little cloud cover or haze in the region at the time the image was taken.
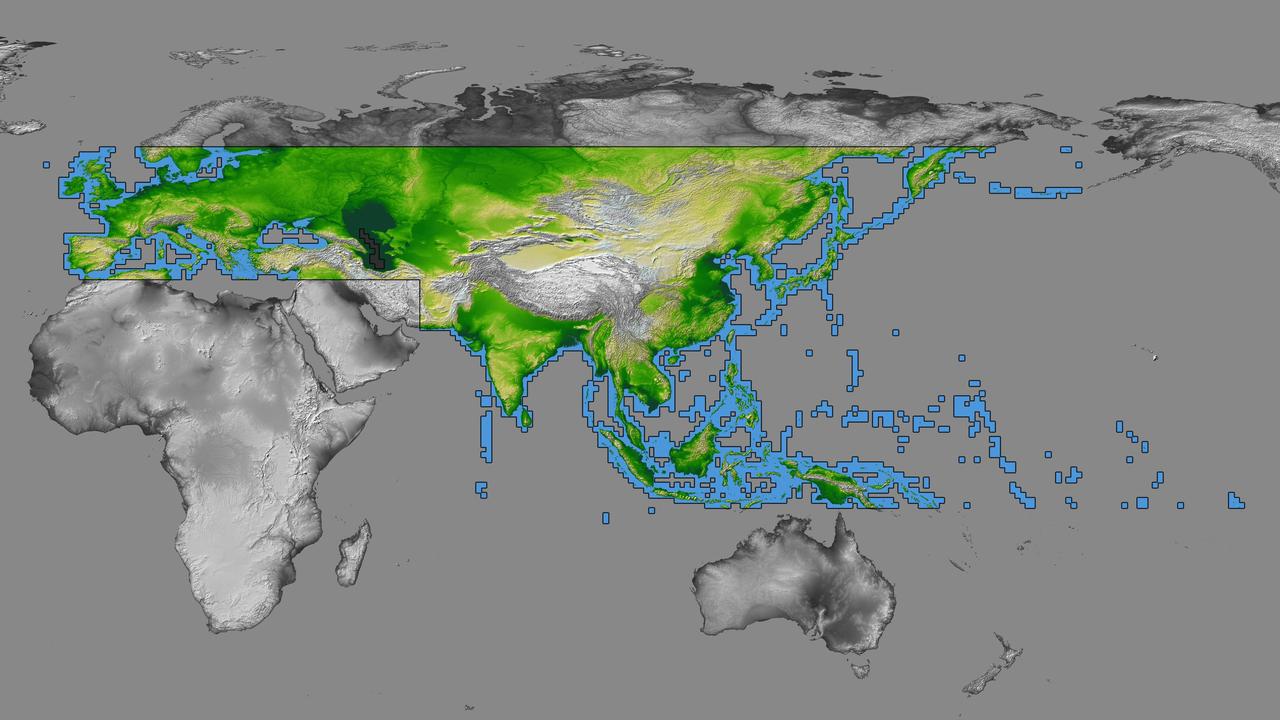
inal Caption Released with Image: The colored regions of this map show the extent of digital elevation data recently released by the Shuttle Radar Topography Mission (SRTM). This release includes data for most of Europe and Asia plus numerous islands in the Indian and Pacific Oceans. SRTM flew on board the Space Shuttle Endeavour in February 2000 and used an interferometric radar system to map the topography of Earth's landmass between latitudes 56 degrees south and 60 degrees north. The data were processed into geographic "tiles," each of which represents one by one degree of latitude and longitude. A degree of latitude measures 111 kilometers (69 miles) north-south, and a degree of longitude measures 111 kilometers or less east-west, decreasing away from the equator. The data are being released to the public on a continent-by-continent basis. This Eurasia segment includes 5,940 tiles, more than a third of the total data set. Previous releases covered North America and South America. Forthcoming releases will include Africa-Arabia and Australia plus an "Islands" release for those islands not included in the continental releases. Together these data releases constitute the world's first high-resolution, near-global elevation model. The resolution of the publicly released data is three arcseconds (1/1,200 of a degree of latitude and longitude), which is about 90 meters (295 feet). European coverage in the current data release stretches eastward from the British Isles and the Iberian Peninsula in the west, across the Alps and Carpathian Mountains, as well as the Northern European Plain, to the Ural and Caucasus Mountains bordering Asia. The Asian coverage includes a great diversity of landforms, including the Tibetan Plateau, Tarin Basin, Mongolian Plateau, and the mountains surrounding Lake Baikal, the world's deepest lake. Mt. Everest in the Himalayas, at 8,848 meters (29,029 feet) is the world's highest mountain. From India's Deccan Plateau, to Southeast Asia, coastal China, and Korea, various landforms place constraints upon land use planning for a great population. Volcanoes in the East Indies, the Philippines, Japan, and the Kamchatka Peninsula form the western part of the "Ring of Fire" around the Pacific Ocean. Many of these regions were previously very poorly mapped due to persistent cloud cover or the inaccessibility of the terrain. Digital elevation data, such as provided by SRTM, are particularly in high demand by scientists studying earthquakes, volcanism, and erosion patterns for use in mapping and modeling hazards to human habitation. But the shape of Earth's surface affects nearly every natural process and human endeavor that occurs there, so elevation data are used in a wide range of applications. In this index map color-coding is directly related to topographic height, with green at the lower elevations, rising through yellow and tan, to white at the highest elevations. The large, very dark green feature in western Asia is the Caspian Sea, which is below sea level. Blue areas on the map represent water within the mapped tiles, each of which includes shorelines or islands. http://photojournal.jpl.nasa.gov/catalog/PIA03398