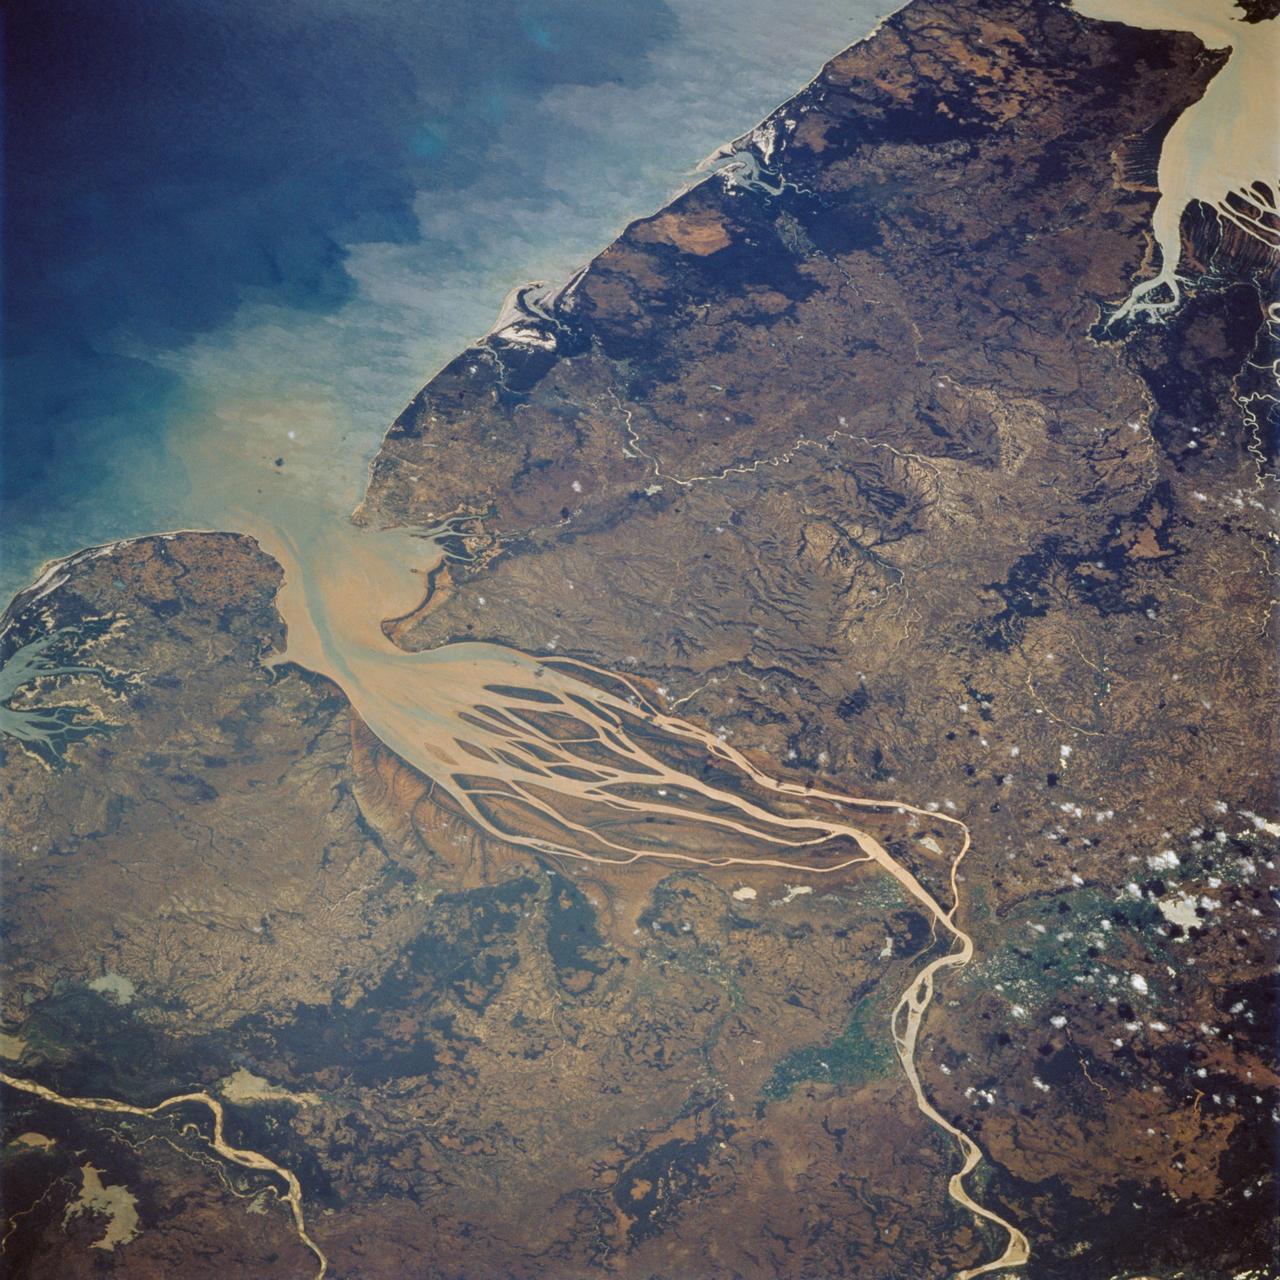
51F-37-059 (29 July-6 Aug 1985) --- The mouth of the Betsiboka River in northwest Madagascar is seen. The estuary at Mahajanga is being quickly filled with river borne sediments due to poor land management, mainly deforest-action in the river basin. Changes in the estuary can be seen from one Shuttle flight to the next.
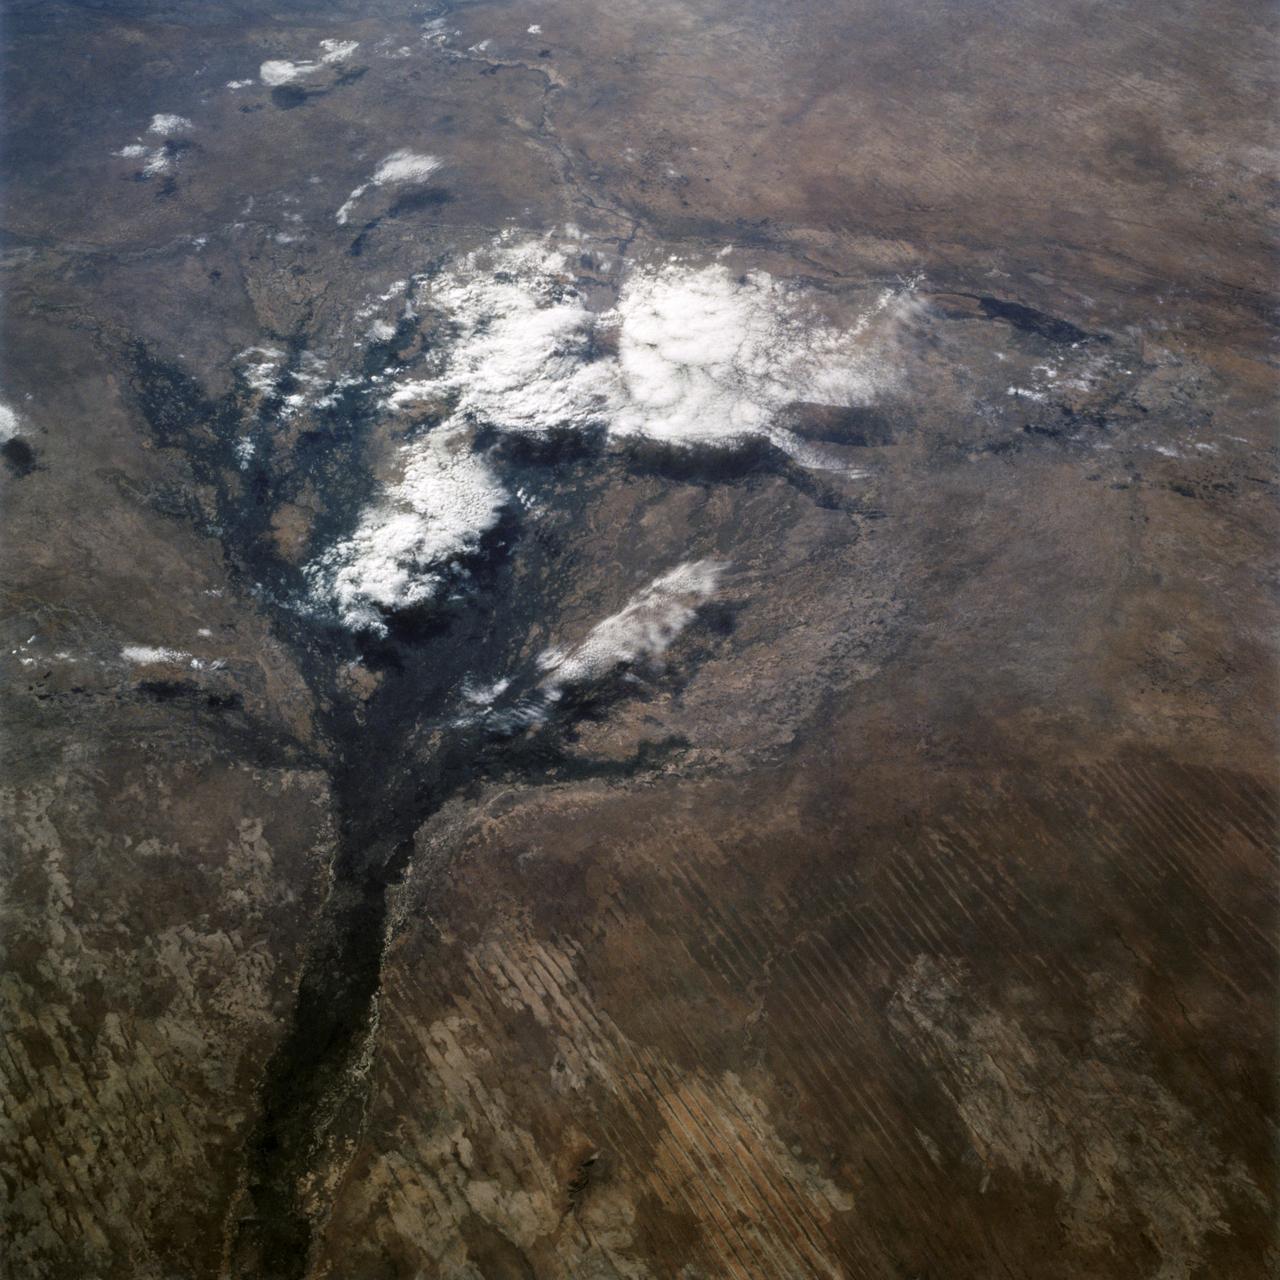
STS066-122-091 (3-14 Nov. 1994) --- This November 1994 view looking south-southeast shows clouds over the Okavango Delta area of northern Botswana. The Okavango is one of the wilder, less spoiled regions of Africa. The area still supports great herds of wild animals such as elephant, zebra and the cape buffalo. Despite conservation efforts from the stable government of Botswana, delta habitats are pressured. The Okavango River (lower left of view) brings water from the high, wet plateaus of Angola into the Kalahari Desert, and enormous inland basin. As a result of a series of small faults (upper center of the view) related to the African Rift System, the river is dammed up in the form of swampy inland delta. Here, water is consumed by evaporation, infiltration, and the swamp forests. Late summer floods take six months to slowly penetrate the 160 kilometer (95 miles) to the other end of the Delta. The visual patterns of the area are strongly linear: straight sand dunes occur in many places and can be seen across the bottom portion of the photograph. Numerous brush-fire scars produce a complex, straight-edged pattern over much of the lower portion of this view. Lake Ngami (upper right of view) was once permanently full as late as the middle 1800's. Changes in the climate of the area over the last 100 years has changed the size and shape of the inland delta.
In this panoramic view of the Okavango Swamp, Botswana, (19.0S, 22.0E), the Okavango River, seen in sunglint, flows into a topographic trough to form an inland delta. Water, trapped in the meandering delta distributaries is evaporated or transpired by vegetation. In Angola to the north, the many fires of the seasonal burning of savannah vegetation for land clearing, in preparation for agriculture, has filled the atmosphere with haze and smoke.
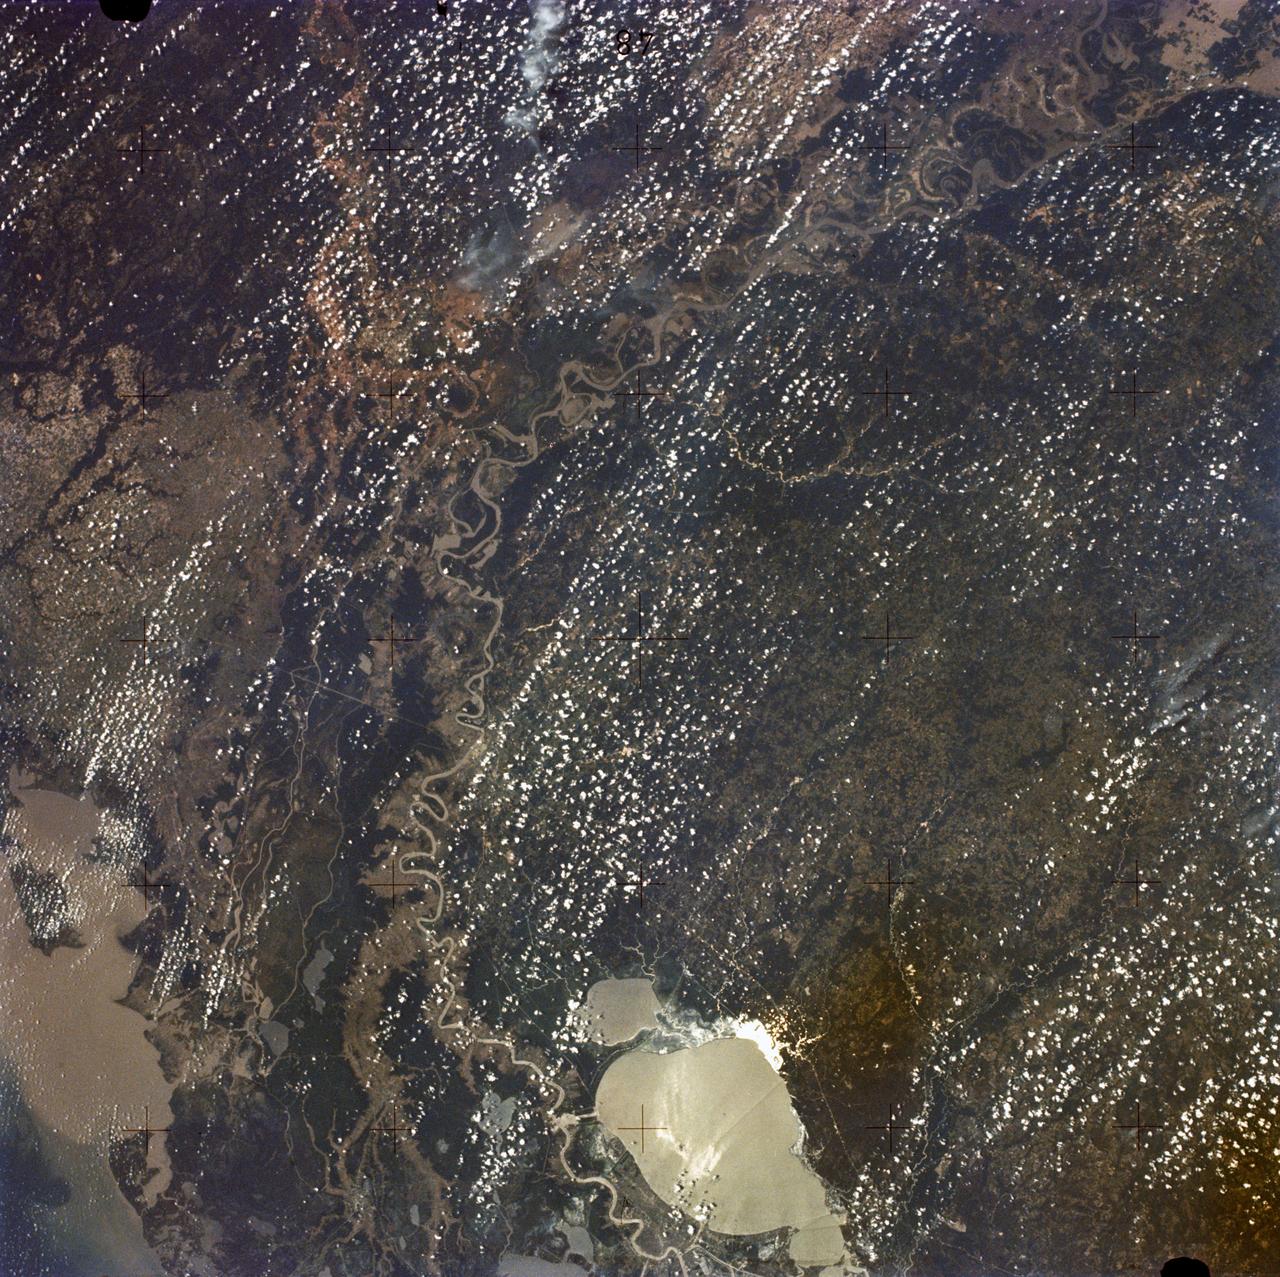
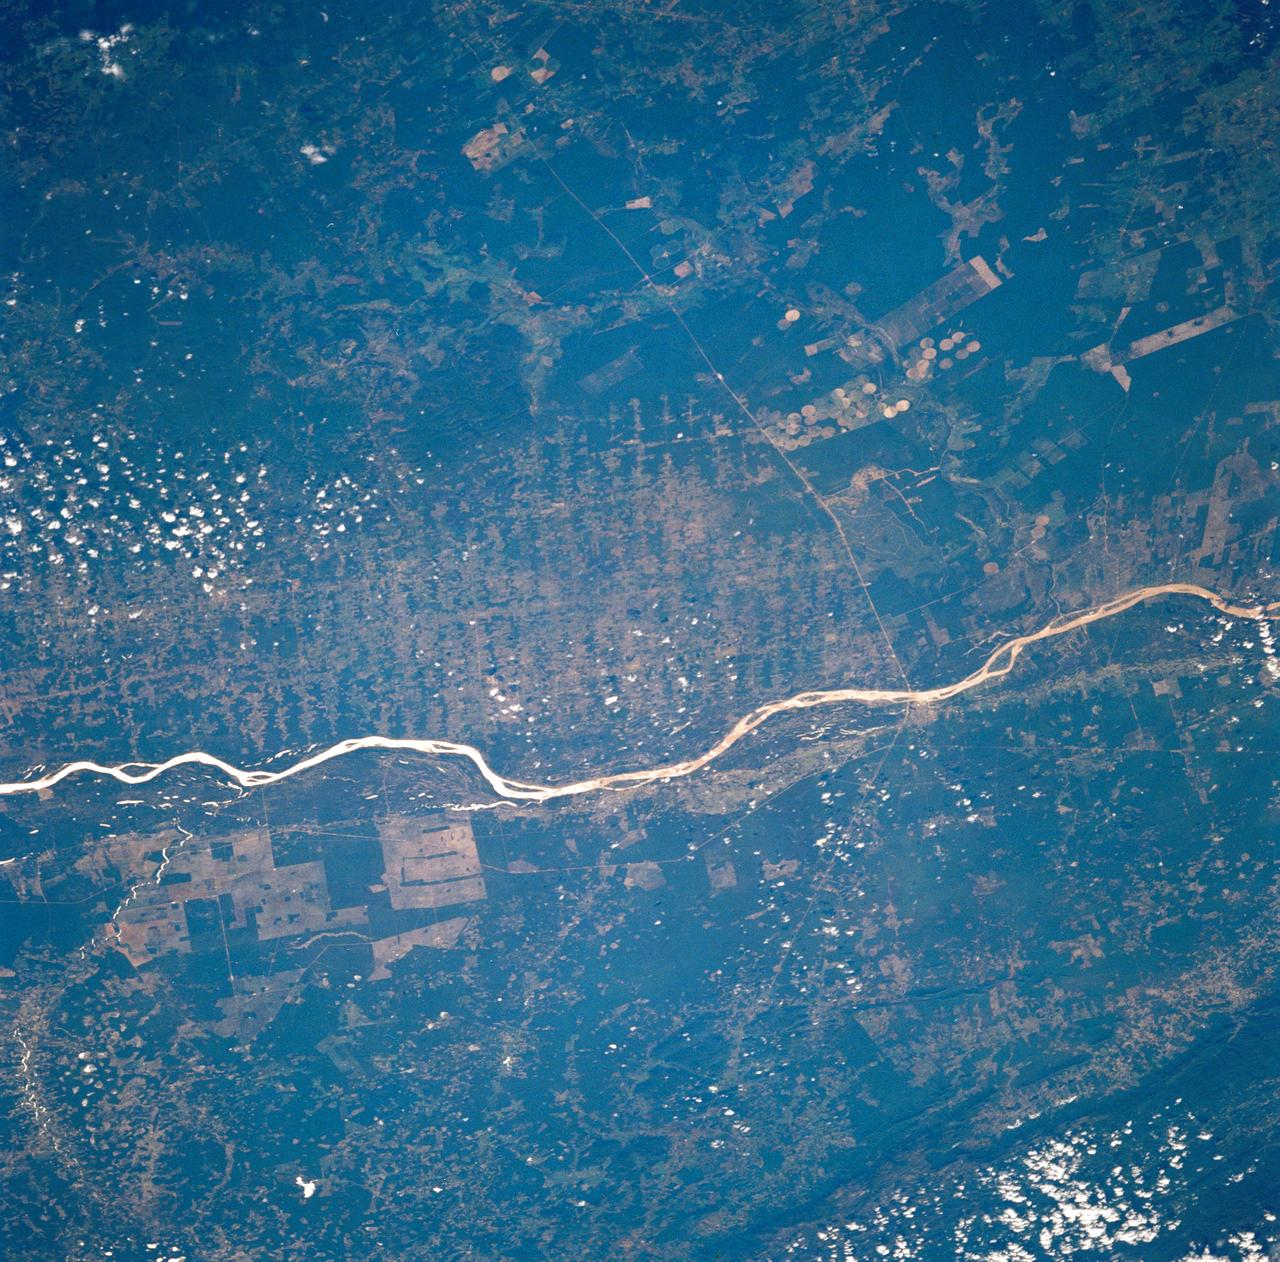
SL2-05-397 (22 June 1973) --- New Orleans, Louisiana, Mississippi River, and Lake Pontchartrain (31.0N, 91.0W) can all be seen in this single detailed view. The marshlands of the Atchafalaya Basin, previously the main drainage way for the Mississippi River, can be seen to be partially silted as a result of sediments. The long narrow field patterns fronting on the river is called the "Long Lot" system of equal land distribution based on the French Napoleonic Civil Code. Photo credit: NASA
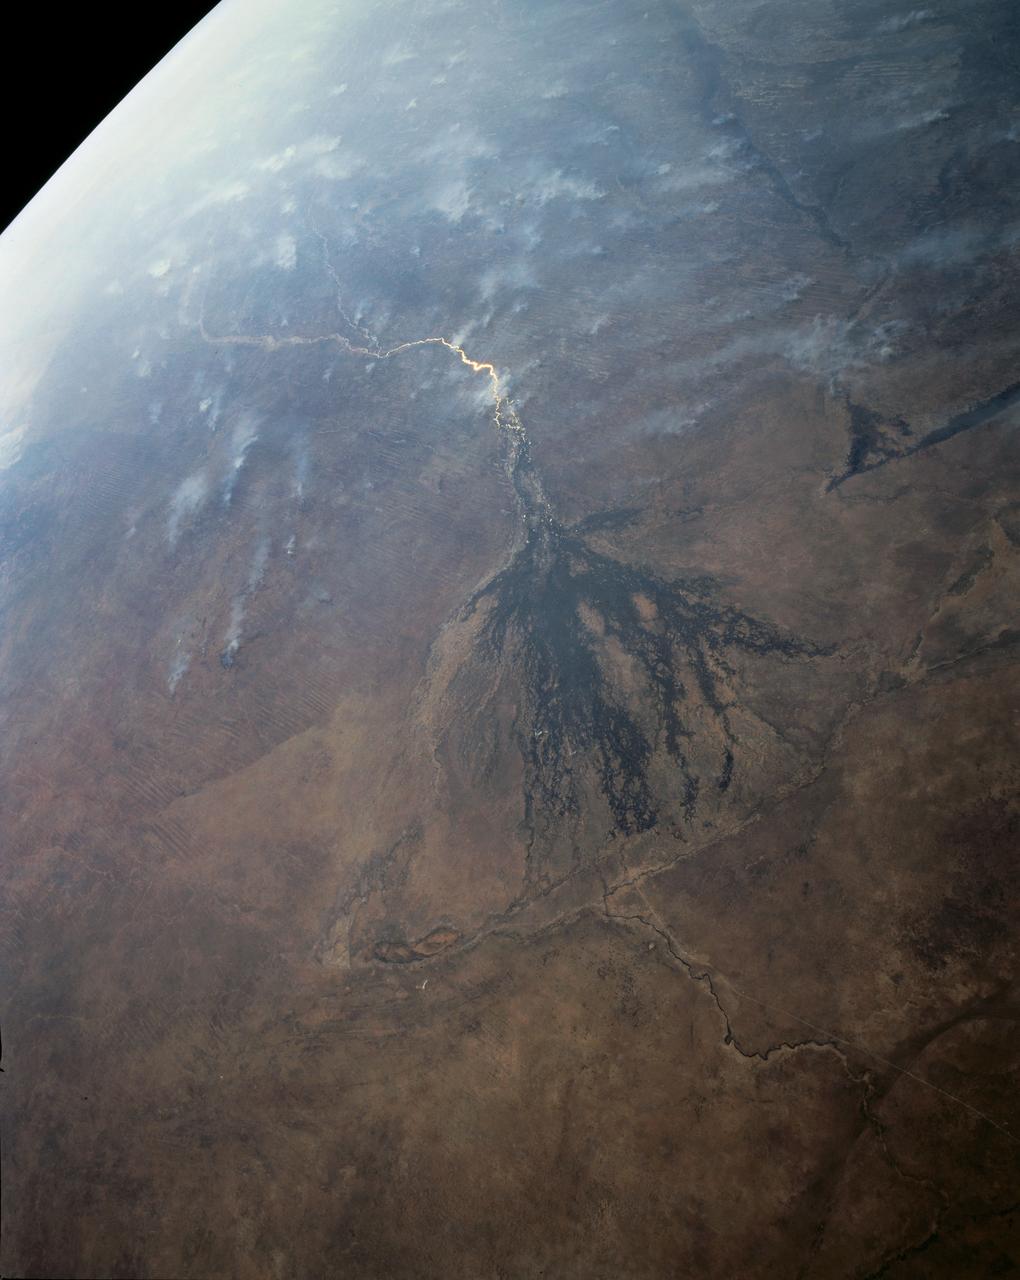
STS035-73-082 (2-10 Dec 1990) --- This agricultural and ranching area, Rio Sao Francisco, Brazil (13.0S, 43.5W) has been under study for several years. See scene STS-31-92-045 for comparison. This area has many small single family subsistence farms, large square and rectangular commercial farms and pastures for livestock grazing. Over the several years of observation, the number and size of farms has increased and center-pivot, swing-arm irrigation systems have been installed.
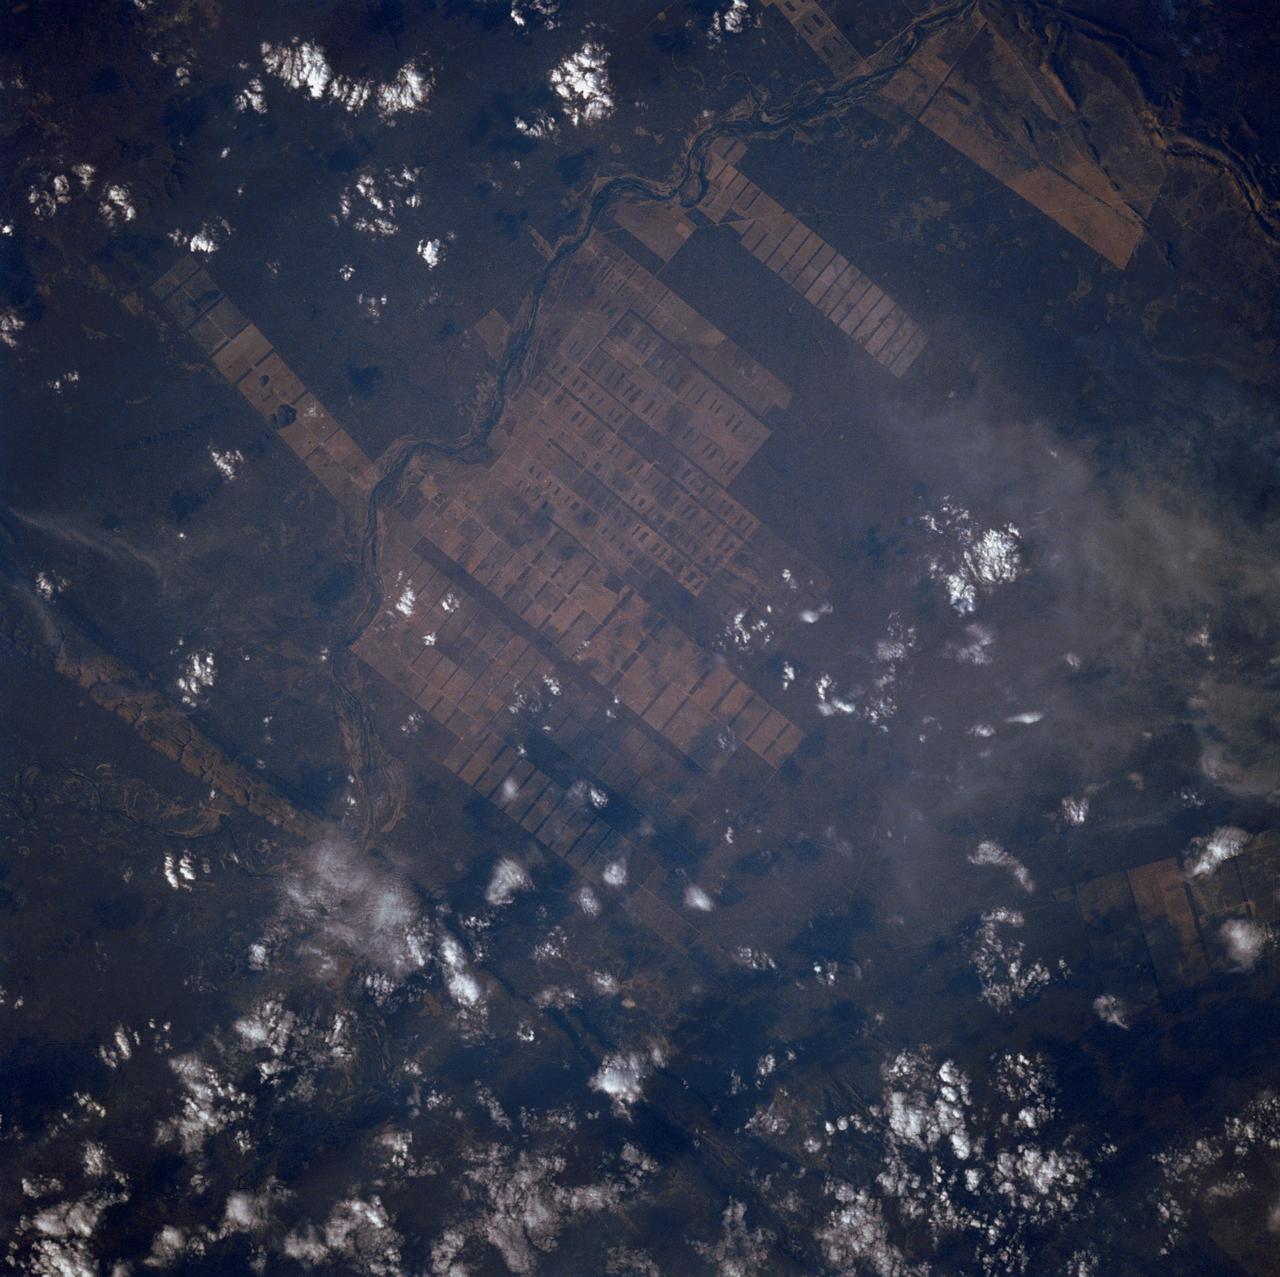
The large field patterns in this view of the Rio Sao Francisco basin, Brazil, South America, (11.5S, 43.5W) indicate a commercial agriculture venture; family subsistence farms are much smaller and laid out in different patterns. Land clearing in Brazil has increased at an alarming rate in recent years and preliminary estimates suggest a 25 to 30% increase in deforestation since 1984. The long term impact on the ecological processes are still unknown.

Perseverance mission manager Keith Comeaux is seen in mission control as he and the Perseverance Mars river team monitor the spa crafts approach and landing on Mars, Thursday, Feb. 18, 2021, at NASA's Jet Propulsion Laboratory in Pasadena, California. A key objective for Perseverance’s mission on Mars is astrobiology, including the search for signs of ancient microbial life. The rover will characterize the planet’s geology and past climate, pave the way for human exploration of the Red Planet, and be the first mission to collect and cache Martian rock and regolith. Photo Credit: (NASA/Bill Ingalls)
The first stage of the SpaceX Falcon 9 rocket lands at Vandenberg Space Force Base's landing zone 4 following the successful launch of the Surface Water and Ocean Topography (SWOT) satellite on Dec. 16, 2022. A collaboration between NASA and the French space agency Centre National d’Études Spatiales (CNES), with contributions from the Canadian Space Agency and the UK Space Agency, SWOT will be the first satellite to survey nearly all water on Earth’s surface. The satellite will help researchers understand how much water flows in and out of Earth’s freshwater bodies and will provide insight into the ocean’s role in climate change. The instruments onboard will measure the height of water in lakes, rivers, reservoirs, and the ocean, and will observe ocean features in higher definition than ever before. NASA’s Launch Services Program, based at the agency’s Kennedy Space Center in Florida, is managing the launch service.
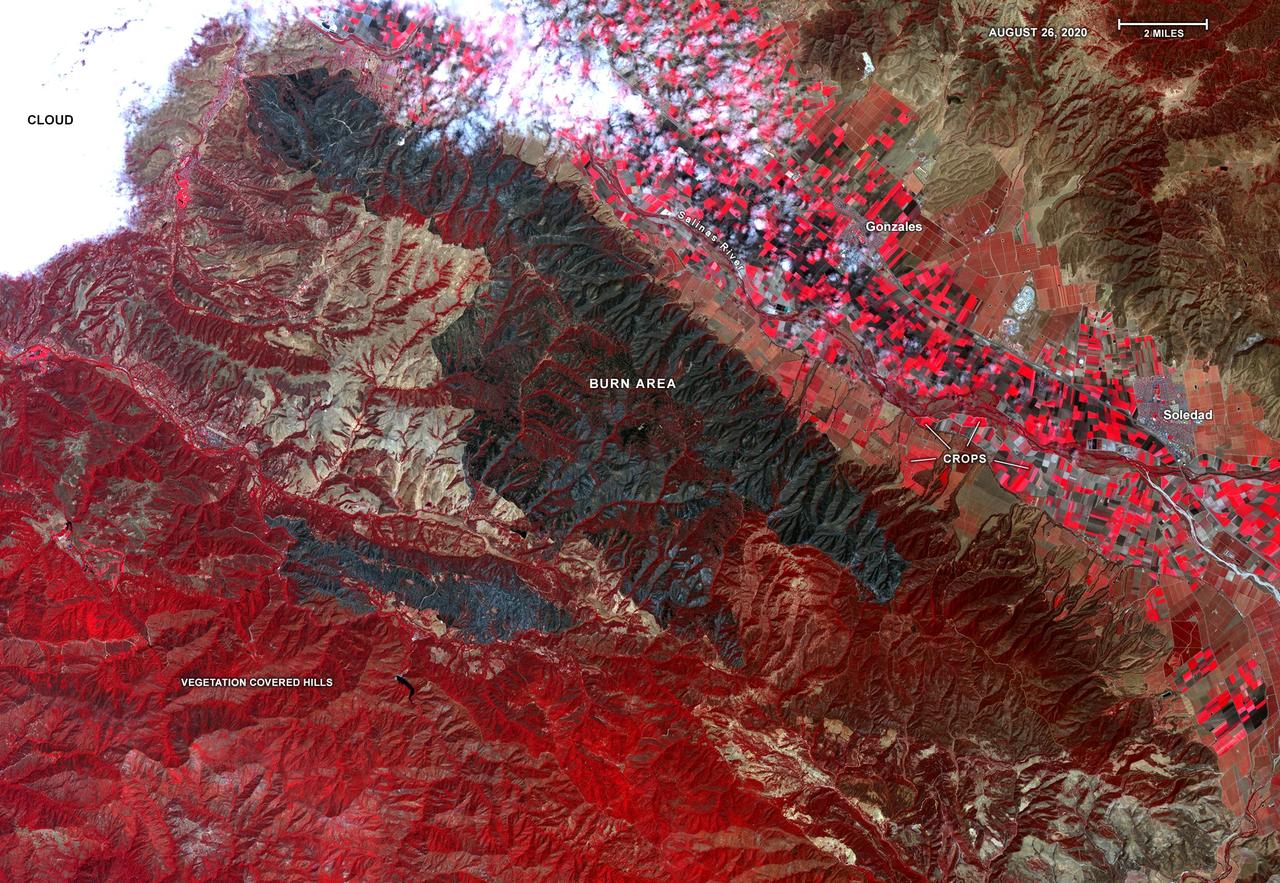
On Aug. 26, 2020, Advanced Spaceborne Thermal Emission and Reflection Radiometer (ASTER) instrument aboard NASA's Terra satellite passed over the River and Carmel fires in Monterey County, California, got a bird's eye view of the vast fire burn area. This false-color map shows the burn area as dark blue and gray, in the center of the image. Vegetation is in red, including agricultural crops along the Salinas River (bright red rectangles) surrounding the towns of Soledad and Gonzales; bare areas with no vegetation and rock are shown in tan and brown. The city of Salinas is in the upper left of the image, obscured by thick clouds. ASTER obtains high-resolution (15-90 square meters, or 161-969 square feet, per pixel) images of the Earth in 14 wavelengths of the electromagnetic spectrum, ranging from visible to thermal infrared light. Data from ASTER — which is managed by Japan Space Systems and NASA's Jet Propulsion Laboratory in Southern California — are used by scientists to create detailed maps of land surface temperature, how much infrared energy the land emits, how much light the land reflects and its elevation. On this occasion, ASTER was able to support NASA's Disaster Program response to the state's wildfires, providing data products that can be used by resources on the ground to fight the fires and for scientists to better understand their long-term effects. The area covered here is 21.4 by 31 miles (34.4 by 49.9 kilometers). https://photojournal.jpl.nasa.gov/catalog/PIA23800

Zella Morewitz poses with a model of the National Advisory Committee for Aeronautics (NACA) Aircraft Engine Research Laboratory, currently the NASA Glenn Research Center. The model was displayed in the Administration Building during the construction of the laboratory in the early 1940s. Detailed models of the individual test facilities were also fabricated and displayed in the facilities. The laboratory was built on a wedge of land between the Cleveland Municipal Airport on the far side and the deep curving valley etched by the Rocky River on the near end. Roughly only a third of the laboratory's semicircle footprint was initially utilized. Additional facilities were added to the remaining areas in the years after World War II. In the late 1950s the site was supplemented by the acquisition of additional adjacent land. Morewitz joined the NACA in 1935 as a secretary in the main office at the Langley Memorial Aeronautical Laboratory. In September 1940 she took on the task of setting up and guiding an office dedicated to the design of the NACA’s new engine research laboratory. Morewitz and the others in the design office transferred to Cleveland in December 1941 to expedite the construction. Morewitz served as Manager Ray Sharp’s secretary for six years and was a popular figure at the new laboratory. In December 1947 Morewitz announced her engagement to Langley researcher Sidney Batterson and moved back to Virginia.

In 1979, China established two special economic zones around the Pearl River Delta, north of Hong Kong. This image, taken by Landsat 3 on October 19, 1973, shows that the region was rural when the zone was established. Plant-covered land, which is red in this false-color image, dominates the scene. Square grids are agriculture. By January 10, 2003, when Landsat 7 took this image, the Pearl River Delta was a densely populated urban corridor with several large cities. The urban areas are gray in this image. The region is a major manufacturing center with an economy the size of Taiwan’s. As of 2010, the Pearl River Economic Zone had a population of 36 million people. ---- NASA and the U.S. Department of the Interior through the U.S. Geological Survey (USGS) jointly manage Landsat, and the USGS preserves a 40-year archive of Landsat images that is freely available over the Internet. The next Landsat satellite, now known as the Landsat Data Continuity Mission (LDCM) and later to be called Landsat 8, is scheduled for launch in 2013. In honor of Landsat’s 40th anniversary in July 2012, the USGS released the LandsatLook viewer – a quick, simple way to go forward and backward in time, pulling images of anywhere in the world out of the Landsat archive. <b><a href="http://www.nasa.gov/audience/formedia/features/MP_Photo_Guidelines.html" rel="nofollow">NASA image use policy.</a></b> <b><a href="http://www.nasa.gov/centers/goddard/home/index.html" rel="nofollow">NASA Goddard Space Flight Center</a></b> enables NASA’s mission through four scientific endeavors: Earth Science, Heliophysics, Solar System Exploration, and Astrophysics. Goddard plays a leading role in NASA’s accomplishments by contributing compelling scientific knowledge to advance the Agency’s mission. <b>Follow us on <a href="http://twitter.com/NASA_GoddardPix" rel="nofollow">Twitter</a></b> <b>Like us on <a href="http://www.facebook.com/pages/Greenbelt-MD/NASA-Goddard/395013845897?ref=tsd" rel="nofollow">Facebook</a></b> <b>Find us on <a href="http://instagrid.me/nasagoddard/?vm=grid" rel="nofollow">Instagram</a></b>
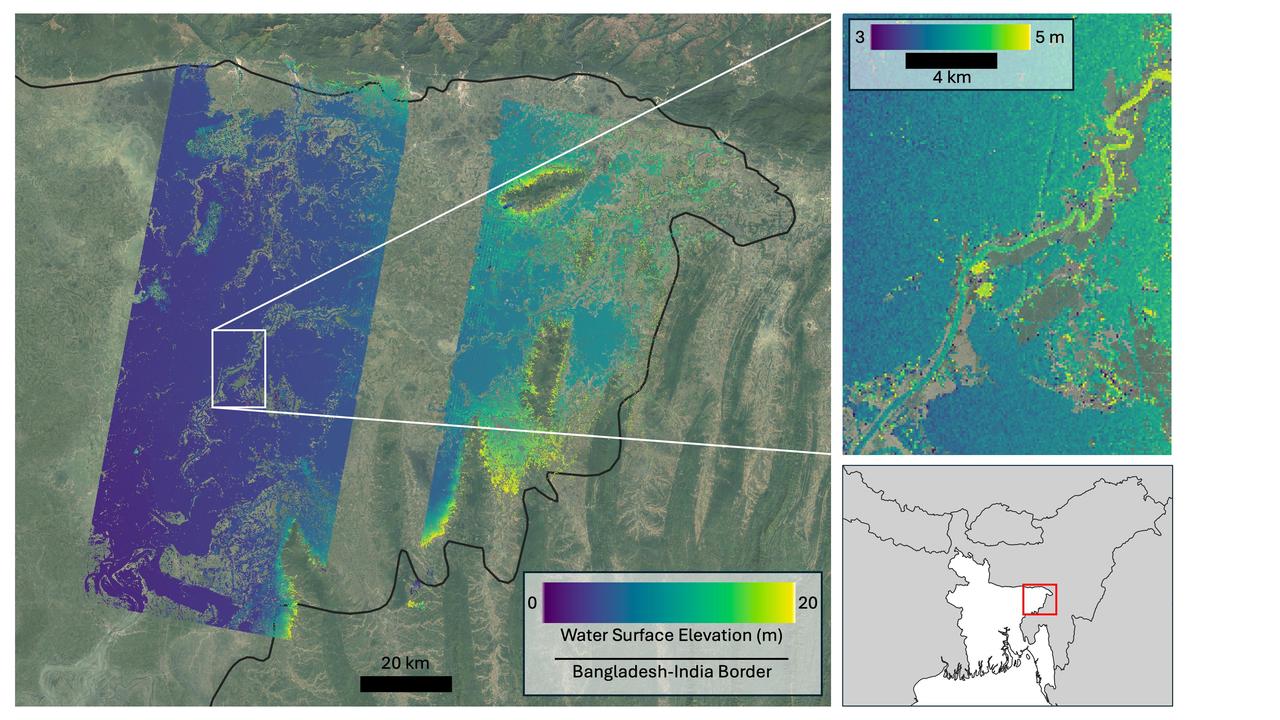
Flooding from monsoon rains covers a wide region of northeast Bangladesh near the India border in this Oct. 8, 2023, image showing data from the U.S.-French Surface Water and Ocean Topography (SWOT) satellite. Around that time, heavy monsoon rains affected various parts of Bangladesh, including the region depicted here, home to Sylhet, the country's fifth-largest city (population approximately 700,000). Sylhet and surrounding areas experienced substantial flooding. The SWOT data, overlaid on a standard Google Earth image, shows the precise surface elevation of the floodwaters. The vast majority of the land area within the region imaged by SWOT is flooded. In the main image at left, dark blue indicates waters just above sea level, while yellow represents 65 feet (20 meters) above sea level. The inset at top right zooms in on a section of the Kalni River, a tributary of one of Bangladesh's three major rivers, the Meghna. The main channel of the Kalni is about 650 feet (200 meters) wide. In the inset at top right, dark blue indicates water about 10 feet (3 meters) above sea level and yellow is used for waters about 16 feet (5 meters) above sea level. The zoomed-in data can be used to determine the slope of the river, which tells hydrologists how fast water flows through it and off a landscape. The water surface elevations depicted are higher in the top right of the inset than they are in the bottom left. The data also shows the elevation of the river is generally greater than that of water in the floodplain around it, telling hydrologists that water is likely flowing from the river into the floodplain. Each pixel in the image represents an area that is about 330 feet by 330 feet (100 meters by 100 meters). The image shows data from SWOT's Ka-band Radar Interferometer (KaRIn) instrument antennas, which don't cover a 12-mile-wide (20-kilometer-wide) strip right underneath the satellite. For that gap, a separate instrument collects water surface elevation data that isn't shown here. Bangladesh is a low-lying, generally flat country that chronically suffers from two types of flooding. Monsoon rains cause rivers that flow into Bangladesh from neighboring countries, especially India, to flood. And flash flooding occurs during the pre-monsoon season and can damage agricultural crops if not forecast with sufficient warning. While the use of satellite altimetry and precipitation in models has shown some promise for flood forecasting in Bangladesh, forecasting both types of flooding with sufficient lead time has remained challenging due to a lack of timely, high-spatial-resolution information on water elevation. SWOT is the first satellite to provide this information over entire regions, enabling improved forecasts and filling the data gap when places like Bangladesh become inundated. The Bangladesh Water Development Board, which is in charge of national flood forecasting and management, is now exploring how to incorporate SWOT water elevation information into its flood inundation forecasting system. Since shortly after launch in December 2022, SWOT has been measuring the height of nearly all water on Earth's surface, developing one of the most detailed, comprehensive views yet of the planet's oceans and freshwater lakes and rivers. The mission science team makes measurements using the KaRIn instrument. With two antennas spread 33 feet (10 meters) apart on a boom, KaRIn produces a pair of data swaths as it circles the globe, bouncing radar pulses off water surfaces to collect surface-height information. https://photojournal.jpl.nasa.gov/catalog/PIA26343
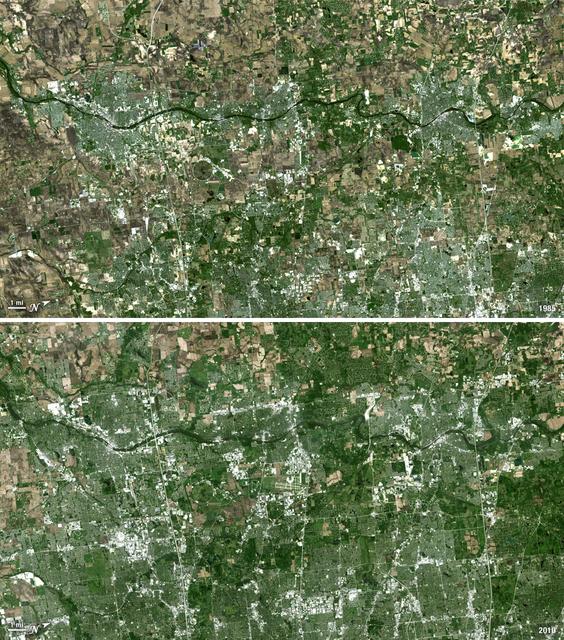
Forty miles west of downtown Chicago, the Fox River meanders its way through what has become the westernmost reaches of metropolitan Chicago, where the sprawling metropolis meets the hinterlands. While Chicago itself has seen a seven percent population decline during the last decade, the population of its metropolitan region, "Chicagoland," has steadily increased. These two natural-color Landsat 5 images acquired a quarter-century apart (on May 2, 1985, and May 23, 2010), stand witness to the soaring growth of this region. Aurora, Illinois’ second largest city, is the silvery-green region to the left hugging the Fox River, just south of the I-88 (North is to the right in this image); Carpentersville is found on the rightmost side, north of the I-90. From 1985 to 2010 a development explosion can been seen as the browns of pasture lands give way to silvery-green suburban areas and large white-colored business districts spring up along and east of the river. A major expansion of Dupage Airport appears in the middle of the 2010 image, and the circular-shaped region north of the I-88 and east of the Fox River, visible on both images, is the Department of Energy’s Fermilab. ---- NASA and the U.S. Department of the Interior through the U.S. Geological Survey (USGS) jointly manage Landsat, and the USGS preserves a 40-year archive of Landsat images that is freely available over the Internet. The next Landsat satellite, now known as the Landsat Data Continuity Mission (LDCM) and later to be called Landsat 8, is scheduled for launch in 2013. In honor of Landsat’s 40th anniversary in July 2012, the USGS released the LandsatLook viewer – a quick, simple way to go forward and backward in time, pulling images of anywhere in the world out of the Landsat archive. <b><a href="http://www.nasa.gov/audience/formedia/features/MP_Photo_Guidelines.html" rel="nofollow">NASA image use policy.</a></b> <b><a href="http://www.nasa.gov/centers/goddard/home/index.html" rel="nofollow">NASA Goddard Space Flight Center</a></b> enables NASA’s mission through four scientific endeavors: Earth Science, Heliophysics, Solar System Exploration, and Astrophysics. Goddard plays a leading role in NASA’s accomplishments by contributing compelling scientific knowledge to advance the Agency’s mission. <b>Follow us on <a href="http://twitter.com/NASA_GoddardPix" rel="nofollow">Twitter</a></b> <b>Like us on <a href="http://www.facebook.com/pages/Greenbelt-MD/NASA-Goddard/395013845897?ref=tsd" rel="nofollow">Facebook</a></b> <b>Find us on <a href="http://instagrid.me/nasagoddard/?vm=grid" rel="nofollow">Instagram</a></b>

An oil slick in the Gulf of Mexico following Hurricane Ida – a high-end Category 4 when it made landfall near Port Fourchon, Louisiana, on Aug. 29, 2021 – appears as a green trail in the inset false-color graphic provided by NASA's Delta-X project, while the surrounding seawater appears orange. The National Oceanic and Atmospheric Administration (NOAA) regularly monitors U.S. coastal waters for potential spills and noticed slicks that appeared just off the coast after the hurricane. They were able to use this information from Delta-X to corroborate other data they had about oil slicks in the area (satellite image in the second inset picture). The blue-green swath crossing from the Gulf of Mexico over the Louisiana coast denotes the flight path of the Delta-X radar instrument on Sept. 1, just before 11:30 a.m. CDT. Charged with studying the Mississippi River Delta, Delta-X was gearing up to collect data on Louisiana's coastal wetlands when Hurricane Ida barreled ashore in late August. The storm damaged buildings and infrastructure alike, resulting in power outages, flooding, and oil slicks in the Gulf of Mexico. Oil tends to smooth out the bumps on the ocean's surface, which results in a distinct radar signal that the Delta-X mission was able to pick out of their data. Delta-X added flight paths to their planned schedule – with the support of NASA's Applied Science Disaster Program – in order to collect information over the gulf in areas of interest to NOAA. Delta-X is studying two wetlands – the Atchafalaya and Terrebonne Basins – by land, boat, and air to quantify water and sediment flow as well as vegetation growth. While the Atchafalaya Basin has been gaining land through sediment accumulation, Terrebonne Basin, which is right next to the Atchafalaya, has been rapidly losing land. The data collected by the project will be applied to models used to forecast which areas of the delta are likely to gain or lose land under various sea level rise, river flow, and watershed management scenarios. The mission uses several instruments to collect its data. Affixed to the bottom of a Gulfstream-III airplane, one of those instruments, the all-weather Uninhabited Aerial Vehicle Synthetic Aperture Radar (UAVSAR), bounces radar signals off of Earth's surface, forming a kind of image of a particular area. Repeated images of the same regions, captured at different times, enable researchers to detect changes in those areas, such as fluctuating water levels beneath the vegetation as the tides move in and out of these wetlands. In addition to radar measurements, teams from Caltech, Louisiana State University, Florida International University, and other collaborating institutions gather water and vegetation samples – among other data – by boat, other airborne sensors, and from instruments on the ground. Funded by NASA's Earth Venture Suborbital (EVS-3) program, Delta-X is managed by the agency's Jet Propulsion Laboratory. Caltech in Pasadena, California, manages JPL for NASA. Fall 2021 was Delta-X's last scheduled field campaign, although the five-year mission will run through the end of 2023. https://photojournal.jpl.nasa.gov/catalog/PIA24540
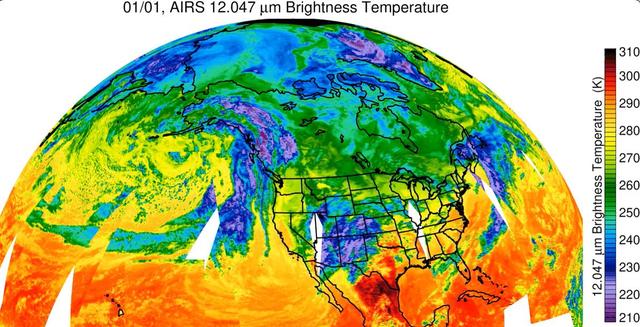
Since the start of 2023 California has been drenched by a series of storms being transported by an atmospheric river – a relatively narrow, windy region in Earth's atmosphere that can transport moisture or tiny particles for thousands of miles, much like a river on land moves water. NASA's Atmospheric Infrared Sounder (AIRS) captured the series of storms as they dumped record amounts of rain in some parts of California, caused flooding, and damaged infrastructure. Forecasts say this pattern of storms will continue through the week of Jan. 9. The images show cloud temperatures taken at infrared wavelengths not visible to the human eye. Purple and violet areas are colder, between about minus 82 degrees Fahrenheit and minus 46 degrees Fahrenheit (minus 63 degrees Celsius to minus 44 degrees Celsius), than blue and green regions which are roughly minus 28 degrees Fahrenheit to 26 degrees Fahrenheit (minus 33 degrees Celsius to minus 3 degrees Celsius). Warmer red sections are between roughly 62 degrees Fahrenheit and 80 degrees Fahrenheit (17 degrees Celsius to 27 degrees Celsius), representing mostly cloud-free air. The cooler parts of the clouds are associated with very heavy rainfall. White patches represent gaps in satellite coverage. Located aboard the Aqua satellite AIRS, in conjunction with the Advanced Microwave Sounding Unit (AMSU), senses emitted infrared and microwave radiation from Earth to provide a 3D look at the planet's weather and climate. Working in tandem, the two instruments make simultaneous observations down to Earth's surface. With more than 2,000 channels sensing different regions of the atmosphere, the system creates a global, 3D map of atmospheric temperature and humidity, cloud amounts and heights, greenhouse gas concentrations, and many other atmospheric phenomena. Launched into Earth orbit in 2002 aboard NASA's Aqua spacecraft, the AIRS and AMSU instruments are managed by NASA's Jet Propulsion Laboratory in Southern California, under contract to NASA. JPL is a division of Caltech. Animation available at https://photojournal.jpl.nasa.gov/catalog/PIA25597
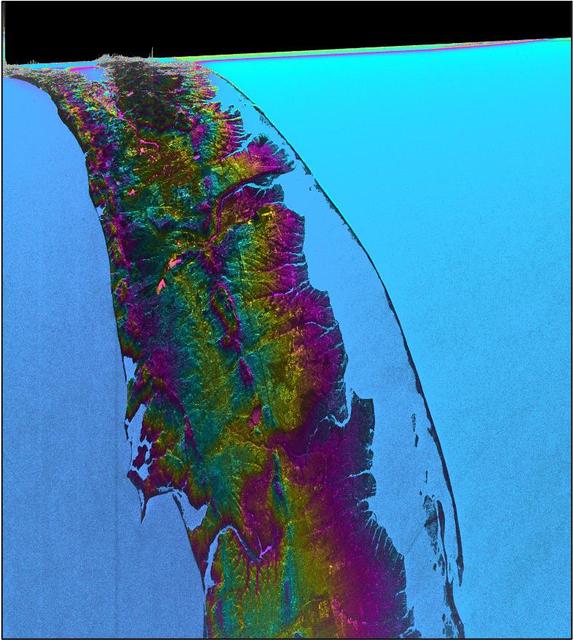
This visualization shows water features on New York's Long Island – shown as bright pink splotches nestled within the landscape. Purple, yellow, green, and dark blue shades represent different land elevations, while the surrounding ocean is a lighter blue. The data was collected on Jan. 21, 2023, by an instrument on the Surface Water and Ocean Topography (SWOT) satellite called the Ka-band Radar Interferometer (KaRIn). KaRIn is the scientific heart of the SWOT mission. It's a radar instrument with one antenna at each end of a boom that’s 33 feet (10 meters) long. This enables KaRIn to look off to either side of a center line directly below the satellite as the instrument bounces microwave signals off of Earth's surface. The returning radar signals arrive at each antenna slightly out of step, or phase, from one another. When these signals are combined with other information about the antennas and the satellite's altitude, scientists will be able to map the height of water on Earth's surface with never-before-seen clarity. This initial inland image is a tantalizing indication of how SWOT can measure details of smaller lakes, ponds, and rivers in ways that satellites could not before. Such data will be used to produce an extraordinary accounting of the freshwater on Earth's surface in ways useful to researchers, policymakers, and water resource managers. Led by NASA and the French space agency Centre National d'Études Spatiales (CNES), SWOT will measure the height of water on over 90% of Earth's surface, providing a high-definition survey of our planet's water for the first time. The satellite's measurements of freshwater bodies and the ocean will provide insights into how the ocean influences climate change; how a warming world affects lakes, rivers, and reservoirs; and how communities can better prepare for floods and other disasters. Launched on Dec. 16, 2022, from Vandenberg Space Force Base in central California, SWOT is now in a six-month period called commissioning, calibration and validation. This is when engineers on the mission check out the satellite's systems and science instruments to ensure data accuracy before the start of science operations in July. https://photojournal.jpl.nasa.gov/catalog/PIA25774
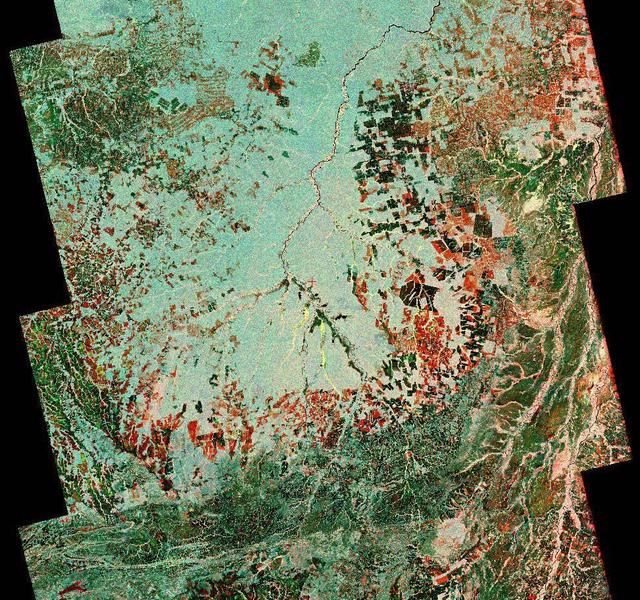
To show the kind of imagery that data from the NISAR (NASA-ISRO Synthetic Aperture Radar) satellite mission will produce, researchers pointed to this composite image of a portion of the so-called "arc of deforestation," a region on the southeast edge of the Amazonian jungle in Brazil where forests are being cleared at a fast pace through human activity. This three-color image shows change to the land cover in the Xingu River basin between 1996 (red) and 2007 (blue/green), using data from the Japanese L-band SAR satellites JERS-1 and ALOS-1, respectively. Black indicates areas converted from rainforest to agricultural land prior to 1996, and red shows the additional areas that had been cleared by 2007. NISAR will offer detailed insights into how the planet's forest ecosystems are changing over time, which will help researchers understand regional and global dynamics of deforestation and study the role of wooded areas in the global carbon cycle. NISAR could also help improve accounting of forest loss and growth, as countries that rely on logging try to shift toward more sustainable practices. NISAR is a joint mission of the U.S. and Indian space agencies. When in orbit, its sophisticated L- and S-band radar systems will scan nearly all of Earth's land and ice surfaces twice every 12 days with exquisite precision. Scheduled to launch in early 2024, NISAR is an equal collaboration between NASA and the Indian Space Research Organisation and marks the first time the two agencies have cooperated on hardware development for an Earth-observing mission. NASA's Jet Propulsion Laboratory, which is managed for the agency by Caltech in Pasadena, leads the U.S. component of the project and is providing the mission's L-band SAR. NASA is also providing the radar reflector antenna, the deployable boom, a high-rate communication subsystem for science data, GPS receivers, a solid-state recorder, and payload data subsystem. ISRO's U R Rao Satellite Centre in Bengaluru, which is leading the ISRO component of the mission, is providing the spacecraft bus, the S-band SAR electronics, the launch vehicle, and associated launch services and satellite mission operations. https://photojournal.jpl.nasa.gov/catalog/PIA26111
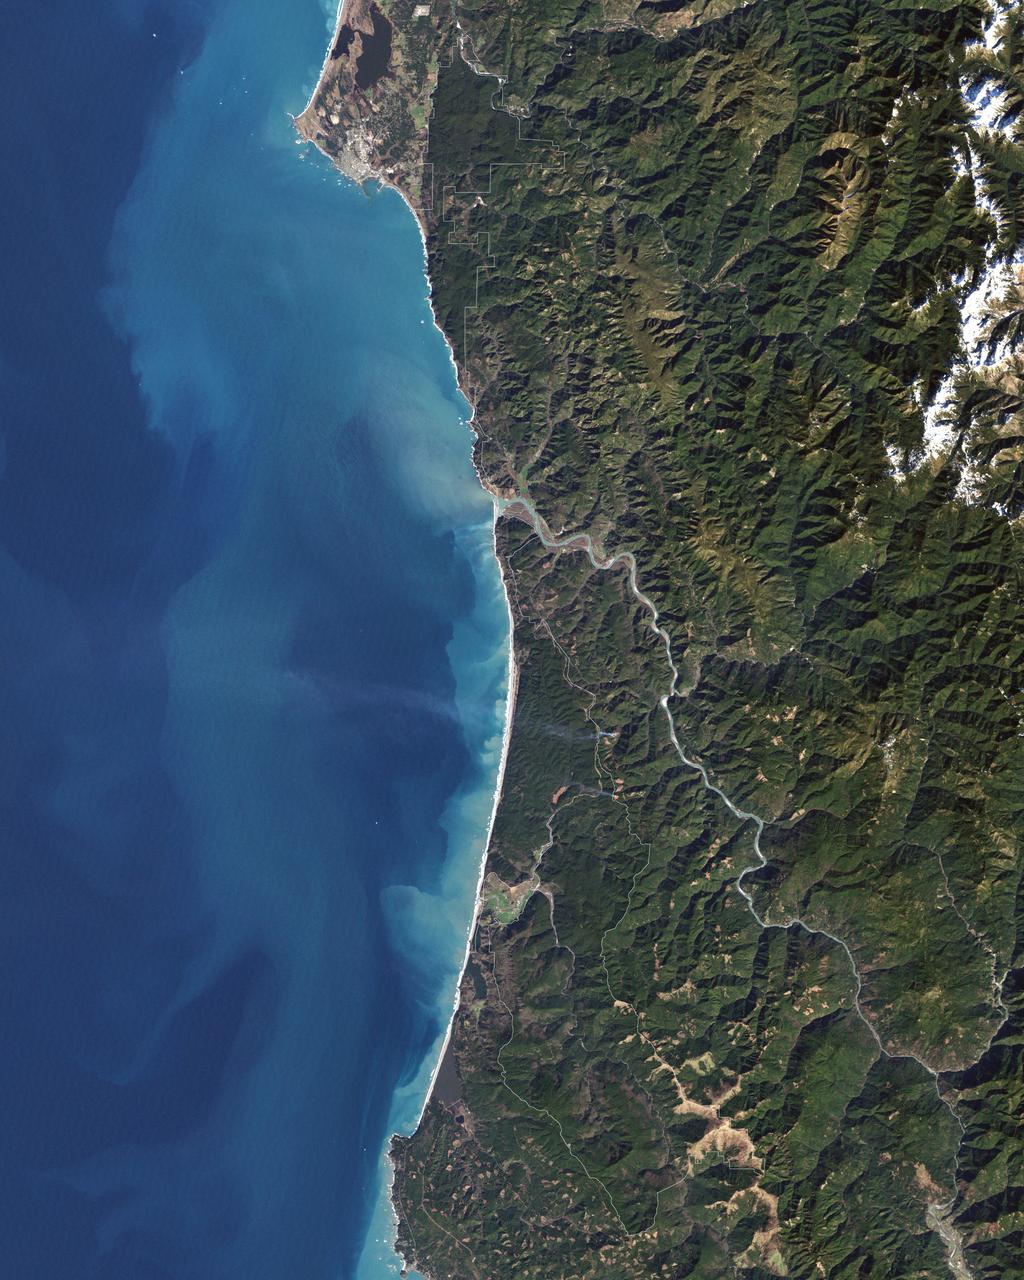
In 1968, after state parks had already been established in northern California, the U.S. Congress established Redwood National Park. This new park supplemented protected lands in the region, and in 1994, state and federal authorities agreed to jointly manage the area’s public lands. On February 6, 2003, the Enhanced Thamatic Mapper Plus on NASA’s Landsat 7 satellite captured this true-color image of the southern end of Redwood National Park - a thin coastal corridor connects the northern and southern ends of the park system. Along the coast, sandy beaches appear off-white, and sediments form swirls of pale blue in the darker blue sea. Inland, the park is dominated by green vegetation, with isolated patches of gray-beige rock. This image of the Redwood National Park includes two stands of trees: Lady Bird Johnson Grove and Tall Trees Grove. The first grove was dedicated to the former first lady by President Richard Nixon in August 1969. The second grove became the focus of efforts to protect the surrounding area from logging. Two waterways appear in this image: Redwood Creek and Klamath River. The more conspicuous Klamath River flows through the park system’s midsection (north of the area pictured here). Redwood Creek flows through the southern portion of the park system. Both waterways have carved gorges through the mountainous landscape. Redwood National and State Parks occupy an area considered to be the most seismically active in the United States. The frequent seismic activity has led to shifting waterways, landslides, and rapid erosion along the coastline. Read more: <a href="http://go.nasa.gov/2bRlryv" rel="nofollow">go.nasa.gov/2bRlryv</a> Credit: NASA/Landsat7 <b><a href="http://www.nasa.gov/audience/formedia/features/MP_Photo_Guidelines.html" rel="nofollow">NASA image use policy.</a></b> <b><a href="http://www.nasa.gov/centers/goddard/home/index.html" rel="nofollow">NASA Goddard Space Flight Center</a></b> enables NASA’s mission through four scientific endeavors: Earth Science, Heliophysics, Solar System Exploration, and Astrophysics. Goddard plays a leading role in NASA’s accomplishments by contributing compelling scientific knowledge to advance the Agency’s mission. <b>Follow us on <a href="http://twitter.com/NASAGoddardPix" rel="nofollow">Twitter</a></b> <b>Like us on <a href="http://www.facebook.com/pages/Greenbelt-MD/NASA-Goddard/395013845897?ref=tsd" rel="nofollow">Facebook</a></b> <b>Find us on <a href="http://instagrid.me/nasagoddard/?vm=grid" rel="nofollow">Instagram</a></b>
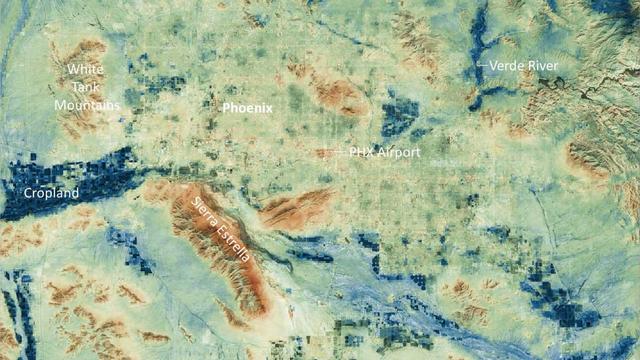
Researchers at NASA's Jet Propulsion Laboratory have created a series of maps showing land-surface temperatures in the Phoenix area in July 2023, when the city experienced a record-breaking run of hot weather. The images reveal the cumulative effect – overnight and across the month – of relentless daytime heating. The data was captured during overnight hours (around 2 a.m.) on several days in July by an instrument called the Visible Infrared Imaging Radiometer Suite (VIIRS) aboard the NOAA-NASA Suomi National Polar-orbiting Partnership (Suomi NPP) satellite managed by the National Oceanic and Atmospheric Administration and NASA. The images show how built surfaces – roads, buildings, airport runways, and the like – retain heat, sometimes hovering around 100 degrees Fahrenheit (38 degrees Celsius) for hours after sunset. From July 1 to July 19, the built surfaces in the maps grew progressively hotter, likely the combined effect of the heat wave intensifying and the cumulative heating of those human-made structures. Due to their high heat capacity, these surfaces didn't fully cool overnight before the onset of the next day's heat. At the center of the images is Phoenix's Sky Harbor International Airport, where VIIRS measured the hottest land-surface temperature within the city. The airport is also where Phoenix takes its official air temperature. By those measurements, the city experienced the hottest month on record in July, including a record 31 consecutive days in which the temperature exceeded 110 degrees Fahrenheit (43.3 degrees Celsius). The previous record was 18 days. Land-surface temperatures in cities are usually warmer than in rural and undeveloped areas because of human activities and the materials used for building. Streets – seen in these maps as a grid pattern – are often the hottest part of the built environment due to dark asphalt paving that absorbs more sunlight than lighter-colored surfaces; asphalt absorbs up to 95% of solar radiation. In the images, the mountains near Phoenix are also notably hot due to their angle to the Sun and greater soil exposure from lack of vegetation. The hot surfaces in and around the city stand in contrast to nearby irrigated surfaces such as agricultural fields, golf courses, and parks, which fell as low as 68 degrees Fahrenheit (18.9 degrees Celsius) during the night. The Verde River and other nearby waterways also were significantly cooler. VIIRS is one of five instruments aboard the NOAA-NASA Suomi NPP satellite. Short for Suomi National Polar-orbiting Partnership, the spacecraft is one of several in the Joint Polar Satellite System. The images were produced from the VNP21IMG Land Surface Temperature product, which is available at NASA's Land, Atmosphere Near-real-time Capability for EOS (LANCE). Animation available at https://photojournal.jpl.nasa.gov/catalog/PIA25868

ISS015-E-07725 (11 May 2007) --- Marsh Island, Louisiana is featured in this image photographed by an Expedition 15 crewmember on the International Space Station. Marsh Island, located along the southwestern coastline of Louisiana, is a remnant of an abandoned lobe of the Mississippi River Delta formed approximately 5000-7500 years before the present day, according to scientists. It is composed primarily of organic-rich muds and brackish marsh vegetation (some peat -- semiconsolidated plant and organic matter -- is also present). The intricate lake, pond and stream network of the island is highlighted in this image by silver-gray sunglint -- light reflected off of water surfaces directly back to the crewmember on the space station. Sunglint also illuminates water surfaces in the adjacent Gulf of Mexico and West Cote Blanche Bay -- variations in intensity of reflectance in these water bodies is due to surface roughness (often related to wind-driven waves or currents) and the presence of surfactants that can change the surface properties of the water. Marsh Island is a popular fishing, shrimping and birding location. The island has experienced significant loss of vegetation and land area -- nearly 3,000 hectares (7,000 acres) - due to erosion, with a corresponding loss of habitat for local and migratory birds, shrimp, alligators and deer. While Marsh Island is uninhabited, it has been the focus of intensive development for management of erosion, such as revegetation of deteriorated marsh areas. Leveed canals (straight silver-gray water features) help drain areas for above-surface revegetation, while sill dams help stabilize water levels and foster regrowth of important subsurface vegetation such as widgeongrass.
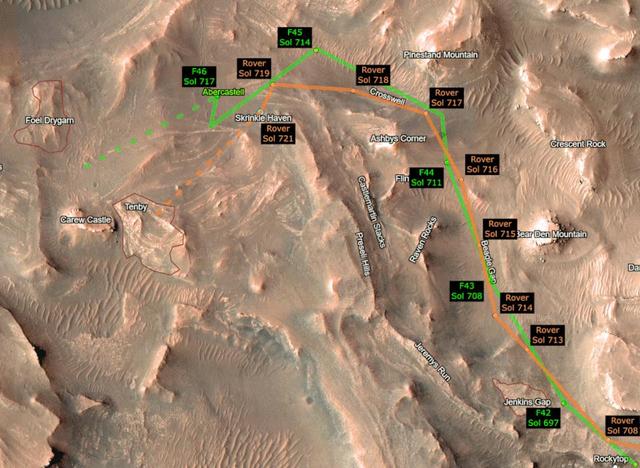
This animation shows the progress of NASA's Perseverance Mars rover and its Ingenuity Mars Helicopter as they make the climb up Jezero Crater's delta toward ancient river deposits. The helicopter's route is depicted in green, while the rover's progress is shown in orange. Black labels indicate which day, or sol, of the mission the rover and helicopter were on at each point. (Martian sols are counted from the date the Perseverance rover landed on Mars, Feb. 18, 2021). For the helicopter, the black labels also indicate which flight is shown; depicted here are Ingenuity's 42nd (F42) to 46th (F46) sorties. The Ingenuity Mars Helicopter was built by NASA's Jet Propulsion Laboratory in Southern California, which also manages the project for NASA Headquarters. It is supported by NASA's Science Mission Directorate. NASA's Ames Research Center in California's Silicon Valley, and NASA's Langley Research Center in Hampton, Virginia, provided significant flight performance analysis and technical assistance during Ingenuity’s development. AeroVironment Inc., Qualcomm, and SolAero also provided design assistance and major vehicle components. Lockheed Martin Space designed and manufactured the Mars Helicopter Delivery System. A key objective for Perseverance's mission on Mars is astrobiology, including the search for signs of ancient microbial life. The rover will characterize the planet's geology and past climate, pave the way for human exploration of the Red Planet, and be the first mission to collect and cache Martian rock and regolith (broken rock and dust). Subsequent NASA missions, in cooperation with ESA (European Space Agency), would send spacecraft to Mars to collect these sealed samples from the surface and return them to Earth for in-depth analysis. The Mars 2020 Perseverance mission is part of NASA's Moon to Mars exploration approach, which includes Artemis missions to the Moon that will help prepare for human exploration of the Red Planet. Animation available at https://photojournal.jpl.nasa.gov/catalog/PIA25687

Members of the international Surface Water and Ocean Topography (SWOT) mission test one of the antennas for the Ka-band Radar Interferometer (KaRIn) instrument in a clean room at NASA's Jet Propulsion Laboratory in Southern California. The mission is a collaborative effort between NASA and the French space agency Centre National d'Études Spatiales (CNES) – with contributions from the Canadian Space Agency (CSA) and the UK Space Agency. KaRIn is the scientific heart of the SWOT satellite, which will survey the water on more than 90% of Earth's surface, measuring the height of water in lakes, rivers, reservoirs, and the ocean. To do that, KaRIn will transmit radar pulses to Earth's surface and use its two antennas to triangulate the return signals that bounce back. Mounted at the ends of a boom 33 feet (10 meters) long, the antennas will collect data along a swath 30 miles (50 kilometers) wide on either side of the satellite. KaRIn will operate in two modes: A lower-resolution mode over the ocean will involve significant onboard processing of the data to reduce the volume of information sent during downlinks to Earth; a higher-resolution mode will be used mainly over land. Scheduled to launch from Vandenberg Space Force Base in Central California on Dec. 15, 2022, SWOT is being jointly developed by NASA and CNES, with contributions from the CSA and the UK Space Agency. NASA's Jet Propulsion Laboratory, which is managed for the agency by Caltech in Pasadena, California, leads the U.S. component of the project. For the flight system payload, NASA is providing the Ka-band Radar Interferometer (KaRIn) instrument, a GPS science receiver, a laser retroreflector, a two-beam microwave radiometer, and NASA instrument operations. CNES is providing the Doppler Orbitography and Radioposition Integrated by Satellite (DORIS) system, the dual frequency Poseidon altimeter (developed by Thales Alenia Space), the KaRIn radio-frequency subsystem (together with Thales Alenia Space and with support from the UK Space Agency), the satellite platform, and ground control segment. CSA is providing the KaRIn high-power transmitter assembly. NASA is providing the launch vehicle and associated launch services. https://photojournal.jpl.nasa.gov/catalog/PIA25594
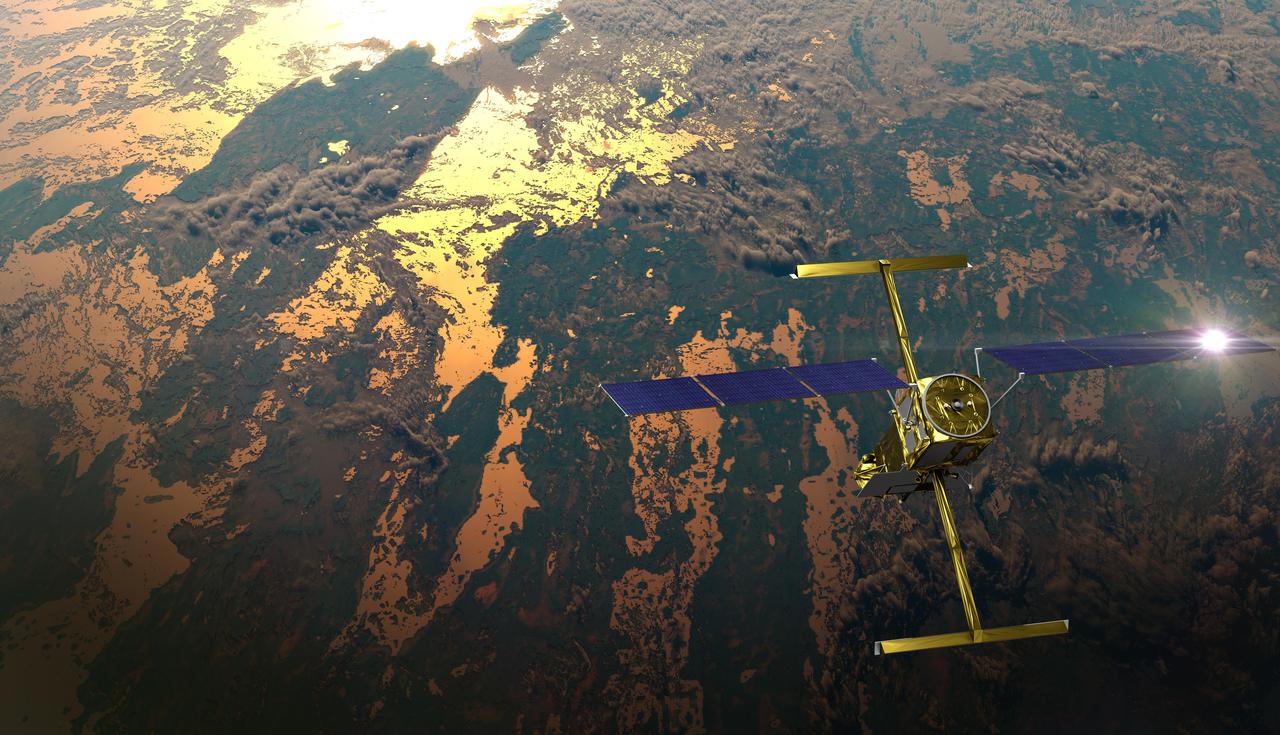
The international Surface Water and Ocean Topography (SWOT) satellite is shown in orbit over Earth in this illustration, with sunlight glinting off one of its solar arrays and both antennas of its Ka-band Radar Interferometer (KaRIn) instrument extended. The mission is a collaborative effort between NASA and the French space agency Centre National d'Études Spatiales (CNES) – with contributions from the Canadian Space Agency (CSA) and the UK Space Agency. KaRIn is the scientific heart of the SWOT satellite, which will survey the water on more than 90% of Earth's surface, measuring the height of water in lakes, rivers, reservoirs, and the ocean. To do that, KaRIn will transmit radar pulses to Earth's surface and use its two antennas to triangulate the return signals that bounce back. Mounted at the ends of a boom 33 feet (10 meters) long, the antennas will collect data along a swath 30 miles (50 kilometers) wide on either side of the satellite. KaRIn will operate in two modes: A lower-resolution mode over the ocean will involve significant onboard processing of the data to reduce the volume of information sent during downlinks to Earth; a higher-resolution mode will be used mainly over land. Scheduled to launch from Vandenberg Space Force Base in Central California on Dec. 15, 2022, SWOT is being jointly developed by NASA and CNES, with contributions from the CSA and the UK Space Agency. NASA's Jet Propulsion Laboratory, which is managed for the agency by Caltech in Pasadena, California, leads the U.S. component of the project. For the flight system payload, NASA is providing the Ka-band Radar Interferometer (KaRIn) instrument, a GPS science receiver, a laser retroreflector, a two-beam microwave radiometer, and NASA instrument operations. CNES is providing the Doppler Orbitography and Radioposition Integrated by Satellite (DORIS) system, the dual frequency Poseidon altimeter (developed by Thales Alenia Space), the KaRIn radio-frequency subsystem (together with Thales Alenia Space and with support from the UK Space Agency), the satellite platform, and ground control segment. CSA is providing the KaRIn high-power transmitter assembly. NASA is providing the launch vehicle and associated launch services. https://photojournal.jpl.nasa.gov/catalog/PIA25595