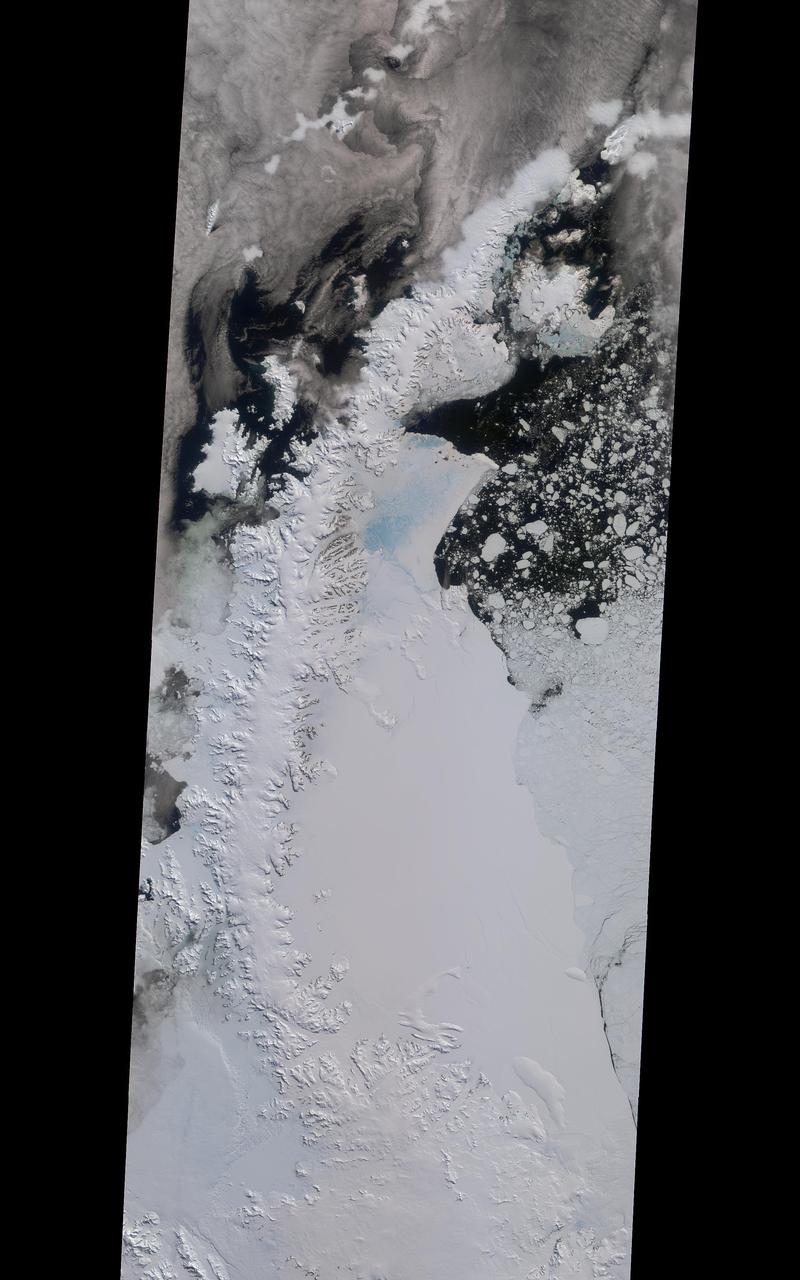
A rift in Antarctica's Larsen C ice shelf has grown to 110 miles (175 km) long, making it inevitable that an iceberg larger than Rhode Island will soon calve from the ice shelf. Larsen C is the fourth largest ice shelf in Antarctica, with an area of almost 20,000 square miles (50,000 square kilometers). The calving event will remove approximately 10 percent of the ice shelf's mass, according to the Project for Impact of Melt on Ice Shelf Dynamics and Stability (MIDAS), a UK-based team studying the ice shelf. Only 12 miles (20 km) of ice now separates the end of the rift from the ocean. The rift has grown at least 30 miles (50 km) in length since August, but appears to be slowing recently as Antarctica returns to polar winter. Project MIDAS reports that the calving event might destabilize the ice shelf, which could result in a collapse similar to what occurred to the Larsen B ice shelf in 2002. The Multi-angle Imaging SpectroRadiometer (MISR) instrument aboard NASA's Terra satellite captured views of Larsen C on August 22, 2016, when the rift was 80 miles (130 km) in length; December 8, 2016, when the rift was approximately 90 miles (145 km) long; and April 6, 2017. The MISR instrument has nine cameras, which view the Earth at different angles. The overview image, from December 8, shows the entire Antarctic Peninsula -- home to Larsen A, B, and C ice shelves -- in natural color (similar to how it would appear to the human eye) from MISR's vertical-viewing camera. Combining information from several MISR cameras pointed at different angles gives information about the texture of the ice. The accompanying GIF depicts the inset area shown on the larger image and displays data from all three dates in false color. These multiangular views -- composited from MISR's 46-degree backward-pointing camera, the nadir (vertical-viewing) camera, and the 46-degree forward-pointing camera -- represent variations in ice texture as changes in color, such that areas of rough ice appear orange and smooth ice appears blue. The Larsen C shelf is on the left in the GIF, bordered by the Weddell Sea on the upper right. The ice within the rift is orange, indicating movement, and the end of the rift can be tracked across the shelf between images. In addition, between December and April, the rift widened, pushing the future iceberg away from the shelf at its southern end. These data were acquired during Terra orbits 88717, 90290 and 92023. https://photojournal.jpl.nasa.gov/catalog/PIA21581
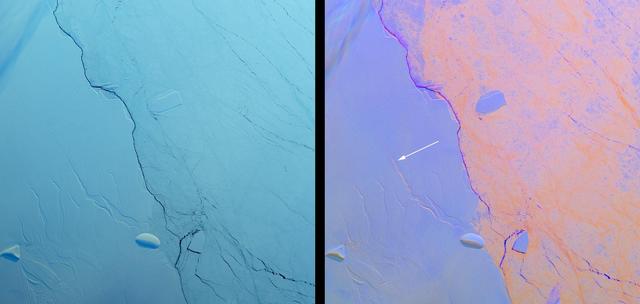
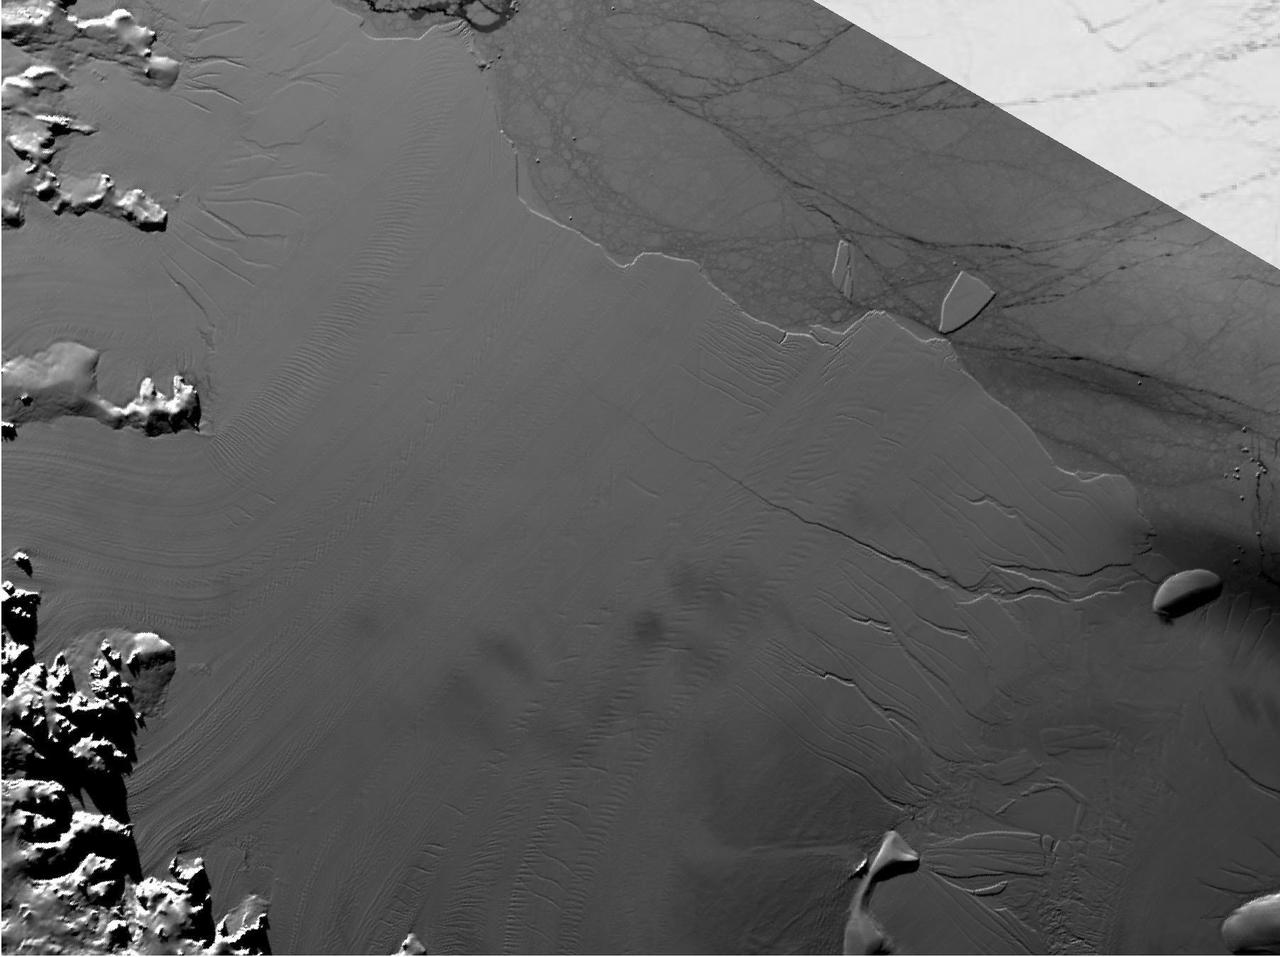
Project MIDAS, a United Kingdom-based group that studies the Larsen Ice Shelf in Antarctica, reported Aug. 18, 2016, that a large crack in the Larsen C shelf has grown by another 13 miles (22 kilometers) in the past six months. The crack is now more than 80 miles (130 kilometers) long. Larsen C is the fourth largest ice shelf in Antarctica, with an area of about 19,300 square miles (50,000 square kilometers), greater than the size of Maryland. Computer modeling by Project MIDAS predicts that the crack will continue to grow and eventually cause between nine and twelve percent of the ice shelf to collapse, resulting in the loss of 2,300 square miles (6,000 square kilometers) of ice -- more than the area of Delaware. This follows the collapse of the Larsen B shelf in 2002 and the Larsen A shelf in 1995, which removed about 1,255 square miles (3,250 square kilometers) and 580 square miles (1,500 square kilometers) of ice, respectively. The Multiangle Imaging SpectroRadiometer (MISR) instrument aboard NASA's Terra satellite flew over Larsen C on Aug. 22, 2016. The MISR instrument views Earth with nine cameras pointed at different angles, which provides information about the texture of the surface. On the left is a natural-color image of the shelf from MISR's vertical-viewing camera. Antarctica is slowly emerging from its polar night, and the low light gives the scene a bluish tint. The Larsen C shelf is on the left, while thinner sea ice is present on the right. A variety of cracks are visible in the Larsen C shelf, all appearing roughly the same. The image is about 130 by 135 miles (210 by 220 kilometers) in size. On the right is a composite image made by combining data from MISR's 46-degree backward-pointing camera (plotted as blue), the vertical-pointing camera (plotted as green), and the 46-degree forward-pointing camera (plotted as red). This has the effect of highlighting surface roughness; smooth surfaces appear as blue-purple, while rough surfaces appear as orange. Clouds near the upper left appear multi-hued because their elevation above the surface causes the different angular views to be slightly displaced. In this composite, the difference between the rough sea ice and the smoother ice shelf is immediately apparent. An examination of the cracks in the ice shelf shows that the large crack Project MIDAS is tracking (indicated by an arrow) is orange in color, demonstrating that it is actively growing. These data were acquired during Terra orbit 88717 http://photojournal.jpl.nasa.gov/catalog/PIA20894
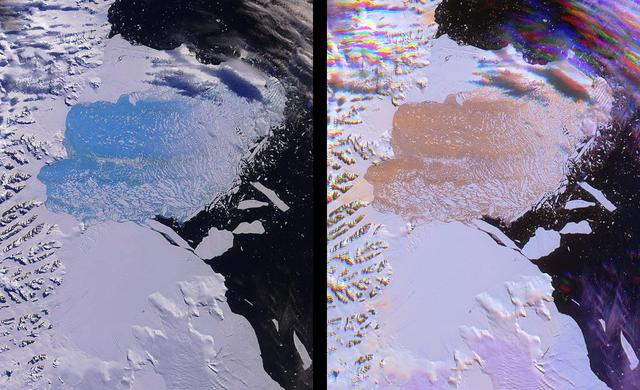
Both single and multi-angle views of the breakup of the northern section of the Larsen B ice shelf are shown in this image pair fromNASA Terra satellite. The Larsen B ice shelf collapsed and broke away from the Antarctic Peninsula during February and Ma
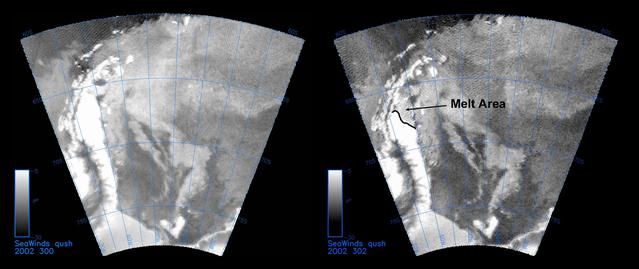
The SeaWinds instrument on NASA Quick Scatterometer QuikScat spacecraft captured these near-real-time backscatter images of melting on the Larsen C ice shelf in Antarctica Weddell Sea between October 27 left and October 29 right.
Between July 10 and 12, 2017, the Larsen C Ice Shelf in West Antarctica calved one of the largest icebergs in history (named "A-68"), weighing approximately one trillion tons. The rift in the ice shelf that spawned the iceberg has been present on the shelf since at least the beginning of the Landsat era (approximately the 1970s), but remained relatively dormant until around 2012, when it was observed actively moving through a suture zone in the ice shelf (Jansen et al., 2015). Suture zones are wide bands of ice that extend from glacier grounding lines (the boundary between a floating ice shelf and ice resting on bedrock) to the sea comprised of a frozen mixture of glacial ice and sea water, traditionally considered to be stabilizing features in ice shelves. When the Antarctic entered its annual dark period in late April, scientists knew the rift only had a few more miles to go before it completely calved the large iceberg. However, due to the lack of sunlight during the Antarctic winter, visible imagery is generally not available each year between May and August. This frame is from an animation that shows the ice shelf as imaged by the NASA/NOAA satellite Suomi NPP, which features the VIIRS (Visible Infrared Imaging Radiometer Suite) instrument. VIIRS has a day/night panchromatic band capable of collecting nighttime imagery of Earth with a spatial resolution of 2,460 feet (750 meters). An image from the Moderate Resolution Imaging Spectroradiometer (MODIS) instrument on NASA's Terra satellite shows the last cloud-free, daytime image of the ice shelf on April 6; the MODIS thermal imagery band is shown on April 29. The images from May 9 to July 14 show available cloud-free imagery from Suomi NPP. Luckily, despite several cloudy days leading up to the break, the weather mostly cleared on July 11, allowing scientists to see the newly formed iceberg on July 12. The animation is available at https://photojournal.jpl.nasa.gov/catalog/PIA21785
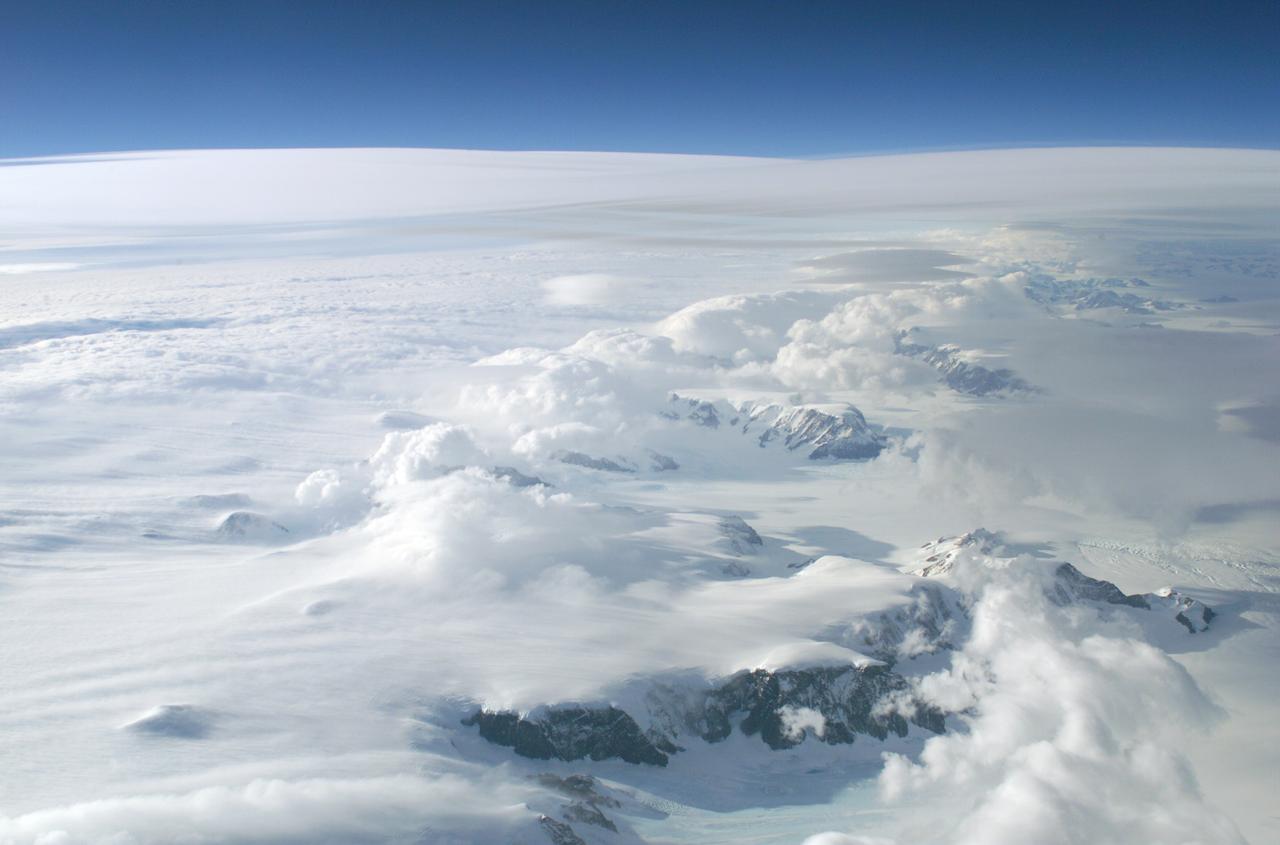
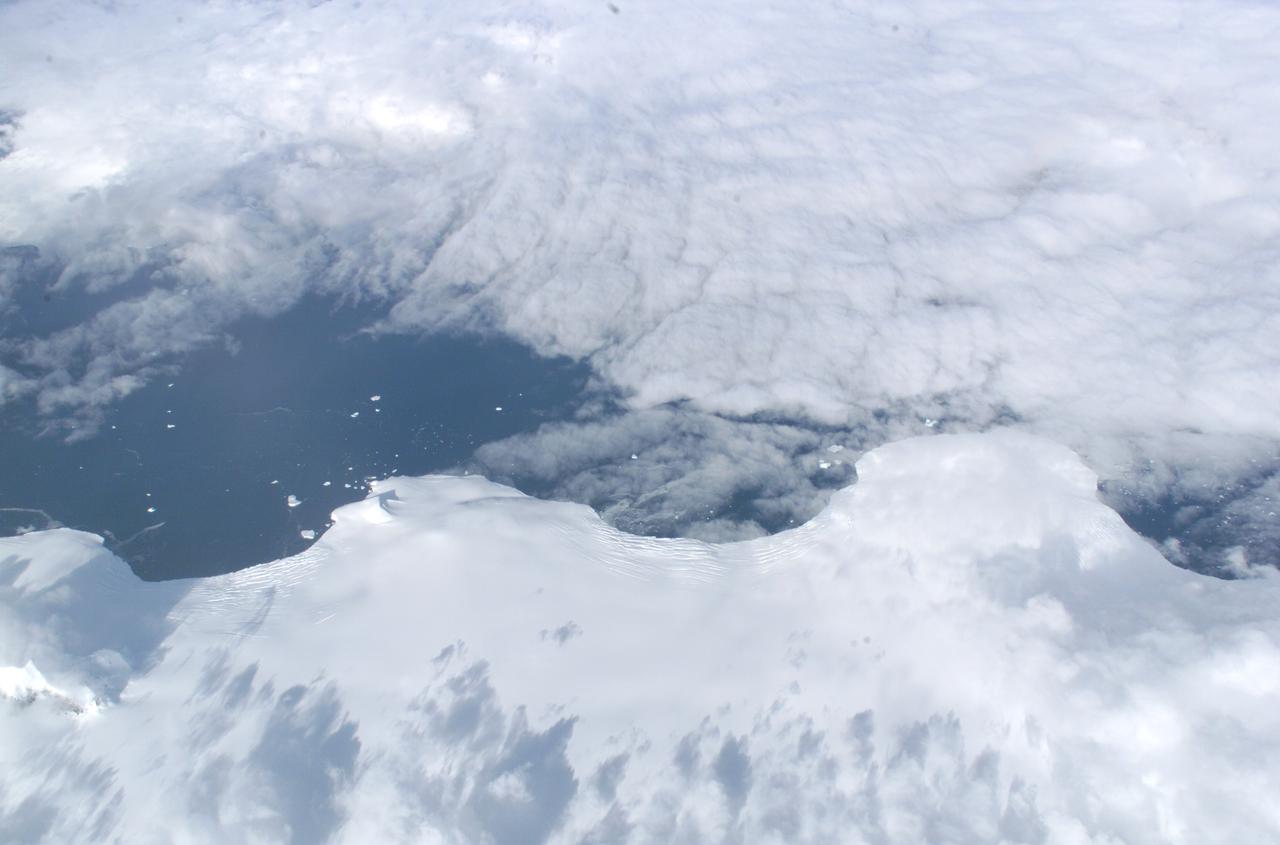
The Larsen Ice Shelf in Antarctica viewed from NASA's DC-8 aircraft during the AirSAR 2004 campaign. AirSAR 2004 is a three-week expedition in Central and South America by an international team of scientists that is using an all-weather imaging tool, called the Airborne Synthetic Aperture Radar (AirSAR), located onboard NASA's DC-8 airborne laboratory. Scientists from many parts of the world are combining ground research with NASA's AirSAR technology to improve and expand on the quality of research they are able to conduct. These photos are from the DC-8 aircraft while flying an AirSAR mission over Antarctica. The Antarctic Peninsula is more similar to Alaska and Patagonia than to the rest of the Antarctic continent. It is drained by fast glaciers, receives abundant precipitation, and melts significantly in the summer months. In recent decades, the Peninsula has experienced significant atmospheric warming (about 2 degrees C since 1950), which has triggered a vast and spectacular retreat of its floating ice shelves, glacier reduction, a decrease in permanent snow cover and a lengthening of the melt season. As a result, the contribution to sea level from this region could be rapid and substantial. With an area of 120,000 km, or ten times the Patagonia ice fields, the Peninsula could contribute as much as 0.4mm/yr sea level rise, which would be the largest single contribution to sea level from anywhere in the world. This region is being studied by NASA using a DC-8 equipped with the Airborne Synthetic Aperture Radar developed by scientists from NASA’s Jet Propulsion Laboratory. AirSAR will provide a baseline model and unprecedented mapping of the region. This data will make it possible to determine whether the warming trend is slowing, continuing or accelerating. AirSAR will also provide reliable information on ice shelf thickness to measure the contribution of the glaciers to sea level.
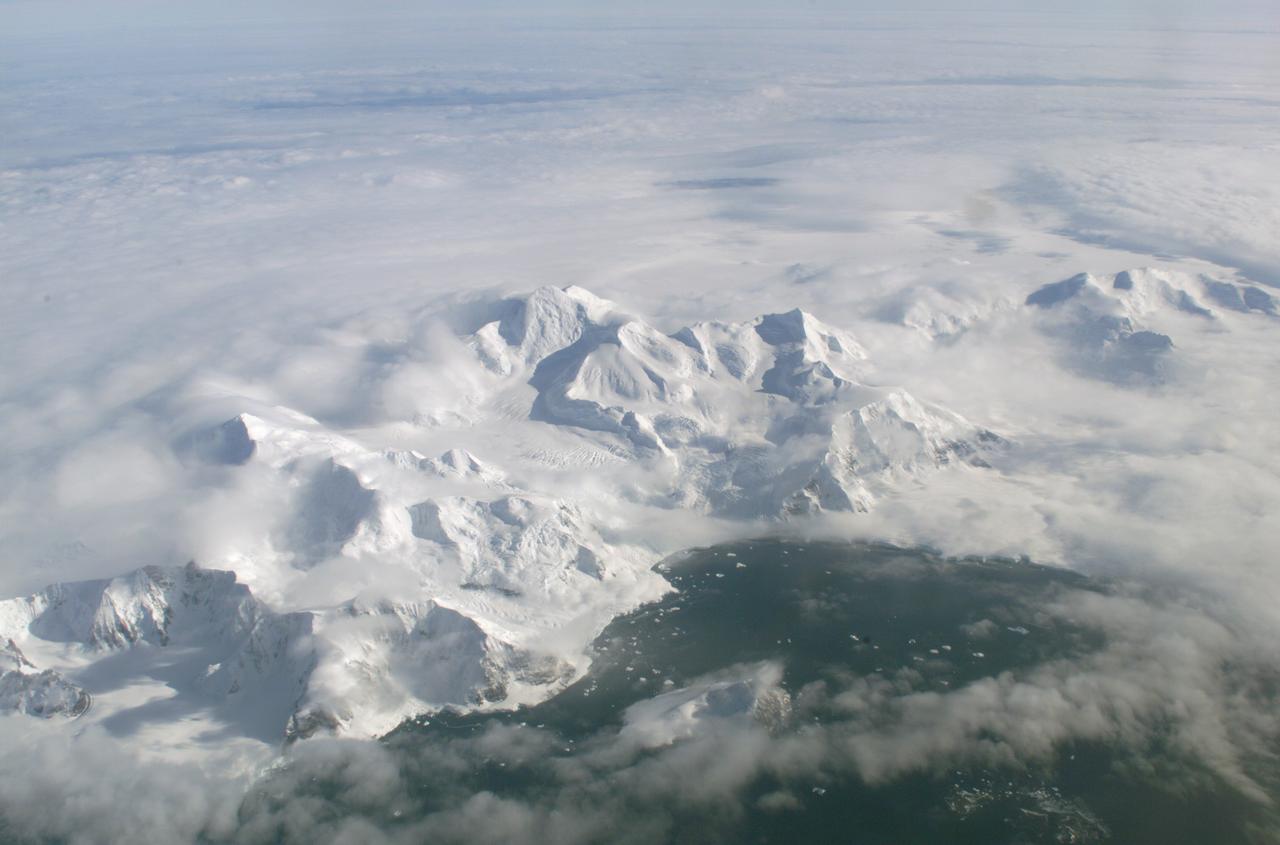
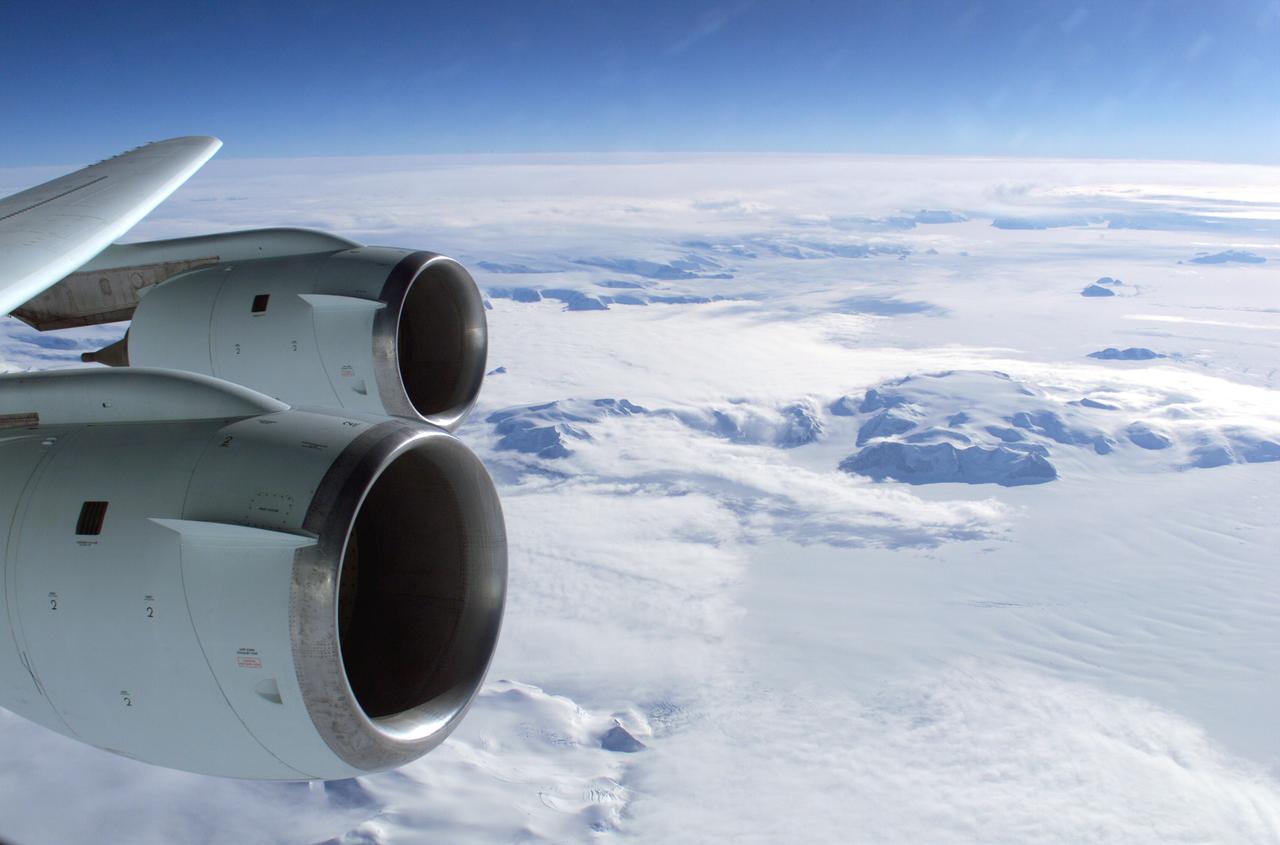
An AirSAR 2004 view from the DC-8 as it approaches the Larsen Ice Shelf, which is part of the Antarctic Peninsula. AirSAR 2004 is a three-week expedition in Central and South America by an international team of scientists that is using an all-weather imaging tool, called the Airborne Synthetic Aperture Radar (AirSAR), located onboard NASA's DC-8 airborne laboratory. Scientists from many parts of the world are combining ground research with NASA's AirSAR technology to improve and expand on the quality of research they are able to conduct. These photos are from the DC-8 aircraft while flying an AirSAR mission over Antarctica. The Antarctic Peninsula is more similar to Alaska and Patagonia than to the rest of the Antarctic continent. It is drained by fast glaciers, receives abundant precipitation, and melts significantly in the summer months. In recent decades, the Peninsula has experienced significant atmospheric warming (about 2 degrees C since 1950), which has triggered a vast and spectacular retreat of its floating ice shelves, glacier reduction, a decrease in permanent snow cover and a lengthening of the melt season. As a result, the contribution to sea level from this region could be rapid and substantial. With an area of 120,000 km, or ten times the Patagonia ice fields, the Peninsula could contribute as much as 0.4mm/yr sea level rise, which would be the largest single contribution to sea level from anywhere in the world. This region is being studied by NASA using a DC-8 equipped with the Airborne Synthetic Aperture Radar developed by scientists from NASA’s Jet Propulsion Laboratory. AirSAR will provide a baseline model and unprecedented mapping of the region. This data will make it possible to determine whether the warming trend is slowing, continuing or accelerating. AirSAR will also provide reliable information on ice shelf thickness to measure the contribution of the glaciers to sea level.

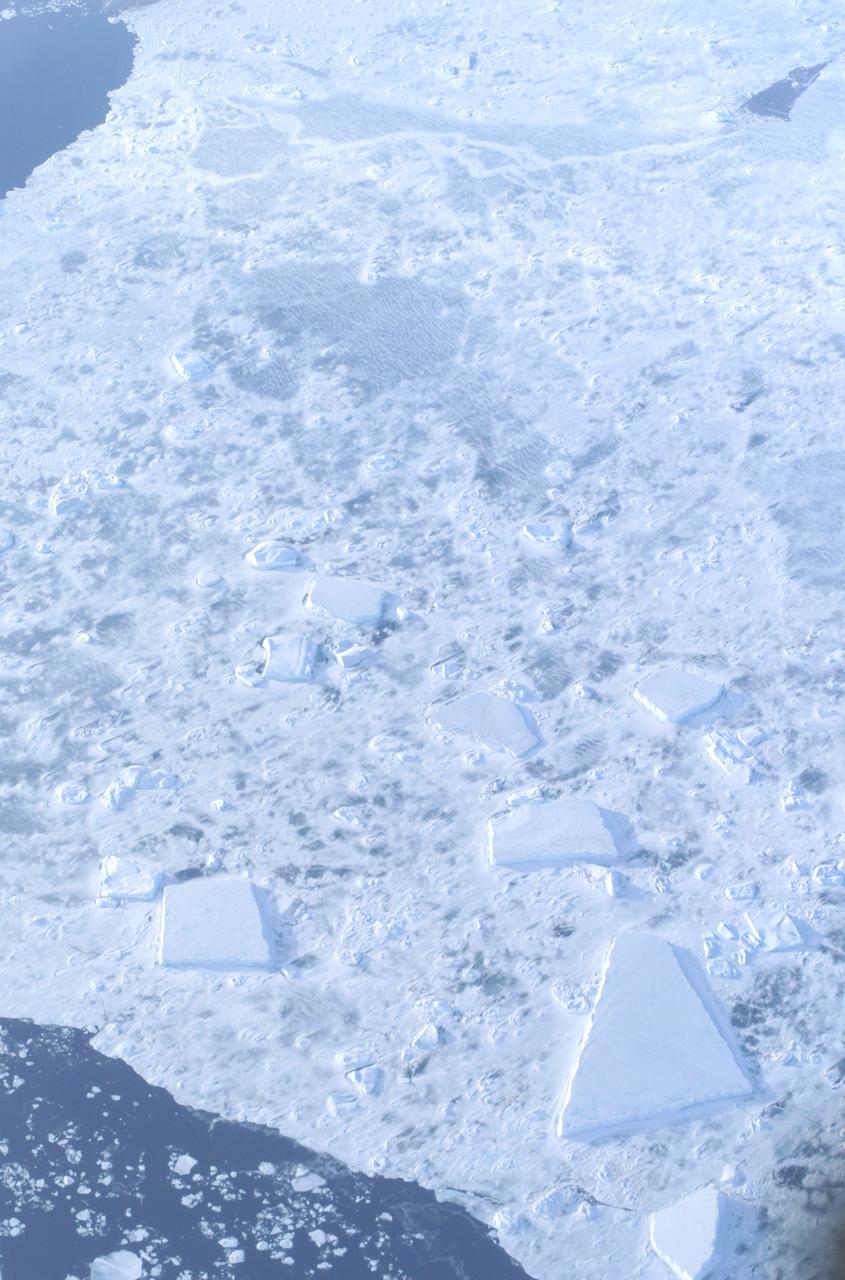
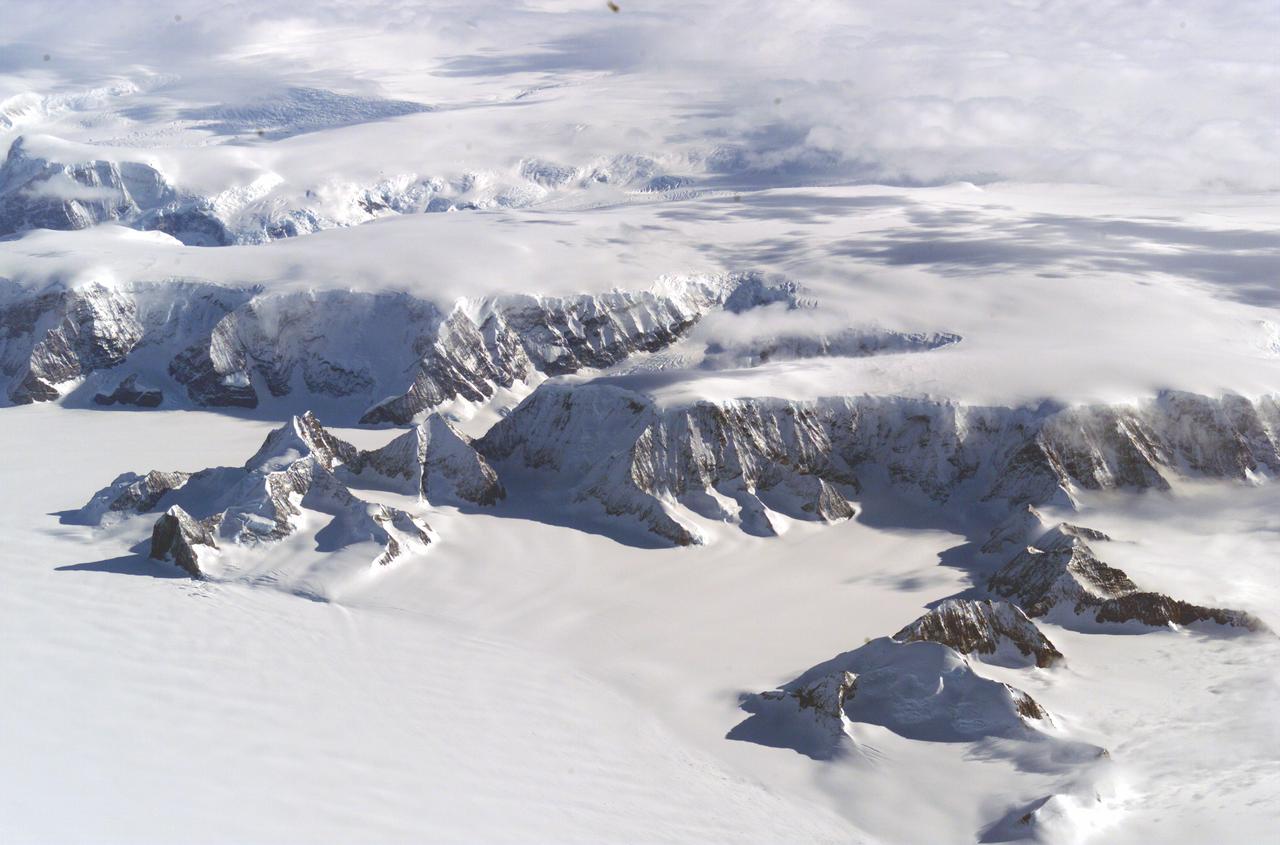
The Larsen Ice Shelf in Antarctica viewed from NASA's DC-8 aircraft during the AirSAR 2004 campaign. AirSAR 2004 is a three-week expedition in Central and South America by an international team of scientists that is using an all-weather imaging tool, called the Airborne Synthetic Aperture Radar (AirSAR), located onboard NASA's DC-8 airborne laboratory. Scientists from many parts of the world are combining ground research with NASA's AirSAR technology to improve and expand on the quality of research they are able to conduct. These photos are from the DC-8 aircraft while flying an AirSAR mission over Antarctica. The Antarctic Peninsula is more similar to Alaska and Patagonia than to the rest of the Antarctic continent. It is drained by fast glaciers, receives abundant precipitation, and melts significantly in the summer months. In recent decades, the Peninsula has experienced significant atmospheric warming (about 2 degrees C since 1950), which has triggered a vast and spectacular retreat of its floating ice shelves, glacier reduction, a decrease in permanent snow cover and a lengthening of the melt season. As a result, the contribution to sea level from this region could be rapid and substantial. With an area of 120,000 km, or ten times the Patagonia ice fields, the Peninsula could contribute as much as 0.4mm/yr sea level rise, which would be the largest single contribution to sea level from anywhere in the world. This region is being studied by NASA using a DC-8 equipped with an Airborne Synthetic Aperture Radar (AirSAR) developed by scientists from NASA’s Jet Propulsion Laboratory. AirSAR will provide a baseline model and unprecedented mapping of the region. This data will make it possible to determine whether the warming trend is slowing, continuing or accelerating. AirSAR will also provide reliable information on ice shelf thickness to measure the contribution of the glaciers to sea level.
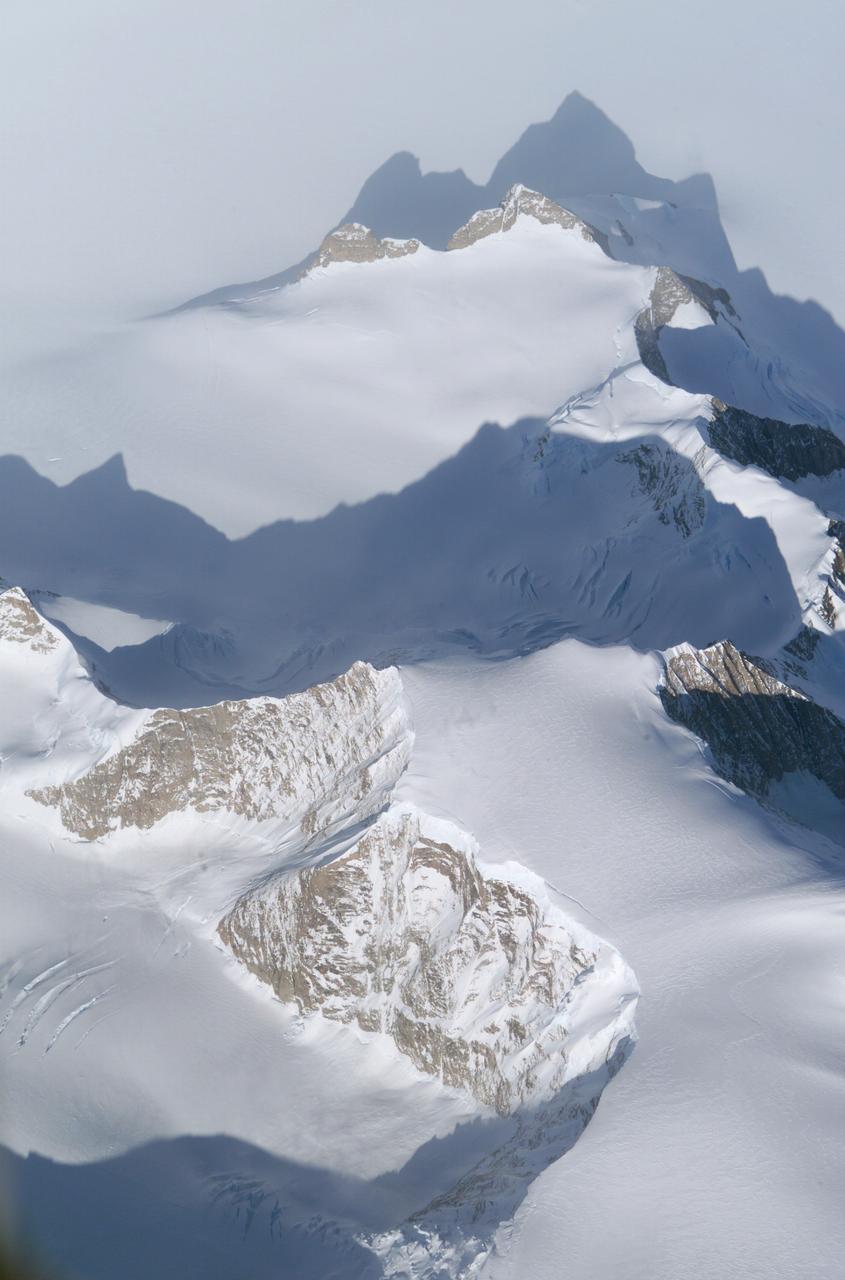
The Larsen Ice Shelf in Antarctica viewed from NASA's DC-8 aircraft during the AirSAR 2004 campaign. AirSAR 2004 is a three-week expedition in Central and South America by an international team of scientists that is using an all-weather imaging tool, called the Airborne Synthetic Aperture Radar (AirSAR), located onboard NASA's DC-8 airborne laboratory. Scientists from many parts of the world are combining ground research with NASA's AirSAR technology to improve and expand on the quality of research they are able to conduct. These photos are from the DC-8 aircraft while flying an AirSAR mission over Antarctica. The Antarctic Peninsula is more similar to Alaska and Patagonia than to the rest of the Antarctic continent. It is drained by fast glaciers, receives abundant precipitation, and melts significantly in the summer months. In recent decades, the Peninsula has experienced significant atmospheric warming (about 2 degrees C since 1950), which has triggered a vast and spectacular retreat of its floating ice shelves, glacier reduction, a decrease in permanent snow cover and a lengthening of the melt season. As a result, the contribution to sea level from this region could be rapid and substantial. With an area of 120,000 km, or ten times the Patagonia ice fields, the Peninsula could contribute as much as 0.4mm/yr sea level rise, which would be the largest single contribution to sea level from anywhere in the world. This region is being studied by NASA using a DC-8 equipped with the Airborne Synthetic Aperture Radar developed by scientists from NASA’s Jet Propulsion Laboratory. AirSAR will provide a baseline model and unprecedented mapping of the region. This data will make it possible to determine whether the warming trend is slowing, continuing or accelerating. AirSAR will also provide reliable information on ice shelf thickness to measure the contribution of the glaciers to sea level.

The Larsen Ice Shelf in Antarctica viewed from NASA's DC-8 aircraft during the AirSAR 2004 campaign. AirSAR 2004 is a three-week expedition in Central and South America by an international team of scientists that is using an all-weather imaging tool, called the Airborne Synthetic Aperture Radar (AirSAR), located onboard NASA's DC-8 airborne laboratory. Scientists from many parts of the world are combining ground research with NASA's AirSAR technology to improve and expand on the quality of research they are able to conduct. These photos are from the DC-8 aircraft while flying an AirSAR mission over Antarctica. The Antarctic Peninsula is more similar to Alaska and Patagonia than to the rest of the Antarctic continent. It is drained by fast glaciers, receives abundant precipitation, and melts significantly in the summer months. In recent decades, the Peninsula has experienced significant atmospheric warming (about 2 degrees C since 1950), which has triggered a vast and spectacular retreat of its floating ice shelves, glacier reduction, a decrease in permanent snow cover and a lengthening of the melt season. As a result, the contribution to sea level from this region could be rapid and substantial. With an area of 120,000 km, or ten times the Patagonia ice fields, the Peninsula could contribute as much as 0.4mm/yr sea level rise, which would be the largest single contribution to sea level from anywhere in the world. This region is being studied by NASA using a DC-8 equipped with the Airborne Synthetic Aperture Radar developed by scientists from NASA’s Jet Propulsion Laboratory. AirSAR will provide a baseline model and unprecedented mapping of the region. This data will make it possible to determine whether the warming trend is slowing, continuing or accelerating. AirSAR will also provide reliable information on ice shelf thickness to measure the contribution of the glaciers to sea level.
The Larsen Ice Shelf in Antarctica viewed from NASA's DC-8 aircraft during the AirSAR 2004 campaign. AirSAR 2004 is a three-week expedition in Central and South America by an international team of scientists that is using an all-weather imaging tool, called the Airborne Synthetic Aperture Radar (AirSAR), located onboard NASA's DC-8 airborne laboratory. Scientists from many parts of the world are combining ground research with NASA's AirSAR technology to improve and expand on the quality of research they are able to conduct. These photos are from the DC-8 aircraft while flying an AirSAR mission over Antarctica. The Antarctic Peninsula is more similar to Alaska and Patagonia than to the rest of the Antarctic continent. It is drained by fast glaciers, receives abundant precipitation, and melts significantly in the summer months. In recent decades, the Peninsula has experienced significant atmospheric warming (about 2 degrees C since 1950), which has triggered a vast and spectacular retreat of its floating ice shelves, glacier reduction, a decrease in permanent snow cover and a lengthening of the melt season. As a result, the contribution to sea level from this region could be rapid and substantial. With an area of 120,000 km, or ten times the Patagonia ice fields, the Peninsula could contribute as much as 0.4mm/yr sea level rise, which would be the largest single contribution to sea level from anywhere in the world. This region is being studied by NASA using a DC-8 equipped with the Airborne Synthetic Aperture Radar developed by scientists from NASA’s Jet Propulsion Laboratory. AirSAR will provide a baseline model and unprecedented mapping of the region. This data will make it possible to determine whether the warming trend is slowing, continuing or accelerating. AirSAR will also provide reliable information on ice shelf thickness to measure the contribution of the glaciers to sea level.
The Larsen Ice Shelf in Antarctica viewed from NASA's DC-8 aircraft during the AirSAR 2004 campaign. AirSAR 2004 is a three-week expedition in Central and South America by an international team of scientists that is using an all-weather imaging tool, called the Airborne Synthetic Aperture Radar (AirSAR), located onboard NASA's DC-8 airborne laboratory. Scientists from many parts of the world are combining ground research with NASA's AirSAR technology to improve and expand on the quality of research they are able to conduct. These photos are from the DC-8 aircraft while flying an AirSAR mission over Antarctica. The Antarctic Peninsula is more similar to Alaska and Patagonia than to the rest of the Antarctic continent. It is drained by fast glaciers, receives abundant precipitation, and melts significantly in the summer months. In recent decades, the Peninsula has experienced significant atmospheric warming (about 2 degrees C since 1950), which has triggered a vast and spectacular retreat of its floating ice shelves, glacier reduction, a decrease in permanent snow cover and a lengthening of the melt season. As a result, the contribution to sea level from this region could be rapid and substantial. With an area of 120,000 km, or ten times the Patagonia ice fields, the Peninsula could contribute as much as 0.4mm/yr sea level rise, which would be the largest single contribution to sea level from anywhere in the world. This region is being studied by NASA using a DC-8 equipped with the Airborne Synthetic Aperture Radar developed by scientists from NASA’s Jet Propulsion Laboratory. AirSAR will provide a baseline model and unprecedented mapping of the region. This data will make it possible to determine whether the warming trend is slowing, continuing or accelerating. AirSAR will also provide reliable information on ice shelf thickness to measure the contribution of the glaciers to sea level.
The Larsen Ice Shelf in Antarctica viewed from NASA's DC-8 aircraft during the AirSAR 2004 campaign. AirSAR 2004 is a three-week expedition in Central and South America by an international team of scientists that is using an all-weather imaging tool, called the Airborne Synthetic Aperture Radar (AirSAR), located onboard NASA's DC-8 airborne laboratory. Scientists from many parts of the world are combining ground research with NASA's AirSAR technology to improve and expand on the quality of research they are able to conduct. These photos are from the DC-8 aircraft while flying an AirSAR mission over Antarctica. The Antarctic Peninsula is more similar to Alaska and Patagonia than to the rest of the Antarctic continent. It is drained by fast glaciers, receives abundant precipitation, and melts significantly in the summer months. In recent decades, the Peninsula has experienced significant atmospheric warming (about 2 degrees C since 1950), which has triggered a vast and spectacular retreat of its floating ice shelves, glacier reduction, a decrease in permanent snow cover and a lengthening of the melt season. As a result, the contribution to sea level from this region could be rapid and substantial. With an area of 120,000 km, or ten times the Patagonia ice fields, the Peninsula could contribute as much as 0.4mm/yr sea level rise, which would be the largest single contribution to sea level from anywhere in the world. This region is being studied by NASA using a DC-8 equipped with the Airborne Synthetic Aperture Radar developed by scientists from NASA’s Jet Propulsion Laboratory. AirSAR will provide a baseline model and unprecedented mapping of the region. This data will make it possible to determine whether the warming trend is slowing, continuing or accelerating. AirSAR will also provide reliable information on ice shelf thickness to measure the contribution of the glaciers to sea level.
The Larsen Ice Shelf in Antarctica viewed from NASA's DC-8 aircraft during the AirSAR 2004 campaign. AirSAR 2004 is a three-week expedition in Central and South America by an international team of scientists that is using an all-weather imaging tool, called the Airborne Synthetic Aperture Radar (AirSAR), located onboard NASA's DC-8 airborne laboratory. Scientists from many parts of the world are combining ground research with NASA's AirSAR technology to improve and expand on the quality of research they are able to conduct. These photos are from the DC-8 aircraft while flying an AirSAR mission over Antarctica. The Antarctic Peninsula is more similar to Alaska and Patagonia than to the rest of the Antarctic continent. It is drained by fast glaciers, receives abundant precipitation, and melts significantly in the summer months. In recent decades, the Peninsula has experienced significant atmospheric warming (about 2 degrees C since 1950), which has triggered a vast and spectacular retreat of its floating ice shelves, glacier reduction, a decrease in permanent snow cover and a lengthening of the melt season. As a result, the contribution to sea level from this region could be rapid and substantial. With an area of 120,000 km, or ten times the Patagonia ice fields, the Peninsula could contribute as much as 0.4mm/yr sea level rise, which would be the largest single contribution to sea level from anywhere in the world. This region is being studied by NASA using a DC-8 equipped with the Airborne Synthetic Aperture Radar developed by scientists from NASA’s Jet Propulsion Laboratory. AirSAR will provide a baseline model and unprecedented mapping of the region. This data will make it possible to determine whether the warming trend is slowing, continuing or accelerating. AirSAR will also provide reliable information on ice shelf thickness to measure the contribution of the glaciers to sea level.
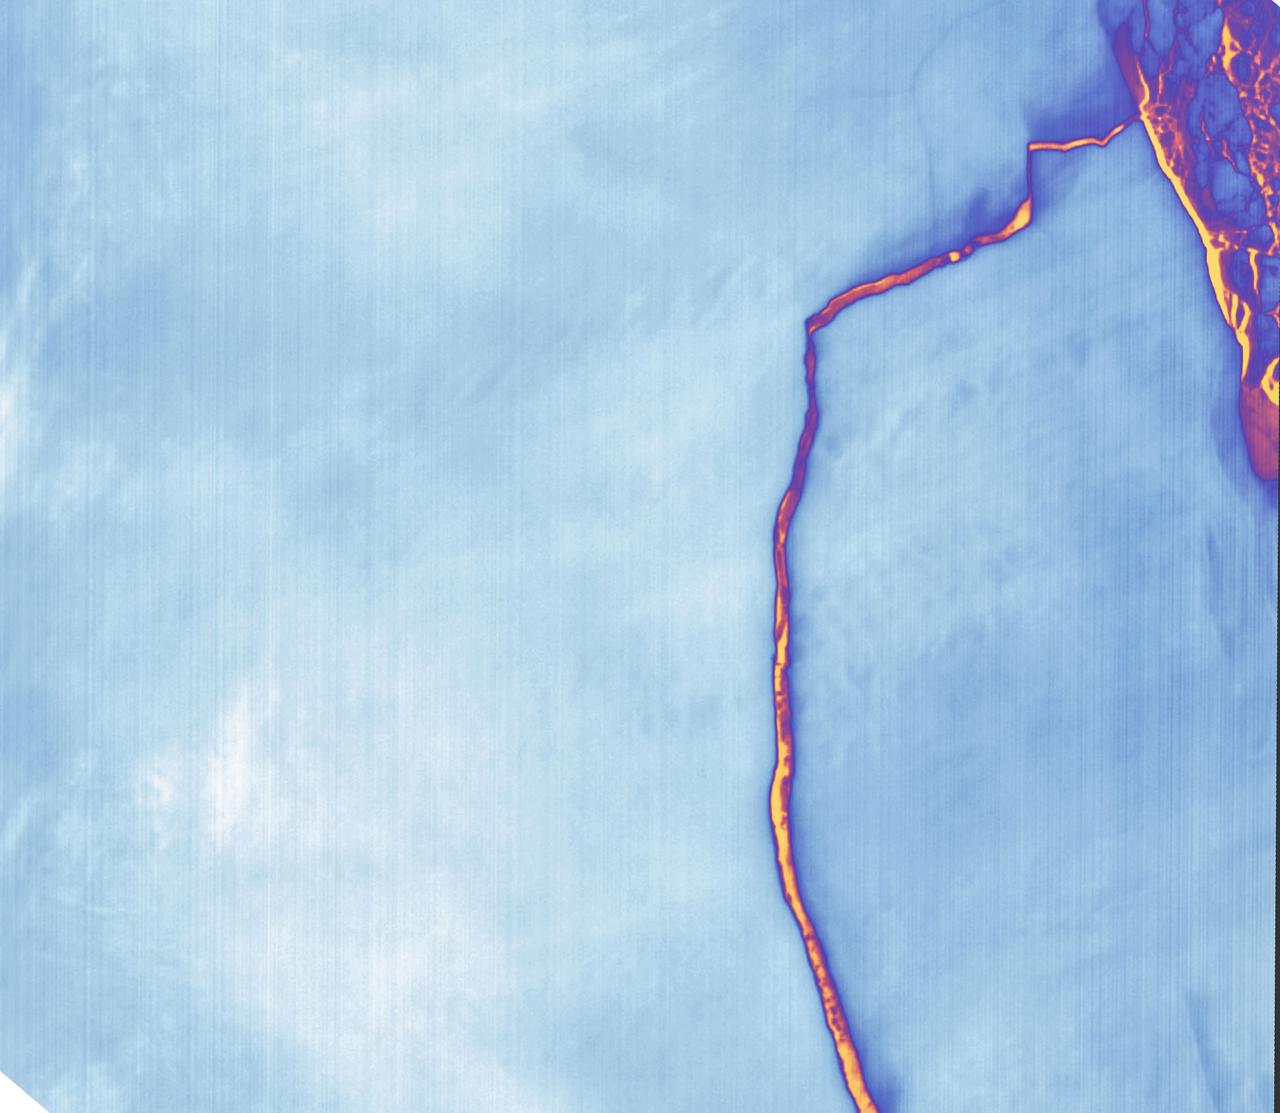
Sometime between July 10 and July 12, an iceberg about the size of Delaware split off from Antarctica’s Larsen C ice shelf. Now that nearly 5,800 square kilometers (2,200 square miles) of ice has broken away, the Larsen C shelf area has shrunk by approximately 10 percent. This false-color image was captured by Landsat’s Thermal Infrared Sensor (TIRS). It shows the relative warmth or coolness of the landscape. Orange indicates where the surface is the warmest, most notably the mélange between the new berg and the ice shelf. Light blues and whites are the coldest areas, including the ice shelf and the iceberg. On July 13, the U.S. National Ice Center issued a press release confirming the new iceberg and officially naming it A-68. Credit: NASA Earth Observatory images by Joshua Stevens, using Landsat data from the U.S. Geological Survey <b><a href="http://www.nasa.gov/audience/formedia/features/MP_Photo_Guidelines.html" rel="nofollow">NASA image use policy.</a></b> <b><a href="http://www.nasa.gov/centers/goddard/home/index.html" rel="nofollow">NASA Goddard Space Flight Center</a></b> enables NASA’s mission through four scientific endeavors: Earth Science, Heliophysics, Solar System Exploration, and Astrophysics. Goddard plays a leading role in NASA’s accomplishments by contributing compelling scientific knowledge to advance the Agency’s mission. <b>Follow us on <a href="http://twitter.com/NASAGoddardPix" rel="nofollow">Twitter</a></b> <b>Like us on <a href="http://www.facebook.com/pages/Greenbelt-MD/NASA-Goddard/395013845897?ref=tsd" rel="nofollow">Facebook</a></b> <b>Find us on <a href="http://instagrid.me/nasagoddard/?vm=grid" rel="nofollow">Instagram</a></b>
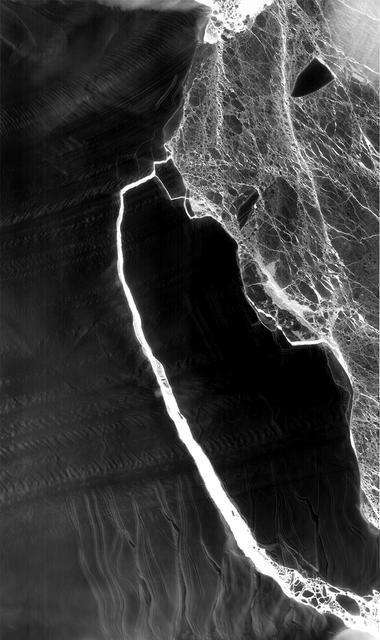
As Antarctica remains shrouded in darkness during the Southern Hemisphere winter, the Thermal Infrared Sensor (TIRS) on Landsat 8 captured a new snap of the 2,240-square-mile iceberg that split off from the Antarctic Peninsula’s Larsen C ice shelf on July 10-12. The satellite imagery is a composite of Landsat 8 as it past on July 14 and July 21 and shows that the main berg, A-68, has already lost several smaller pieces. The A-68 iceberg is being carried by currents northward out of its embayment on the Larsen C ice shelf. The latest imagery also details a group of three small, not yet released icebergs at the north end of the embayment. Credits: NASA Goddard/UMBC JCET, Christopher A. Shuman <b><a href="http://www.nasa.gov/audience/formedia/features/MP_Photo_Guidelines.html" rel="nofollow">NASA image use policy.</a></b> <b><a href="http://www.nasa.gov/centers/goddard/home/index.html" rel="nofollow">NASA Goddard Space Flight Center</a></b> enables NASA’s mission through four scientific endeavors: Earth Science, Heliophysics, Solar System Exploration, and Astrophysics. Goddard plays a leading role in NASA’s accomplishments by contributing compelling scientific knowledge to advance the Agency’s mission. <b>Follow us on <a href="http://twitter.com/NASAGoddardPix" rel="nofollow">Twitter</a></b> <b>Like us on <a href="http://www.facebook.com/pages/Greenbelt-MD/NASA-Goddard/395013845897?ref=tsd" rel="nofollow">Facebook</a></b> <b>Find us on <a href="http://instagrid.me/nasagoddard/?vm=grid" rel="nofollow">Instagram</a></b>