
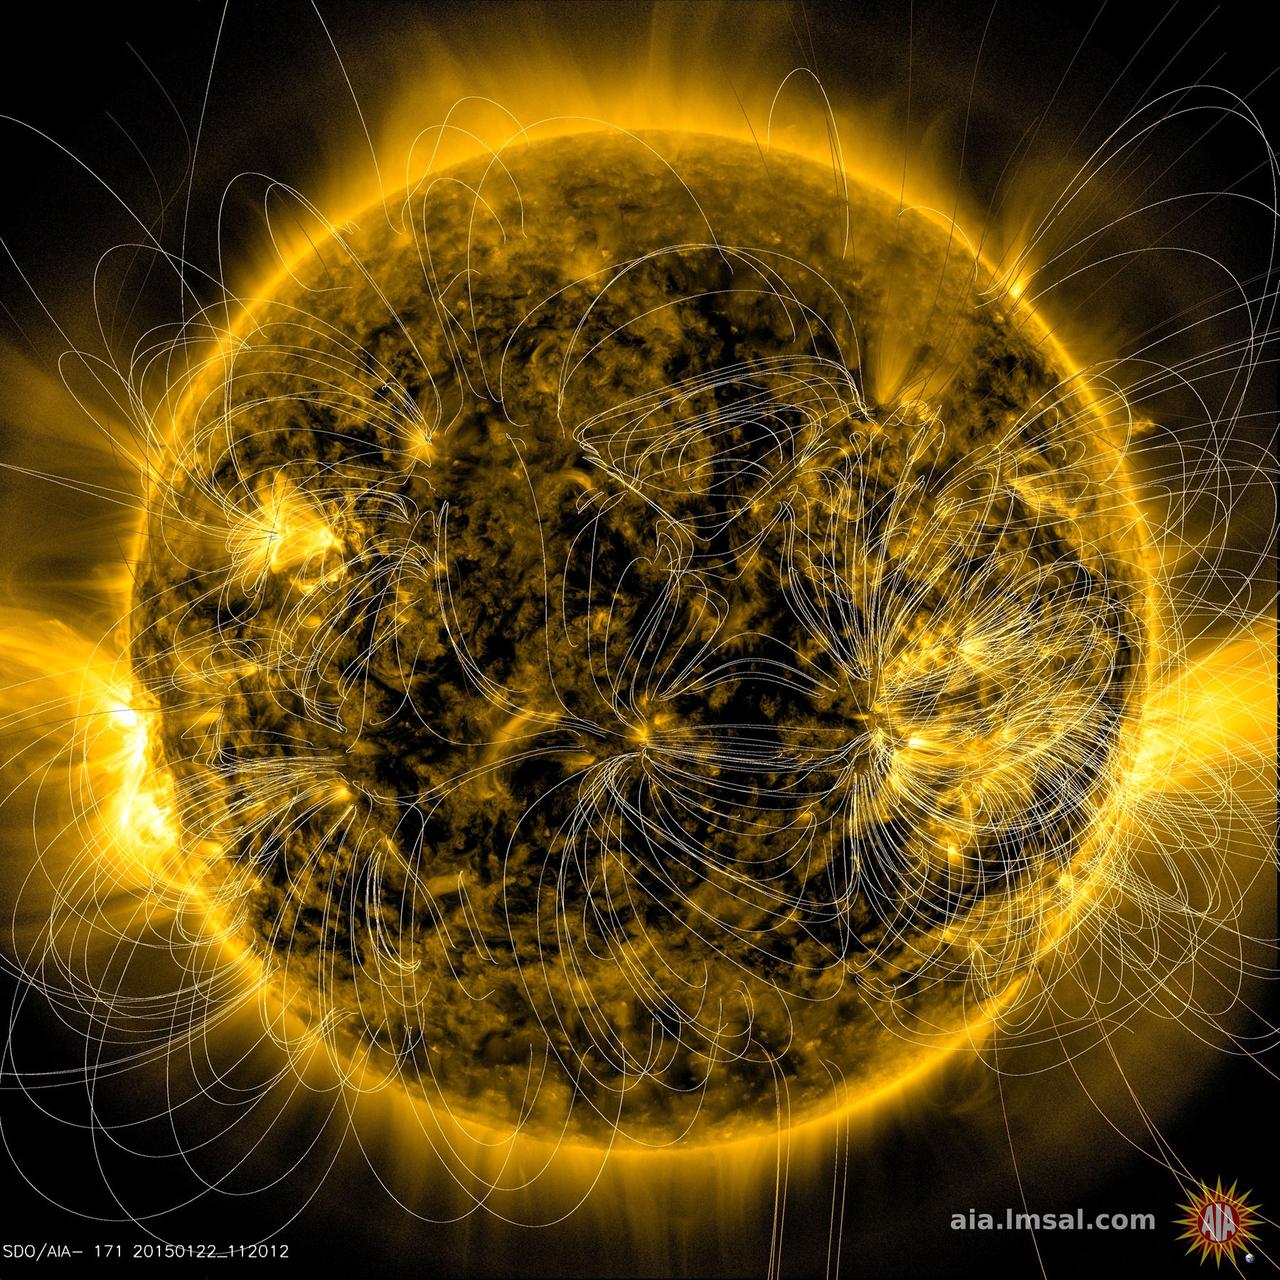
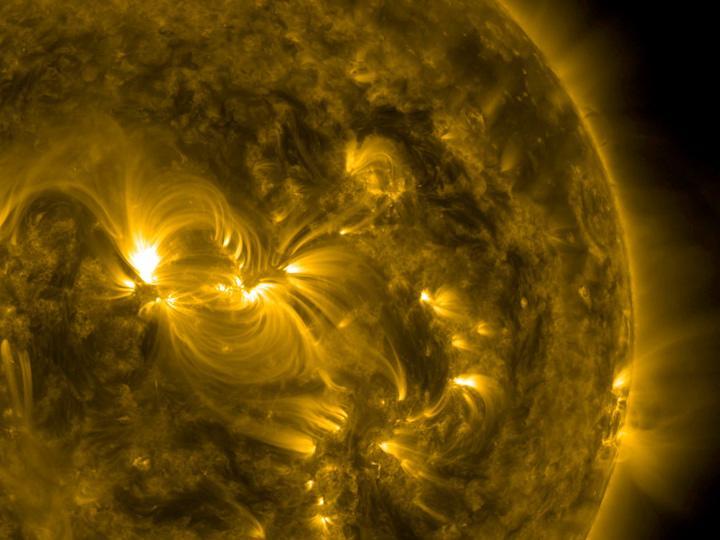
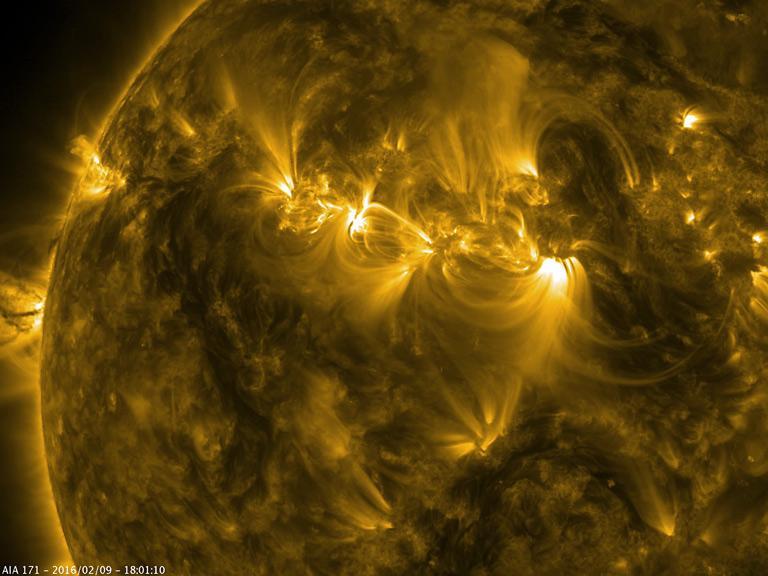
This illustration lays a depiction of the sun's magnetic fields over an image captured by NASA’s Solar Dynamics Observatory on March 12, 2016. The complex overlay of lines can teach scientists about the ways the sun's magnetism changes in response to the constant movement on and inside the sun. Note how the magnetic fields are densest near the bright spots visible on the sun – which are magnetically strong active regions – and many of the field lines link one active region to another. This magnetic map was created using the PFSS – Potential Field Source Surface – model, a model of the magnetic field in the sun’s atmosphere based on magnetic measurements of the solar surface. The underlying image was taken in extreme ultraviolet wavelengths of 171 angstroms. This type of light is invisible to our eyes, but is colorized here in gold. Credits: NASA/SDO/AIA/LMSAL <b><a href="http://www.nasa.gov/audience/formedia/features/MP_Photo_Guidelines.html" rel="nofollow">NASA image use policy.</a></b> <b><a href="http://www.nasa.gov/centers/goddard/home/index.html" rel="nofollow">NASA Goddard Space Flight Center</a></b> enables NASA’s mission through four scientific endeavors: Earth Science, Heliophysics, Solar System Exploration, and Astrophysics. Goddard plays a leading role in NASA’s accomplishments by contributing compelling scientific knowledge to advance the Agency’s mission. <b>Follow us on <a href="http://twitter.com/NASAGoddardPix" rel="nofollow">Twitter</a></b> <b>Like us on <a href="http://www.facebook.com/pages/Greenbelt-MD/NASA-Goddard/395013845897?ref=tsd" rel="nofollow">Facebook</a></b> <b>Find us on <a href="http://instagrid.me/nasagoddard/?vm=grid" rel="nofollow">Instagram</a></b>
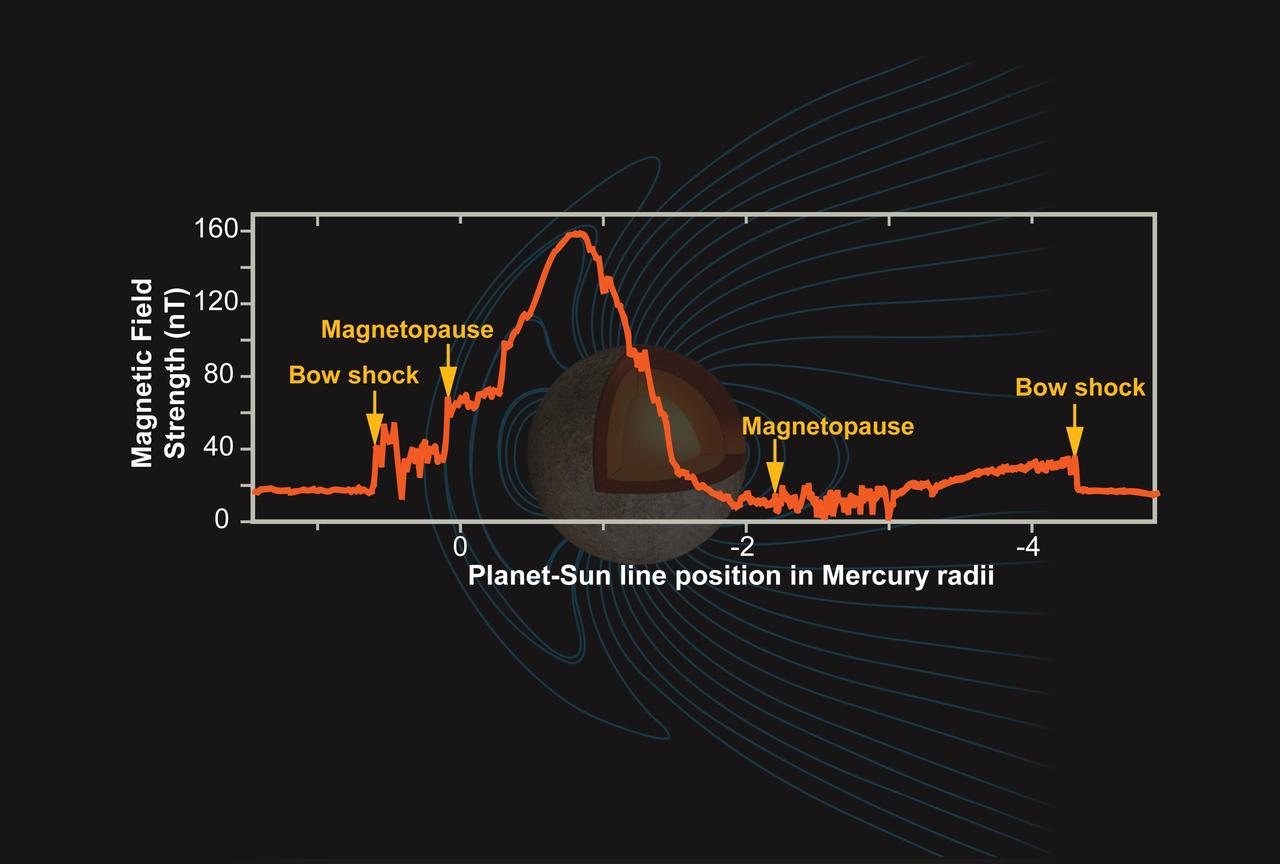
Mercury Magnetic Field
Mercury Magnetic Field Lines
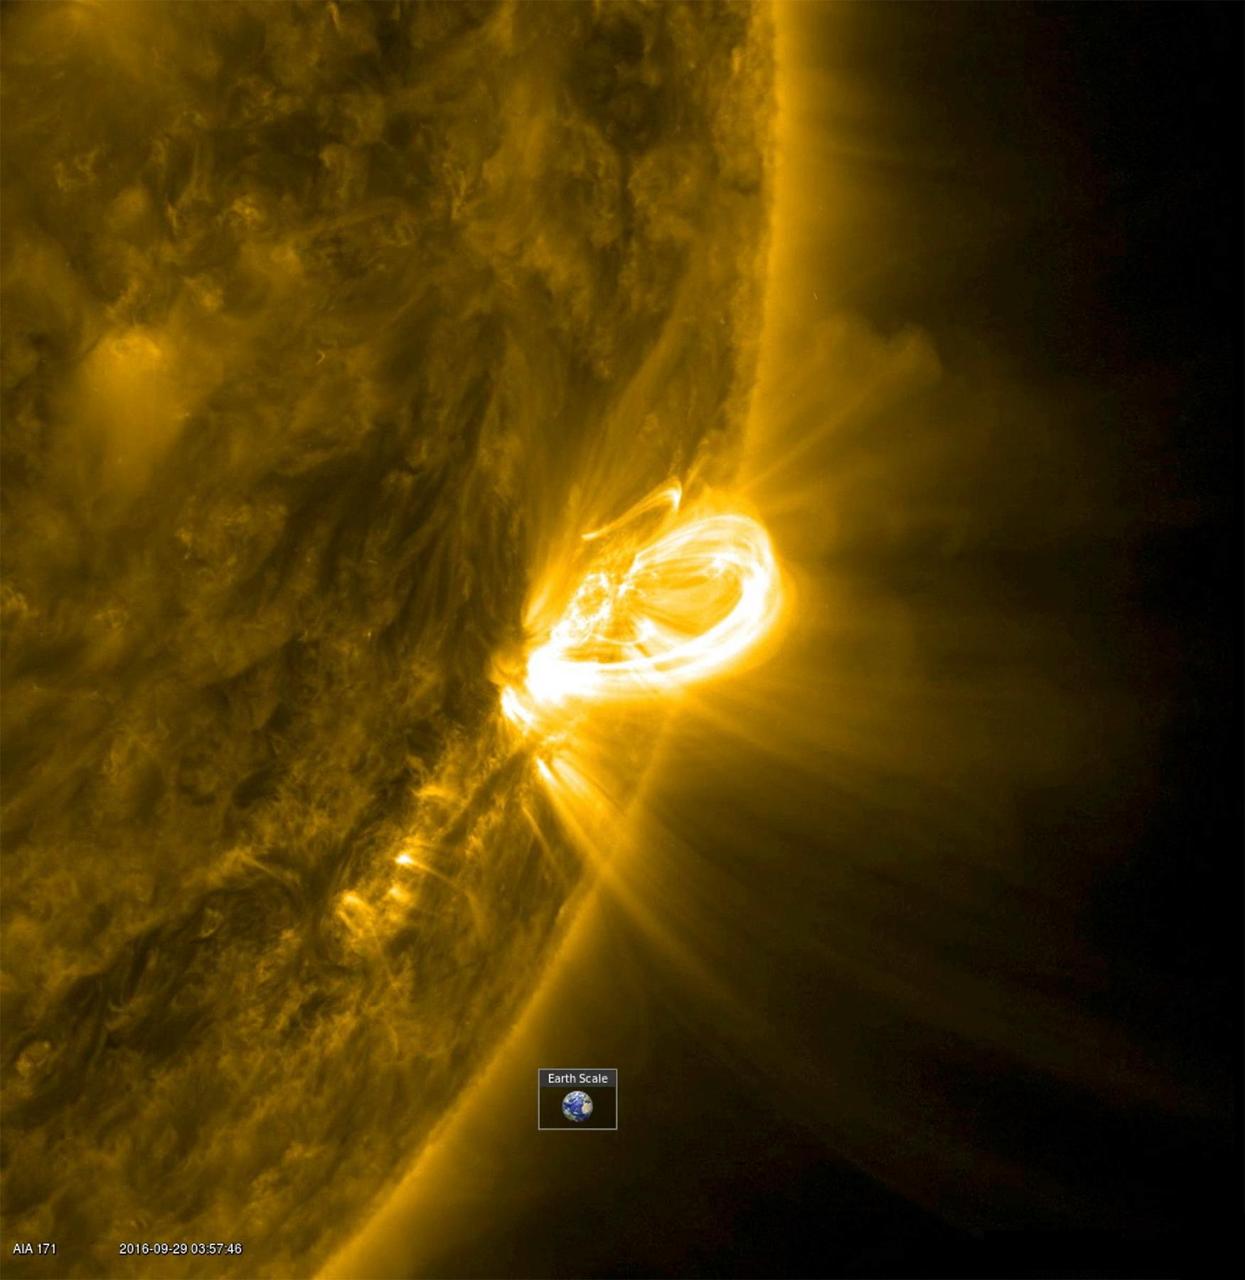
When an active region rotated into a profile view, SDO was able to capture the magnificent loops arching above an active region (Sept. 28-29, 2016). Active region are areas of strong magnetic fields. The magnetic field lines above these regions are illuminated by charged particles spiraling along them. The images were taken in a wavelength of extreme ultraviolet light. The video covers 12 hours of activity. The Earth was inset to give a sense of the scale of these towering arches. Movies are available at http://photojournal.jpl.nasa.gov/catalog/PIA21101
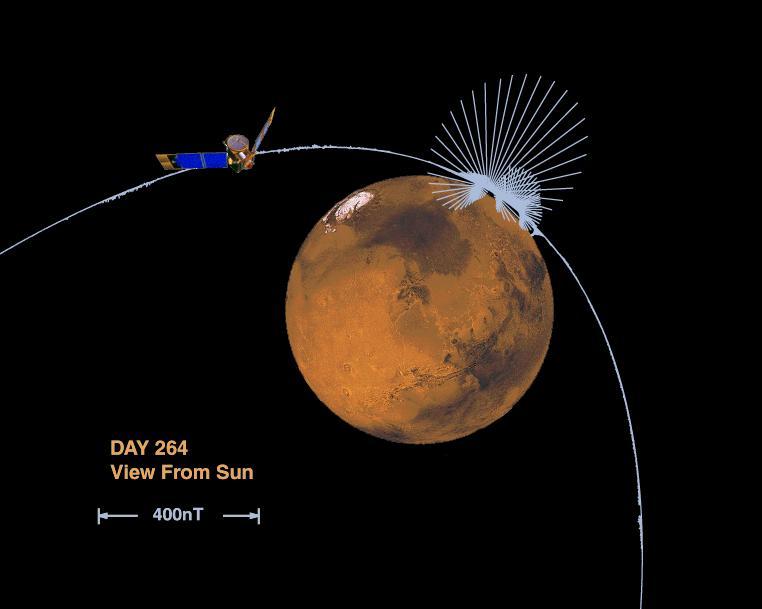
Orientation and Magnitude of Mars Magnetic Field

Mars Crustal Magnetic Field Remnants
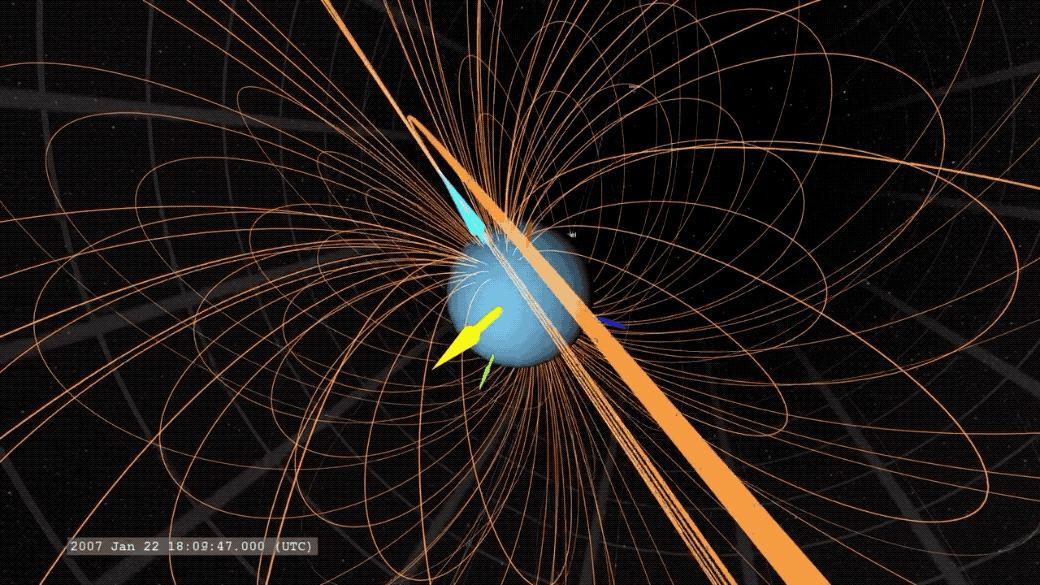
An animated GIF showing Uranus' magnetic field. The yellow arrow points to the Sun, the light blue arrow marks Uranus' magnetic axis, and the dark blue arrow marks Uranus' rotation axis. Animation available at https://photojournal.jpl.nasa.gov/catalog/PIA23683
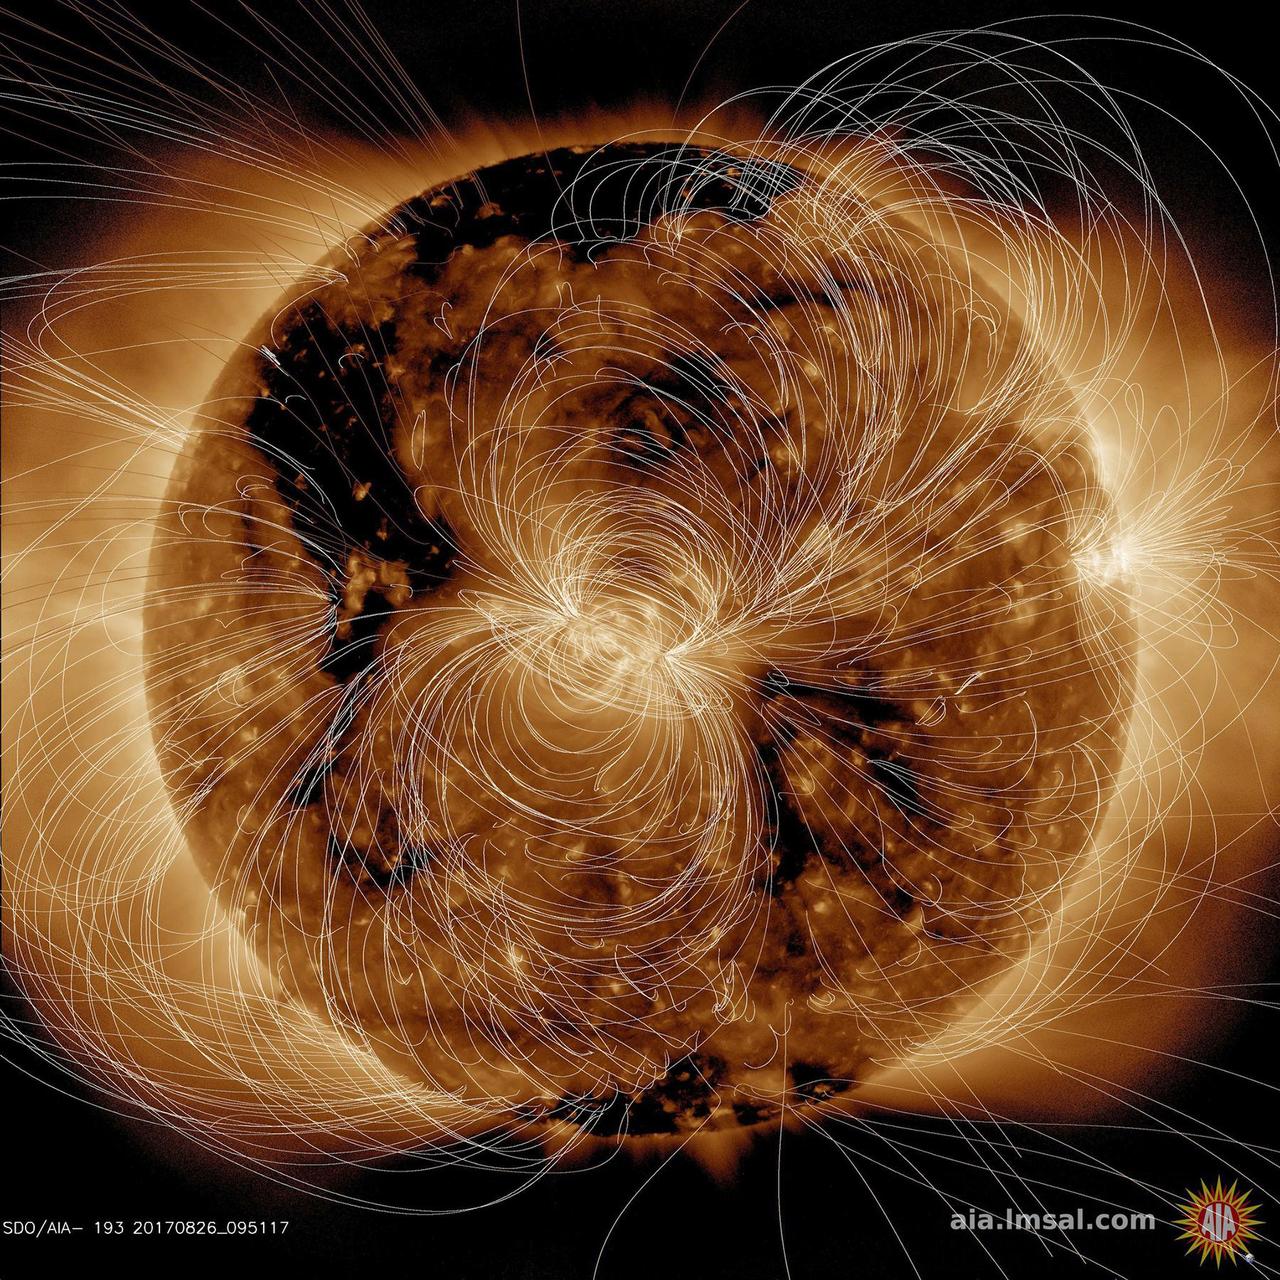
Scientists have developed a way to produce models of where the magnetic field lines are several times each day. Here we have created a time-lapse version of these models over four days (2-3 each day) to give you a peek at how these change over time. The spiraling arcs of magnetic field lines emerge from active regions and connect back to areas with the opposite polarity. The field lines are more concentrated where regions are more magnetically intense. And of course, they rotate with the rotation of the Sun. Credit: NASA/Solar Dynamics Observatory <b><a href="http://www.nasa.gov/audience/formedia/features/MP_Photo_Guidelines.html" rel="nofollow">NASA image use policy.</a></b> <b><a href="http://www.nasa.gov/centers/goddard/home/index.html" rel="nofollow">NASA Goddard Space Flight Center</a></b> enables NASA’s mission through four scientific endeavors: Earth Science, Heliophysics, Solar System Exploration, and Astrophysics. Goddard plays a leading role in NASA’s accomplishments by contributing compelling scientific knowledge to advance the Agency’s mission. <b>Follow us on <a href="http://twitter.com/NASAGoddardPix" rel="nofollow">Twitter</a></b> <b>Like us on <a href="http://www.facebook.com/pages/Greenbelt-MD/NASA-Goddard/395013845897?ref=tsd" rel="nofollow">Facebook</a></b> <b>Find us on <a href="http://instagram.com/nasagoddard?vm=grid" rel="nofollow">Instagram</a></b>
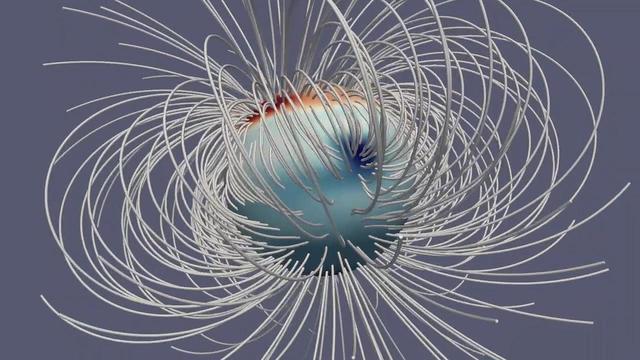
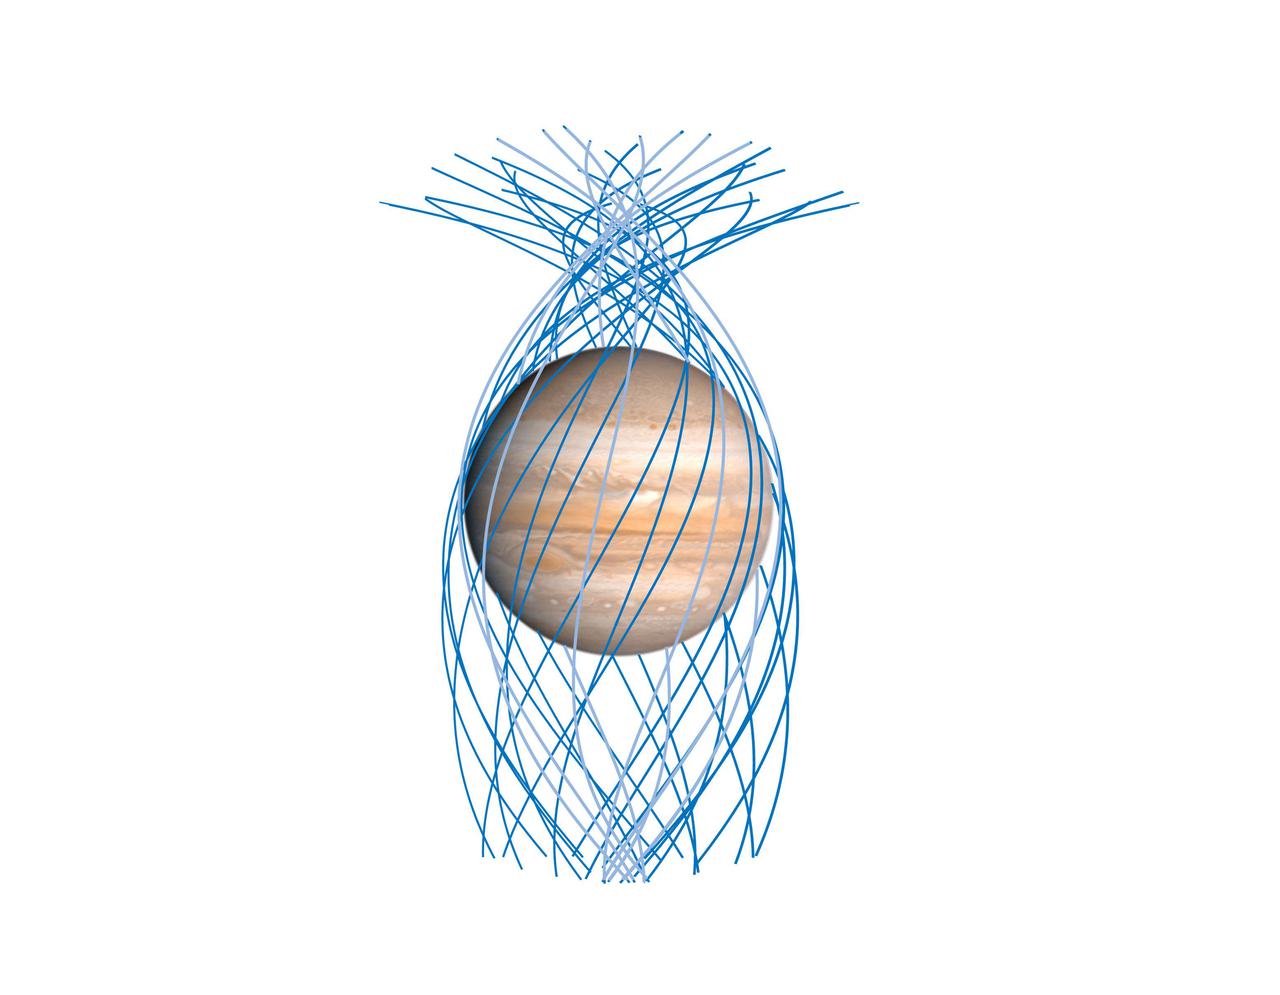
This animation illustrates Jupiter's magnetic field at a single moment in time. The Great Blue Spot, an-invisible-to-the-eye concentration of magnetic field near the equator, stands out as a particularly strong feature. The gray lines (called field lines) show the field's direction in space, and the deepness of the color corresponds to the strength of the magnetic field (with dark red and dark blue for regions with strongly positive and strongly negative fields, respectively). The animation first appeared in a Sept. 5, 2018, paper in the Journal Nature. Animation available at https://photojournal.jpl.nasa.gov/catalog/PIA23229.
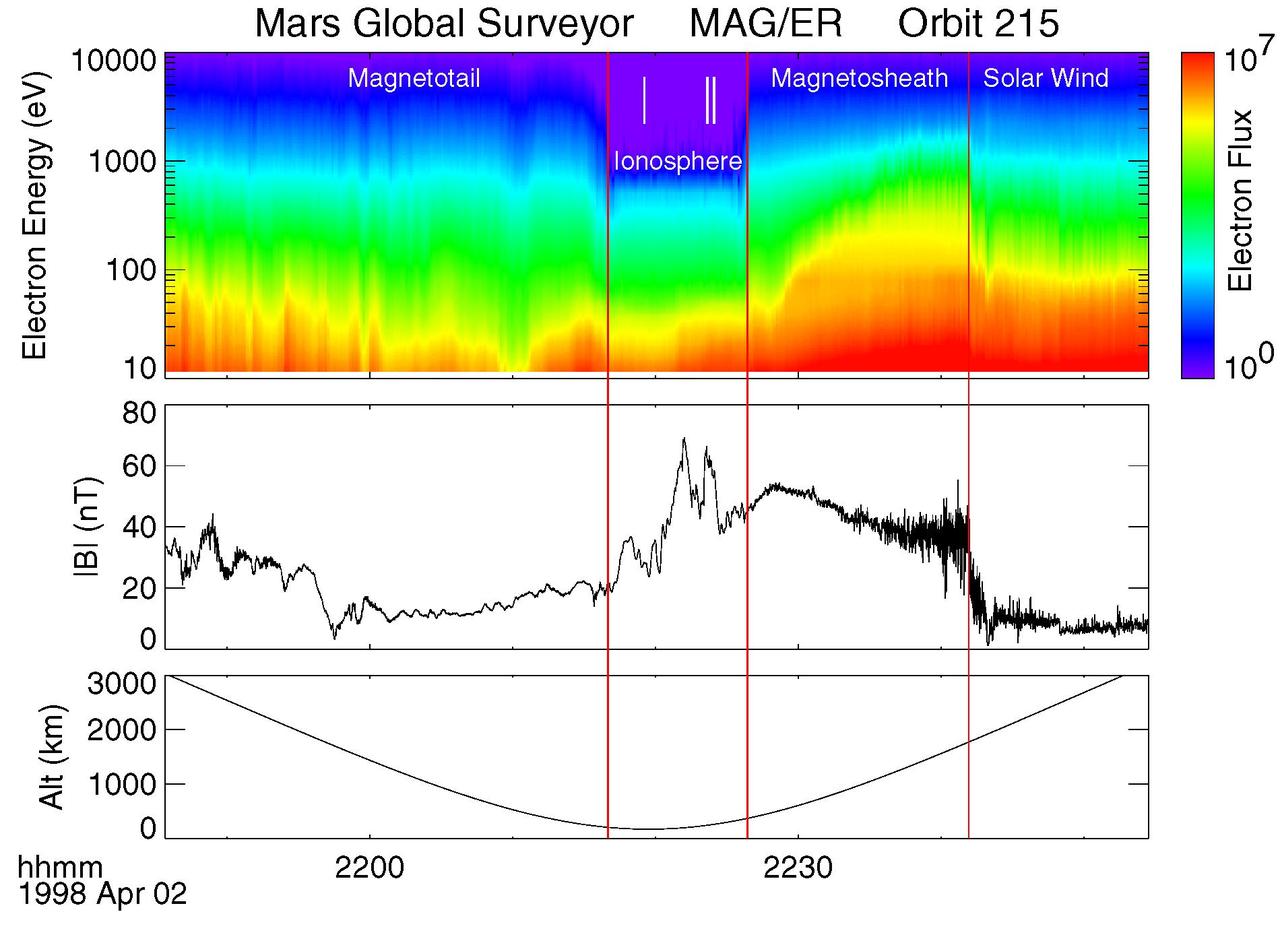
Electron and Magnetic Field Observations MAG/ER
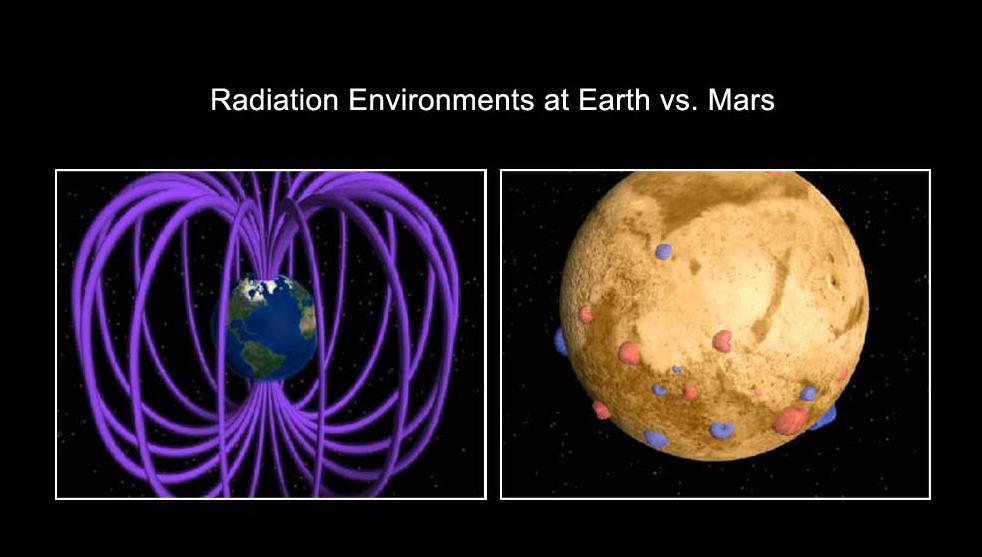
This is an artist concept comparing the present day magnetic fields on Earth and Mars. Earth magnetic field is generated by an active dynamo -- a hot core of molten metal.
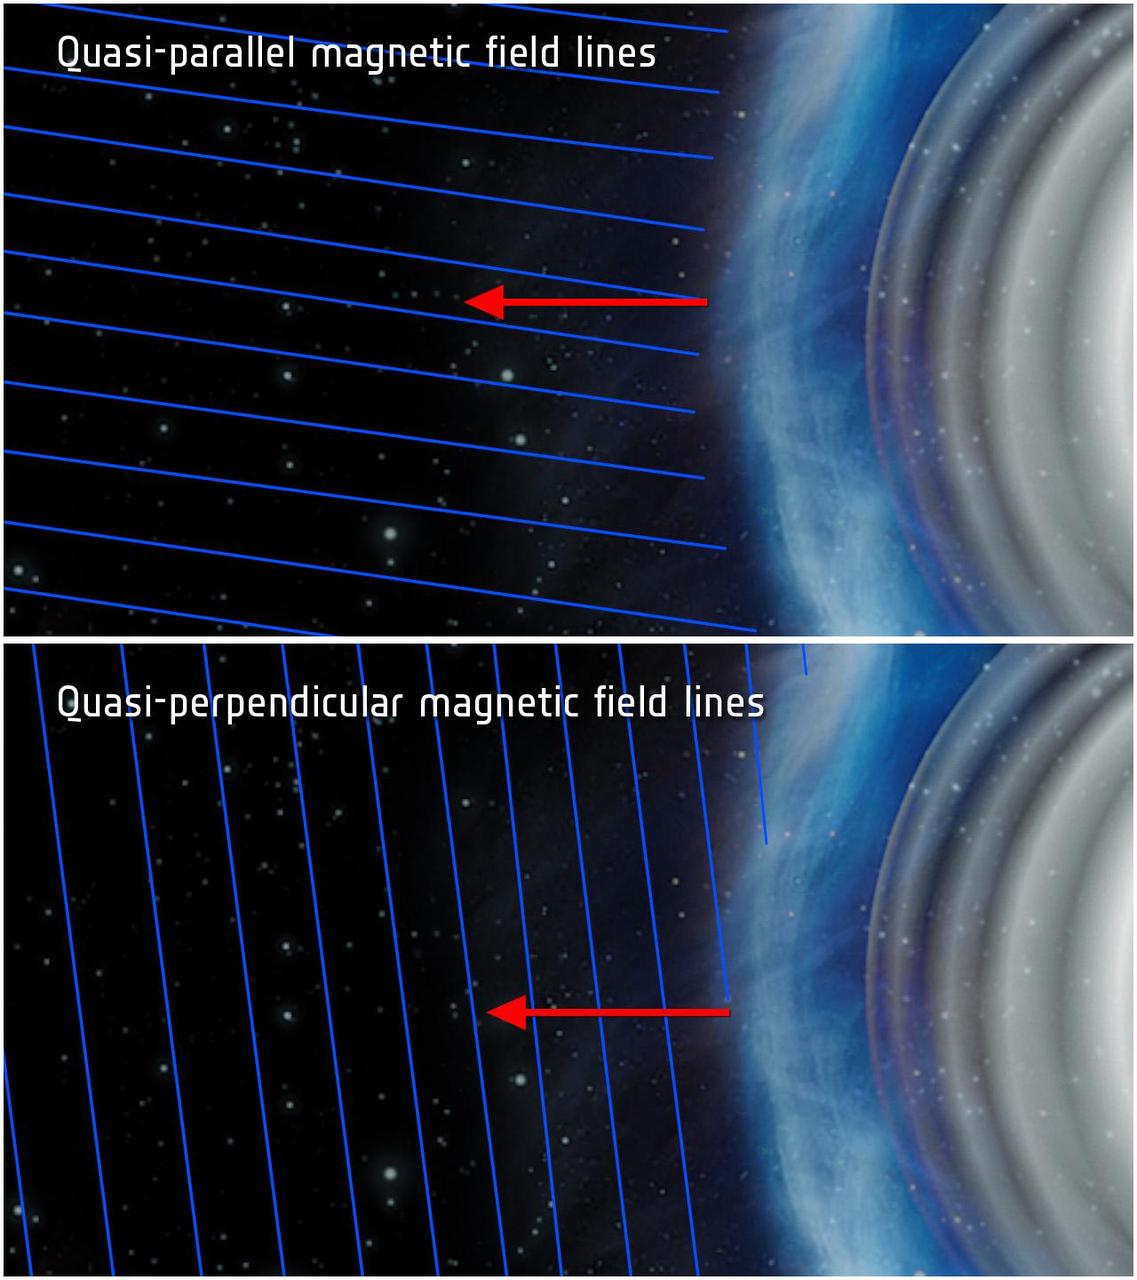
This illustration shows quasi-parallel top and quasi-perpendicular bottom magnetic field conditions at a planetary bow shock. Bow shocks are shockwaves created when the solar wind blows on a planet magnetic field.
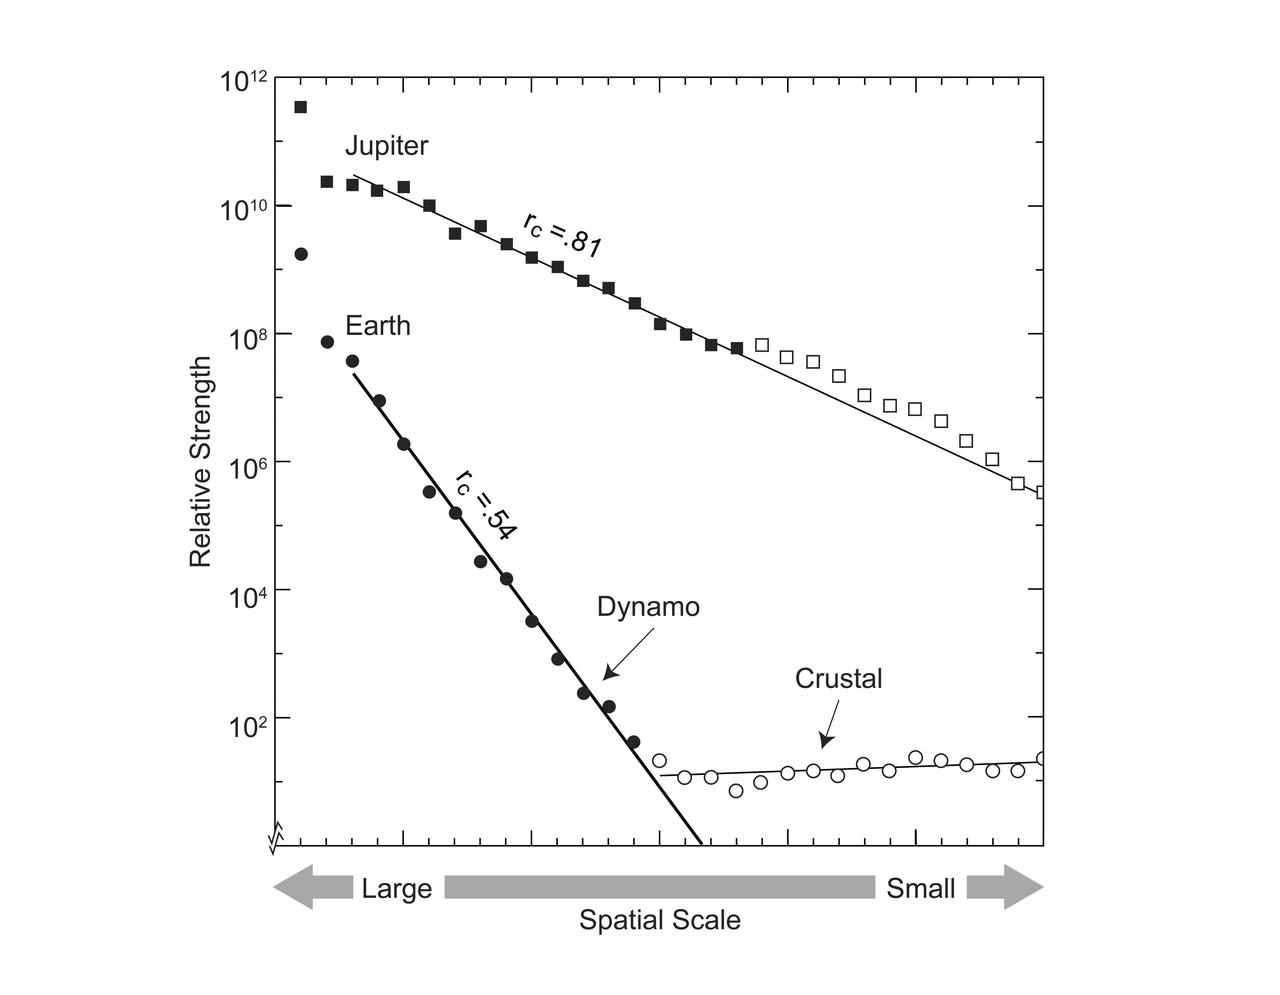
This graphic compares the magnetic fields of Earth and Jupiter, characterizing the field on the surface of each planet in terms of spatial scale, with large scale to the left, and small scale to the right. The linear progression of terms characterizing Earth's field identifies a dynamo core radius at 0.54 planet radius and crustal magnetization at smaller scales. By analogy, the new Jupiter model identifies a dynamo core radius at 0.81 planet radius, in the convective metallic hydrogen just beneath a zone stabilized by helium rain. https://photojournal.jpl.nasa.gov/catalog/PIA25064
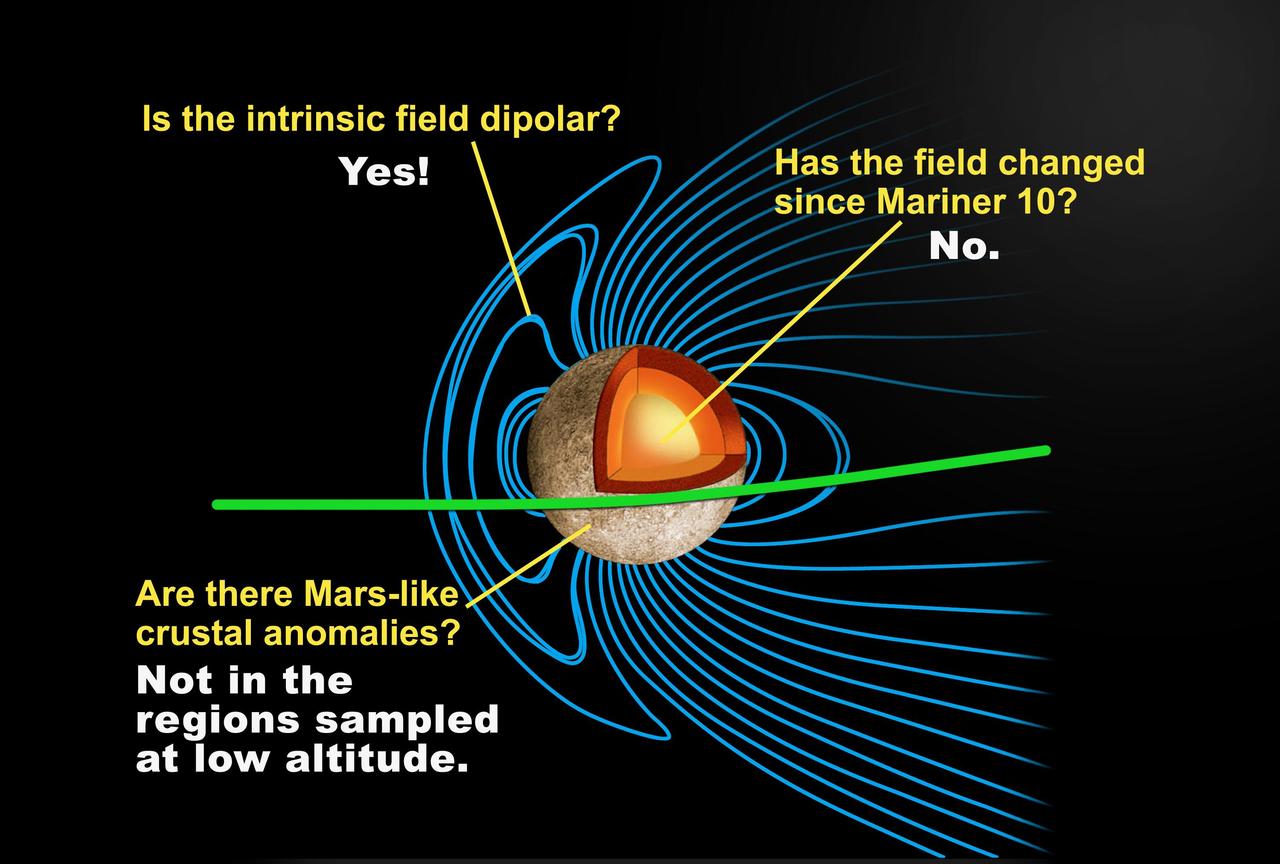
This depiction of a simulated Mercury magnetosphere shows representations of the distortions of the planetary magnetic field lines blue by the solar wind.
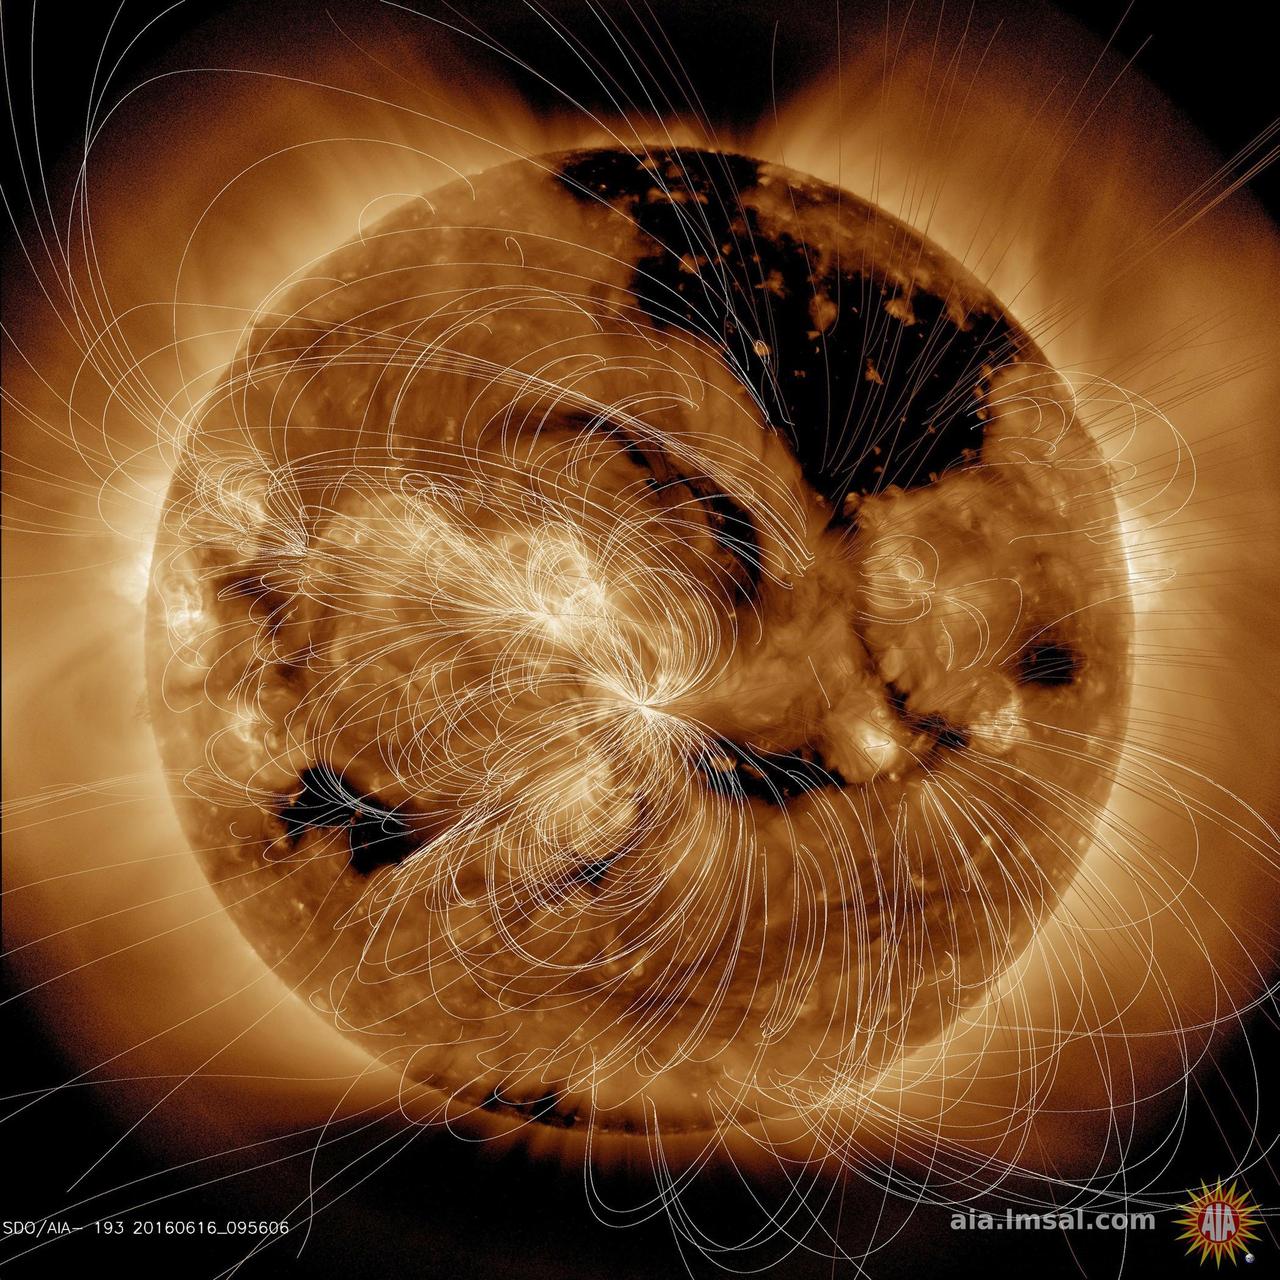
Each day NASA solar scientists produce overlays (in white lines) that show their estimation of how the magnetic field lines above the sun are configured (June16, 2016). In the video clip we show the sun in a wavelength of extreme ultraviolet light, then reveal the magnetic field line configuration in the same wavelength. Notice how the lines are tightly bundled near the lighter-toned active regions, which are magnetically intense regions. The magnetic lines from the darker areas, called coronal holes, open out into space and the extended lines show that. Our magnetically active sun is a dynamic body that changes all the time. Movie are also available at the Photojournal. http://photojournal.jpl.nasa.gov/catalog/PIA20881
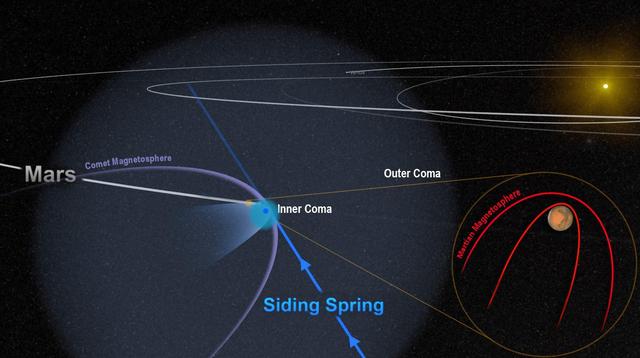
This artist depiction shows the close encounter between comet Siding Sprng and Mars in 2014. The comet powerful magnetic field temporarily merged with, and overwhelmed, the planet weak magnetic field.
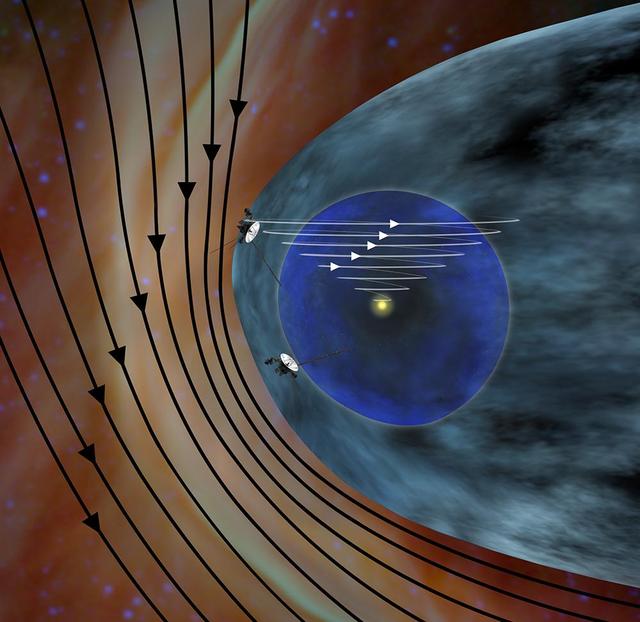
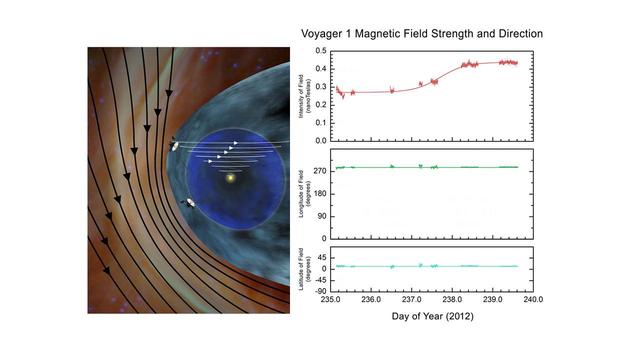
This artist concept shows the different expected directions of the magnetic fields in interstellar space black lines and the magnetic field emanating from our sun white lines as NASA Voyager 1 spacecraft travels northward out of the heliosphere.
NASA's Solar Dynamics Observatory (SDO) scientists use their computer models to generate a view of the sun's magnetic field (Aug. 10, 2018). We took the opportunity to compare an extreme ultraviolet view of the sun with the same image showing the superimposed field lines. The bright active region right at the central area of the sun clearly shows a concentration of field lines, as well as the small active region at the sun's right edge, but to a lesser extent. Magnetism drives the dynamic activity near the sun's surface. Movies are available at https://photojournal.jpl.nasa.gov/catalog/PIA22662

These banana-shaped loops are part of a computer-generated snapshot of our sun's magnetic field. The solar magnetic-field lines loop through the sun's corona, break through the sun's surface, and cornect regions of magnetic activity, such as sunspots. This image --part of a magnetic-field study of the sun by NASA's Allen Gary -- shows the outer portion (skins) of interconnecting systems of hot (2 million degrees Kelvin) coronal loops within and between two active magnetic regions on opposite sides of the sun's equator. The diameter of these coronal loops at their foot points is approximately the same size as the Earth's radius (about 6,000 kilometers).
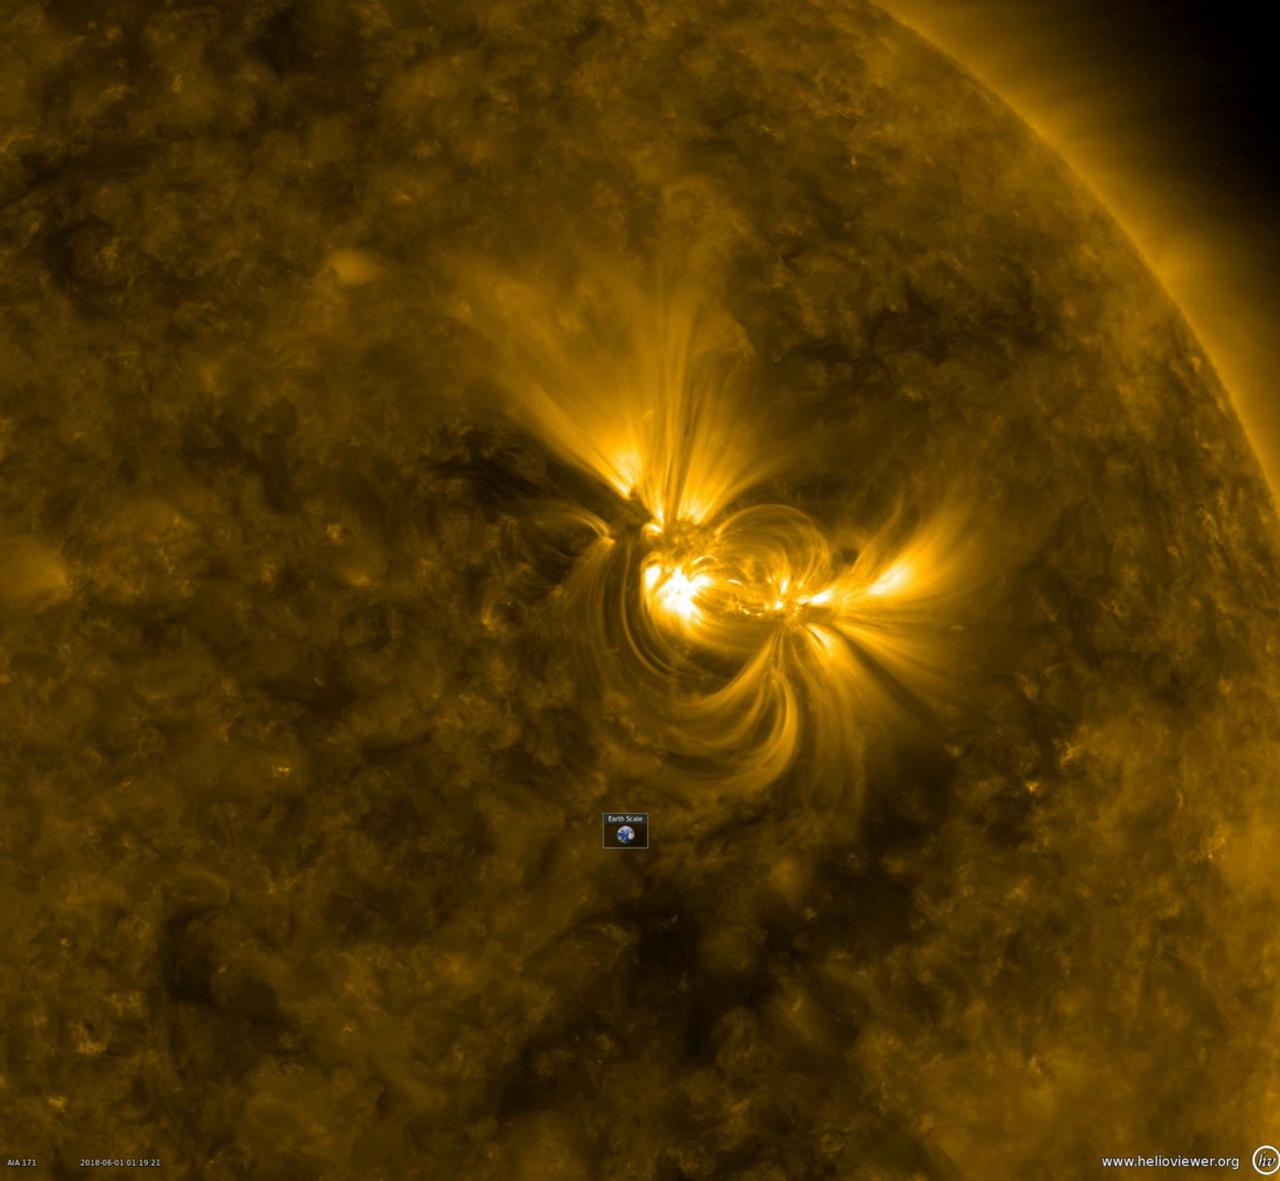
This close-up from a video clip taken May 30-June 1, 2018 shows a large active region in extreme ultraviolet light as the bright magnetic field lines above it shift and twist. Note the Earth scale below the active region: the longest loops extend about 10 times the diameter of Earth. When the magnetic field lines get themselves tangled up enough, they can erupt with a solar storm. Videos are available at https://photojournal.jpl.nasa.gov/catalog/PIA22475
The artist concept on left is based on theoretical models predicting the direction and strength of magnetic field lines coming from the sun and interstellar space.
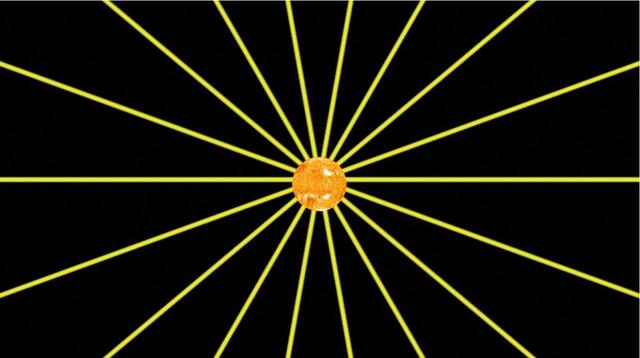
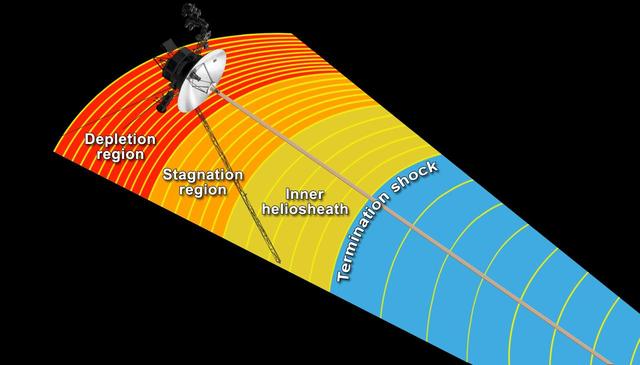
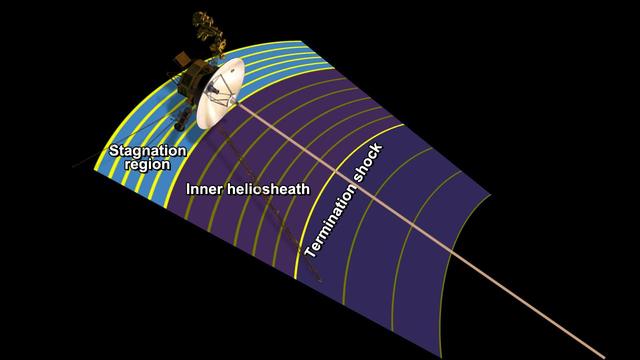
This frame from an animation shows how the magnetic field lines emanating from our sun spiral out into the solar system as the sun rotates. NASA Voyager 1 is in an area scientists are calling the stagnation region, at the outer layer of the heliosphere.
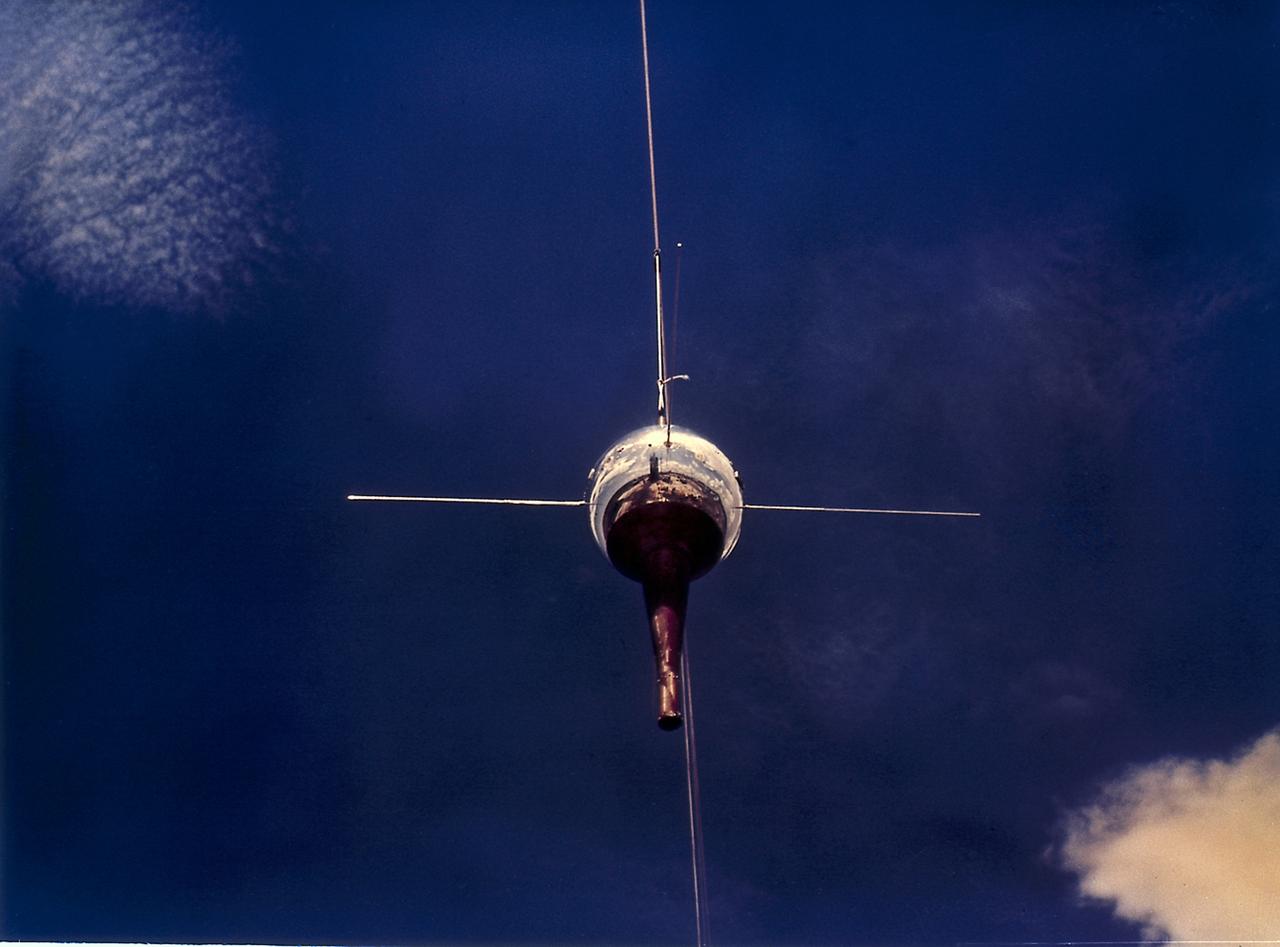
The Vangard III satellite to study the magnetic field and radiation belt in orbit. NASA successfully launched Vanguard III (SLV-7) from Cape Canaveral, Florida on September 18, 1959.
Crystal Growth in magnetic fields, a float-zone sample, the surface tension of the melt keeps the sample suspended between the sample rods in the furnace forming an actual liquid bridge. Principal Investigator: Dr. Frank Szofran
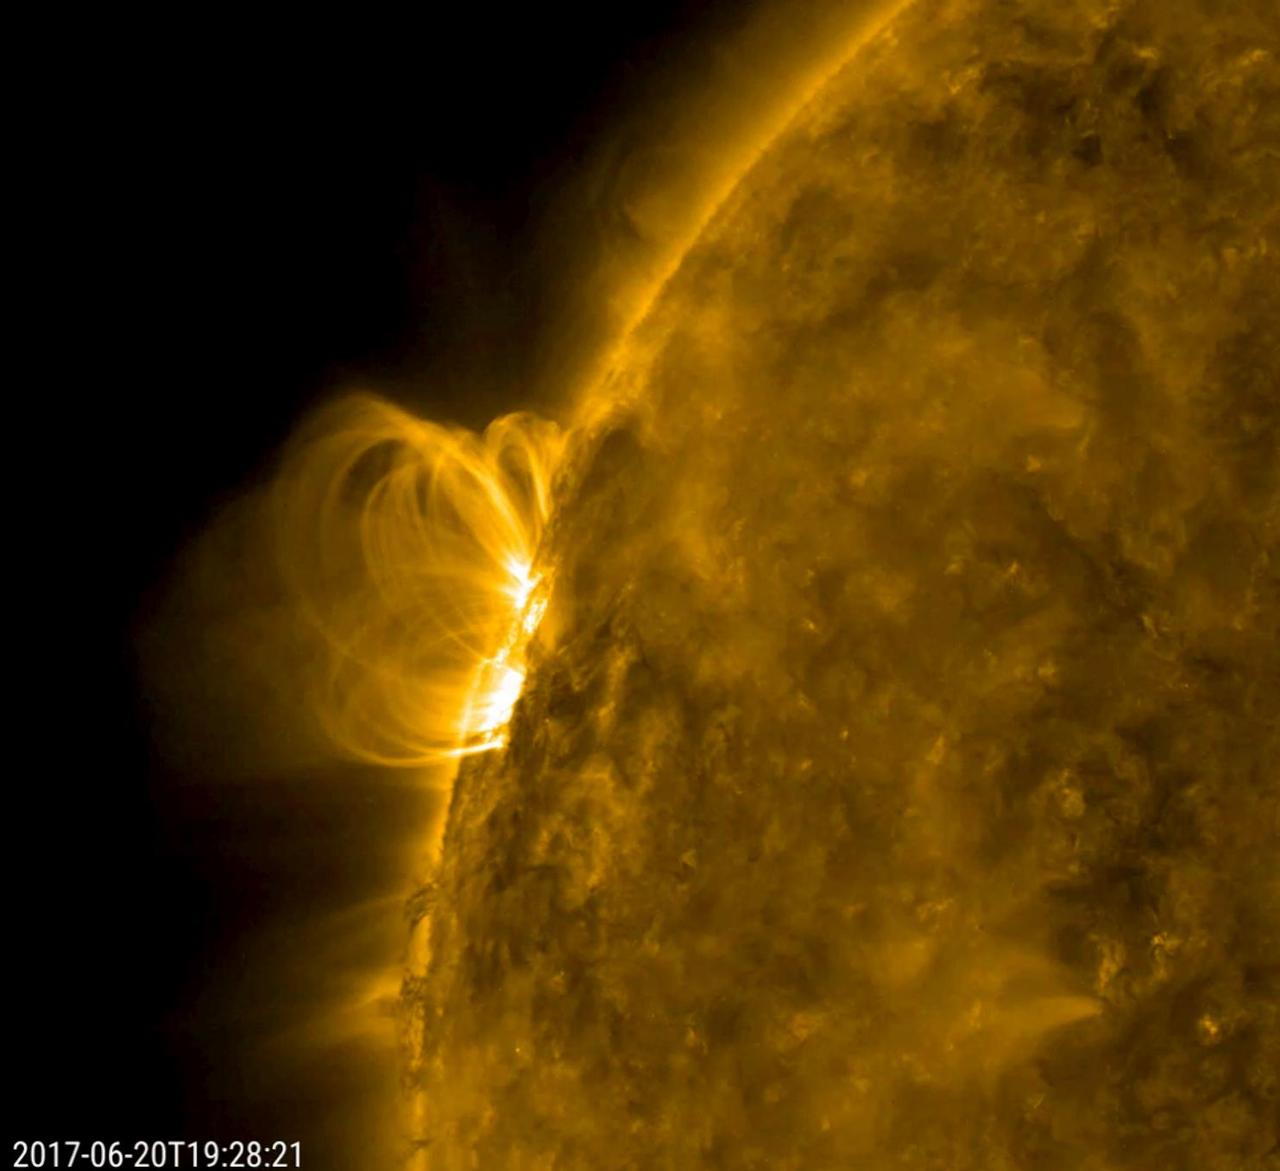
A smallish solar filament looks like it collapsed into the sun and set off a minor eruption that hurled plasma into space (June 20, 2017). Then, the disrupted magnetic field immediately began to reorganize itself, hence the bright series of spirals coiling up over that area. The magnetic field lines are made visible in extreme ultraviolet light as charged particles spin along them. Also of interest are the darker, cooler strands of plasma being pulled and twisted at the edge of the sun just below the active region. The activity here is in a 21-hour period. Movies are available at https://photojournal.jpl.nasa.gov/catalog/PIA21764
This artist concept shows NASA Voyager 1 spacecraft in a new region at the edge of our solar system where the magnetic field lines generated by our sun are piling up and intensifying.
This artist concept shows NASA Voyager 1 spacecraft in a new region at the edge of our solar system where the magnetic field lines generated by our sun are piling up and intensifying.
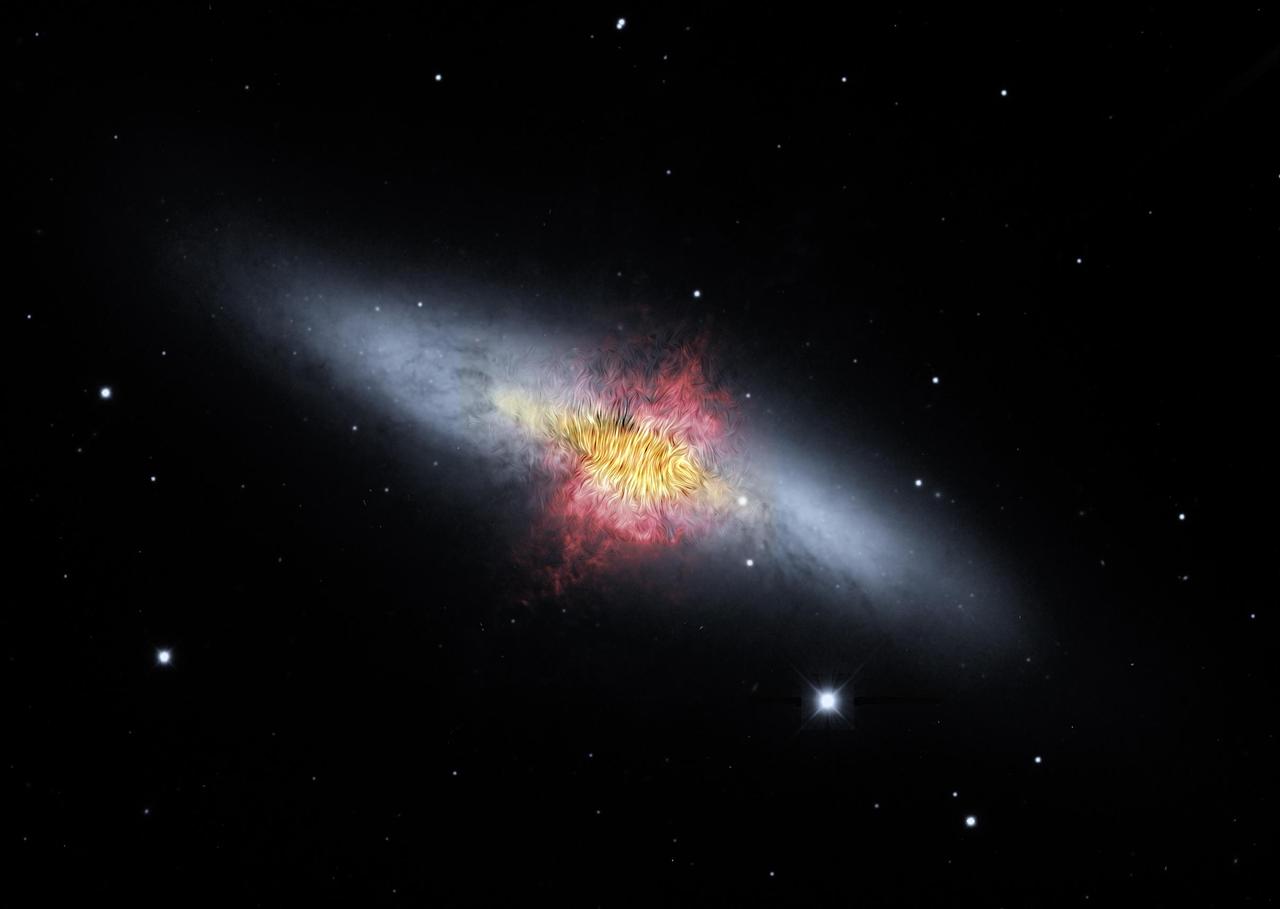
A composite image of the Cigar Galaxy (also called M82), a starburst galaxy about 12 million light-years away in the constellation Ursa Major. The magnetic field detected by the High-resolution Airborne Wideband Camera-Plus instrument (known as HAWC+) on SOFIA (the Stratospheric Observatory for Infrared Astronomy), shown as streamlines, appears to follow the bipolar outflows (red) generated by the intense nuclear starburst. The image combines visible starlight (gray) and a tracing of hydrogen gas (red) observed from the Kitt Peak Observatory, with near-infrared and mid-infrared starlight and dust (yellow) observed by SOFIA and the Spitzer Space Telescope. https://photojournal.jpl.nasa.gov/catalog/PIA23010
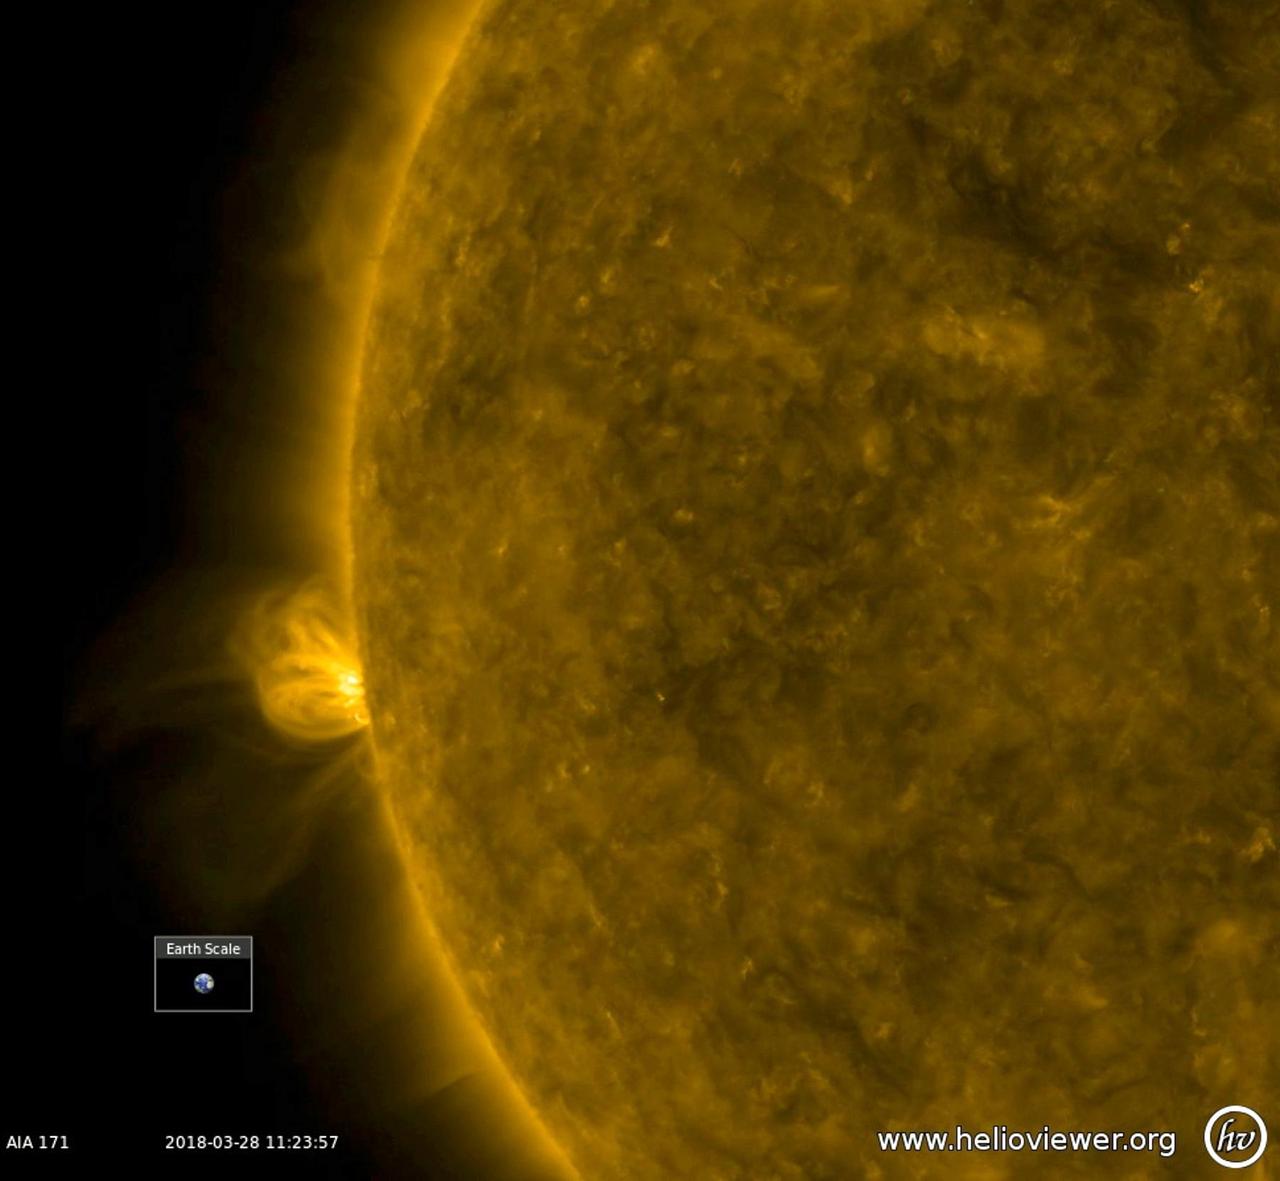
With no active regions currently on the face of the sun, a bristling active region has begun to rotate into view (Mar. 27-28, 2018). In this extreme ultraviolet view, the active region has numerous arches of bright, magnetic field lines blossoming out and towering above it. Whether this region will produce solar storms remains to be seen, but at least there is some new activity to observe. The video was produced with Helioviewer software. Animations are available at https://photojournal.jpl.nasa.gov/catalog/PIA22411

The lone active region visible on the sun put on a fine display with its tangled magnetic field lines swaying and twisting above it (Apr. 24-26, 2018) when viewed in a wavelength of extreme ultraviolet light. The charged particles spinning along these field lines illuminate them. The region did not erupt with any significant solar storms, although it still might. Videos are available at https://photojournal.jpl.nasa.gov/catalog/PIA22449

Several small sunspots appeared this week, giving NASA Solar Dynamics Observatory a chance to illustrate their sources Mar. 2, 2017. The first image is a magnetogram or magnetic image of the sun's surface. The MDI instrument can observe where positive and negative particles are moving toward or away from strong magnetic areas. These active regions have stronger magnetic fields and appear as strongly black or white. The yellow image shows the surface in filtered light, and there the same active regions appear as dark, cooler splotches called sunspots. Higher up in the sun's atmosphere, the golden image (in extreme ultraviolet light) shows arches of light above the active regions, which are charged particles spinning along magnetic field lines. Note that they all align very well with each other. Magnetic forces are the dynamic drivers here in these regions of the sun. Movies are available at http://photojournal.jpl.nasa.gov/catalog/PIA21557
This animation illustrates how the magnetic field surrounding Jupiter's moon Ganymede (represented by the blue lines) interacts with and disrupts the magnetic field surrounding Jupiter (represented by the orange lines). During the June 2021 close approach to Ganymede by NASA's Juno spacecraft, the Magnetic Field (MAG) and Jovian Auroral Distributions Experiment (JADE) instruments aboard the spacecraft recorded data showing evidence of the breaking and reforming of magnetic field connections between Jupiter and Ganymede. Studying Ganymede's magnetic field can provide scientists with clues about the nature of the salty water reservoir suspected to exist deep under the moon's surface. Animation available at https://photojournal.jpl.nasa.gov/catalog/PIA25724
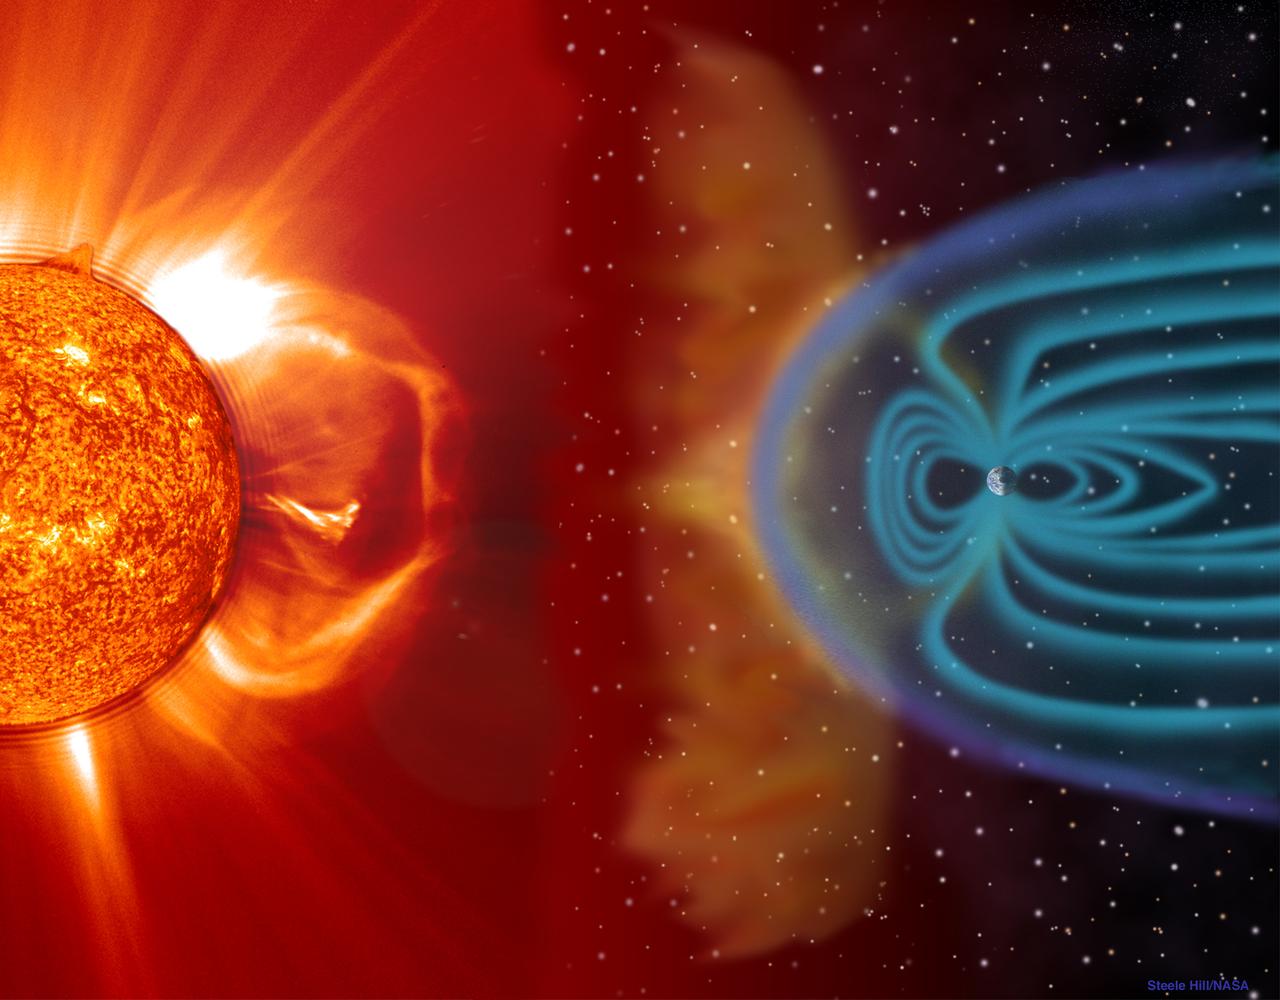
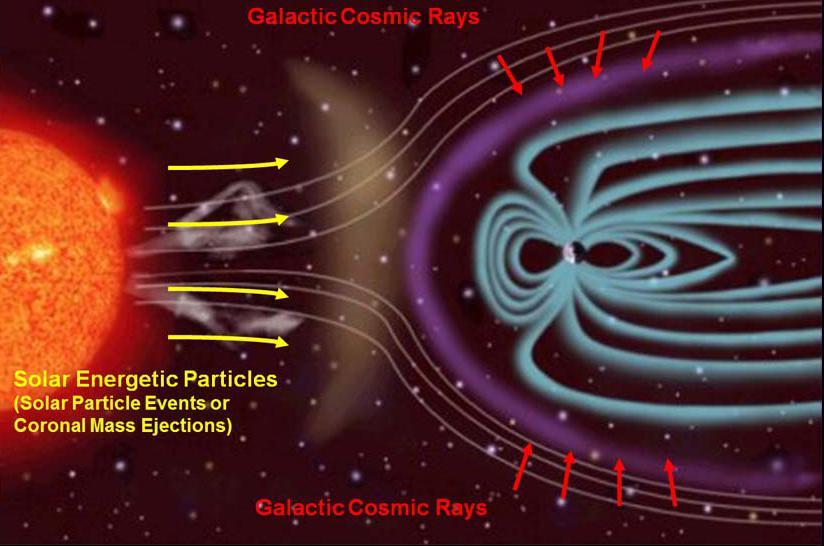
NASA's Marshall Space Flight Center (MSFC) and university scientists from the National Space Science and Technology Center (NSSTC) in Huntsville, Alabama, are watching the Sun in an effort to better predict space weather - blasts of particles and magnetic fields from the Sun that impact the magnetosphere, the magnetic bubble around the Earth. Filled by charged particles trapped in the Earth's magnetic field, the spherical comet-shaped magnetosphere extends out 40,000 miles from Earth's surface in the sunward direction and more in other directions. This image illustrates the Sun-Earth cornection. When massive solar explosions, known as coronal mass ejections, blast through the Sun's outer atmosphere and plow toward Earth at speeds of thousands of miles per second, the resulting effects can be harmful to communication satellites and astronauts outside the Earth's magnetosphere. Like severe weather on Earth, severe space weather can be costly. On the ground, magnetic storms wrought by these solar particles can knock out electric power. By using the Solar Vector Magnetograph, a solar observation facility at MSFC, scientists are learning what signs to look for as indicators of potential severe space weather.
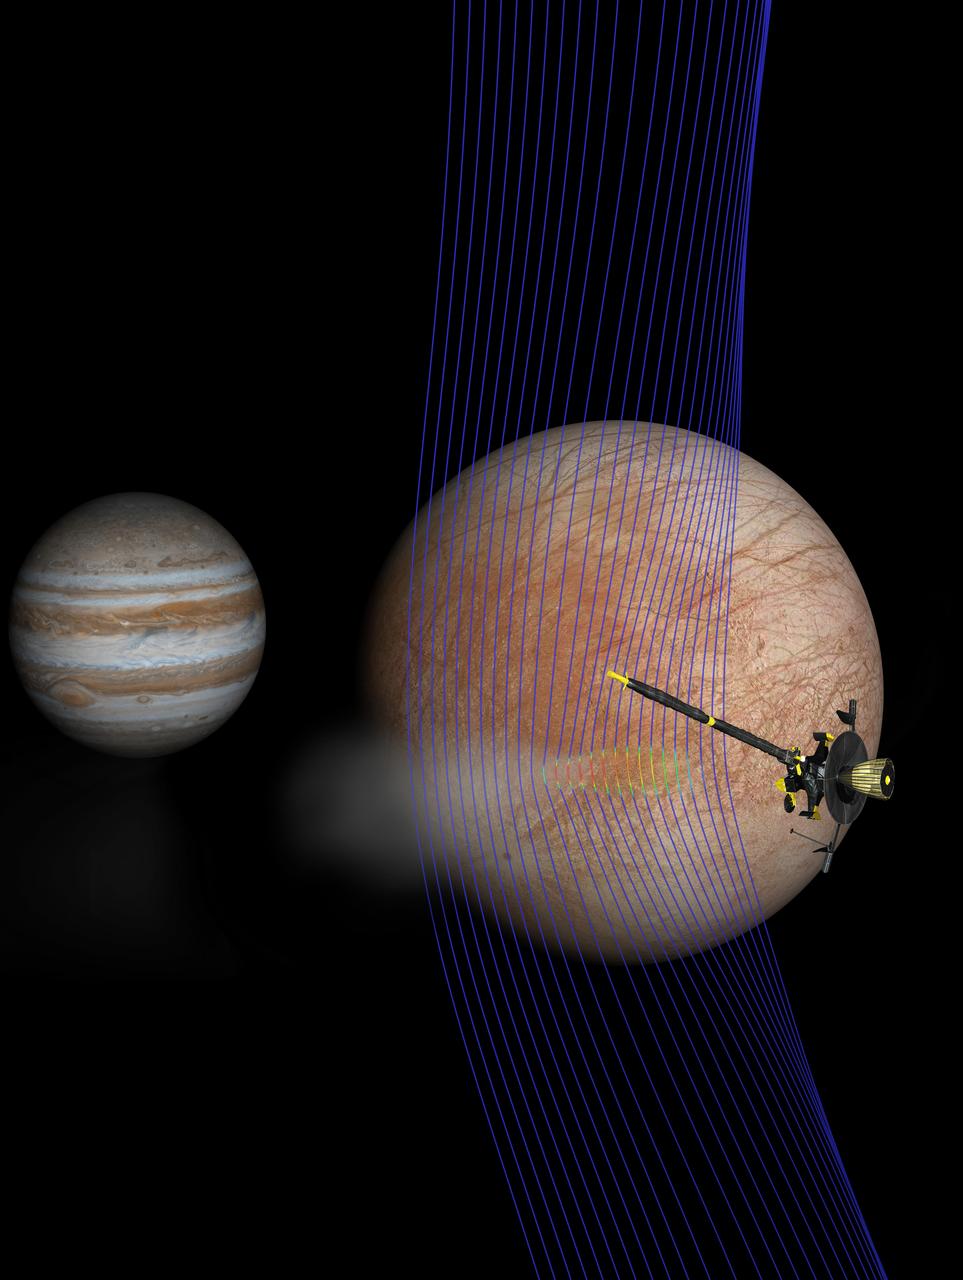
Artist's illustration of Jupiter and Europa (in the foreground) with the Galileo spacecraft after its pass through a plume erupting from Europa's surface. A new computer simulation gives us an idea of how the magnetic field interacted with a plume. The magnetic field lines (depicted in blue) show how the plume interacts with the ambient flow of Jovian plasma. The red colors on the lines show more dense areas of plasma. https://photojournal.jpl.nasa.gov/catalog/PIA21922
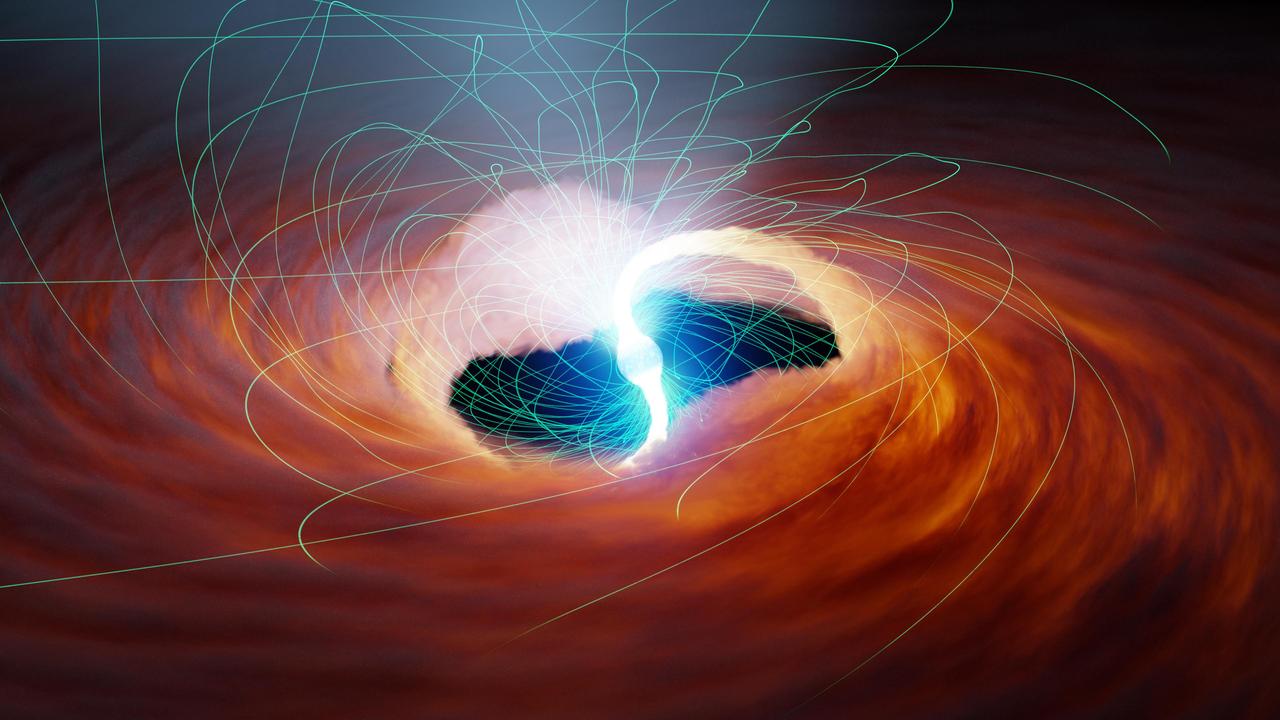
Two rivers of hot gas are siphoned onto the surface of a neutron star (the collapsed remains of a dead star) in this illustration. Neutron stars pack roughly the mass of our Sun into an area about 10 miles (6 kilometers) across. The gravity at the neutron star's surface is about 100 trillion times stronger than the gravitational pull on Earth's surface. Under those conditions, the captured gas accelerates to millions of miles per hour, releasing tremendous energy and radiation when it hits the neutron star's surface. Because these sources of light emit primarily X-rays, they are known as ultra-luminous X-ray sources (ULXs), and are visible by telescopes like NASA's NuSTAR (the Nuclear Spectroscopic Telescope Array). The neutron star's twisted magnetic field lines are illustrated in green. Some scientists hypothesize that strong magnetic fields like the ones produced by neutron stars can distort the normal shape of atoms from roughly spherical to elongated, stringy shapes. This may ultimately increase an object's maximum possible brightness. https://photojournal.jpl.nasa.gov/catalog/PIA25781
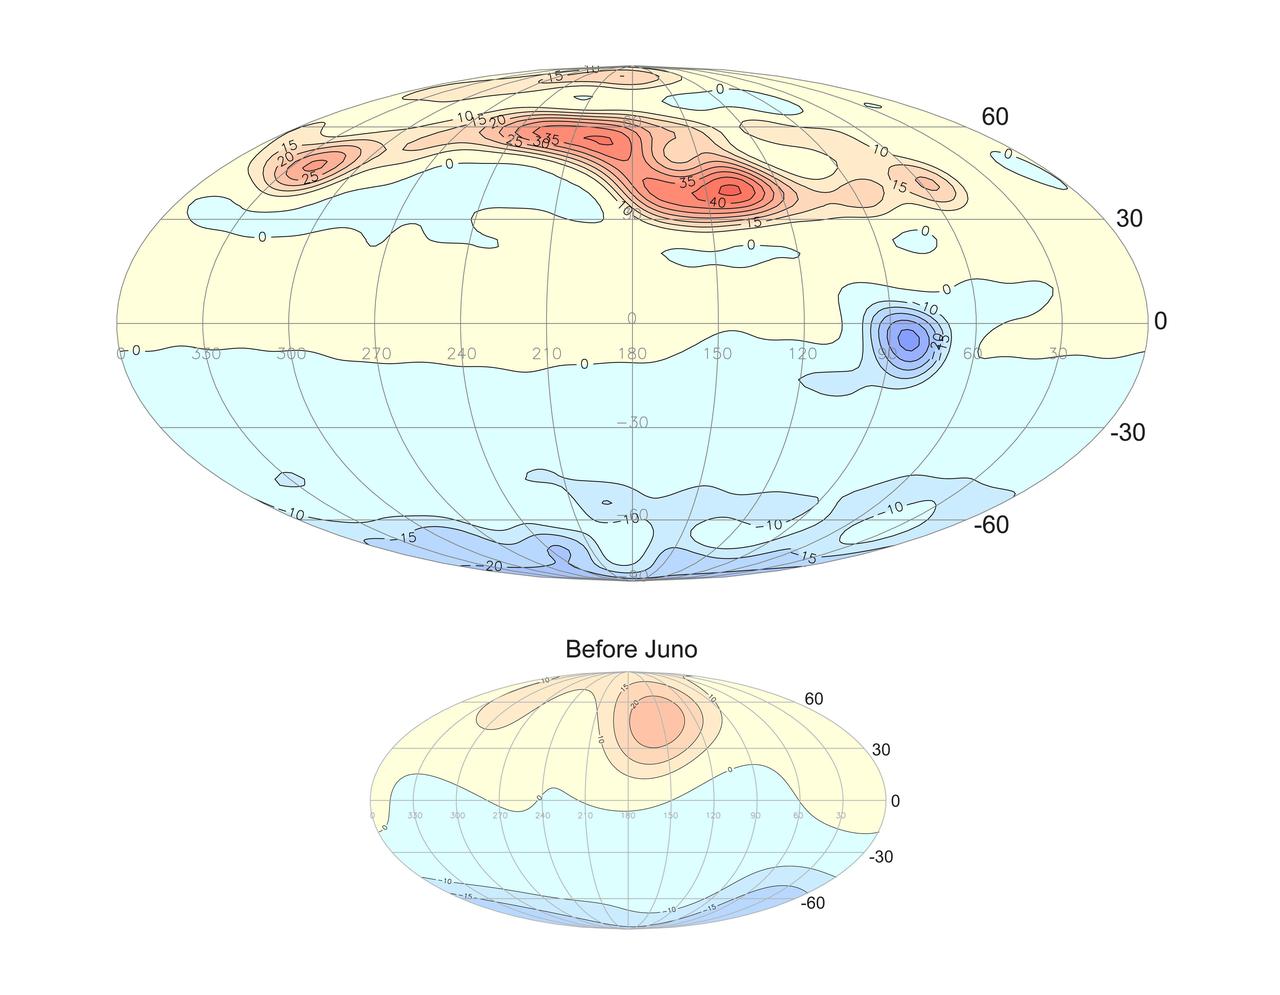
This projection of the radial magnetic field of Jupiter (top) uses a new magnetic field model based on data from Juno's orbits during its prime mission. Magnetic field lines emerge from yellow and red regions and enter the planet in the blue regions. The new model represents a vast improvement in spatial resolution compared to prior knowledge (bottom) provided by earlier missions, including Pioneer 10 and 11, Voyager 1 and 2, Ulysses, and Galileo. https://photojournal.jpl.nasa.gov/catalog/PIA25040
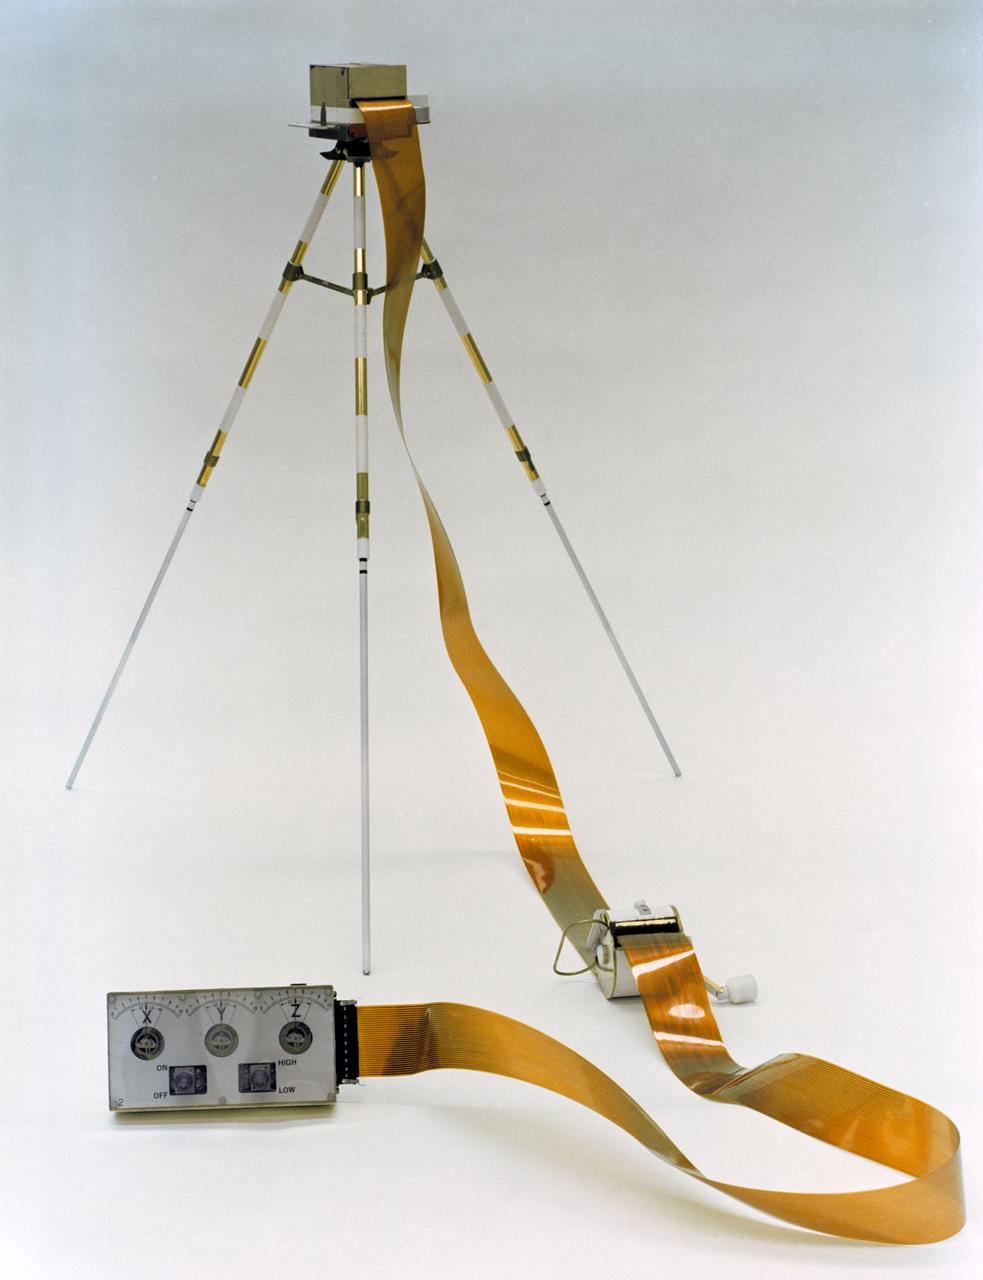
S70-56721 (December 1970) --- A close-up view of the Lunar Portable Magnetometer (LPM), which will be used by the crew of the Apollo 14 lunar landing mission during the second extravehicular activity (EVA). The LPM's components, a tripod-mounted flux-gate magnetometer sensor head and an electronics data package, connected by a 50-feet flat cable, function together to measure variations in the lunar magnetic field at several points on the geological traverse. Data gathered will be used to determine the location, strength and dimensions of magnetic sources, as well as knowledge of the local and total selenological structure. The LPM will be carried on the Modular Equipment Transporter (MET), and deployed by the lunar module pilot, who will align the sensor head at least 35 feet from the data package. The LM pilot will then return to the MET and verbally relay the LPM readouts to Earth. Astronaut Edgar D. Mitchell is the lunar module pilot for the Apollo 14 lunar landing mission.
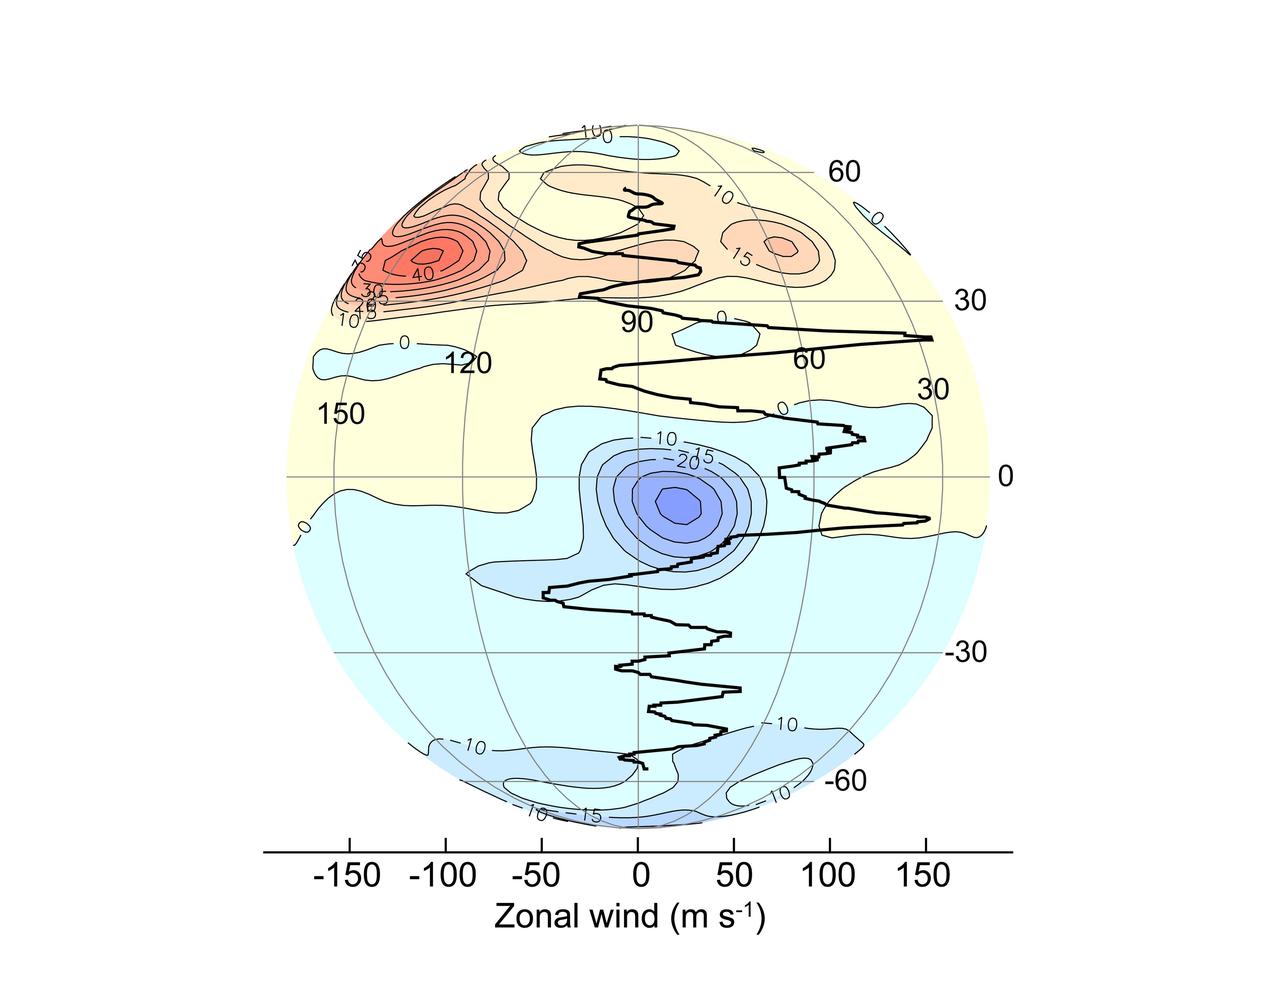
A new, highly detailed map of Jupiter's magnetic field based on data from NASA's Juno spacecraft renders in high resolution a mysterious region of the field nicknamed the Great Blue Spot (GBS), an isolated and intense patch of magnetic flux at the planet's equator. This orthographic plot shows the radial magnetic field from a vantage point above the GBS, compared to zonal winds measured by tracking the movement of surface features. The GBS appears to be distorted by the winds, with westward zonal winds south of the GBS pulling the field to the west and eastward zonal winds north of the GBS stretching the field toward the east. https://photojournal.jpl.nasa.gov/catalog/PIA25035
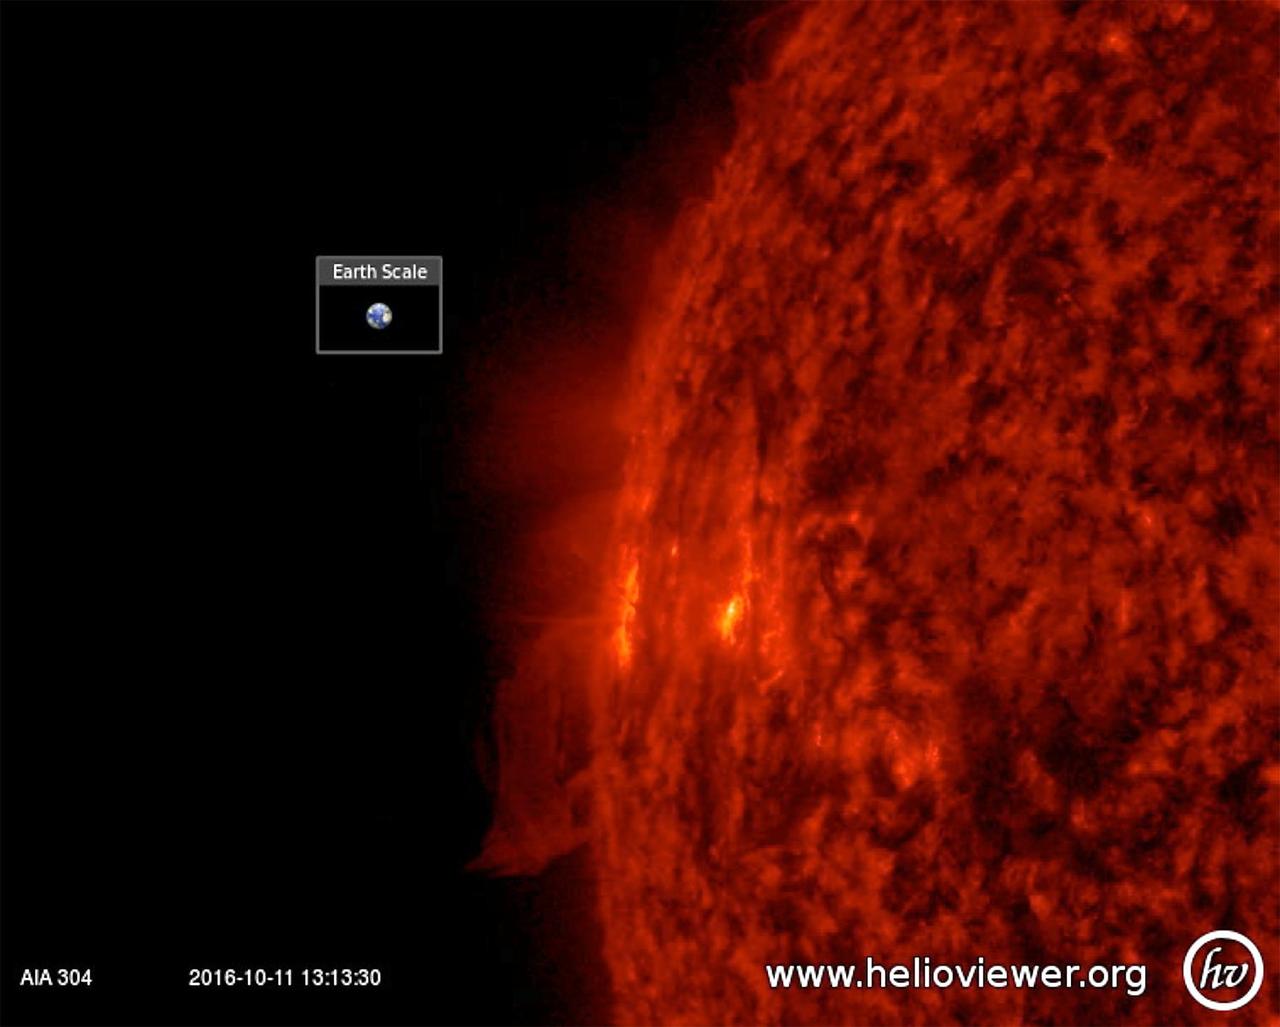
An active region just rotating into view gave us a perfect view of the tussle of magnetic field lines above it (Oct. 10-11, 2016). The particles spiraling along the magnetic field lines become visible in extreme ultraviolet light, helping us to see the struggle going on. There were no eruptions during this period, although active regions are usually the source for solar storms. The video clip covers just one day's worth of activity. Movies are available at http://photojournal.jpl.nasa.gov/catalog/PIA21109
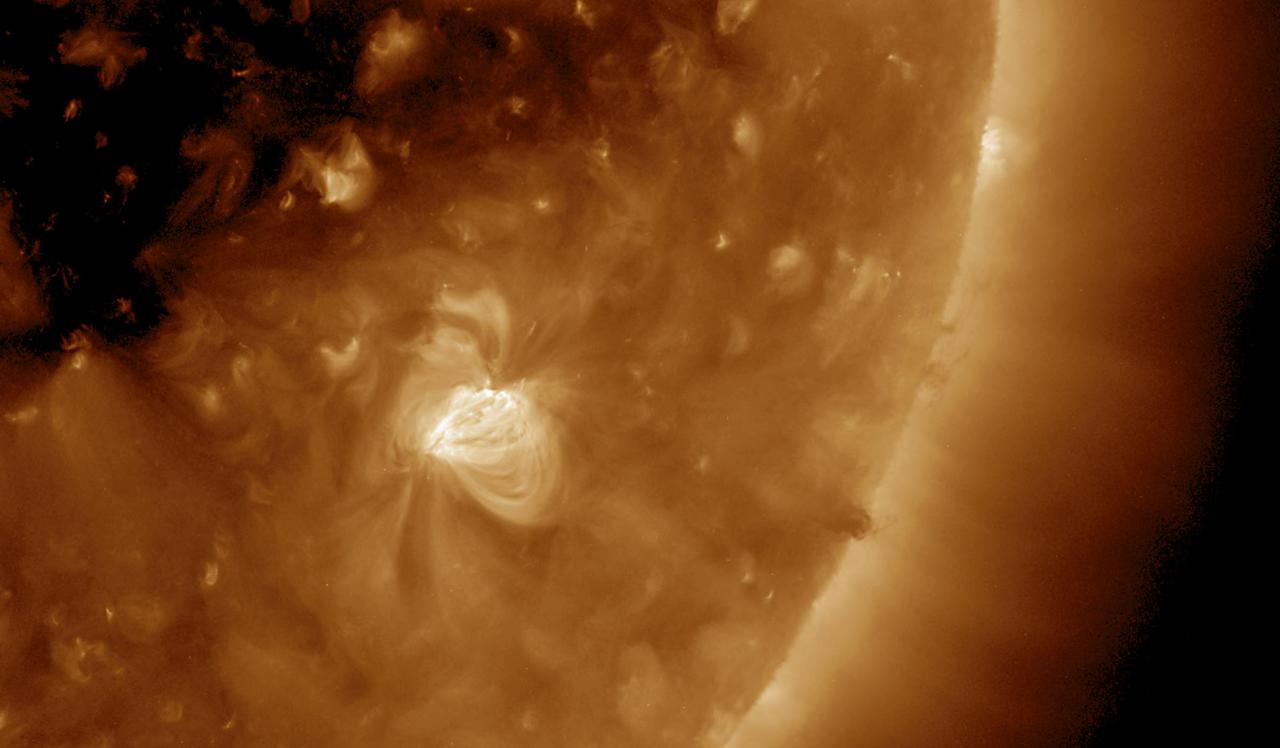
A close-up view of one day in the life of a rather small active region shows the agitation and dynamism of its magnetic field (Dec. 21, 2016). This wavelength of extreme ultraviolet light reveals particles as they spin along the cascading arches of magnetic field lines above the active region. Some darker plasma rises up and spins around at the edge of the sun near the end of the video clip also being pulled by unseen magnetic forces. Movies are available at http://photojournal.jpl.nasa.gov/catalog/PIA15032

The magnetic field lines between a pair of active regions formed a beautiful set of swaying arches rising up above them Apr. 24-26, 2017, as seen by NASA Solar Dynamics Observatory. The connection between opposing poles of polarity is visible in exquisite detail in this wavelength of extreme ultraviolet light. What we are really seeing are charged particles spinning along the magnetic field lines. Other field lines are traced as they reach out in other directions as well. Videos can be seen at https://photojournal.jpl.nasa.gov/catalog/PIA21604
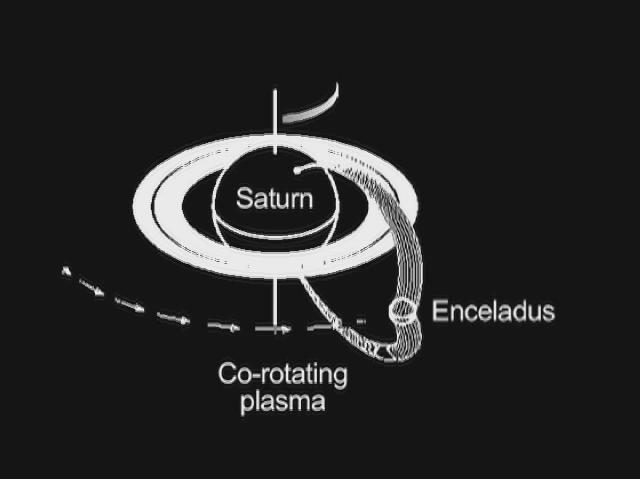
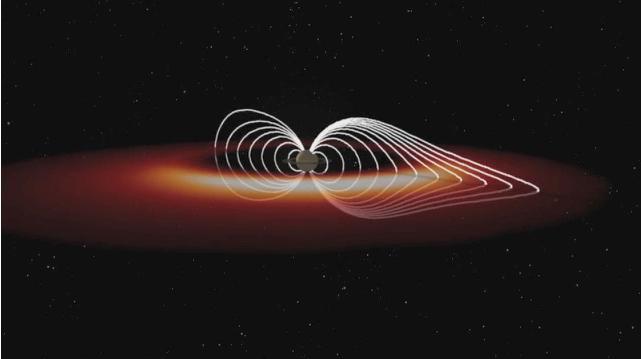
This graphic shows how Saturn and its moon Enceladus are electrically linked. Magnetic field lines, invisible to the human eye but detectable by the fields and particles instruments on NASA's Cassini spacecraft, arc from Saturn's north polar region to south polar region. Enceladus resides in the arc of a set of the field lines and feeds charged particles into the Saturn atmosphere. As Enceladus orbits around Saturn, the "footprint" of its connection to Saturn's north polar region, visible in ultraviolet light, also rotates. A doughnut of plasma, or hot ionized gas, revolves around Saturn at the same pace as the planet turns. The interaction of this plasma cloud with Enceladus shoots electrons along the magnetic field lines into the polar region of Saturn. The rain of electrons into Saturn's atmosphere creates an ultraviolet glow in an aurora-like phenomenon. Cassini's radio and plasma wave science instrument has detected a "hiss-like" radio noise generated by electrons moving along magnetic field lines from Enceladus to the glowing patch of ultraviolet light on Saturn. An animation is available at http://photojournal.jpl.nasa.gov/catalog/PIA13897
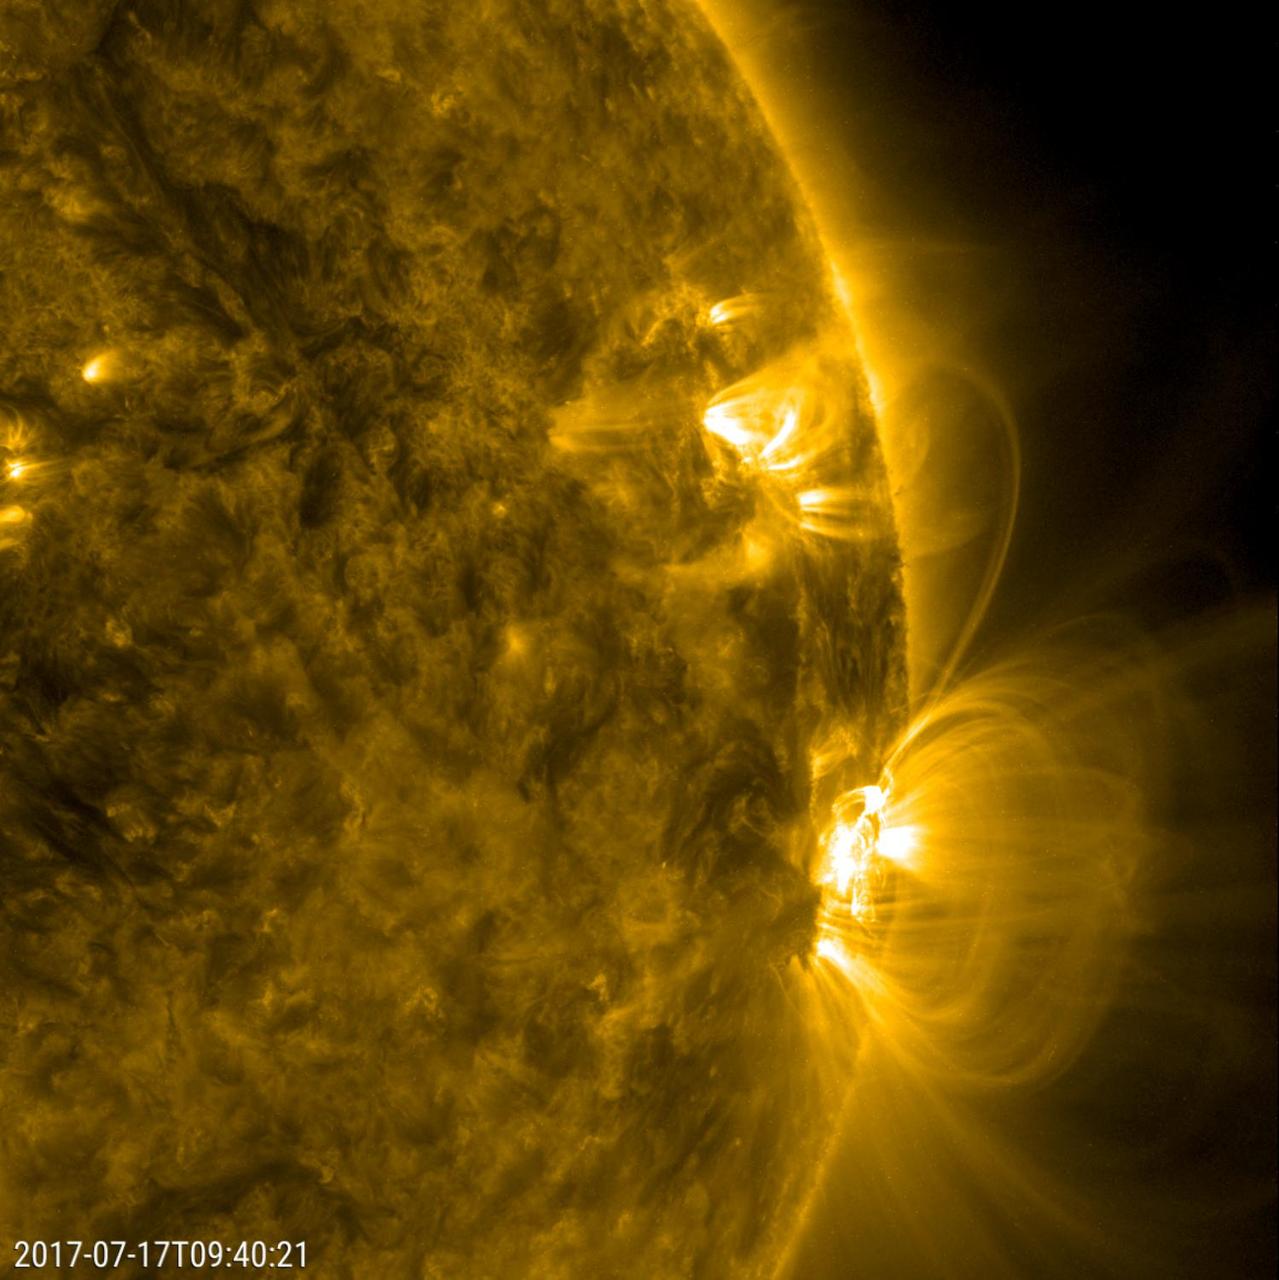
Numerous arches of magnetic field lines danced and swayed above a large active region over about a 30-hour period (July 17-18, 2017). We can also see the magnetic field lines from the large active region reached out and connected with a smaller active region. Those linked lines then strengthened (become brighter), but soon began to develop a kink in them and rather swiftly faded from view. All of this activity is driven by strong magnetic forces associated with the active regions. The images were taken in a wavelength of extreme ultraviolet light. https://photojournal.jpl.nasa.gov/catalog/PIA21838
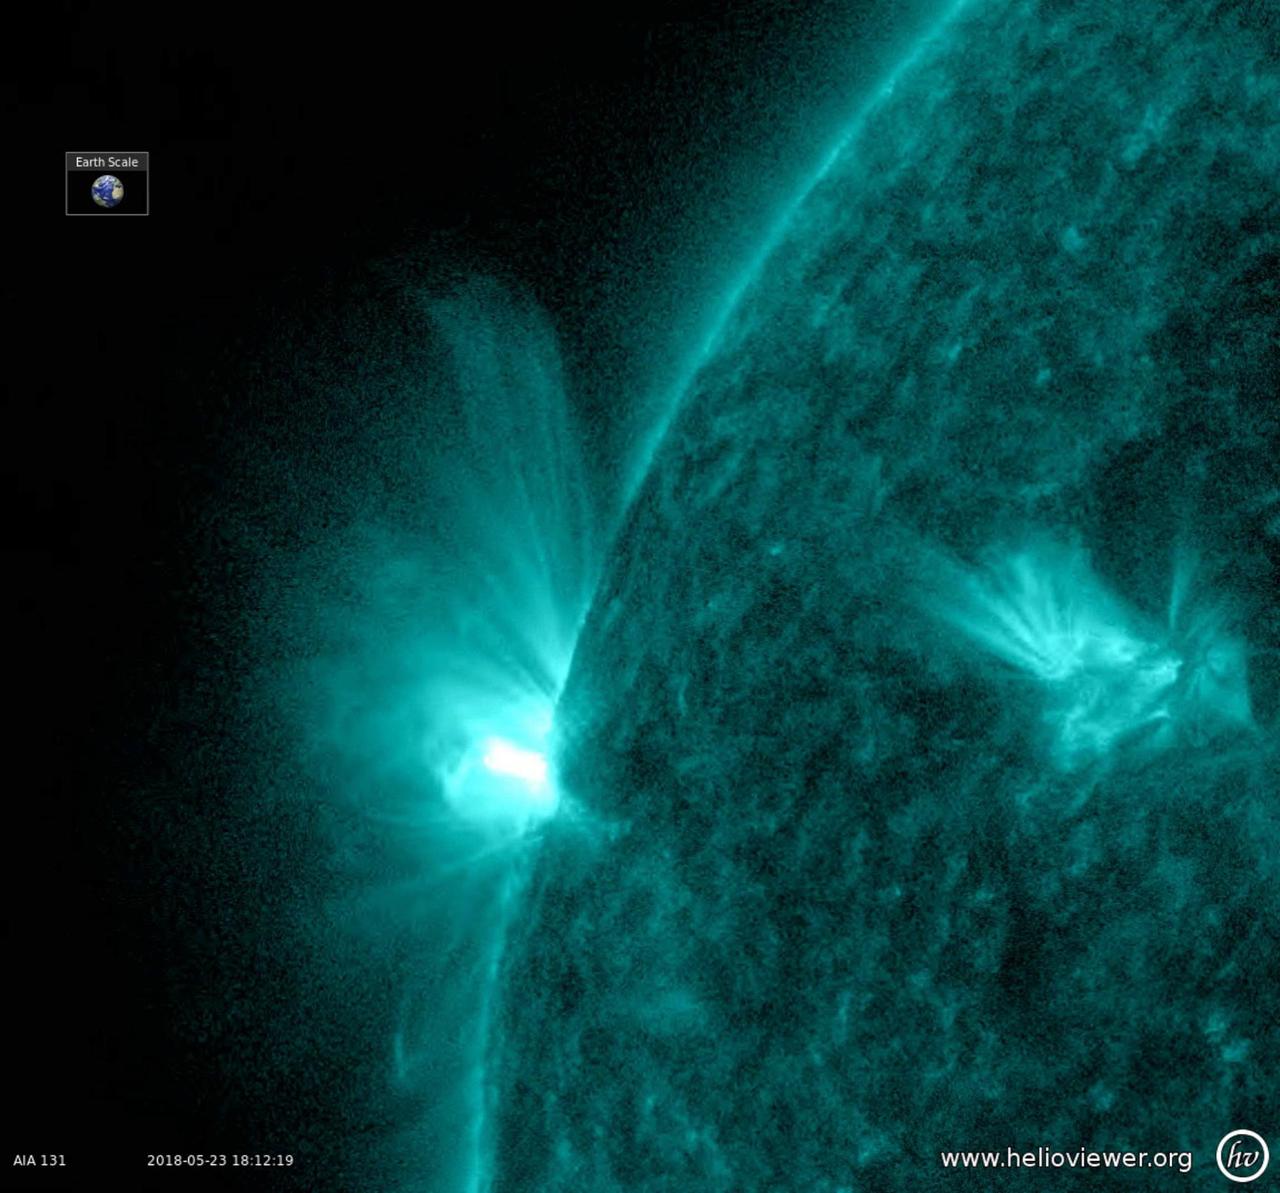
An active region rotated into view and sputtered with numerous small flares and towering magnetic field lines that stretched out many times the diameter of Earth (May 23-25, 2018). Active regions are areas of intense magnetic energy. The field lines are illuminated by charged particles spiraling along them and easiest to discern when viewed in profile. The colorized images were taken in a wavelength of extreme ultraviolet light. Movies are available at https://photojournal.jpl.nasa.gov/catalog/PIA22461
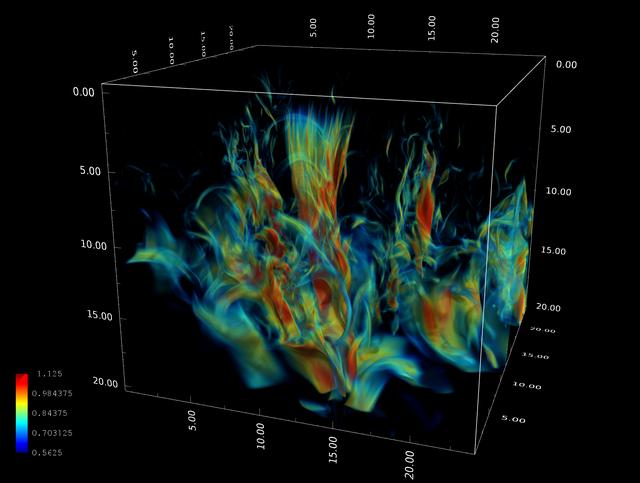
Stein_Sun: Visualization of the complex magnetic field produced as magnetic flux rises toward the Sun¹s surface from the deep convection zone. The image shows a snapshot of how the magnetic field has evolved two days from the time uniform, untwisted, horizontal magnetic field started to be advected by inflows at the bottom (20 megameters deep). Axes are in megameters, and the color scale shows the log of the magnetic field strength. Credit: Robert Stein, Michigan State University; Tim Sandstrom, NASA/Ames
One broad active region sported a wonderful example of coiled magnetic field lines over almost a four-day period (July 15-18, 2016). The magnetic lines are easily visible in this 171 Angstrom wavelength of extreme ultraviolet light be cause charged particles are spiraling along the lines. The active region is a hotbed of struggling magnetic forces that were pushing out above the sun's surface. http://photojournal.jpl.nasa.gov/catalog/PIA17911
This video demonstrates the hiss-like radio noise generated by electrons moving along magnetic field lines from the Saturnian moon Enceladus to a glowing patch of ultraviolet light on Saturn.
This illustration depicts the two main types of radiation that NASA Radiation Assessment Detector RAD onboard Curiosity monitors, and how the magnetic field around Earth affects the radiation in space near Earth.
This graphic shows a comparison of the observed change in Jupiter's radial magnetic field, over time, as well as the change calculated from the model, assuming eastward drift of the "Great Blue Spot" (GBS). https://photojournal.jpl.nasa.gov/catalog/PIA25036
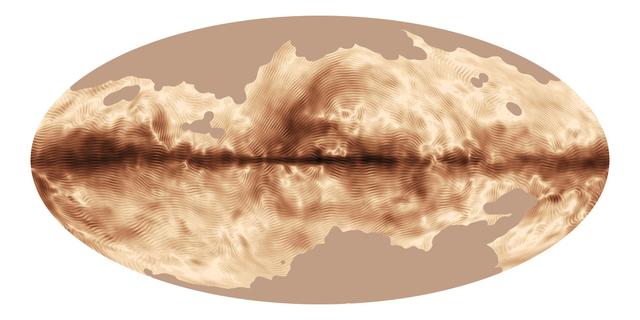
The magnetic field of our Milky Way galaxy as seen by ESA Planck satellite. This image was compiled from the first all-sky observations of polarized light emitted by interstellar dust in the Milky Way.
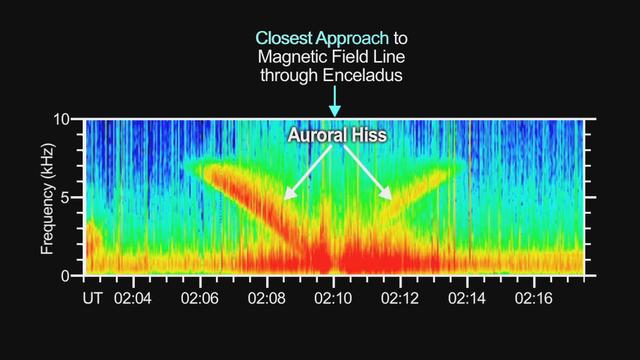
This graphic demonstrates the hiss-like radio noise generated by electrons moving along magnetic field lines from the Saturnian moon Enceladus to a glowing patch of ultraviolet light on Saturn.
This frame from an animation based on data obtained by NASA Cassini spacecraft shows how the explosions of hot plasma on the night side orange and white periodically inflate Saturn magnetic field white lines.
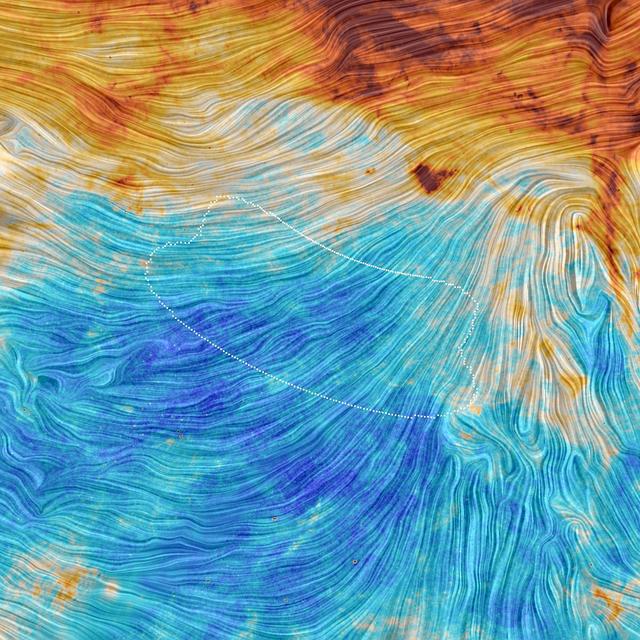
The color scale in this image from the Planck mission represents the emission from dust, a minor but crucial component that pervades our Milky Way galaxy. The texture indicates the orientation of the galactic magnetic field.
The magnetic field lines of three active regions in close proximity to one another interacted with each other over two and a half days Feb. 8-10, 2016. This image is from NASA Solar Dynamics Observatory.
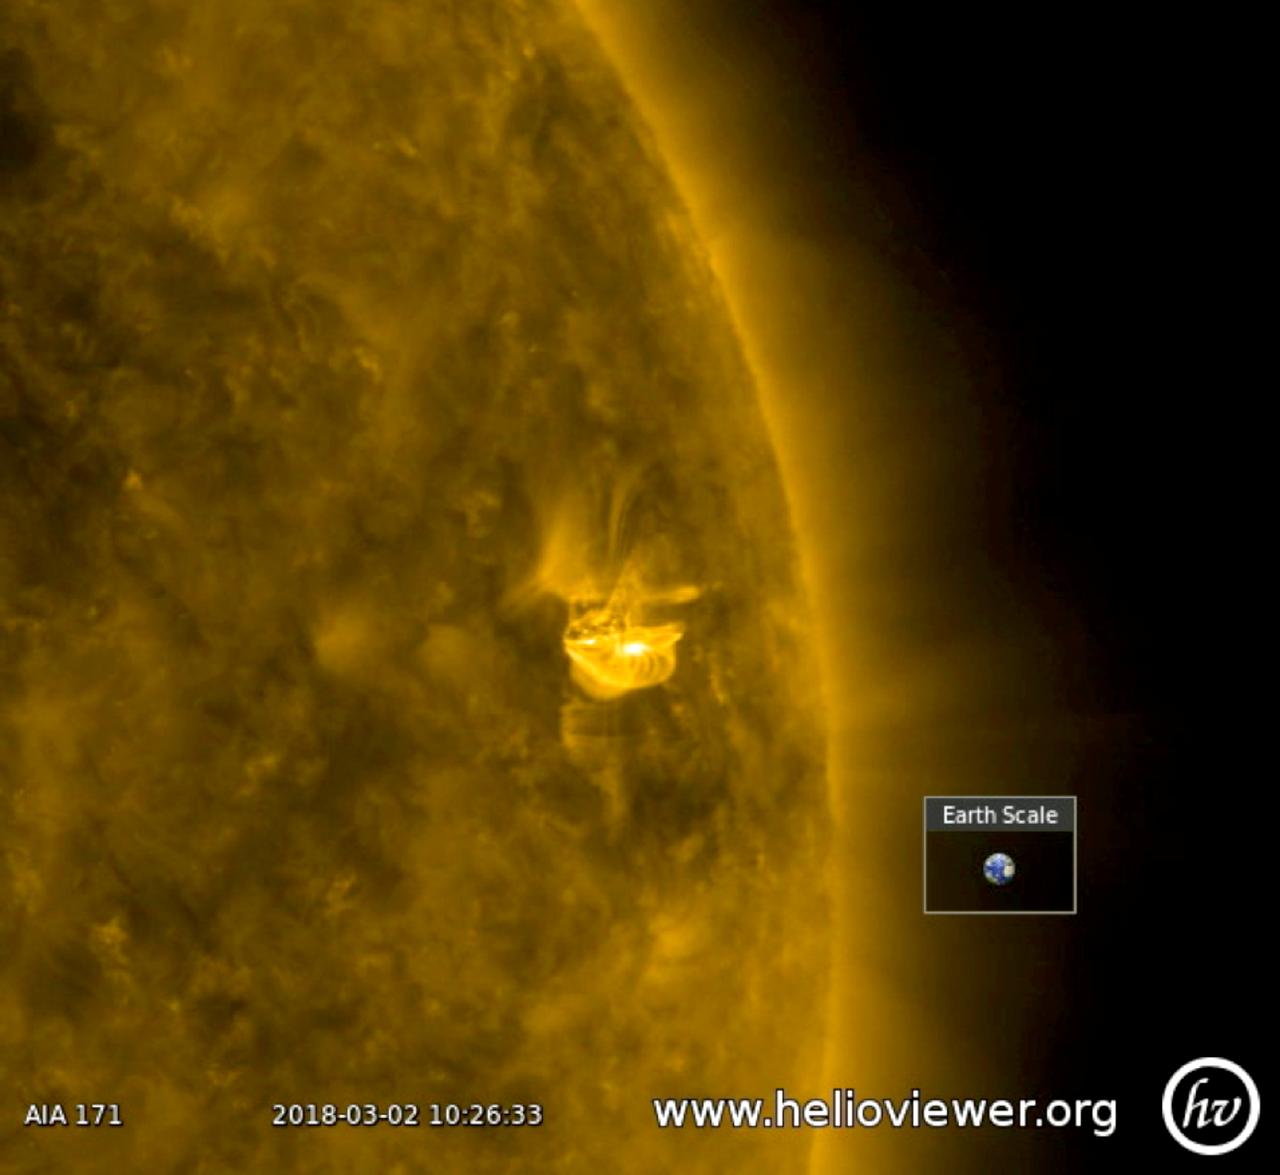
A relatively small active region erupted twice in 18 hours (Mar. 2, 2018). After each burst, one can see the magnetic fields lines, which appear as bright coils, spiraling around the region. They are reorganizing the disrupted magnetic field. The quick second when the screen goes black was caused by the Earth passing between the spacecraft and the sun. Images were taken in a wavelength of extreme ultraviolet light. The video was produced using the free Helioviewer software at Helioviewer.org. Videos are available at https://photojournal.jpl.nasa.gov/catalog/PIA22260
A substantial coronal hole began to rotate into view over the past few days (Dec. 1-2, 2016). Coronal holes are magnetically open areas of the sun's magnetic field structure that spew streams of high speed solar wind into space. In about a week or so that coronal hole might send streams of particles in the direction of Earth. Often times these streams can interact with Earth's magnetosphere and generate aurora. The images were taken in a wavelength of extreme ultraviolet light. Movies are available at http://photojournal.jpl.nasa.gov/catalog/PIA21208
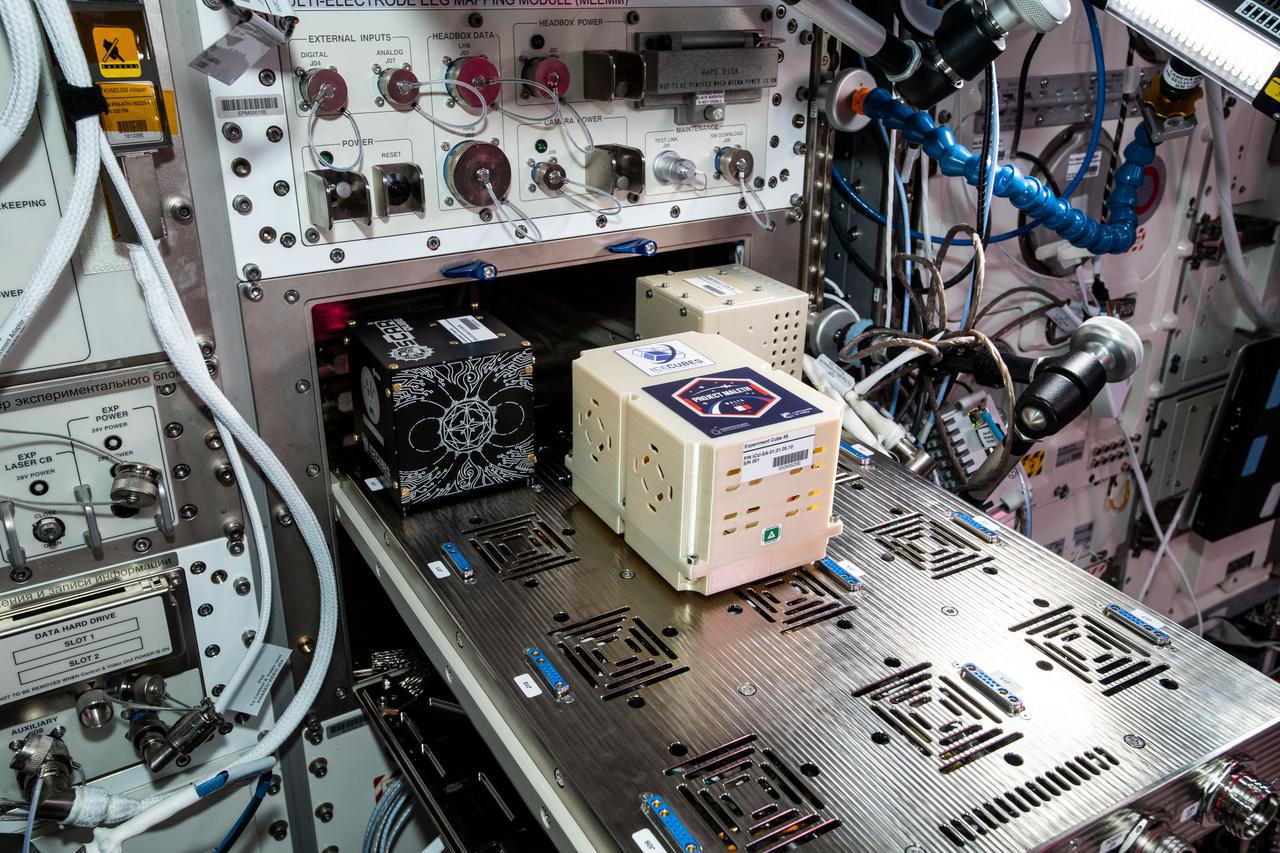
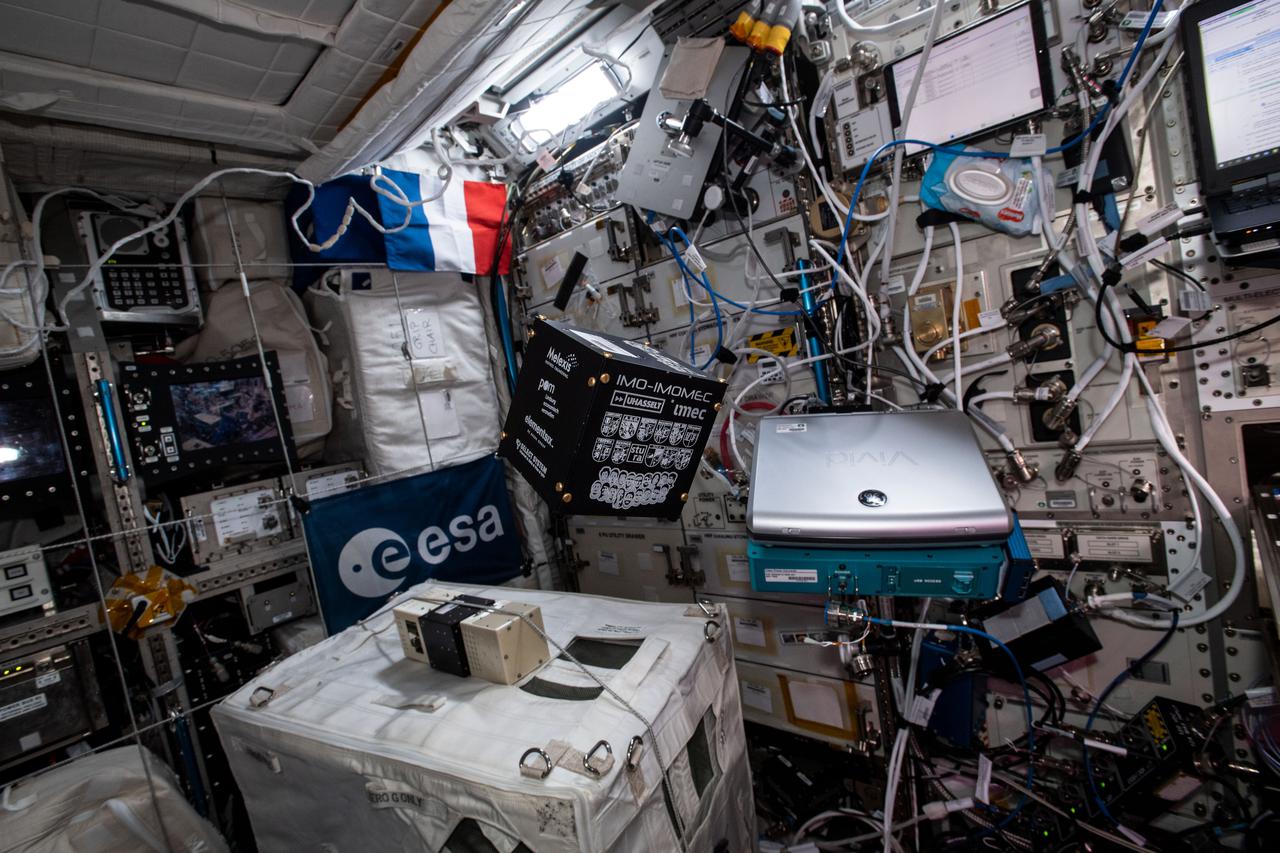
iss065e343736 (9/2/2021) --- A view aboard the International Space Station Columbus module with the Ice Cube #8 and #9 BioCubes. The Ice Cube #8 investigation uses quantum technology to produce high-resolution, high-precision measurements of the local magnetic field to create a high-resolution map of the Earth’s magnetic field. Ice Cube #9 seeks to analize the Skin Microbiome of Diabetic Foot Ulcers . The Ice Cube #8 investigation uses quantum technology to produce high-resolution, high-precision measurements of the local magnetic field to create a high-resolution map of the Earth’s magnetic field.

iss065e343729 (9/2/2021) --- A view aboard the International Space Station Columbus module with the Ice Cube #8 and #9 BioCubes. The Ice Cube #8 investigation uses quantum technology to produce high-resolution, high-precision measurements of the local magnetic field to create a high-resolution map of the Earth’s magnetic field. Ice Cube #9 seeks to analize the Skin Microbiome of Diabetic Foot Ulcers . The Ice Cube #8 investigation uses quantum technology to produce high-resolution, high-precision measurements of the local magnetic field to create a high-resolution map of the Earth’s magnetic field.
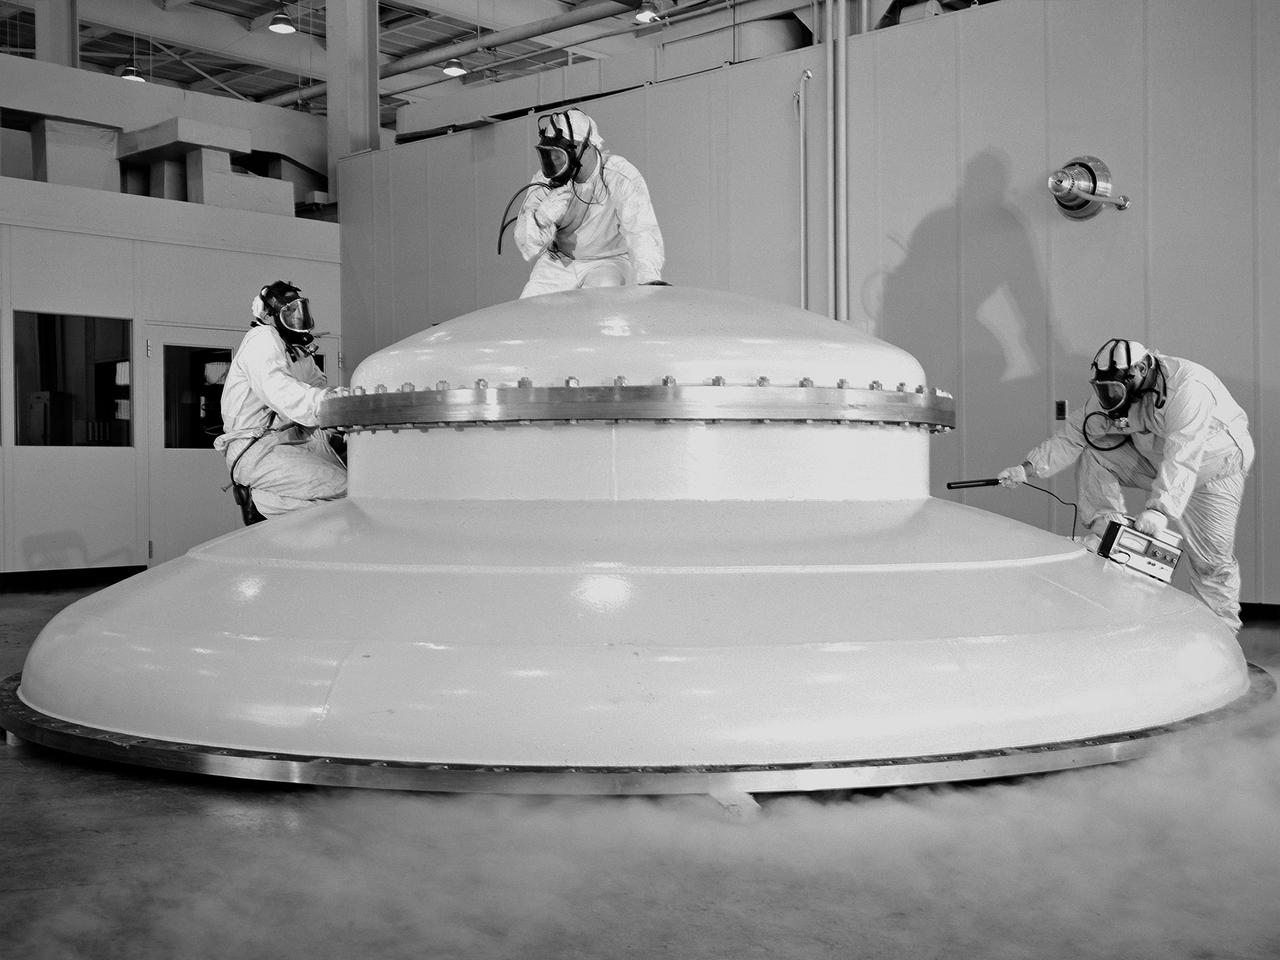
Engineer Paul Reader and his colleagues take environmental measurements during testing of a 20-inch diameter ion engine in a vacuum tank at the Electric Propulsion Laboratory (EPL). Researchers at the Lewis Research Center were investigating the use of a permanent-magnet circuit to create the magnetic field required power electron bombardment ion engines. Typical ion engines use a solenoid coil to create this magnetic field. It was thought that the substitution of a permanent magnet would create a comparable magnetic field with a lower weight. Testing of the magnet system in the EPL vacuum tanks revealed no significant operational problems. Reader found the weight of the two systems was similar, but that the thruster’s efficiency increased with the magnet. The EPL contained a series of large vacuum tanks that could be used to simulate conditions in space. Large vacuum pumps reduced the internal air pressure, and a refrigeration system created the cryogenic temperatures found in space.
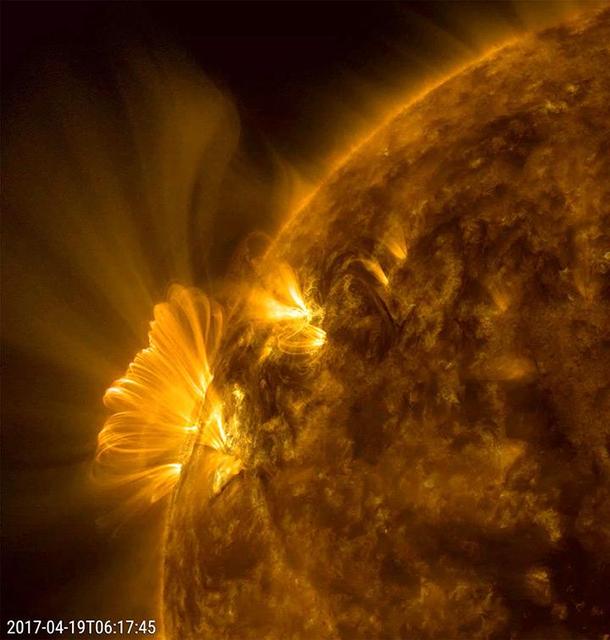
An active region that had just rotated into view blasted out a coronal mass ejection, which was immediately followed by a bright series of post-coronal loops seeking to reorganize that region's magnetic field (April 19, 2017). We have observed this phenomenon numerous times, but this one was one of the longest and clearest sequences we have seen in years. The bright loops are actually charged particles spinning along the magnetic field lines. The action was captured in a combination of two wavelengths of extreme ultraviolet light over a period of about 20 hours. Movies are available at https://photojournal.jpl.nasa.gov/catalog/PIA21598
Researchers at Marshall's Space Science Laboratory successfully demonstrate that linear arrays of Hall probes can be constructed in high Hall coefficient films and used to digitally image magnetic fields. This research is beneficial to visually imaging any magnetic field.
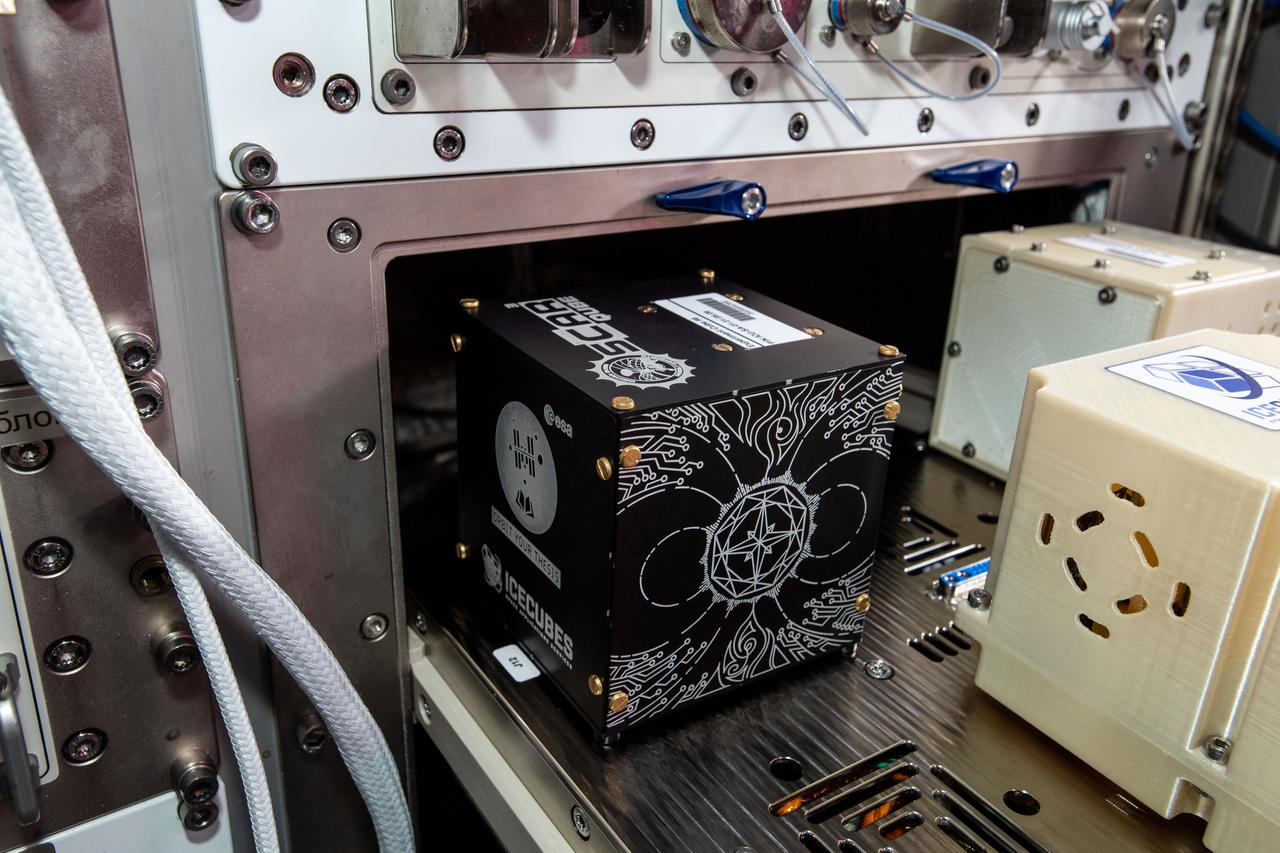
iss065e343732 (9/2/2021) --- A view aboard the International Space Station Columbus module with the Ice Cube #8 BioCube. The Ice Cube #8 investigation uses quantum technology to produce high-resolution, high-precision measurements of the local magnetic field to create a high-resolution map of the Earth’s magnetic field.
iss065e343710 (9/2/2021) --- A view aboard the International Space Station Columbus module with the Ice Cube #8 BioCube. The Ice Cube #8 investigation uses quantum technology to produce high-resolution, high-precision measurements of the local magnetic field to create a high-resolution map of the Earth’s magnetic field.

This still image from an animation from NASA GSFC Solar Dynamics Observatory shows magnetically charged particles forming a nicely symmetrical arch at the edge of the Sun as they followed the magnetic field lines of an active region Aug.4-5, 2015. Before long the arch begins to fade, but a fainter and taller arch appears for a time in the same place. Note that several other bright active regions display similar kinds of loops above them. These images of ionized iron at about one million degrees were taken in a wavelength of extreme ultraviolet light. The video covers about 30 hours of activity. http://photojournal.jpl.nasa.gov/catalog/PIA19874

Principal investigator, Dr. Janine Captain, demonstrates the effects of moving a magnet against metal in the Applied Physics Laboratory at NASA’s Kennedy Space Center on Dec. 12, 2018. When dropped or tipped over on a plate of copper, the magnet decelerates and slowly touches down on the plate visually demonstrating the physics of the magnetic field.
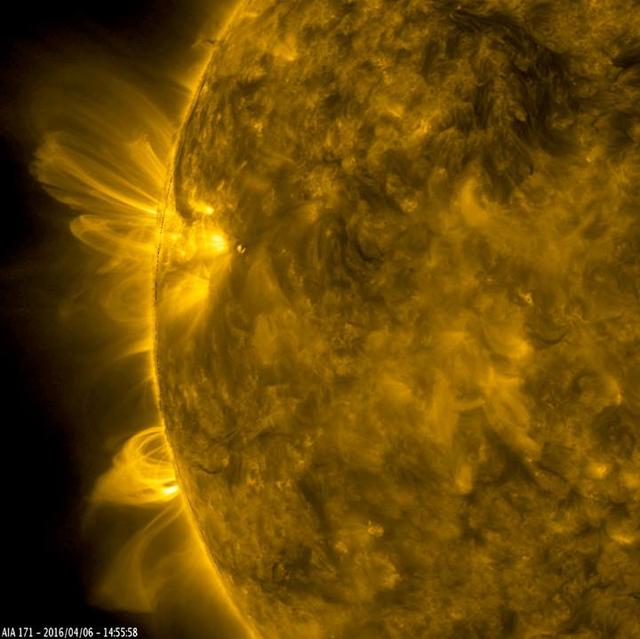
This still image from an animation from NASA GSFC Solar Dynamics Observatory shows arches of magnetic field lines towered over the edge of the Sun as a pair of active regions began to rotate into view Apr. 5-6, 2016.
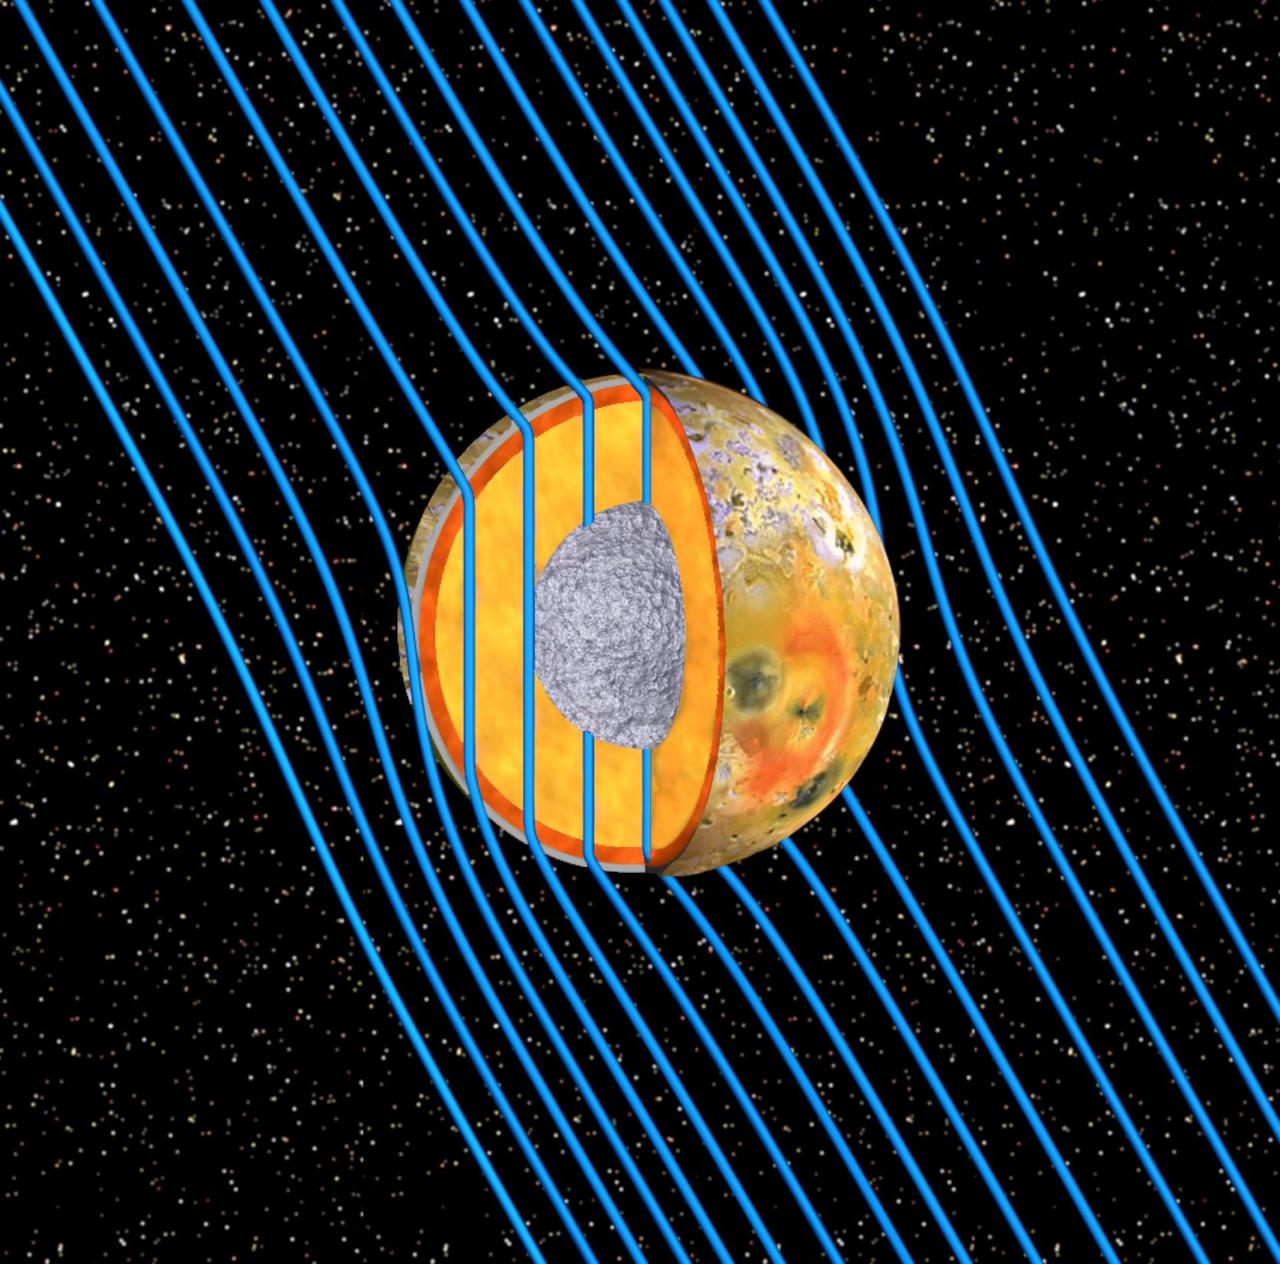
This graphic shows the internal structure of Jupiter moon Io as revealed by data from NASA Galileo spacecraft. Io is bathed in magnetic field lines shown in blue that connect the north polar region of Jupiter to the planet south polar region.

Giant, bright coronal loops trace out the magnetic field lines above an active region from June 4-6, 2018. The wavelength of extreme ultraviolet light shown here is emitted by ionized iron travelling along the field lines, super-heated to approximately 1 million degrees K. Coronal loops were not seen in this level of detail until the Solar Dynamics Observatory was launched in 2010 and came online, giving solar scientists new data with which to study the Sun and its processes. Videos are available at https://photojournal.jpl.nasa.gov/catalog/PIA22508

This graphic shows the computer simulation of a black hole from start to finish. Plasma is falling slowly toward the black hole in a (at the upper left). The plasma has a magnetic field, shown by the white lines. It picks up speed as it falls toward the hole in b (at the upper right), c (lower left) and d (lower right). However, the rotating black hole twists up space itself (and the magnetic field lines) and ejects electromagnetic power along the north and south poles above the black hole. The red and white color shows the immense electromagnetic power output, which eventually will pick up particles and form squirting jets. This simulation was conducted using supercomputers at Japan's National Institute for Fusion Science. http://photojournal.jpl.nasa.gov/catalog/PIA04206
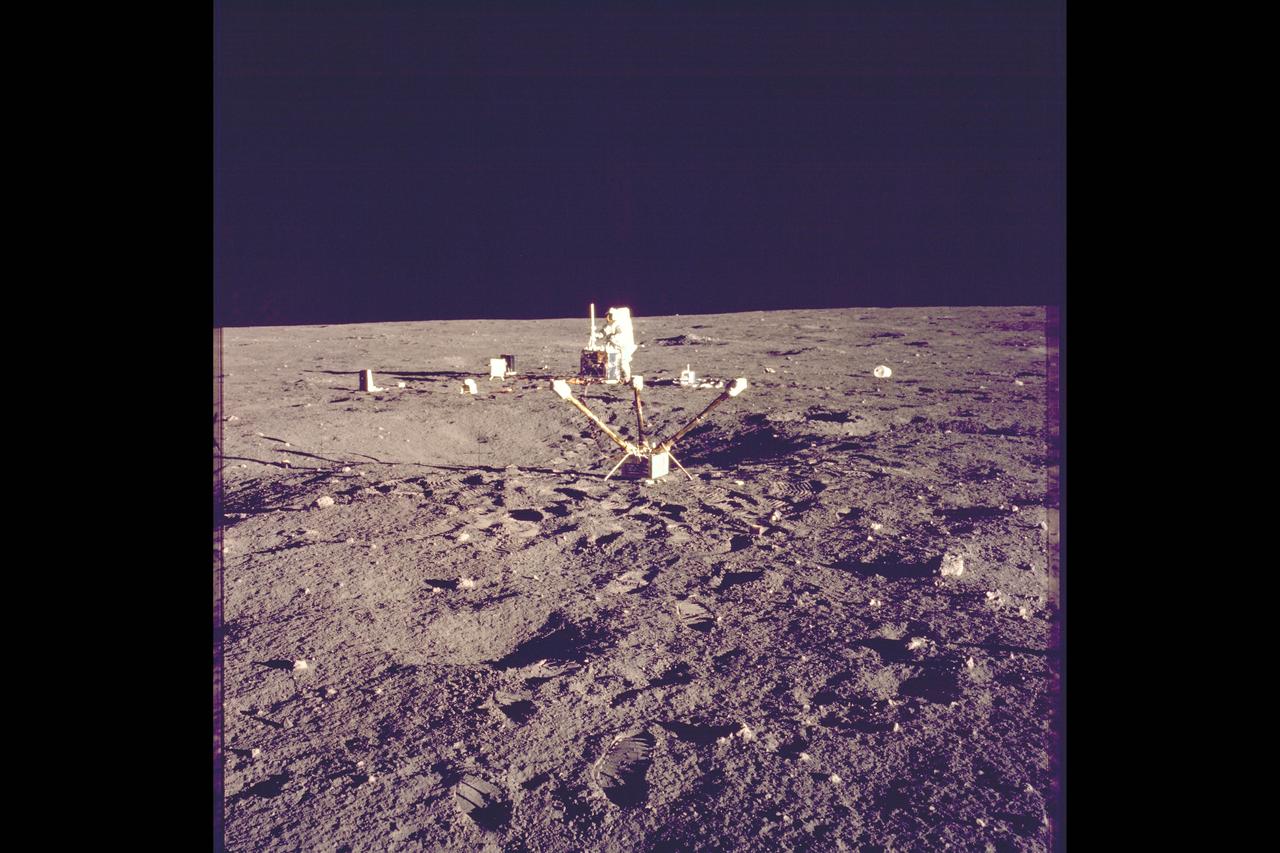
Apollo 12 mission deploys Ames developed special Lunar surface Magnetometer to measure magnetic fields on the moon (Tri-axis magnetometer)
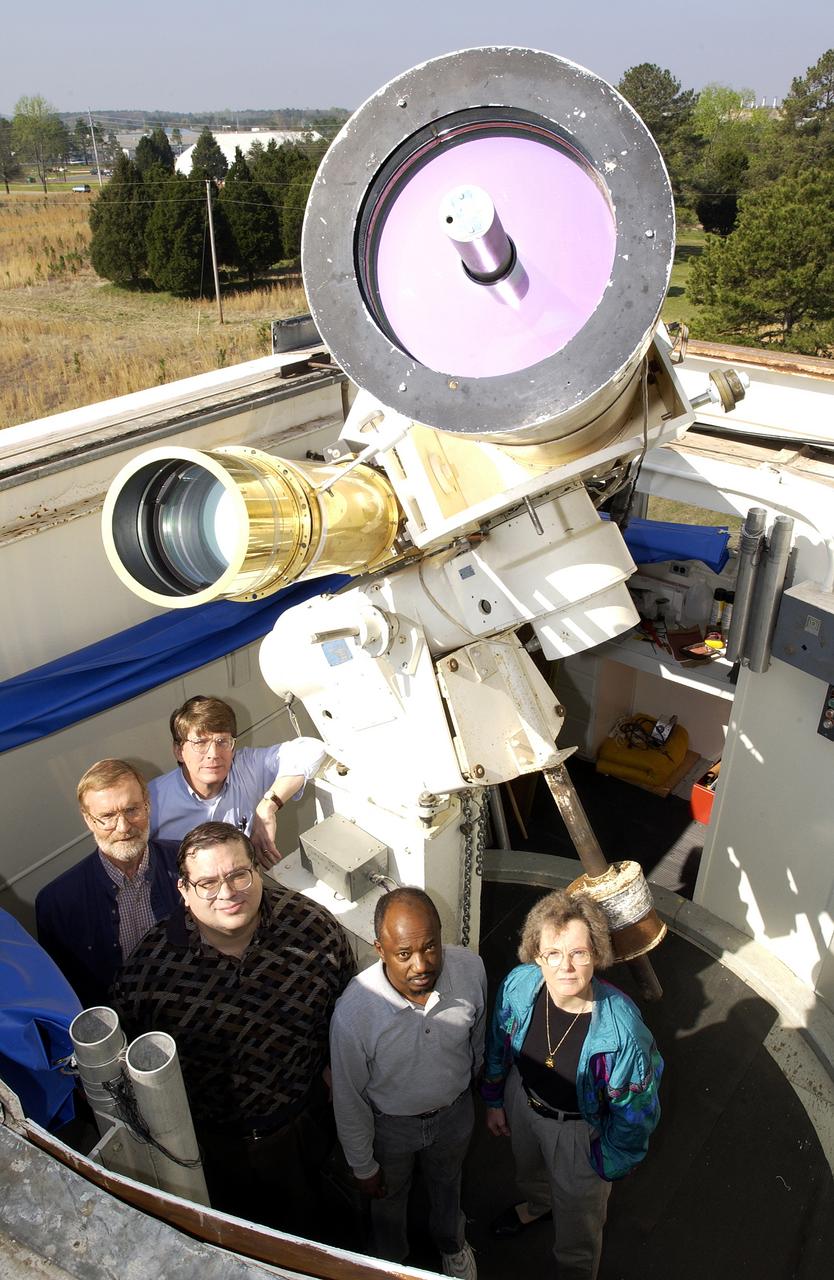
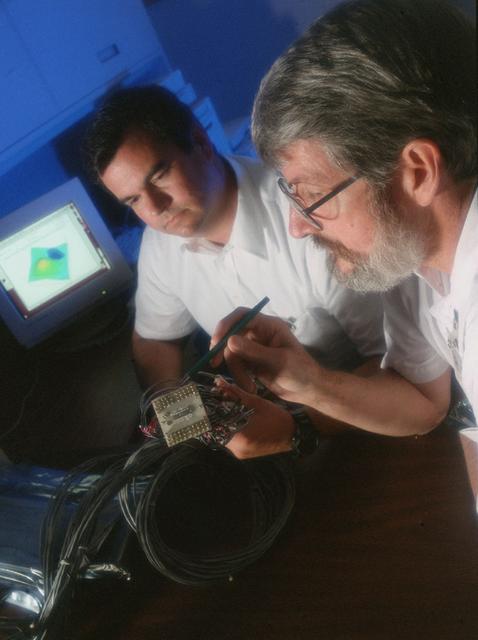
Using the Solar Vector Magnetograph, a solar observation facility at NASA's Marshall Space Flight Center (MSFC), scientists from the National Space Science and Technology Center (NSSTC) in Huntsville, Alabama, are monitoring the explosive potential of magnetic areas of the Sun. This effort could someday lead to better prediction of severe space weather, a phenomenon that occurs when blasts of particles and magnetic fields from the Sun impact the magnetosphere, the magnetic bubble around the Earth. When massive solar explosions, known as coronal mass ejections, blast through the Sun's outer atmosphere and plow toward Earth at speeds of thousands of miles per second, the resulting effects can be harmful to communication satellites and astronauts outside the Earth's magnetosphere. Like severe weather on Earth, severe space weather can be costly. On the ground, magnetic storms wrought by these solar particles can knock out electric power. Photographed are a group of contributing researchers in front of the Solar Vector Magnetograph at MSFC. The researchers are part of NSSTC's solar physics group, which develops instruments for measuring magnetic fields on the Sun. With these instruments, the group studies the origin, structure, and evolution of the solar magnetic fields and the impact they have on Earth's space environment.
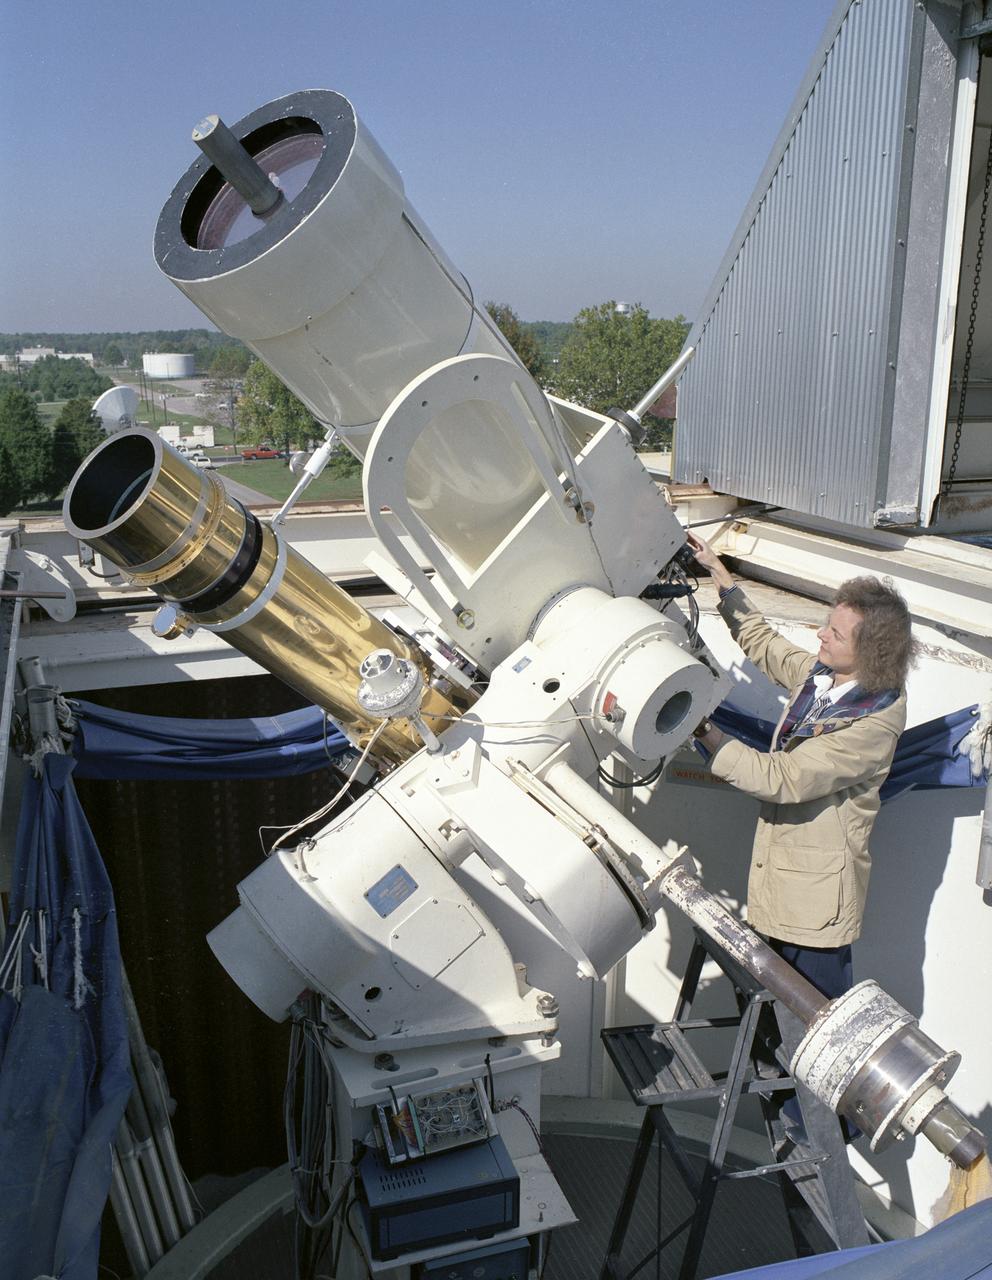
Using the Solar Vector Magnetograph, a solar observation facility at NASA's Marshall Space Flight Center (MSFC), scientists from the National Space Science and Technology Center (NSSTC) in Huntsville, Alabama, are monitoring the explosive potential of magnetic areas of the Sun. This effort could someday lead to better prediction of severe space weather, a phenomenon that occurs when blasts of particles and magnetic fields from the Sun impact the magnetosphere, the magnetic bubble around the Earth. When massive solar explosions, known as coronal mass ejections, blast through the Sun's outer atmosphere and plow toward Earth at speeds of thousands of miles per second, the resulting effects can be harmful to communication satellites and astronauts outside the Earth's magnetosphere. Like severe weather on Earth, severe space weather can be costly. On the ground, the magnetic storm wrought by these solar particles can knock out electric power. The researchers from MSFC and NSSTC's solar physics group develop instruments for measuring magnetic fields on the Sun. With these instruments, the group studies the origin, structure, and evolution of the solar magnetic field and the impact it has on Earth's space environment. This photograph shows the Solar Vector Magnetograph and Dr. Mona Hagyard of MSFC, the director of the observatory who leads the development, operation and research program of the Solar Vector Magnetograph.
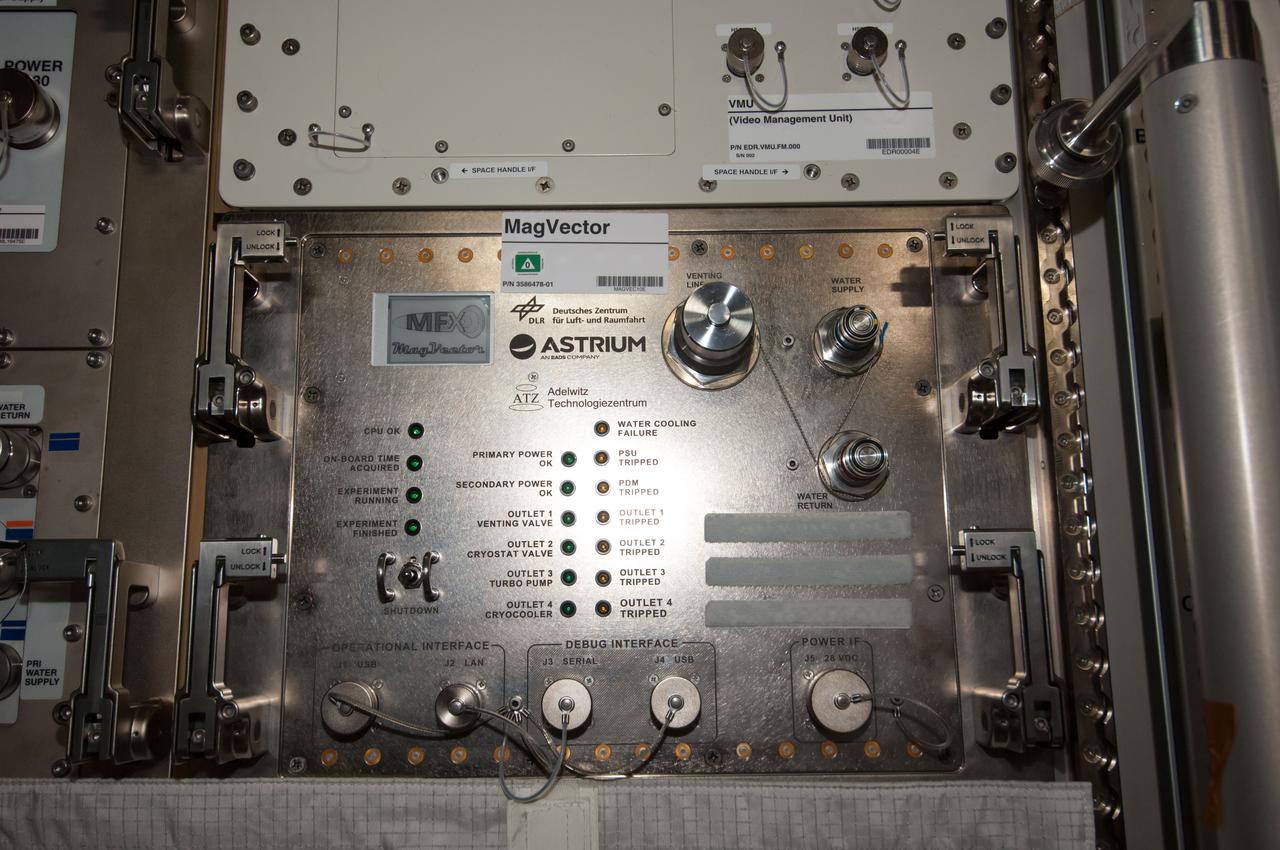
iss040e108291 (8/26/2014) --- Photographic documentation of final installation of MAGVECTOR hardware in the Columbus module aboard the International Space Station (ISS). MAGVECTOR qualitatively investigates the interaction between a moving magnetic field and an electrical conductor. The set up will provide initial insights regarding the principal feasibility on board the ISS,future improvements and phenomenological trends and dependencies. The expected changes in the magnetic field structure on the Ram and Wake side of the electrical conductor are of interest for technical applications as well as for astrophysical research.
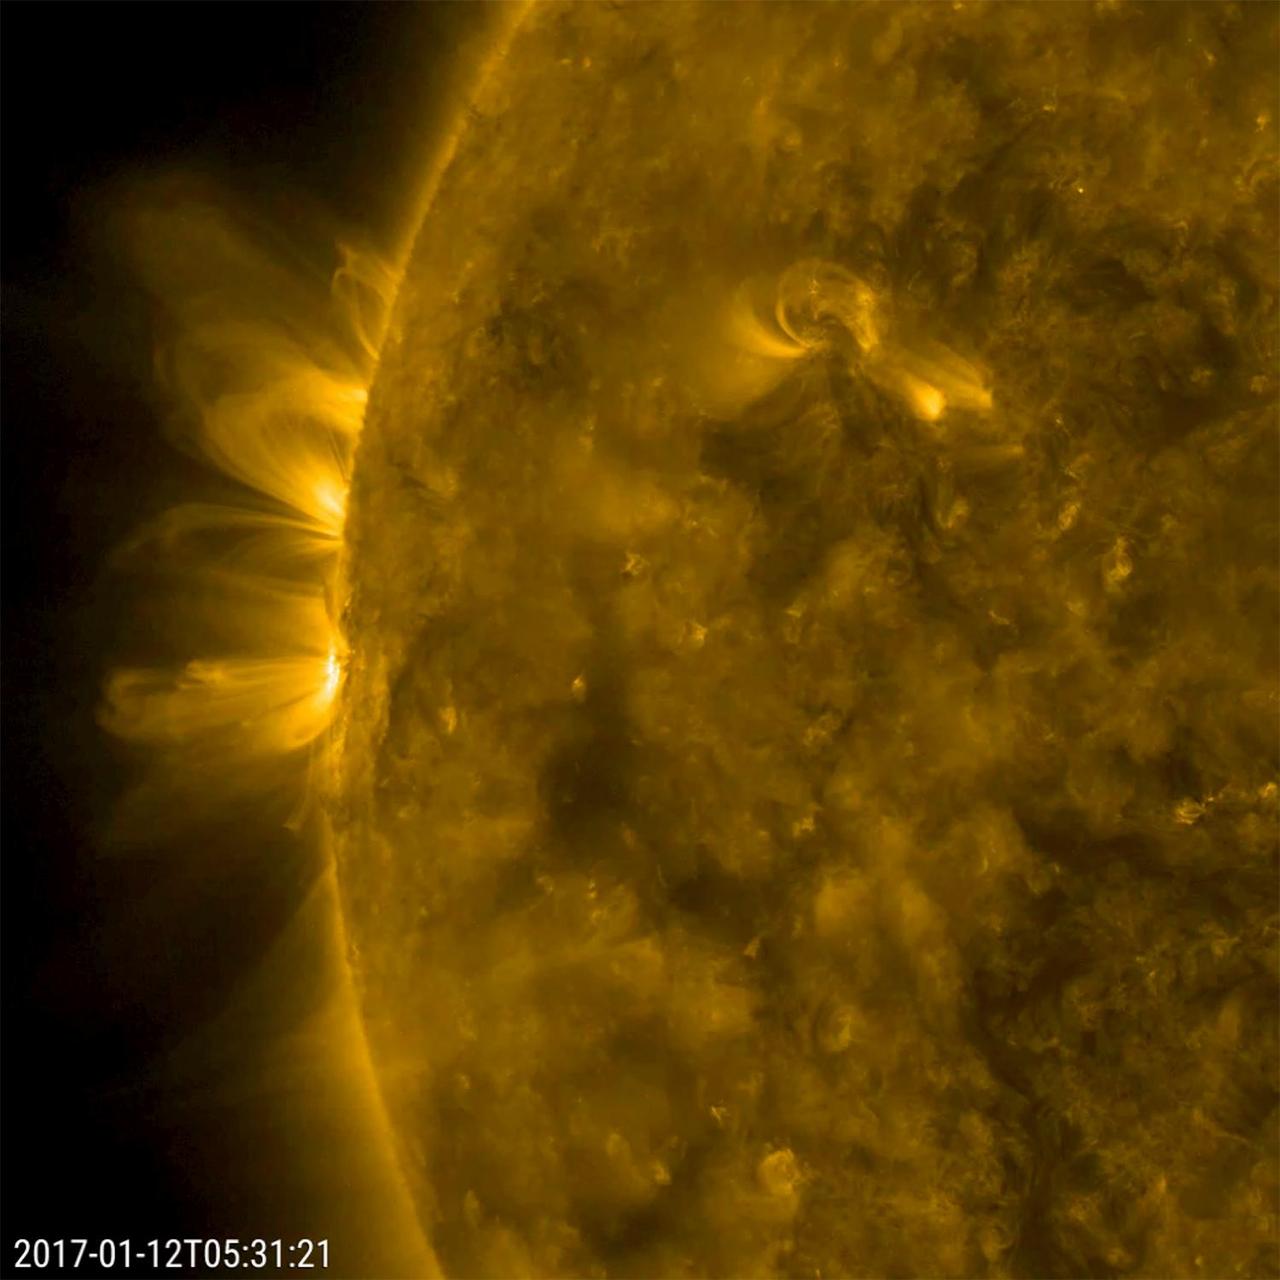
Magnetic arcs of plasma that spiraled above two active regions held their shape fairly well over 18 hours (Jan. 11-12, 2017). The charged plasma is being controlled the magnetic field lines of the active regions. The field lines become clearly visible when viewed in this wavelength of extreme ultraviolet light. Often the arches bend and twist more dynamically than the relatively stable ones seen here. Movies are available at http://photojournal.jpl.nasa.gov/catalog/PIA12327
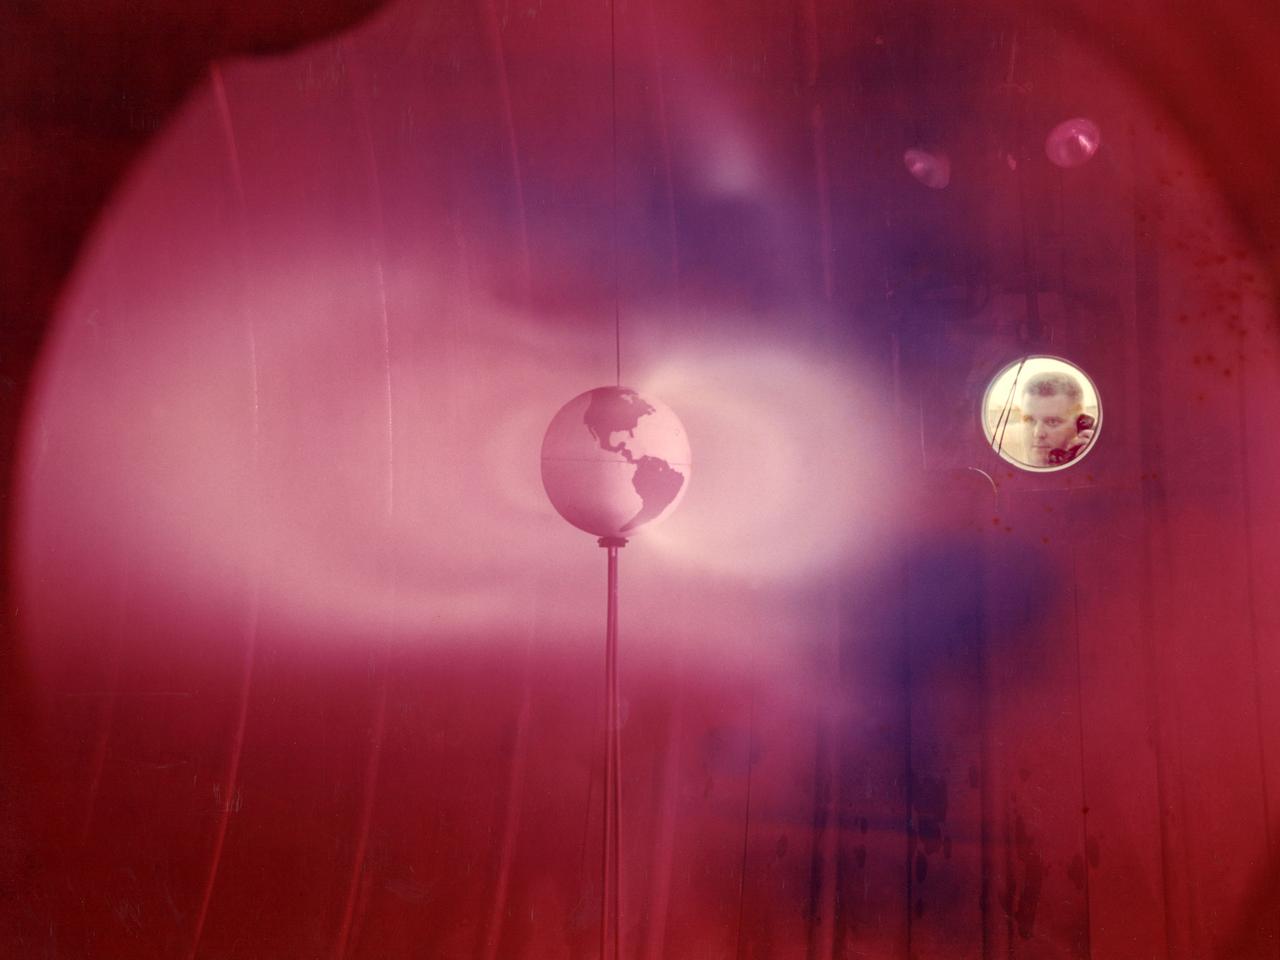
The model of the Earth housed inside Vacuum Tank 5 contained a coil which produced a magnetic field simulating that of the Earth. It was bombarded with a stream of ionized particles simulating the solar wind which impinges on the Earth's magnetic field. The bands or belts of luminous plasma seen in this image were suggestive of the Van Allen belts found around the Earth. Scientists at Lewis probed the plasma around the model and studied scaling laws in an attempt to find an explanation for the actual formation of the Van Allen belt.
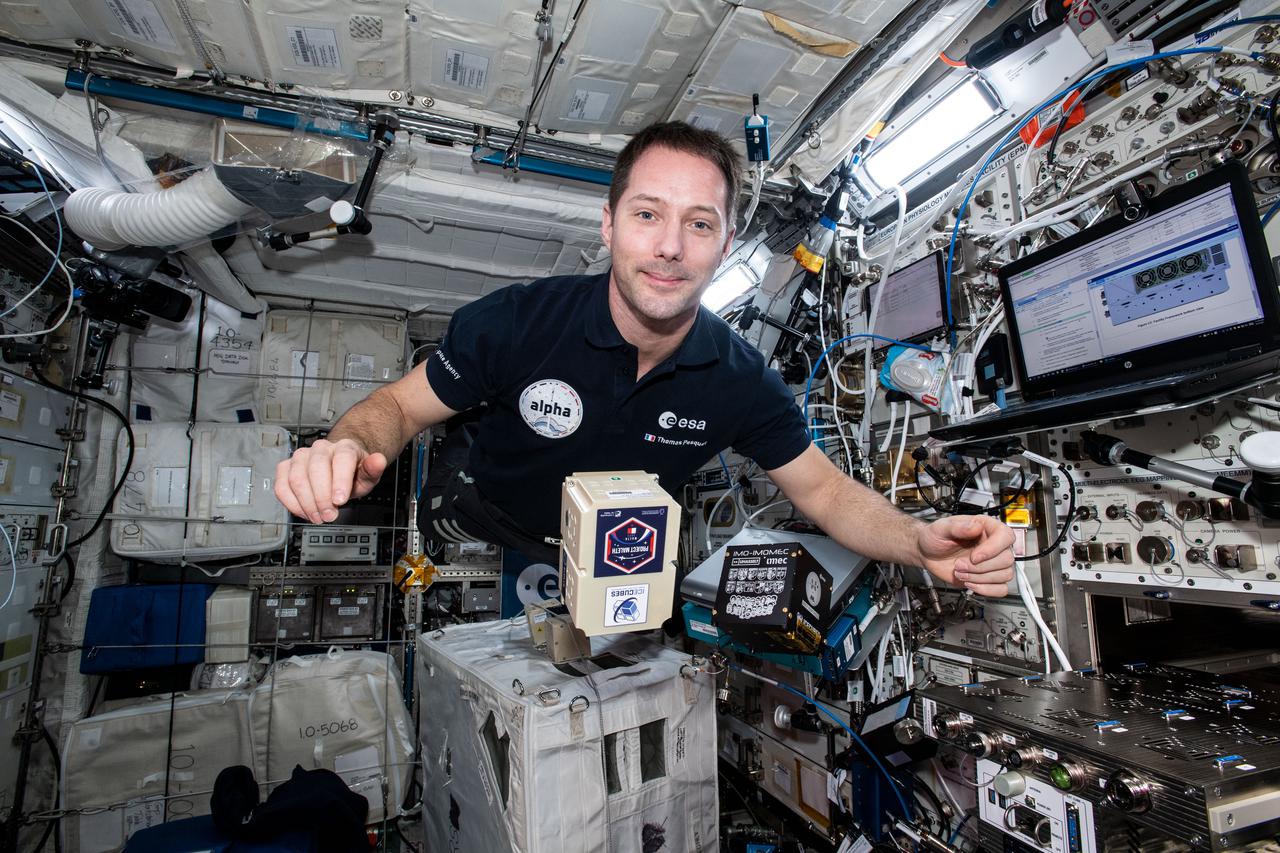
iss065e343728 (9/2/2021) --- European Space Agency (ESA) astronaut Thomas Pesquet is pictured aboard the International Space Station Columbus module with the Ice Cube #8 and #9 BioCubes. The Ice Cube #8 investigation uses quantum technology to produce high-resolution, high-precision measurements of the local magnetic field to create a high-resolution map of the Earth’s magnetic field. Ice Cube #9 seeks to analize the Skin Microbiome of Diabetic Foot Ulcers
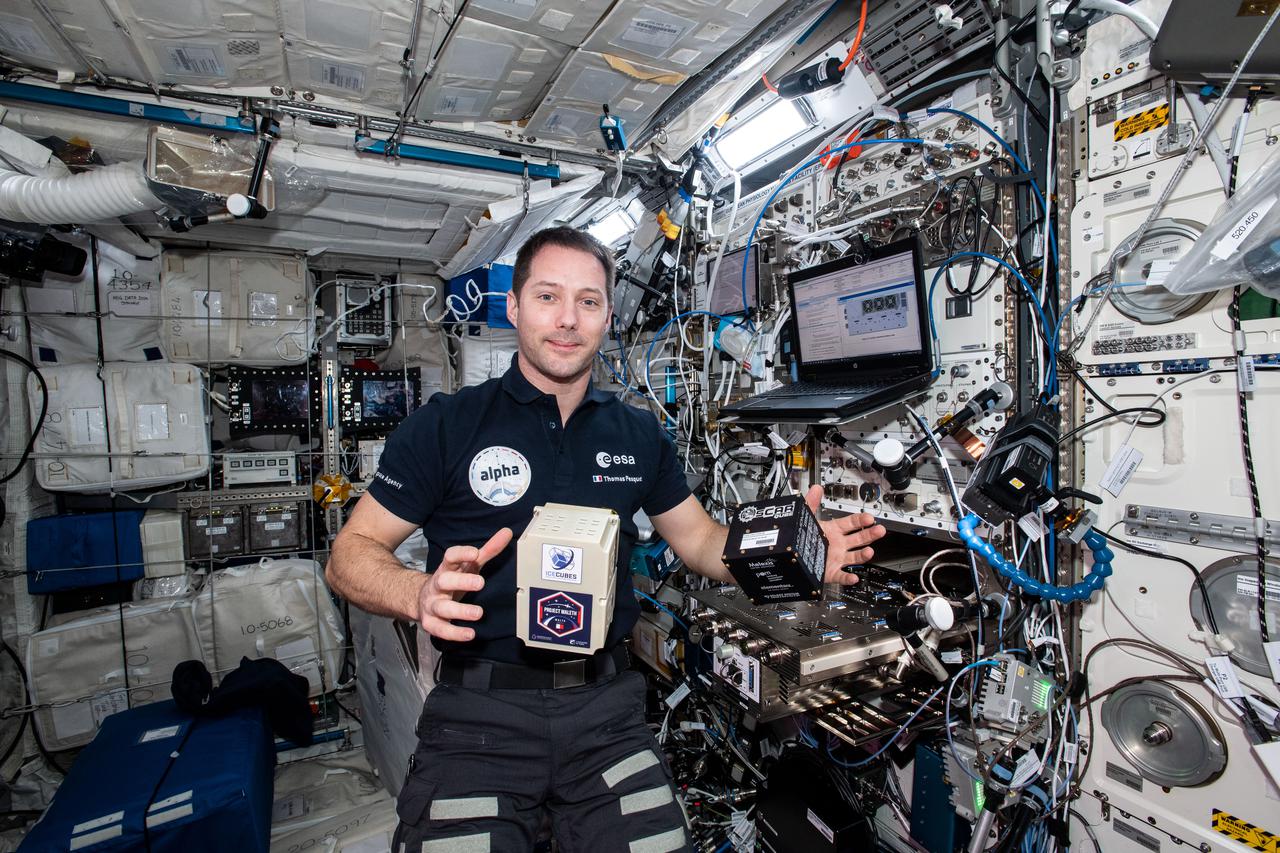
iss065e343725 (9/2/2021) --- European Space Agency (ESA) astronaut Thomas Pesquet is pictured aboard the International Space Station Columbus module with the Ice Cube #8 and #9 BioCubes. The Ice Cube #8 investigation uses quantum technology to produce high-resolution, high-precision measurements of the local magnetic field to create a high-resolution map of the Earth’s magnetic field. Ice Cube #9 seeks to analize the Skin Microbiome of Diabetic Foot Ulcers
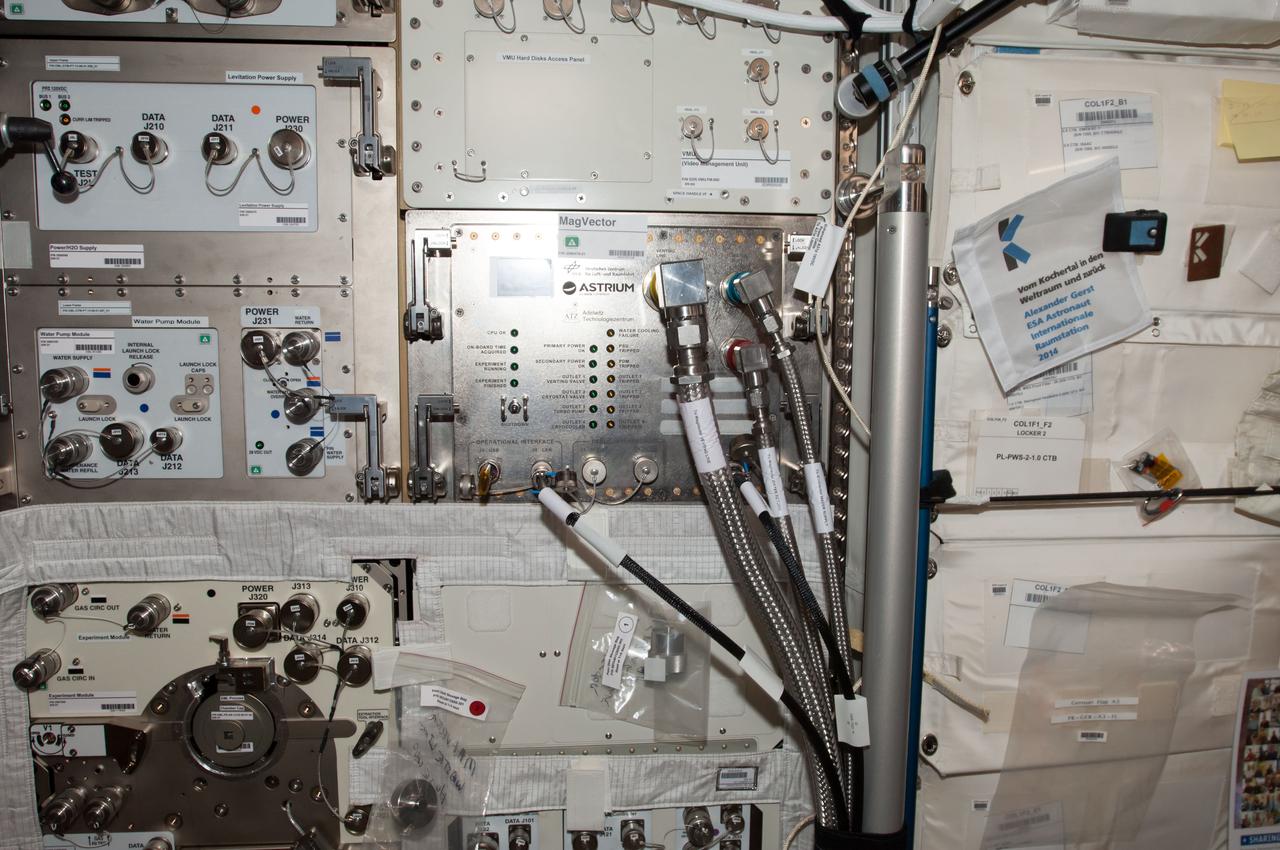
iss040e123621 (9/4/2014) --- Photographic documentation of final installation of MAGVECTOR hardware in the Columbus module aboard the International Space Station (ISS). MAGVECTOR qualitatively investigates the interaction between a moving magnetic field and an electrical conductor. The set up will provide initial insights regarding the principal feasibility on board the ISS,future improvements and phenomenological trends and dependencies. The expected changes in the magnetic field structure on the Ram and Wake side of the electrical conductor are of interest for technical applications as well as for astrophysical research.

A solar prominence at the sun's edge put on quite a display of plasma being pushed and pulled by unstable magnetic fields (May 22-24, 2017). We call them hedgerow prominences because they look somewhat like a hedge of bushes. This is one of the better examples of this type of solar phenomenon than any we have seen in quite some time. Movies are available at https://photojournal.jpl.nasa.gov/catalog/PIA21650
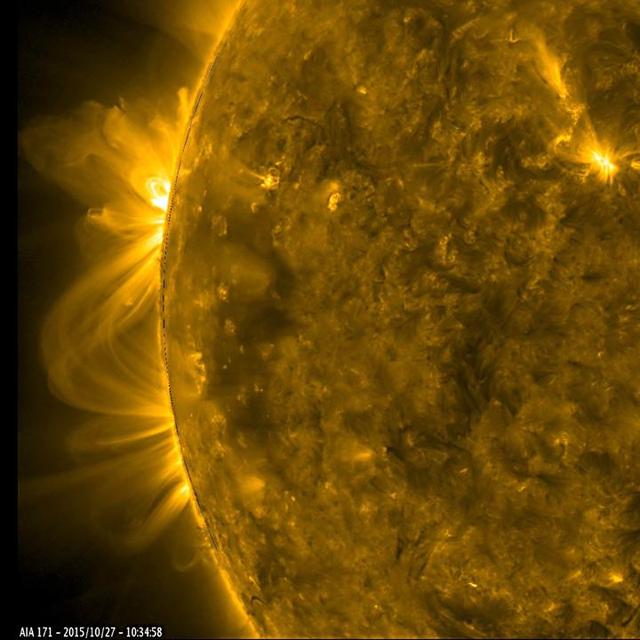
As a pair of active regions began to rotate into view, their towering magnetic field lines above them bloomed into a dazzling display of twisting arches (Oct. 27-28, 2015). Some of the lines reached over and connected with the neighboring active region. Active regions are usually the source of solar storms. The images were taken in a wavelength of extreme ultraviolet light. http://photojournal.jpl.nasa.gov/catalog/PIA20048
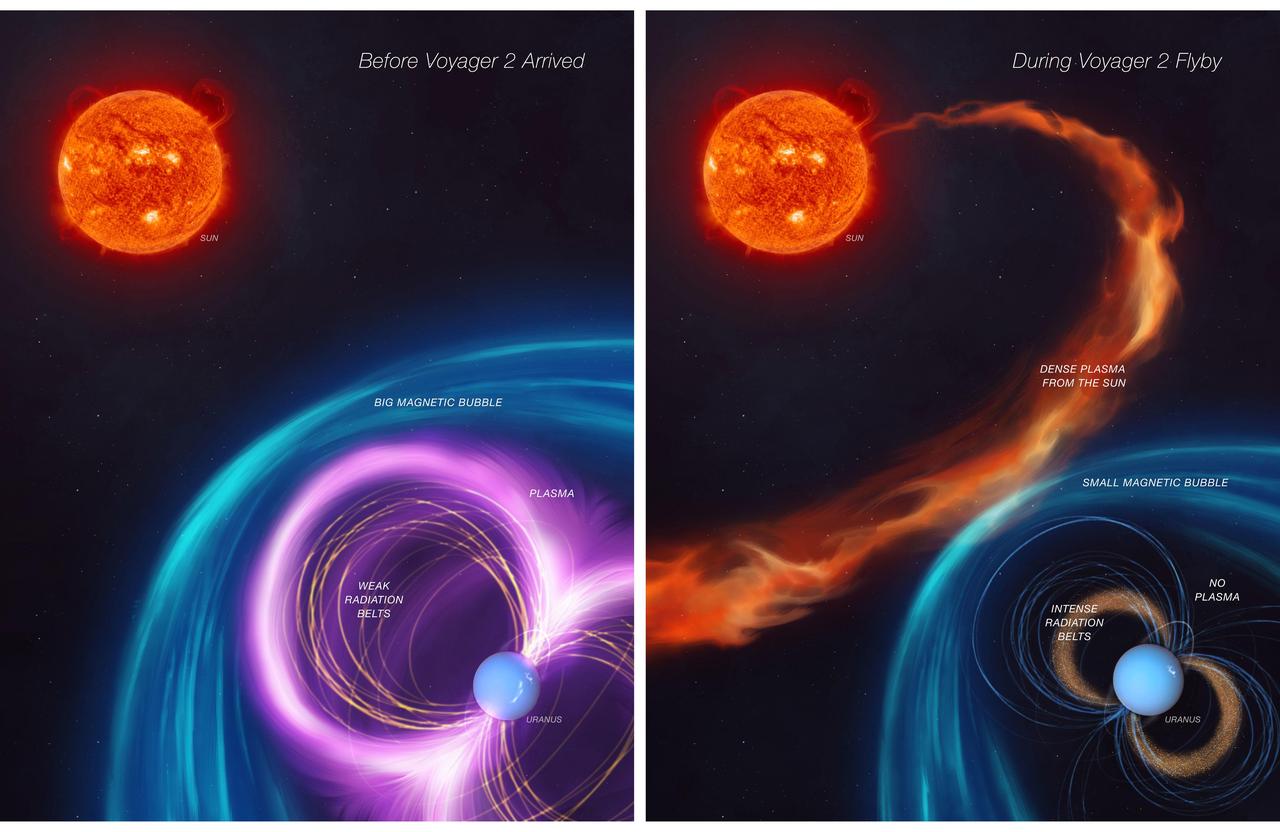
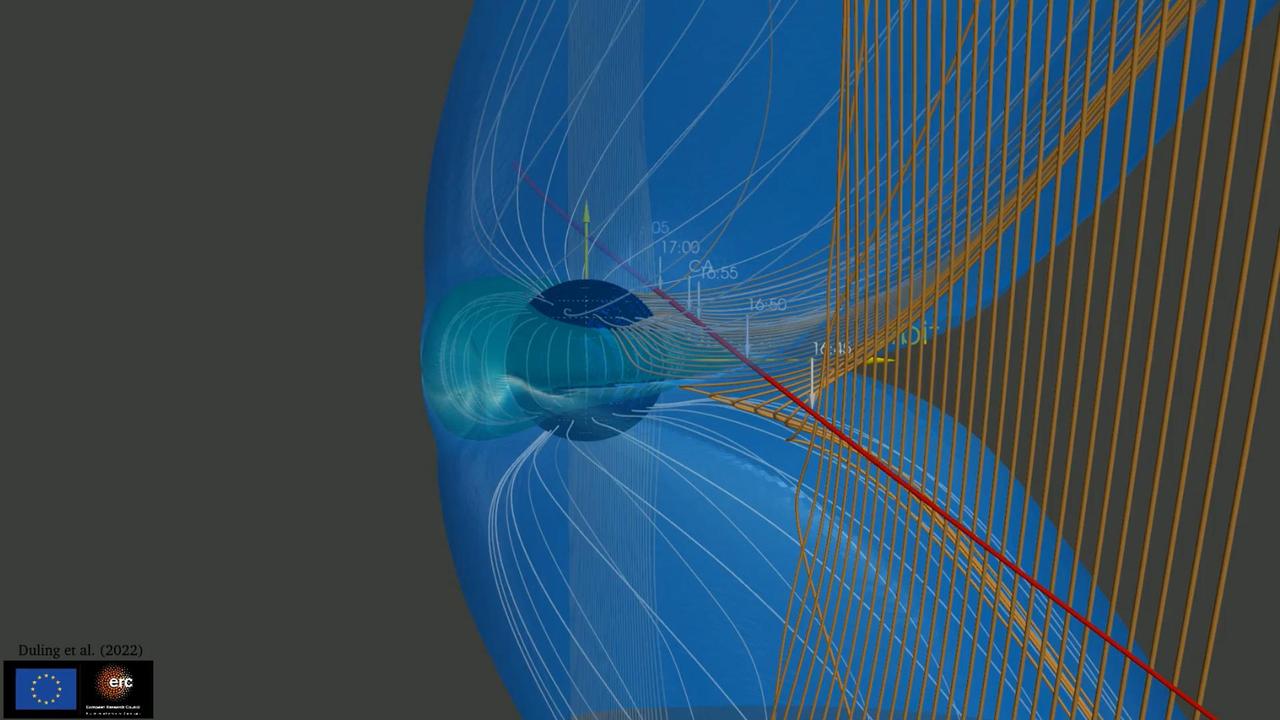
When NASA's Voyager 2 spacecraft flew by Uranus in 1986, it provided scientists' first – and, so far, only – close glimpse of this outer planet. Scientists were confronted by a mystery: The energized particles around the planet defied their understanding of how magnetic fields work to trap particle radiation. The first panel of this artist's concept depicts how Uranus's magnetosphere (its protective bubble) was behaving before Voyager 2's flyby. The second panel shows that an unusual kind of solar weather was happening at the same time as the spacecraft's flyby, giving scientists a skewed view of Uranus's magnetosphere. The work, led by a scientist at NASA's Jet Propulsion Laboratory and described in a paper published in Nature Astronomy in November 2024, contributes to scientists' understanding of this enigmatic planet. It also opens the door to the possibility that Uranus' five major moons may be active. https://photojournal.jpl.nasa.gov/catalog/PIA26069
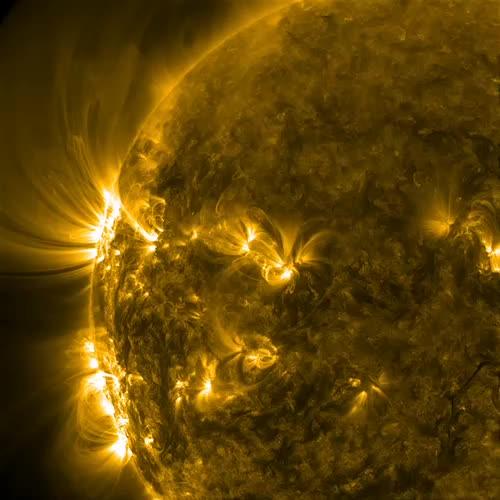
Two active regions with their intense magnetic fields produced towering arches and spiraling coils of solar loops above them (June 29 - July 1, 2014) as they rotated into view. When viewed in extreme ultraviolet light, magnetic field lines are revealed by charged particles that travel along them. These active regions appear as dark sunspots when viewed in filtered light. Note the small blast in the upper of the two major active regions, followed by more coils of loops as the region reorganizes itself. The still was taken on June 30 at 10:33 UT. Credit: NASA/Solar Dynamics Observatory Two active regions with their intense magnetic fields produced towering arches and spiraling coils of solar loops above them (June 29 - July 1, 2014) as they rotated into view. When viewed in extreme ultraviolet light, magnetic field lines are revealed by charged particles that travel along them. These active regions appear as dark sunspots when viewed in filtered light. Note the small blast in the upper of the two major active regions, followed by more coils of loops as the region reorganizes itself. The still was taken on June 30 at 10:33 UT. Credit: Solar Dynamics Observatory/NASA.
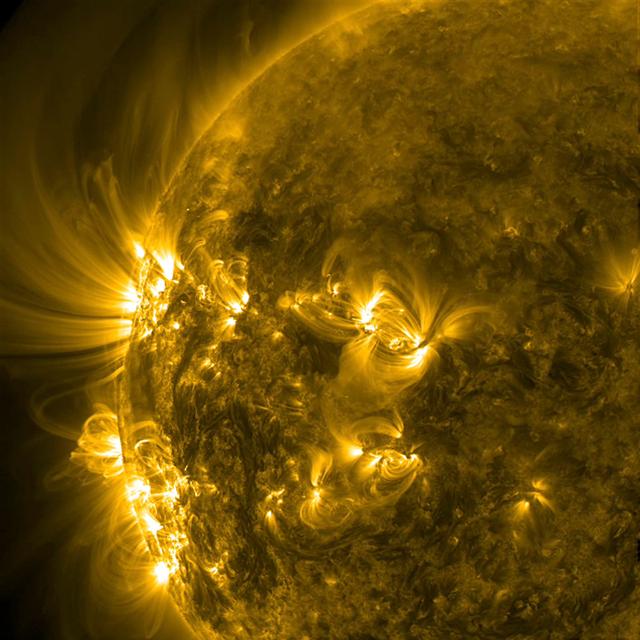
Two active regions with their intense magnetic fields produced towering arches and spiraling coils of solar loops above them (June 29 - July 1, 2014) as they rotated into view. When viewed in extreme ultraviolet light, magnetic field lines are revealed by charged particles that travel along them. These active regions appear as dark sunspots when viewed in filtered light. This image was taken on June 30 at 10:33 UT. Credit: NASA/Solar Dynamics Observatory Two active regions with their intense magnetic fields produced towering arches and spiraling coils of solar loops above them (June 29 - July 1, 2014) as they rotated into view. When viewed in extreme ultraviolet light, magnetic field lines are revealed by charged particles that travel along them. These active regions appear as dark sunspots when viewed in filtered light. Note the small blast in the upper of the two major active regions, followed by more coils of loops as the region reorganizes itself. The still was taken on June 30 at 10:33 UT. Credit: Solar Dynamics Observatory/NASA.

This artist's concept depicts a magnetar – a type of neutron star with a strong magnetic field – losing material into space in an ejection that would have caused the object's rotation to slow. Shown as thin green lines, the magnetic field lines influence the movement of charged material around the magnetar. In October 2022, astronomers using NASA's NICER (Neutron Star Interior Composition Explorer) on the International Space Station and NuSTAR (Nuclear Spectroscopic Telescope Array) in low Earth orbit observed a rapid slowdown in a nearby magnetar called SGR 1935+2154. They believe the slowdown was caused by a rapid loss of material. The slowdown coincided with the release a fast radio burst – an eruption of radio waves that last only for a fraction of a second but can release about as much energy as the Sun does in a year. The light also forms a laser-like beam, setting them apart from more chaotic cosmic explosions. The telescopes were able to observe SGR 1935+2154 for hours, catching a glimpse of what happened on its surface and in its immediate surroundings both before and after the fast radio burst. https://photojournal.jpl.nasa.gov/catalog/PIA26274
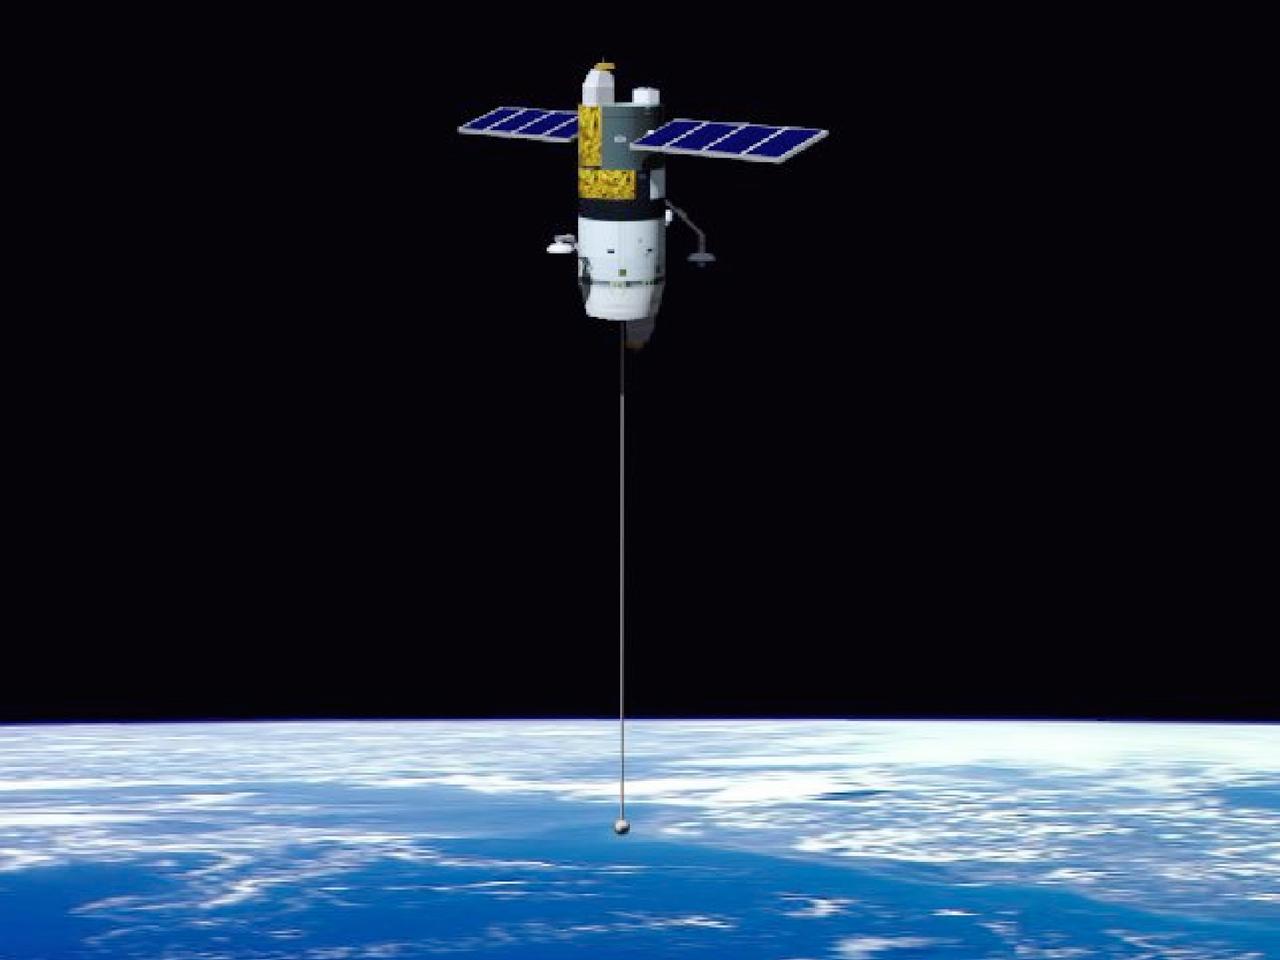
This picture is an artist's concept of an orbiting vehicle using the Electrodynamic Tethers Propulsion System. Relatively short electrodynamic tethers can use solar power to push against a planetary magnetic field to achieve propulsion without the expenditure of propellant.

The Gasdynamic Mirror, or GDM, is an example of a magnetic mirror-based fusion propulsion system. Its design is primarily consisting of a long slender solenoid surrounding a vacuum chamber that contains plasma. The bulk of the fusion plasma is confined by magnetic field generated by a series of toroidal-shaped magnets in the center section of the device. the purpose of the GDM Fusion Propulsion Experiment is to confirm the feasibility of the concept and to demonstrate many of the operational characteristics of a full-size plasma can be confined within the desired physical configuration and still reman stable. This image shows an engineer from Propulsion Research Technologies Division at Marshall Space Flight Center inspecting solenoid magnets-A, an integrate part of the Gasdynamic Mirror Fusion Propulsion Engine Experiment.
Every day, invisible magnetic explosions are happening around Earth, on the surface of the sun and across the universe. These explosions, known as magnetic reconnection, occur when magnetic field lines cross, releasing stored magnetic energy. Such explosions are a key way that clouds of charged particles — plasmas — are accelerated throughout the universe. In Earth’s magnetosphere — the giant magnetic bubble surrounding our planet — these magnetic reconnections can fling charged particles toward Earth, triggering auroras. Read more: <a href="http://go.nasa.gov/2mnMtDm" rel="nofollow">go.nasa.gov/2mnMtDm</a> Video caption - In this simulation, a reconnection even pushes a blob of plasma toward Earth. The jet blown in the opposite direction wobbles due to the unstable conditions. Credit: NASA’s Goddard Space Flight Center/Yi-Hsin Liu/Joy Ng, producer
Three substantial coronal holes rotated across the face of the Sun the week of Sept. 8-10, 2015 as seen by NASA Solar Dynamics Observatory. Coronal holes are areas where the Sun magnetic field is open and a source of streaming solar wind. They appear darker in extreme ultraviolet light because there is less material in the hole areas being imaged in this specific wavelength of light. It is a little unusual to have three coronal holes at the same time, but neither is it a rare occurrence. http://photojournal.jpl.nasa.gov/catalog/PIA19950
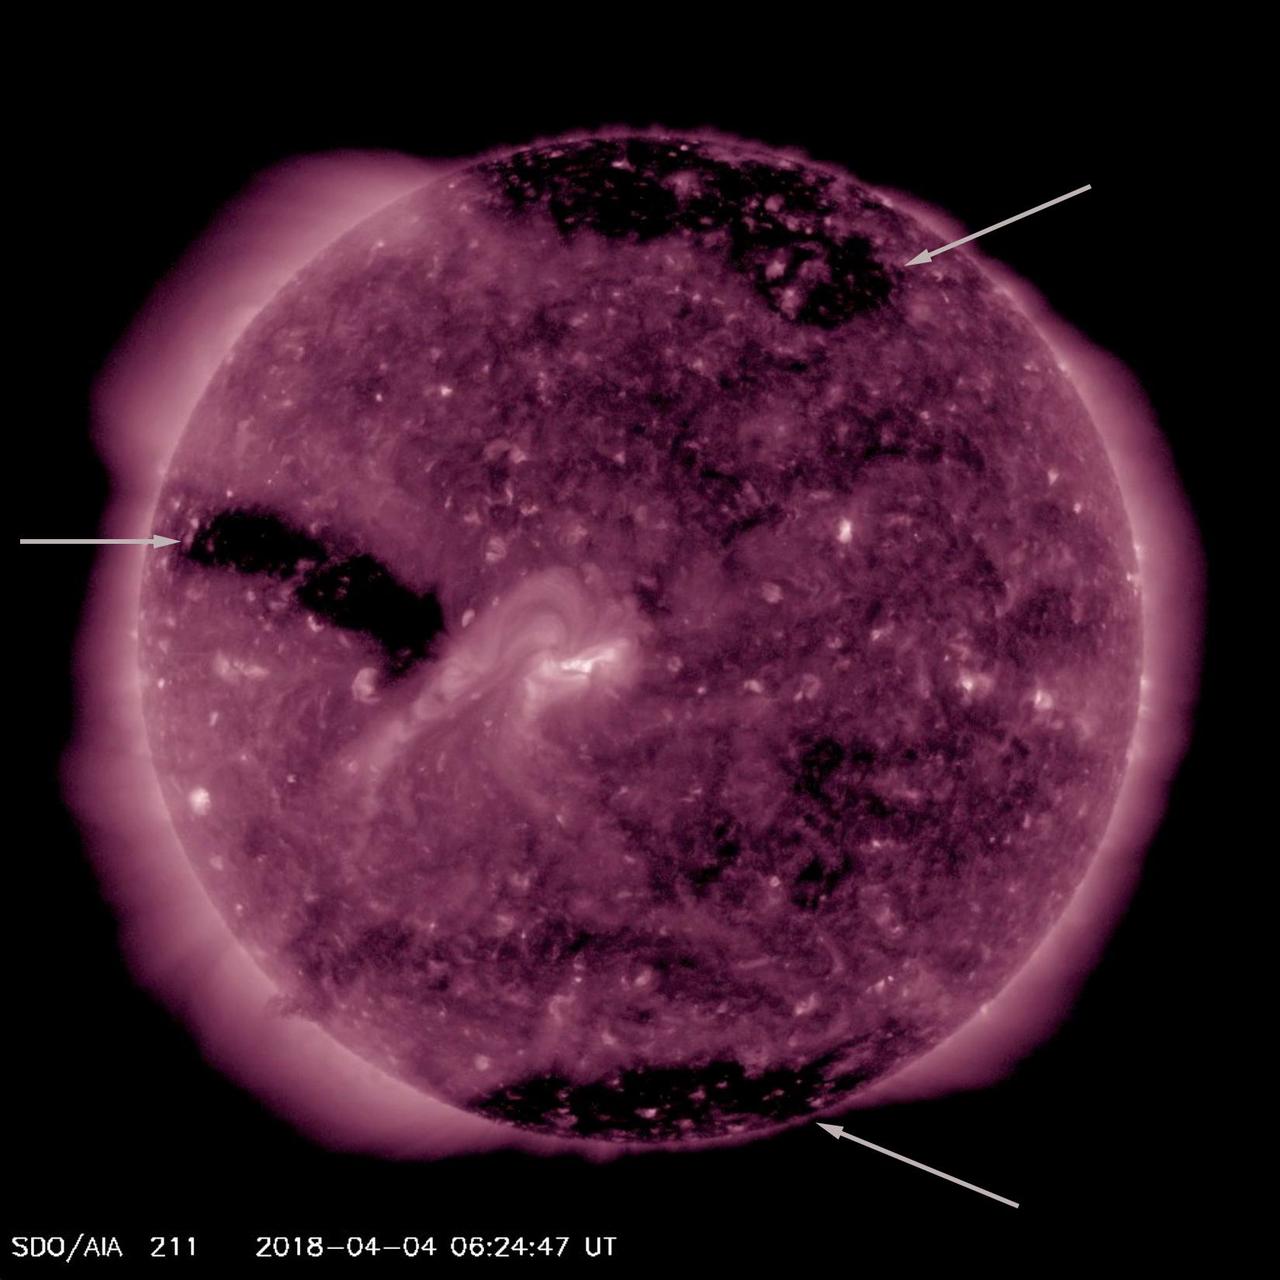
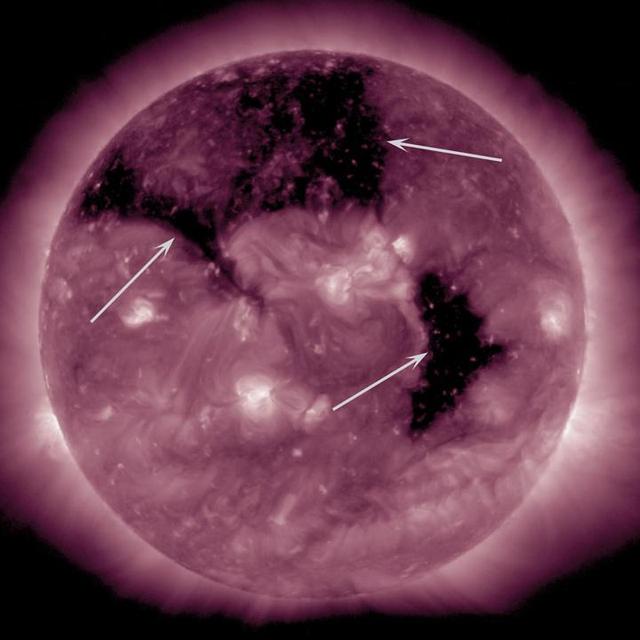
For much of this week the sun featured three substantial coronal holes (Apr. 3-6, 2018). Coronal holes appear as large dark areas which are identified with arrows in the still image. These are areas of open magnetic field from which high speed solar wind rushes out into space. This wind, if it interacts with Earth's magnetosphere, can cause aurora to appear near the poles. They are not at all uncommon. Animations are available at https://photojournal.jpl.nasa.gov/catalog/PIA22414
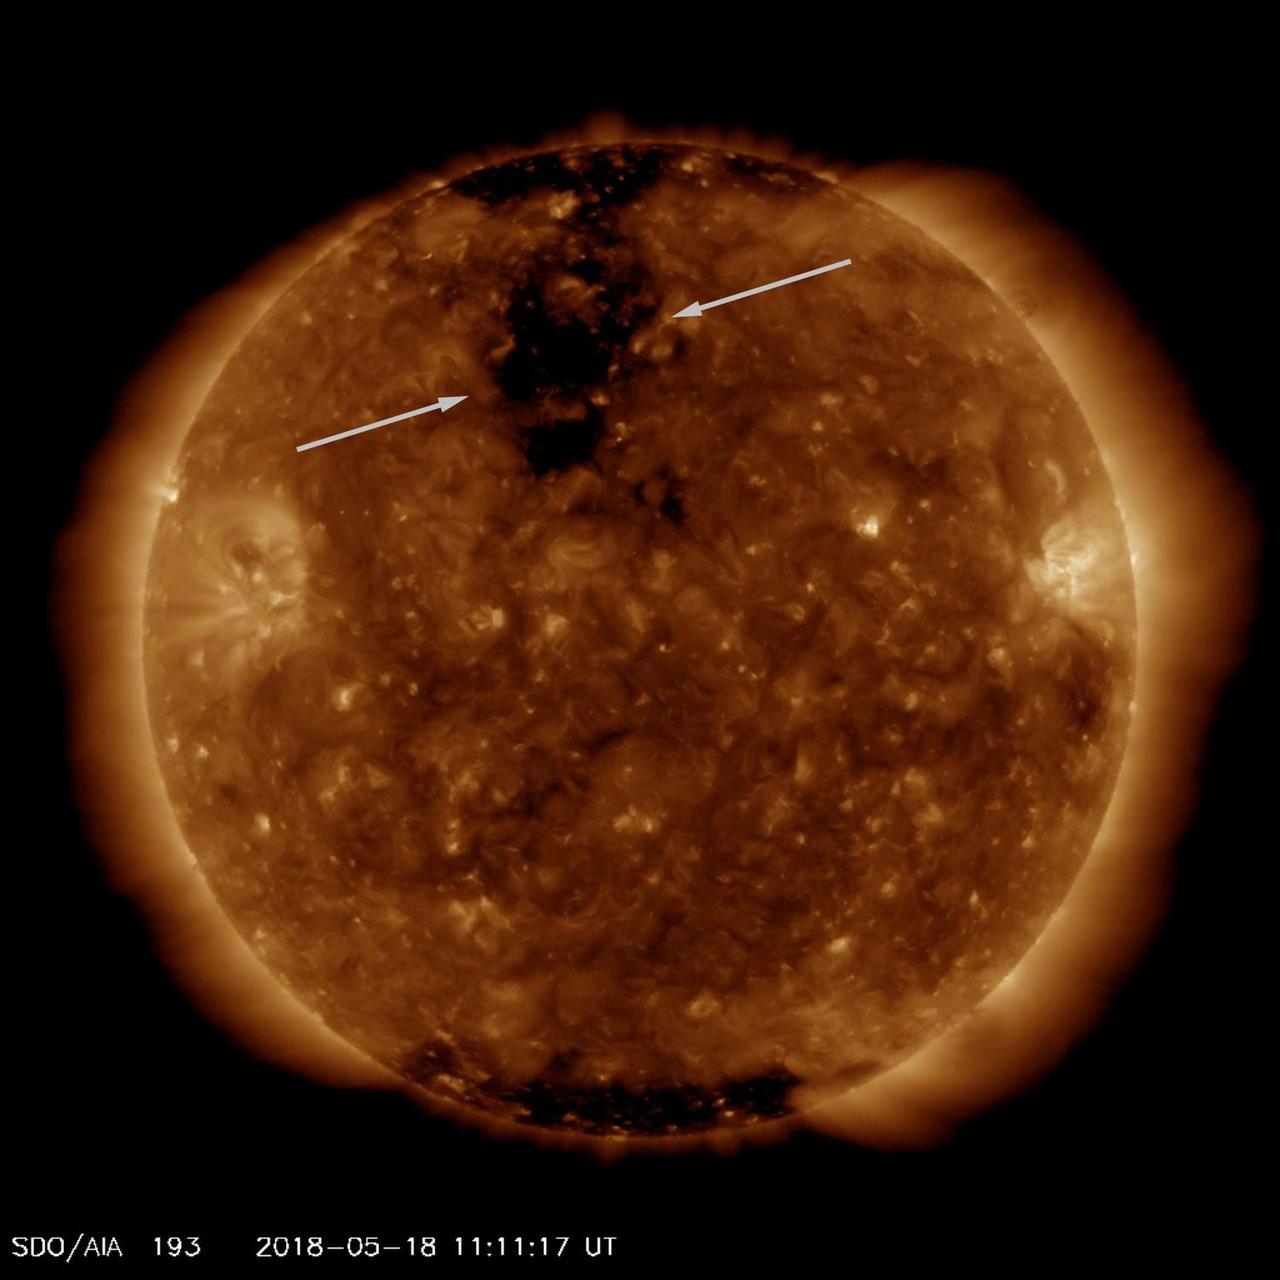
A good-sized coronal hole came around to where it is just about facing Earth (May 16-18, 2018). Coronal holes are areas of open magnetic field from which solar wind (consisting of charged particles) streams into space. The video clip covers two days and was taken in a wavelength of extreme ultraviolet light. Such streams of particles take several days to reach Earth, but they can generate aurora, particularly nearer the poles. An animation is available at https://photojournal.jpl.nasa.gov/catalog/PIA00575
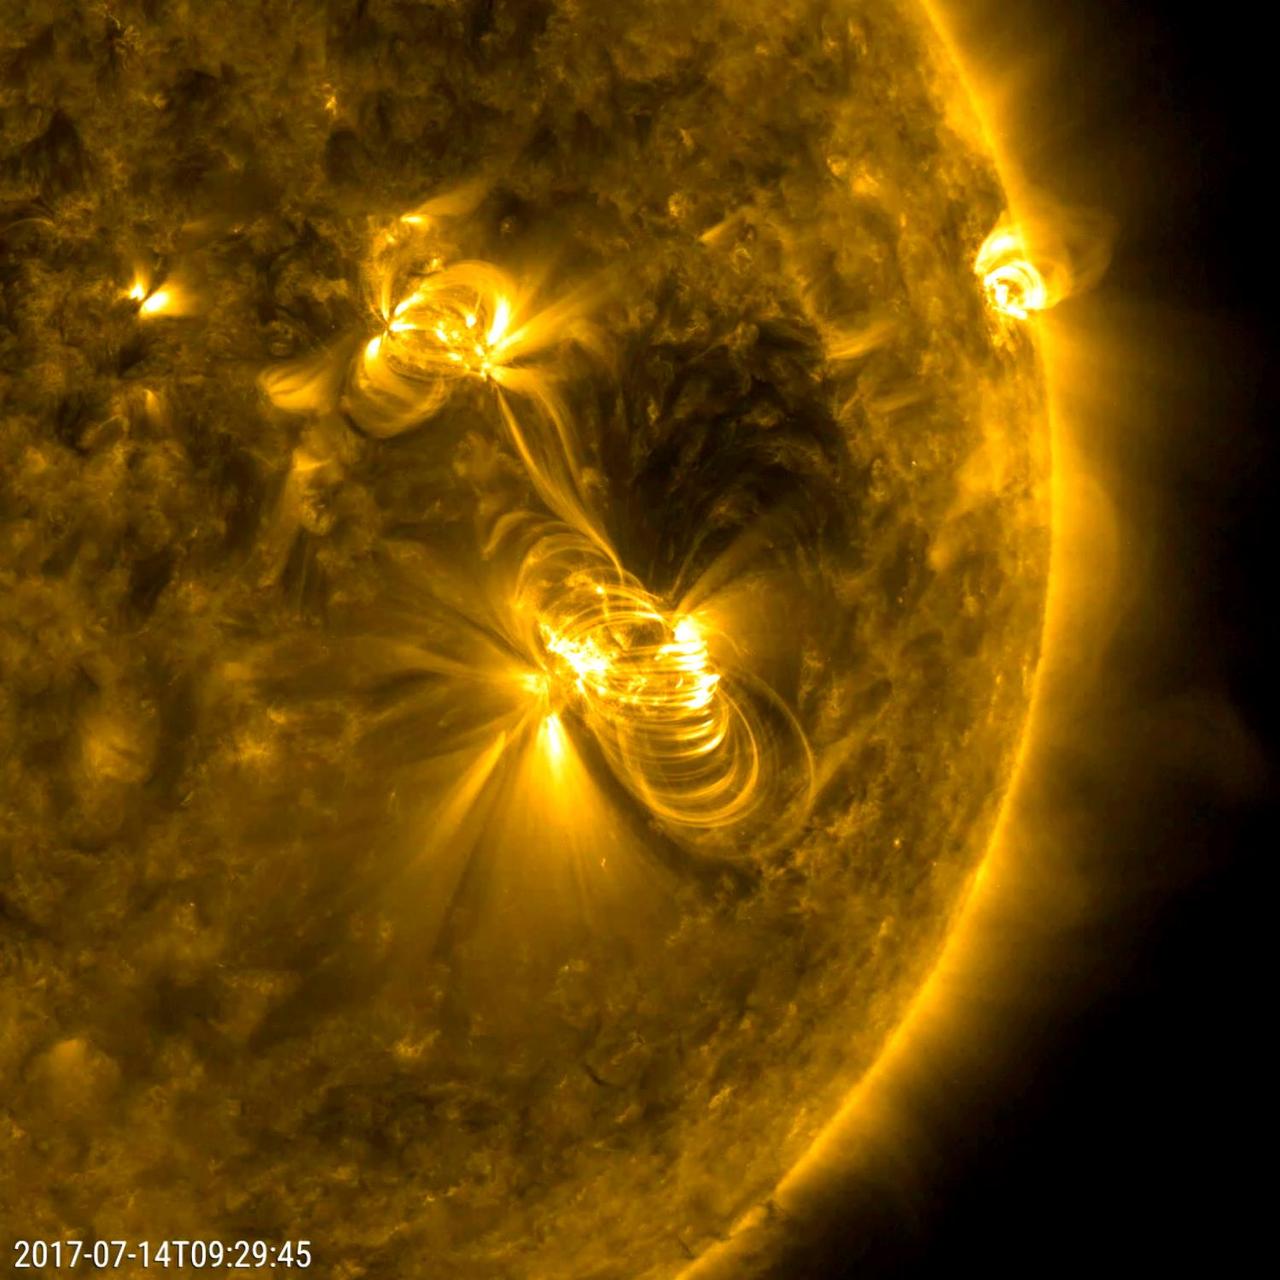
A flare medium-sized (M2) flare and a coronal mass ejection erupted from the same, large active region (July 14, 2017). The flare lasted almost two hours, quite a long duration. Coronagraphs on the SOHO spacecraft show a substantial cloud of charged particles blasting into space just after the blast. The coils arcing over this active region are particles spiraling along magnetic field lines, which were reorganizing themselves after the magnetic field was disrupted by the blast. Images were taken in a wavelength of extreme ultraviolet light. Movies are available at https://photojournal.jpl.nasa.gov/catalog/PIA21836
This diagram indicates the paths that NASA's Juno spacecraft took relative to Jupiter as the spacecraft repeatedly passed close by the giant planet over the course of five years, beginning in 2016, wrapping it in a dense net of observations ideally suited to mapping its magnetic field. Shown here are segments of the mission's first 32 high-inclination orbits, drawn from that part of each orbit passing very close to Jupiter, equally spaced in longitude. Juno has completed its first global mapping of the magnetic field, sampling it from pole to pole at about 11 degrees of separation in longitude between each orbit. https://photojournal.jpl.nasa.gov/catalog/PIA25061
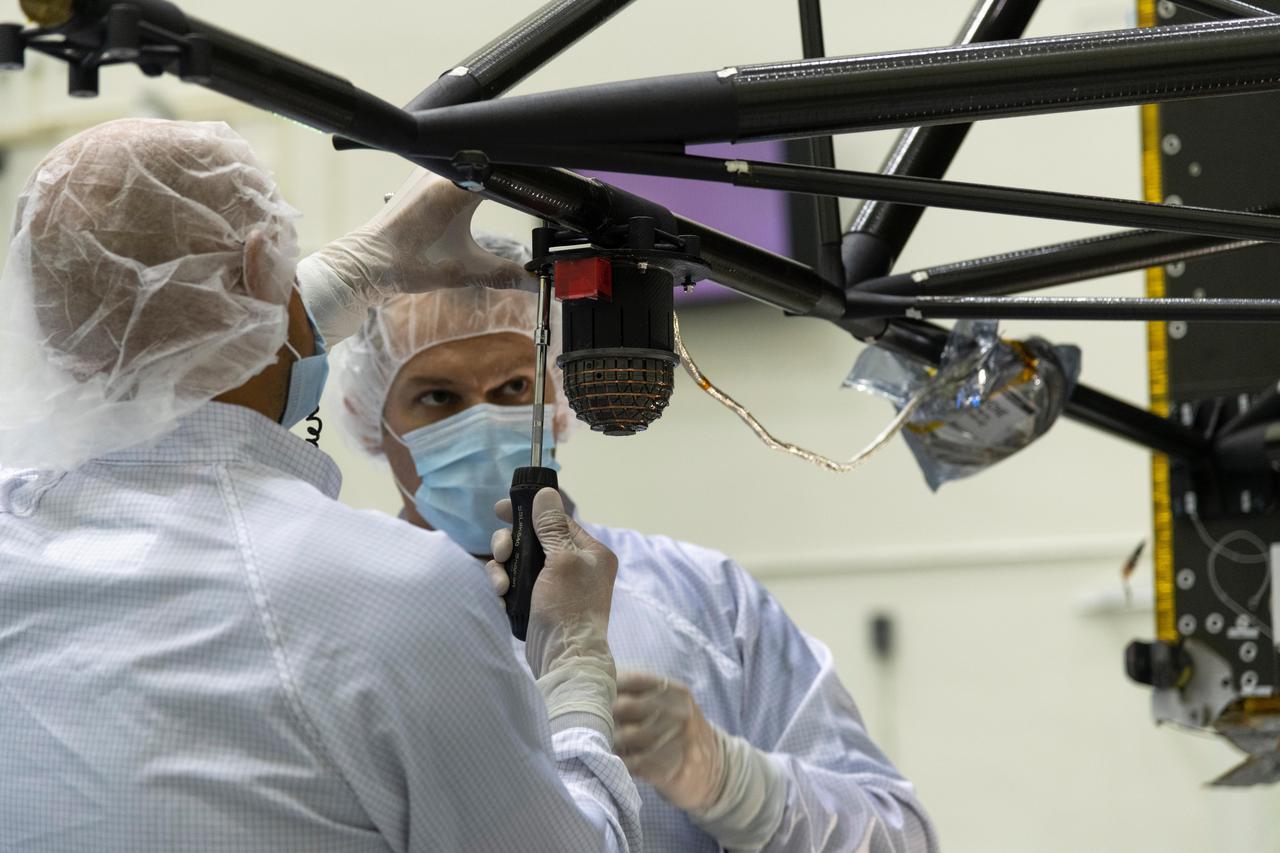
Engineers at NASA's Jet Propulsion Laboratory in Southern California integrate the magnetometer instrument into the agency's Psyche spacecraft on June 28, 2021. Psyche, set to launch in August 2022, will investigate a metal-rich asteroid of the same name, which lies in the main asteroid belt between Mars and Jupiter. Scientists believe the asteroid could be part or all of the iron-rich interior of an early planetary building block that was stripped of its outer rocky shell as it repeatedly collided with other large bodies during the early formation of the solar system. Scientists know that the asteroid doesn't generate a magnetic field the way Earth does; but if Psyche had a magnetic field in the past, that magnetic field could still be recorded in Psyche's material today. With sensors mounted onto a 6-foot (2-meter) boom, the magnetometer can determine if Psyche is still magnetized. If so, that would confirm that the asteroid is part of the core of a planetesimal, the building block of an early planet. This photo shows one of the magnetometer's sensors. https://photojournal.jpl.nasa.gov/catalog/PIA24893

The Sun's rotation brought a new active region into view, revealing the dynamic arches and twisting streams of its magnetic field (Oct. 10-11, 2018). A new active region is becoming more of a rare sight, as the Sun is currently approaching solar minimum -- the point of the 11-year solar cycle when activity is most reduced. The video clip, showing images taken in a wavelength of extreme ultraviolet light covers 33 hours and consists of over 500 frames (i.e., one frame selected every 4 minutes). Animations are available at https://photojournal.jpl.nasa.gov/catalog/PIA18139
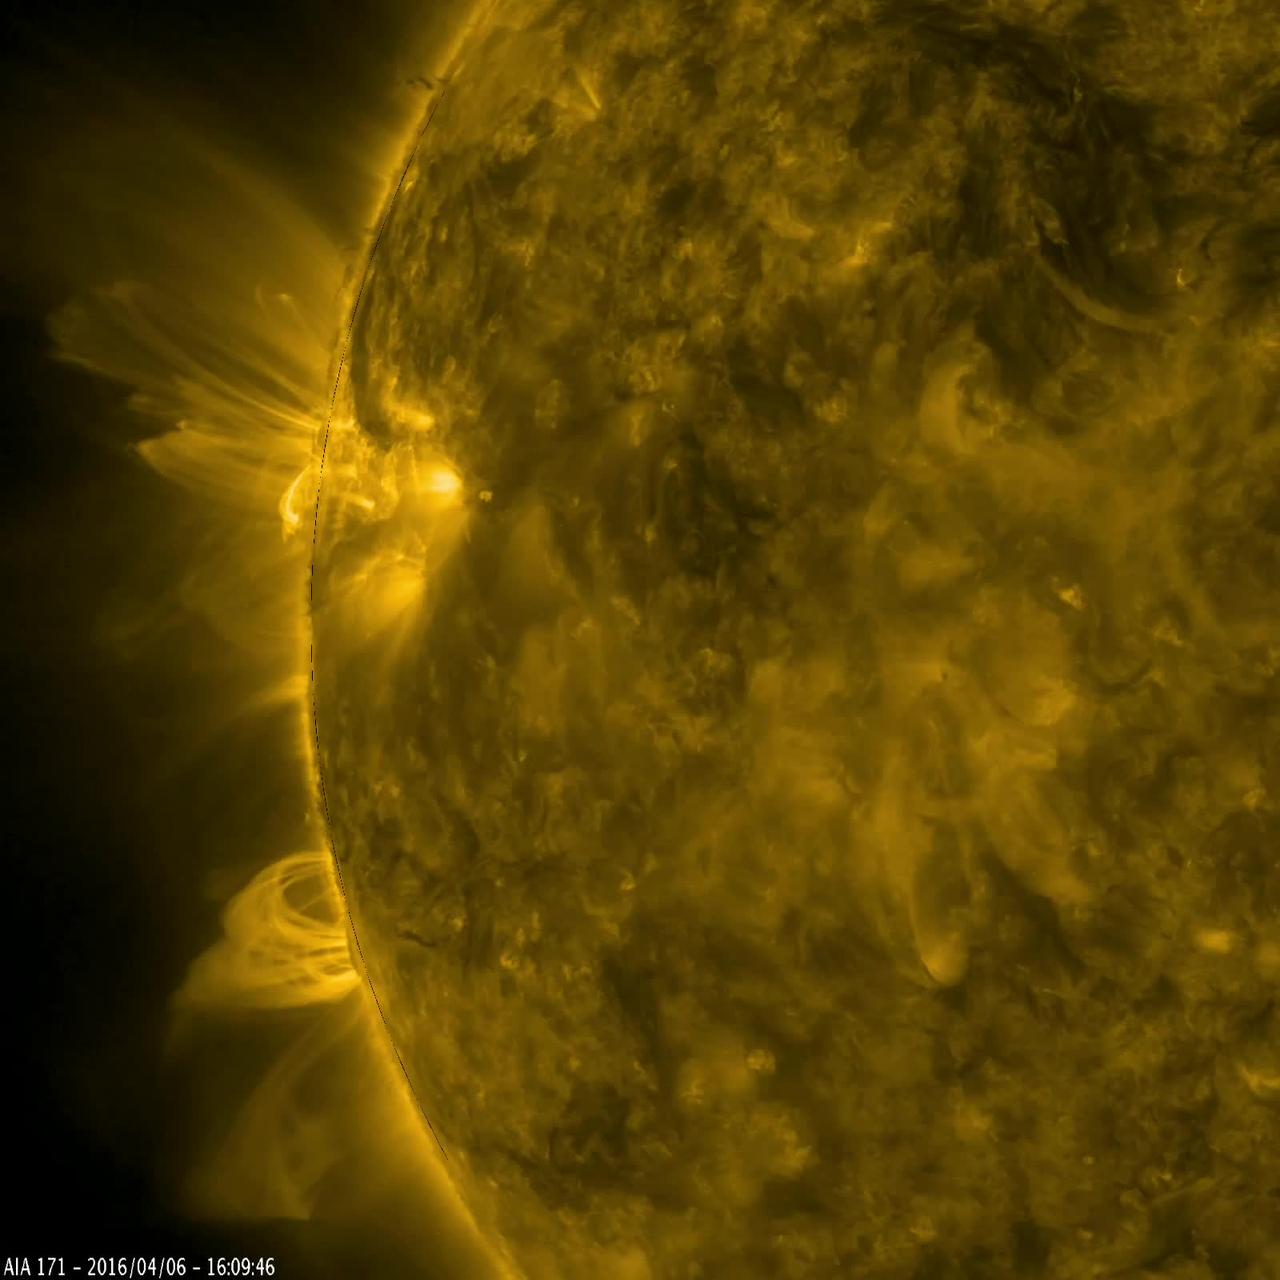
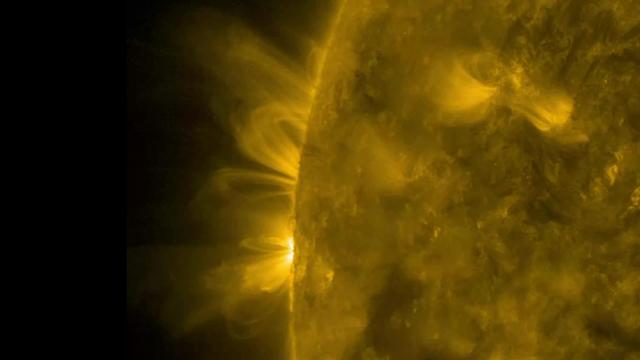
Arches of magnetic field lines towered over the sun’s edge as a pair of active regions began to rotate into view in this video captured by NASA’s Solar Dynamics Observatory on April 5-6, 2016. Active regions are areas of very concentrated magnetic field. Charged particles spiraling along these magnetic fields emit extreme ultraviolet light, which is typically not visible to our eyes, but colorized here in gold. The light given off from the particles helps trace out the magnetic field lines, which are otherwise invisible. Scientists use images such as this to observe how magnetic fields move around the sun and learn more about what causes active regions. Credit: NASA/Goddard/SDO <b><a href="http://www.nasa.gov/audience/formedia/features/MP_Photo_Guidelines.html" rel="nofollow">NASA image use policy.</a></b> <b><a href="http://www.nasa.gov/centers/goddard/home/index.html" rel="nofollow">NASA Goddard Space Flight Center</a></b> enables NASA’s mission through four scientific endeavors: Earth Science, Heliophysics, Solar System Exploration, and Astrophysics. Goddard plays a leading role in NASA’s accomplishments by contributing compelling scientific knowledge to advance the Agency’s mission. <b>Follow us on <a href="http://twitter.com/NASAGoddardPix" rel="nofollow">Twitter</a></b> <b>Like us on <a href="http://www.facebook.com/pages/Greenbelt-MD/NASA-Goddard/395013845897?ref=tsd" rel="nofollow">Facebook</a></b> <b>Find us on <a href="http://instagrid.me/nasagoddard/?vm=grid" rel="nofollow">Instagram</a></b>

Workers at Launch Complex 17 Pad A, Kennedy Space Center (KSC) encapsulate the Geomagnetic Tail (GEOTAIL) spacecraft (upper) and attached payload Assist Module-D upper stage (lower) in the protective payload fairing. GEOTAIL project was designed to study the effects of Earth's magnetic field. The solar wind draws the Earth's magnetic field into a long tail on the night side of the Earth and stores energy in the stretched field lines of the magnetotail. During active periods, the tail couples with the near-Earth magnetosphere, sometimes releasing energy stored in the tail and activating auroras in the polar ionosphere. GEOTAIL measures the flow of energy and its transformation in the magnetotail and will help clarify the mechanisms that control the imput, transport, storage, release, and conversion of mass, momentum, and energy in the magnetotail.
Magnetic arcs of solar material spewing from our favorite sphere of hot plasma, the sun. Magnetic arcs of solar material held their shapes fairly well as they spiraled above two solar active regions over 18 hours on Jan. 11-12, 2017. The charged solar material, called plasma, traces out the magnetic field lines above the active regions when viewed in wavelengths of extreme ultraviolet light, captured here by NASA’s Solar Dynamics Observatory. Extreme ultraviolet light is typically invisible to our eyes, but is colorized here in gold for easy viewing. Credit: NASA/SDO
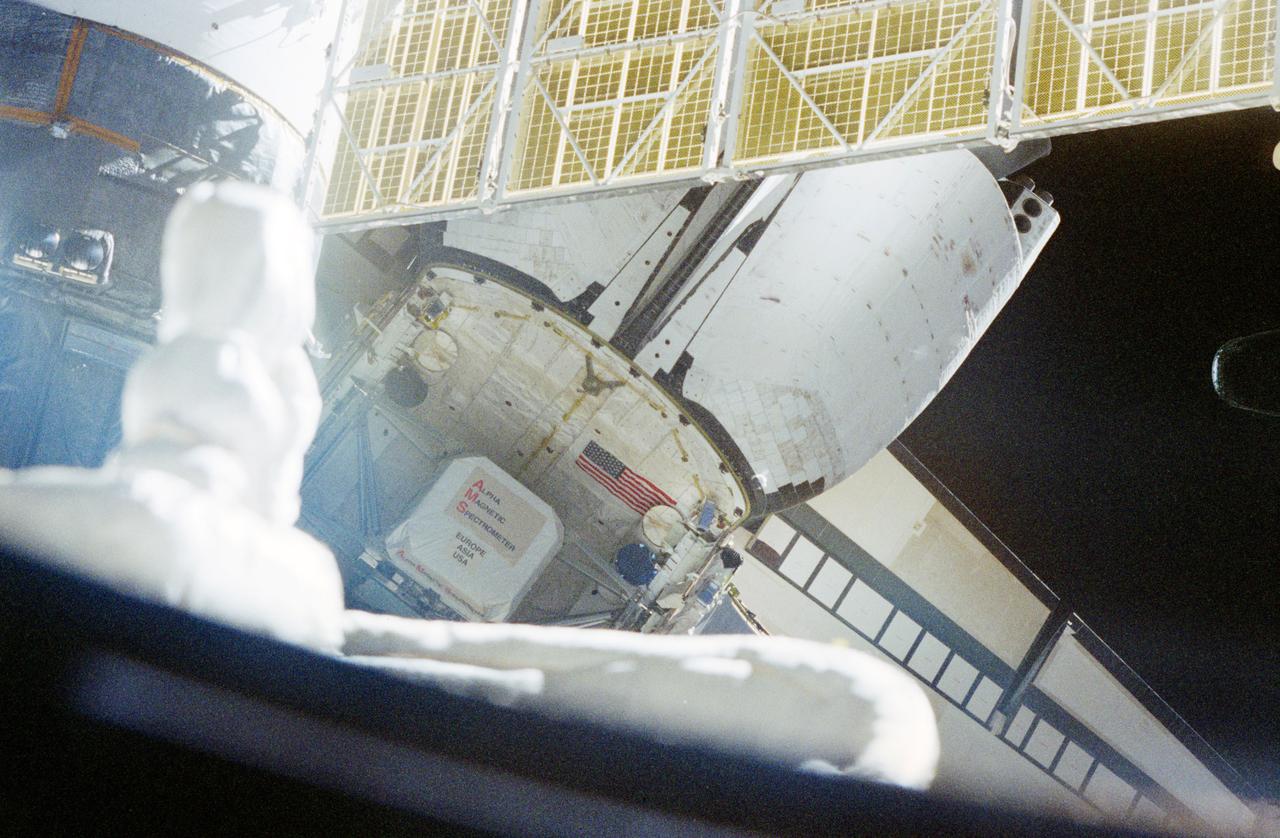
STS091-367-033 (2-12 June 1998) --- This photo of the Space Shuttle Discovery's aft section features the Alpha Magnetic Spectrometer (AMS), as seen from Russia's Mir space station, docked with Discovery at the time. AMS is the first large-magnet experiment ever placed in Earth orbit. The scientific goal of this high-energy physics experiment is to increase our understanding of the composition and origin of the universe. It is designed to search for and measure charged particles, including antimatter, outside Earth's atmosphere. The charge of such particles can be identified only by their trajectories in a magnetic field.

The sun shot out a small coronal mass ejection that was also associated with a small flare (Jan. 22, 2018). The video, which covers about 5 hours, shows the burst of plasma as the magnetic loops break apart. Immediately the magnetic fields brighten intensely and begin to reorganize themselves in coils above the active region. The images were taken in a wavelength of extreme ultraviolet light. Videos are available at https://photojournal.jpl.nasa.gov/catalog/PIA22184

A small prominence observed in profile arched up and sent streams of plasma curling back into the sun over a 30-hour period (Dec. 13-14, 2017). We are observing charged particles streaming along magnetic field lines made visible in extreme ultraviolet light. Prominences are cooler strands of plasma tethered above the sun's surface by magnetic forces. They are quite unstable and frequently fall apart within hours or days. Movies are available at https://photojournal.jpl.nasa.gov/catalog/PIA22196