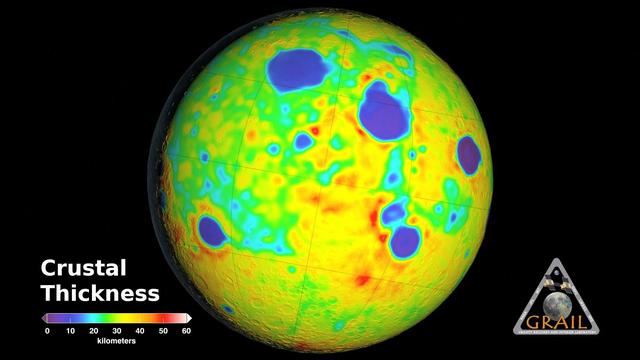
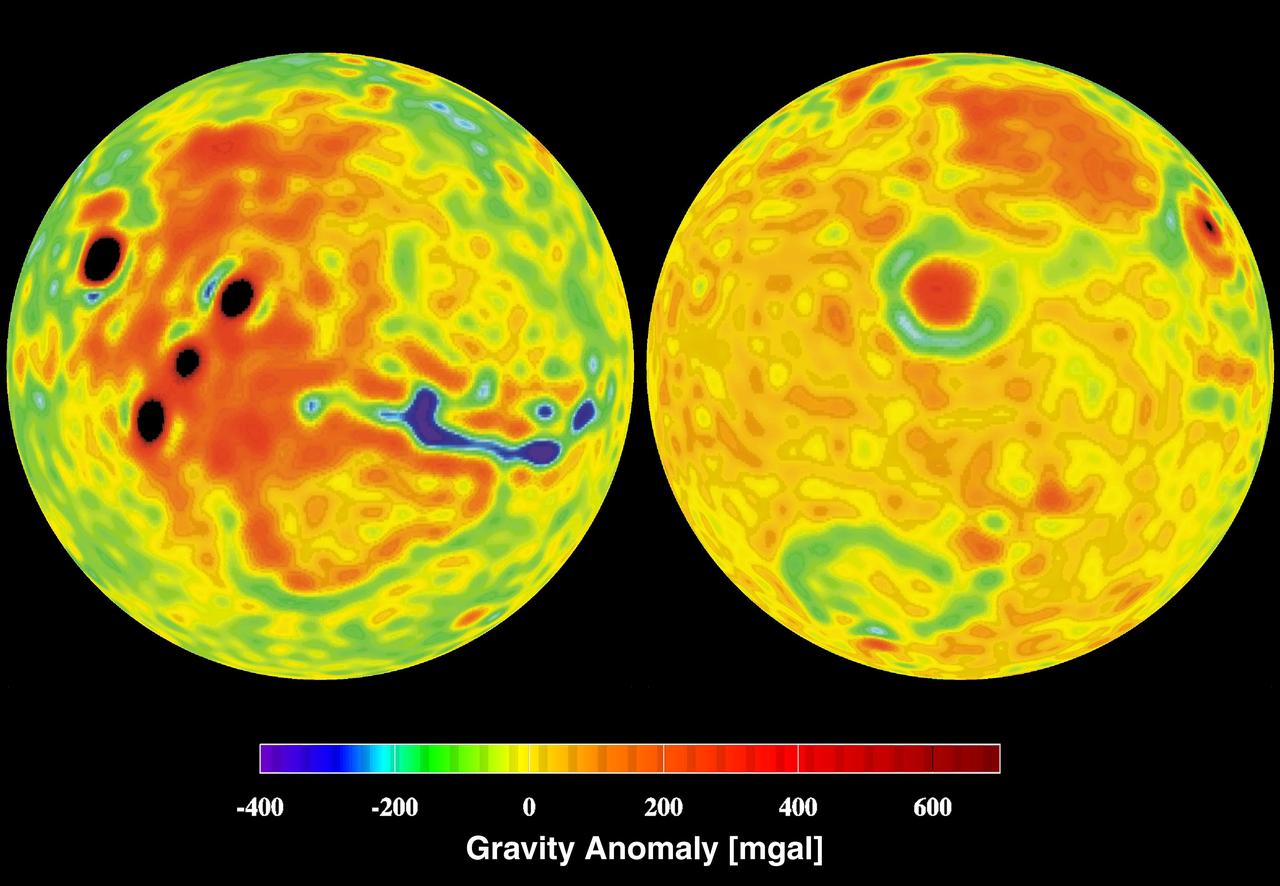
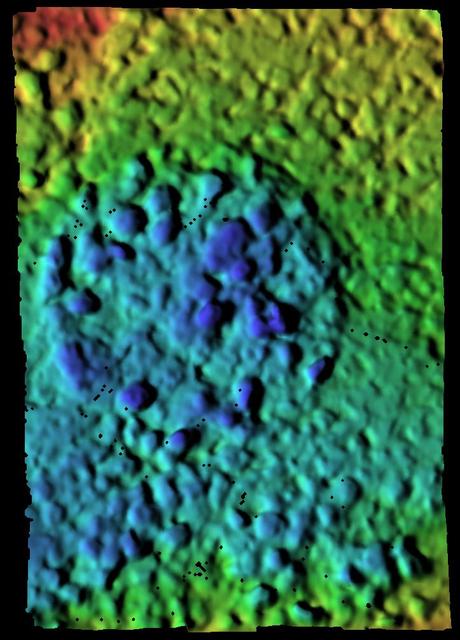
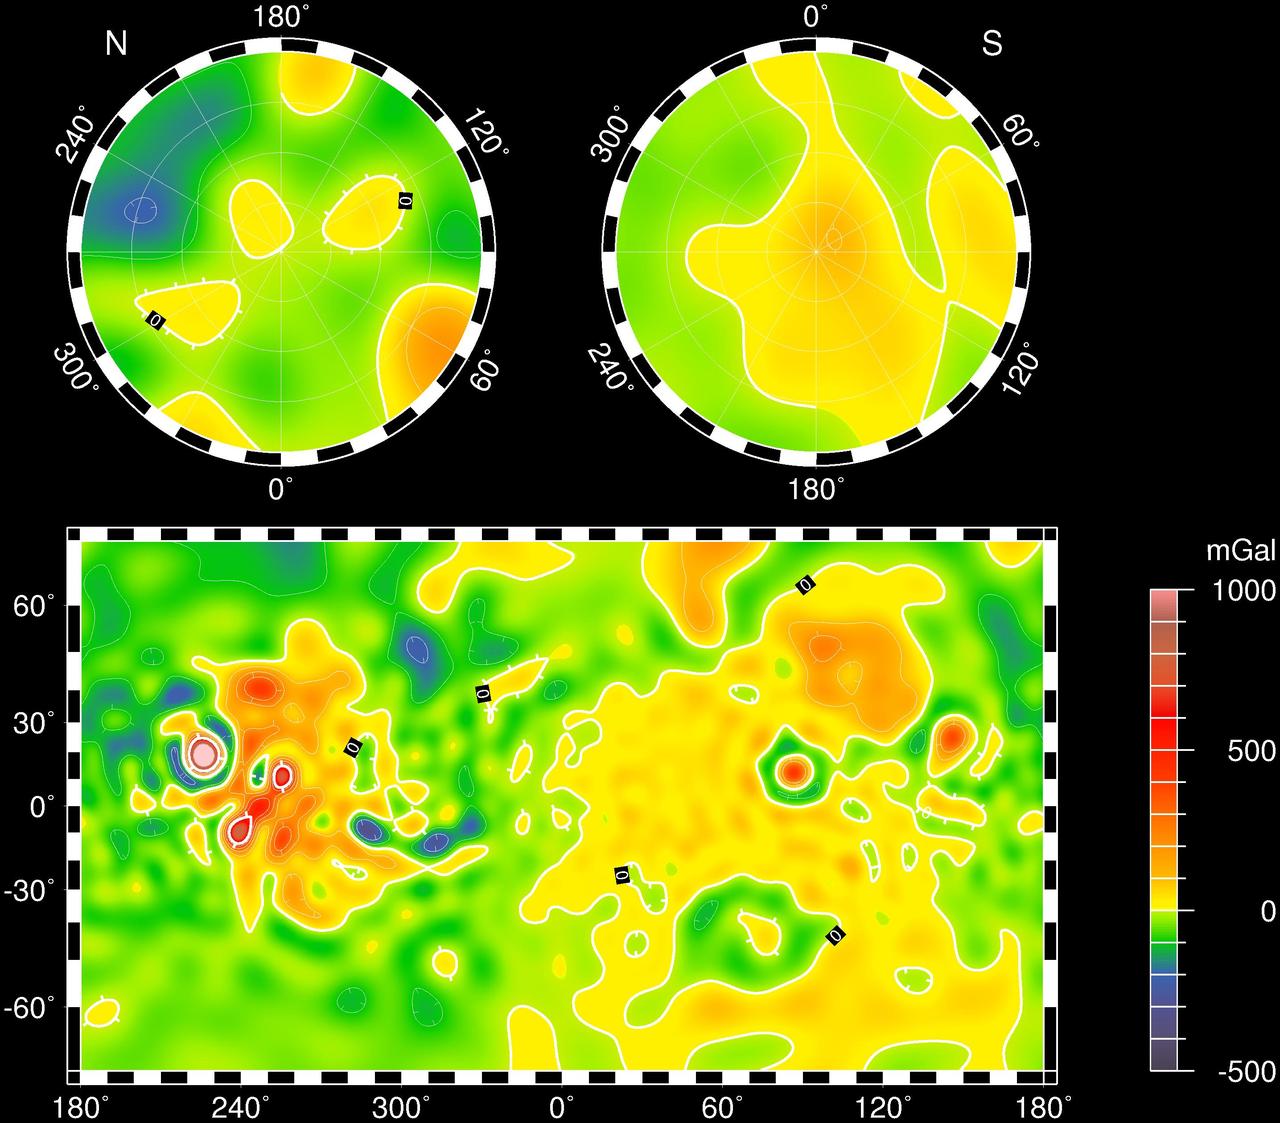
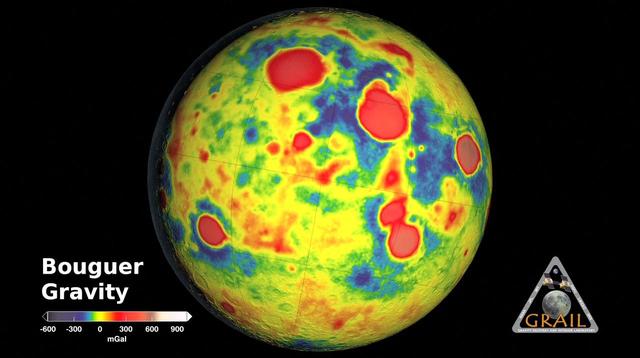
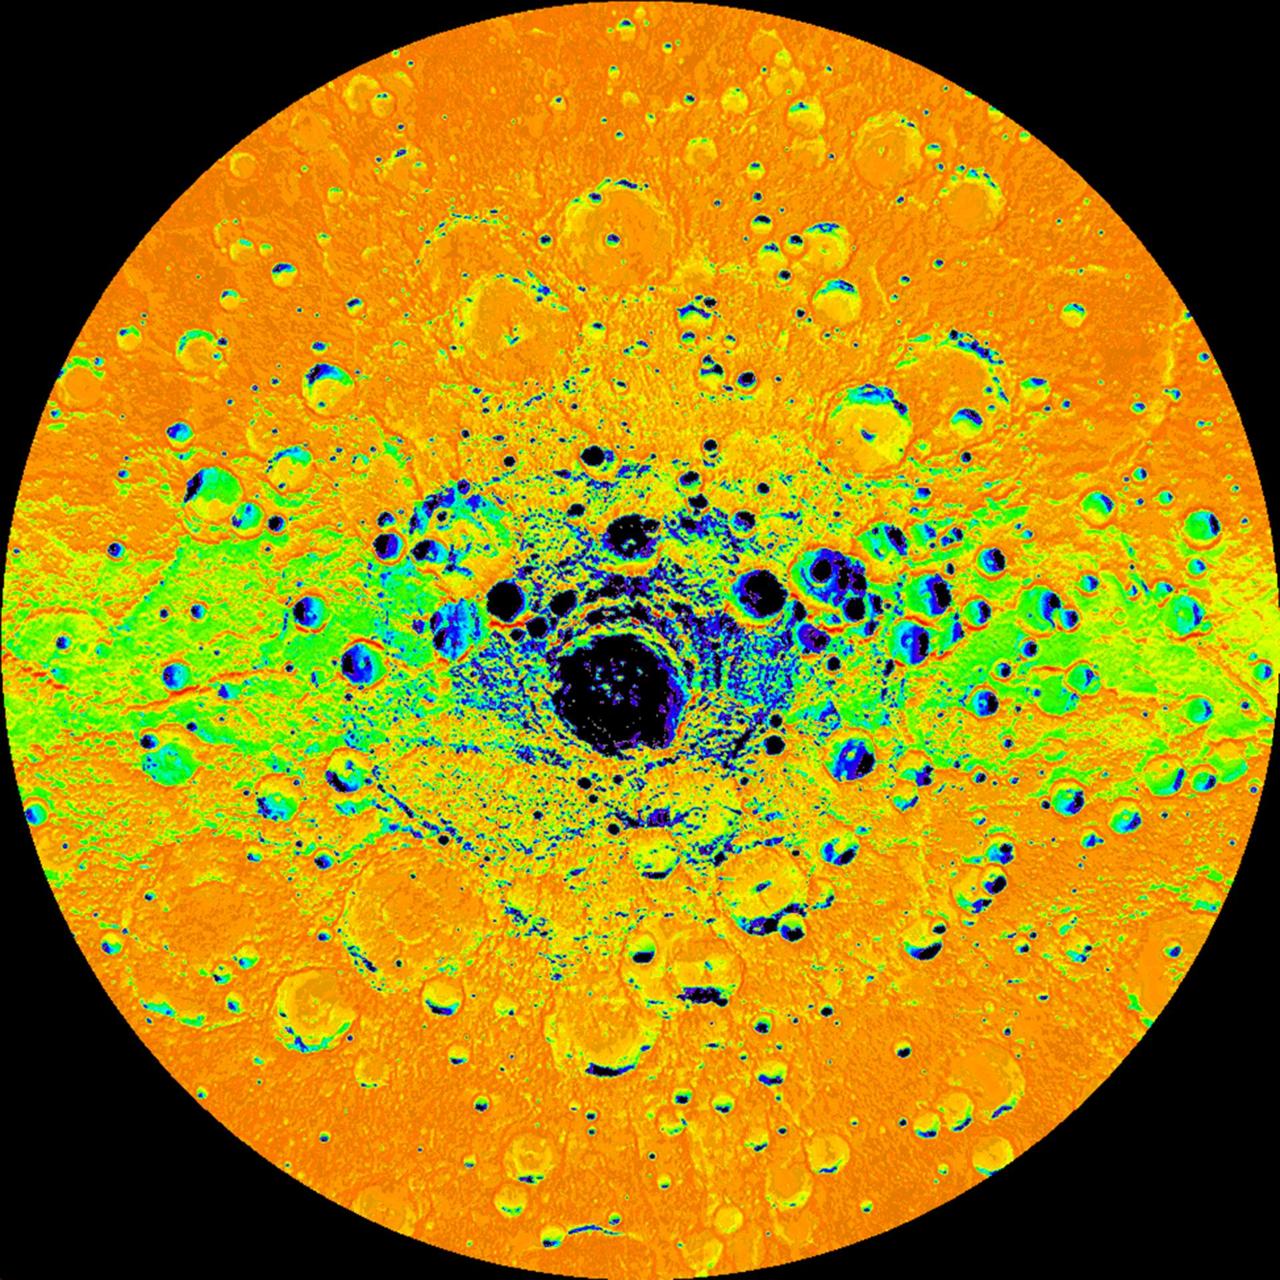
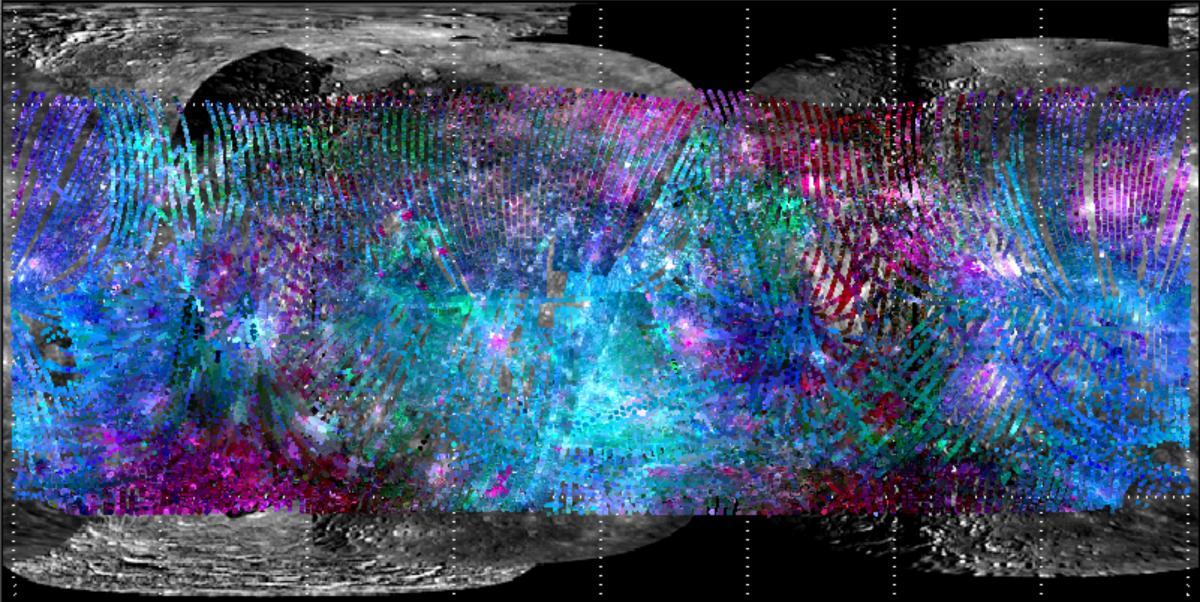
Mapping Beethoven
Mapping Beethoven
Titan Map
Titan Map
Map of Enceladus
Map of Enceladus
Mapping a Volcano
Mapping a Volcano
Map of Tethys
Map of Tethys
The Advanced Rapid Imaging and Analysis (ARIA) team at NASA's Jet Propulsion Laboratory created this Damage Proxy Map (DPM) of Tongatapu, the main island of Tonga, following the landfall of Cyclone Gita, a Category 4 storm that hit Tonga on Feb. 12-13, 2018. The map depicts areas that are likely damaged from the storm, shown by red and yellow pixels. The map was produced by comparing two pairs of interferometric synthetic aperture radar (InSAR) images from the COSMO-SkyMed satellites, operated by the Italian Space Agency (ASI). The pre- and post-cyclone images were acquired on Jan. 19 and Feb. 13, 2018, respectively. The later image was acquired just 4-1/2 hours after the peak damage by the cyclone.  The map covers the entire island of Tongatapu (the 25-by-25-mile, or 40-by-40 kilometer SAR image footprint indicated with the large red polygon). Each pixel measures about 98 feet (30 meters) across. The color variation from yellow to red indicates increasingly more significant ground surface change. Preliminary validation of the SAR data was done by comparing them with high-resolution optical imagery acquired by DigitalGlobe. This Damage Proxy Map should be used as guidance to identify damaged areas and may be less reliable over vegetated and flooded areas.  https://photojournal.jpl.nasa.gov/catalog/PIA22257
Tonga Cyclone Damage Mapped by NASA's ARIA Team
Mapping Mercury Surface in Color
Color Mapping the Southern Hemisphere
Map of Enceladus - February 2010
Martian City Map
Martian City Map
Hematite Map TES
Hematite Map TES
Global Map of Ganymede
Map of Tethys - February 2010
Mapping the Moon, Point by Point
Map of Phoenix Digging Area
Map of Rhea - February 2010
Enhanced Color Mercury Map
A Road map for Eros
A Road map for Eros
Mineral Mapping the Moon
Eros Map and Place Names
Enceladus Temperature Map
Map of Enceladus - December 2008
Map of Moessbauer Placement
Map of Tethys - February 2008
One Year of Spectral Mapping
Iapetus Temperature Map
Map of Moon Crust
Map of Moon Crust
Mapping Ions around Mercury
Mars Gravity Anomoly Map
Maps of Mars Global Topography
Map of Titan in Infrared
Map of Hills on the Horizon
Maps of Titan - January 2009
Mars Gravity Map RS
Mars Gravity Map RS
Welcome to Albedo Mapping!
A Global Map of Mercury Surface
Map of Dione - May 2008
Completing a Global Map of Ganymede
Map of Titan - October 2007
South Pole Illumination Map
Map of Mars Topography
Phoenix Workplace Map
Mapping Titan Surface
Spirit Traverse Map
Spirit Traverse Map
Iapetus Temperature Variation Map
Spectral Mapping of Landing Site
Geologic Map of Titan Volcano
MOLA TOPOGRAPHIC MAP
Endurance Road Map
Endurance Road Map
Jupiter Atmospheric Map
Map of Mimas - June 2008
Map of Dione - October 2010
Map of Iapetus - May 2008
Hematite Abundance Map at Echo
New Maps of Mercury!
Mapping Clumps in Saturn Rings
Map of Iapetus - January 2008
This  still image features a free-air gravity map of the Moon's southern latitudes developed by S. Goossens et al. from data returned by the Gravity Recovery and Interior Laboratory (GRAIL) mission.  If the Moon were a perfectly smooth sphere of uniform density, the gravity map would be a single, featureless color, indicating that the force of gravity at a given elevation was the same everywhere. But like other rocky bodies in the solar system, including Earth, the Moon has both a bumpy surface and a lumpy interior. Spacecraft in orbit around the Moon experience slight variations in gravity caused by both of these irregularities.  The free-air gravity map shows deviations from the mean gravity that a cueball Moon would have. The deviations are measured in milliGals, a unit of acceleration. On the map, purple is at the low end of the range, at around -400 mGals, and red is at the high end near +400 mGals. Yellow denotes the mean.  The map shown here extends from the south pole of the Moon up to 50°S and reveals the gravity for that region in even finer detail than the global gravity maps published previously. The image illustrates the very good correlation between the gravity map and topographic features such as peaks and craters, as well as the mass concentration lying beneath the large Schrödinger basin in the center of the frame. The terrain in the image is based on Lunar Reconnaissance Orbiter (LRO) altimeter and camera data.  Credit: NASA's Scientific Visualization Studio  <b><a href="http://www.nasa.gov/audience/formedia/features/MP_Photo_Guidelines.html" rel="nofollow">NASA image use policy.</a></b>  <b><a href="http://www.nasa.gov/centers/goddard/home/index.html" rel="nofollow">NASA Goddard Space Flight Center</a></b> enables NASA’s mission through four scientific endeavors: Earth Science, Heliophysics, Solar System Exploration, and Astrophysics. Goddard plays a leading role in NASA’s accomplishments by contributing compelling scientific knowledge to advance the Agency’s mission.  <b>Follow us on <a href="http://twitter.com/NASAGoddardPix" rel="nofollow">Twitter</a></b>  <b>Like us on <a href="http://www.facebook.com/pages/Greenbelt-MD/NASA-Goddard/395013845897?ref=tsd" rel="nofollow">Facebook</a></b>  <b>Find us on <a href="http://instagram.com/nasagoddard?vm=grid" rel="nofollow">Instagram</a></b>
Free-Air Gravity Map of the Moon
This map is a mosaic of images obtained by NASA Dawn framing camera during the high-altitude mapping orbit phase. This map shows the distribution of dark materials on the surface of asteroid Vesta.
Map of Dark Materials on Vesta
Infrared Map of Titan Active Regions
Opportunity Sol 1742 Traverse Map
Enceladus Polar Maps - February 2010
GRAIL Bouguer Gravity Moon Map
Illumination Map of Mercury South Pole
Mapping Titan Global Wind Patterns
Enceladus Polar Maps - February 2010
MOLA Global Roughness Map of Mars
Spirit Traverse Map, Sol 680
Temperature Map of Io Night Side
Topographic Map of Pathfinder Landing Site
Columbia Hills Color Elevation Map
Opportunity Traverse Map, Eagle to Victoria
Opportunity Traverse Map, Sol 656
Rhea Polar Maps - February 2010
Tethys Polar Maps - February 2010
Mapping Spectral Variations on Mercury with MASCS
A Compositional Map of the Tyre Region of Europa
A Moving Jupiter Global Map Animation
Stripes and Heat Map Side-by-Side
Rhea Polar Maps - February 2010
Opportunity Traverse Map, Sol 383
This colorful view of Mercury was produced by using images from the color base map imaging campaign during MESSENGER's primary mission. These colors are not what Mercury would look like to the human eye, but rather the colors enhance the chemical, mineralogical, and physical differences between the rocks that make up Mercury's surface. This specific color combination places the second principle component in the red channel, the first principle component in the green channel, and the ratio of the 430 nm/1000 nm filters in the blue channel.  The MESSENGER spacecraft is the first ever to orbit the planet Mercury, and the spacecraft's seven scientific instruments and radio science investigation are unraveling the history and evolution of the Solar System's innermost planet. During the first two years of orbital operations, MESSENGER acquired over 150,000 images and extensive other data sets. MESSENGER is capable of continuing orbital operations until early 2015.  Credit: NASA/Johns Hopkins University Applied Physics Laboratory/Carnegie Institution of Washington  <b><a href="http://www.nasa.gov/audience/formedia/features/MP_Photo_Guidelines.html" rel="nofollow">NASA image use policy.</a></b>  <b><a href="http://www.nasa.gov/centers/goddard/home/index.html" rel="nofollow">NASA Goddard Space Flight Center</a></b> enables NASA’s mission through four scientific endeavors: Earth Science, Heliophysics, Solar System Exploration, and Astrophysics. Goddard plays a leading role in NASA’s accomplishments by contributing compelling scientific knowledge to advance the Agency’s mission.  <b>Follow us on <a href="http://twitter.com/NASA_GoddardPix" rel="nofollow">Twitter</a></b>  <b>Like us on <a href="http://www.facebook.com/pages/Greenbelt-MD/NASA-Goddard/395013845897?ref=tsd" rel="nofollow">Facebook</a></b>  <b>Find us on <a href="http://instagram.com/nasagoddard?vm=grid" rel="nofollow">Instagram</a></b>
Enhanced Color Mercury Map
This image of the northwestern portion of Mars' Gale Crater and terrain north of it, from the European Space Agency's Mars Express orbiter, provides a locator map for some features visible in an October 2017 panorama from NASA's Curiosity Mars rover (see PIA22210, Fig. 1).  A blue star marks the rover's landing site, on the floor of Gale Crater near the base of Mount Sharp. That layered mountain occupies the middle of the crater. The black line indicates the path of the rover's traverse from its August 2012 landing to about the location on lower Mount Sharp, where the panorama was acquired.  North is toward the top. At lower right is a 20-kilometer (12.4-mile) scale bar. The base-map image was taken by the High Resolution Stereo Camera on Mars Express.  https://photojournal.jpl.nasa.gov/catalog/PIA22208
Locator Map for Features in Curiosity Panorama
This global infrared map of Titan was composed with data from Cassini  visual and infrared mapping spectrometer taken during the last two Titan  flybys
An Infrared Map of Titan
A map of the Moon on a black background for October 12, 2013 at 12:00 UT. Labeled features include maria, craters, a mountain range, a scarp, a rille, and four Apollo landing sites.  Credit: NASA's Goddard Space Flight Center Scientific Visualization Studio  <b><a href="http://www.nasa.gov/audience/formedia/features/MP_Photo_Guidelines.html" rel="nofollow">NASA image use policy.</a></b>  <b><a href="http://www.nasa.gov/centers/goddard/home/index.html" rel="nofollow">NASA Goddard Space Flight Center</a></b> enables NASA’s mission through four scientific endeavors: Earth Science, Heliophysics, Solar System Exploration, and Astrophysics. Goddard plays a leading role in NASA’s accomplishments by contributing compelling scientific knowledge to advance the Agency’s mission.  <b>Follow us on <a href="http://twitter.com/NASA_GoddardPix" rel="nofollow">Twitter</a></b>  <b>Like us on <a href="http://www.facebook.com/pages/Greenbelt-MD/NASA-Goddard/395013845897?ref=tsd" rel="nofollow">Facebook</a></b>  <b>Find us on <a href="http://instagram.com/nasagoddard?vm=grid" rel="nofollow">Instagram</a></b>
Moon Map
The science team of NASA's New Horizons mission has produced an updated global map of the dwarf planet Pluto. The map includes all resolved images of the surface acquired between July 7-14, 2015, at pixel resolutions ranging from 40 kilometers (24 miles) on the Charon-facing hemisphere (left and right sides of the map) to 400 meters (1,250 feet) on the anti-Charon facing hemisphere (map center). Many additional images are expected in fall of 2015 and these will be used to complete the global map.  http://photojournal.jpl.nasa.gov/catalog/PIA19858
Global Map of Pluto
STS059-16-032 (9-20 April 1994) --- Astronaut Kevin P. Chilton, pilot, displays a map of Scandinavia on the Space Shuttle Endeavour's flight deck.  Large scale maps such as this were used by the crew to locate specific sites of interest to the Space Radar Laboratory scientists.  The crew then photographed the sites at the same time as the radar in the payload bay imaged them.  Chilton was joined in space by five other NASA astronauts for a week and a half of support to the Space Radar Laboratory (SRL-1) mission and other tasks.
Astronaut Kevin Chilton displays map of Scandinavia on flight deck
Scientists produced new global maps of Jupiter using the Wide Field Camera 3 on NASA Hubble Space Telescope. One color map is shown here, projected onto a globe and as a flat image.
Spinning Jupiter and Global Map
This global digital map of Saturn moon Iapetus was created using data  taken during Cassini and Voyager spacecraft flybys. The map is an  equidistant projection and has a scale of 641 meters 2,103 feet per  pixel
Map of Iapetus -- December 2005
This is a map of lower Mount Sharp on Mars, showing the major geologic units identified from orbit. The rocks of the Murray Formation, mapped in green, likely represent the oldest layers of Mount Sharp that NASA Curiosity rover will explore.
Map of Lower Mount Sharp
This global digital map of Saturn moon Enceladus was created using data  taken during Cassini and Voyager spacecraft flybys. The map is an  equidistant projection and has a scale of 110 meters 361 feet per pixel
Map of Enceladus -- December 2005
This global map of Mars was acquired on Oct. 28, 2008, by the Mars Color Imager instrument on NASA MRO. One global map is generated each day to forecast weather conditions for the entry, descent and landing of NASA Curiosity rover.
Mars Weather Map, 2008
This image shows an updated map of Saturn icy moon Enceladus, generated by NASA Cassini imaging team. The map incorporates new images taken in 2008, with better image processing techniques.
Map of Enceladus October 2009
This global digital map of Saturn moon Mimas was created using data  taken during Cassini and Voyager spacecraft flybys. The map is an  equidistant projection and has a scale of 434 meters 1,424 feet per  pixel
Map of Mimas -- December 2005
The northern and southern hemispheres of Dione are seen in these polar stereographic maps, mosaicked from images from NASA Cassini mission. Each map is centered on one of the poles and surface coverage extends to the equator.
Map of Dione - December 2011
This global digital map of Saturn moon Tethys was created using data  taken during Cassini and Voyager spacecraft flybys. The map is an  equidistant projection and has a scale of 293 meters 961 feet per pixel
Map of Tethys -- December 2005
This mosaic shows an updated global map of Saturn icy moon Enceladus, created using images taken during flybys of NASA Cassini spacecraft. The map incorporates new images taken during flybys in December 2011.
Map of Enceladus - December 2011
This global digital map of Saturn moon Dione was created using data  taken during Cassini and Voyager spacecraft flybys. The map is an  equidistant projection and has a scale of 977 meters 3,205 feet per  pixel
Map of Dione -- December 2005
The map is a Mercator projection and has a resolution of 460 feet 140 meters per pixel. The images used to make this map were taken from Dawn high-altitude mapping orbit HAMO, at a distance of 915 miles 1,470 kilometers from Ceres.
Colorized Map of Ceres Mercator Projection