
Portrait, Brian Gore in MIDAS Lab using Task Load Index (TLX). taken for podcast

Portrait, Brian Gore in MIDAS Lab using Task Load Index (TLX). taken for podcast
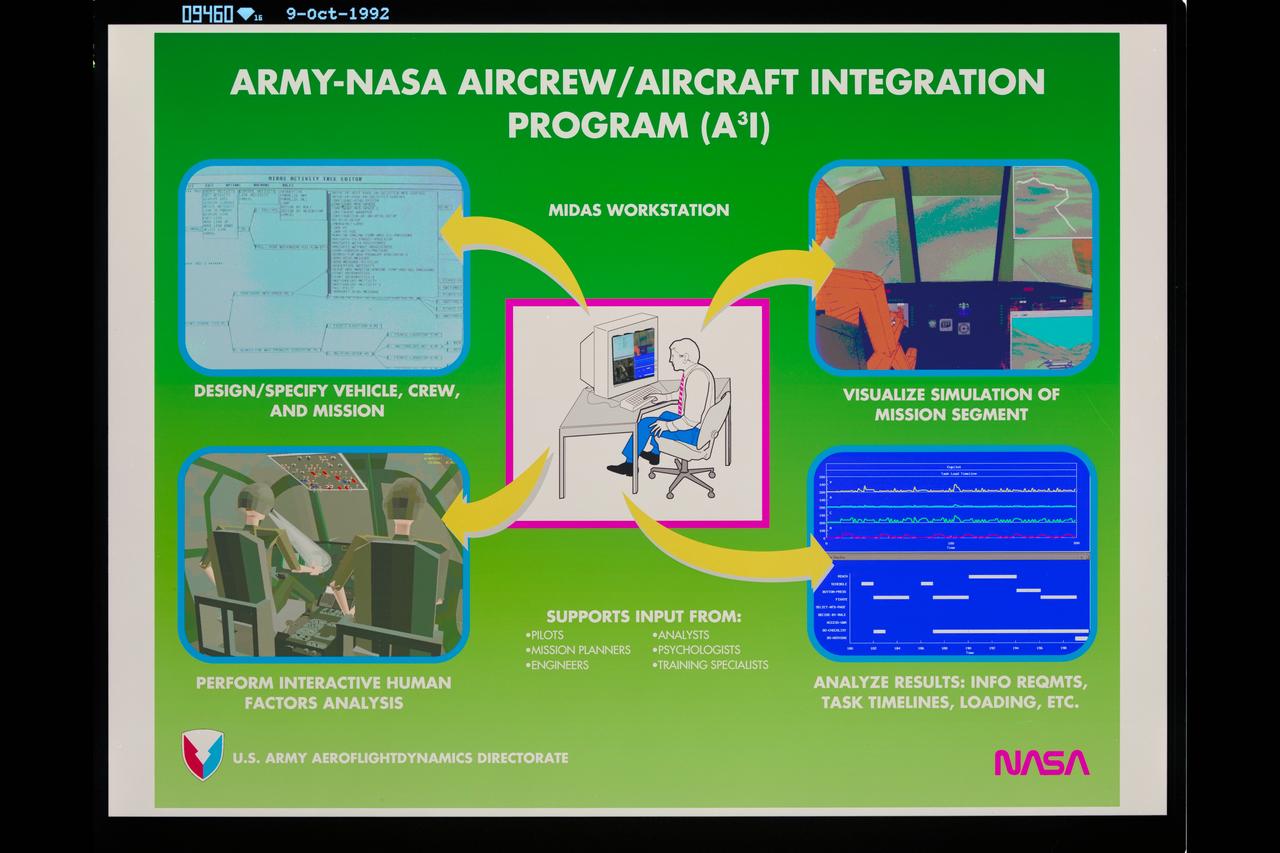
NASA Army Aircrew Aircraft Integration (A3I) Program Composite with Midas Workstation
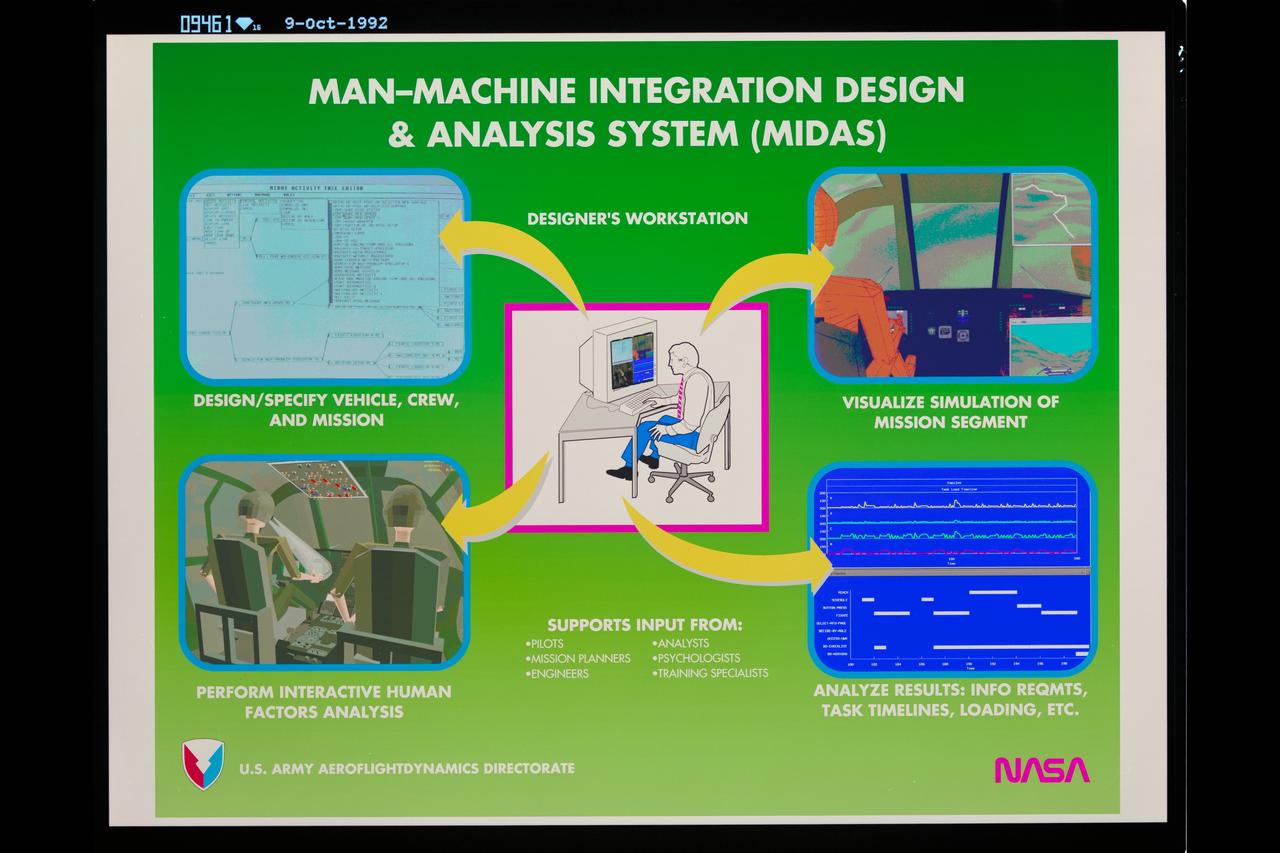
Composite Art NASA Army Aircrew Aircraft Integration (A3I) Program Composite with Midas Workstation
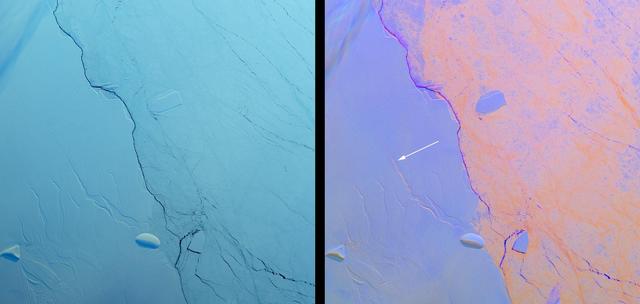
Project MIDAS, a United Kingdom-based group that studies the Larsen Ice Shelf in Antarctica, reported Aug. 18, 2016, that a large crack in the Larsen C shelf has grown by another 13 miles (22 kilometers) in the past six months. The crack is now more than 80 miles (130 kilometers) long. Larsen C is the fourth largest ice shelf in Antarctica, with an area of about 19,300 square miles (50,000 square kilometers), greater than the size of Maryland. Computer modeling by Project MIDAS predicts that the crack will continue to grow and eventually cause between nine and twelve percent of the ice shelf to collapse, resulting in the loss of 2,300 square miles (6,000 square kilometers) of ice -- more than the area of Delaware. This follows the collapse of the Larsen B shelf in 2002 and the Larsen A shelf in 1995, which removed about 1,255 square miles (3,250 square kilometers) and 580 square miles (1,500 square kilometers) of ice, respectively. The Multiangle Imaging SpectroRadiometer (MISR) instrument aboard NASA's Terra satellite flew over Larsen C on Aug. 22, 2016. The MISR instrument views Earth with nine cameras pointed at different angles, which provides information about the texture of the surface. On the left is a natural-color image of the shelf from MISR's vertical-viewing camera. Antarctica is slowly emerging from its polar night, and the low light gives the scene a bluish tint. The Larsen C shelf is on the left, while thinner sea ice is present on the right. A variety of cracks are visible in the Larsen C shelf, all appearing roughly the same. The image is about 130 by 135 miles (210 by 220 kilometers) in size. On the right is a composite image made by combining data from MISR's 46-degree backward-pointing camera (plotted as blue), the vertical-pointing camera (plotted as green), and the 46-degree forward-pointing camera (plotted as red). This has the effect of highlighting surface roughness; smooth surfaces appear as blue-purple, while rough surfaces appear as orange. Clouds near the upper left appear multi-hued because their elevation above the surface causes the different angular views to be slightly displaced. In this composite, the difference between the rough sea ice and the smoother ice shelf is immediately apparent. An examination of the cracks in the ice shelf shows that the large crack Project MIDAS is tracking (indicated by an arrow) is orange in color, demonstrating that it is actively growing. These data were acquired during Terra orbit 88717 http://photojournal.jpl.nasa.gov/catalog/PIA20894
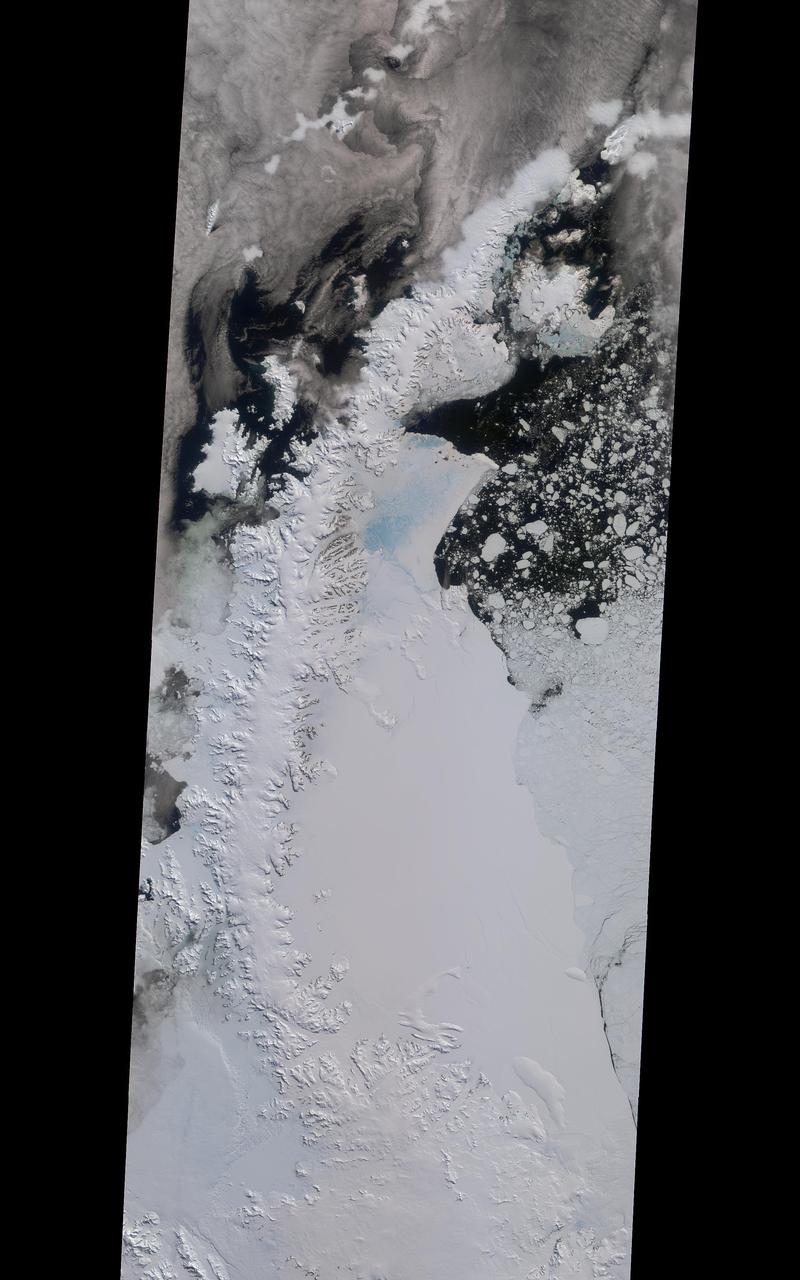
A rift in Antarctica's Larsen C ice shelf has grown to 110 miles (175 km) long, making it inevitable that an iceberg larger than Rhode Island will soon calve from the ice shelf. Larsen C is the fourth largest ice shelf in Antarctica, with an area of almost 20,000 square miles (50,000 square kilometers). The calving event will remove approximately 10 percent of the ice shelf's mass, according to the Project for Impact of Melt on Ice Shelf Dynamics and Stability (MIDAS), a UK-based team studying the ice shelf. Only 12 miles (20 km) of ice now separates the end of the rift from the ocean. The rift has grown at least 30 miles (50 km) in length since August, but appears to be slowing recently as Antarctica returns to polar winter. Project MIDAS reports that the calving event might destabilize the ice shelf, which could result in a collapse similar to what occurred to the Larsen B ice shelf in 2002. The Multi-angle Imaging SpectroRadiometer (MISR) instrument aboard NASA's Terra satellite captured views of Larsen C on August 22, 2016, when the rift was 80 miles (130 km) in length; December 8, 2016, when the rift was approximately 90 miles (145 km) long; and April 6, 2017. The MISR instrument has nine cameras, which view the Earth at different angles. The overview image, from December 8, shows the entire Antarctic Peninsula -- home to Larsen A, B, and C ice shelves -- in natural color (similar to how it would appear to the human eye) from MISR's vertical-viewing camera. Combining information from several MISR cameras pointed at different angles gives information about the texture of the ice. The accompanying GIF depicts the inset area shown on the larger image and displays data from all three dates in false color. These multiangular views -- composited from MISR's 46-degree backward-pointing camera, the nadir (vertical-viewing) camera, and the 46-degree forward-pointing camera -- represent variations in ice texture as changes in color, such that areas of rough ice appear orange and smooth ice appears blue. The Larsen C shelf is on the left in the GIF, bordered by the Weddell Sea on the upper right. The ice within the rift is orange, indicating movement, and the end of the rift can be tracked across the shelf between images. In addition, between December and April, the rift widened, pushing the future iceberg away from the shelf at its southern end. These data were acquired during Terra orbits 88717, 90290 and 92023. https://photojournal.jpl.nasa.gov/catalog/PIA21581