
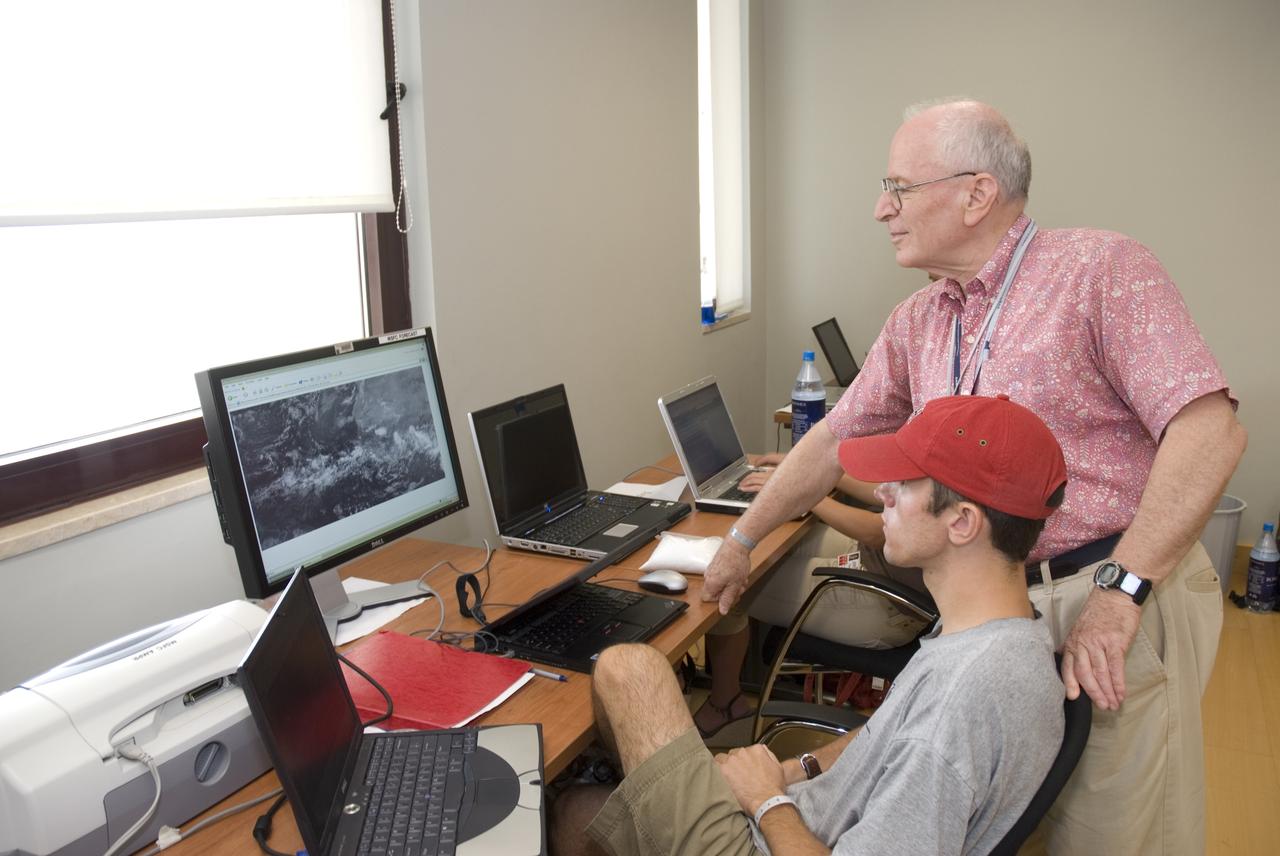
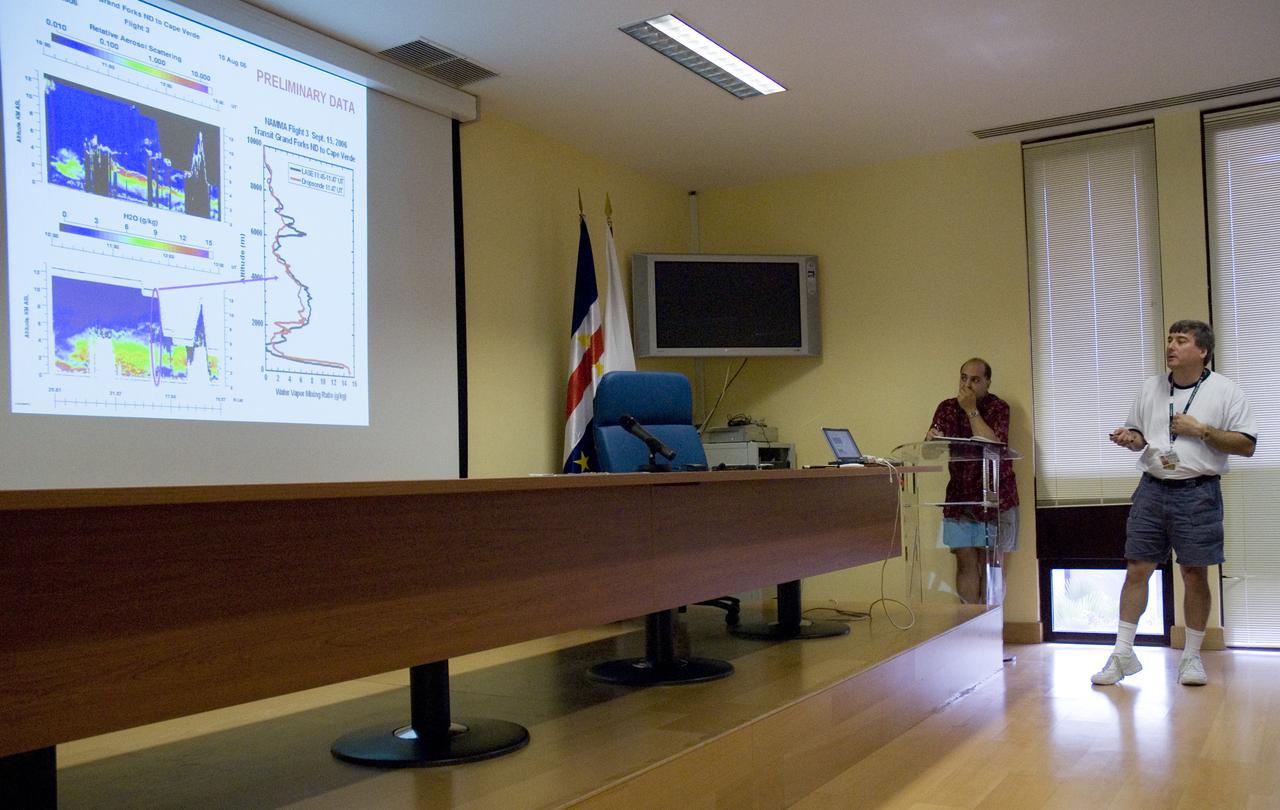
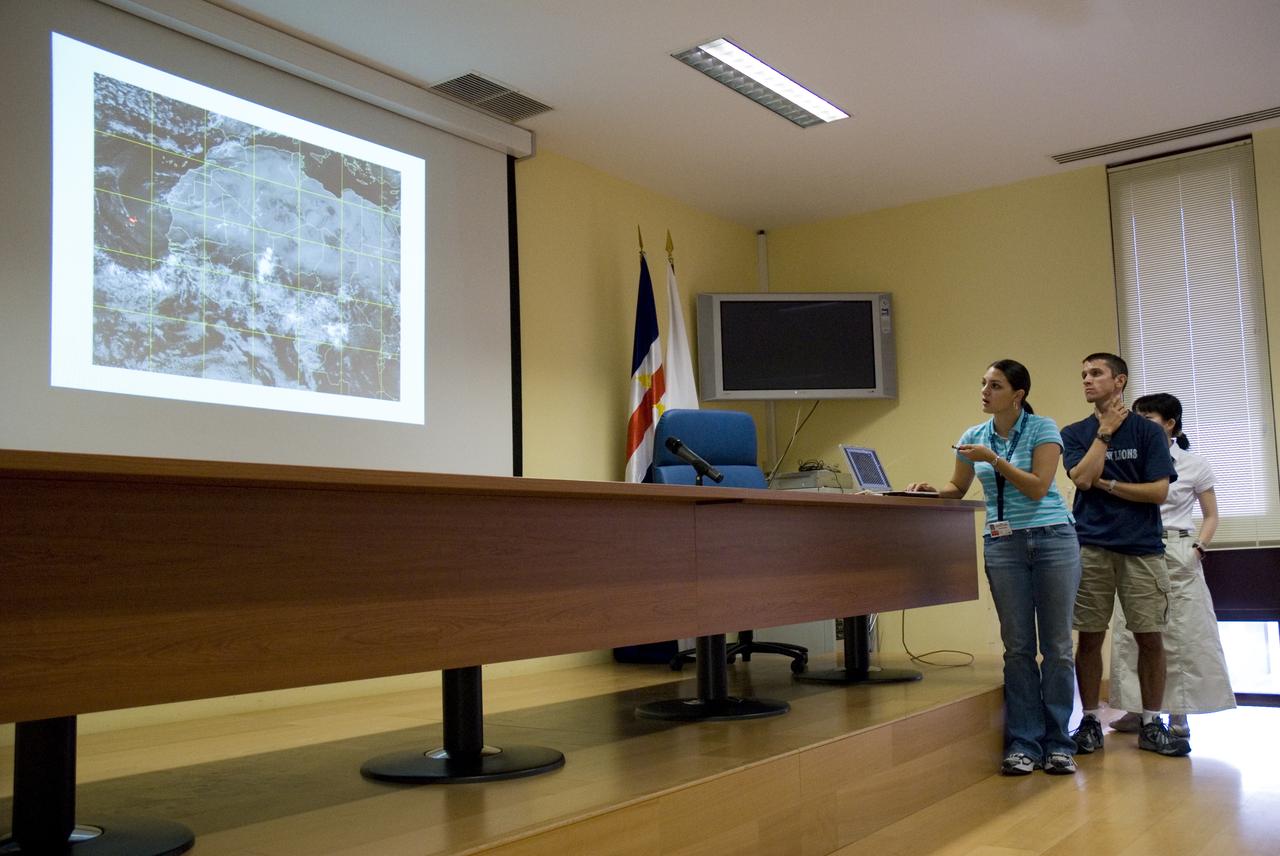
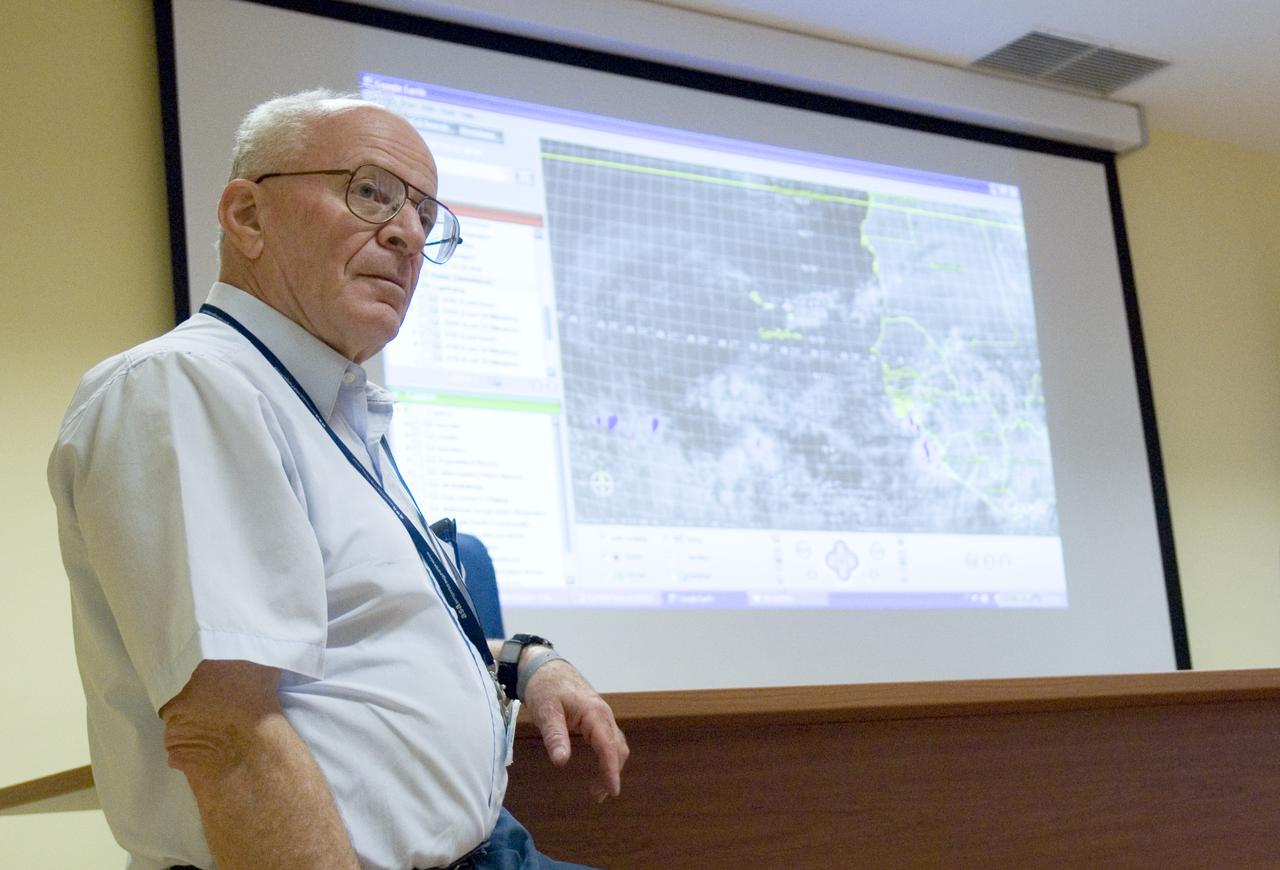
NASA Monsoon Multidisciplinary analysis (NAMMA) deployment, Sal Island, Cape Verde Africia

NASA Monsoon Multidisciplinary analysis (NAMMA) deployment, Sal Island, Cape Verde Africia

NASA Monsoon Multidisciplinary analysis (NAMMA) deployment, Sal Island, Cape Verde Africia

NASA Monsoon Multidisciplinary analysis (NAMMA) deployment, Sal Island, Cape Verde Africia

NASA Monsoon Multidisciplinary analysis (NAMMA) deployment, Sal Island, Cape Verde Africia

NASA Monsoon Multidisciplinary analysis (NAMMA) deployment, Sal Island, Cape Verde Africia

NASA Monsoon Multidisciplinary analysis (NAMMA) deployment, Sal Island, Cape Verde Africia

NASA Monsoon Multidisciplinary analysis (NAMMA) deployment, Sal Island, Cape Verde Africia

NASA Monsoon Multidisciplinary analysis (NAMMA) deployment, Sal Island, Cape Verde Africia

NASA Monsoon Multidisciplinary analysis (NAMMA) deployment, Sal Island, Cape Verde Africia

NASA Monsoon Multidisciplinary analysis (NAMMA) deployment, Sal Island, Cape Verde Africia

NASA Monsoon Multidisciplinary analysis (NAMMA) deployment, Sal Island, Cape Verde Africia

NASA Monsoon Multidisciplinary analysis (NAMMA) deployment, Sal Island, Cape Verde Africia

NASA Monsoon Multidisciplinary analysis (NAMMA) deployment, Sal Island, Cape Verde Africia

NASA Monsoon Multidisciplinary analysis (NAMMA) deployment, Sal Island, Cape Verde Africia

NASA Monsoon Multidisciplinary analysis (NAMMA) deployment, Sal Island, Cape Verde Africia

NASA Monsoon Multidisciplinary analysis (NAMMA) deployment, Sal Island, Cape Verde Africia
NASA Monsoon Multidisciplinary analysis (NAMMA) deployment, Sal Island, Cape Verde Africia

NASA Monsoon Multidisciplinary analysis (NAMMA) deployment, Sal Island, Cape Verde Africia

NASA Monsoon Multidisciplinary analysis (NAMMA) deployment, Sal Island, Cape Verde Africia

NASA Monsoon Multidisciplinary analysis (NAMMA) deployment, Sal Island, Cape Verde Africia

NASA Monsoon Multidisciplinary analysis (NAMMA) deployment, Sal Island, Cape Verde Africia

NASA Monsoon Multidisciplinary analysis (NAMMA) deployment, Sal Island, Cape Verde Africia

NASA Monsoon Multidisciplinary analysis (NAMMA) deployment, Sal Island, Cape Verde Africia

NASA Monsoon Multidisciplinary analysis (NAMMA) deployment, Sal Island, Cape Verde Africia

STS052-152-047 (22 Oct- 1 Nov 1992) --- The Kalahari Desert had not seen any significant rainfall for months before the launch of STS-52. Here, Shuttle astronauts have captured the onset of the (Southern Hemisphere) summer monsoon over the Kalahari Desert, as illustrated by the large thunderstorm towers poking up through the sun's terminator. The summer monsoon, with its associated thunderstorms, generally lasts from November through March. Scientist observers of this area report that the summer monsoon contributes most of the annual rainfall to this environmentally sensitive area. Shuttle nadir position: 28.0 degrees south, 25.1 degrees east. The center of the scene is 22.0 degrees south, 25.0 degrees east, 16:20:04 GMT.

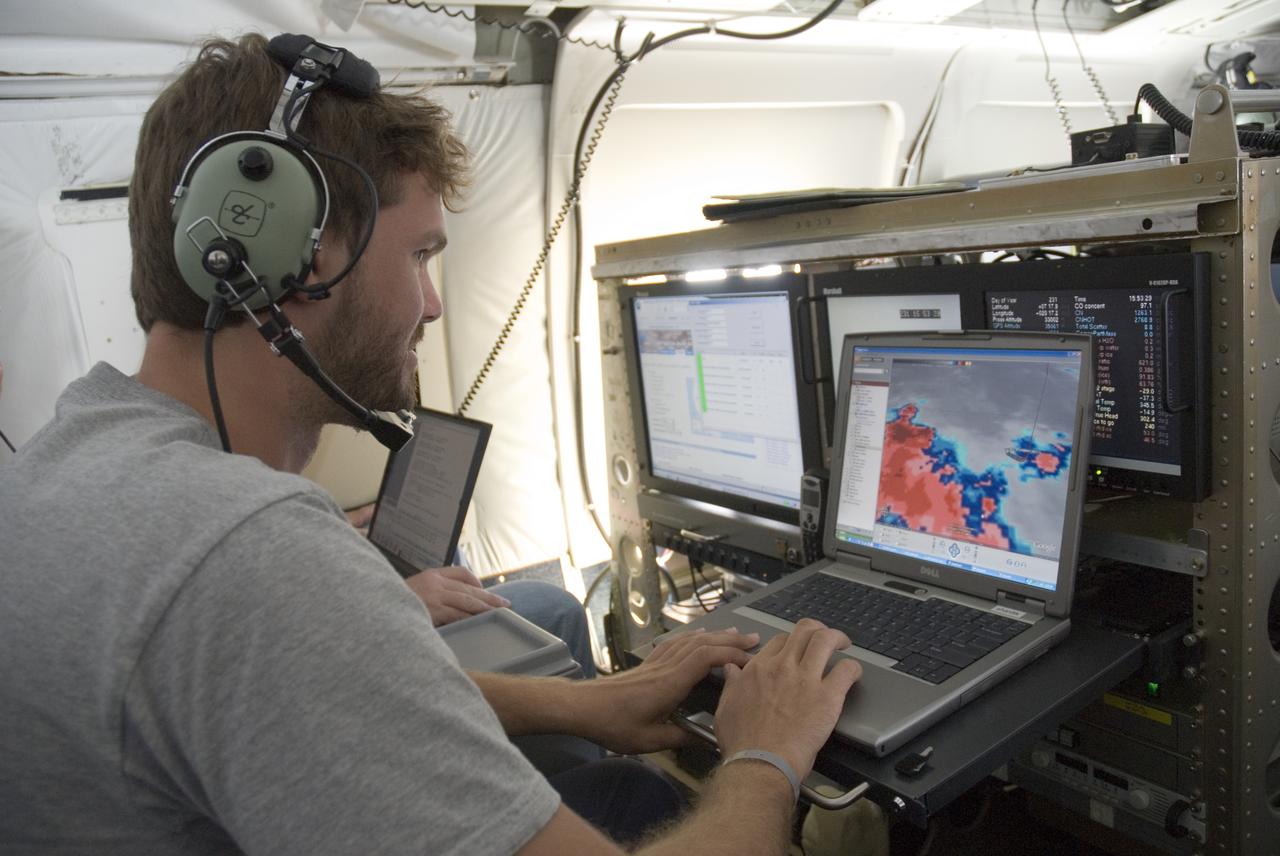
NASA African Monsoon Multidisciplinary Analyses (NAMMA) DC-8 deployment to Cape Verde, Sal island, Africa

NASA African Monsoon Multidisciplinary Analyses (NAMMA) DC-8 deployment to Cape Verde, Sal island, Africa

NASA African Monsoon Multidisciplinary Analyses (NAMMA) DC-8 deployment to Cape Verde, Sal island, Africa

NASA African Monsoon Multidisciplinary Analyses (NAMMA) DC-8 deployment to Cape Verde, Sal island, Africa

NASA African Monsoon Multidisciplinary Analyses (NAMMA) DC-8 deployment to Cape Verde, Sal island, Africa
NASA African Monsoon Multidisciplinary Analyses (NAMMA) DC-8 deployment to Cape Verde, Sal island, Africa

NASA African Monsoon Multidisciplinary Analyses (NAMMA) DC-8 deployment to Cape Verde, Sal island, Africa

NASA African Monsoon Multidisciplinary Analyses (NAMMA) DC-8 deployment to Cape Verde, Sal island, Africa

NASA African Monsoon Multidisciplinary Analyses (NAMMA) DC-8 deployment to Cape Verde, Sal island, Africa

NASA African Monsoon Multidisciplinary Analyses (NAMMA) DC-8 deployment to Cape Verde, Sal island, Africa

NASA African Monsoon Multidisciplinary Analyses (NAMMA) DC-8 deployment to Cape Verde, Sal island, Africa

NASA African Monsoon Multidisciplinary Analyses (NAMMA) DC-8 deployment to Cape Verde, Sal island, Africa

NASA African Monsoon Multidisciplinary Analyses (NAMMA) DC-8 deployment to Cape Verde, Sal island, Africa

NASA African Monsoon Multidisciplinary Analyses (NAMMA) DC-8 deployment to Cape Verde, Sal island, Africa
NASA African Monsoon Multidisciplinary Analyses (NAMMA) DC-8 deployment to Cape Verde, Sal island, Africa

NASA African Monsoon Multidisciplinary Analyses (NAMMA) DC-8 deployment to Cape Verde, Sal island, Africa

NASA African Monsoon Multidisciplinary Analyses (NAMMA) DC-8 deployment to Cape Verde, Sal island, Africa

NASA African Monsoon Multidisciplinary Analyses (NAMMA) DC-8 deployment to Cape Verde, Sal island, Africa

NASA African Monsoon Multidisciplinary Analyses (NAMMA) DC-8 deployment to Cape Verde, Sal island, Africa

NASA African Monsoon Multidisciplinary Analyses (NAMMA) DC-8 deployment to Cape Verde, Sal island, Africa

NASA African Monsoon Multidisciplinary Analyses (NAMMA) DC-8 deployment to Cape Verde, Sal island, Africa

NASA African Monsoon Multidisciplinary Analyses (NAMMA) DC-8 deployment to Cape Verde, Sal island, Africa

NASA African Monsoon Multidisciplinary Analyses (NAMMA) DC-8 deployment to Cape Verde, Sal island, Africa
NASA African Monsoon Multidisciplinary Analyses (NAMMA) DC-8 deployment to Cape Verde, Sal island, Africa
NASA African Monsoon Multidisciplinary Analyses (NAMMA) DC-8 deployment to Cape Verde, Sal island, Africa
NASA African Monsoon Multidisciplinary Analyses (NAMMA) DC-8 deployment to Cape Verde, Sal island, Africa

NASA African Monsoon Multidisciplinary Analyses (NAMMA) DC-8 deployment to Cape Verde, Sal island, Africa

NASA African Monsoon Multidisciplinary Analyses (NAMMA) DC-8 deployment to Cape Verde, Sal island, Africa

NASA African Monsoon Multidisciplinary Analyses (NAMMA) DC-8 deployment to Cape Verde, Sal island, Africa
NASA African Monsoon Multidisciplinary Analyses (NAMMA) DC-8 deployment to Cape Verde, Sal island, Africa

NASA African Monsoon Multidisciplinary Analyses (NAMMA) DC-8 deployment to Cape Verde, Sal island, Africa

NASA African Monsoon Multidisciplinary Analyses (NAMMA) DC-8 deployment to Cape Verde, Sal island, Africa

NASA African Monsoon Multidisciplinary Analyses (NAMMA) DC-8 deployment to Cape Verde, Sal island, Africa

NASA African Monsoon Multidisciplinary Analyses (NAMMA) DC-8 deployment to Cape Verde, Sal island, Africa

NASA African Monsoon Multidisciplinary Analyses (NAMMA) DC-8 deployment to Cape Verde, Sal island, Africa. Mike Gaunce in center.

NASA African Monsoon Multidisciplinary Analyses (NAMMA) DC-8 deployment to Cape Verde, Sal island, Africa with Mike Gaunce, NASA Ames
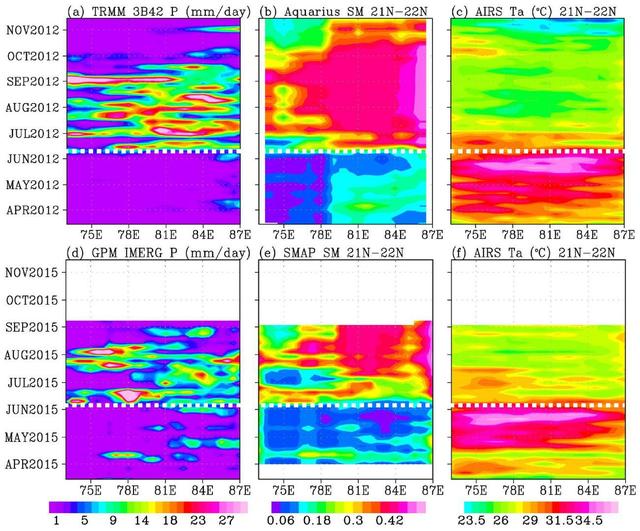
In June 2015, news organizations around the world reported on a deadly heat wave in India that killed more than 2,300 people. Prior to the arrival of the summer monsoon in India, weather conditions had been extremely hot and dry. Such conditions can lead to economic and agricultural disaster, human suffering and loss of life. NASA satellite sensors are allowing scientists to characterize pre-monsoon droughts and heat waves and postulate their scientific cause. This figure shows the longitude-time variations, averaged between 21 and 22 degrees North, across the middle of the India subcontinent from mid-April to mid-June. Longitude from the Arabian Sea to the Bay of Bengal is represented on the horizontal axis; while the vertical axis shows the timeframe. Rainfall is shown on the left, soil moisture is in the center, and surface air temperature is on the right. For both years (2012 and 2015), the summer monsoon begins in June, with sharp rises in rainfall and soil moisture, and a sharp drop in air temperature. The hottest and driest weeks occurred just before the summer monsoon onsets. Similar dry and hot periods, varying from one to a few weeks, were observed in 2013 and 2014. Soil moisture as an indication of drought as measured by NASA's Aquarius mission was first available in 2012. Rainfall data are from NASA's Tropical Rainfall Measuring Mission (TRMM), and surface air temperature is from NASA's Atmospheric Infrared Sounder (AIRS) instrument on NASA's Aqua satellite. The TRMM and Aquarius missions ended in April 2015, before the drought and heat waves. Their data were replaced by those presently available from NASA's Soil Moisture Active Passive Mission (SMAP) and Global Precipitation Mission (GPM) to show the drought and heatwave in 2015. Scientists from NASA's Jet Propulsion Laboratory, Pasadena, California, have shown that during the summer monsoon season, moisture is transported into the India Subcontinent from the Arabian Sea and out to the Bay of Bengal. The difference between moisture input from the west and output to the east is deposited as rain over land. The pre-monsoon drought and heat waves coincide with the short period when moisture is advected out to the Bay of Bengal ahead of input from the Arabian Sea. The onset of southwest monsoon winds begins in the Bay of Bengal and sucks moisture out from the subcontinent earlier than the onset in the Arabian Sea. http://photojournal.jpl.nasa.gov/catalog/PIA19939
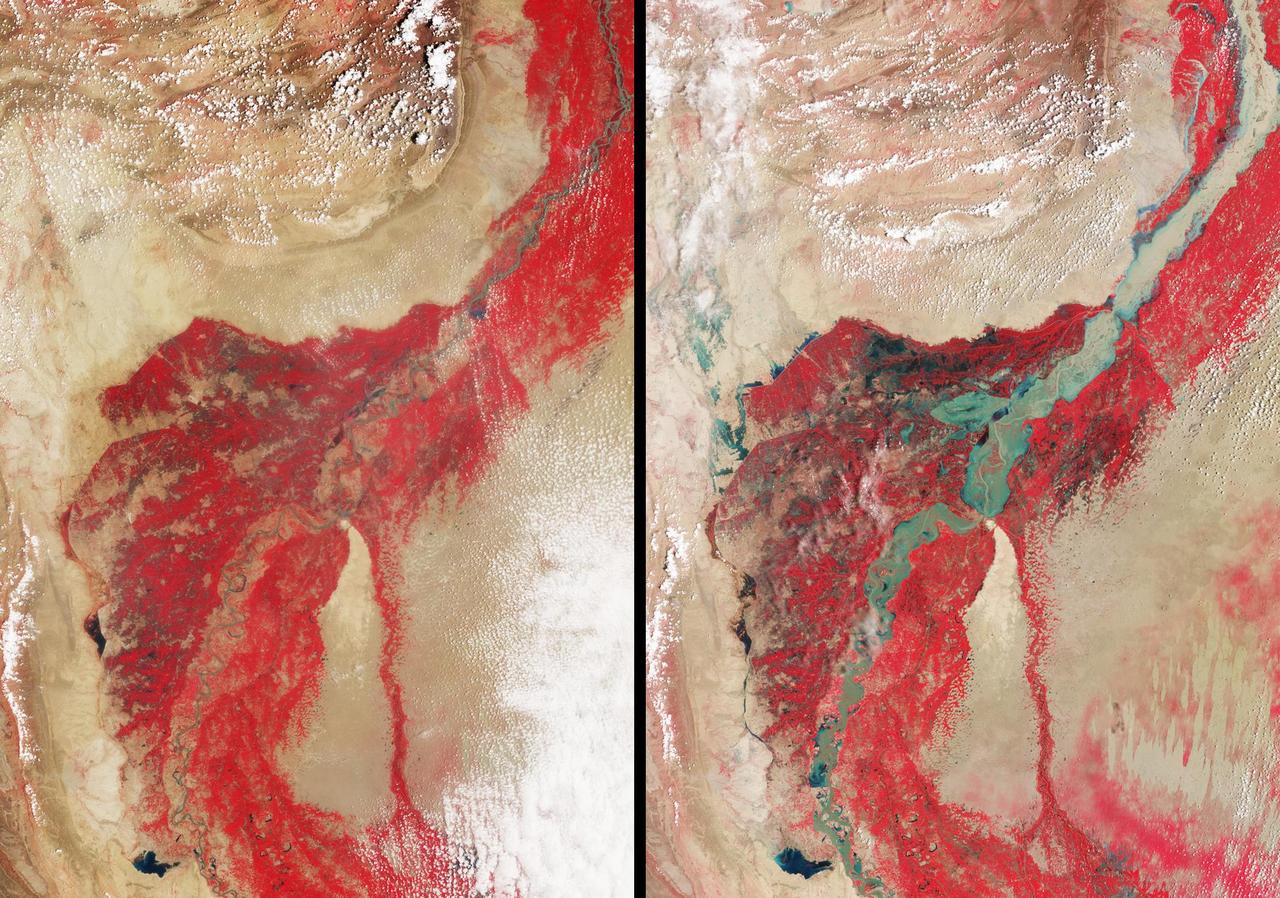
In late July 2010, flooding caused by heavy monsoon rains began in several regions of Pakistan, including the Khyber Pakhtunkhwa, Sindh, Punjab and parts of Baluchistan. This image was acquired by NASA Terra spacecraft on August 11, 2010.
In late July 2010, flooding caused by heavy monsoon rains began in several regions of Pakistan. These images taken by NASA Aqua spacecraft show were taken before and after the flooding.
NASA Terra spacecraft captured this image of the city of Jhudo, Pakistan, and surrounding countryside on Sept. 24, 2011. Torrential monsoon rains in south Asia have displaced hundreds of thousands of residents in India, Pakistan and Thailand.
In late July 2010, flooding caused by heavy monsoon rains began in several regions of Pakistan. This image from NASA Aqua spacecraft reveals the bright white cloud tops from the cluster of thunderstorms.

NASA Monsoon Multidisciplinary analysis (NAMMA) deployment, Sal Island, Cape Verde Africia DC-8 NAMMA MISSION TO CAPE VERDE, AFRICA close-up of one of the external probes used on baord NASA's DC-8 during the deployment.

NASA Monsoon Multidisciplinary analysis (NAMMA) deployment, Sal Island, Cape Verde Africia DC-8 NAMMA MISSION TO CAPE VERDE, AFRICA close-up of one of the external probes used on baord NASA's DC-8 during the deployment.

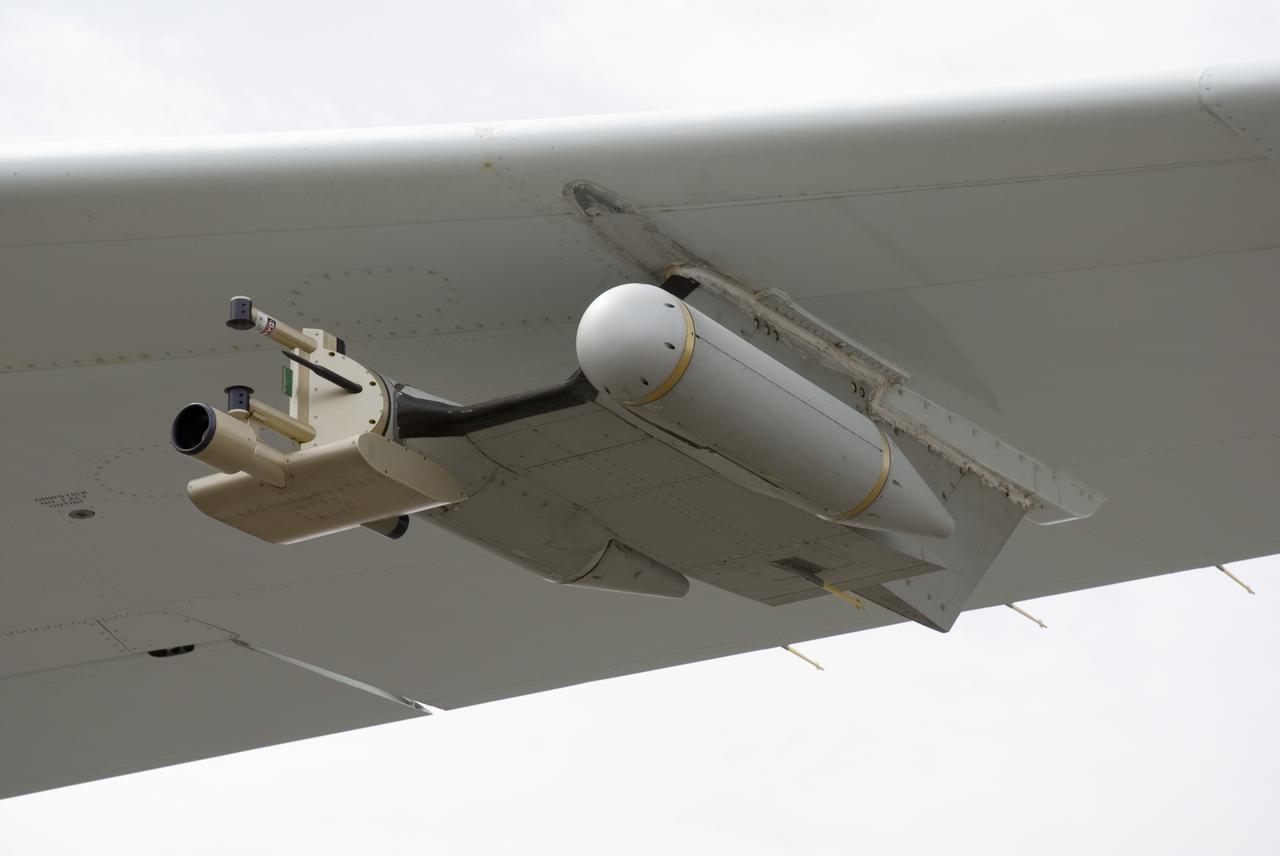
NASA Monsoon Multidisciplinary analysis (NAMMA) deployment, Sal Island, Cape Verde Africia DC-8 NAMMA MISSION TO CAPE VERDE, AFRICA close-up of one of the external wingtip probes used on baord NASA's DC-8 during the deployment.

NASA Monsoon Multidisciplinary analysis (NAMMA) deployment, Sal Island, Cape Verde Africia DC-8 NAMMA MISSION TO CAPE VERDE, AFRICA: NASA's Dc-8 rolls down runway prior to take off from Sal Island's Amilcar Cabral International Airport on a Science flight for the NAMMA mission

NASA Monsoon Multidisciplinary analysis (NAMMA) deployment, Sal Island, Cape Verde Africia DC-8 NAMMA MISSION TO CAPE VERDE, AFRICA: NASA Ames photographer Eric James videotapes the formaton flight with the U.K.'s FAAM aircrft BAE-146 off the coast of Senegal, Africa.

NASA Monsoon Multidisciplinary analysis (NAMMA) deployment, Sal Island, Cape Verde Africia DC-8 NAMMA MISSION TO CAPE VERDE, AFRICA close-up of one of the external probes used on baord NASA's DC-8 during the deployment.
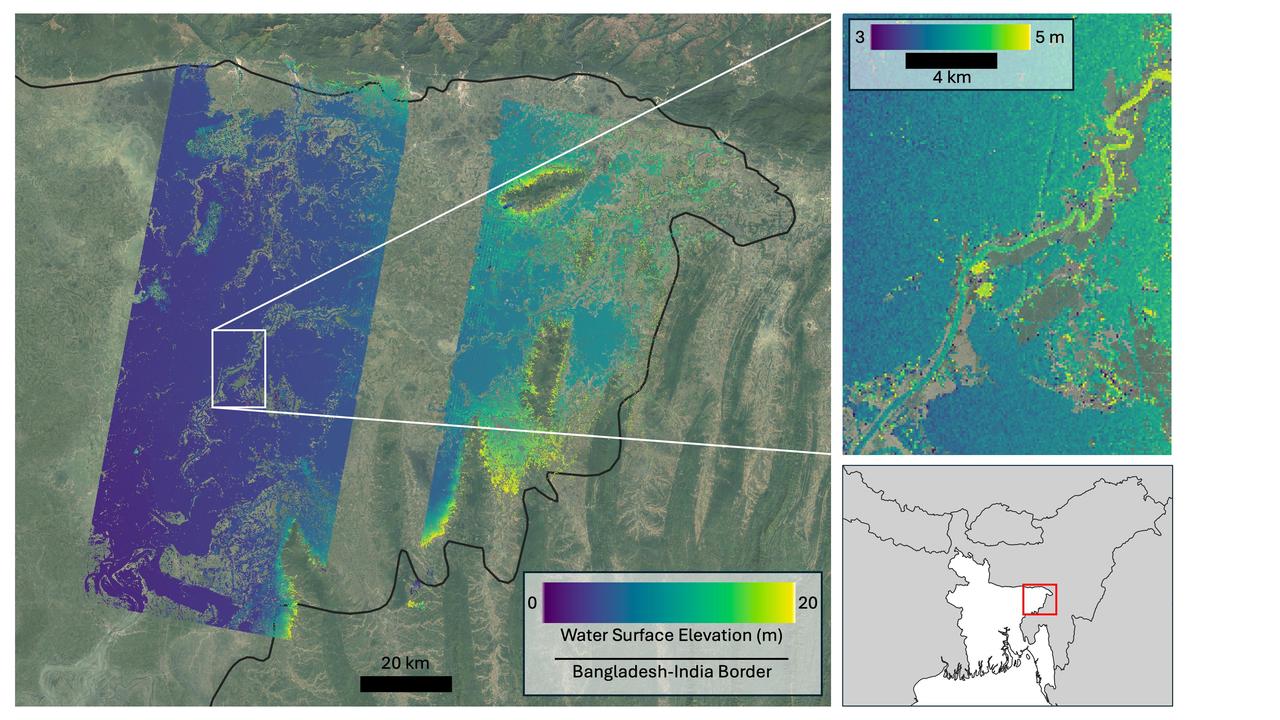
Flooding from monsoon rains covers a wide region of northeast Bangladesh near the India border in this Oct. 8, 2023, image showing data from the U.S.-French Surface Water and Ocean Topography (SWOT) satellite. Around that time, heavy monsoon rains affected various parts of Bangladesh, including the region depicted here, home to Sylhet, the country's fifth-largest city (population approximately 700,000). Sylhet and surrounding areas experienced substantial flooding. The SWOT data, overlaid on a standard Google Earth image, shows the precise surface elevation of the floodwaters. The vast majority of the land area within the region imaged by SWOT is flooded. In the main image at left, dark blue indicates waters just above sea level, while yellow represents 65 feet (20 meters) above sea level. The inset at top right zooms in on a section of the Kalni River, a tributary of one of Bangladesh's three major rivers, the Meghna. The main channel of the Kalni is about 650 feet (200 meters) wide. In the inset at top right, dark blue indicates water about 10 feet (3 meters) above sea level and yellow is used for waters about 16 feet (5 meters) above sea level. The zoomed-in data can be used to determine the slope of the river, which tells hydrologists how fast water flows through it and off a landscape. The water surface elevations depicted are higher in the top right of the inset than they are in the bottom left. The data also shows the elevation of the river is generally greater than that of water in the floodplain around it, telling hydrologists that water is likely flowing from the river into the floodplain. Each pixel in the image represents an area that is about 330 feet by 330 feet (100 meters by 100 meters). The image shows data from SWOT's Ka-band Radar Interferometer (KaRIn) instrument antennas, which don't cover a 12-mile-wide (20-kilometer-wide) strip right underneath the satellite. For that gap, a separate instrument collects water surface elevation data that isn't shown here. Bangladesh is a low-lying, generally flat country that chronically suffers from two types of flooding. Monsoon rains cause rivers that flow into Bangladesh from neighboring countries, especially India, to flood. And flash flooding occurs during the pre-monsoon season and can damage agricultural crops if not forecast with sufficient warning. While the use of satellite altimetry and precipitation in models has shown some promise for flood forecasting in Bangladesh, forecasting both types of flooding with sufficient lead time has remained challenging due to a lack of timely, high-spatial-resolution information on water elevation. SWOT is the first satellite to provide this information over entire regions, enabling improved forecasts and filling the data gap when places like Bangladesh become inundated. The Bangladesh Water Development Board, which is in charge of national flood forecasting and management, is now exploring how to incorporate SWOT water elevation information into its flood inundation forecasting system. Since shortly after launch in December 2022, SWOT has been measuring the height of nearly all water on Earth's surface, developing one of the most detailed, comprehensive views yet of the planet's oceans and freshwater lakes and rivers. The mission science team makes measurements using the KaRIn instrument. With two antennas spread 33 feet (10 meters) apart on a boom, KaRIn produces a pair of data swaths as it circles the globe, bouncing radar pulses off water surfaces to collect surface-height information. https://photojournal.jpl.nasa.gov/catalog/PIA26343

Johnson Space Center Aircraft Operations Division research pilot Tom ‘Duster’ Parent suits up in a WB-57 pressure suit in preparation for a WB-57 high altitude flight to support JSC Aircraft Ops WB-57 Science Campaign - Asian Summer Monsoon Chemical and Climate Impact Project (ACCLIP). Photo Date: August 17, 2021. Location: Ellington Field - Hangar 990. Photographer: Robert Markowitz
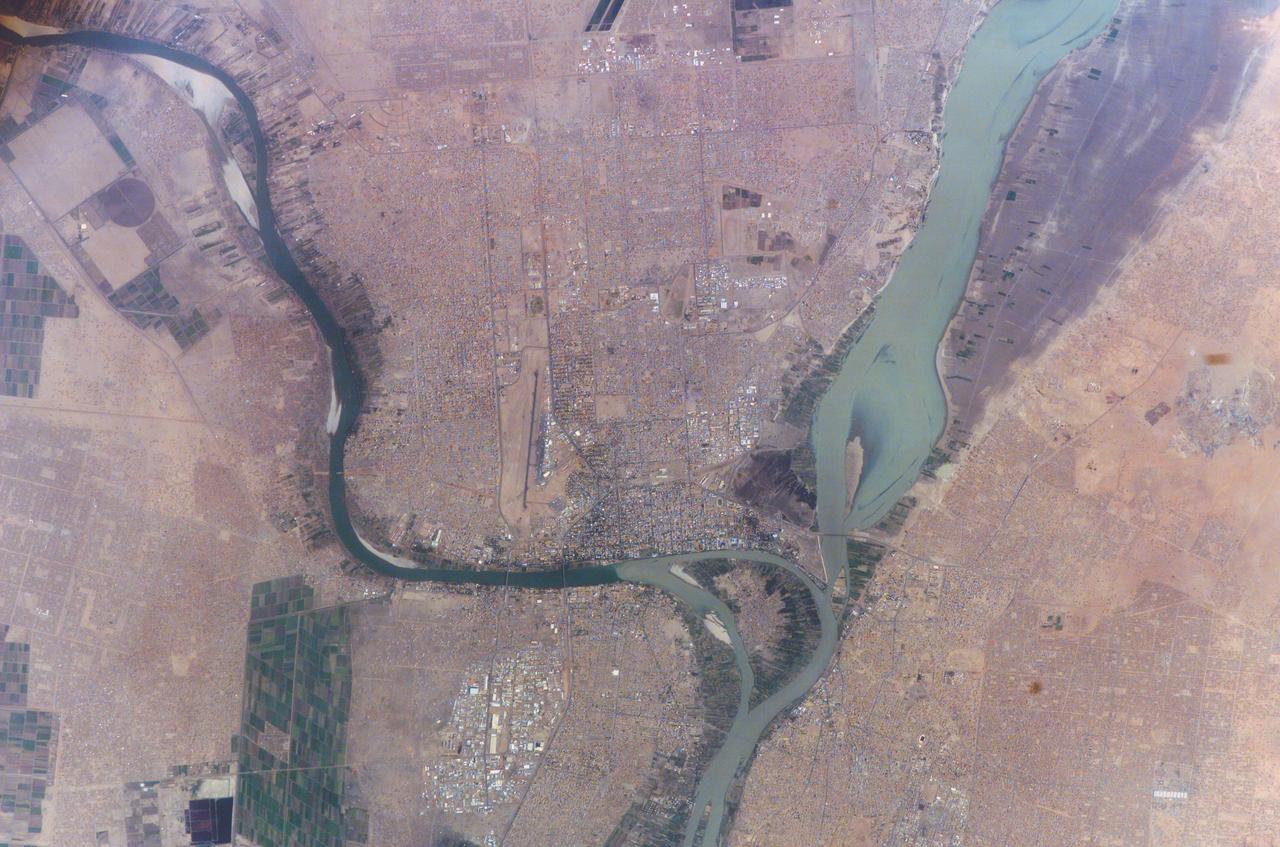
ISS010-E-23451 (7 April 2005) --- Khartoum, Sudan is featured in this image photographed by an Expedition 10 crewmember on the International Space Station (ISS). Sudan’s capital city Khartoum, which means Elephant’s Trunk, describes the shape of the Nile River where the Blue and the White Nile Rivers meet to form the united Nile that flows northward into Egypt. This image shows the rivers near the end of the dry season. The White Nile (western branch) runs through Sudan from Uganda. The White Nile’s equatorial source produces a flow that runs at a nearly constant rate throughout the year. The nearly dry Blue Nile from the highlands of Ethiopia swells in the late summer and early fall with rains from the summer monsoons. The flow can be so great the Nile flows backward at the junction. In recent years, floods in Khartoum have occurred in August with heavy monsoon rainfall. Khartoum is one of the largest Muslim cities in North Africa, but has a fairly short history.
STS059-L14-170 (9-20 April 1994) --- Orient with the sea at the left. Then Subic Bay is at the lower left corner, and Clark Air Force Base (abandoned after the eruption) is to the lower right of the volcano. A turquoise lake occupies the caldera just below the center of the photograph. Mount Pinatubo erupted in June, 1991 after several hundred years of quiescence. Eruptive activity has nearly ceased, but every torrential rain in this monsoonal climate causes renewed mud flows of a viscous slurry composed of volcanic ash and pumice. Shuttle crews have been photographing the mountain at every opportunity, to add documentation to unmanned-satellite, aerial, and ground-based observations of changes. SRL scientists will use the excellent radar imagery obtained during STS-59 to help discriminate among different kinds of volcanic material, and to extend their observations to other volcanoes around the world using future, perhaps unmanned, radar satellites. Linhof photograph.
STS093-709-046 (23-27 July 1999) --- The STS-93 astronauts aboard the Space Shuttle Columbia took this picture featuring the Northern Territory of Australia. Melville Island (bottom) and Bathurst Island are across Clarence Strait just north of the city of Darwin. According to scientists studying the STS-93 photo collection, seasonal fires are common in the region. Winter is the season for agricultural land clearing of the native monsoon forests. Smoke from the fires on the islands is being blown northwest by the prevailing winter winds. Data back information on the 70mm film that recorded this image lists time and date as 05:38:45 GMT, July 25, 1999. When the photo was taken, the shuttle was flying over a point located at 18.4 degrees south latitude and 118.7 east longitude.
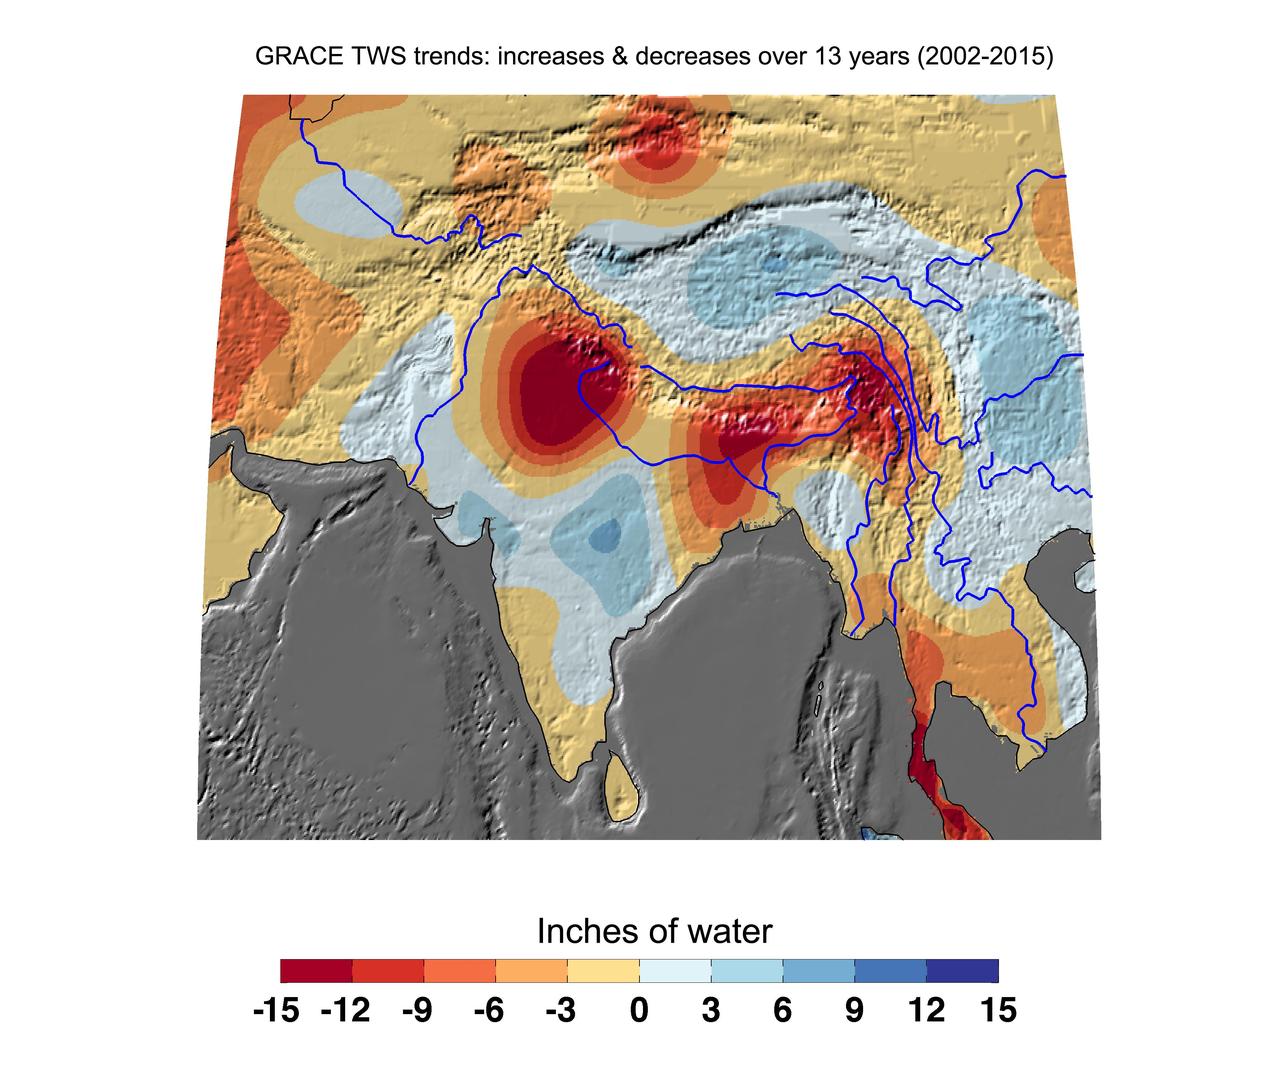
Cumulative total freshwater losses in South Asia from 2002 to 2015 (in inches) observed by NASA's Gravity Recovery and Climate Experiment (GRACE) mission. Total water refers to all of the snow, surface water, soil water and groundwater combined. Groundwater depletion in India and Bangladesh continue to dominate total water losses in the region. The persistent drought along the Malaysian Peninsula is also apparent. Regions of increasing total water experience strong interannual variations in the Asian monsoon. Image updated from Rodell et al., 2009. Citation of Record: Rodell, M., I. Velicogna and J. Famiglietti, Satellite-based estimates of groundwater depletion in India, Nature, doi:10.1038/nature08238. http://photojournal.jpl.nasa.gov/catalog/PIA20206
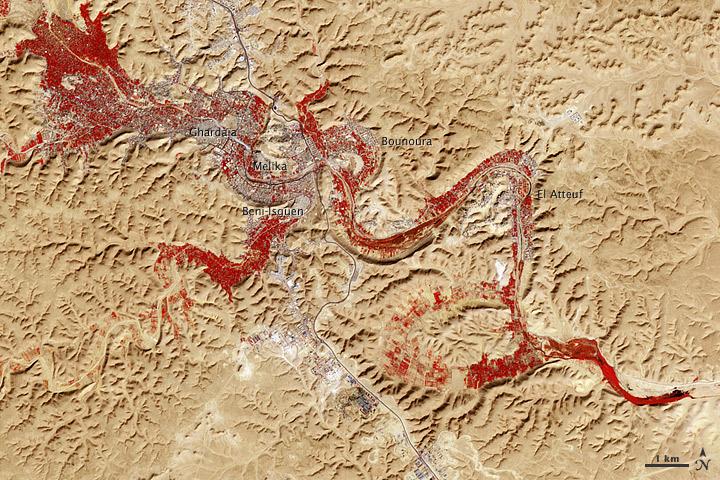
NASA image acquired Feb. 9, 2011 Less than 5 percent of Algeria’s land surface is suitable for growing crops, and most precipitation falls on the Atlas Mountains along the coast. Inland, dust-laden winds blow over rocky plains and sand seas. However, in north central Algeria—off the tip of Grand Erg Occidental and about 450 kilometers (280 miles) south of Algiers—lies a serpentine stretch of vegetation. It is the M’zab Valley, filled with palm groves and dotted with centuries-old settlements. The Advanced Spaceborne Thermal Emission and Reflection Radiometer (ASTER) on NASA’s Terra satellite captured this image of M’zab Valley on February 9, 2011. ASTER combines infrared, red, and green wavelengths of light. Bare rock ranges in color from beige to peach. Buildings and paved surfaces appear gray. Vegetation is red, and brighter shades of red indicate more robust vegetation. This oasis results from water that is otherwise in short supply in the Sahara Desert, thanks to the valley’s approximately 3,000 wells. Chemical analysis of Algerian aquifers, as well studies of topography in Algeria and Tunisia, suggest this region experienced a cooler climate in the late Pleistocene, and potentially heavy monsoon rains earlier in the Holocene. The M’zab region shows evidence of meandering rivers and pinnate drainage patterns. The vegetation lining M’zab Valley highlights this old river valley’s contours. Cool summer temperatures and monsoon rains had long since retreated from the region by eleventh century, but this valley nevertheless supported the establishment of multiple fortified settlements, or ksours. Between 1012 A.D. and 1350 A.D., locals established the ksours of El-Atteuf, Bounoura, Melika, Ghardaïa, and Beni-Isguen. Collectively these cities are now a United Nations Educational, Scientific, and Cultural Organization (UNESCO) World Heritage site. NASA Earth Observatory image by Robert Simmon and Jesse Allen, using data from the GSFC/METI/ERSDAC/JAROS, and U.S./Japan ASTER Science Team. Caption by Michon Scott. Instrument: Terra - ASTER <b>To download the full high res file go <a href="http://earthobservatory.nasa.gov/IOTD/view.php?id=51296" rel="nofollow"> here</a></b>

STS035-607-024 (2-10 Dec. 1990) --- This is one of 25 visuals used by the STS-35 crew at its Dec. 20, 1990 post-flight press conference. Space Shuttle Columbia's flight of almost nine days duration (launched December 2 from Kennedy Space Center (KSC) and landed December 10 at Edwards Air Force Base) carried the Astro-1 payload and was dedicated to astrophysics. The mission involved a seven-man crew. Crew members were astronauts Vance D. Brand, Guy S. Gardner, Jeffrey A. Hoffman, Robert A.R. Parker and John M. (Mike) Lounge; and payload specialists Samuel T. Durrance and Ronald A. Parise. Thunderstorm systems over the Pacific Ocean, with heavy sunglint, as photographed with a handheld Rolleiflex camera aimed through Columbia's aft flight deck windows.

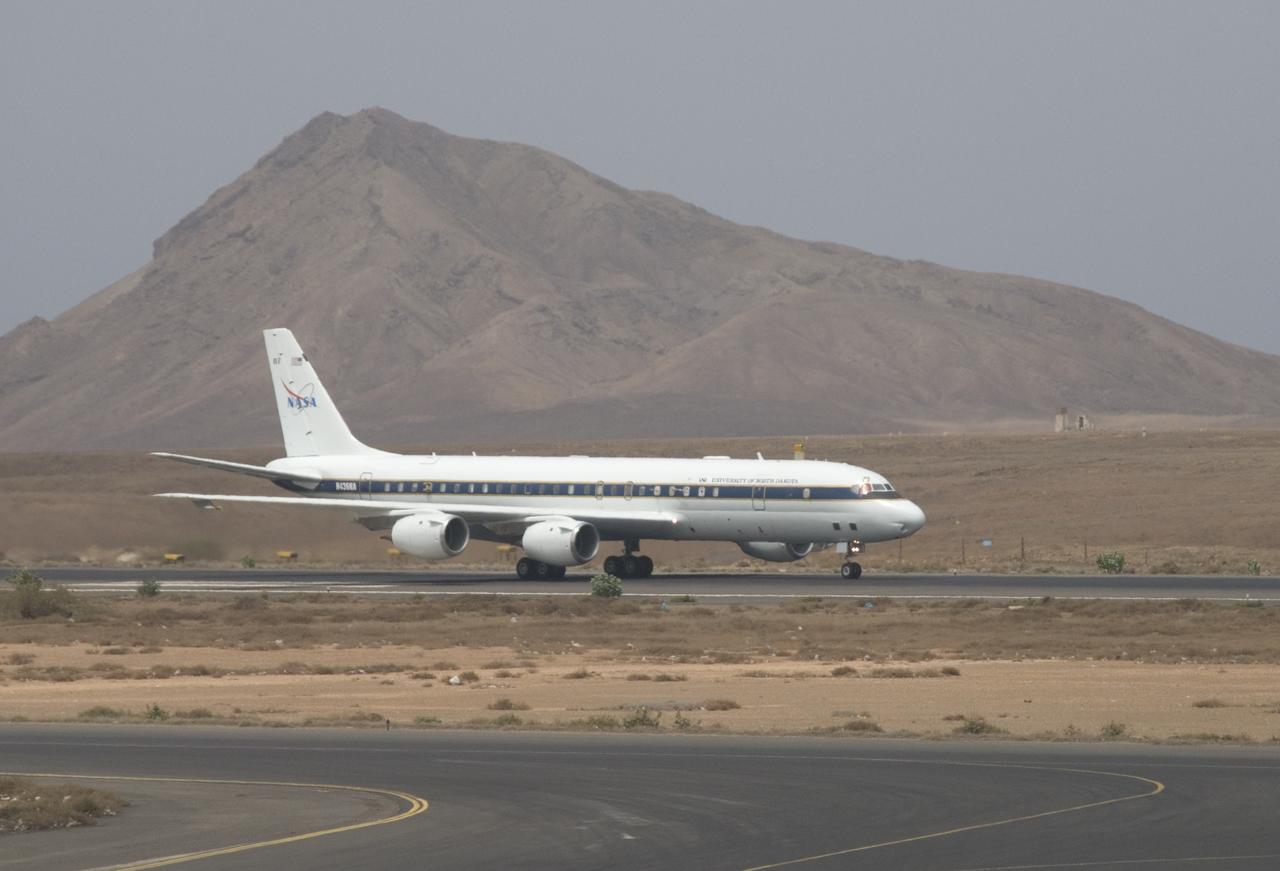
NASA's DC-8 Flying Laboratory taxis up to the ramp at Sal Island's Amilcar Cabral International Airport after a science flight for the NAMMA mission. (Ames photo # ACD06-0135-035)
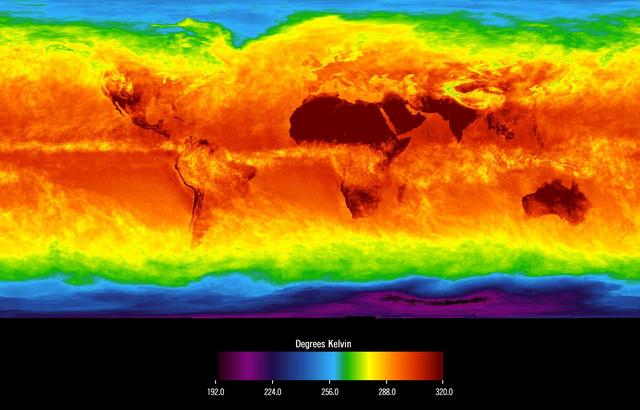
This image shows average temperatures in April, 2003, observed by AIRS at an infrared wavelength that senses either the Earth's surface or any intervening cloud. Similar to a photograph of the planet taken with the camera shutter held open for a month, stationary features are captured while those obscured by moving clouds are blurred. Many continental features stand out boldly, such as our planet's vast deserts, and India, now at the end of its long, clear dry season. Also obvious are the high, cold Tibetan plateau to the north of India, and the mountains of North America. The band of yellow encircling the planet's equator is the Intertropical Convergence Zone (ITCZ), a region of persistent thunderstorms and associated high, cold clouds. The ITCZ merges with the monsoon systems of Africa and South America. Higher latitudes are increasingly obscured by clouds, though some features like the Great Lakes, the British Isles and Korea are apparent. The highest latitudes of Europe and Eurasia are completely obscured by clouds, while Antarctica stands out cold and clear at the bottom of the image. http://photojournal.jpl.nasa.gov/catalog/PIA00427
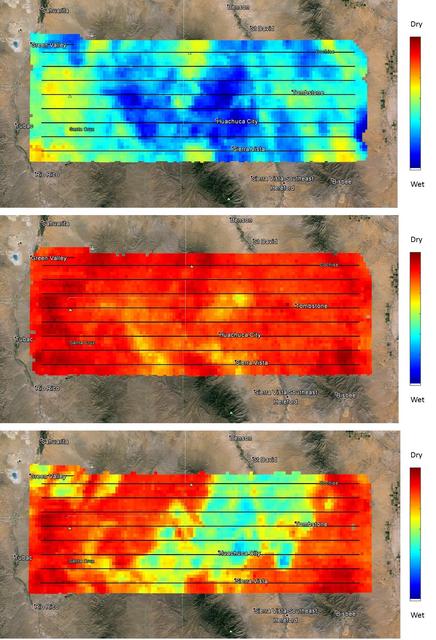
NASA's SMAP (Soil Moisture Active Passive) satellite observatory conducted a field experiment as part of its soil moisture data product validation program in southern Arizona on Aug. 2-18, 2015. The images here represent the distribution of soil moisture over the SMAPVEX15 (SMAP Validation Experiment 2015) experiment domain, as measured by the Passive Active L-band System (PALS) developed by NASA's Jet Propulsion Laboratory, Pasadena, California, which was installed onboard a DC-3 aircraft operated by Airborne Imaging, Inc. Blue and green colors denote wet conditions and dry conditions are marked by red and orange. The black lines show the nominal flight path of PALS. The measurements show that on the first day, the domain surface was wet overall, but had mostly dried down by the second measurement day. On the third day, there was a mix of soil wetness. The heterogeneous soil moisture distribution over the domain is typical for the area during the North American Monsoon season and provides excellent conditions for SMAP soil moisture product validation and algorithm enhancement. The images are based on brightness temperature measured by the PALS instrument gridded on a grid with 0.6-mile (1-kilometer) pixel size. They do not yet compensate for surface characteristics, such as vegetation and topography. That work is currently in progress. http://photojournal.jpl.nasa.gov/catalog/PIA19879
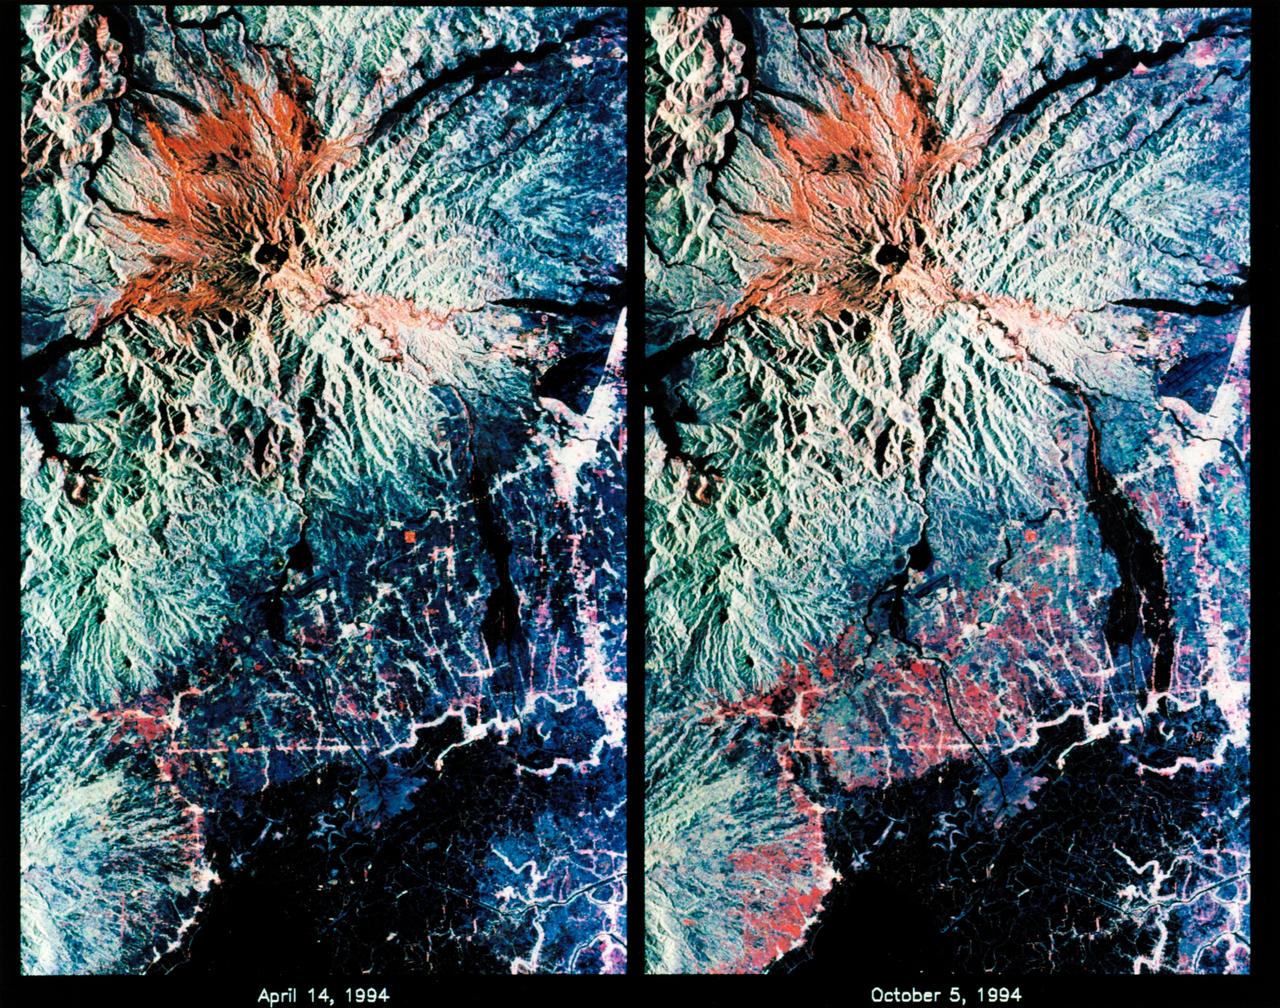
STS068-S-053 (7 October 1994) --- These are color composite radar images showing the area around Mount Pinatubo in the Philippines. The images were acquired by the Spaceborne Imaging Radar-C/X-Band Synthetic Aperture Radar (SIR-C/X-SAR) aboard the Space Shuttle Endeavour on April 14, 1994 (left image) and October 5, 1994 (right image). The images are centered at about 15 degrees north latitude and 120.5 degrees east longitude. Both images were obtained with the same viewing geometry. The color composites were made by displaying the L-Band (horizontally transmitted and received) in red; the L-Band (horizontally transmitted and vertically received) in green; and the C-Band (horizontally transmitted and vertically received) in blue. The area shown is approximately 40 by 65 kilometers (25 by 40 miles). The main volcanic crater on Mount Pinatubo produced by the June 1991 eruptions and the steep slopes on the upper flanks of the volcano are easily seen in these images. Red on the high slopes shows the distribution of the ash deposited during the 1991 eruption, which appears red because of the low cross-polarized radar returns at C and L Bands. The dark drainage's radiating away from the summit are smooth mud flows, which even three years after the eruption continue to flood the river valleys after heavy rain. Comparing the two images shows that significant changes have occurred in the intervening five months along the Pasig-Potero rivers (the dark area in the lower right of the images). Mud flows, called "lahars", that occurred during the 1994 monsoon season filled the river valleys, allowing the lahars to spread over the surrounding countryside. Three weeks before the second image was obtained, devastating lahars more than doubled the area affected in the Pasig-Potero rivers, which is clearly visible as the increase in dark area on the lower right of the images. Migration of deposition to the east (right) has affected many communities. Newly affected areas included the community of Bacolor, Pampanga, where thousands of homes were buried in meters of hot mud and rock as 80,000 people fled the lahar-stricken area. The 1991 Mount Pinatubo eruption is well known for its near-global effects on the atmosphere and short-term climate due to the large amount of sulfur dioxide that was injected into the upper atmosphere. Locally, however, the effects will most likely continue to impact surrounding areas for as long as the next 10 to 15 years. Mud flows, quite certainly, will continue to pose severe hazards to adjacent areas. Radar observations like those obtained by SIR-C/X-SAR will play a key role in monitoring these changes because of the radar's ability to see daylight or darkness and even in the worst weather conditions. Radar imaging will be particularly useful during the monsoon season, when the lahars form. Frequent imaging of these lahar fields will allow scientists to better predict when they are likely to begin flowing again and which communities might be at risk. Spaceborne Imaging Radar-C/X-Band Synthetic Aperture Radar (SIR-C/X-SAR) is part of NASA's Mission to Planet Earth. (P-44729)
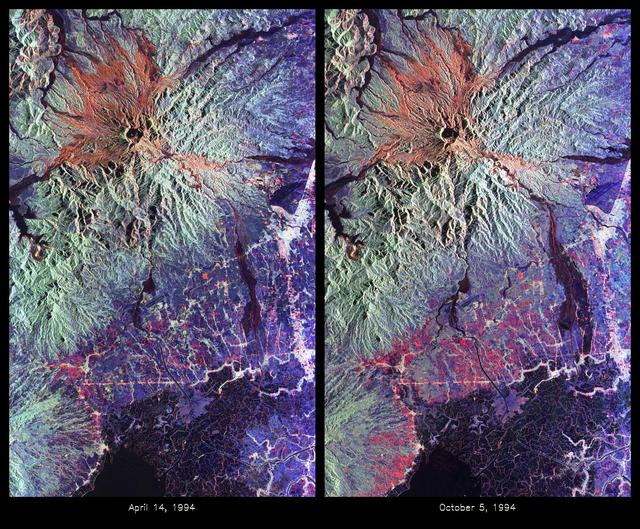
These are color composite radar images showing the area around Mount Pinatubo in the Philippines. The images were acquired by the Spaceborne Imaging Radar-C and X-band Synthetic Aperture Radar (SIR-C/X-SAR) aboard the space shuttle Endeavour on April 14, 1994 (left image) and October 5,1994 (right image). The images are centered at about 15 degrees north latitude and 120.5 degrees east longitude. Both images were obtained with the same viewing geometry. The color composites were made by displaying the L-band (horizontally transmitted and received) in red; the L-band (horizontally transmitted and vertically received) in green; and the C-band (horizontally transmitted and vertically received) in blue. The area shown is approximately 40 kilometers by 65 kilometers (25 miles by 40 miles). The main volcanic crater on Mount Pinatubo produced by the June 1991 eruptions and the steep slopes on the upper flanks of the volcano are easily seen in these images. Red on the high slopes shows the distribution of the ash deposited during the 1991 eruption, which appears red because of the low cross-polarized radar returns at C and L bands. The dark drainages radiating away from the summit are the smooth mudflows, which even three years after the eruptions continue to flood the river valleys after heavy rain. Comparing the two images shows that significant changes have occurred in the intervening five months along the Pasig-Potrero rivers (the dark area in the lower right of the images). Mudflows, called "lahars," that occurred during the 1994 monsoon season filled the river valleys, allowing the lahars to spread over the surrounding countryside. Three weeks before the second image was obtained, devastating lahars more than doubled the area affected in the Pasig-Potrero rivers, which is clearly visible as the increase in dark area on the lower right of the images. Migration of deposition to the east (right) has affected many communities. Newly affected areas included the community of Bacolor, Pampanga, where thousands of homes were buried in meters of hot mud and rock as 80,000 people fled the lahar-stricken area. Scientists are closely monitoring the westward migration ( toward the left in this image) of the lahars as the Pasig-Potrero rivers seek to join with the Porac River, an area that has not seen laharic activity since the eruption. This could be devastating because the Pasig-Potrero rivers might be permanently redirected to lower elevations along the Porac River where communities are located. Ground saturation with water during the rainy season reveals inactive channels that were dry in the April image. A small lake has turned into a pond in the lower reaches of the Potrero River because the channels are full of lahar deposits and the surface runoff has no where to flow. Changes in the degree of erosion in ash and pumice deposits from the 1991 eruption can also be seen in the channels that deliver the mudflow material to the Pasig-Potrero rivers. The 1991 Mount Pinatubo eruption is well known for its near-global effects on the atmosphere and short-term climate due to the large amount of sulfur dioxide that was injected into the upper atmosphere. Locally, however, the effects will most likely continue to impact surrounding areas for as long as the next 10 to 15 years. Mudflows, quite certainly, will continue to pose severe hazards to adjacent areas. Radar observations like those obtained by SIR-C/X-SAR will play a key role in monitoring these changes because of the radar's ability to see in daylight or darkness and even in the worst weather conditions. Radar imaging will be particularly useful, for example, during the monsoon season, when the lahars form. Frequent imaging of these lahar fields will allow scientists to better predict when they are likely to begin flowing again and which communities might be at risk. http://photojournal.jpl.nasa.gov/catalog/PIA01743
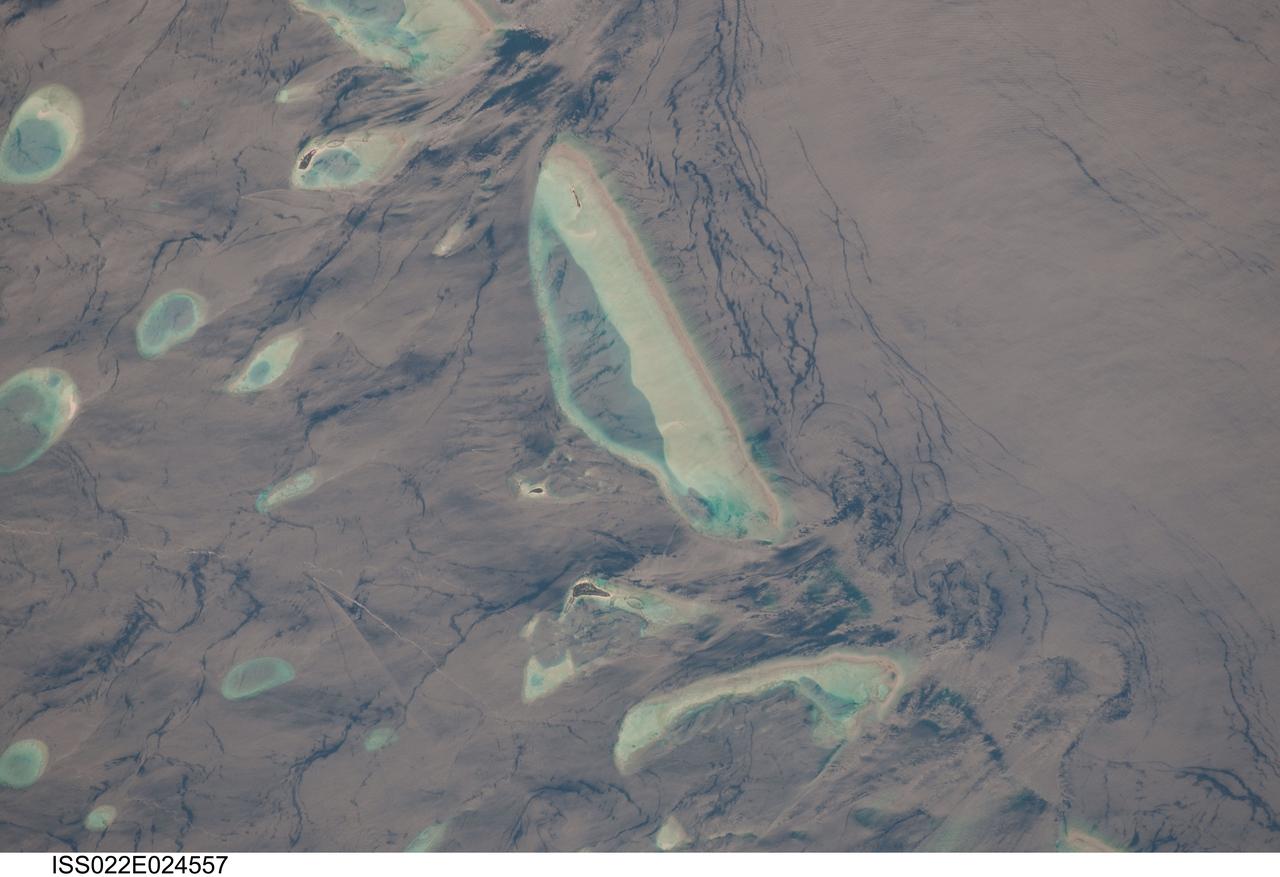
ISS022-E-024557 (12 Jan. 2010) --- Male Atoll and Maldive Islands in the Indian Ocean are featured in this image photographed by an Expedition 22 crew member on the International Space Station. This detailed photograph features one of the numerous atolls in the Maldive Island chain. The Maldives are an island nation, comprised of twenty-six atolls that stretch in a north-to-south chain for almost 900 kilometers southwest of the Indian subcontinent. The silvery, almost pink sheen on the normally blue water of the equatorial Indian Ocean is the result of sunglint. Sunglint occurs when sunlight is reflected off of a water surface directly back towards the observer ? in this case a crew member on the space station. Full sunglint in images typically results in bright silver to white coloration of the water surface. Sunglint images can have different hues depending on the roughness of the water surface and atmospheric conditions. They also can reveal numerous details of water circulation which are otherwise invisible. This image was taken during the Indian Ocean Northeast monsoon season - predominant winds in this area create sinuous surface water patterns on the leeward side, and between, the islets (left). A south-flowing current flows in the deeper water through the Maldives most of the year (right), with fan-shaped surface currents formed by local tides pulsing in and out of the shallow water near the islands (top and bottom). The largest island seen here (center) is 6 kilometers long, and is one of the outer ring of larger islands that make up the 70 kilometers-long, oval-shaped Male Atoll. Shores facing deeper water have well-defined beaches. Numerous small, elliptical coral reef islets are protected within the ring of shallow water to the northeast (left). These islets are mostly awash at high tide, with dry ground appearing in tiny patches only. A small boat was navigating between the islets at the time the image was taken as indicated by its v-shaped wake at bottom left. Images like these illustrate why the Republic of Maldives is one of the most outspoken countries in stressing the dangers of rising sea levels.

“I was born in India soon after we got independence from the British. So we were just beginning to get access to education. My mother was very keen that her daughters get an education. She was a big motivating force behind my interest in science. Since I was really little, she would say, ‘This daughter of mine is going to be a scientist.’ “And I loved nature. In those days, the monsoon would make India come to life with flowers and creepy-crawlies and all kinds of little creatures. I would just go out, eagerly looking for new forms of life. I was always curious. And I remember the night sky — just trying to count all the stars. We didn’t have electricity so it was very dark. You could see the Milky Way, it was so clear. “When Sputnik was launched, it came out in the newspaper that you would be able to see it pass overhead at 5 in the morning. And my grandmother woke up everyone — the entire household — to see it. There was a big crowd in the backyard to watch Sputnik go by. "Then, Yuri Gagarin made a tour of India. He came to our city — Lucknow — and there was a reception for him. My mother got invitations for all of us to see the cosmonaut. We were just little kids. We ran right to the stage — there was no security then — and said hello to him. He gave us little booklets and autographs. It was a big inspiration for me. I remember just staring at that booklet he gave me. I kept it for years.” NASA Program Scientist, Dr. Hashima Hasan, poses for a portrait in her backyard, while working from home during the COVID-19 pandemic, Monday, July 6, 2020 in Maryland. Hasan currently works at NASA Headquarters as a program scientist on the agency’s Nuclear Spectroscopic Telescope Array (NuSTAR) spacecraft, the Keck Observatory, and the NASA Astrophysics Archives, and is the deputy program scientist for NASA’s James Webb Space Telescope. Photo Credit: (NASA/Aubrey Gemignani)
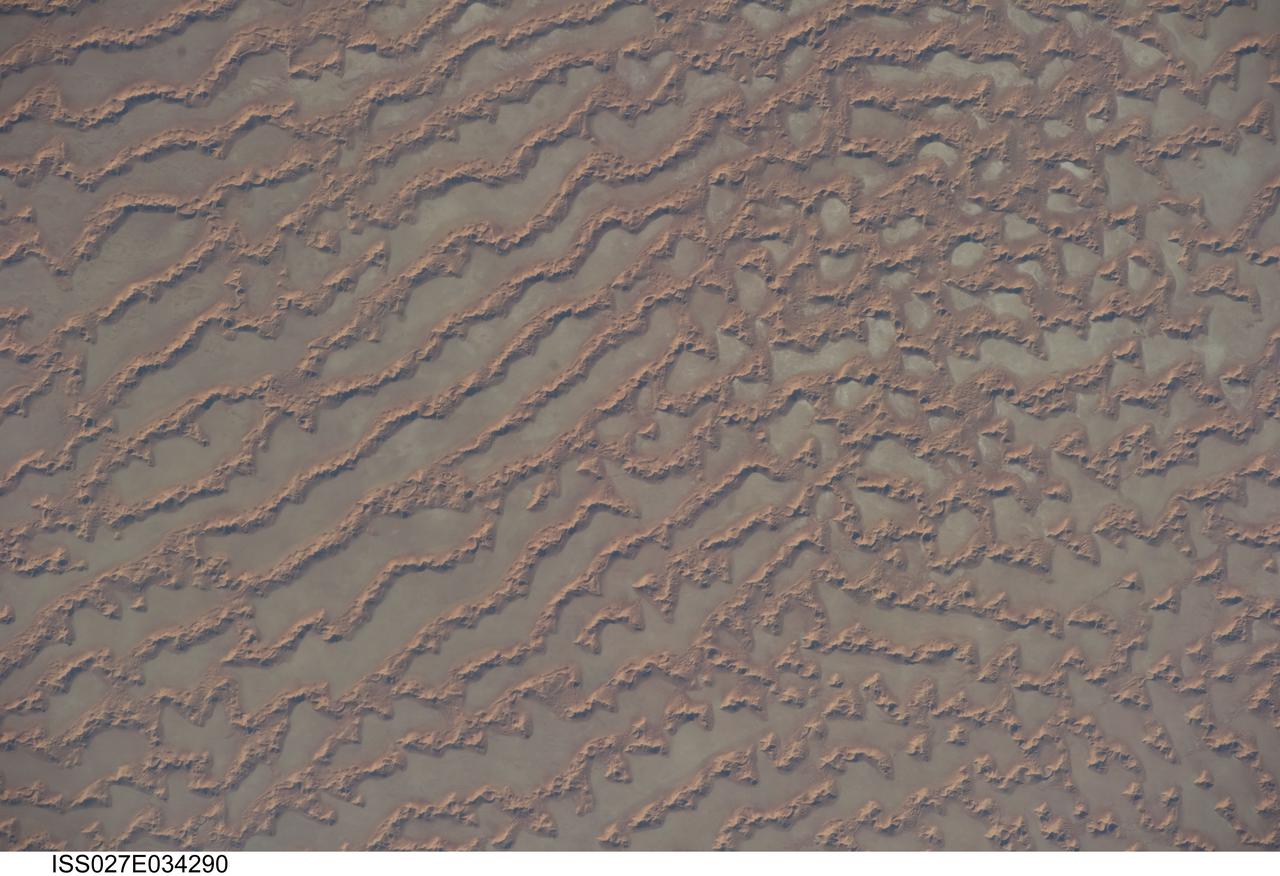
ISS027-E-034290 (16 May 2011) --- Ar Rub al Khali Sand Sea, Arabian Peninsula is featured in this image photographed by an Expedition 27 crew member on the International Space Station. The Ar Rub al Khali, also known as the “Empty Quarter”, is a large region of sand dunes and interdune flats known as a sand sea (or erg). This photograph highlights a part of the Ar Rub al Khali located close to its southeastern margin in the Sultanate of Oman. Reddish-brown, large linear sand dunes alternate with blue-gray interdune salt flats known as sabkhas at left. The major trend of the linear dunes is transverse to northwesterly trade winds that originate in Iraq (known as the Shamal winds). Formation of secondary barchan (crescent-shaped) and star dunes (dune crests in several directions originating from a single point, looking somewhat like a starfish from above) on the linear dunes is supported by southwesterly winds that occur during the monsoon season (Kharif winds). The long linear dunes begin to break up into isolated large star dunes to the northeast and east (right). This is likely a result of both wind pattern interactions and changes in the sand supply to the dunes. The Empty Quarter covers much of the south-central portion of the Arabian Peninsula, and with an area of approximately 660,000 square kilometers it is the largest continuous sand desert on Earth. The Empty Quarter is so called as the dominantly hyperarid climate and difficulty of travel through the dunes has not encouraged permanent settlement within the region. There is geological and archeological evidence to support cooler and wetter past climates in the region together with human settlement. This evidence includes exposed lakebed sediments, scattered stone tools, and the fossils of hippopotamus, water buffalo, and long-horned cattle.
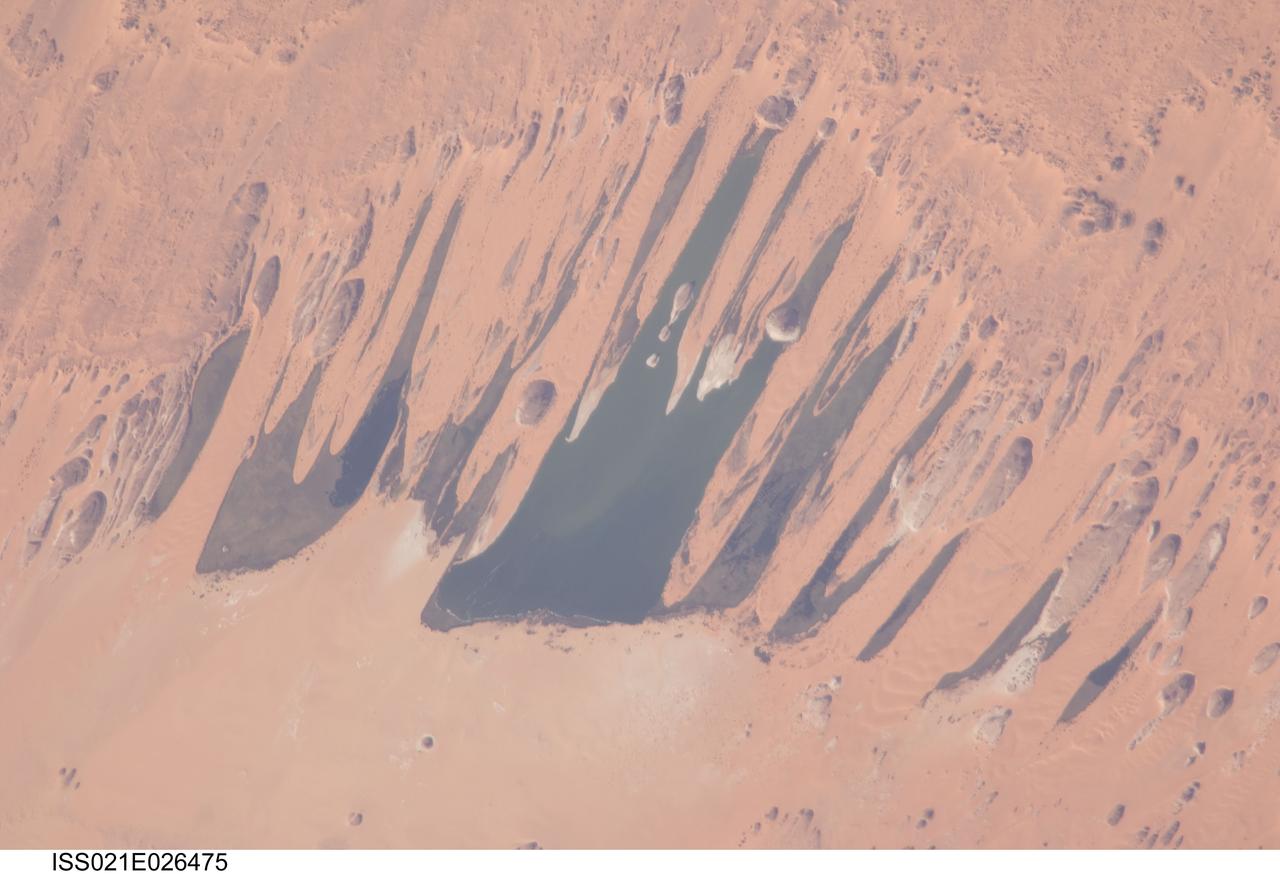
ISS021-E-026475 (14 Nov. 2009) --- Ounianga Lakes in the Sahara Desert, in the nation of Chad are featured in this image photographed by an Expedition 21 crew member on the International Space Station. This view features one of the largest of a series of ten, mostly fresh water lakes in the Ounianga basin in the heart of the Sahara Desert of northeastern Chad. According to scientists, the lakes are the remnant of a single large lake, probably tens of kilometers long that once occupied this remote area approximately 14,800 to 5,500 years ago. As the climate dried out during the subsequent millennia, the lake was reduced in size and large wind-driven sand dunes invaded the original depression dividing it into several smaller basins. The area shown in this image measures approximately 11 x 9 kilometers, with the dark water surfaces of the lake segregated almost completely by orange linear sand dunes that stream into the depression from the northeast. The almost year-round northeast winds and cloudless skies make for very high evaporation (an evaporation rate of greater than six meters per year has been measured in one of the nearby lakes). Despite this, only one of the ten lakes is saline. According to scientists, the reason for the apparent paradox of fresh water lakes in the heart of the desert lies in the fact that fresh water from a very large aquifer reaches the surface in the Ounianga depression in the form of the lakes. The aquifer is large enough to keep supplying the small lakes with water despite the high evaporation rate. Mats of floating reeds also reduce the evaporation in places. The lakes form a hydrological system that is unique in the Sahara Desert. Scientists believe the aquifer was charged with fresh water, and the large original lake evolved, during the so-called African Humid Period (approximately 14,800 to 5,500 years ago) when the West African summer monsoon was stronger than it is today. Associated southerly winds brought Atlantic moisture well north of modern limits, producing sufficient rainfall in the central Sahara to foster an almost complete savanna vegetation cover. Pollen data from lake sediments of the original 50-meters-deep Ounianga Lake suggests to scientists that a mild tropical climate with a wooded grassland savanna existed in the region. This vegetation association is now only encountered 300 kilometers further south. Ferns grew in the stream floodplains which must have been occasionally flooded. Even shrubs that now occur only on the very high, cool summits (greater than 2,900 meters, greater than 9,500 feet) of the Tibesti Mts. have been found in the Ounianga lake sediments.

NASA image acquired August 4, 2010 Though many areas in northwest Pakistan were bracing for heavy rain and additional flash flooding on August 4, 2010, the city of Kheshgi, in northwest Pakistan, had clear skies. This image, taken by the Advanced Spaceborne Thermal Emission and Reflection Radiometer (ASTER) on NASA’s Terra satellite reveals a city awash in flood water. Thick with mud, the Kabul River is pale green in this false color image. Clearer water is dark blue. The river flows through its usual channel, but in places, water seeps over the channel and across the landscape. The buildings and roads of Kheshgi are silver. Spots of turquoise blue—shallow, muddy water or water-logged ground—covers several sections of the city. On the south side of the Kabul River, water flows down the hills, washing over neighborhoods. The bare ground in the hills is brown and tan. Plant-covered land, red in this image, is divided into long, narrow rectangles, pointing to agriculture. Geometric shapes under the water near the river are probably submerged fields of crops. Thousands of acres of crops had been lost in floods throughout Pakistan, said the United Nations. Kheshgi is in the Nowshera district in the Khyber Pakhutnkhwa province. As of August 2, Khyber Pakhutnkhwa was the hardest hit province in Pakistan, said the United Nations, and Nowshera was the most impacted district in the province. Nowshera reported 500,000 people displaced with 161 dead, said the Government of Khuber Pakhtunkhwa. The floods affected communities throughout Pakistan. More than 1,100 people had died, 15,000 homes were damaged or destroyed, and at least one million people were in need of emergency assistance throughout Pakistan, said the United Nations on August 2. The floods occurred as unusually heavy monsoon rains fell over Pakistan. NASA image courtesy NASA/GSFC/MITI/ERSDAC/JAROS, and U.S./Japan ASTER Science Team. Caption by Holli Riebeek. Instrument: Terra - ASTER Credit: <b><a href="#//earthobservatory.nasa.gov/" rel="nofollow"> NASA’s Earth Observatory</a></b> To learn more about this image go here: <a href="http://earthobservatory.nasa.gov/NaturalHazards/view.php?id=45050" rel="nofollow">earthobservatory.nasa.gov/NaturalHazards/view.php?id=45050</a> Or here: <a href="http://earthobservatory.nasa.gov/NaturalHazards/view.php?id=45343" rel="nofollow">earthobservatory.nasa.gov/NaturalHazards/view.php?id=45343</a> <b><a href="http://www.nasa.gov/centers/goddard/home/index.html" rel="nofollow">NASA Goddard Space Flight Center</a></b> is home to the nation's largest organization of combined scientists, engineers and technologists that build spacecraft, instruments and new technology to study the Earth, the sun, our solar system, and the universe. <b>Follow us on <a href="http://twitter.com/NASA_GoddardPix" rel="nofollow">Twitter</a></b> <b>Join us on <a href="http://www.facebook.com/pages/Greenbelt-MD/NASA-Goddard/395013845897?ref=tsd" rel="nofollow">Facebook</a></b>
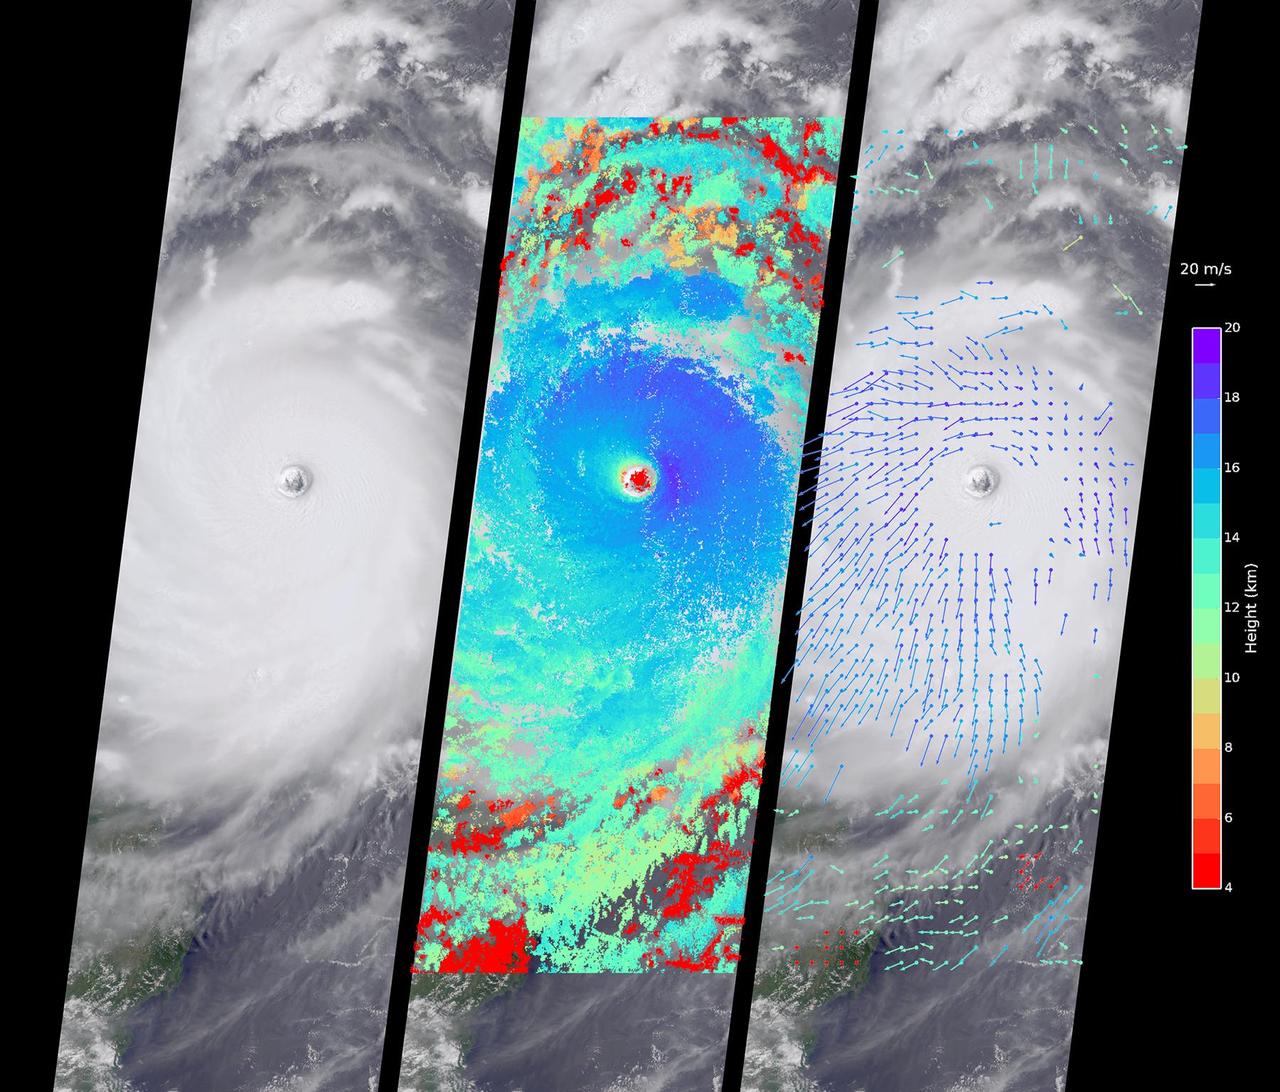
Typhoon Nepartak, the first large typhoon in the northwest Pacific this season, is currently taking aim at the east coast of Taiwan. Over the past few days, Nepartak has rapidly gained strength, growing from a tropical storm to the equivalent of a Category 5 hurricane with sustained wind speeds of more than 160 miles (258 kilometers) per hour. Taiwan's Central Weather Bureau has issued a torrential rain warning, bracing for likely flooding as 5 to 15 inches (13 to 38 centimeters) of rain are expected to fall over Taiwan during the storm's passage. Waves of up to 40 feet (12 meters) are predicted on the coast as the typhoon approaches, and air and train travel have been severely impacted. The typhoon is currently moving at about 10 miles per hour (16 kilometers) to the west-northwest, and is predicted to pass over Taiwan within the next day and then hit the coast of mainland China. Central and eastern China are poorly situated to absorb the rainfall from Nepartak after suffering the effects of severe monsoon flooding, which has killed at least 140 people in the past week. The Multi-angle Imaging SpectroRadiometer (MISR) instrument aboard NASA's Terra satellite captured this view of Typhoon Nepartak on July 7, 2016, at 10:30 a.m. local time (2:30 a.m. UTC). On the left is an image from the nadir (vertical pointing) camera, which shows the central portion of Nepartak and the storm's eye. The image is about 235 miles (378 kilometers) across. The island of Manila in the Philippines, about 250 miles (400 kilometers) south of Taiwan, is visible to the southwest of the eye. The image shows that Nepartak's center is extremely compact, rather than broken up into spiral bands as is more typical of typhoons. This means that the storm may retain more of its strength as it passes over land. MISR uses nine cameras to capture images of the typhoon from different angles. This provides a stereographic view, which can be used to determine the height of the storm's cloud tops. These heights are plotted in the middle panel, superimposed on the image. This shows that the cloud tops are relatively low, about 2.5 miles (4 kilometers), in the eye, but much higher, up to 12.5 miles (20 kilometers), just outside it. By tracking the motion of clouds as they are viewed by each of the nine cameras over about seven minutes, it is possible to also derive how fast the clouds are moving due to wind. These wind vectors are superimposed on the image in the right panel. The length of each arrow shows the wind speed at that location (compare to the 45 miles per hour or 20 meters per second arrow in the legend), and the color shows the height at which the wind is being computed. The motion of the low-level winds (red and yellow arrows) is counterclockwise, while the motion of the high winds (blue and purple arrows) is mostly clockwise. This is because hurricanes draw in warm, moist air at low altitudes, which then flows upward around the eye, releases its moisture as rain, and moves outward at high altitudes. As is typical of these types of storm systems, the inflowing low winds and the outflowing high winds spin in different directions. http://photojournal.jpl.nasa.gov/catalog/PIA20719