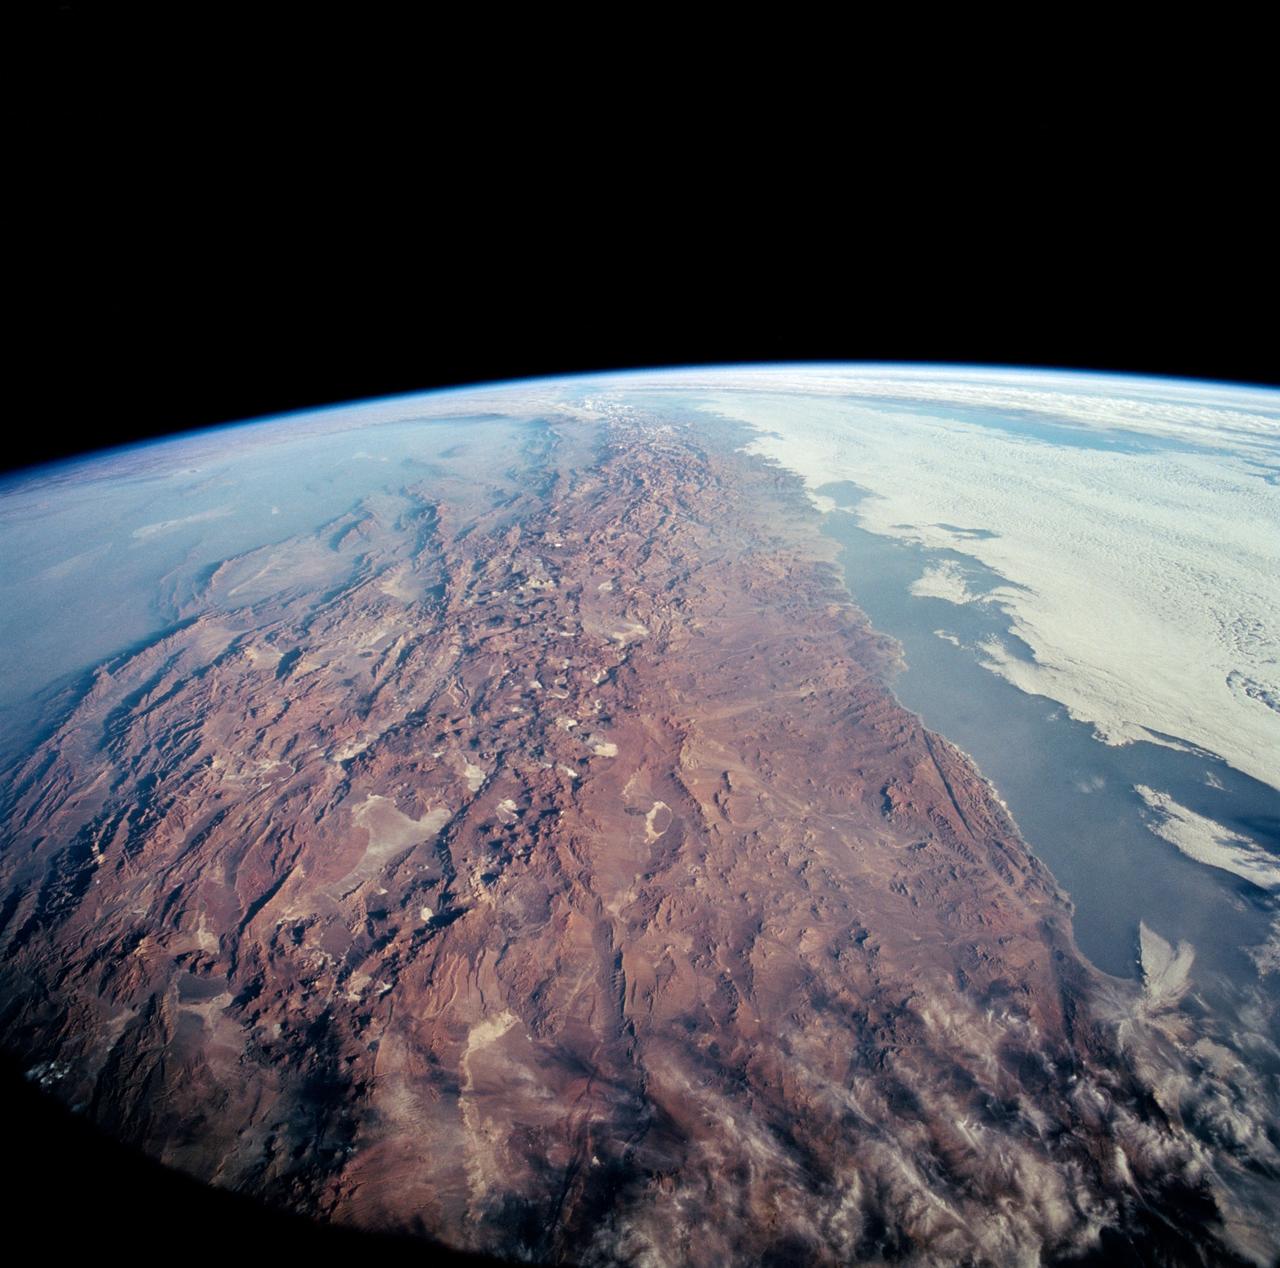
STS-65 Earth observation taken aboard Columbia, Orbiter Vehicle (OV) 102, shows Northern Chile and the Andes Mountains. This color photograph is a panoramic (southern view) that features Chile and the Andes Mountains of South America. The Atacama Desert, one of the driest regions on Earth, is clearly visible along the Chilean coast. In the near left foreground is the Salar de Arizaro. Salar Punta Negra in the center foreground appears to be partially filled with water. On the right side of the view, a coastal plateau rises from the Pacific Ocean and meets the Andes Mountains that appear as a backbone running north to south along the border of Chile and Argentina. In the distant left portion of the view can be seen the hazy Chaco Plains and Pampas.
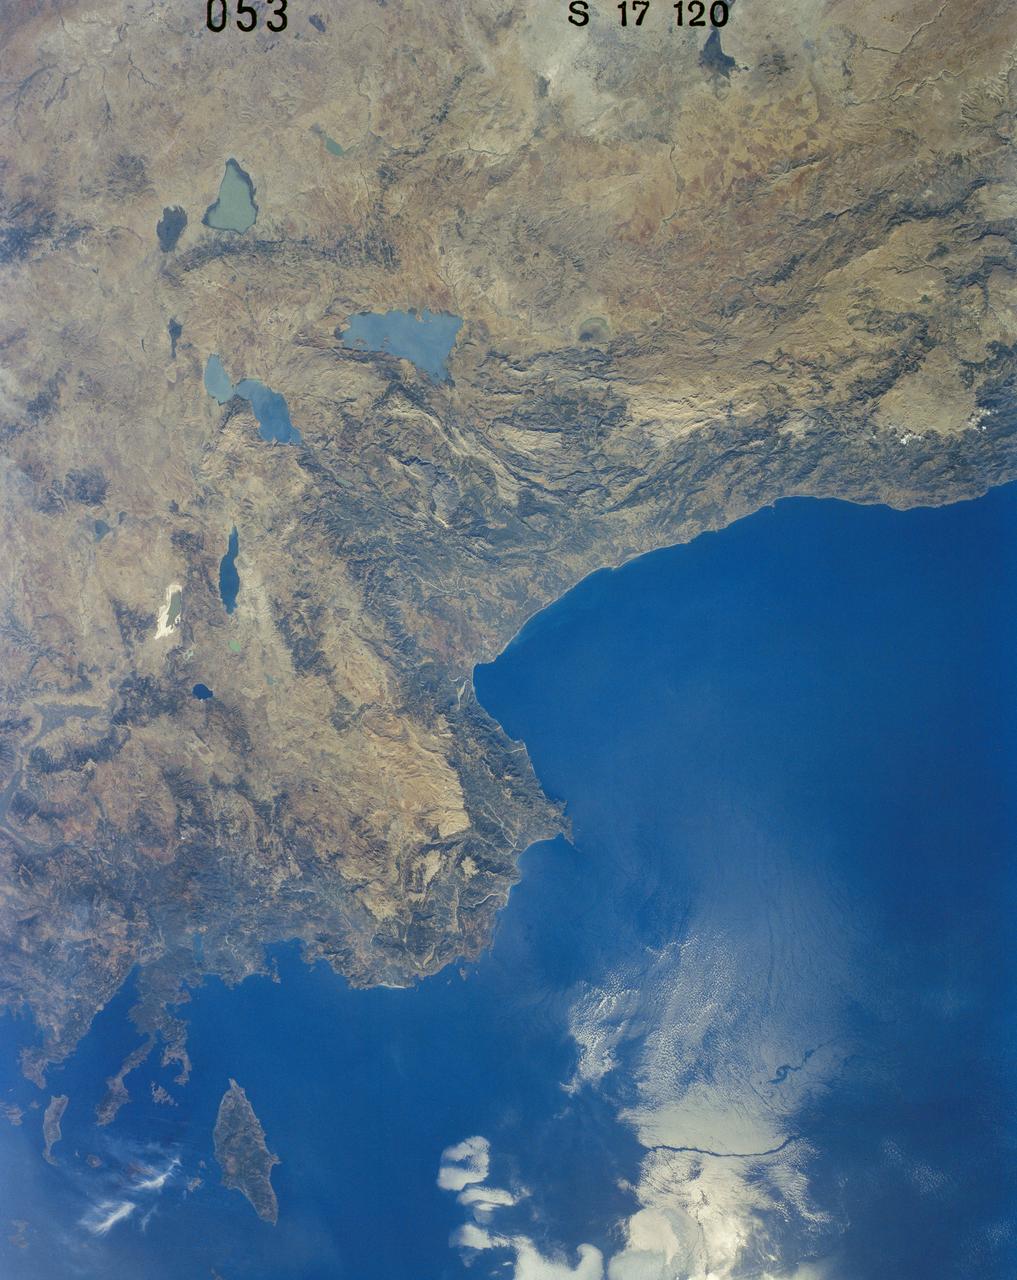
41G-120-053 (5-13 Oct. 1984) --- Turkey and a portion of the Mediterranean Sea, with the city of Antalya visible, were photographed with a medium format camera during the 41-G mission aboard the space shuttle Challenger. Numerous eddies and an ocean front can be observed in the sun's glint off the water's surface. The folded mountains indicate the rugged topography in this region. Photo credit: NASA
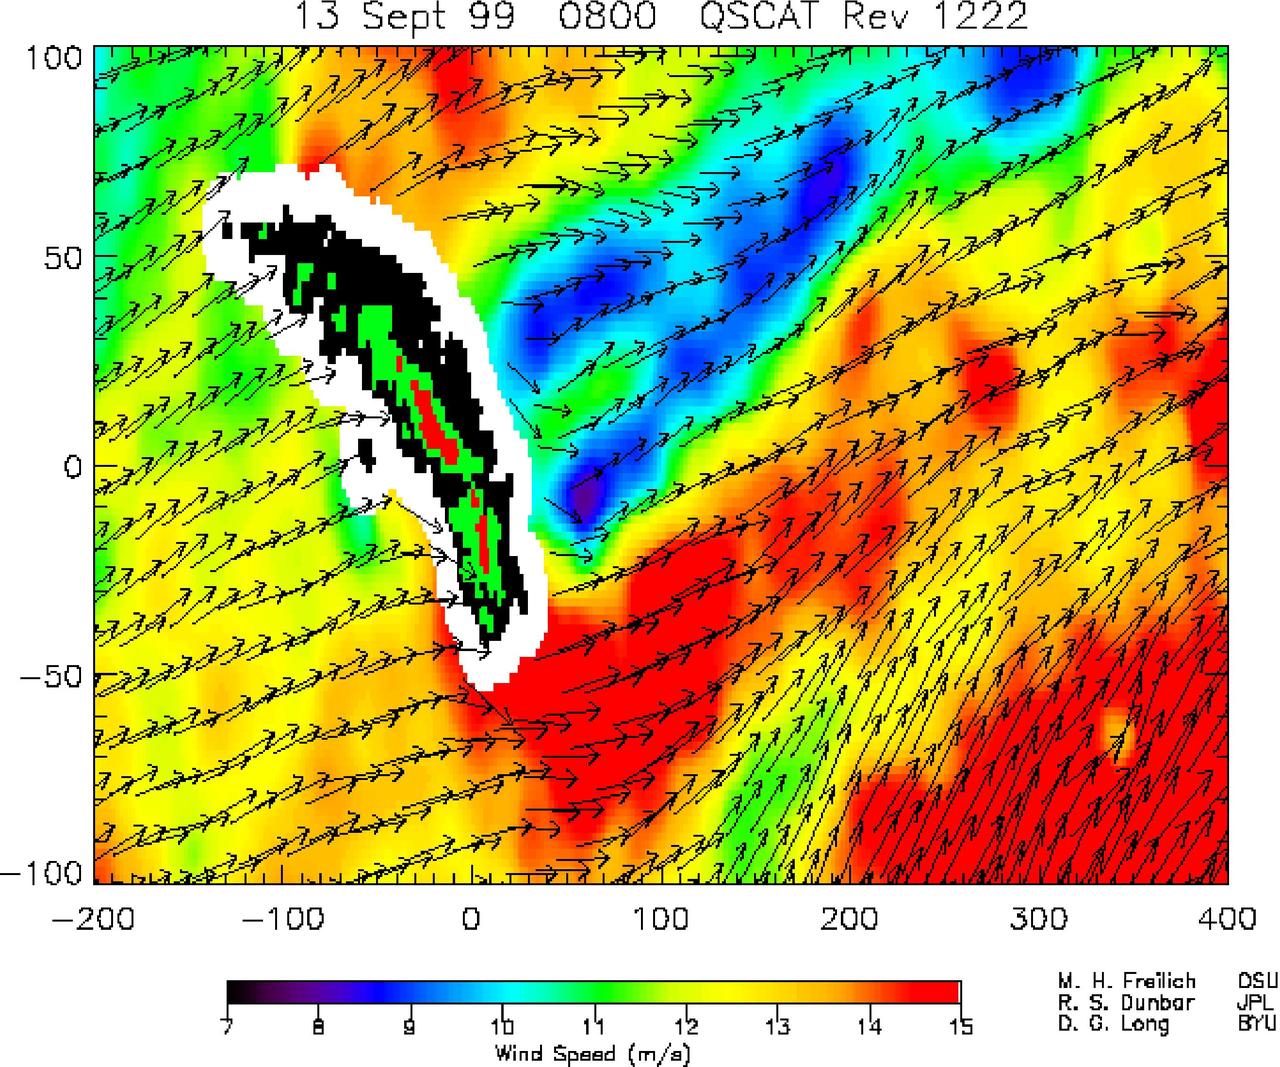
NASA SeaWinds instrument on the QuikScat satellite shows winds are blocked by an island mountain barrier on South Georgia Island, in the South Atlantic Ocean in the year 2000.
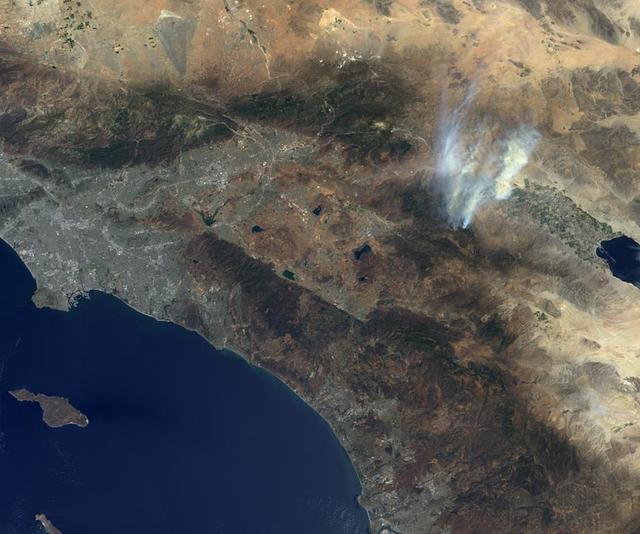
NASA Terra spacecraft passed over the Mountain Fire near Idyllwild, Calif., on Jul. 17, 2013. Los Angeles and the Pacific Ocean can been seen to the left and the Salton Sea is the dark feature in the right center of the image.
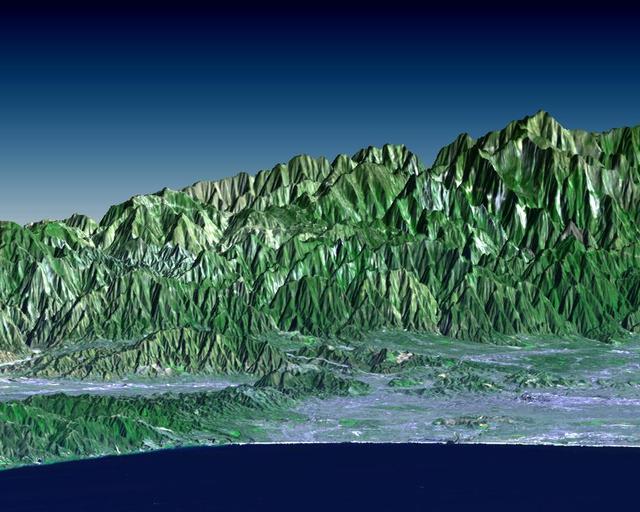
Los Angeles may be the world entertainment capital, but it is a difficult place to locate television and radio antennas. The metropolitan area spreads from the Pacific Ocean to upper and lower deserts, valleys, mountains, canyons and coastal plains.

This radar image of Ventura County, California, shows the Santa Clara River valley and the surrounding mountains. The river valley is the linear feature that extends from the lower right to the upper left, where it empties into the Pacific Ocean.
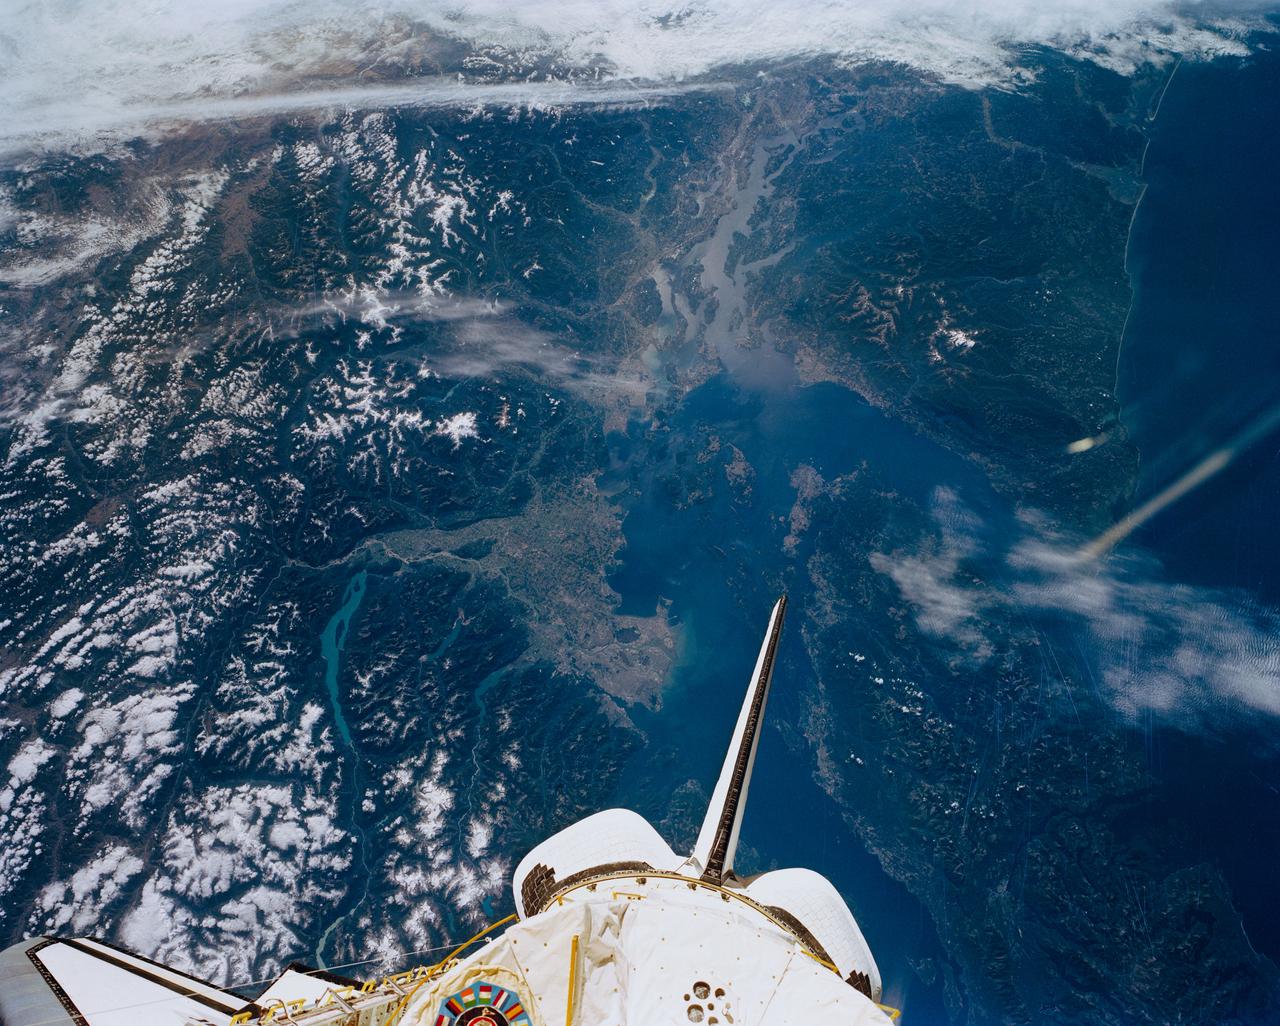
STS047-151-488 (12 - 20 Sept 1992) --- In this large format camera image, the forested Cascade Range appears along the left side; the Pacific Ocean, on the right. The frame was photographed as the Space Shuttle Endeavour flew north to south over Vancouver and Seattle. Many peaks in the Cascades reach altitudes greater than 9,000 feet and remain snowcapped even in mid-summer. The Strait of Juan de Fuca separates the Olympic Peninsula (top right) from Vancouver Island (bottom right). Snowcapped Mt. Olympus (7,965 feet) is one of the wettest places in the continental United States, with rainfall in excess of 120 inches per year. The port cities of Seattle and Tacoma occupy the heavily indented coastline of Puget Sound (top center). They appear as light-colored areas on the left side of the Sound. The angular street pattern of Tacoma is visible at the top of the picture. The international boundary between Canada and the United States of America runs across the middle of the view. The city of Victoria (center) is the light patch on the tip of Vancouver Island. Canada's Fraser River Delta provides flat topography on which the cities of Vancouver, Burnaby, and New Westminster were built. These cities appear as the light-colored area just left of center. The Fraser River can be seen snaking its way out of the mountains at the apex of the delta. Numerous ski resorts dot the slopes of the mountains (bottom left) that rise immediately to the north of Vancouver. In the same area the blue water of Harrison and other, smaller lakes fills some of the valleys that were excavated by glaciers in the "recent" geological past, according to NASA scientists studying the photography. A Linhof camera was used to expose the frame.
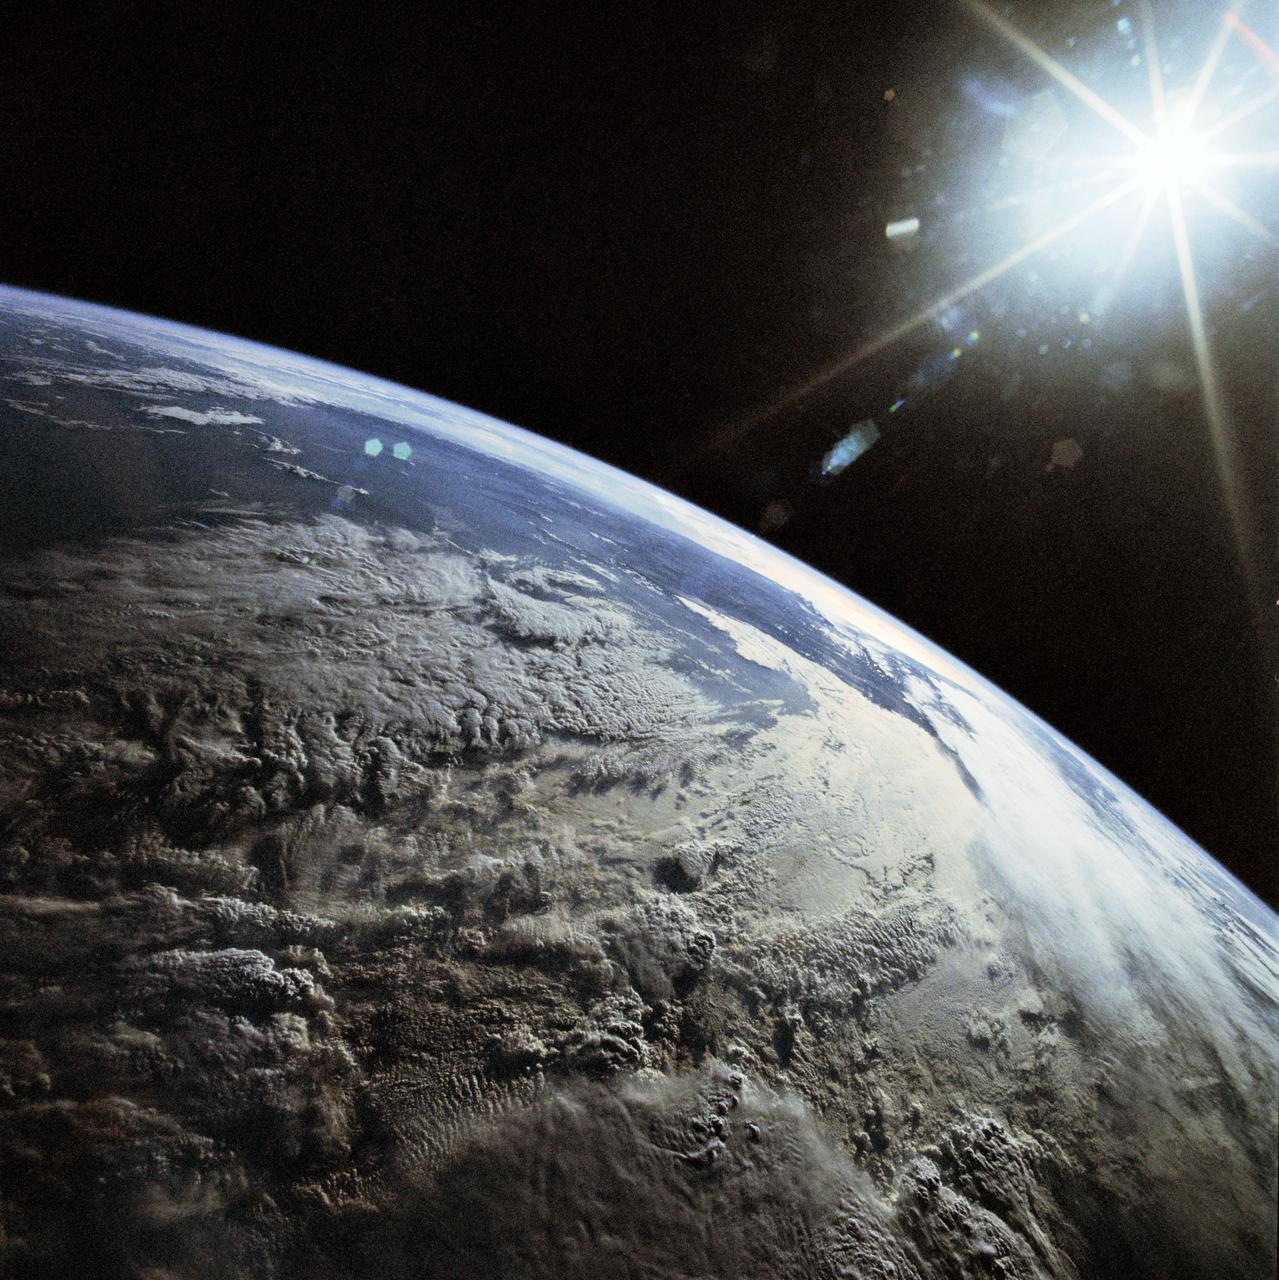
STS031-83-090 (24-29 April 1990) --- This late afternoon scene over the Andes Mountains features sun glare, heavy cloud illumination and sunglint against the Pacific Ocean. This photo was among those selected by the crew members for showing at their May 9, 1990, Post-Flight Press Conference (PFPC) at the Johnson Space Center (JSC) Public Affairs Office (PAO) Facility briefing room. Onboard the Space Shuttle Discovery for the flight, which lifted off on April 24, 1990, and landed on April 29, 1990, were astronauts Loren J. Shriver, Charles F. Bolden, Jr., Bruce McCandless II, Kathryn D. Sullivan and Steven A. Hawley. Some of the slides were not actually shown due to a shortage of time.
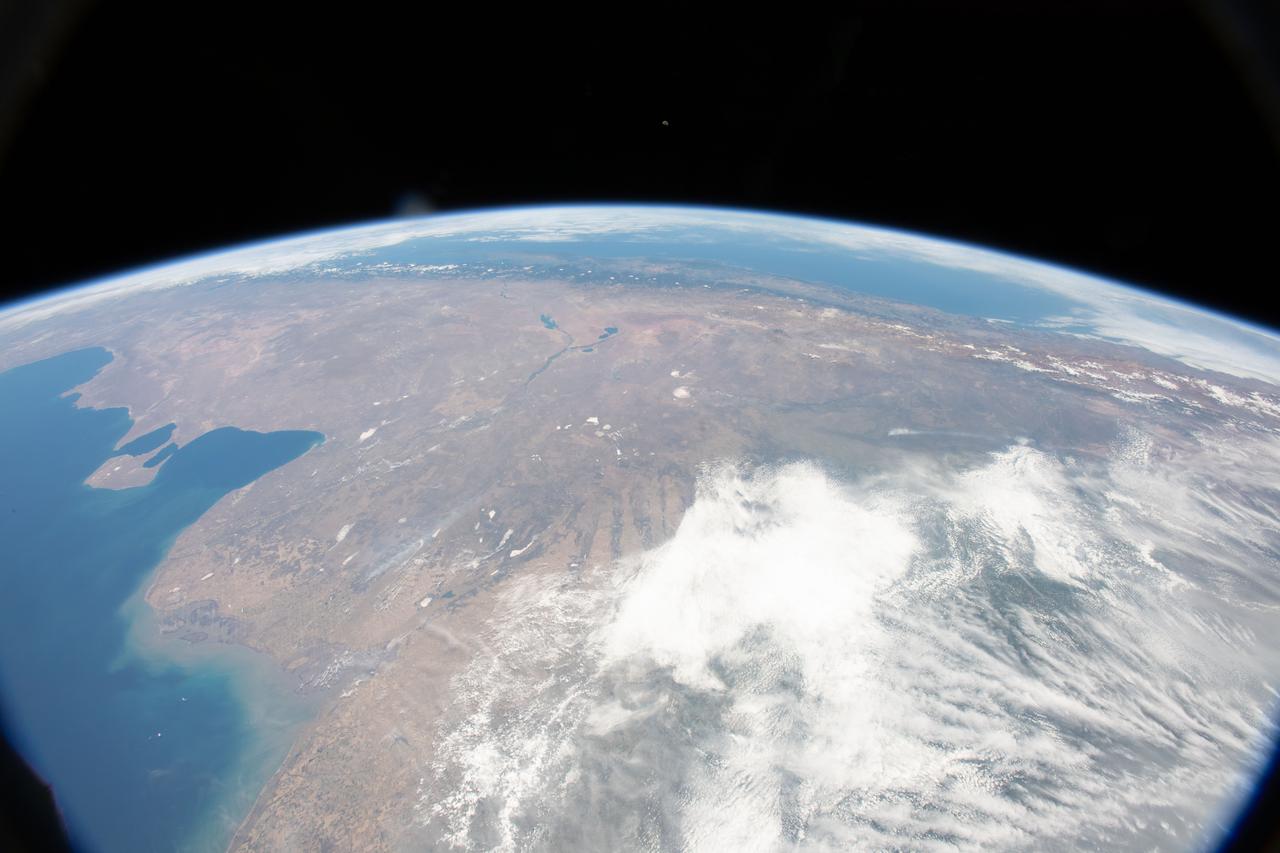
iss058e006004 (Jan. 26, 2019) --- This photograph of South America from bottom to top looks from the northeast coast of Argentina to southwest across Chile, the Andes mountains and the Pacific Ocean. The International Space Station was orbiting 259 miles above the Atlantic coast of the South American continent.
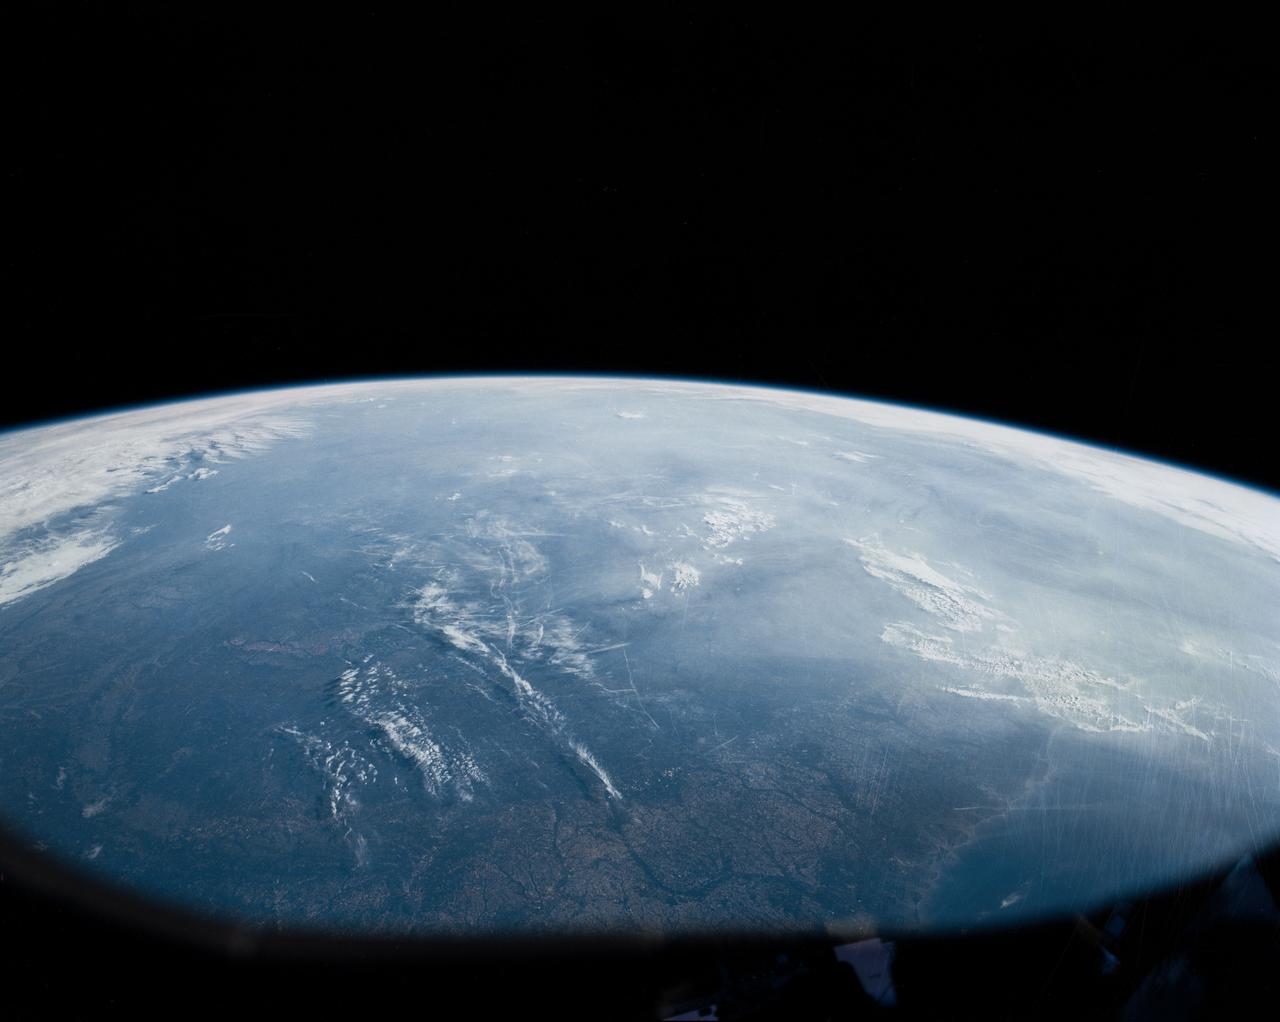
In this oblique view of the Georgia and South Carolina coast, the southern most Appalachians (32.0N, 83.0W) dominate the foreground. Contrails criss cross over Atlanta, a major airline hub. The coastal plain which wraps around the southern Appalachians, is well delineated. Faintly visible under the haze toward Earth's limb are the Great lakes (Lake Michigan near center), the folded belts of the central Appalachians and Long Island, New York.
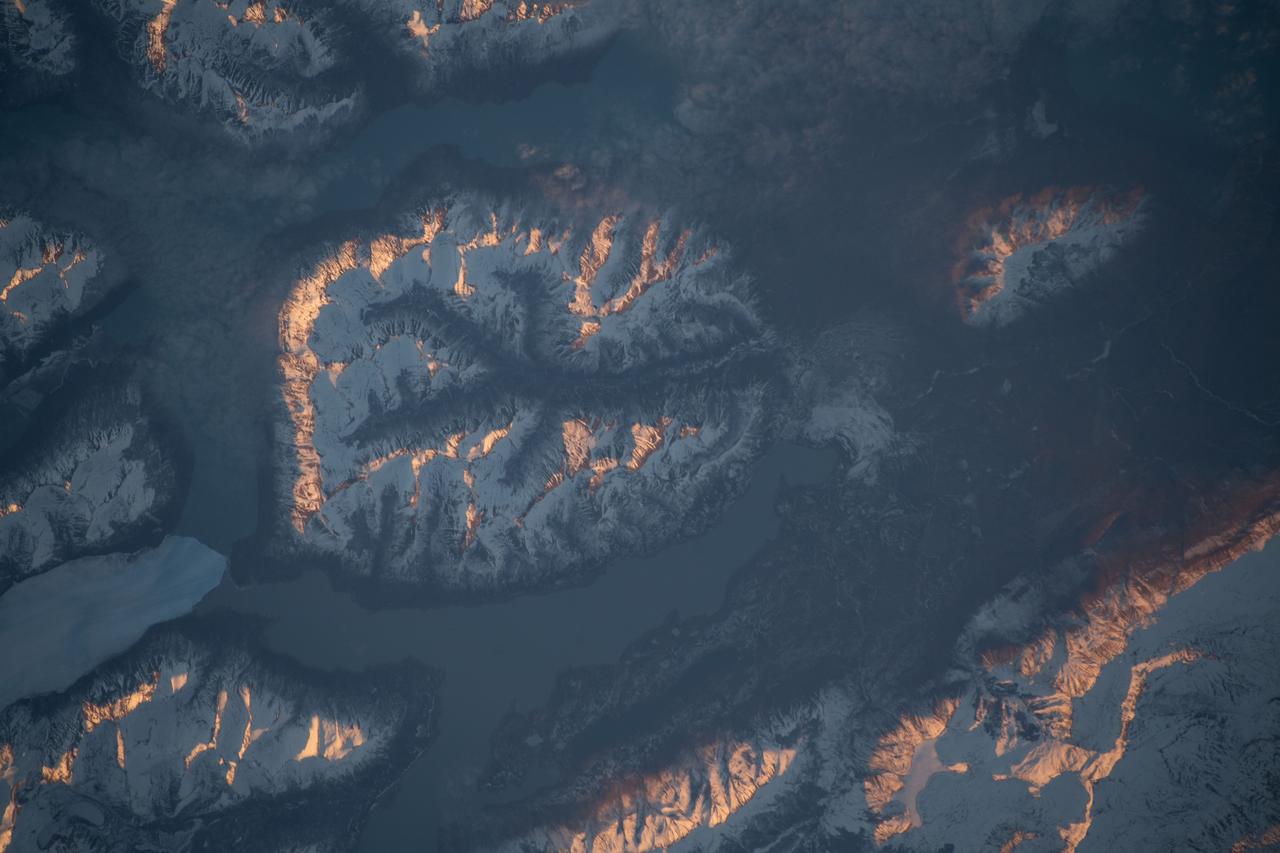
iss056e097055 (July 15, 2018) --- The mountainous and glacial Torres del Paine National Park in the southern-most part of Chile is pictured as the International Space Station began a quick orbital pass over the South American nation from the Pacific Ocean back out over the Atlantic Ocean.

iss068e051131 (Feb. 10, 2023) --- The snow-covered, mountainous southeast coast of Russia's Kamchatka Peninsula is pictured from the International Space Station as it orbited 265 miles above the Pacific Ocean.
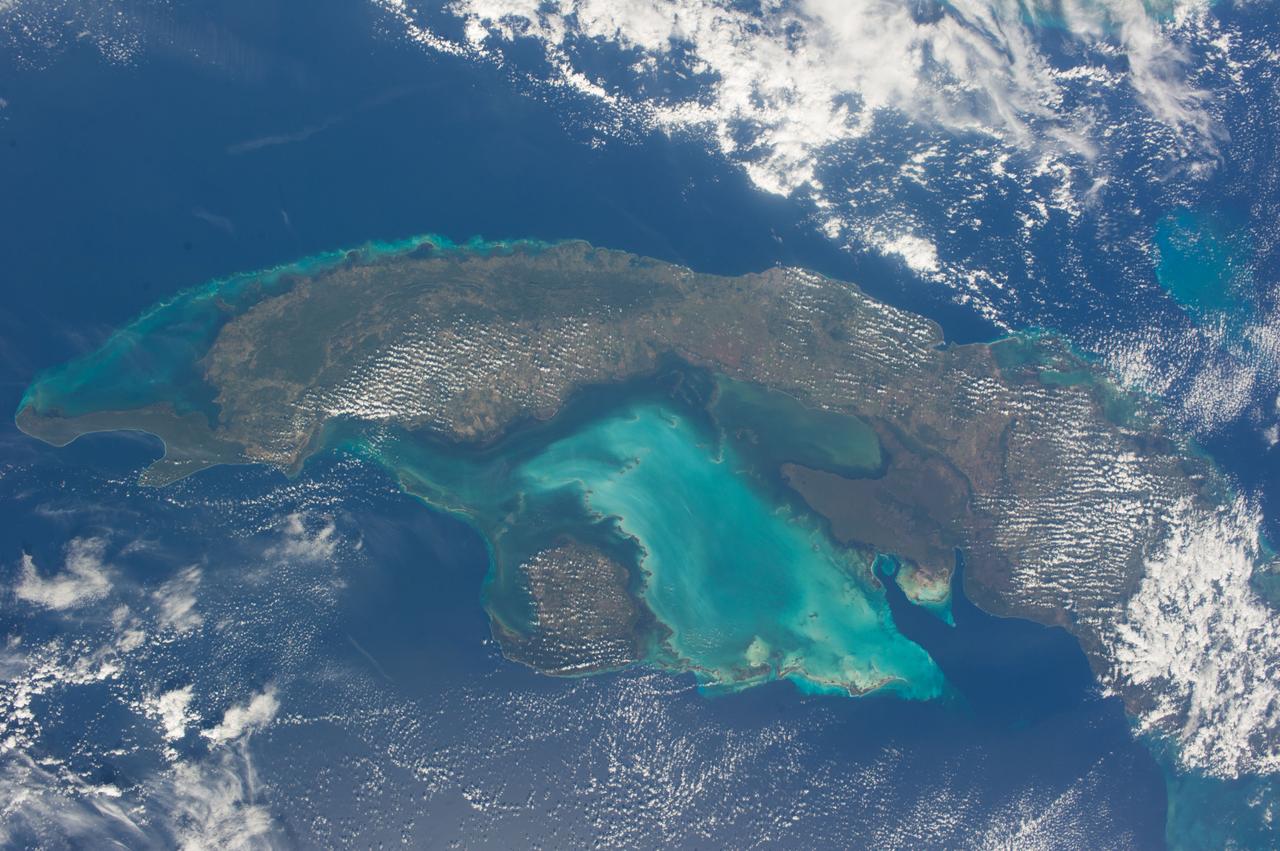
ISS038-E-021397 (24 Dec. 2013) --- The Caribbean country of Cuba is pictured in this nadir image, photographed by one of the Expedition 38 crew members aboard the International Space Station. (Note: North is at the top of the picture.) Cuba is an archipelago of islands in the northern Caribbean Sea at the confluence with the Gulf of Mexico and the Atlantic Ocean. In the southeast, the dark coastal area is home to the Sierra Maestra mountains. It is the highest mountain range on the island, with Pico Turquino reaching nearly 2000 meters. On the central southern coast of the island is the Sierra Del Escambray mountain range, including the 1160 meter-high Pico San Juan, Cuba's second highest peak.
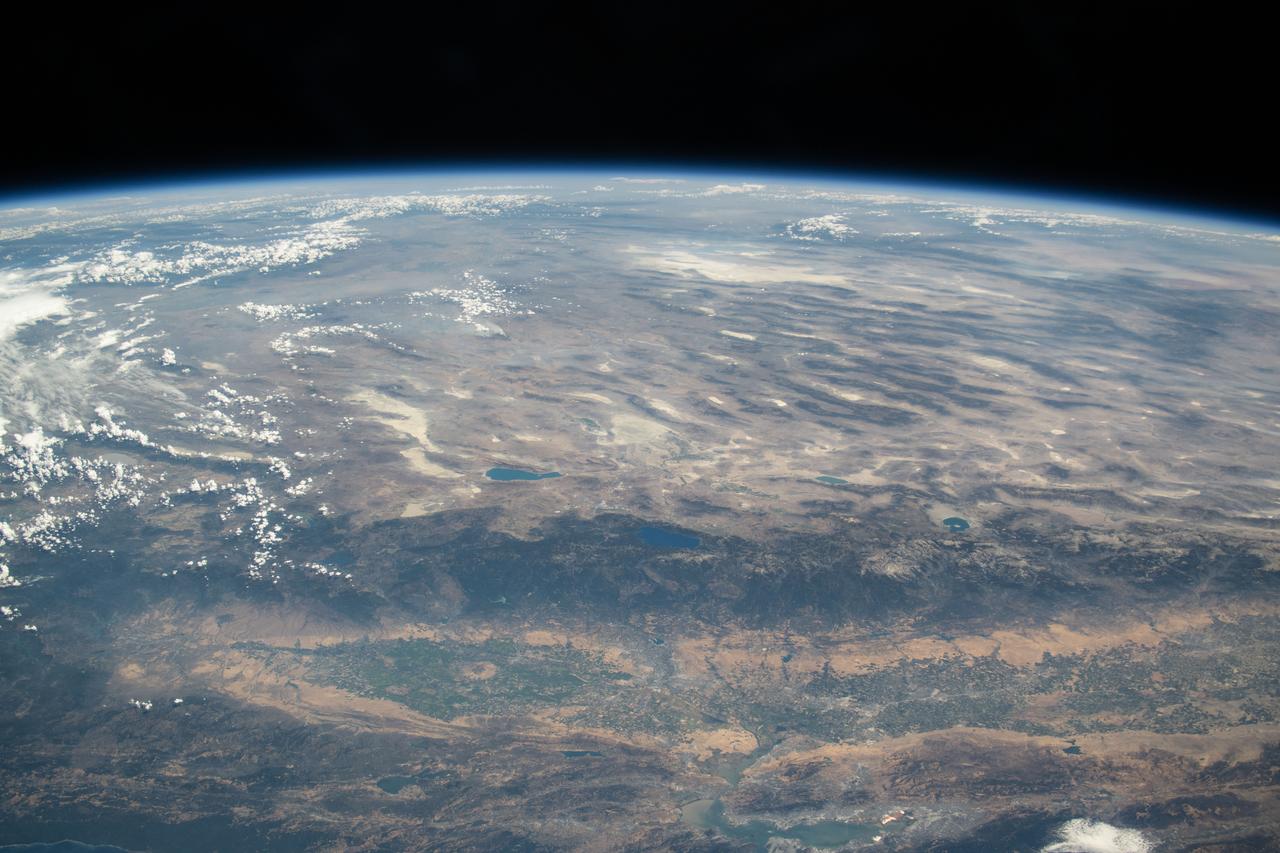
iss073e0420556 (Aug. 3, 2025) --- From bottom to top, or from west to east in this orientation, California's Central Valley extends across the bottom of this photograph and just above the San Francisco Bay Area. Past the Central Valley is the Sierra Nevada mountain range that leads into Nevada's Great Basin region and eastward toward the Rocky Mountains. The International Space Station was soaring 260 miles above the Pacific Ocean at the time of this photograph.
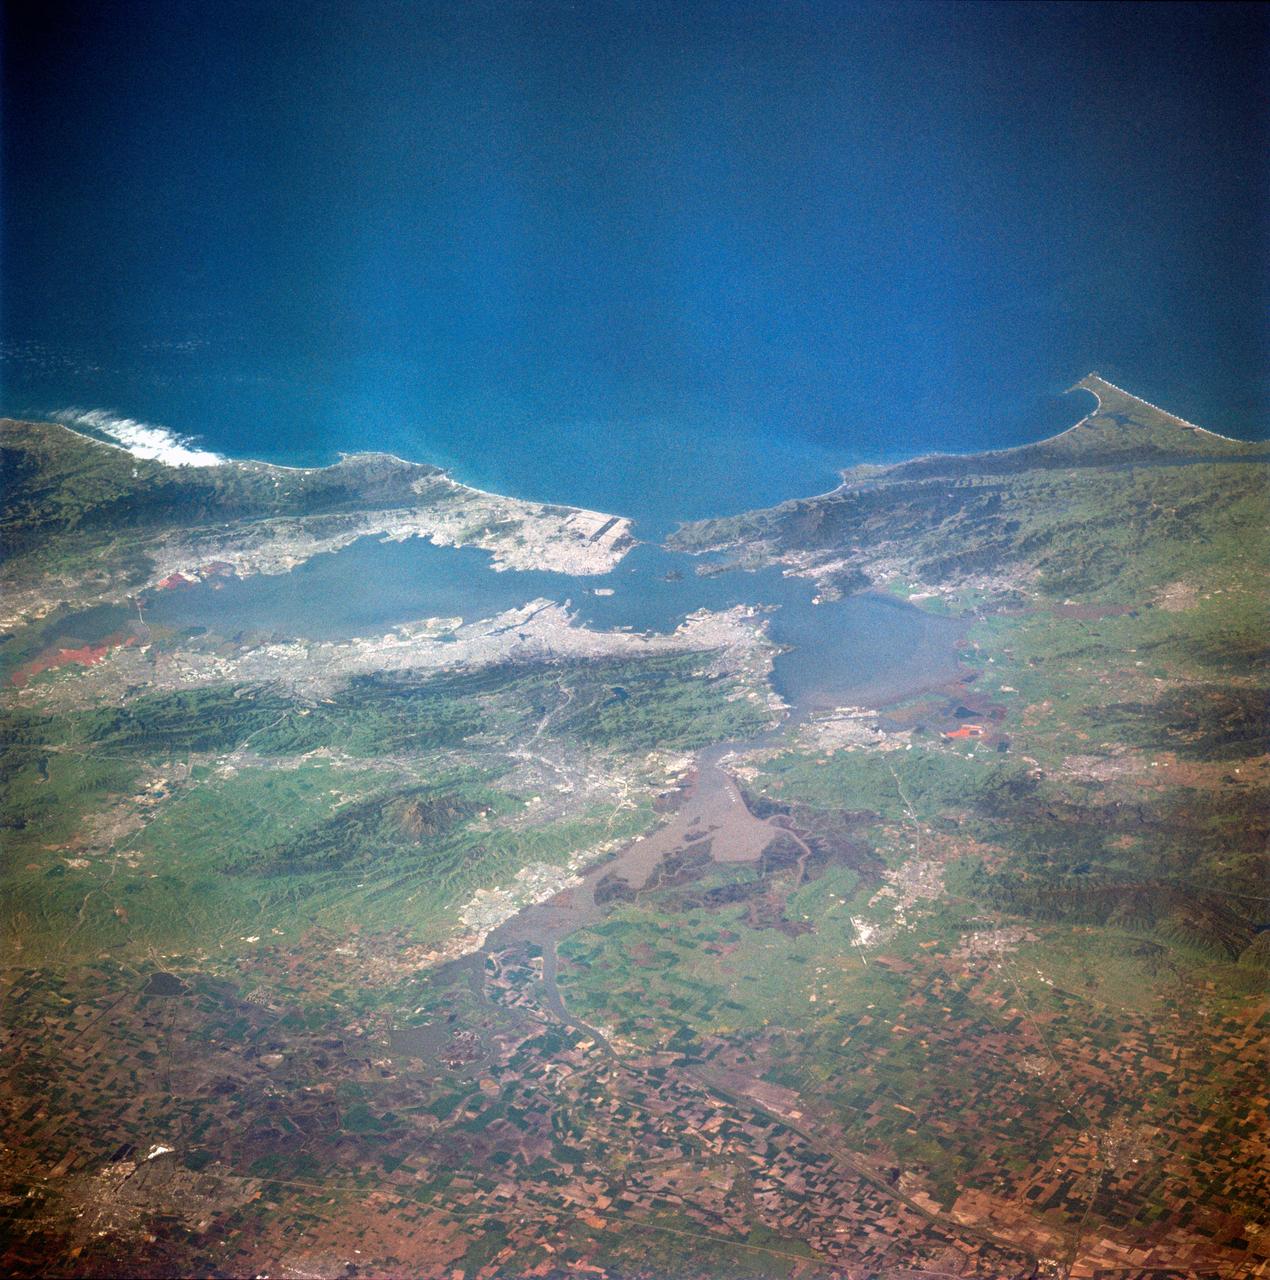
STS001-12-305 (12-14 April 1981) --- California, San Francisco Bay photographed by a crew member on the space shuttle Columbia (STS-1). The coast is seen from near Santa Cruz northward to Point Reyes. The great valley is in the foreground. Photo credit: NASA
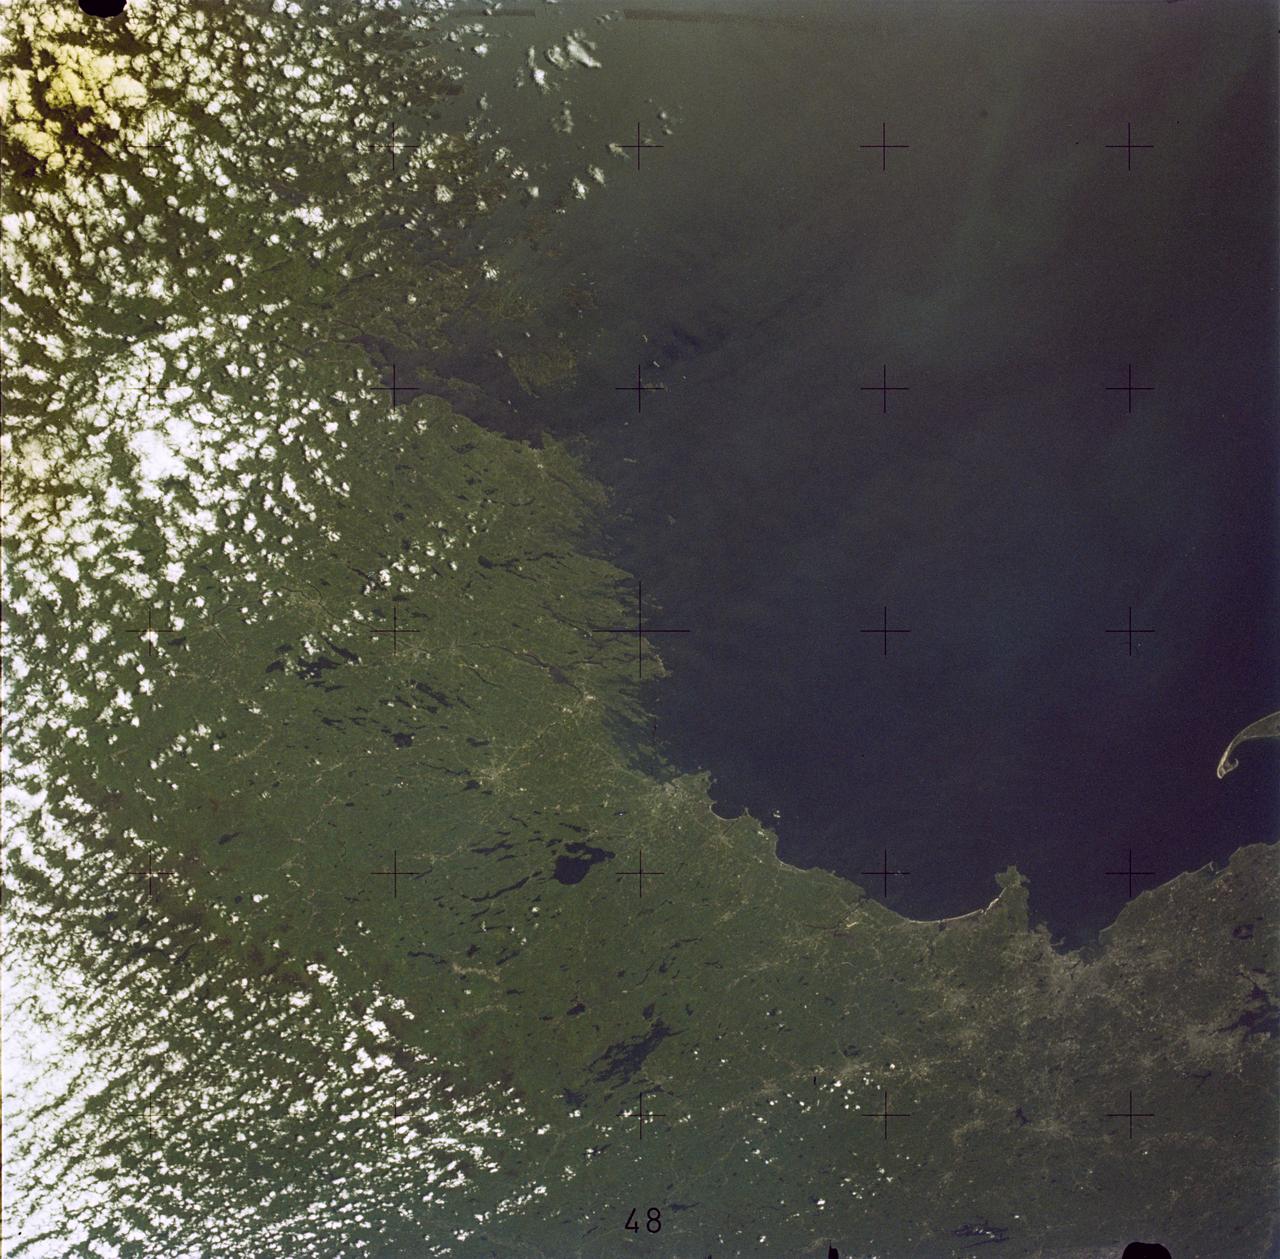
SL2-05-381 (22 June 1973) --- Boston, MA and the New England Coastline (43.5N, 84.0W) can be seen in this view. The typical rugged rocky coast of Maine is the result of heavy glacial action producing the rocky cliffs, jagged spurs of land and islands that characterize Main's Atlantic Coast. During the last Ice Age, extensive sediments were laid down producing a landscape of rolling hills with rocky outcrops. Photo credit: NASA
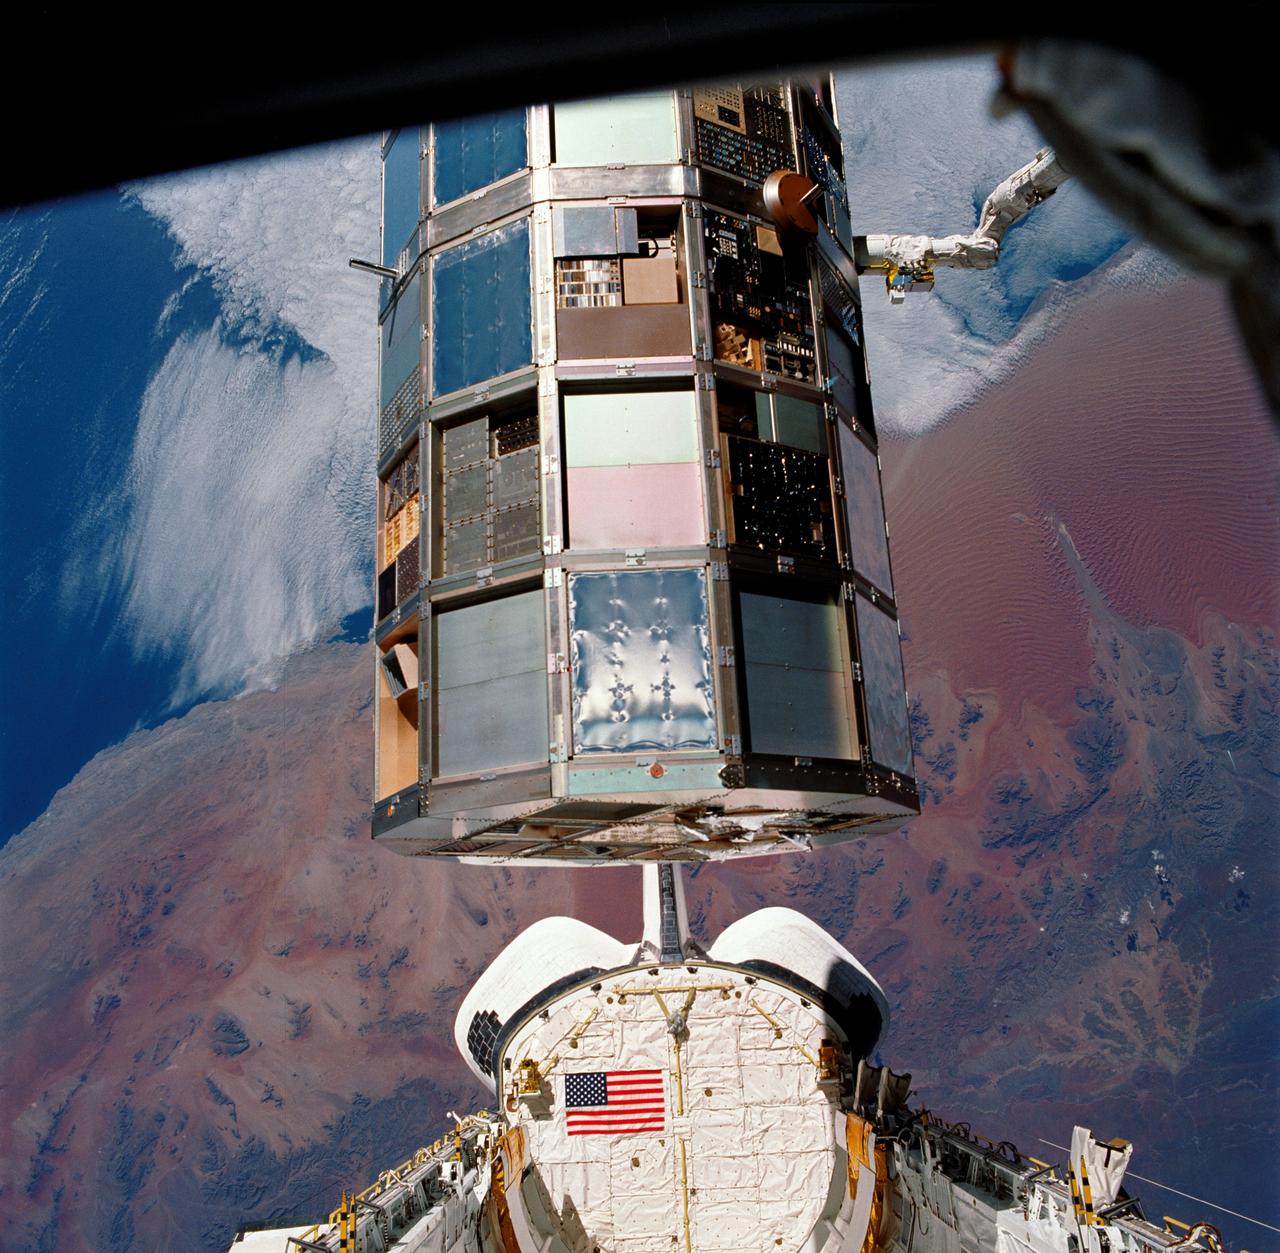
STS032-85-029 (12 Jan. 1990) --- (ORIENT PHOTO WITH COLUMBIA'S CARGO BAY IN LOWER CENTER). This 70mm frame was taken during a battery of documentary photographs of the recently-recaptured Long Duration Exposure Facility (LEDF). The Atlantic Coast of Namibia serves as a backdrop for the colorful scene. After five-and-one half years orbiting Earth, LDEF was retrieved by STS-32 crewmembers and brought back home at the end of the eleven-day mission for scientific observation. The bus-sized spacecraft was held in the grasp of Columbia's remote manipulator system (RMS) end effector during the survey.
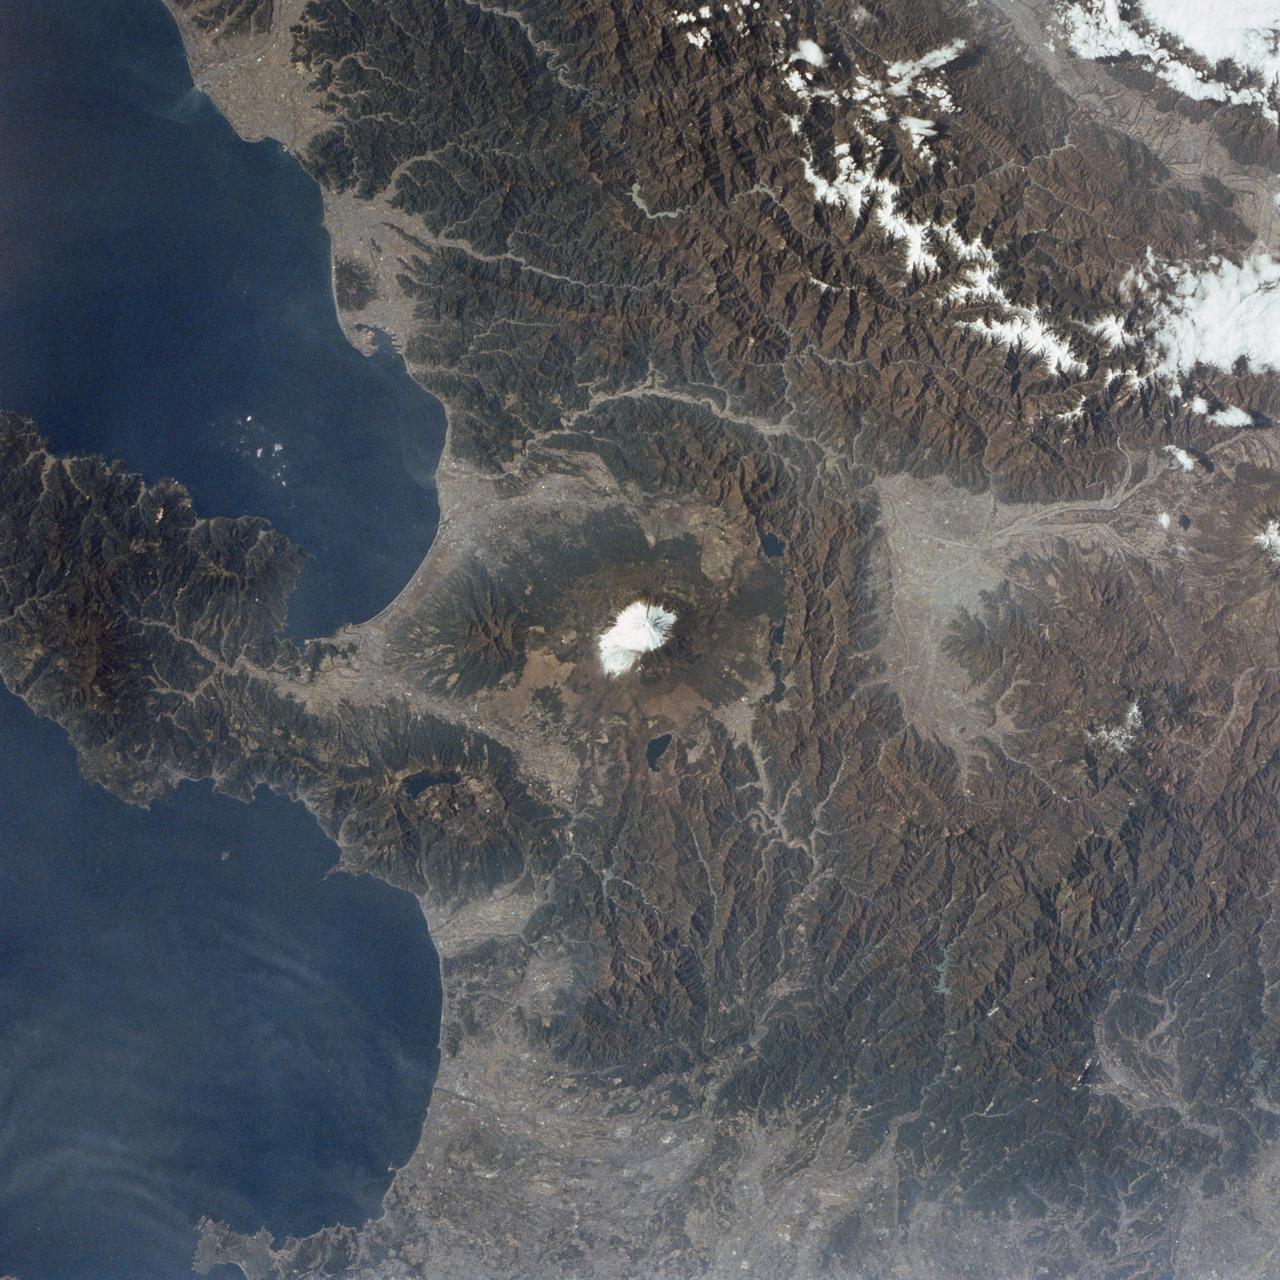
STS002-09-390 (12-14 Nov. 1981) --- Honshu Island, Japan, and its snow-covered Fuji-San or Fuji-Yama volcano are the features of this 70mm frame. The volcano peak is 12,400 feet tall. The western suburbs of Tokyo are at right edge of the photograph. Isu Peninsula is at the bottom, separating the Suruga and Sagami Bay. Other large cities include Yokohama, Kozu, Shizuoka, Namazu and Odawara. Photo credit: NASA
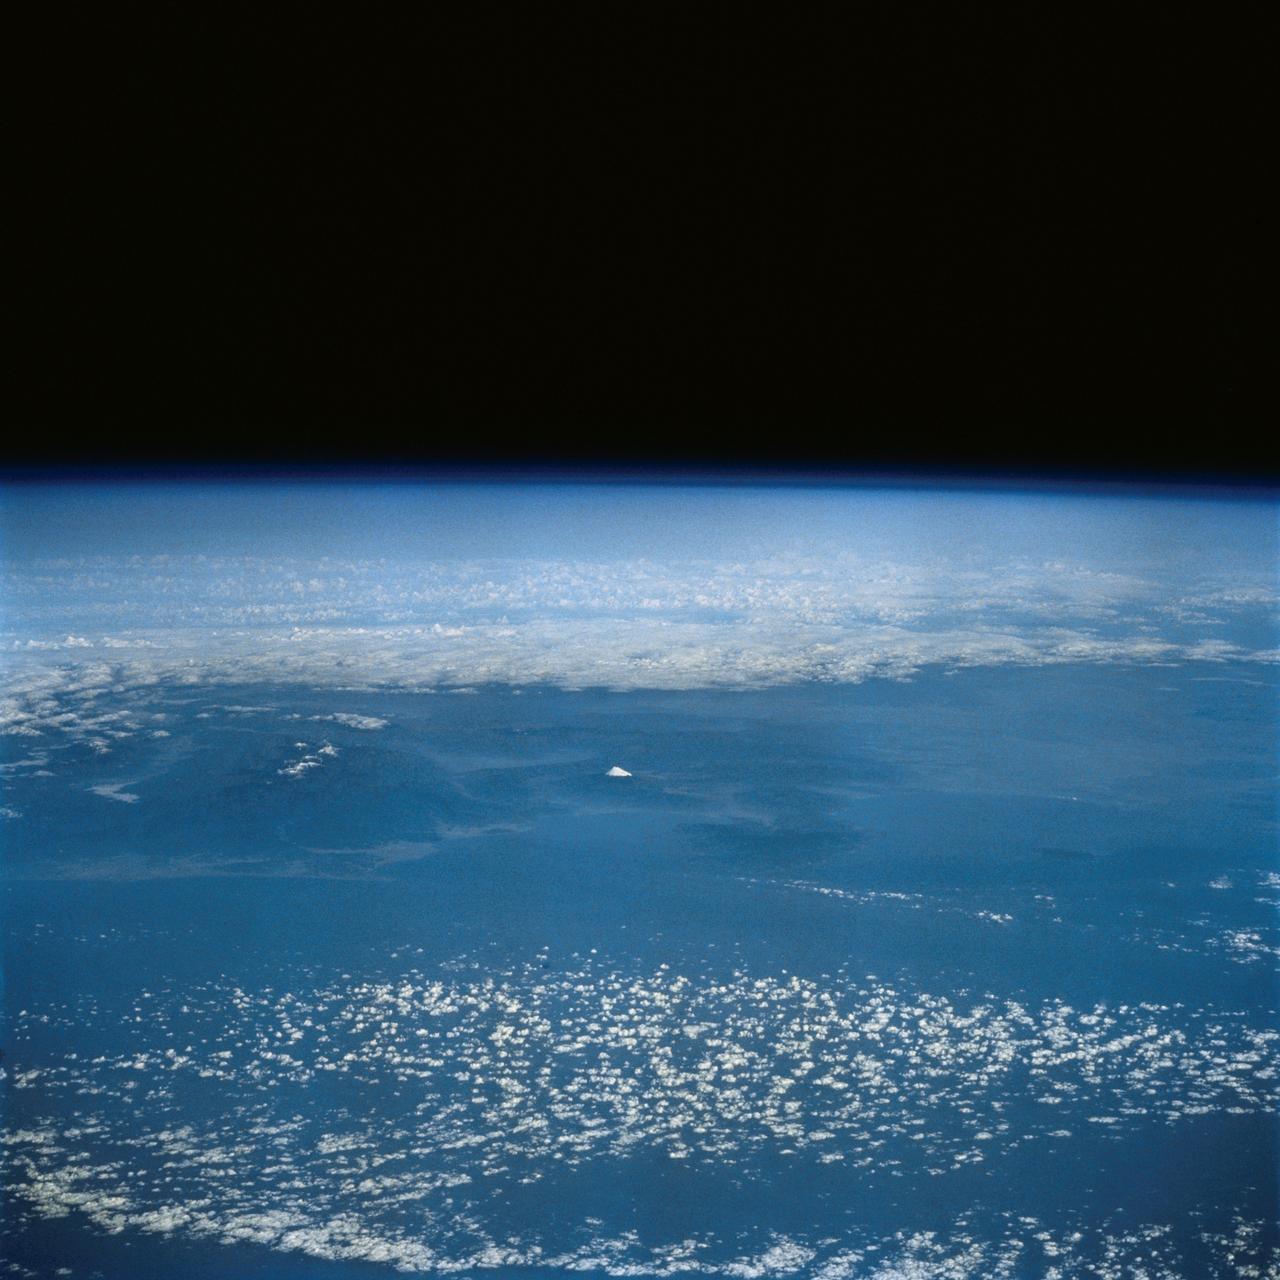
This distant view of Mt. Fuji, on the main home island of Honshu, Japan (34.0N, 139.0E) was taken from about 450 miles to the south. Evan at that great distance, the majestic and inspiring Mt. Fuji is still plainly visible and easily recognized as a world renowned symbol of Japan. The snow capped extinct volcano lies just a few miles south of Tokyo.
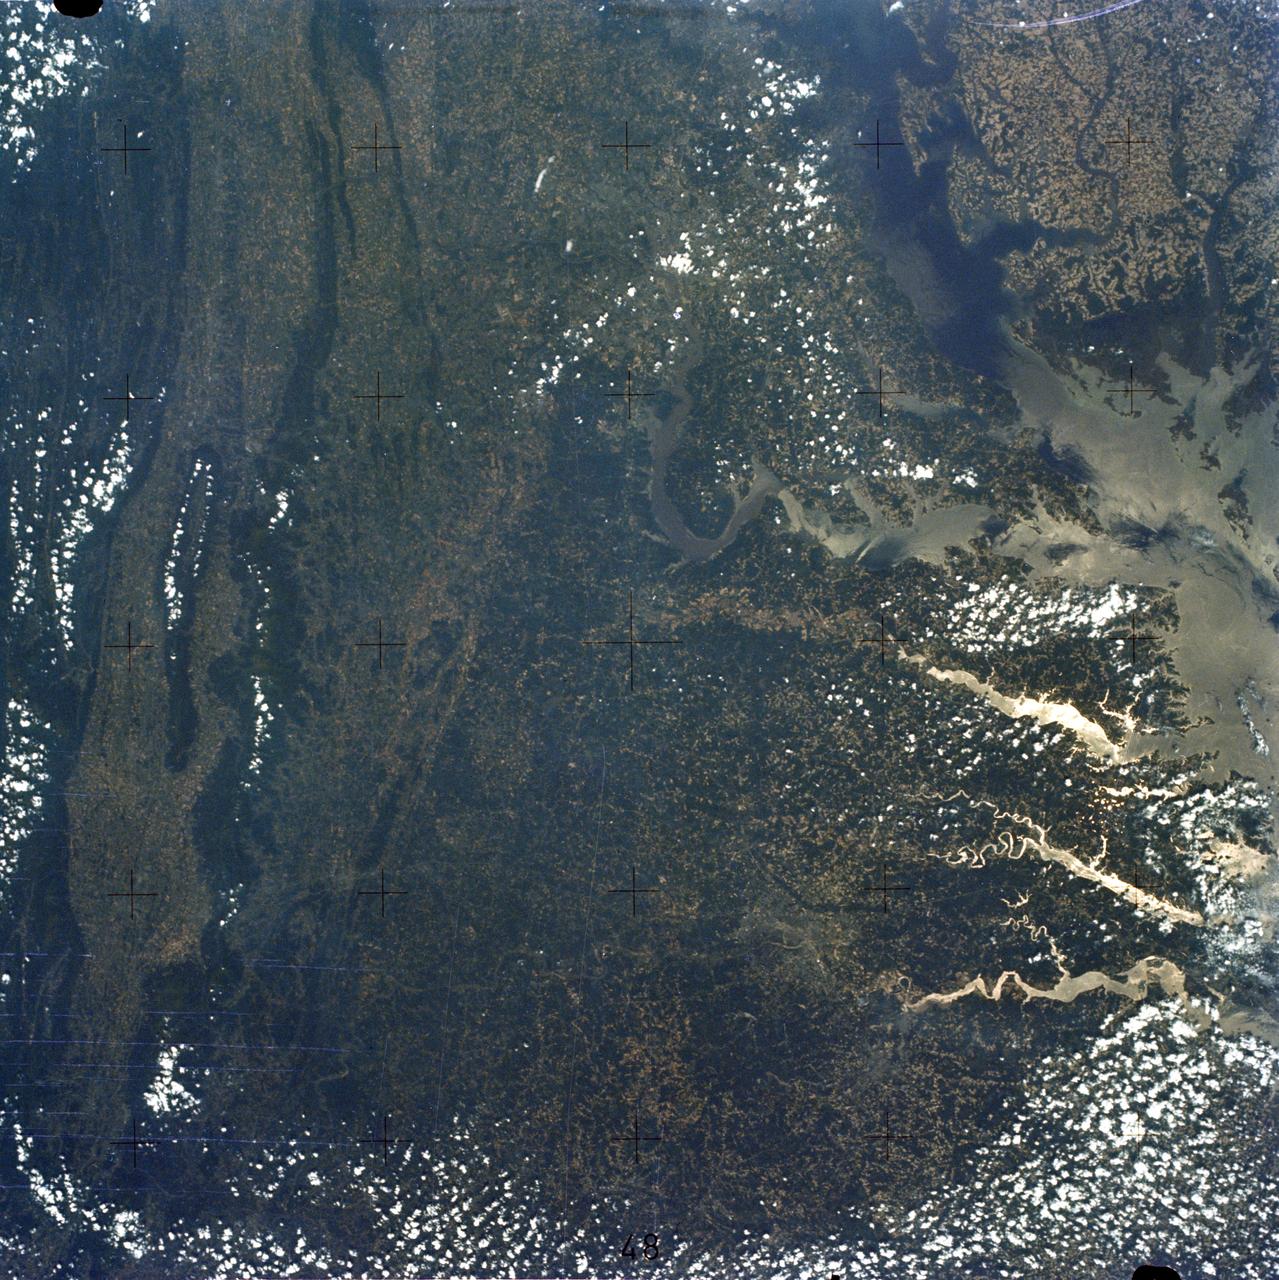
SL2-05-393 (22 June 1973) --- The nation's capital lies astride the Potomac River (38.5N, 77.5W) at the head of the Potomac Estuary. Baltimore, MD, also in the scene, is connected to Washington by the Baltimore-Washington Parkway. The suburbs of both cities tend to cluster around the Washington and Baltimore Beltways. Most of the countryside in the eastern two-thirds of this scene is either heavily forested or is in farming, dairy operations or poultry production. Photo credit: NASA
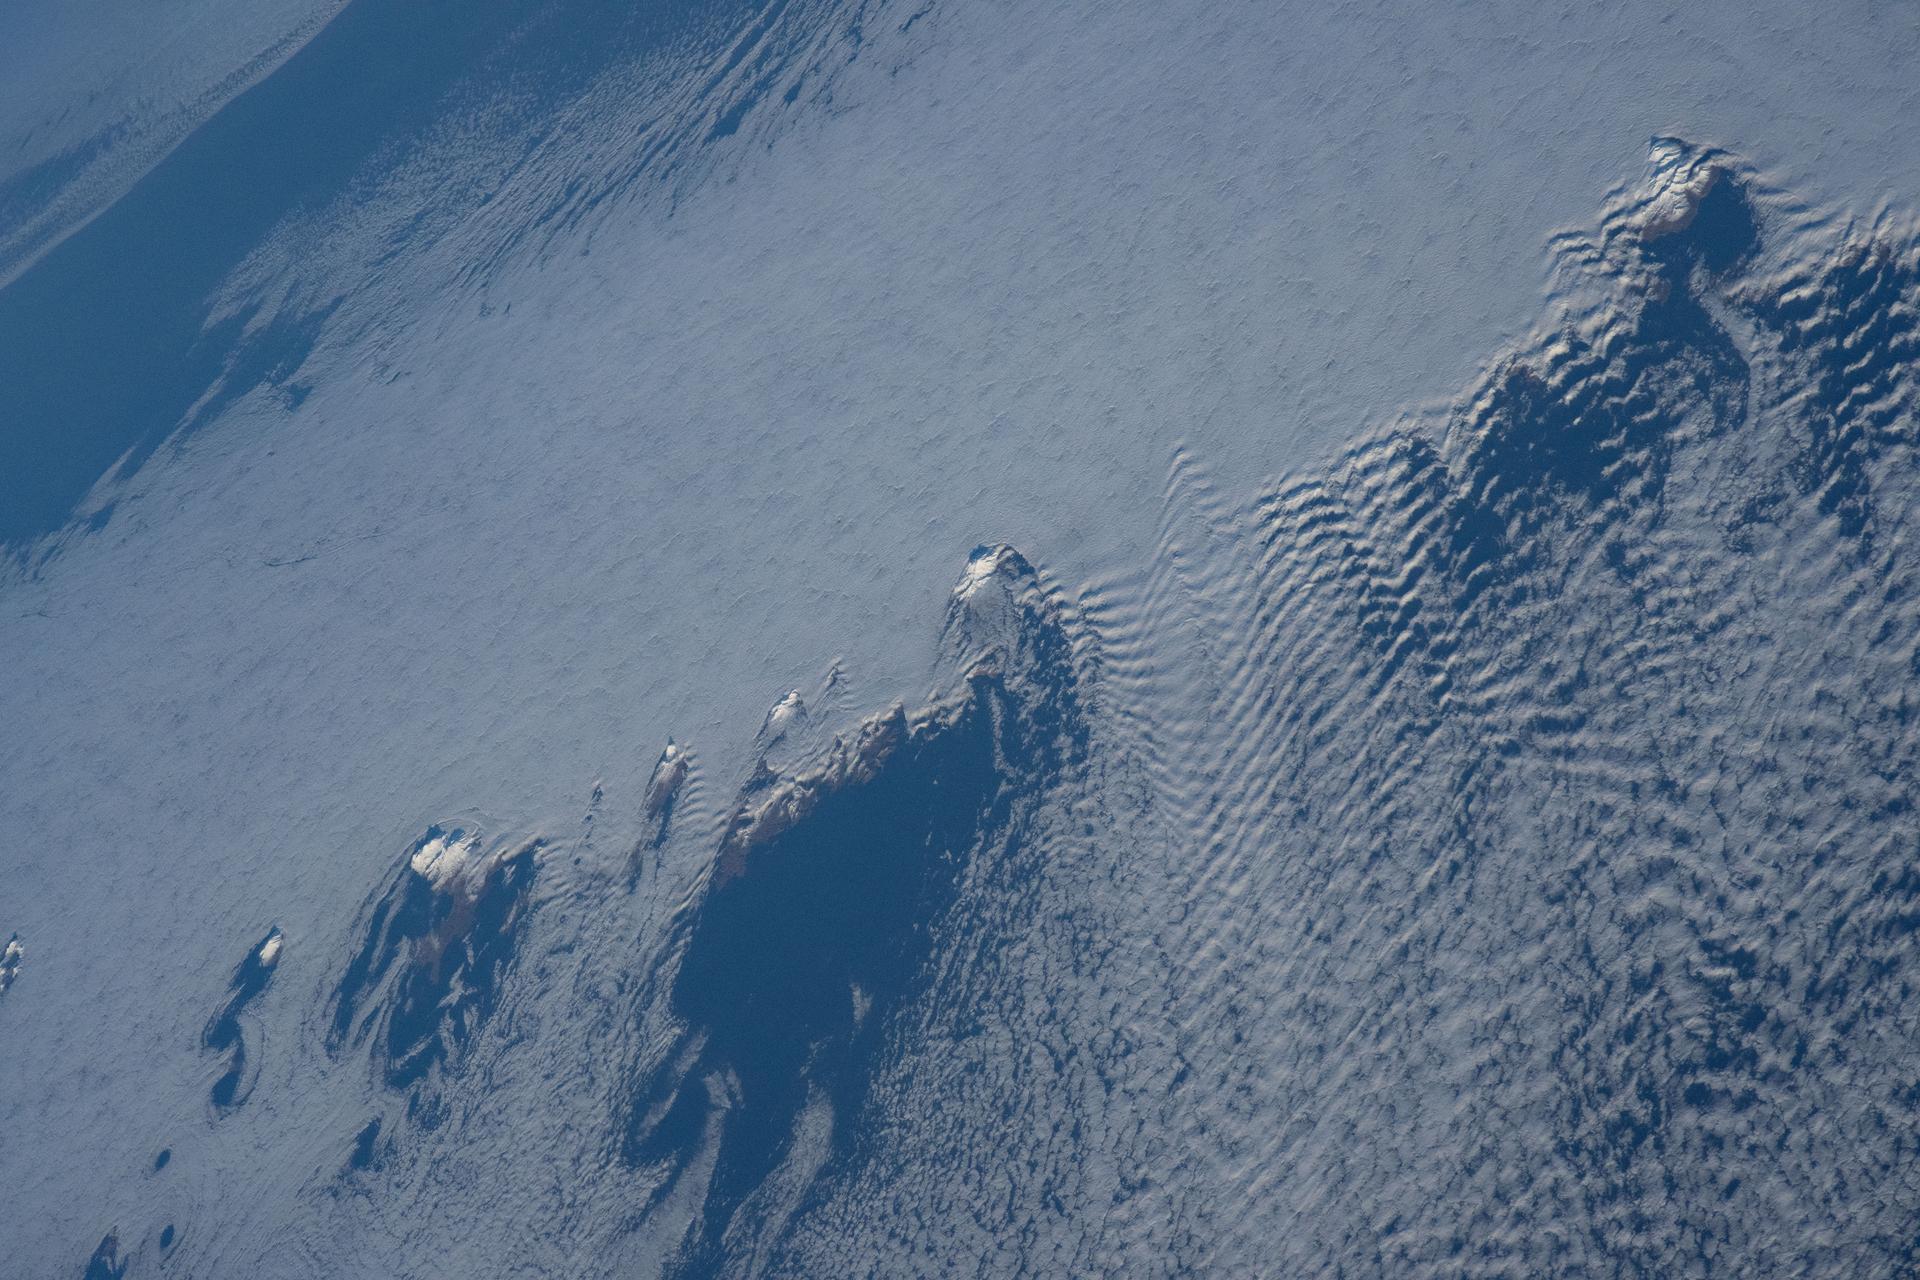
iss074e0008922 (Dec. 12, 2025) --- Snow-capped mountain tops of Alaska's Aleutian Islands pierce through the clouds, disturbing the air and creating wave-like patterns known as altocumulus clouds. This photograph was taken from the International Space Station as it orbited 264 miles above the North Pacific Ocean.
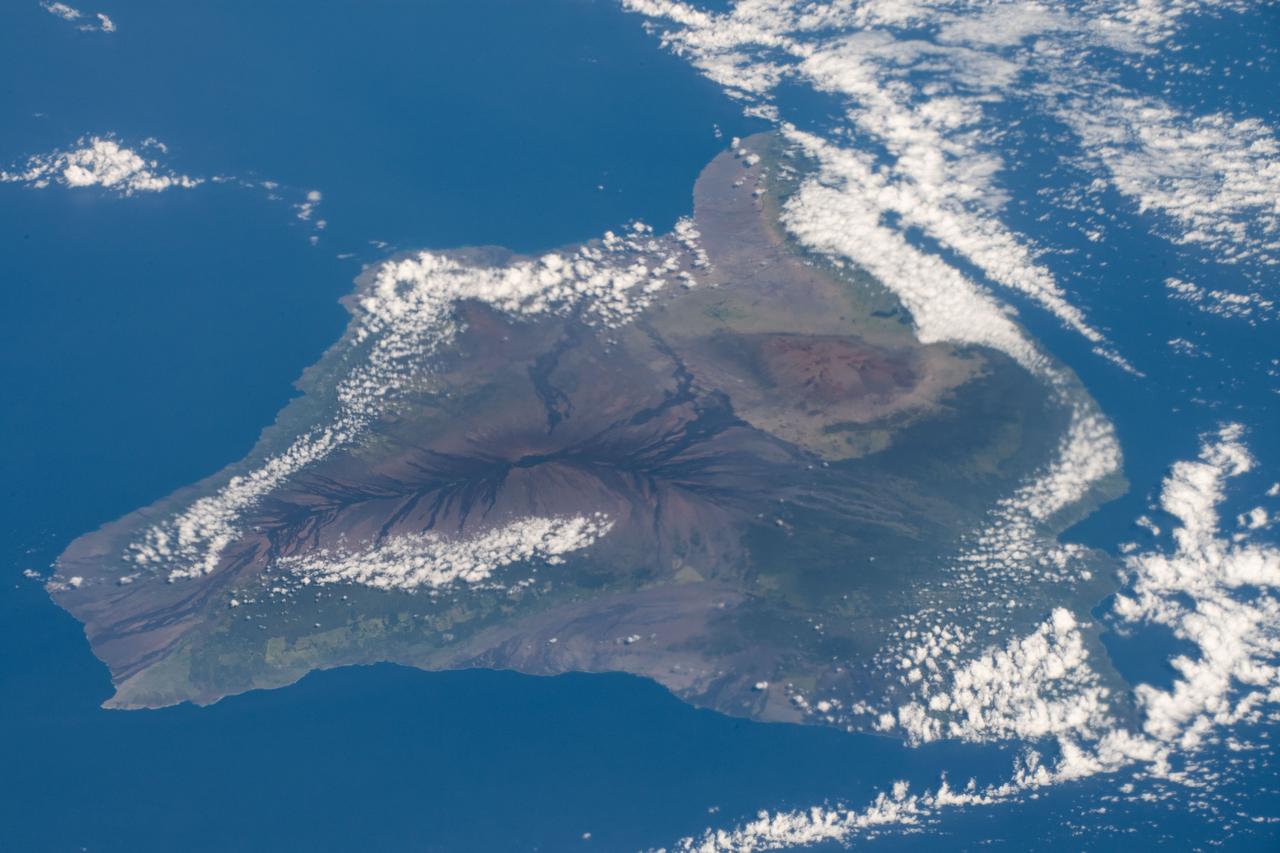
iss063e105782 (Oct. 8, 2020) --- The big island of Hawaii and its two prominent mountains Mauna Loa, an active volcano, and Mauna Kea, a dormant volcano, were pictured as the International Space Station orbited about 315 miles southeast above the Pacific Ocean.
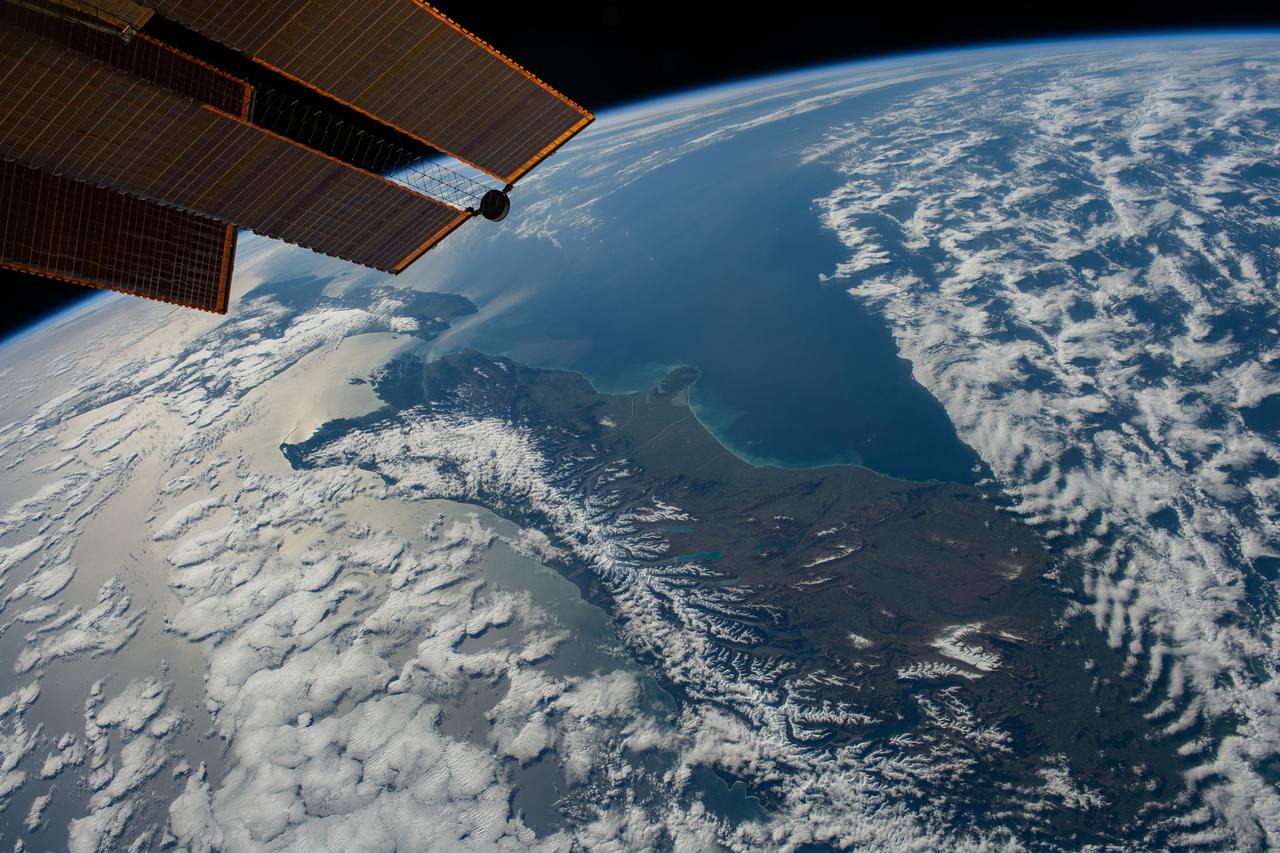
iss069e086875 (Sept. 12, 2023) --- New Zealand, with its snow-capped Southern Alps mountain range, is pictured between two partly cloudy bodies of water, the Tasman Sea and the Pacific Ocean, as the International Space Station orbited 271 miles above.

ISS032-E-024687 (3 Sept. 2012) --- Idaho fires are featured in this image photographed by an Expedition 32 crew member on the International Space Station. Taken with a short lens (45 mm), this west-looking photograph has a field of view covering much of the forested region of central Idaho. The dark areas are all wooded mountains—the Salmon River Mountains (left), Bitterroot Mountains (lower right) and Clearwater Mountains (right). All three areas experienced wildfires in September 2012—this image illustrates the situation early in the month. Smaller fire ‘complexes” appear as tendrils of smoke near the sources (e.g. Halstead complex at left), and as major white smoke plumes from the Mustang fire complex in the densest forests (darkest green, center) of the Clearwater Mountains. This was the largest plume noted in the region with thick smoke blowing eastward over the Beaverhead Mountains at bottom. The linear shape of the smoke plumes gives a sense of the generally eastward smoke transport on this day in early September. The smoke distribution shows another kind of transport: at night, when winds are weak, cooling of the atmosphere near the ground causes drainage of cooled (denser) air down into the major valleys. Here the smoke can be seen flowing west down into the narrow Salmon and Lochsa River valleys (at a local time of 12:18:50 p.m.) – in the opposite direction to the higher winds and the thick smoke masses. The bright yellow-tan areas at top left and top right contrasting with the mountains are grasslands of the Snake River in southern Idaho around Boise, and the Palouse region in western Idaho–SE Washington state. This latter area is known to ecologists as the Palouse Grasslands Ecoregion. Light green areas visible in the center of many of the valleys are agricultural crops including barley, alfalfa, and wheat. The image also shows several firsts of which Idaho can boast. The Snake River between Boise and the Palouse region has cut Hells Canyon (top), the deepest gorge in the U.S. at almost 2,436 meters (8,000 feet). The largest single wilderness area in the contiguous U.S., the Frank Church-River of No Return Wilderness occupies the wooded zones of the Salmon River Mountains and the Clearwater Mountains, i.e. most of the area shown in the middle of the image. Idaho’s highest peak is Borah Peak (lower left) at 3,860 meters above sea level (12,662 feet ASL). The Continental Divide cuts through the bottom of the image—rivers on the eastern slopes of the Beaverhead Mountains drain to the Atlantic Ocean, whereas rivers in the rest of the area drain to the Pacific Ocean.
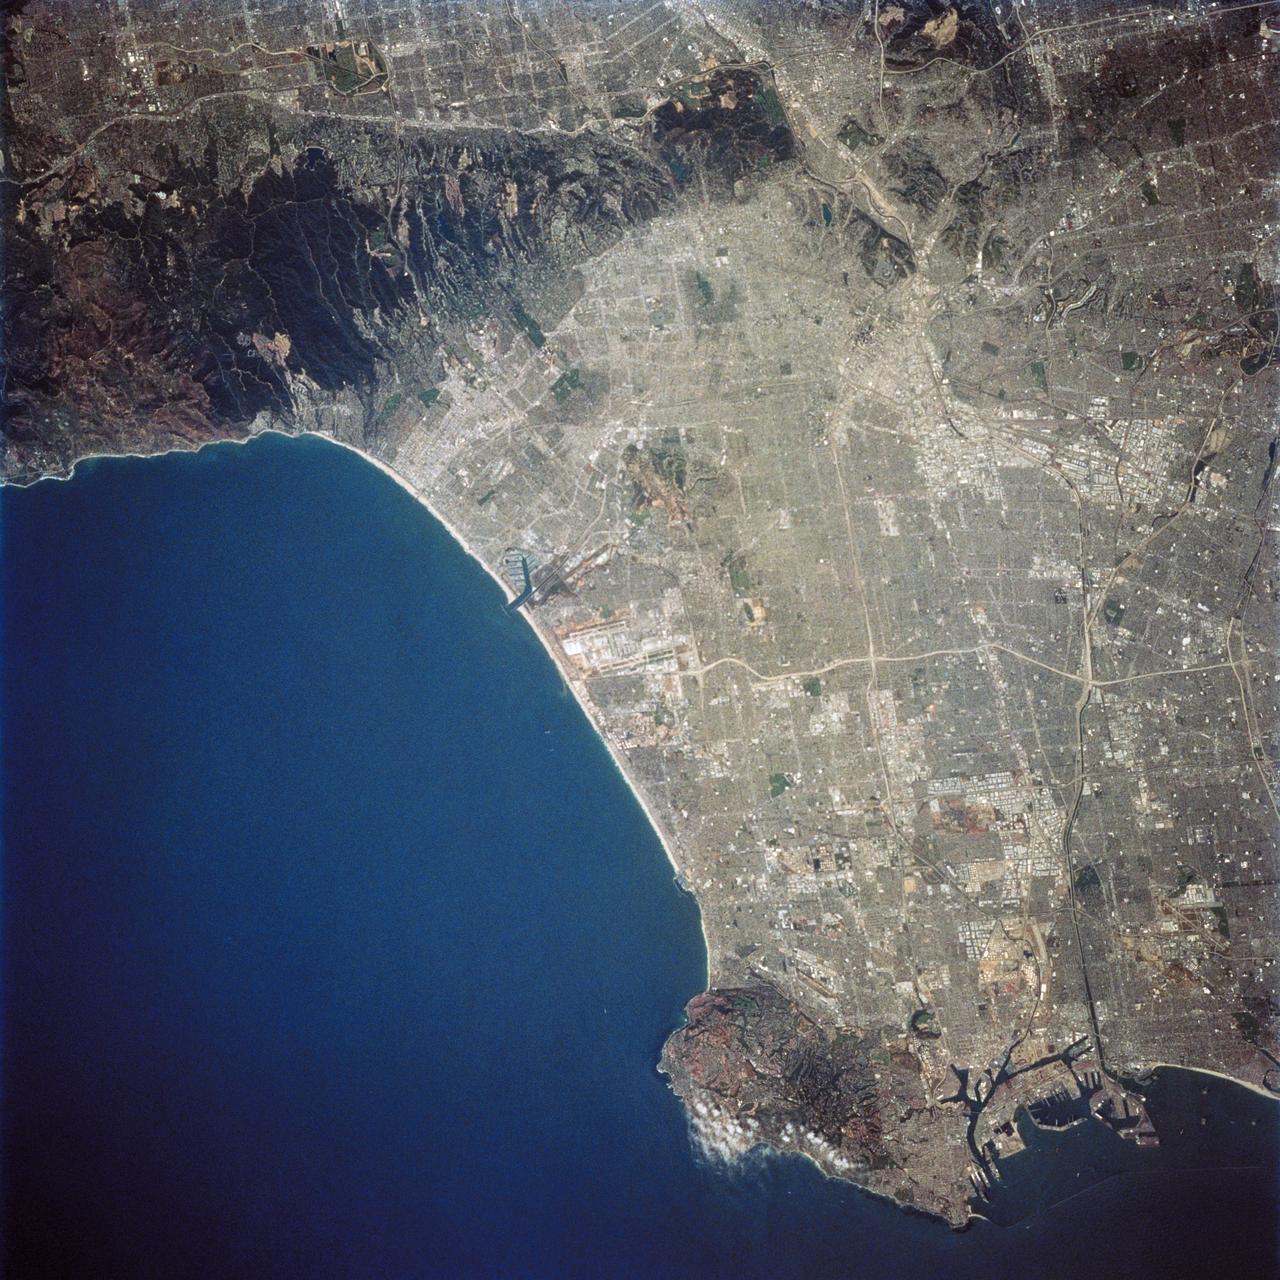
STS059-227-050 (9-20 April 1994) --- A low altitude, and unusually clear air, provided perhaps the most detailed view of Los Angeles, California ever obtained during a shuttle flight. Orient with the bulk of the ocean to the lower left. Then Long Beach is in the lower right, just east of the Palos Verdes Hills that extend into the Pacific Ocean. Marina del Rey is cut into the straight segment of beach, with Los Angeles International Airport (LAX) clearly visible to the southeast. Downtown Los Angeles is the light-toned sprawl in the upper right, with the rectangular grid pattern of Pasadena extending out of the picture. The Santa Monica Mountains to the upper left extend east-west, separating the San Fernando Valley (epicenter of the 1993 earthquake) from the Los Angeles Basin proper. It is impossible to determine by photo interpretation whether or not the de-vegetated scars along the southern edge of the mountains represent man-made features (real-estate development) or wildfires.
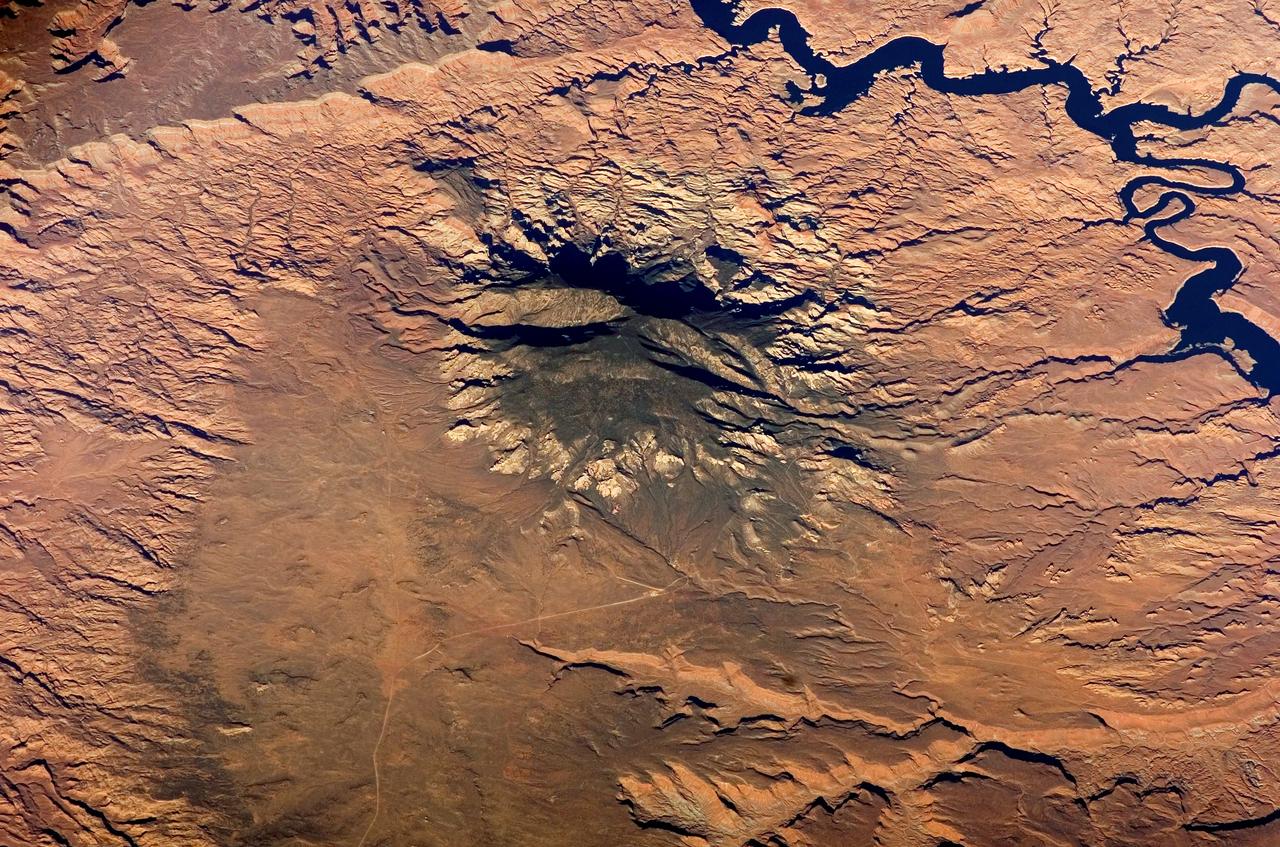
ISS012-E-05172 (14 October 2005) --- Navajo Mountain, Utah is featured in this image photographed by an Expedition 12 crewmember on the international space station. According to scientists, the Colorado Plateau of Arizona, Colorado, New Mexico, and Utah is characterized by mostly flat-lying sedimentary layers that record paleoclimate extremes ranging from oceans to widespread deserts over the last 1.8 billion years. Navajo Mountain is formed by a dome-shaped body of igneous rock (called a laccolith by geologists), one of several in southeast Utah that intrude and uplift the surrounding sedimentary layers of the Plateau. This oblique image highlights Navajo Mountain in the center of the image, surrounded by light red-brown Navajo Sandstone (also visible in canyons at bottom of image). Scientists believe the peak of Navajo Mountain, at approximately 3148 meters (10,388 feet) elevation, is comprised of uplifted Dakota Sandstone deposited during the Cretaceous Period. The establishment of Rainbow Bridge National Monument (1910), and the filling of Glen Canyon by Lake Powell in 1963 (upper right), have facilitated tourism and aesthetic appreciation of this previously remote region. Access to Navajo Mountain is still regulated by the sovereign Navajo Nation, and the process of permitting is required to hike in the region.
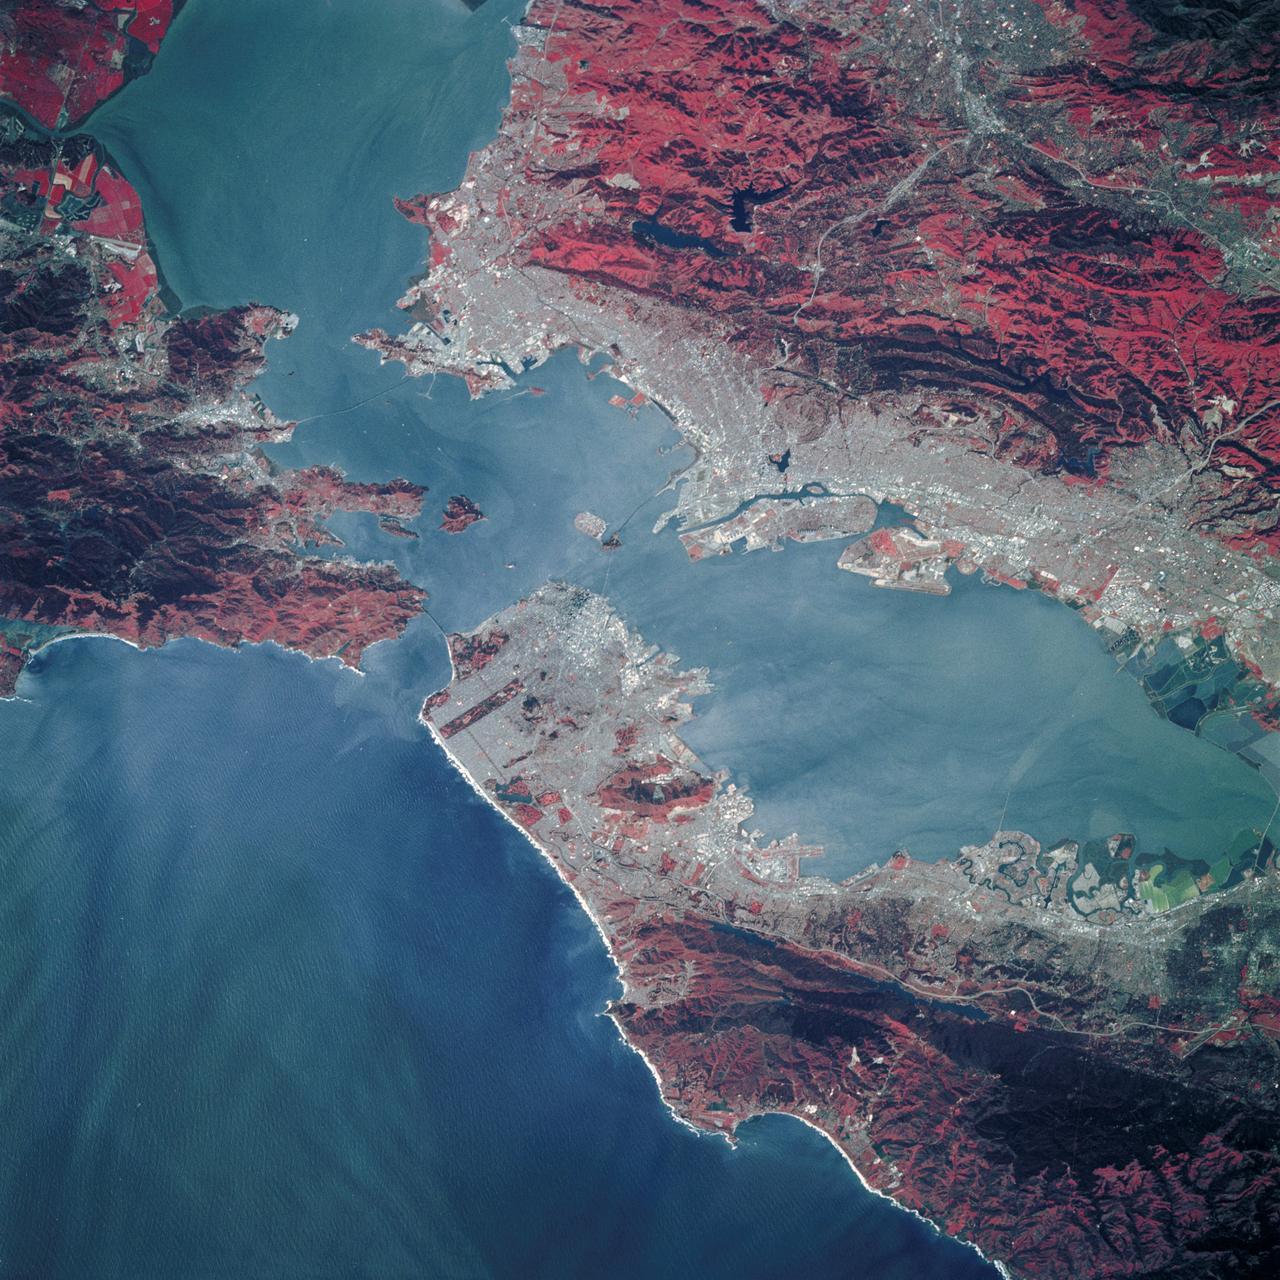
STS039-89-053 (28 April-6 May 1991) --- A 70mm, infrared frame of the city of San Francisco, taken on a clear day. The gray areas represent urban regions, and the red areas are vegetated. Within the city of San Francisco, parks like Golden Gate park and the Presidio at the base of the Golden Gate Bridge easily stand out from the well-developed parts of the city. Major thoroughfares and bridges (Golden Gate and Bay Bridges) are seen as are other landmarks such as Candlestick Park and Alcatraz. The trace of the San Andreas faults show as a straight valley running northerly along the San Francisco peninsula. Good detail is visible in the turbid waters of San Francisco Bay.
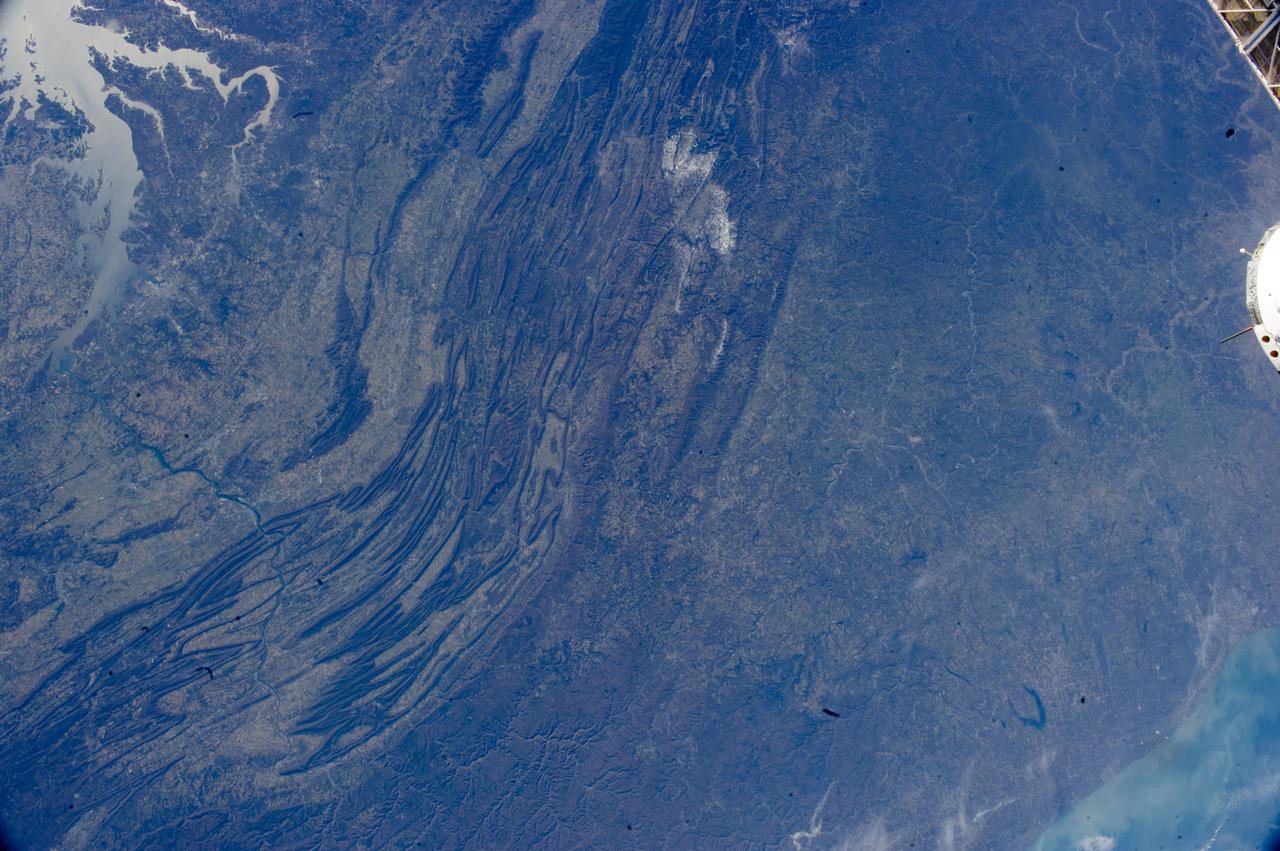
ISS033-E-022378 (17 Nov. 2012) --- The Appalachian Mountains in the eastern Unites States are featured in this image photographed by an Expedition 33 crew member on the International Space Station. This regional view shows the striking visual effect of the valley-and-ridge topography of the Appalachian Mountains as viewed from orbit. The view shows more than 300 miles (500 kilometers) of this low mountain chain, from northeast Pennsylvania (lower left) to southern West Virginia, where a dusting of snow can be seen (top center). Sunglint reflections reveal detail of Chesapeake Bay and the great bend of the Potomac River. Cities are difficult to detect from space during daylight hours, so the sickle-shaped bend of the river is a good visual guide for station crew members trying to photograph the nation?s capital, Washington D.C. (upper left). The farm-dominated Piedmont Plateau is the light-toned area between the mountains and the bay. The Appalachian Mountains appear striped because the ridges are forested; providing a dense and dark canopy cover, while the valleys are farmed with crops that generally appear as lighter-toned areas. Geologically the valleys are the softer, more erodible rock layers, much the preferred places for human settlement. Not only do the larger rivers occupy the valley floors, but all the larger rivers flow in them, soils are thicker, slopes are gentle, and valleys are better protected from winter winds. According to scientists, rocks that form the valley-and-ridge province, as it is known, are relatively old (540-300 million years old), and were laid down in horizontal layers when North America was attached to Europe as the ancient supercontinent of Laurasia. During this time Gondwanaland ? an ancient supercontinent that included present-day Africa, India, South America, Australia and Antarctica - was approaching Laurasia under the influence of plate tectonics. The northwest coastline of modern Africa was the section of Gondwanaland that ?bumped up? against modern North America over a long period (320 ? 260 million years ago), according to scientists. The net result of the tectonic collision was the building of a major mountain chain, much higher than the present Appalachian range?in the process of which the flat-lying rock layers were crumpled up into a series of tight folds, at right angles to the advance of Gondwanaland. The collision also formed the singular supercontinent of Pangaea. The scientists say that, over the following 200 million years, Pangaea broke apart; the modern Atlantic Ocean formed; and erosion wore down the high mountains. What is left to see are the coastline of North America, and the eroded stumps of the mountain chain as the relatively low, but visually striking present-day Appalachian Mountains.
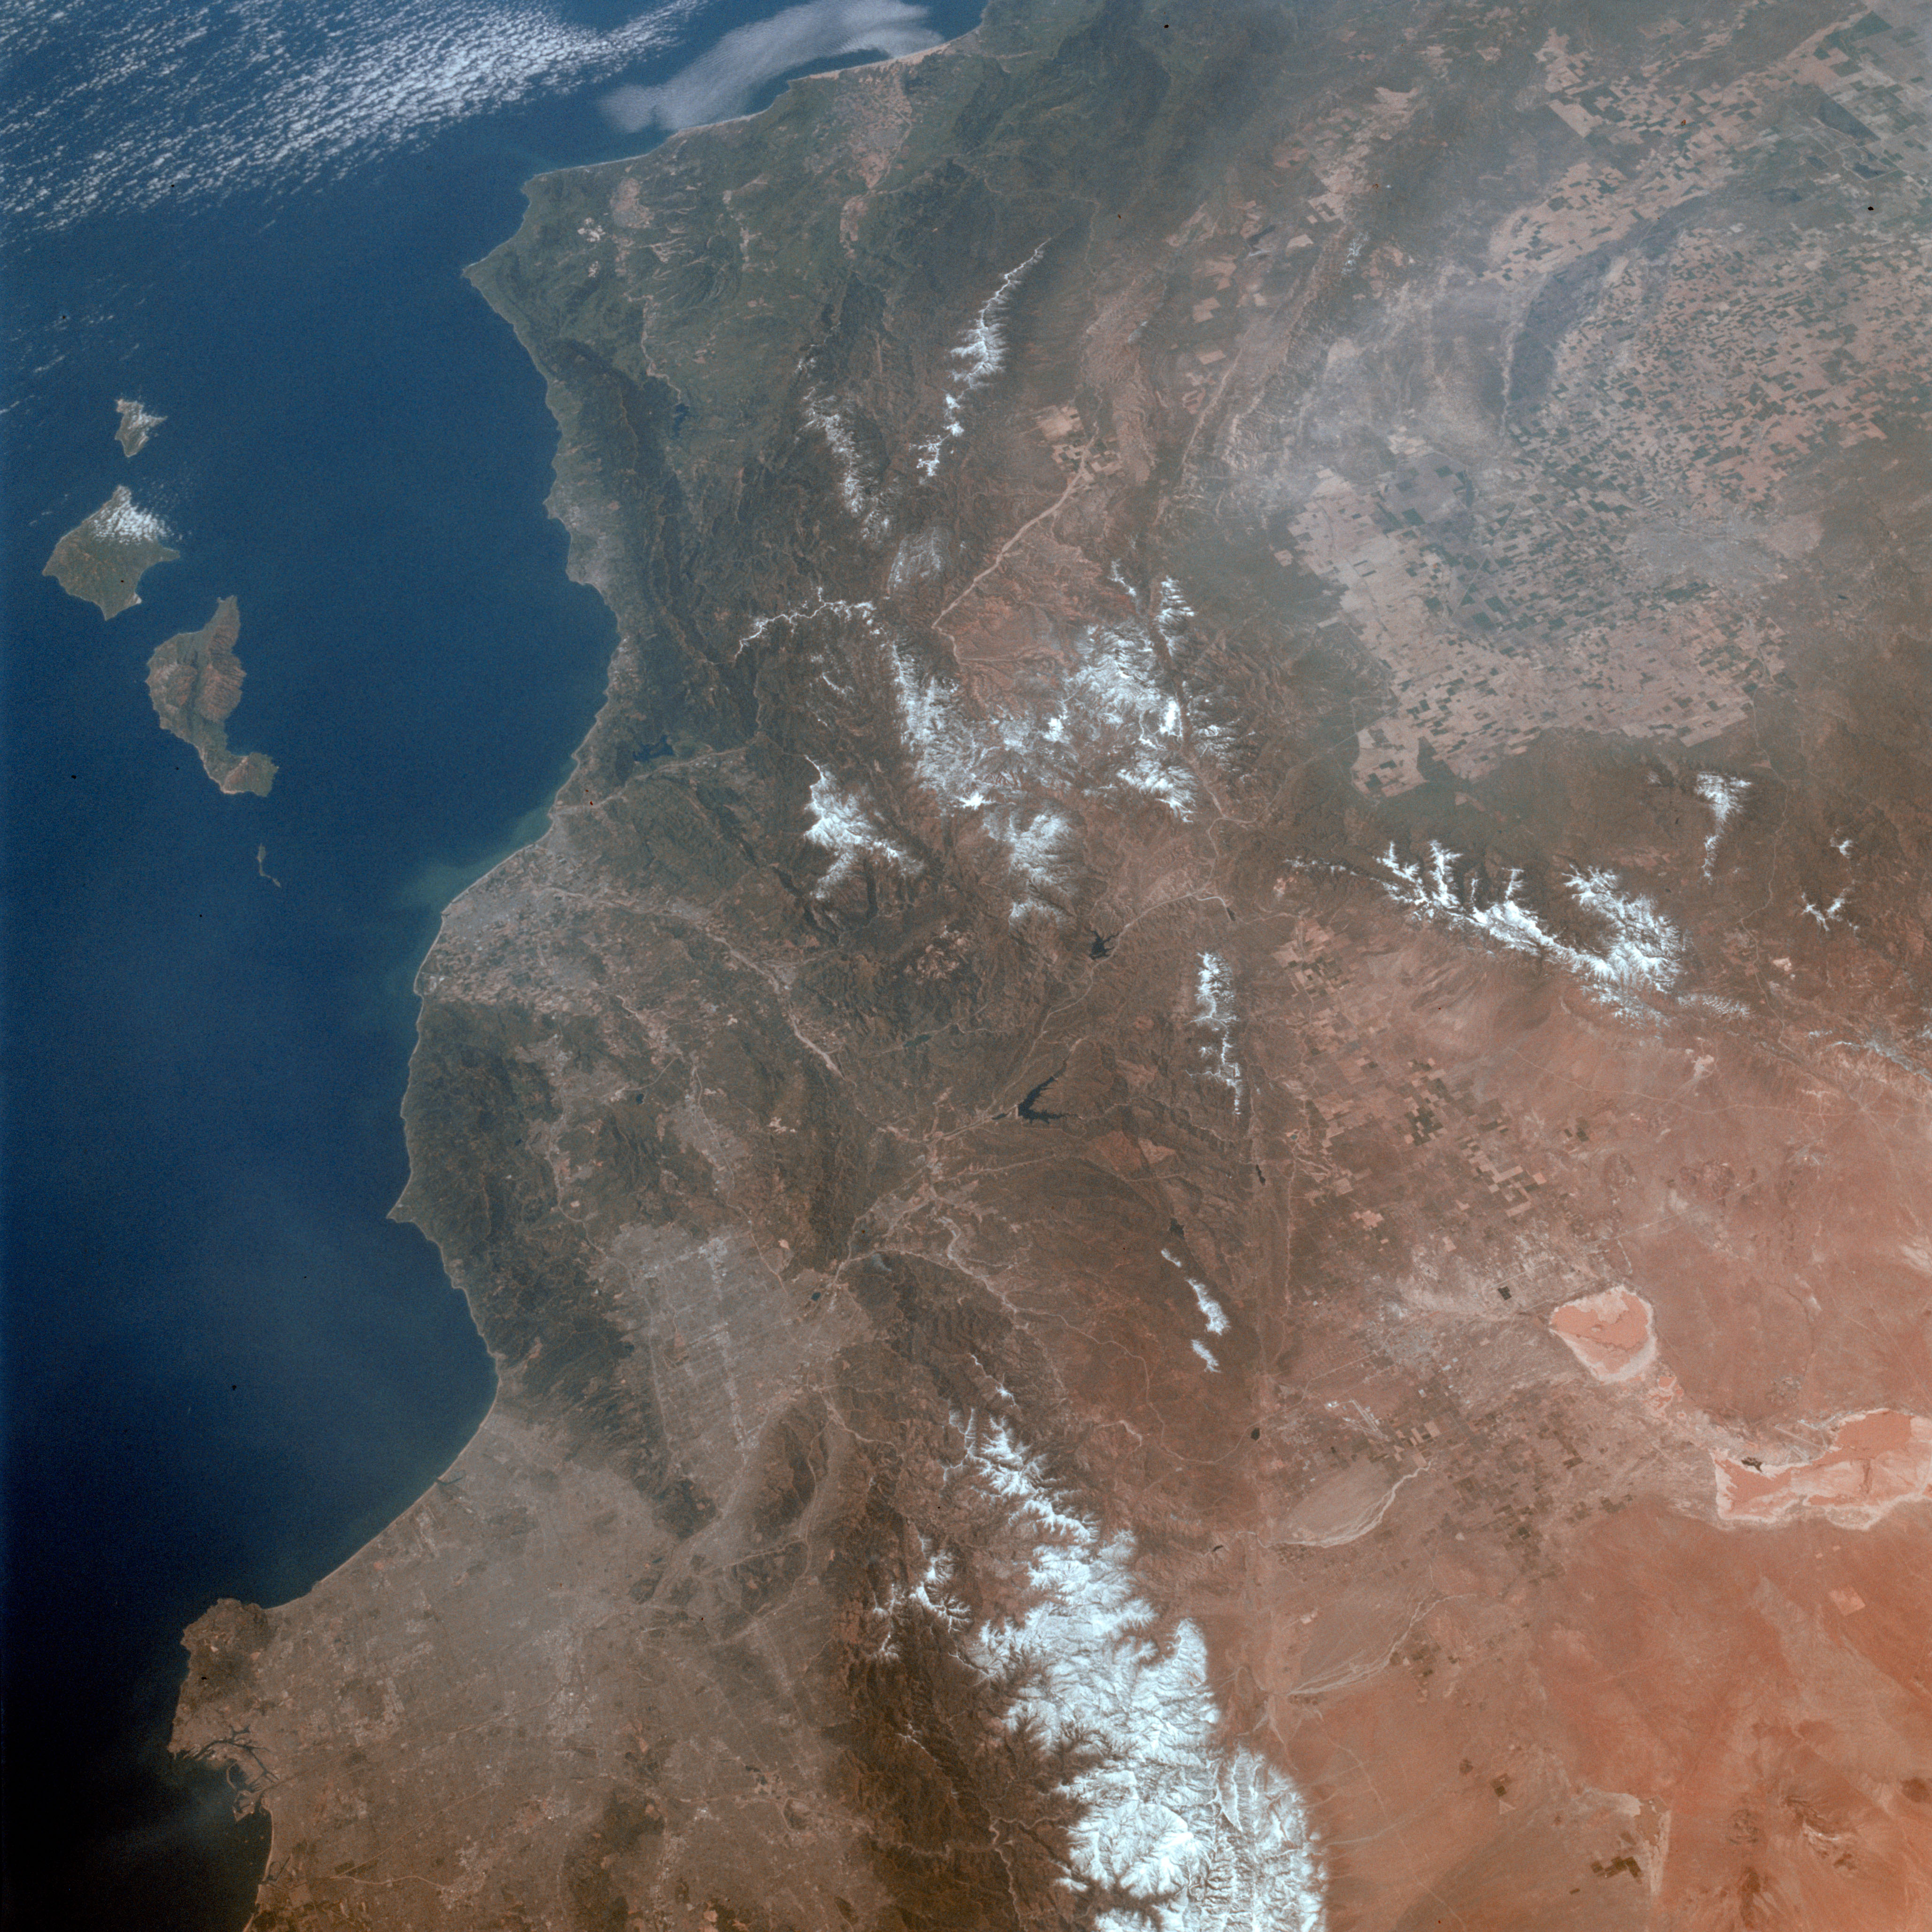
STS003-010-593 (30 March 1982) --- A general view of the greater Los Angeles region of California (34,0N, 118.5W) showing the coastline, Vandenberg AFB, the south end of the Central Valley and the dry lake beds at Edwards AFB. A close look can pinpoint water on the lake beds at Edwards Air Force Base used previously for two shuttle landings. Among other features that can be seen are Oxnard, Santa Barbara, Bakersfield, Vandenberg Air Force Base, and The Ranch. Photo credit: NASA
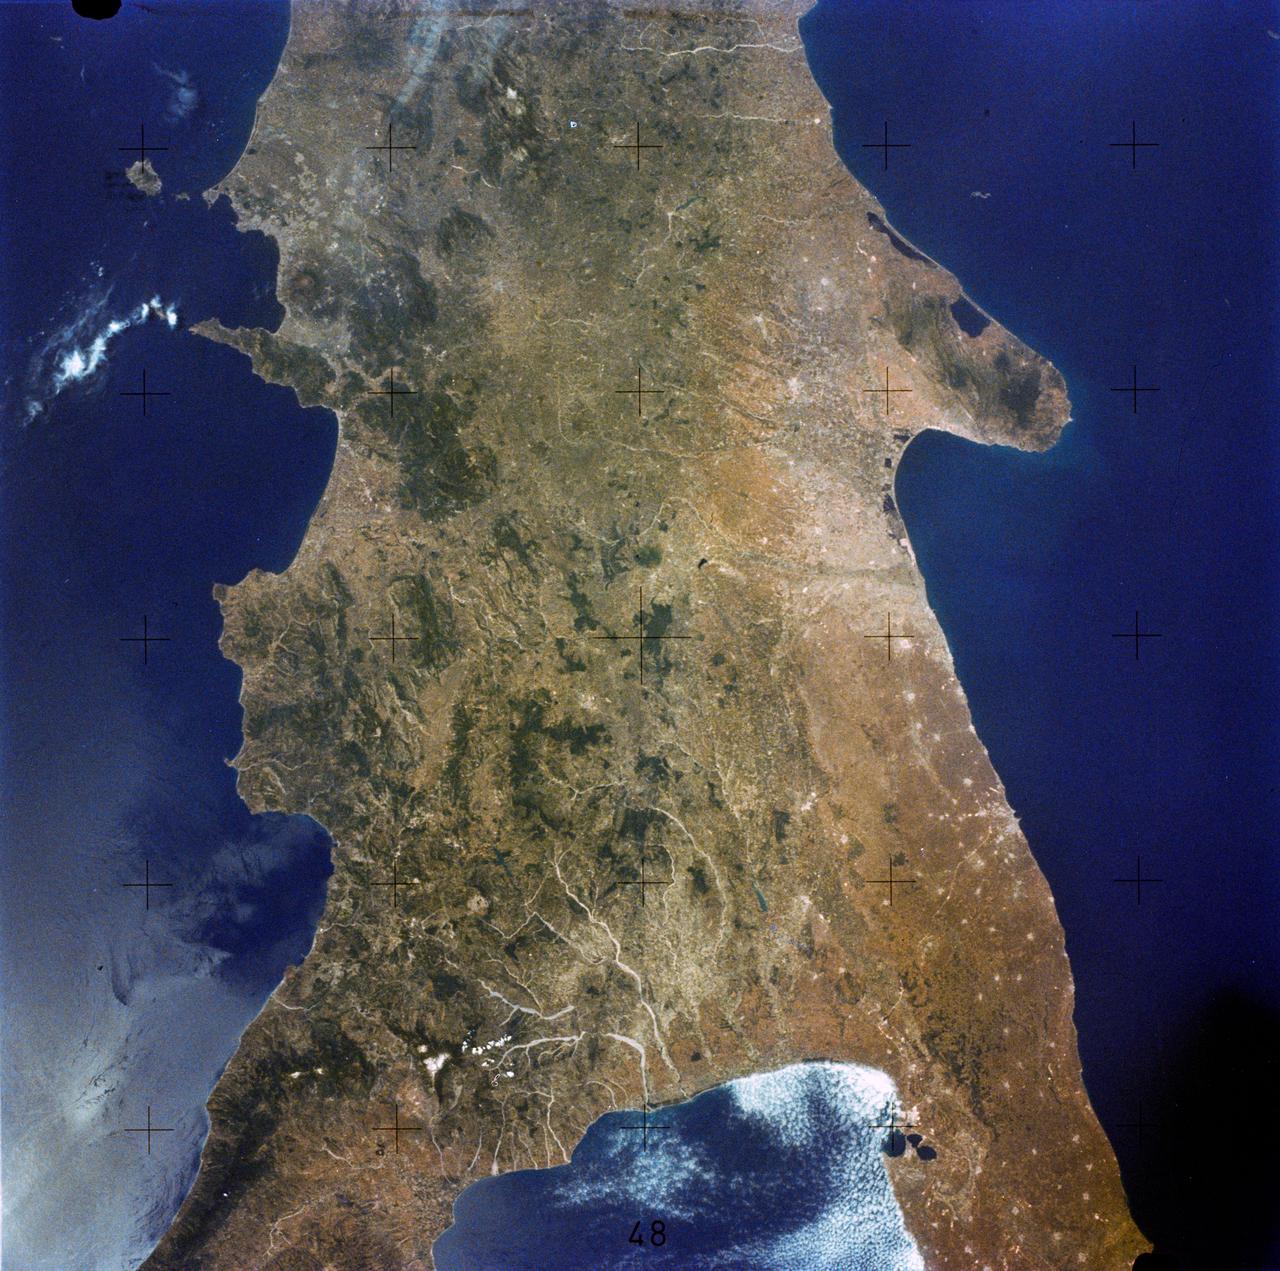
SL2-05-359 (22 June 1973) --- This rare cloud free view of southern Italy (41.0N, 16.0E) shows almost all of the famous `boot' configuration of the peninsula up to just north of Naples and Mount Vesuvius. The land mass of this historic peninsula contrasts sharply with the sparkling blue waters of the Mediterranean Sea. Photo credit: NASA
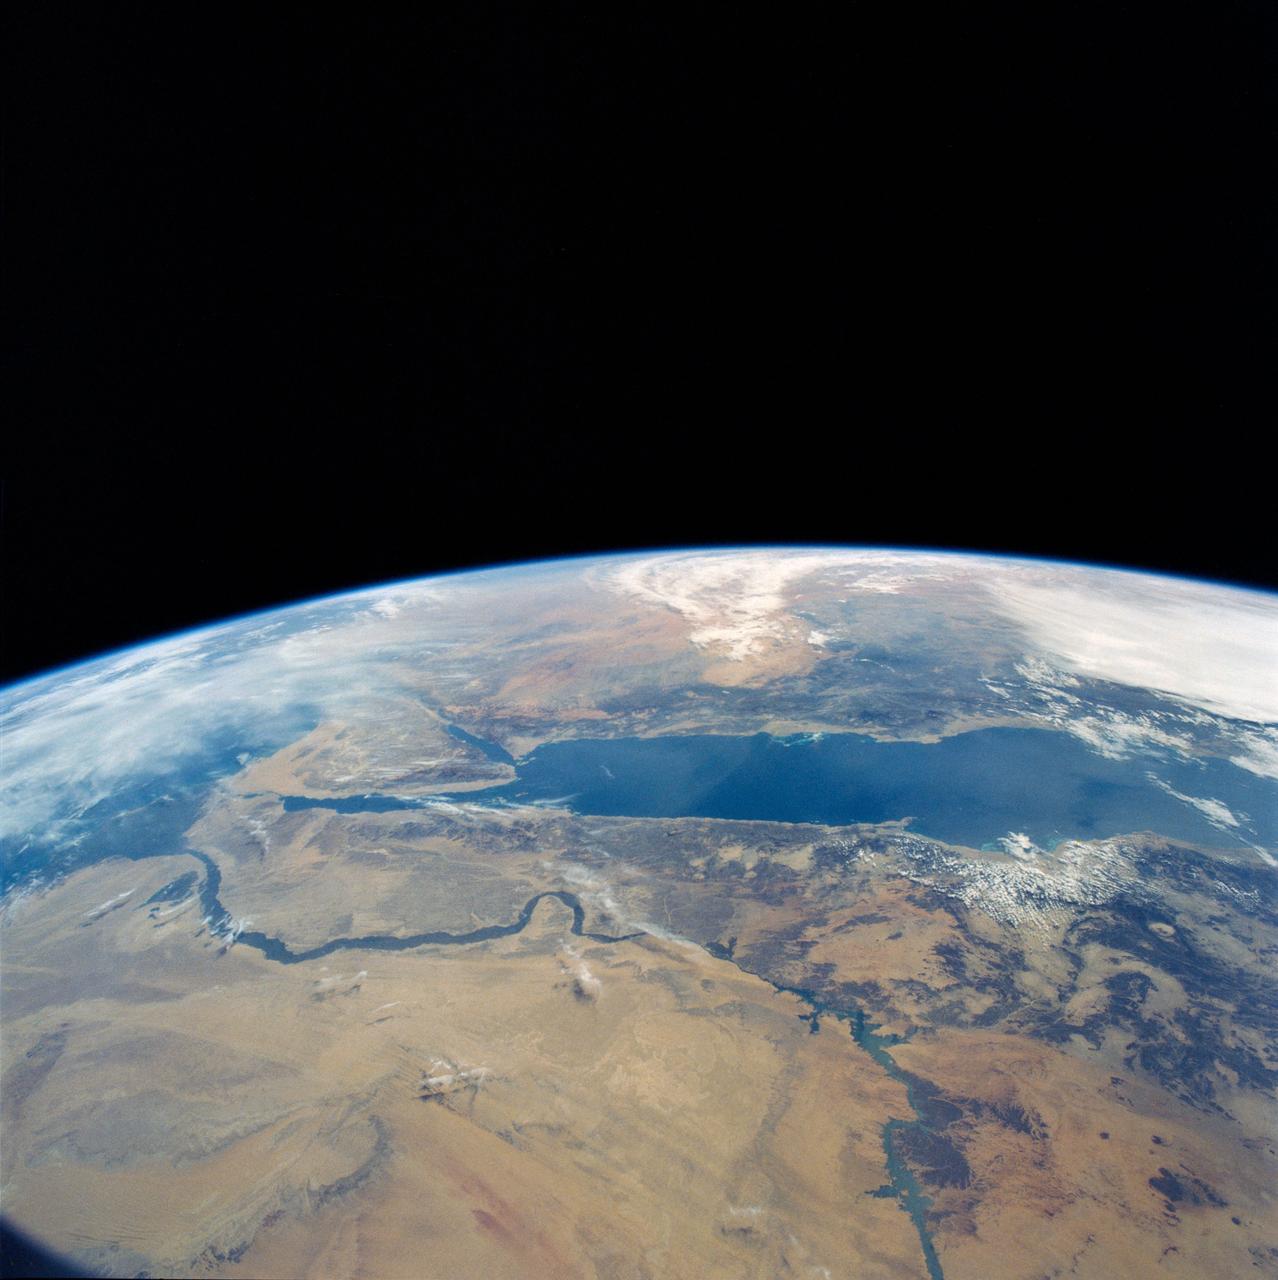
STS031-79-015 (24-29 April 1990) --- The 330-plus nautical mile orbital altitude of the Space Shuttle Discovery allowed for this unique high oblique 70mm Hasselblad frame. Egypt is in the foreground, with the Nile River and Lake Nasser readily identifiable. Cairo and Alexandria are visible. The Mediterranean Sea is on the horizon in upper left. The Red Sea is in the center. Other areas seen include Saudi Arabia, Jordan, Palestine and Israel; the Gulf of Aqaba and the Gulf of Suez.
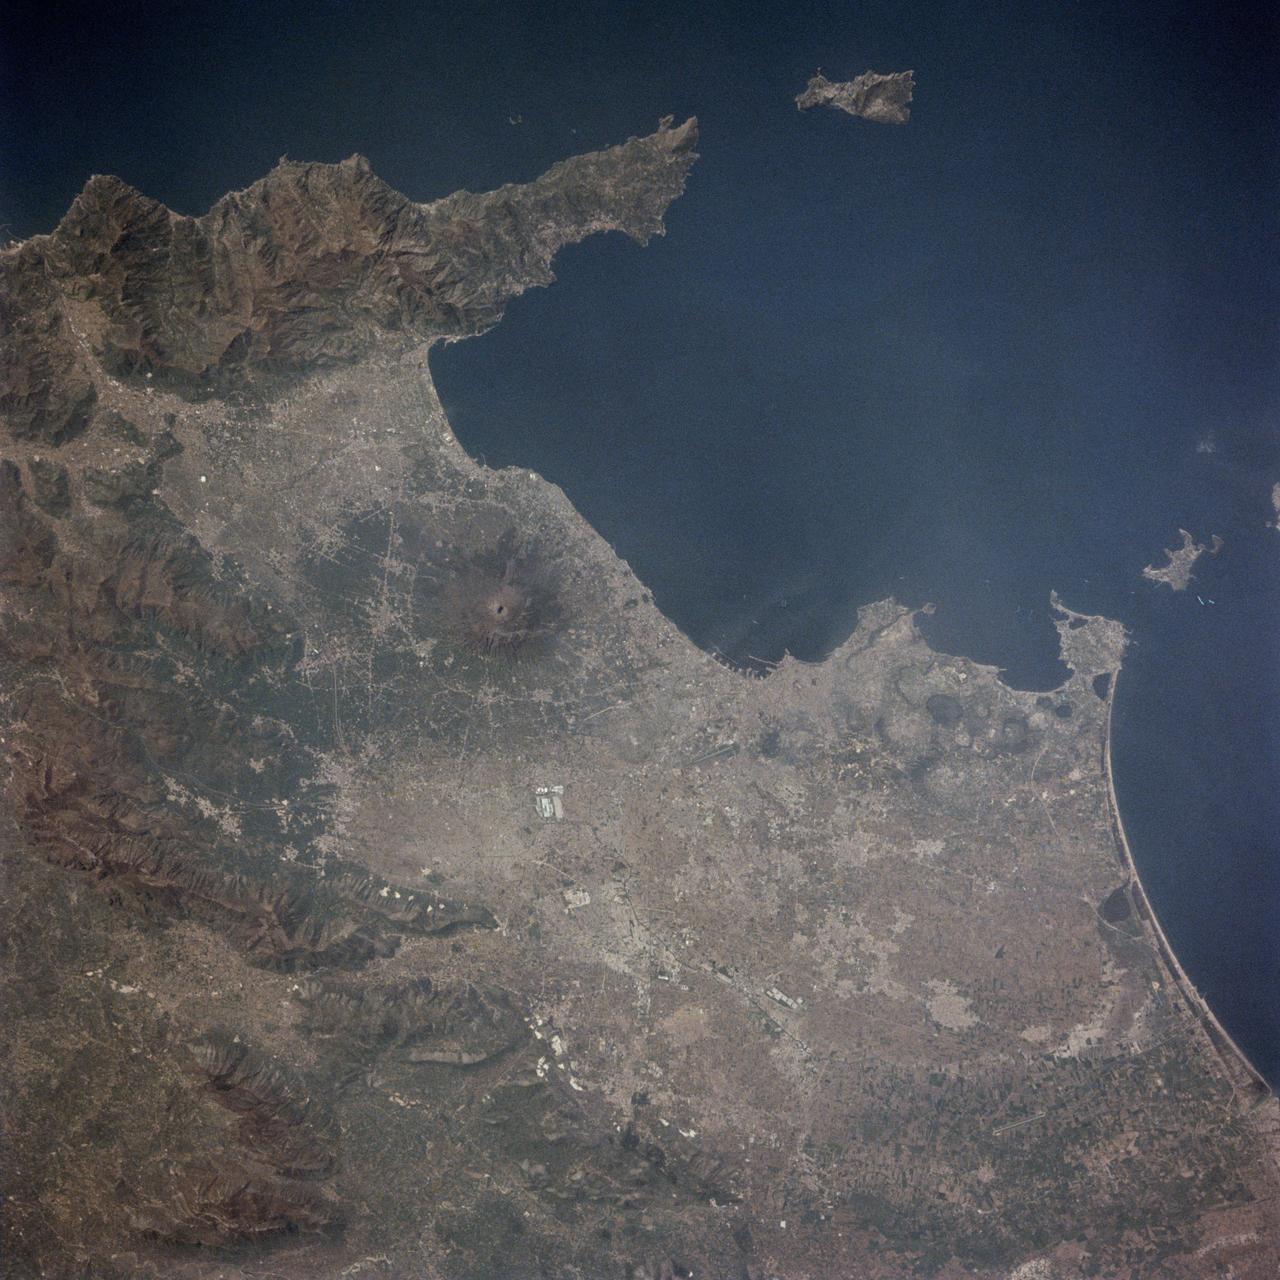
STS001-13-442 (14 April 1981) --- This photograph showing much of Italy was taken with a handheld 70mm camera from 276 kilometers above Earth as the NASA space shuttle Columbia and its crew were marking their last few hours in space on the historic first space mission utilizing a reusable vehicle. Included in the area of the frame are Golfo de Napoli, Napoli (Naples), Castellammare, Amalfi, Capri, Sorrento, Mt. Vesuvius and the ruins of Pompei. Astronauts John W. Young and Robert L. Crippen exposed eight magazines of color 70mm film during their two and one-third days in Earth orbit. Photo credit: NASA

STS003-10-606 (30 March 1982) --- The entire state of New Jersey (39.5N, 74.5W) is seen in great detail in this photograph. Philadelphia, PA on the west bank of the Delaware River and Camden, NJ on the east bank of this natural boundary, are easily seen as well as the coastal resort of Atlantic City. Further north, New York City and most of Long Island can be seen in fair detail while further inland, the northern Appalachian Mountains can be seen going diagonal across the scene. Photo credit: NASA
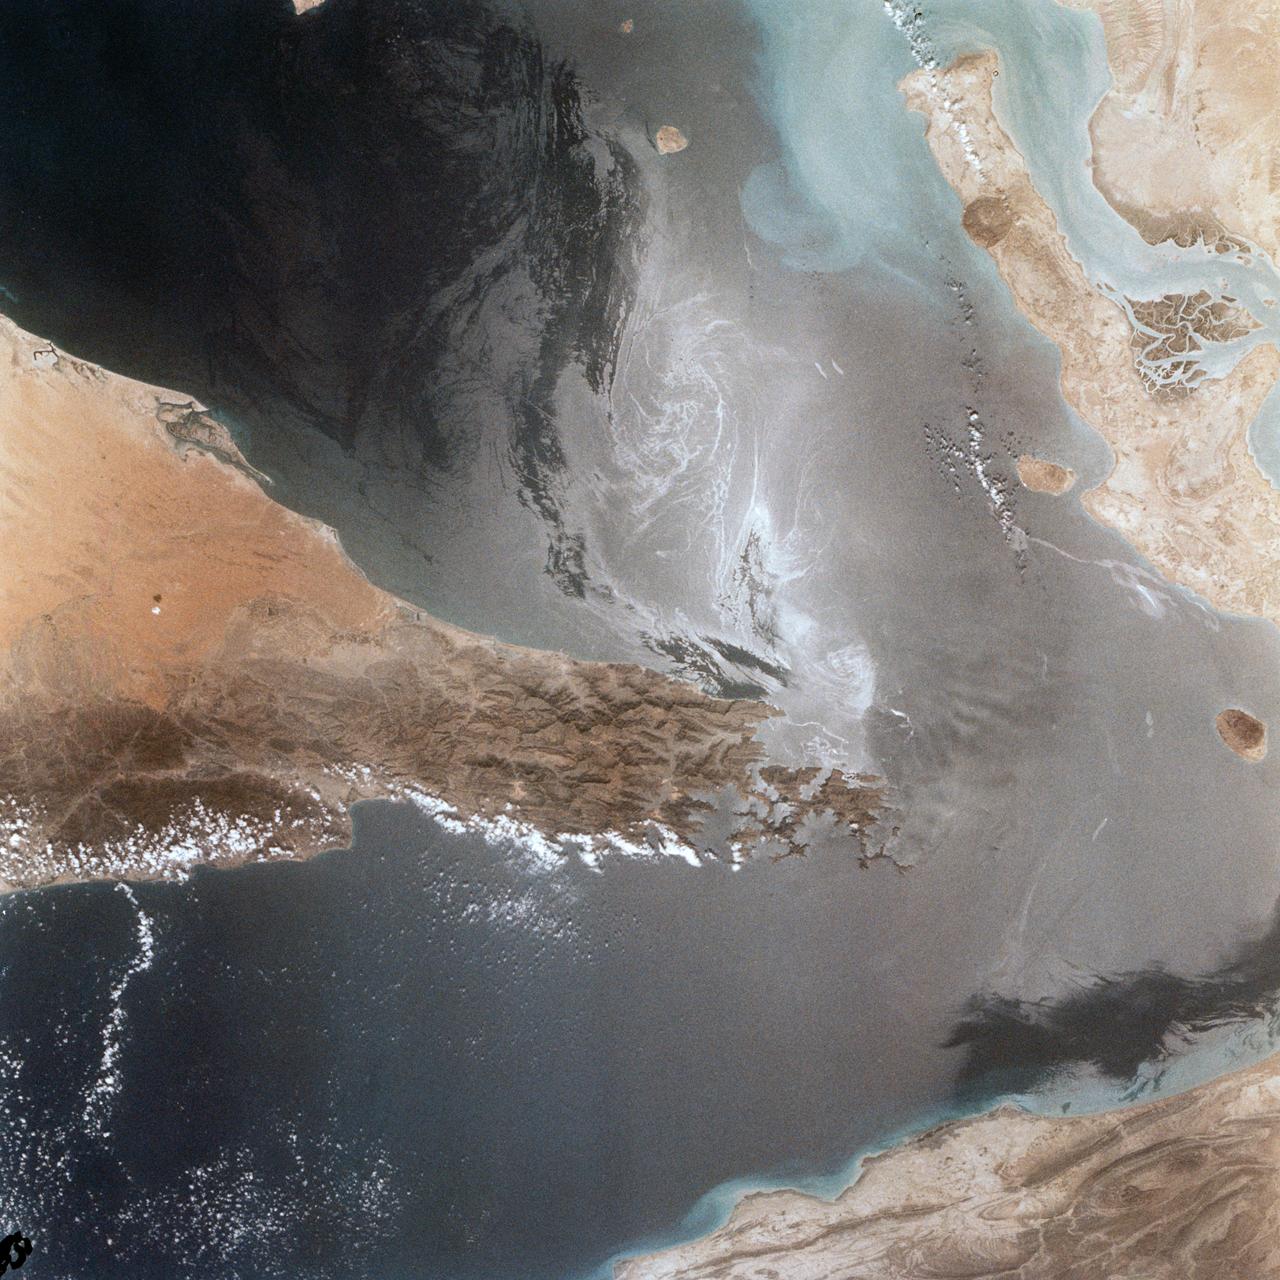
Portions of Oman, The United Arab Emirates and Iran are seen at the Strait of Hormuz (26.0N, 56.0E) in this view. A number of ship wakes can be seen in the area of the strait. Sunglint in the Persian Gulf to the northwest, accentuates the complex currents and oil slicks, seen as dark toned blue streaks on the surface. Qeshm Island, just off the coast of Iran, can be seen on the edge of the photo.
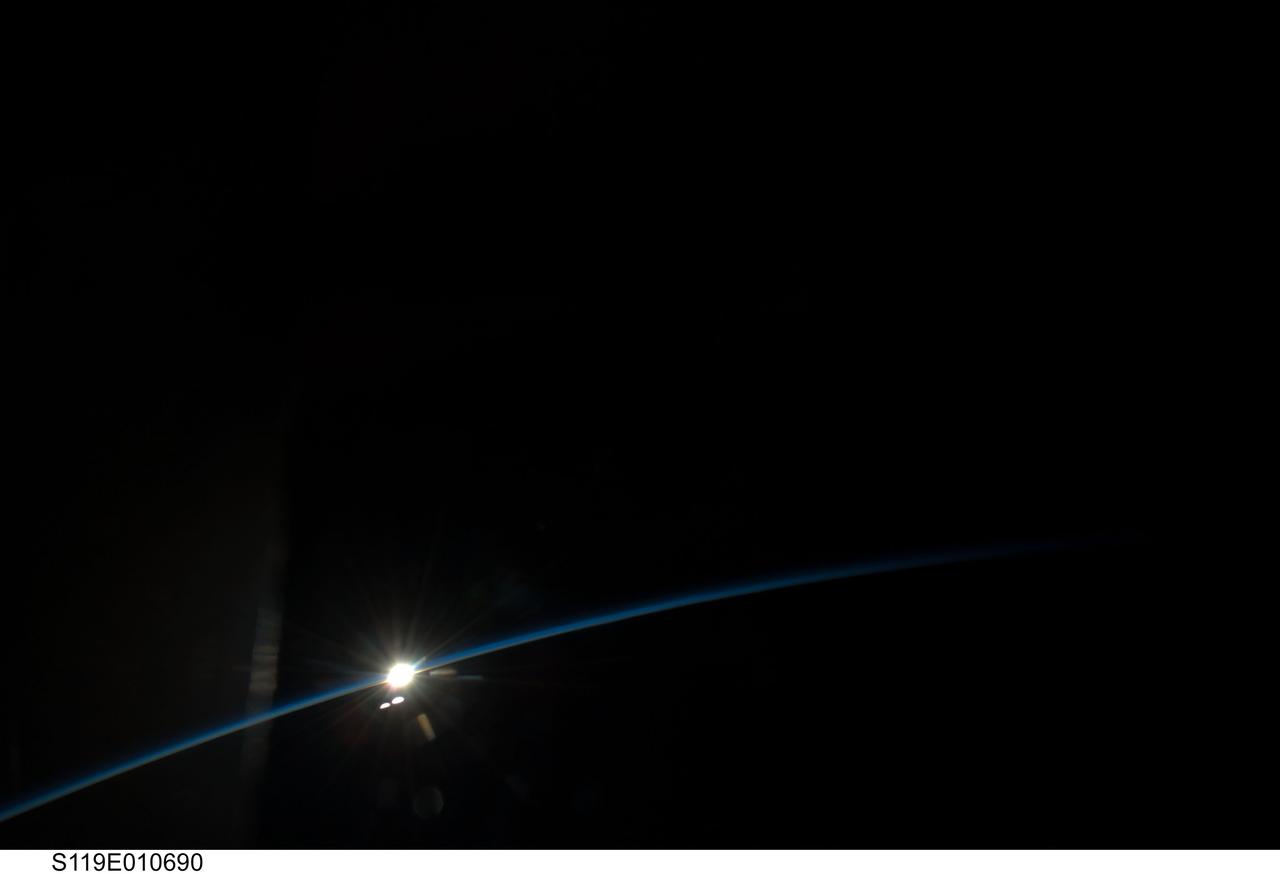
S119-E-010690 (27 March 2009) --- On its final full day in space before a scheduled return home on March 28, the crew of Space Shuttle Discovery took some pictures of the home planet. Unlike most of the images, which showed closer views of Earth featuring oceans, lakes, rivers, clouds, mountains and deserts, this view shows Earth's limb as the spacecraft approached a rising or setting sun.
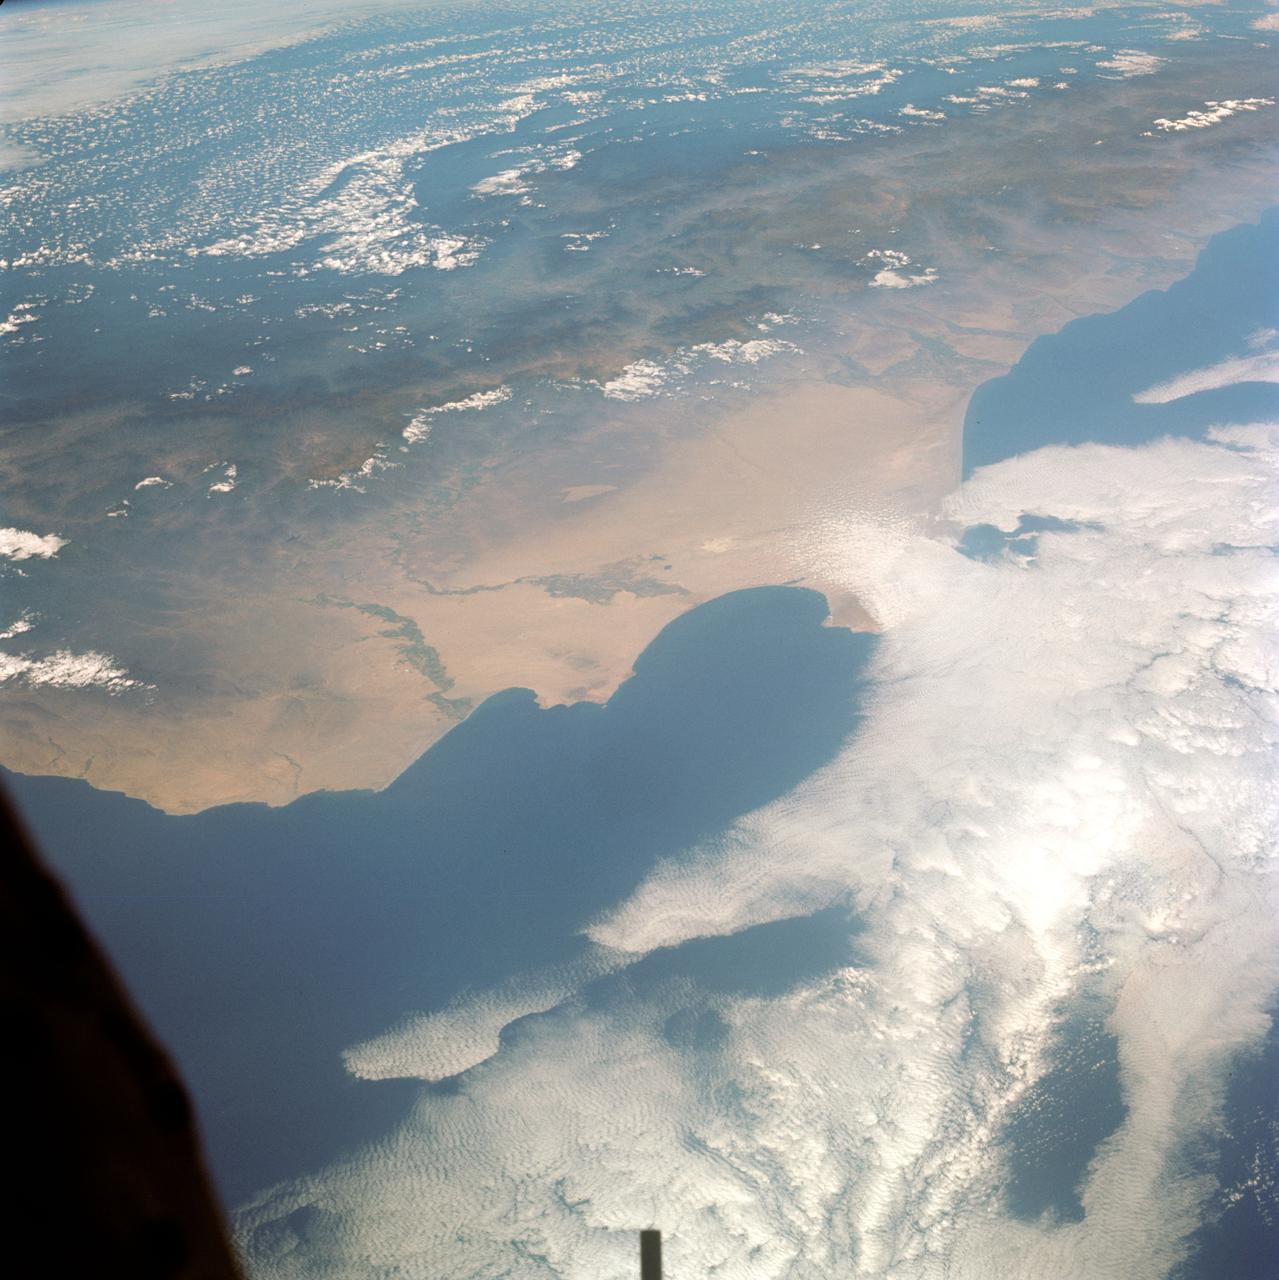
S66-38290 (5 June 1966) --- The north coastal area of Peru looking southeast across the Andes Mountains as seen from the National Aeronautics and Space Administration's Gemini-9A spacecraft. The body of water is the Pacific Ocean. The image was taken with a modified 70mm Hasselblad camera, using Eastman Kodak, Ektachrome MS (S.O. 217) color film. Photo credit: NASA
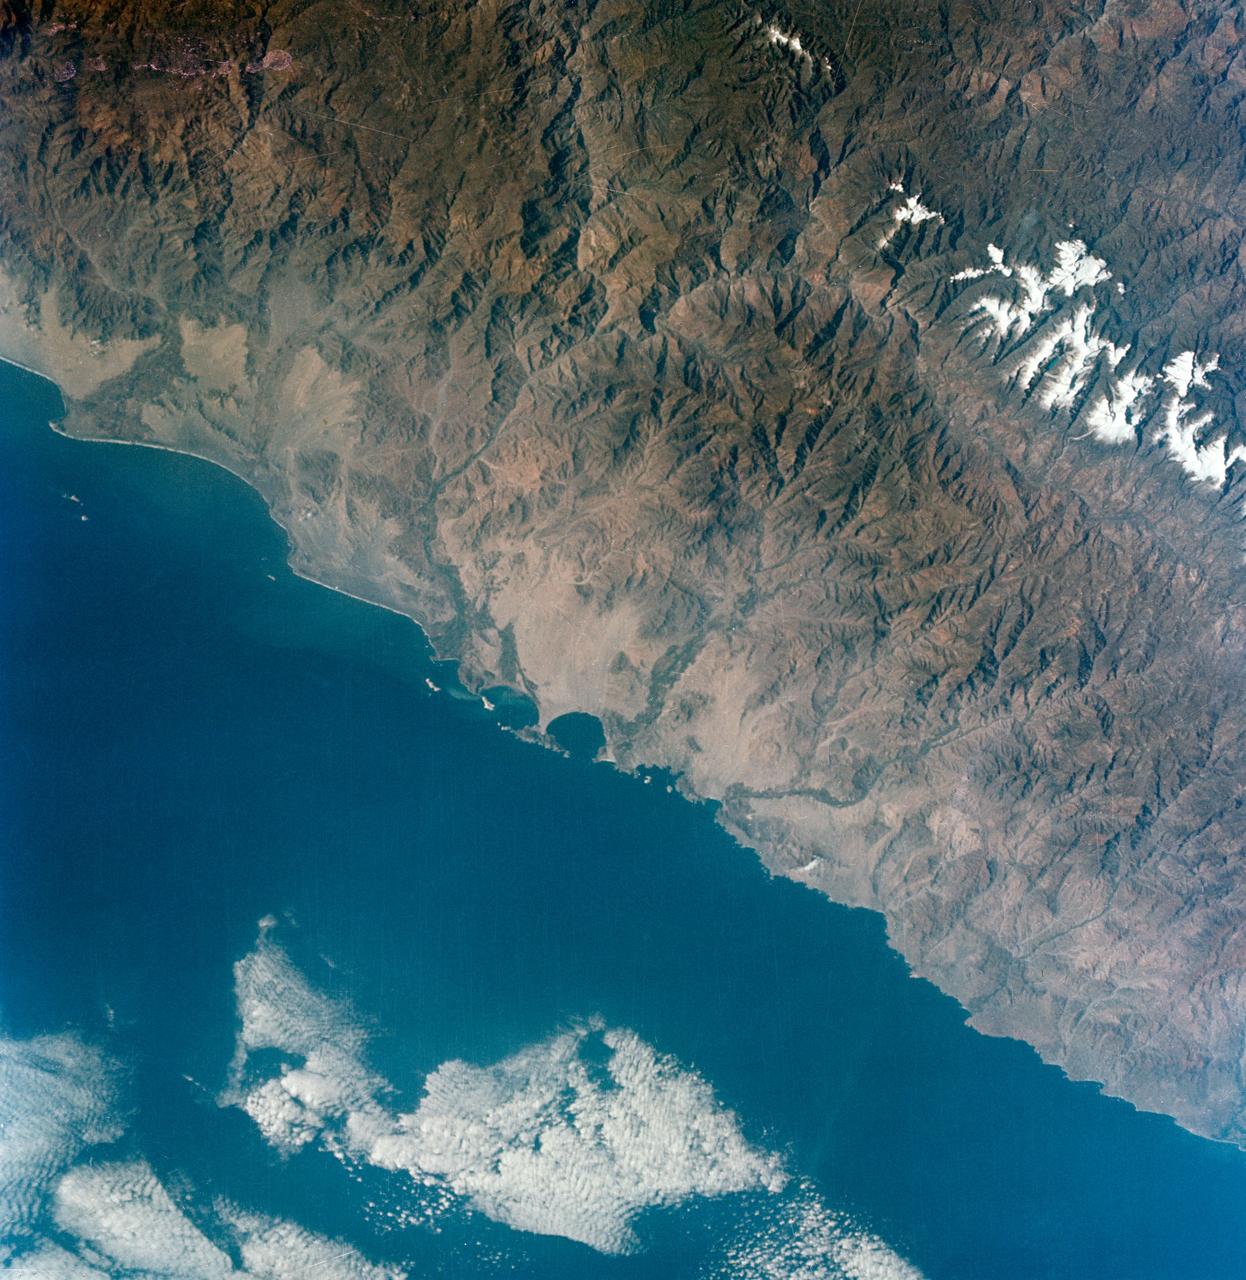
S66-38298 (5 June 1966) --- The central coastal area of Peru as seen from the Gemini-9A spacecraft during its 35th revolution of Earth. The body of water is the Pacific Ocean. The mountains are in the Cordillera Blanca range of the Andes. The 22,205-feet Huascaran is the highest peak in the area. The image was taken with a modified 70mm Hasselblad camera, using Eastman Kodak, Ektachrome MS (S.O. 217) color film Photo credit: NASA
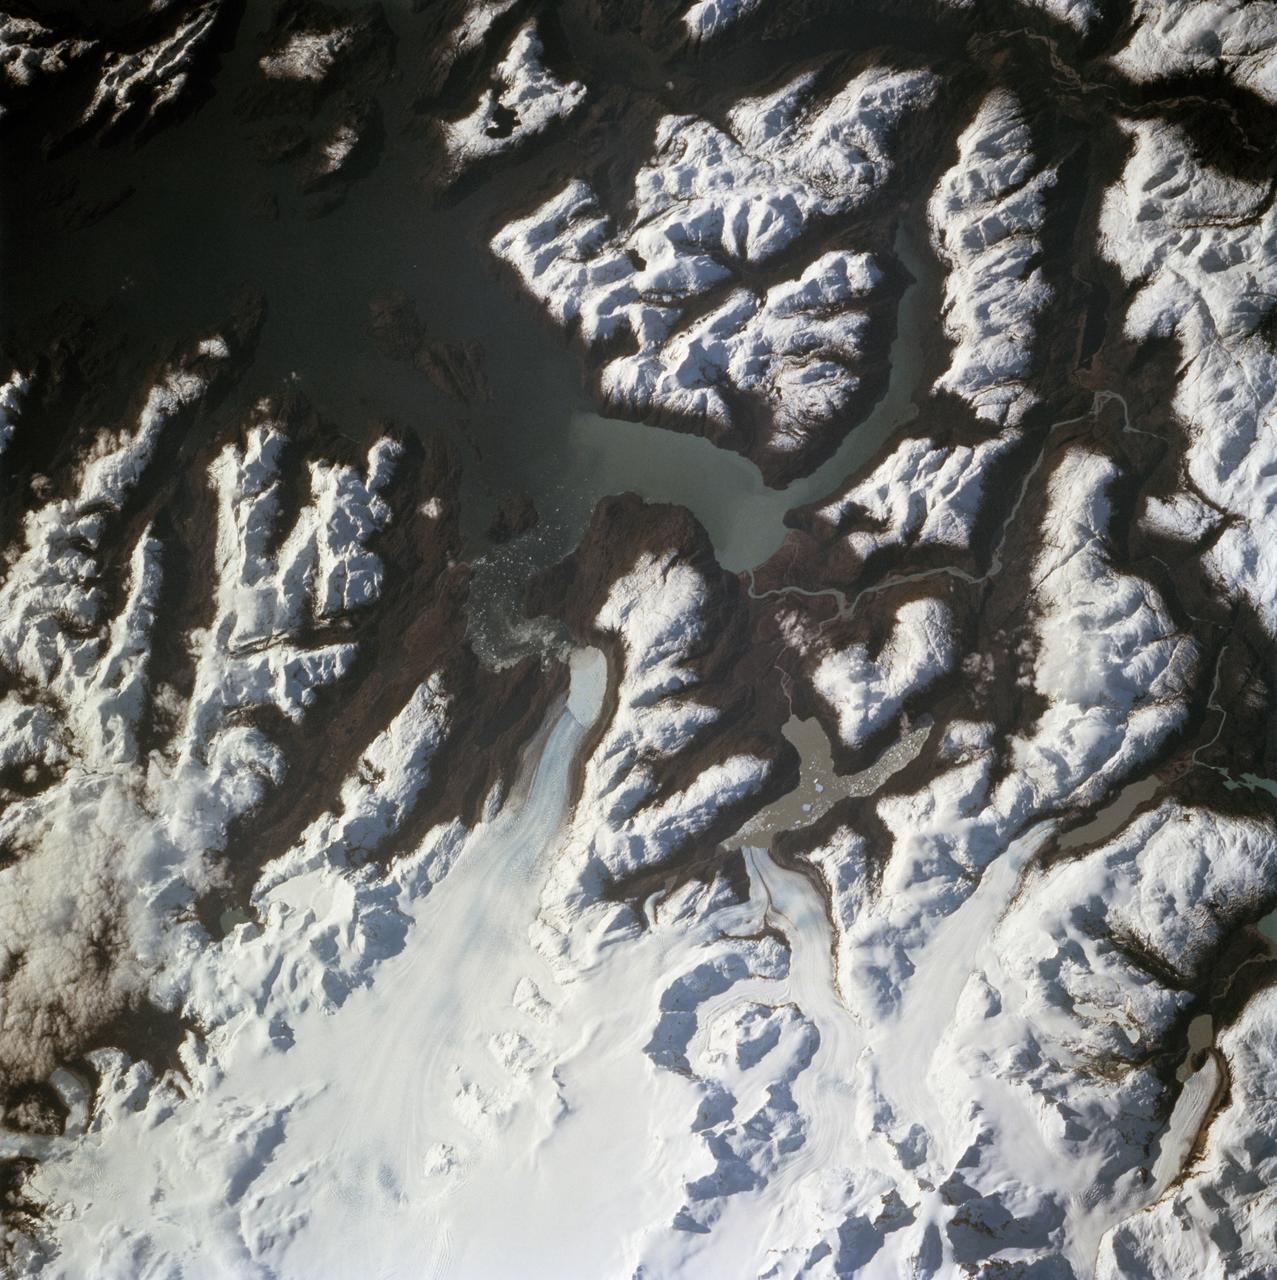
STS068-260-078 (30 September-11 October 1994) --- The ice visible along the bottom of this view is the north end of the larger (southern) of two great remaining ice field of the Andes Mountains in Chile. The longest glacier visible here flows down into the Calen Fjord (an arm of the Pacific Ocean known as Canal Baker) where numerous calved icebergs can be seen floating. The other three glaciers end in glacier-cut valleys with small lakes - the bigger lake has numerous icebergs as well. the river snaking through the mountains to the fjord drains water from the great Lake O'Higgins, which lies out of the picture to the right. Glacial mud can be seen emptying into the fjord and discoloring the water with its milky color.
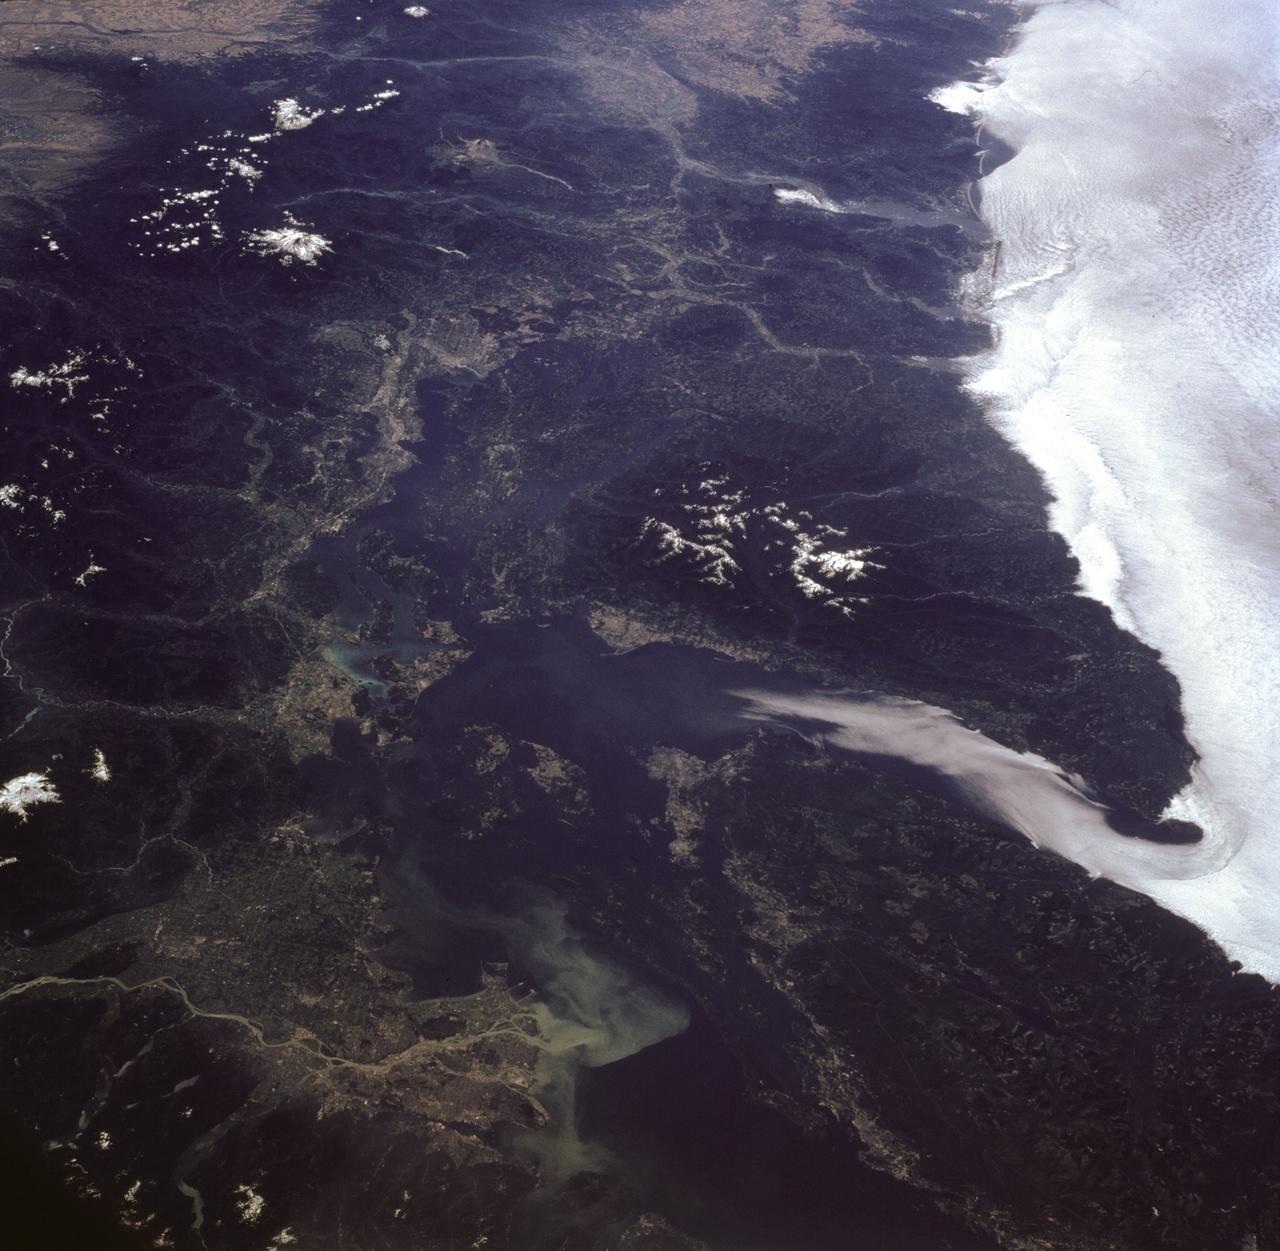
STS085-716-081 (7-19 August 1997) --- This photograph provides a southerly view from Vancouver, B. C. in the foreground, to Portland, Oregon near the top. Coastal stratus, a common occurrence, hugs the Pacific coastline and laps into Puget sound. The silty Fraser River cuts through Vancouver and empties into Puget Sound with a large, milky plume of sediment (bottom). Near the top of the image, the Columbia River runs across the Cascades (between Mt. Adams and Mt. Hood) and the Coast Ranges to the Pacific Ocean. Snow caps the highest peaks of the Olympic Mountains (near center), and the Cascade volcanoes of Rainier (closest to Seattle), Adams and Hood (top). The smaller, gray mountain just south (above and right) of Rainier is Mt. St. Helens.
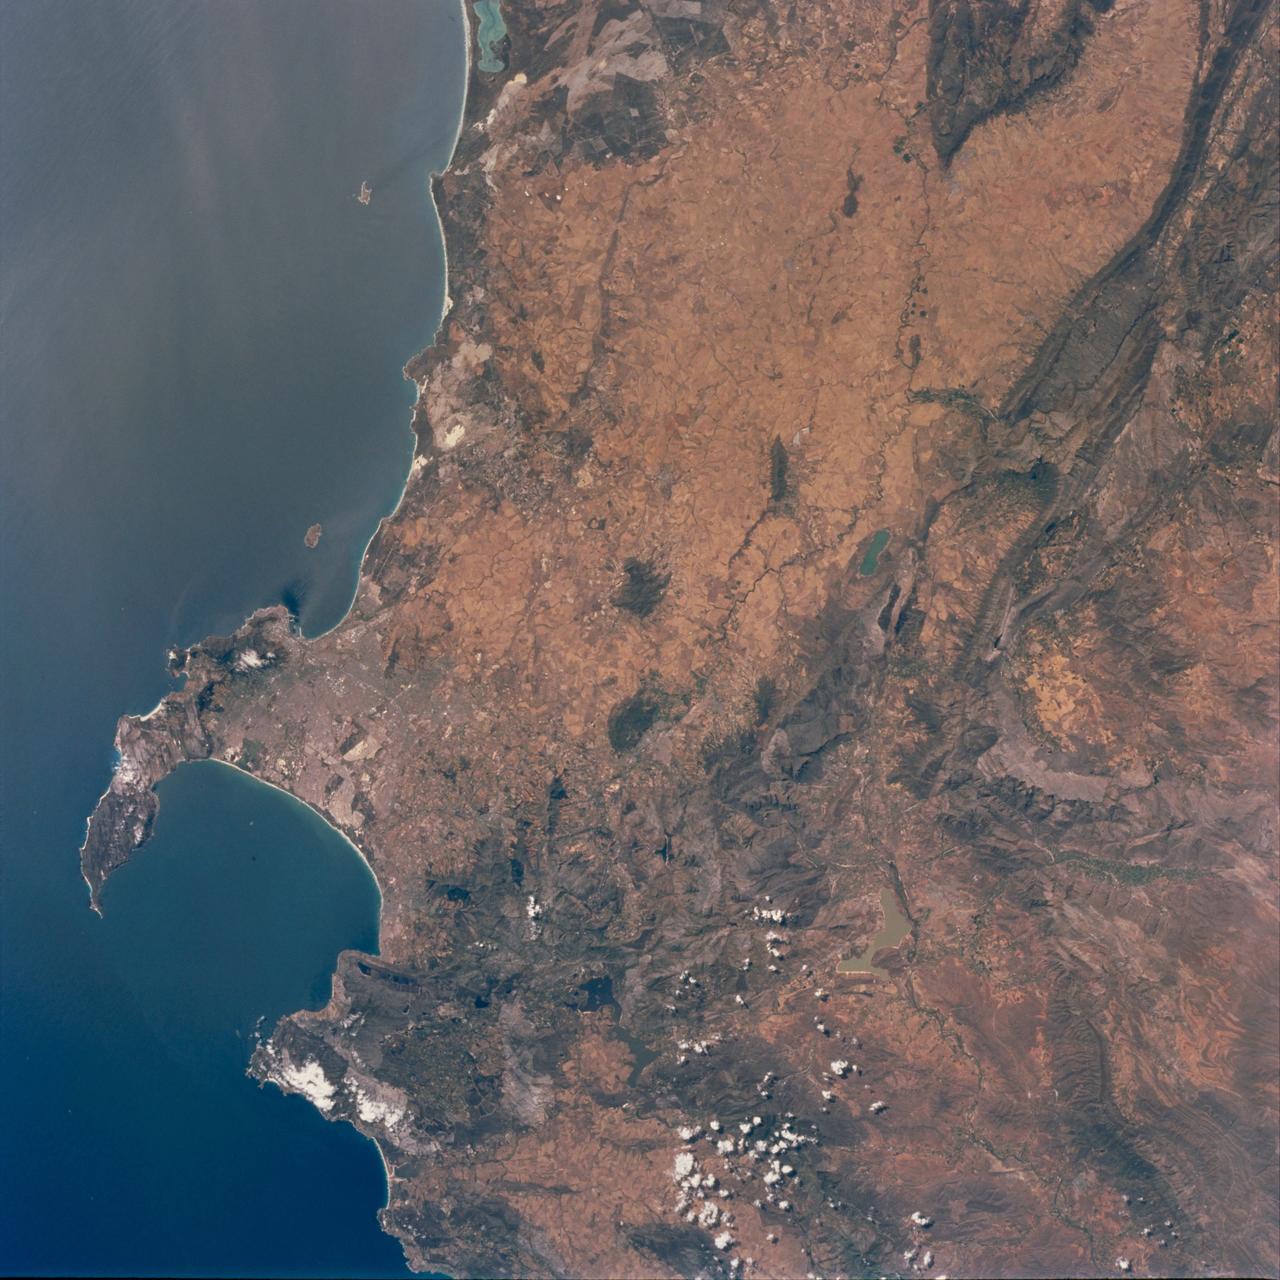
STS097-711-069 (30 Nov. - 11 Dec. 2000) This view featuring Cape Town and the Western Cape Province in the Republic of South Africa was provided by one of the STS-97 astronauts using a 70mm handheld camera aboard the Earth-orbiting Space Shuttle Endeavour. The capital and largest city of Western Cape Province, Cape Town (1995 population in the urban and suburban area shows in excess of 1.9 million), is visible between False Bay (large, U-shaped bay) and a smaller bay along the Atlantic coast of the peninsula. Within the urban built-up area some of the infrastructure of Cape Town, including the city center and the harbor and waterfront facilities, can be identified near the small bay (middle left edge of the image). Table Mountain elevation of 3563 feet (1086 meters above sea level) separates the city center (north of the mountain) from the southern suburbs of Cape Town. The Cape of Good Hope, long famous as the gateway from the Atlantic Ocean to the Indian Ocean, is located at the southern tip of the claw-shaped peninsula. False Bay is a popular recreational region for the local residents of the greater Cape Town region, as well as a tourist attraction for people who live beyond the borders of South Africa. The lighter-colored terrain, mainly north of Cape Town, shows a landscape of large, cultivated field patterns. These coastal plains are separated from the interior by a chain of folded mountain ranges that include the Cedarberg (dark, linear, north/south aligned feature in the upper right corner) and the more complex, folded Herrivierberge Mountains (dark structure, right middle) that are located northeast of Cape Town.

STS058-77-083 (18 Oct-1 Nov 1993) --- In this scene of the south coast of Africa, Cape Agulhas, the southernmost point on the continent, appears as the leftmost cape. Viewed with the Earth's limb top left, clouds at bottom, the view direction is west and north top right. The Cape of Good Hope, with Cape Town nearby, is the thin spike beyond. The great bay in the foreground is Algoa Bay with the city of Port Elizabeth. This was the first time European voyagers are known to have rounded the Cape of Good Hope in their quest to reach India by sea. The entire fold mountain belt of southern Africa is visible: these mountains appear as green (forested) wavy structures stretching west form the foreground, to the Cape of Good Hope, and then northwards some distance. One theory about their origin is that the Falkland Plateau, now an undersea extension of South America, was jostled up against Africa more than 150 million years ago, in times before the Atlantic Ocean existed, before Africa and South America drifted apart from one another. The jostling caused the evolution of the fold mountain belt.
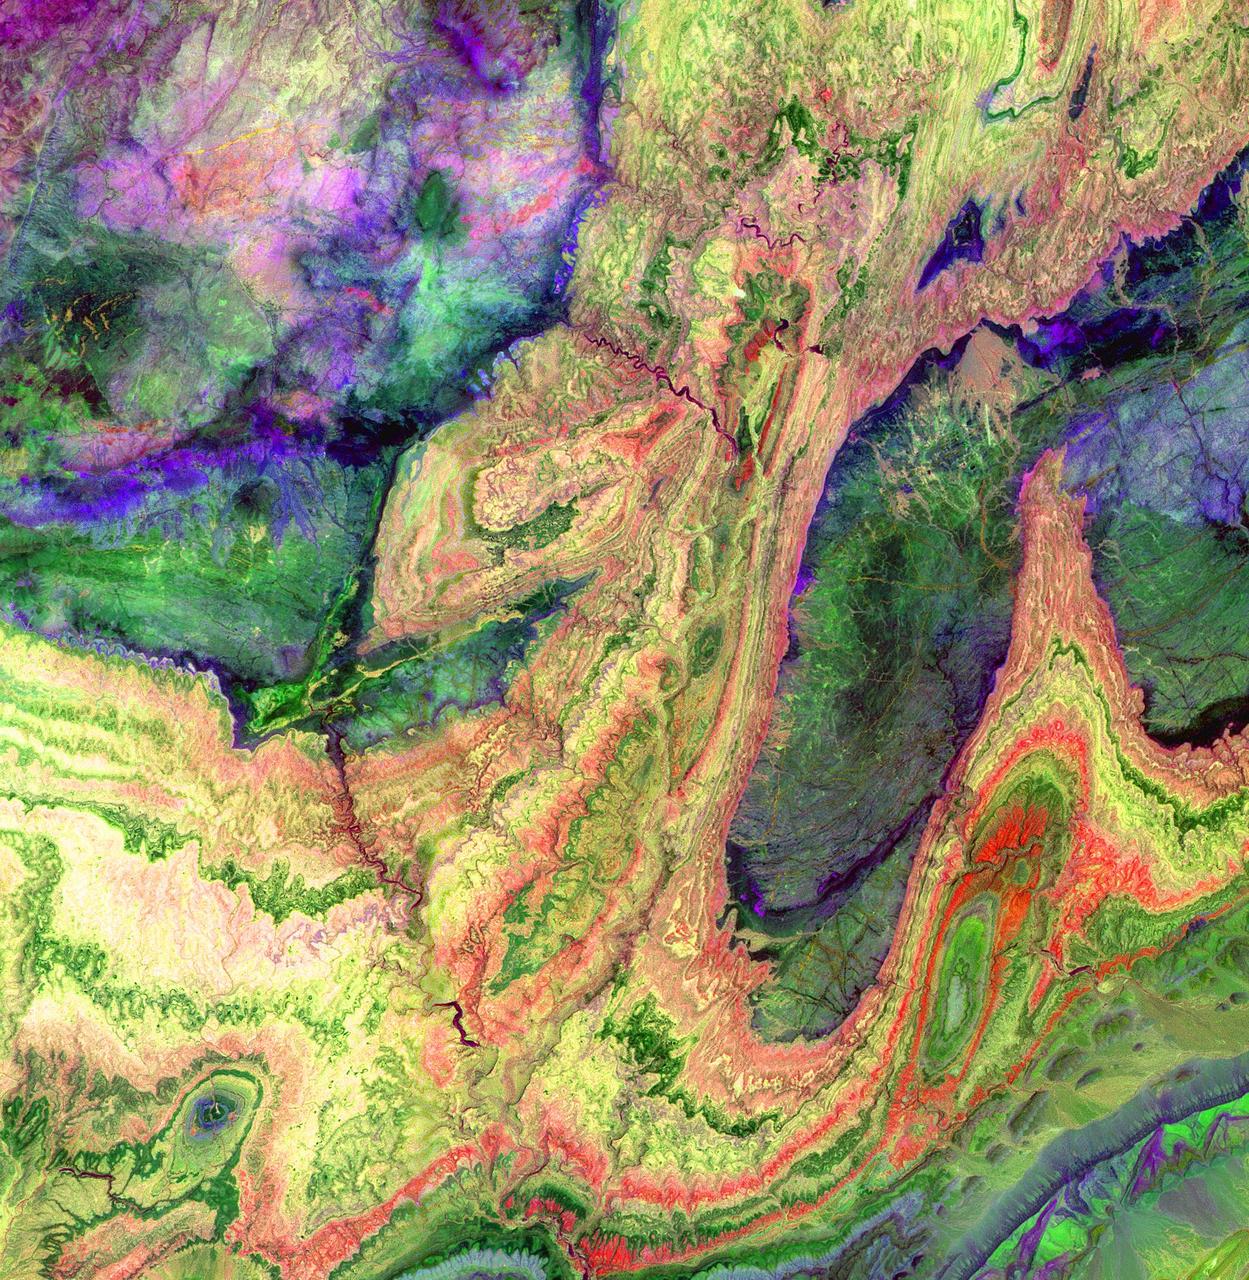
The Anti-Atlas Mountains of Morocco formed as a result of the collision of the African and Eurasian tectonic plates about 80 million years ago. This collision destroyed the Tethys Ocean; the limestone, sandstone, claystone, and gypsum layers that formed the ocean bed were folded and crumpled to create the Atlas and Anti-Atlas Mountains. In this ASTER image, short wavelength infrared bands are combined to dramatically highlight the different rock types, and illustrate the complex folding. The yellowish, orange and green areas are limestones, sandstones and gypsum; the dark blue and green areas are underlying granitic rocks. The ability to map geology using ASTER data is enhanced by the multiple short wavelength infrared bands, that are sensitive to differences in rock mineralogy. This image was acquired on June 13, 2001 by the Advanced Spaceborne Thermal Emission and Reflection Radiometer (ASTER) on NASA's Terra satellite. With its 14 spectral bands from the visible to the thermal infrared wavelength region, and its high spatial resolution of 15 to 90 meters (about 50 to 300 feet), ASTER images Earth to map and monitor the changing surface of our planet. http://photojournal.jpl.nasa.gov/catalog/PIA03893
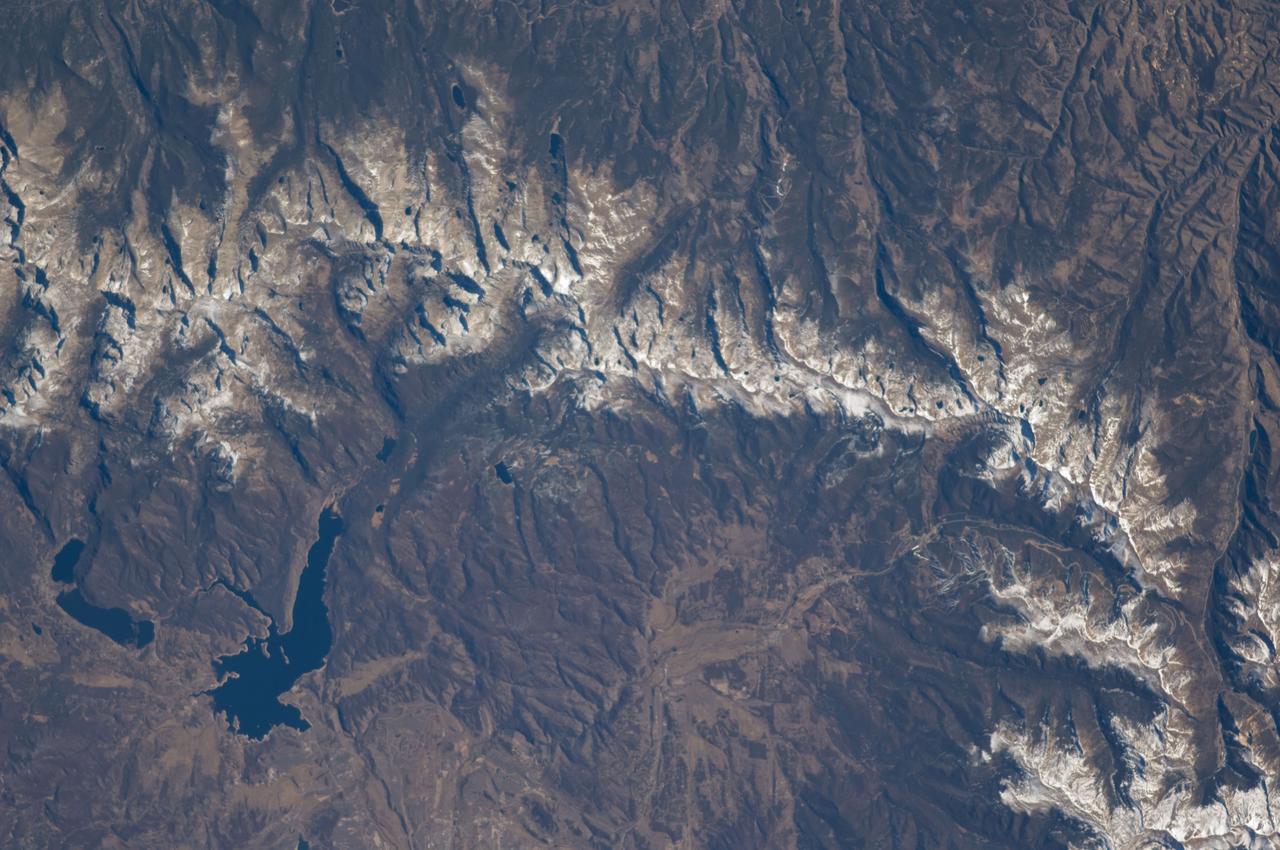
ISS018-E-005660 (28 Oct. 2008) --- The Great Divide of the Rocky Mountains in Colorado is featured in this image photographed by an Expedition 18 crewmember on the International Space Station. This view highlights a portion of the Great Divide in the Rocky Mountains approximately 31 kilometers due west of Boulder, Colorado. The Great Divide is one of four continental divides recognized by geographers and hydrologists in North America -- the others being the Northern, Eastern, and Saint Lawrence Seaway Divides -- but it is still generally (and erroneously) known as "the" Continental Divide. The Great Divide is a hydrologic boundary defined by the ultimate destination of precipitation -- rainfall on the western side of the Divide flows to the Pacific Ocean, while rainfall on the eastern side of the Divide flows to the Gulf of Mexico. It is easy to visualize such a boundary traced along the high ridges of the Rocky Mountains, but in regions of less topography more detailed study of the local geomorphology and hydrology are required to map the location of the Divide. This portion of the Rocky Mountains also hosts the Niwot Ridge Long Term Ecological Research (LTER) site. Part of the National Science Foundation LTER program, the Niwot Ridge LTER site studies climate interactions with tundra and alpine ecosystems. Niwot Ridge is visible in this image as a large eastward spur off the central spine of the mountains. The entire Niwot LTER site is located at elevations higher than 3000 m, and includes an active cirque glacier and glacial landforms, tarns (glacial lakes), and permafrost. Lake Granby, located to the west of the Great Divide, is a reservoir on the Colorado River and the second-largest manmade body of water in the state of Colorado. Storage of water began in 1949. Today, the Lake is popular location for fishing, boating and camping.
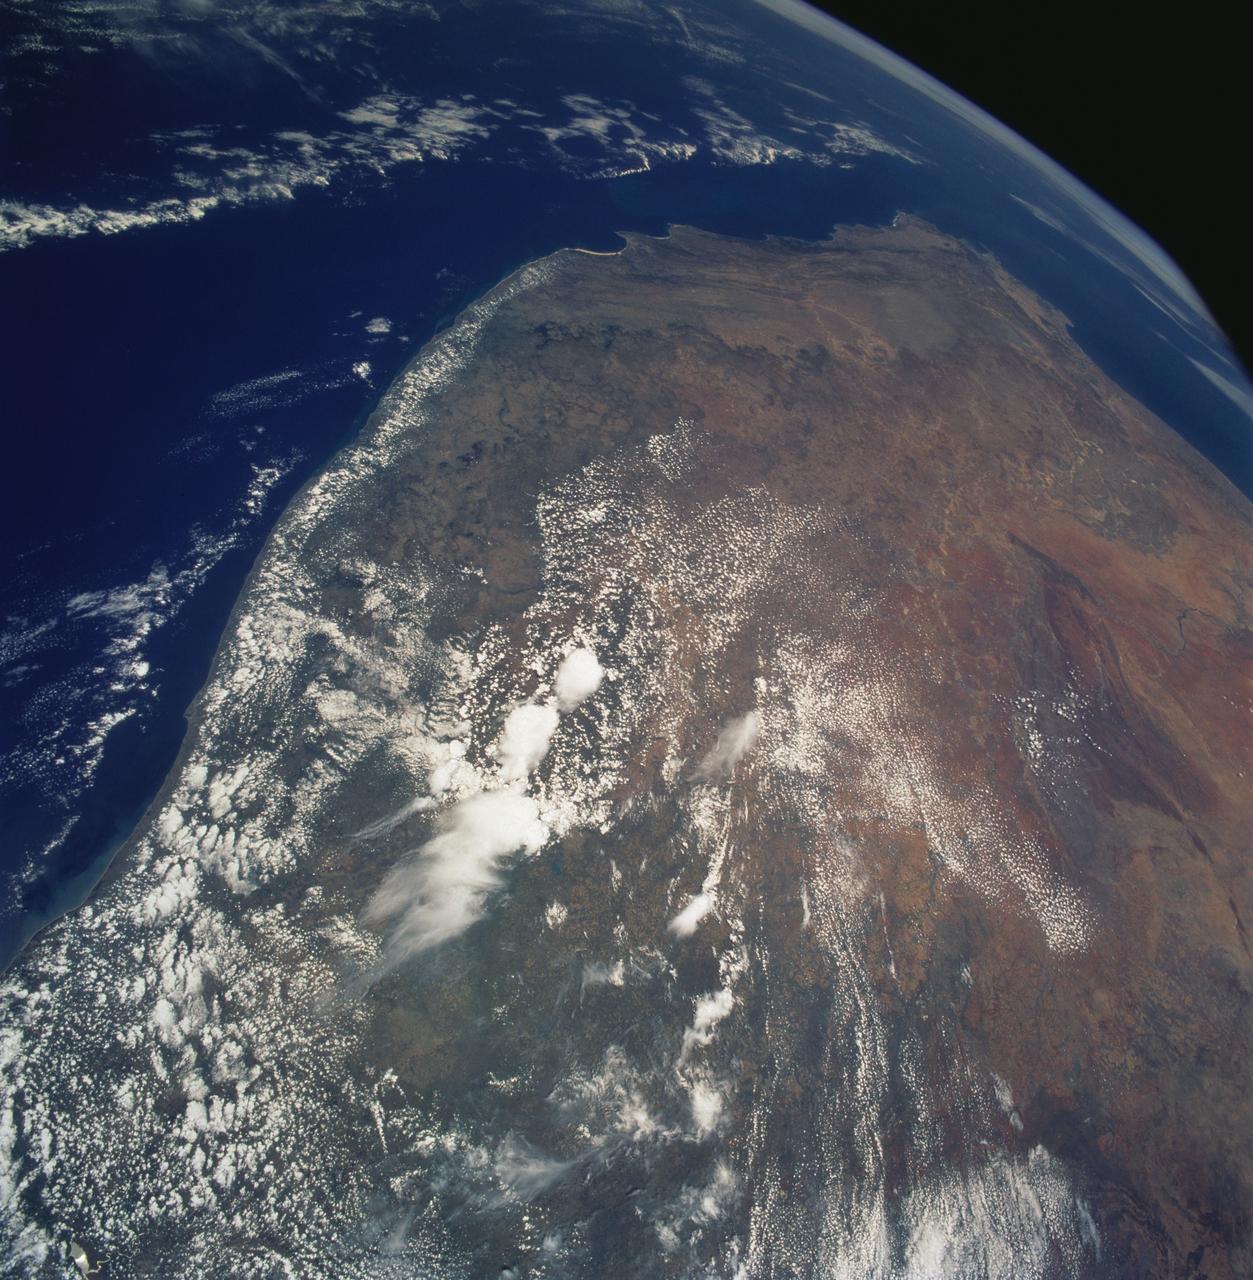
STS061-106-091 (December 1993) --- The entire southern tip of Africa is shown in this high altitude 50mm photograph. The center of the photograph is at approximately 28.0 degrees south and 24.0 degrees east Cape Columbine is at the upper right with Durban at the lower center. The Orange River is at the upper center of the frame. Cape Agulas is the southernmost part of the African continent and is visible toward the upper right corner with the great bays of South Africa trending toward the bottom right. Continuing clockwise along the coast, Durban projects out into the Indian Ocean. The oceanic clouds on the right side of the photograph probably depict a current boundary. The Drakensberg Range on the east, the great Karoo Range to the south and the Karas Mountains on the west surround the drier central plateau. The southern Kalahari Desert is at the upper left of the photograph.
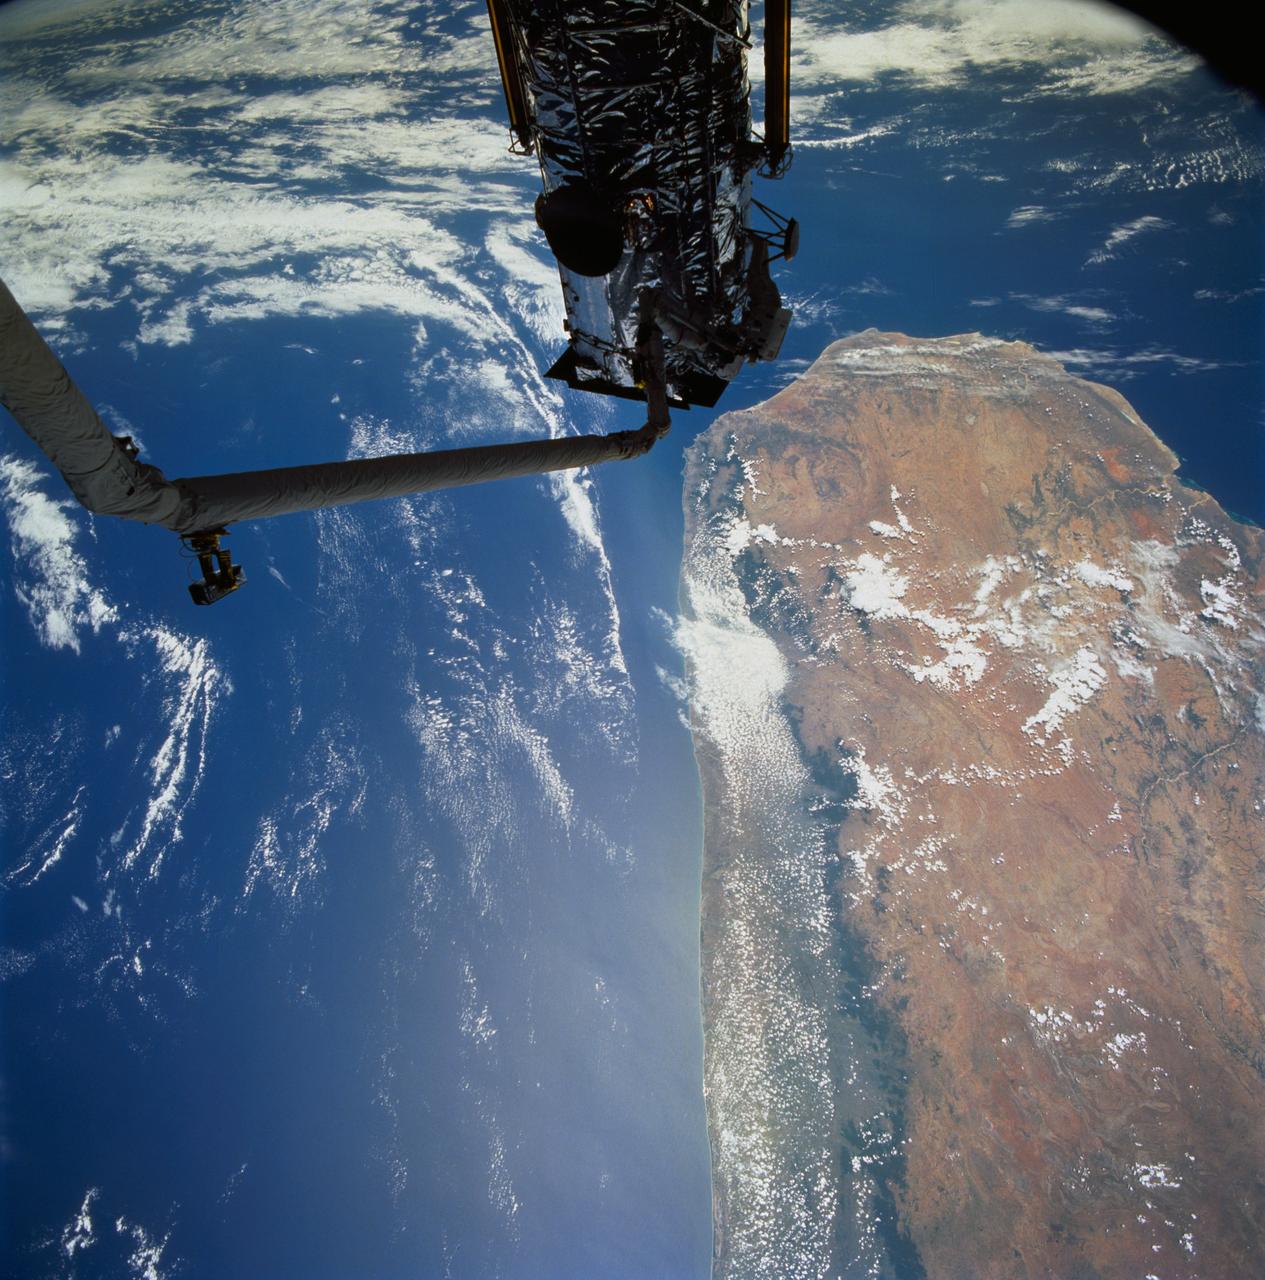
STS061-77-102 (7 Dec 1993) --- Astronauts Jeffrey A. Hoffman (left) and F. Story Musgrave are partially silhouetted against the Indian Ocean as they work to install the Magnetic Sensing System (MSS) on the Hubble Space Telescope (HST). Musgrave is anchored to the end of the Space Shuttle Endeavour's Remote Manipulator System (RMS) arm. The HST is positioned along the southern end of Madagascar, 325 nautical miles away. Visible on the western coast are the sediment laden Onilahy and Fiherenana Rivers which empty into Saint Augustin Bay. North of Fiherenana River is the Mangoky River. The circular feature on the southern end of Madagascar and to the right of HST is the L'ivakoany Mountains. The eastern coast is relatively straight compared to the western coast.
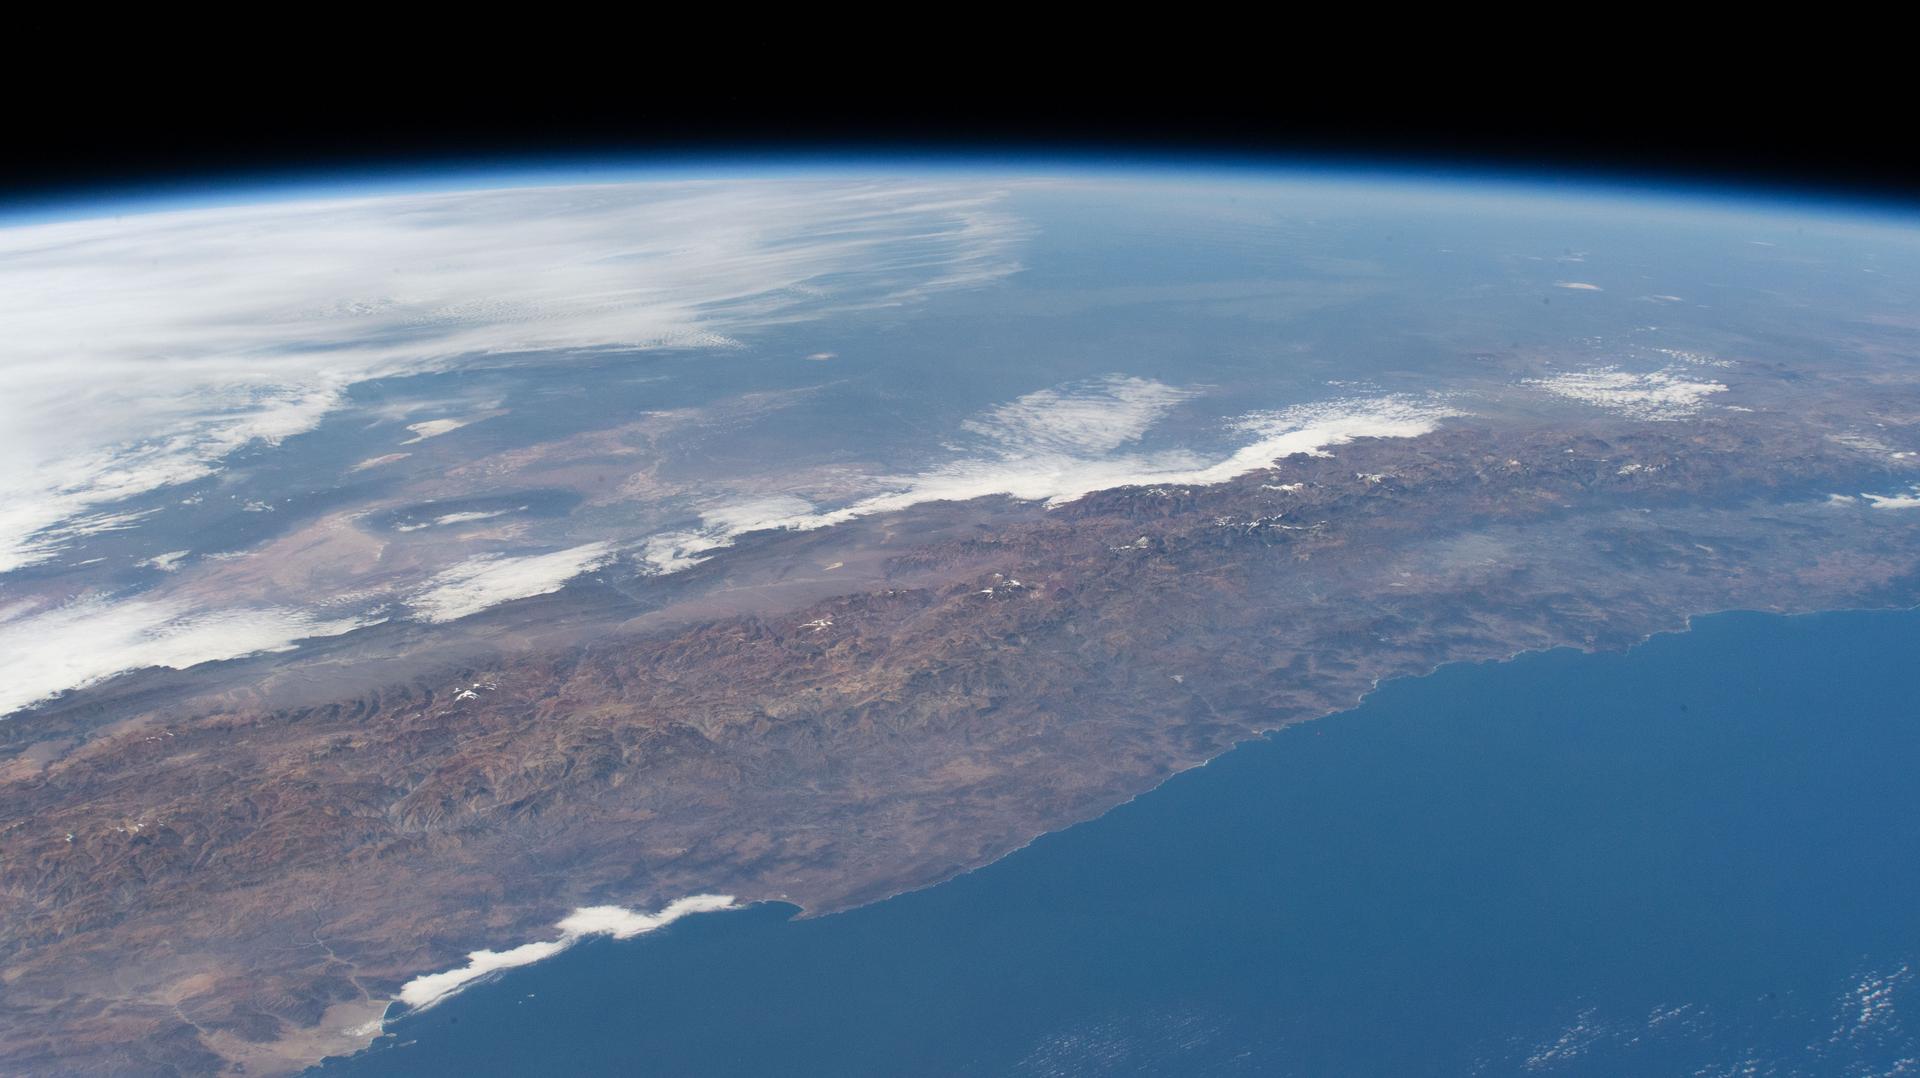
iss074e0349412 (March 3, 2026) --- The Andes mountain range running between Chile and Argentina creates distinct differences in climate and geography between the two South American nations. Chile’s Pacific coastline contributes to its moderate temperatures, with the Atacama Desert in the north being one of the driest places on Earth, while its central and southern regions are cooler and wetter. Argentina’s western side is more arid because the Andes block moisture from the Pacific Ocean, while the country’s Atlantic coastline receives more precipitation than its interior and western regions. Credit: NASA
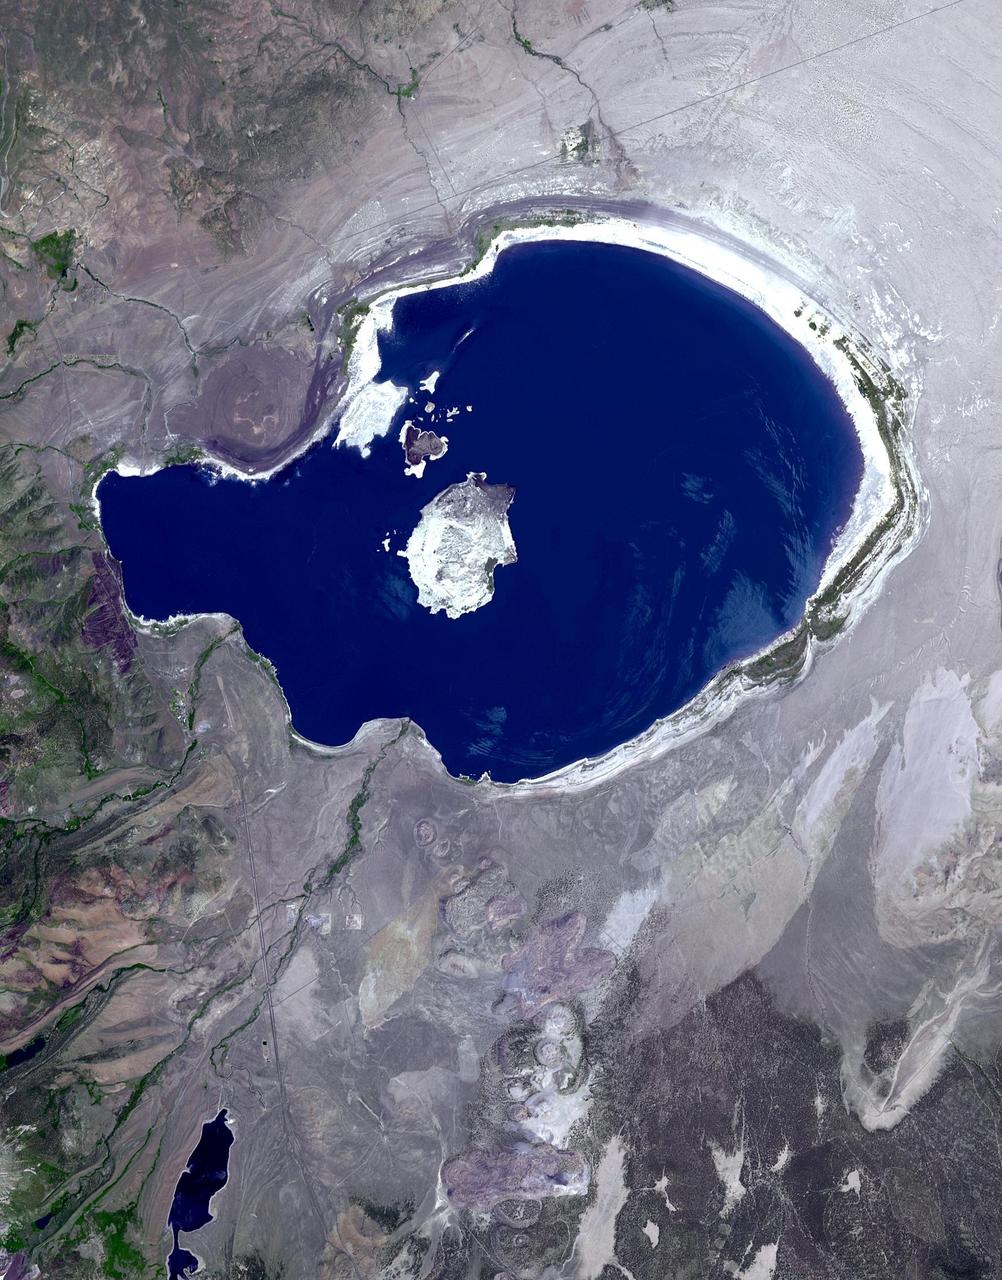
In eastern California, along the western edge of the Great Basin, sits Mono Lake. This is a salty remnant of a wetter era. Estimates are that the lake existed for at least 760,000 years. Now surrounded by mountain ranges, however, Mono Lake has no outlet; water entering the lake can only evaporate away, so Mono Lake is saltier than the ocean. South of the lake appear some of the geologic features known as Mono Craters. Geologists estimate that the Mono Craters last erupted about 650 years ago. The image was acquired July 7, 2016, covers an area of 22.6 by 34 km, and is located at 37.9 degrees north, 119 degrees west. http://photojournal.jpl.nasa.gov/catalog/PIA21518
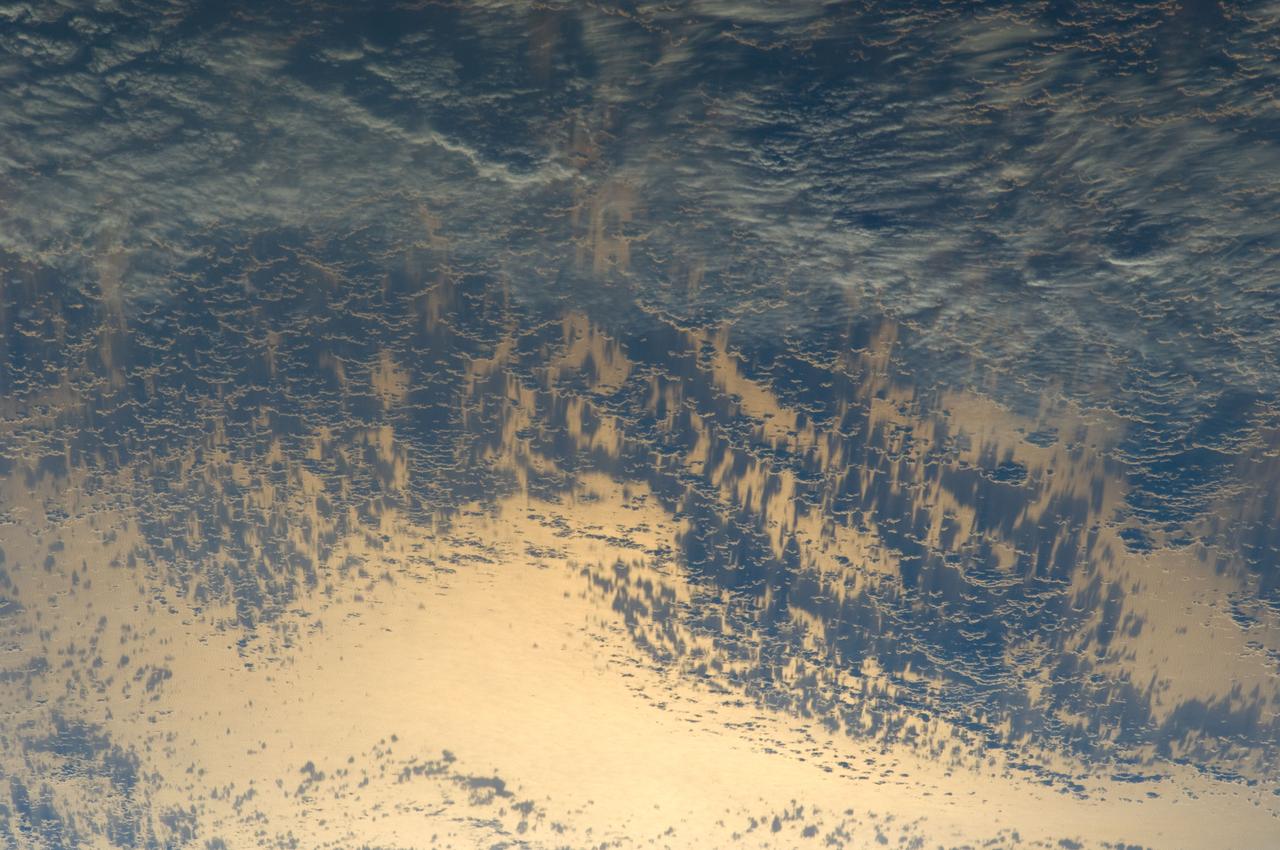
ISS031-E-035310 (15 May 2012) --- Sunglint and clouds off Western South America are featured in this image photographed by an Expedition 31 crew member on the International Space Station. The setting sun highlights cloud patterns above the Pacific Ocean, as well as the ocean surface itself in this impressive image. The space station was located over the Andes Mountains of central Chile at the time. The view is looking towards the Pacific Ocean and the sun setting in the west (towards lower left). Light from the setting sun reflects off the water surface towards the observer on the space station and creates a mirror-like appearance—a phenomenon known as sunglint. Bands of relatively low altitude cumulus clouds appear much like a flotilla of ships with their west-facing sides illuminated by the waning sunlight and the rest in shadow (center). Due to the low sun angle, they cast long and deep shadows over large swaths of the ocean surface. Given the short camera lens used, an individual cloud shadow may extend for miles. Light gray clouds at upper right appear to be at a higher altitude. The cloud cover is likely a remnant of a frontal system that moved inland over South America from the Pacific a day or two prior to the time the image was taken.
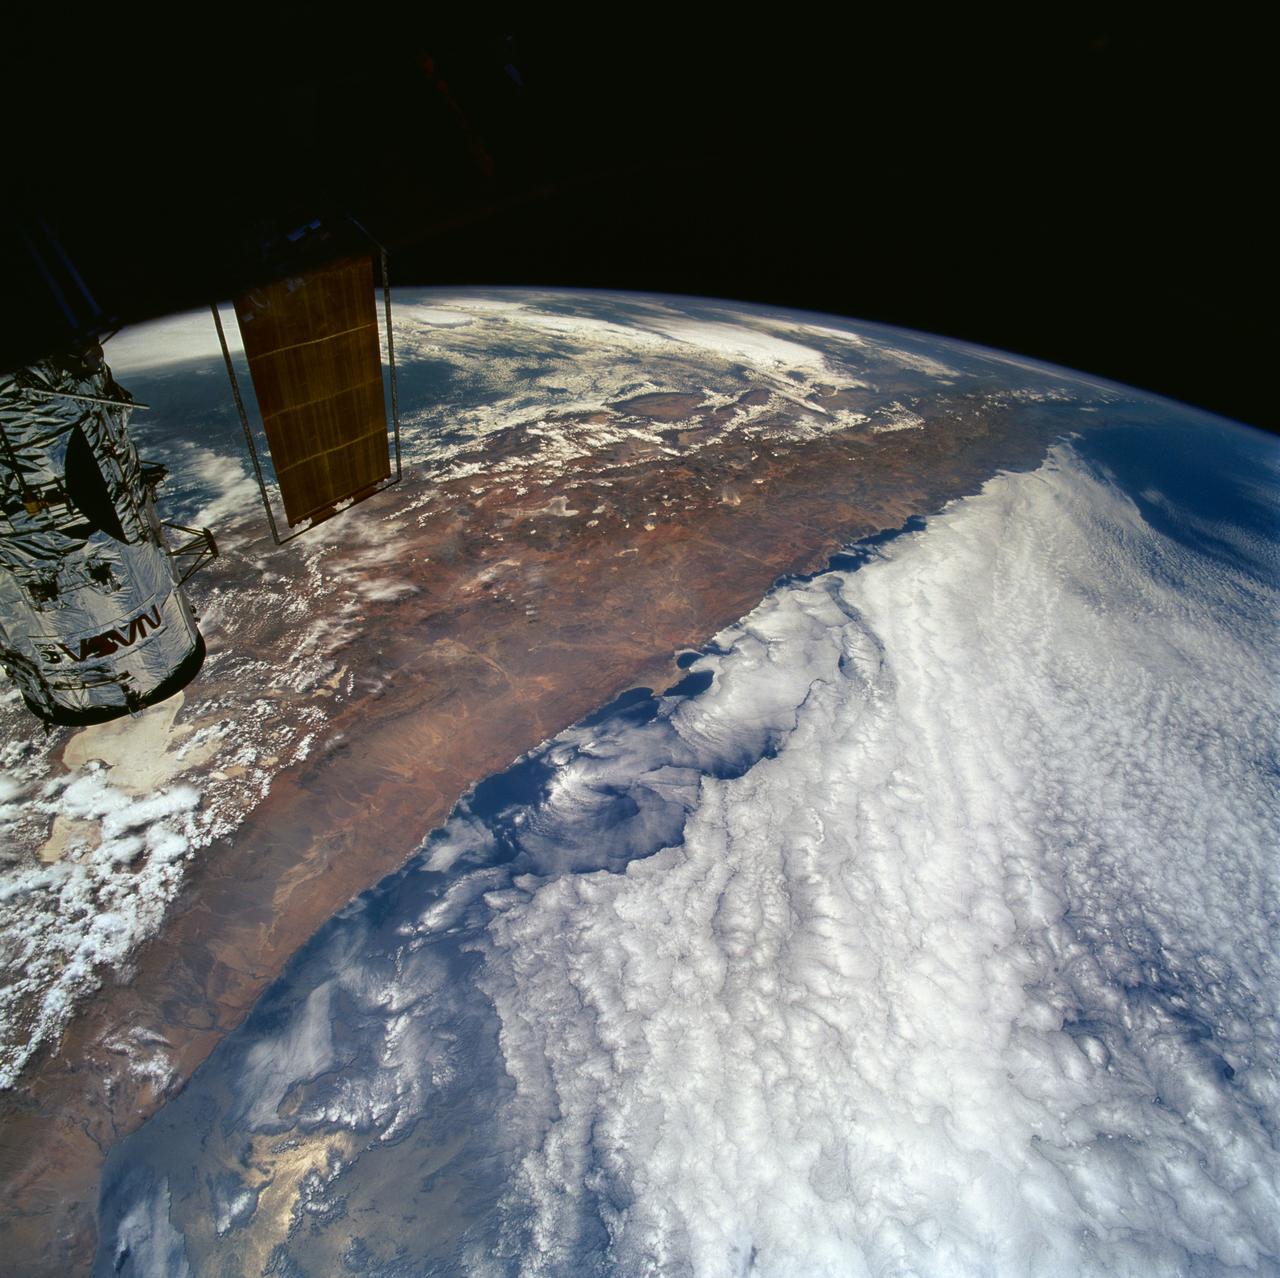
STS061-101-023 (8 Dec 1993) --- This color photograph is a spectacular, panoramic (southeastern view) shot that features the northern half of the country of Chile and the Andes Mountains of South America. The Atacama Desert, one of the driest regions on earth, is clearly visible along the northern Chilean coast. This desert extends from roughly Arica in the north to the city of Caldera in the south, a distance of six hundred miles. Some parts of this very arid region go for more than twenty years without measurable precipitation. It is an area of dramatic and abrupt elevation changes. For example, from the waters edge there is an escarpment of the coastal plateau that rises like an unbroken wall two or three thousand feet above the Pacific Ocean. From the coastal plateau, there is an even more dramatic increase in elevation -- from two thousand feet above sea level to an average elevation of thirteen thousand feet above sea level in the Bolivian Altiplano. This elevation change occurs within a one hundred to two hundred mile distance from the Pacific Ocean. The north-south trending spine of the Andes Mountains can be seen on this photograph. Several of the volcanic peaks in this mountain chain exceed 20,000 feet above sea level. Interspersed with these volcanic peaks, numerous dry lake beds (salars) can be seen as highly reflective surfaces. The largest of these salars (Salar de Uyuni) is visible at the edge of the Hubble Space Telescope (HST). Offshore, the cold Peruvian current produces low stratus clouds that can be found along this coastline at certain times of the year. This is the same type of meteorological phenomena that is found along the southern California coast and the Skeleton coast of southwestern Africa.
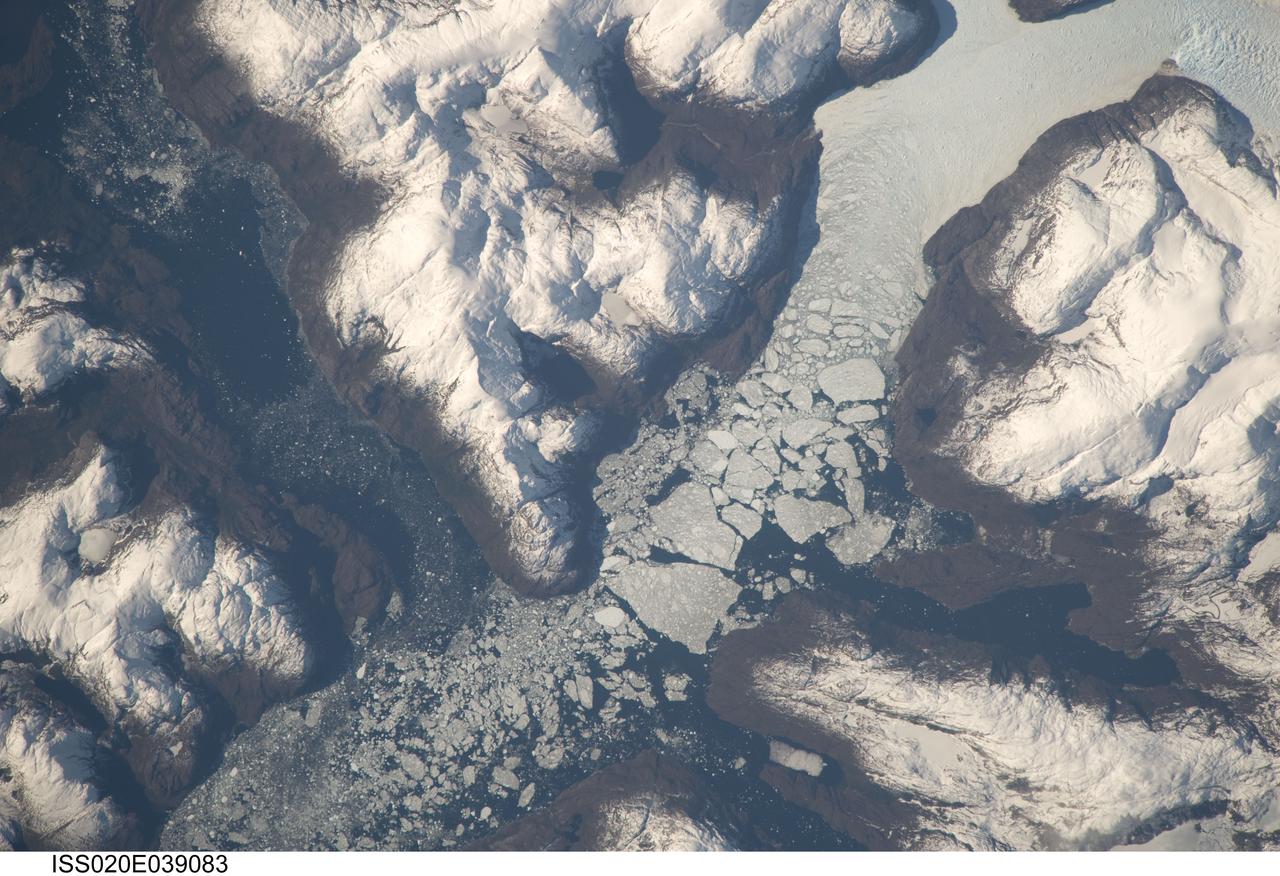
ISS020-E-039083 (6 Sept. 2009) --- Glacier outlet in the Southern Patagonian Ice Field of Chile is featured in this image photographed by an Expedition 20 crew member on the International Space Station. The Southern Patagonian Ice Field of Chile and Argentina hosts a spectacular array of glaciers and associated glacial features within the southern Andes Mountains. Glaciers flowing downhill on the eastern side of the mountains have outlets into several large freshwater lakes. On the western side of the mountains, glaciers release ice into the Pacific Ocean via an intricate network of fjords. Fjords are steep valleys originally cut by glaciers during periods of lower sea level that are now inundated. As glaciers flow into the fjord, ice at the front of the glacier begins to break off and form icebergs that can float out to sea ? a process known as calving. This detailed photograph shows the merged outlet of Penguin Glacier and HPS 19 into a fjord carved into the snow-covered mountains of the southern Andes. The designation HPS stands for Hielo Patagonico Sur (e.g. Southern Patagonian Ice field) and is used to identify glaciers that have no other geographic name. Ice flowing into the fjord begins to break up at center, forming numerous icebergs ? the largest visible in this image is approximately 2 kilometers in width. The large ice masses visible at center have a coarse granular appearance due to variable snow cover, and mixing and refreezing of ice fragments prior to floating free.
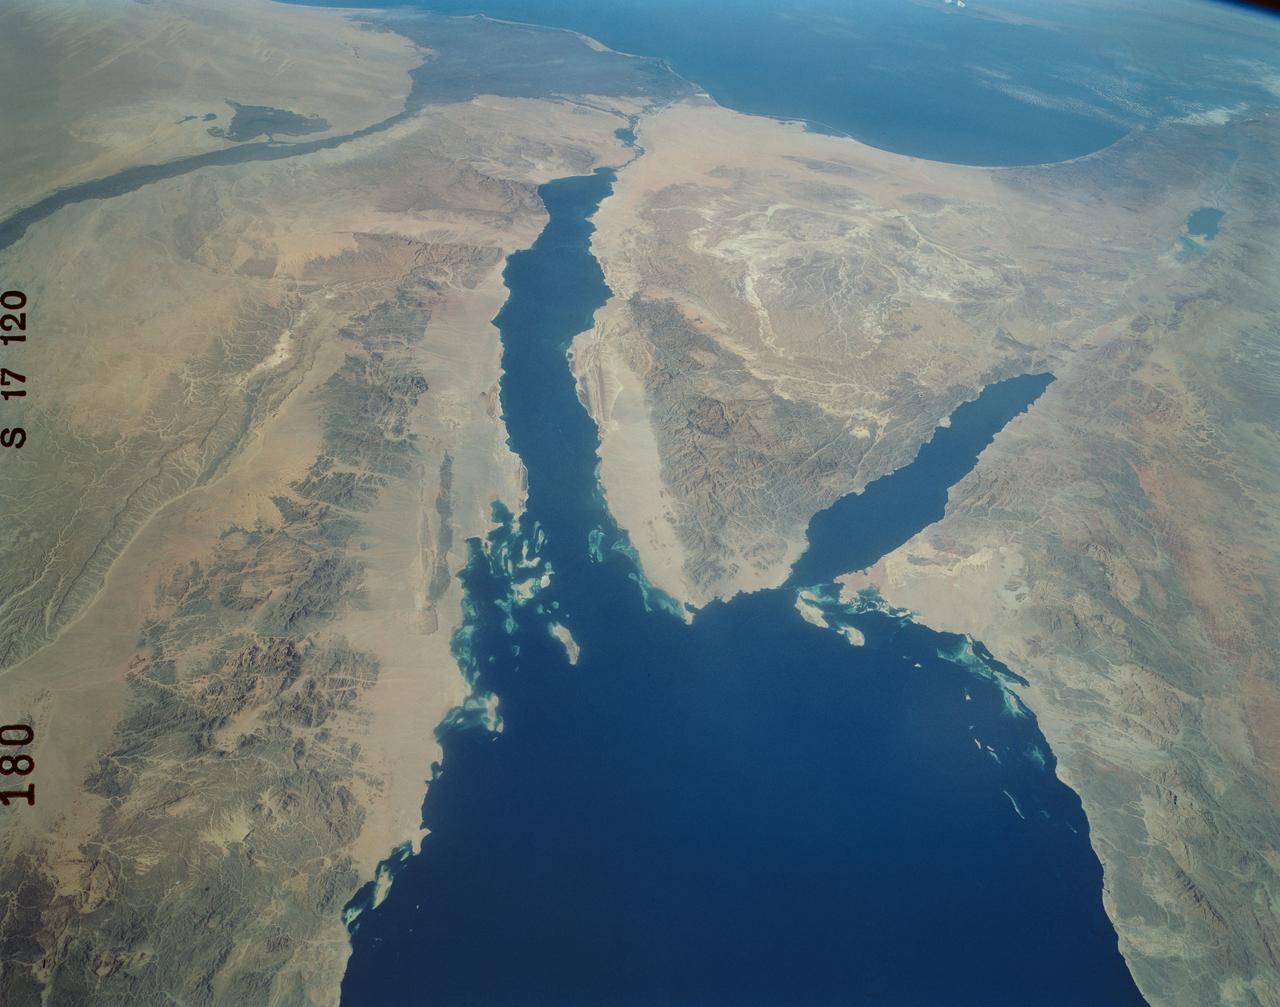
An excellent panoramic view of the entire Sinai Peninsula (29.0N, 34.0E) and the nearby Nile River Delta and eastern Mediterranean coastal region. The Suez Canal, at the top of the scene just to the right of the Delta, connects the Mediterranean Sea with the Gulf of Suez on the west side of the Sinai Peninsula and the Gulf of Aqaba is on the west where they both flow into the Red Sea. At upper right, is the Dead Sea, Jordan River and Lake Tiberius.
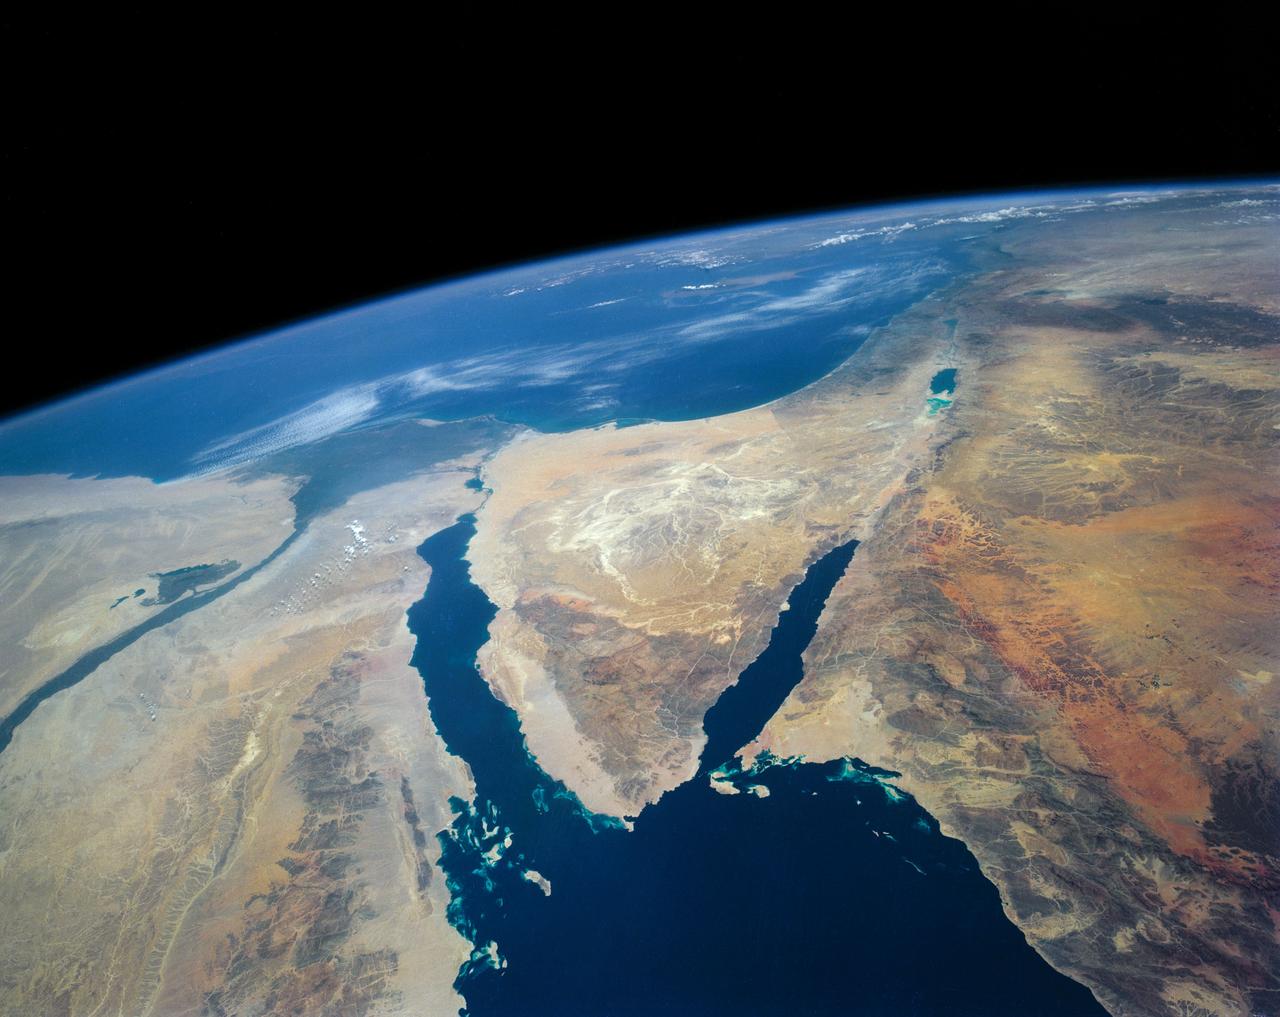
STS040-152-180 (5-24 June 1991) --- The Sinai Peninsula dominates this north-looking, oblique view. According to NASA photo experts studying the STS 40 imagery, the Red Sea in the foreground is clear of river sediment because of the prevailing dry climate of the Middle East. The great rift of the Gulf of Aqaba extends northward to Turkey (top right) through the Dead Sea. The international boundary between Israel and Egypt, reflecting different rural landscapes, stands out clearly. The Nile River runs through the frame. NASA photo experts believe the haze over the Mediterranean to be wind-borne dust. The photo was taken with an Aero-Linhof large format camera.
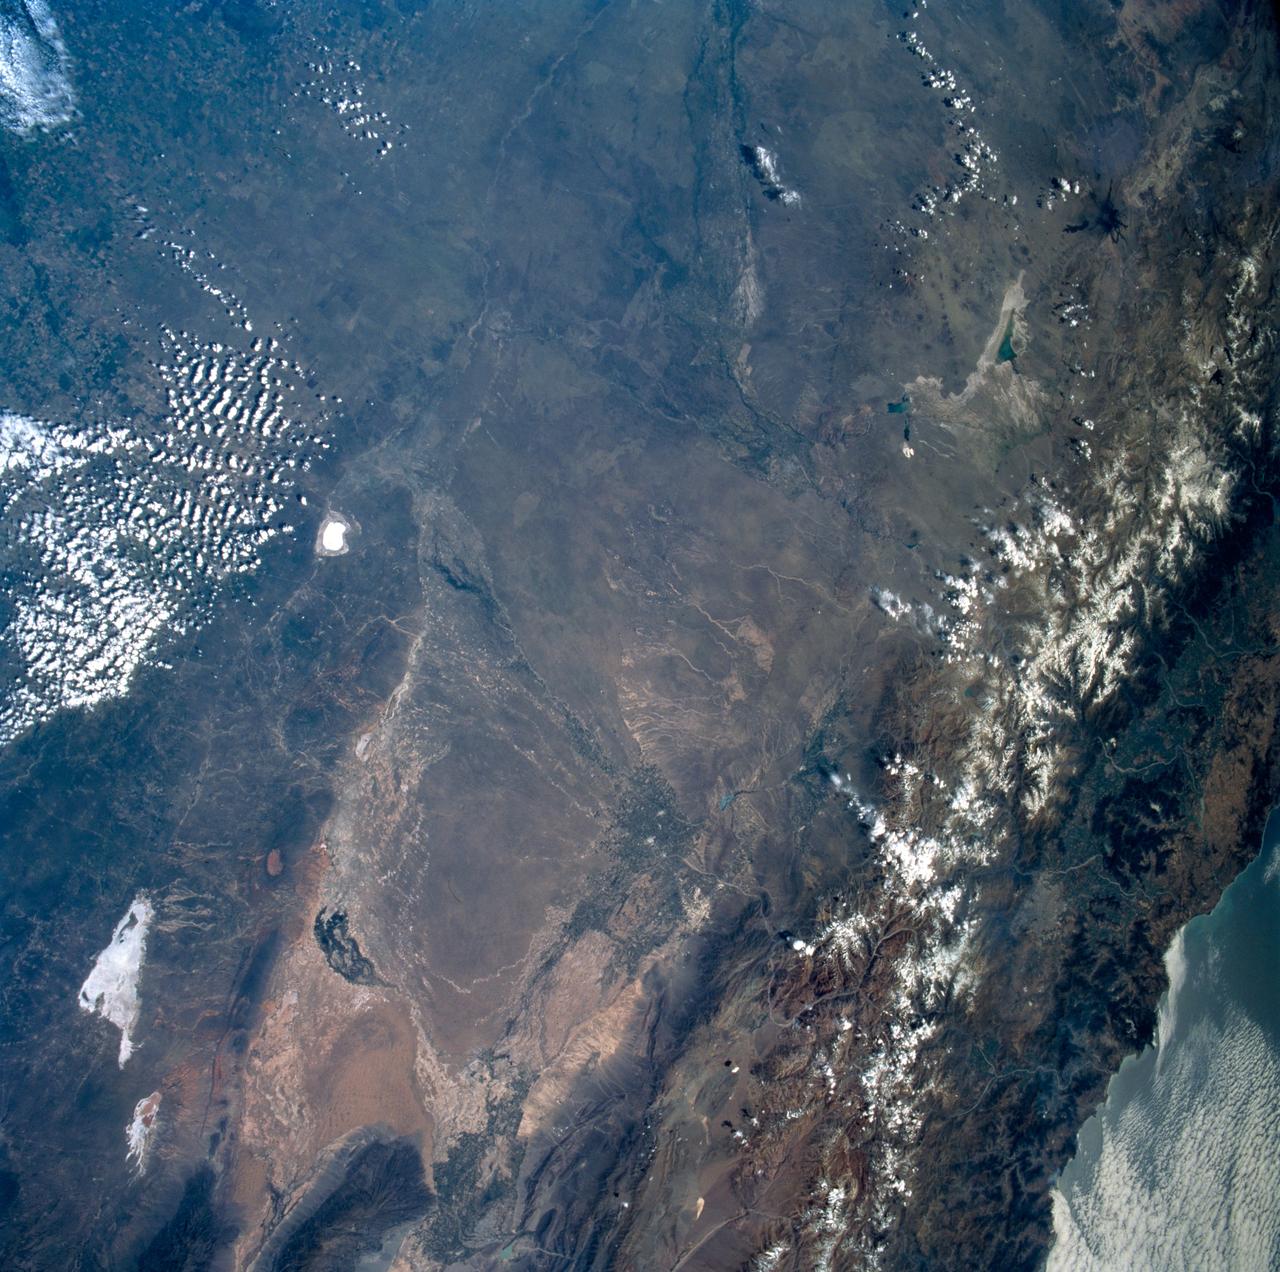
STS089-742-014 (22-31 Jan. 1998) --- This near-nadir picture of the central Andes, showing Santiago and other parts of Chile and Argentina, was photographed with a 70mm handheld camera from the Earth-orbiting space shuttle Endeavour. Santiago (population 4.7 million) is visible to the right of center, west of the snow-capped Andes Mountains. Mendoza, Argentina is the light spot in the upper center of the image in the eastern foothills of the Andes. Cerro Aconcagua, the highest peak in South America (22,834 feet) is due west of Mendoza. Note the sharp bend in the river valley to the junction with a straight north-trending valley. Aconcagua is the large, rounded mass with a bit of cloud just northwest of the valley junction. Bright white spots on the left of the image are salars, or dry lake beds of gypsum and/or salt. Usually dry, some contain water due to recent rains generated by the record El Nino this year. The Pacific Ocean is to the upper right. The continental shelf is very steep in this region and water depths drop (to almost 17,000 feet over a distance of about 60 miles) over the same distance inland from the coast, the Andes rise +17,000 to almost 23,000 feet. The reason for this is the very rapid plate motion between the Pacific Ocean plate and South America. According to NASA scientists, over the last 140 million years, South America has been overriding the Pacific plate resulting in the rapid rise in the Andes and the rapid subduction of the Pacific plate, along with any sediments that are shed into the ocean along the continental margin. The dark, linear mountain ranges east of the high Andes (right center) constitute the Precordillera block; rock strata there have been correlated with the Ordovician (approximately 470 million years old) rocks near El Paso, Texas. The rocks and the fossils within them are virtually identical in the two areas, which are now widely separated. This region would be considered a "remnant terrain" from the time when this portion of South America and Texas were once joined. Photo credit: NASA
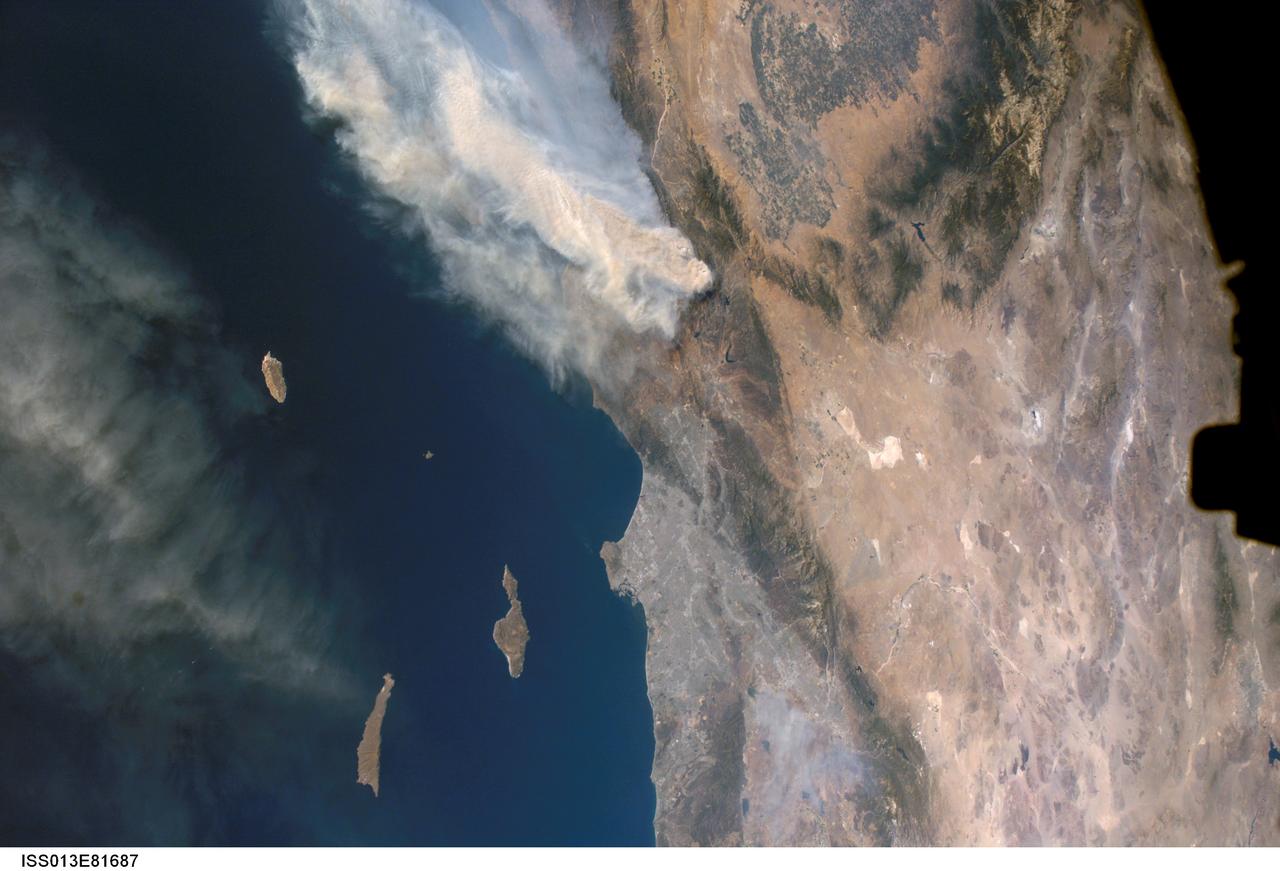
ISS013-E-81687 (17 Sept. 2006) --- A forest fire in southern California is featured in this image photographed by an Expedition 13 crewmember on the International Space Station. The day fire started in Los Padres National Forest north of Los Angeles on Sept. 4, 2006. Easterly winds on Sept. 17 blew the smoke west out to sea, and this wind shift was observed by station crewmembers. The forested mountains north of Los Angeles appear dark green, the smoke a dusky gray. Dense farmland at the south end of California's central valley is framed by the forested Sierra Nevada mountain range. White patches near the center of the view are dry lakes of the Mojave Desert, one of which acts as a landing site for the space shuttle. The dark irregular shape at image right is part of the space station. Death Valley and Las Vegas are visible at image right. The extent of the day fire smoke plume can be gauged from the gray urban region of greater Los Angeles (center) which stretches along 50 miles of coastline. The plume obscures the northern Channel Islands, but the southern Channel Islands are silhouetted against the ocean.
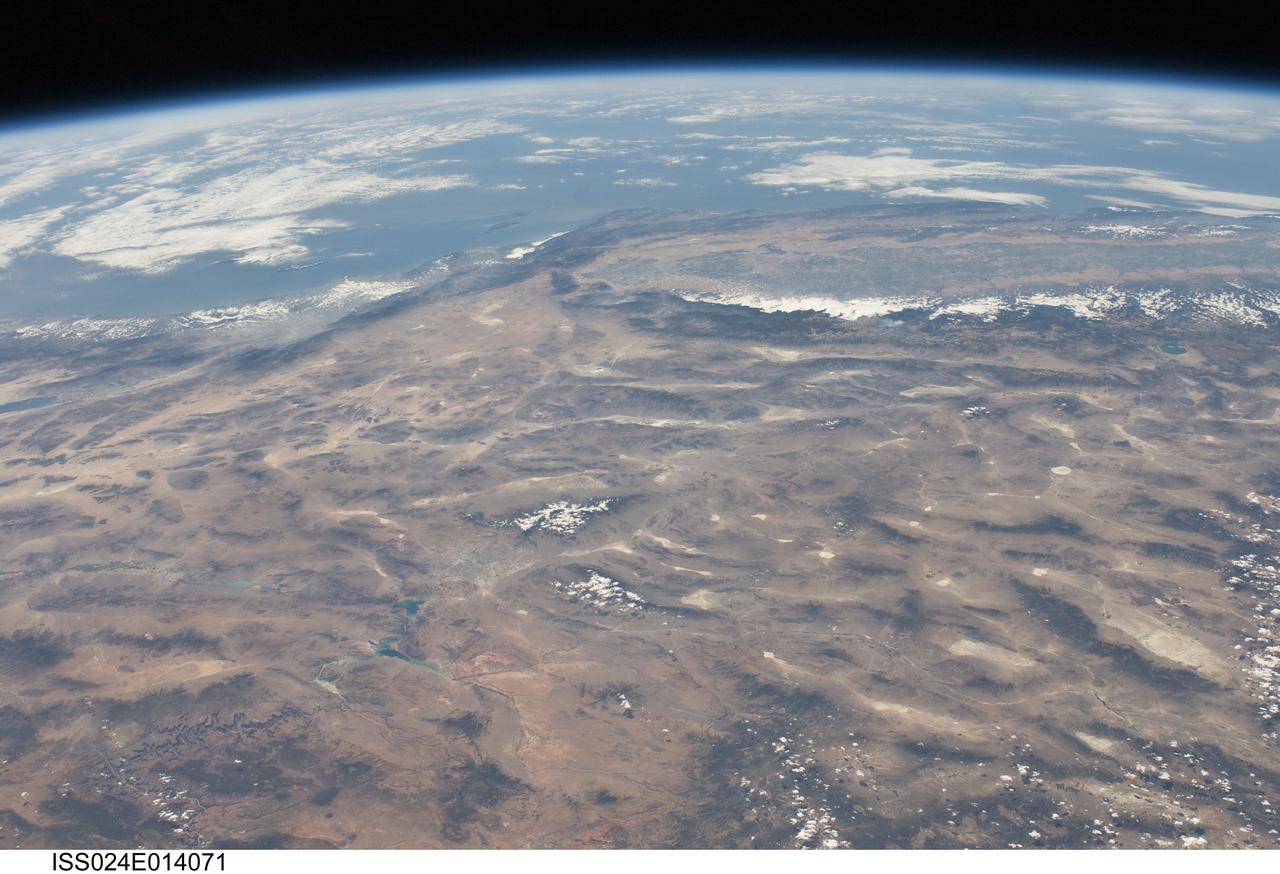
ISS024-E-014071 (9 Sept. 2010) --- This striking panoramic view of the southwestern USA and Pacific Ocean is an oblique image photographed by an Expedition 24 crew member looking outwards at an angle from the International Space Station (ISS). While most unmanned orbital satellites view Earth from a nadir perspective?in other words, collecting data with a ?straight down? viewing geometry?crew members onboard the space station can acquire imagery at a wide range of viewing angles using handheld digital cameras. The ISS nadir point (the point on Earth?s surface directly below the spacecraft) was located in northwestern Arizona, approximately 260 kilometers to the east-southeast, when this image was taken. The image includes parts of the States of Arizona, Nevada, Utah, and California together with a small segment of the Baja California, Mexico coastline at center left. Several landmarks and physiographic features are readily visible. The Las Vegas, NV metropolitan area appears as a gray region adjacent to the Spring Mountains and Sheep Range (both covered by white clouds). The Grand Canyon, located on the Colorado Plateau in Arizona, is visible (lower left) to the east of Las Vegas with the blue waters of Lake Mead in between. The image also includes the Mojave Desert, stretching north from the Salton Sea (left) to the Sierra Nevada mountain range. The Sierra Nevada range is roughly 640 kilometers long (north-south) and forms the boundary between the Central Valley of California and the adjacent Basin and Range. The Basin and Range is so called due to the pattern of long linear valleys separated by parallel linear mountain ranges ? this landscape, formed by extension and thinning of Earth?s crust, is particularly visible at right.
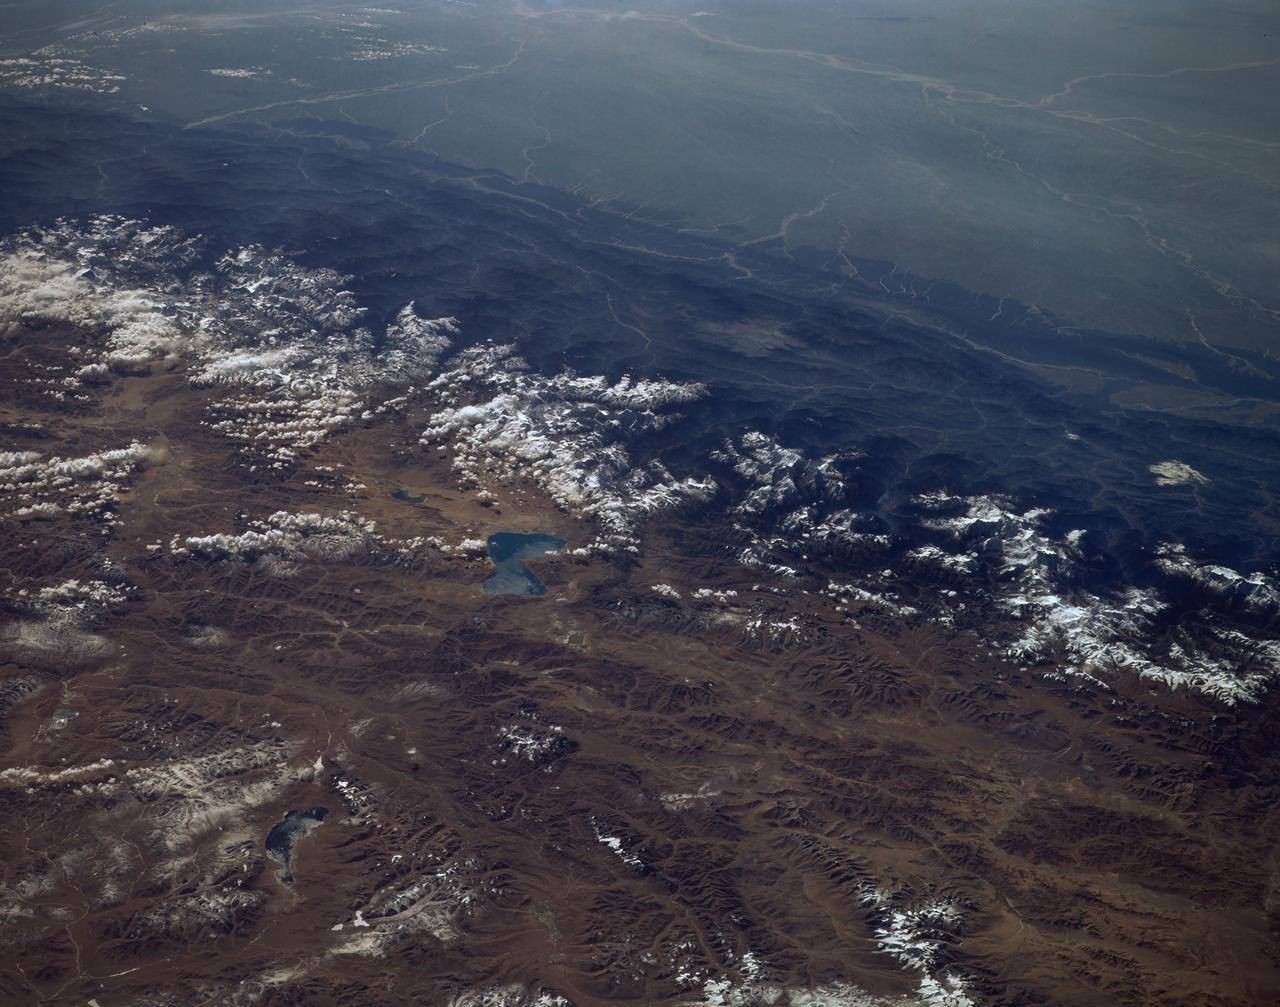
View is southeastward across China (Tibet), half of Nepal and India. The partly frozen lake near the center of the frame is Pei-Ku T'so ("Bos-tie Lake"). The central Himalaya stretches from Mount Everest on the left past Annapurna on the right. Large tributaries converge to form the Ganges River, flowing through the lowland basin south of the Himalaya. This photograph illustrates the rain shadow effect of the Himalaya Chain; wet, warm air from the Indian Ocean is driven against the mountains, lifted, and drained of water that forms ice caps, the abundant rivers, and forests of the foothills. In contrast the high plateau of Tibet is arid, composed largely of topographically-closed basins because stream flow is inadequate to form integrated drainage networks.
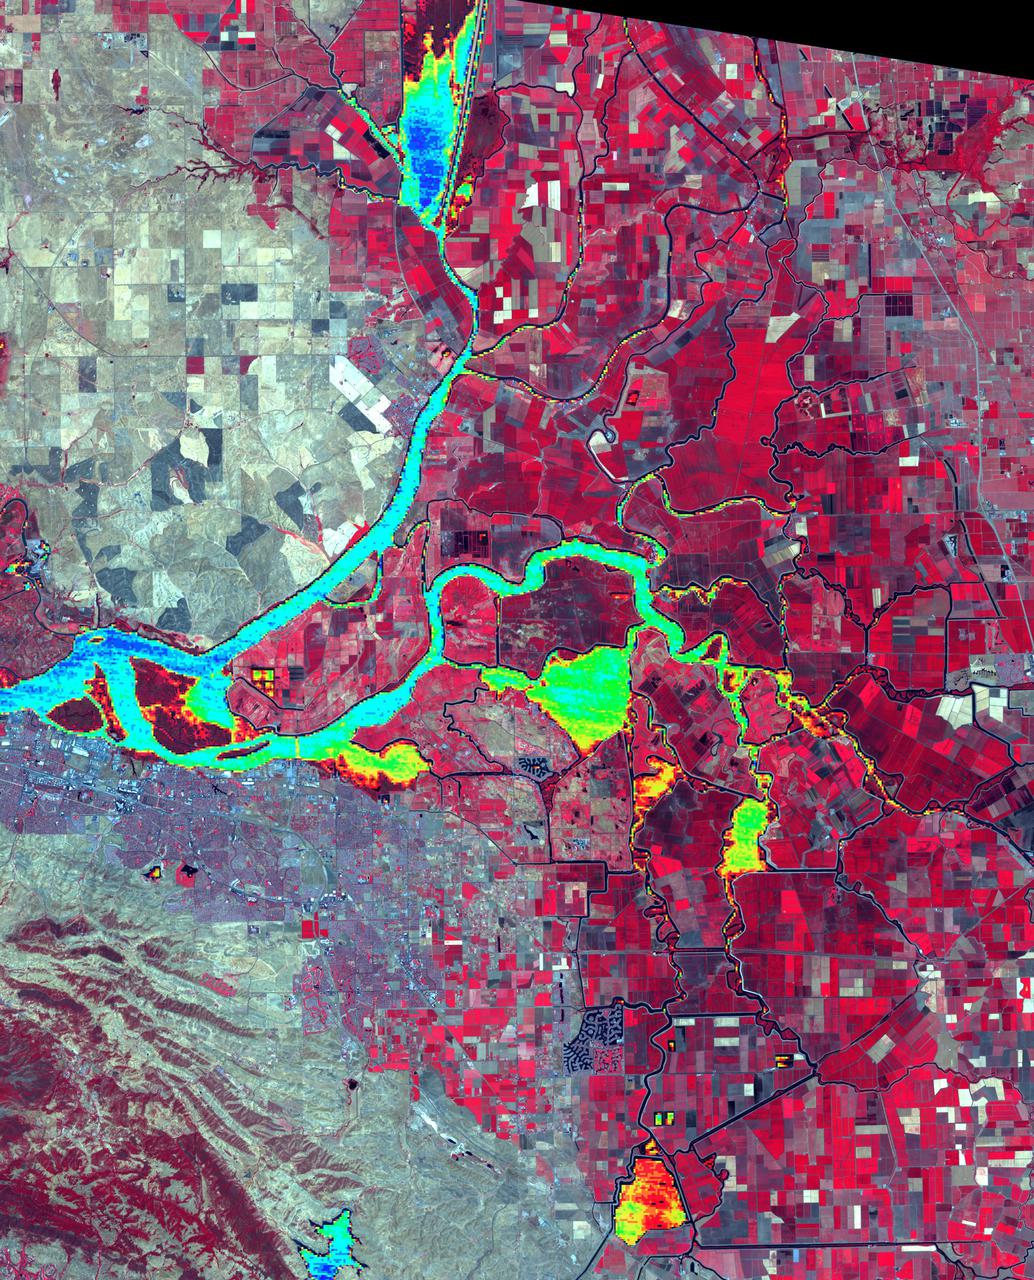
The Sacramento-San Joaquin River Delta, CA (or California Delta) has an area of about 3000 km2, and provides a large fraction of all the water used in California. The Delta drains about 50% of the water coming from the Sierra Nevada Mountains, and channels it through San Francisco's Golden Gate to the Pacific Ocean. Thousands of miles of levees now carefully control the Delta's flow, to maximize water use. The image combines a false color infrared composite (with vegetation depicted in red) with a colorized thermal infrared band to show the water temperature for the larger water bodies. Warmer temperatures are red and yellow, cooler water temperatures are blue and green. The image was acquired July 3, 2012, covers an area of 46.5 by 57.5 km, and is located at 38.1 degrees north, 121.3 degrees west. https://photojournal.jpl.nasa.gov/catalog/PIA24691
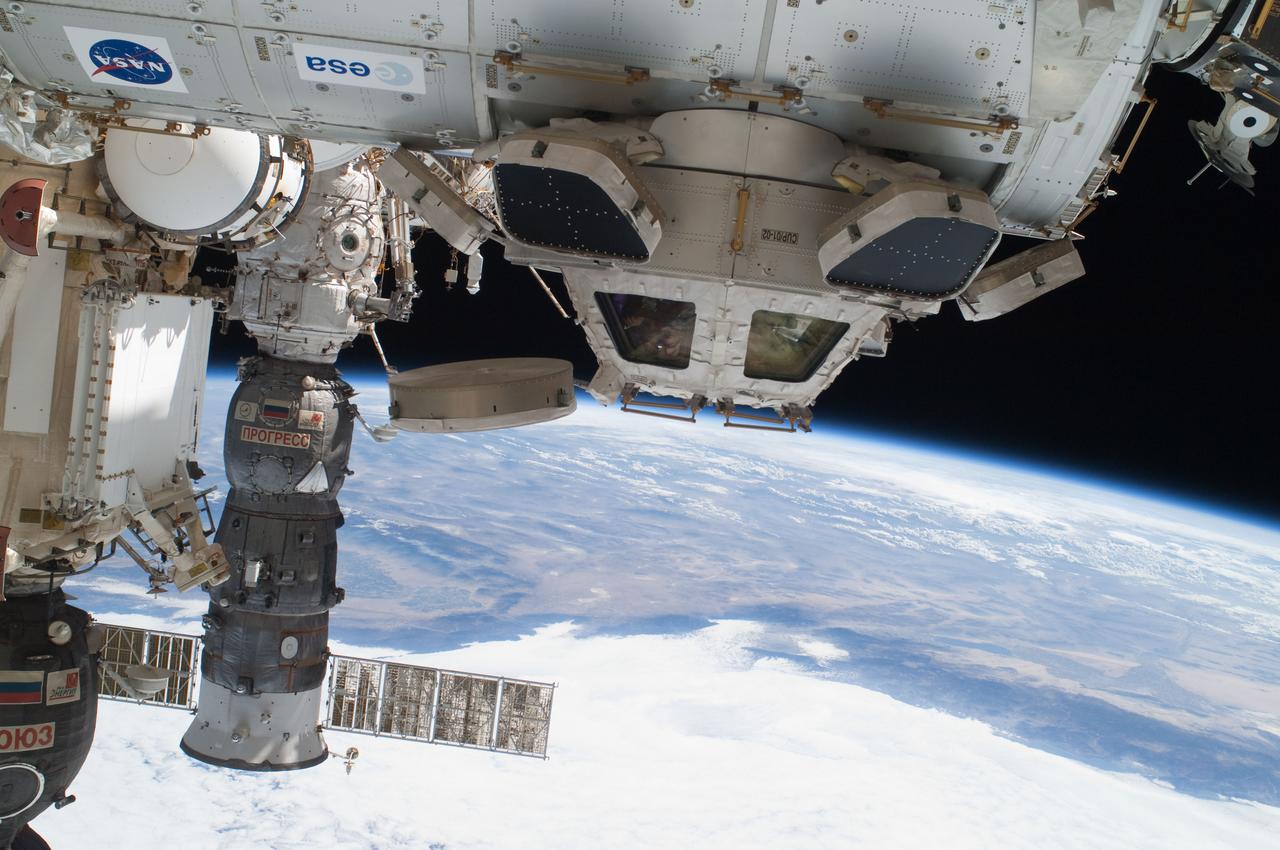
ISS028-E-016225 (12 July 2011) --- Components of the International Space Station, though moving along at 17,500 miles per hour, appear to hover above the Pacific Ocean just off the California coast. Ten cosmonauts and astronauts were working together when this photo was taken -- four of them as STS-135 visitors from the docked space shuttle Atlantis and six as members of the Expedition 28 crew. The Cupola, near center of frame, is attached to Node 3 or Tranquility. A Russian Soyuz and a Russian Progress spacecraft are parked at the station, left side of frame. While much of the coast is obscured by clouds, just inland from left to right, one can see the agriculture of the San Joaquin Valley, the southern Sierra Nevada, the Los Angeles Basin (center), the Mojave Desert, coastal mountains of southern California, the Salton Sea, the Imperial Valley, and the mouth of the Colorado River on the extreme right edge.
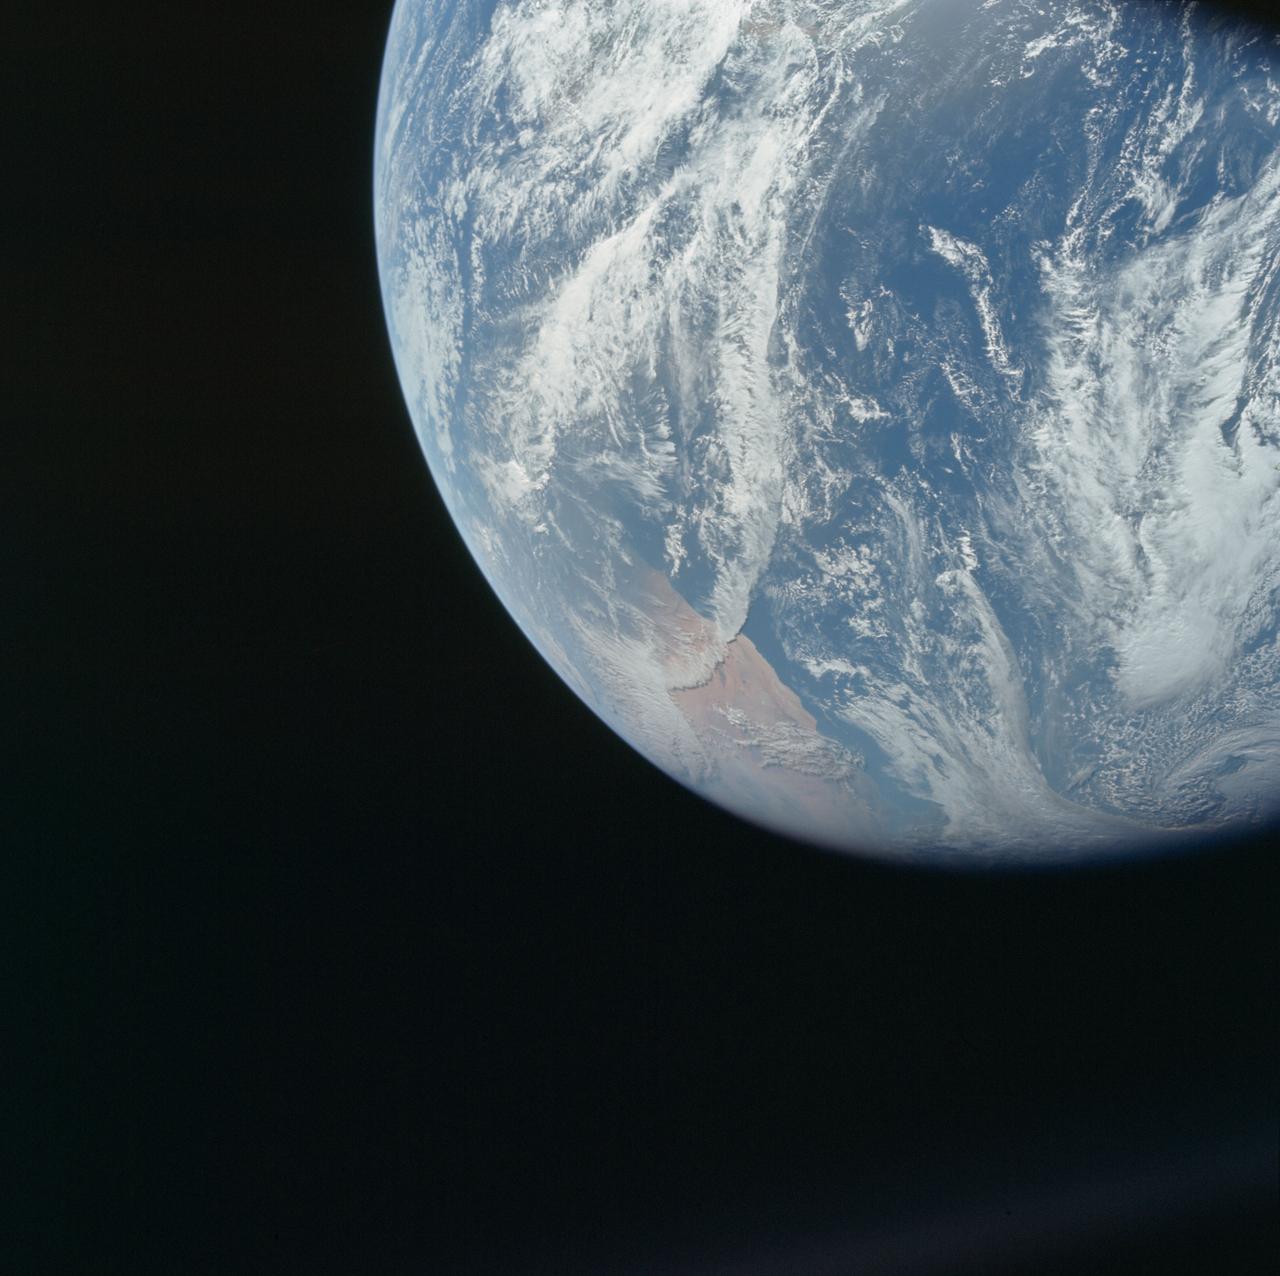
AS08-16-2588 (21-27 Dec. 1968) --- Both sides of the Atlantic Ocean are visible in this view from Apollo 8 spacecraft. (Hold picture with Earth at bottom left). The large, most prominent land mass is the bulge of West Africa. The portion of Africa near the equator is dark and cloudy, but the more northerly portions are clear, showing the prominent cape at Dakar and the Senegal River in Senegal; Cap Blanc; the Adrar Plateau in Mauretania; the wide expanse of desert in Algeria and Spanish Sahara; and the far edge, the Atlas and Anti-Atlas Mountains in Morocco. Clouds cover the eastern coast of South America, southward from Surinam and Guyana to near the city of Salvador, Brazil. The view was photographed following trans-lunar insertion.
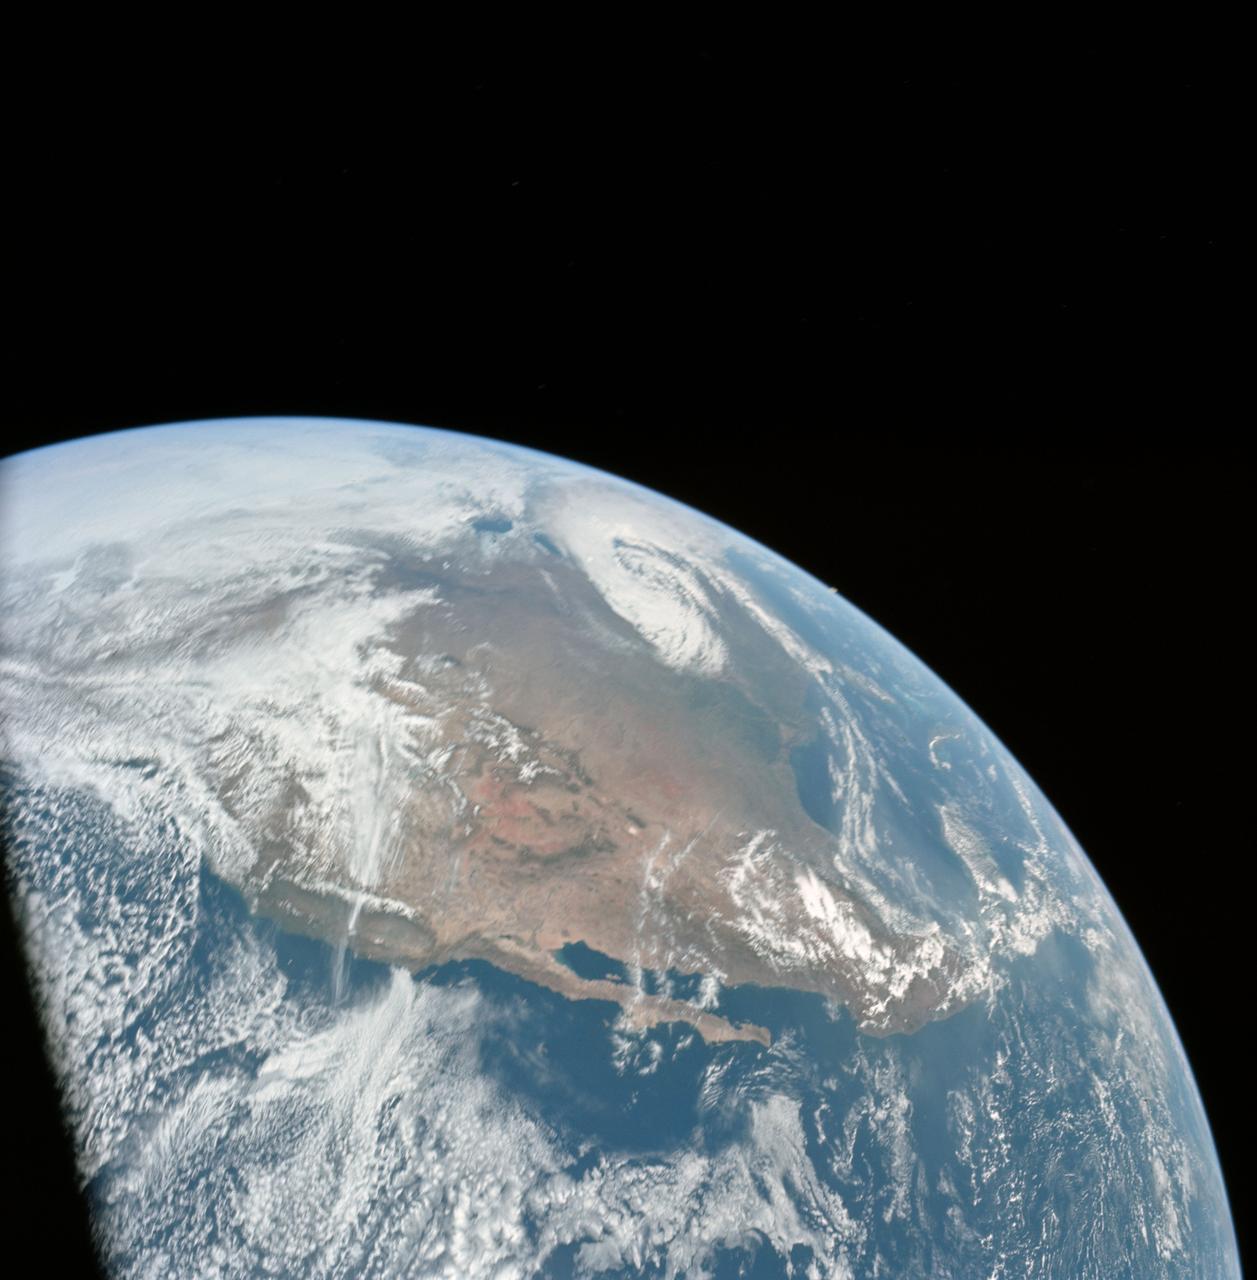
AS16-118-18873 (16 April 1972) --- A good view of Earth photographed shortly after trans-lunar injection of April 16, 1972. Although there is much cloud cover (over Canada and the oceans), the United States in large part, most of Mexico and some parts of Central America are clearly visible. Note Lake Michigan and Lake Superior, also note the Bahama Banks at upper right part of the sphere. A large part of the Rocky Mountain Range is also visible. Just beginning man's fifth lunar landing mission were astronauts John W. Young, commander; Thomas K. Mattingly II, command module pilot; and Charles M. Duke Jr., lunar module pilot. While astronauts Young and Duke descended in the Lunar Module (LM) to explore the moon, astronaut Mattingly remained with the Command and Service Modules (CSM) in lunar orbit.
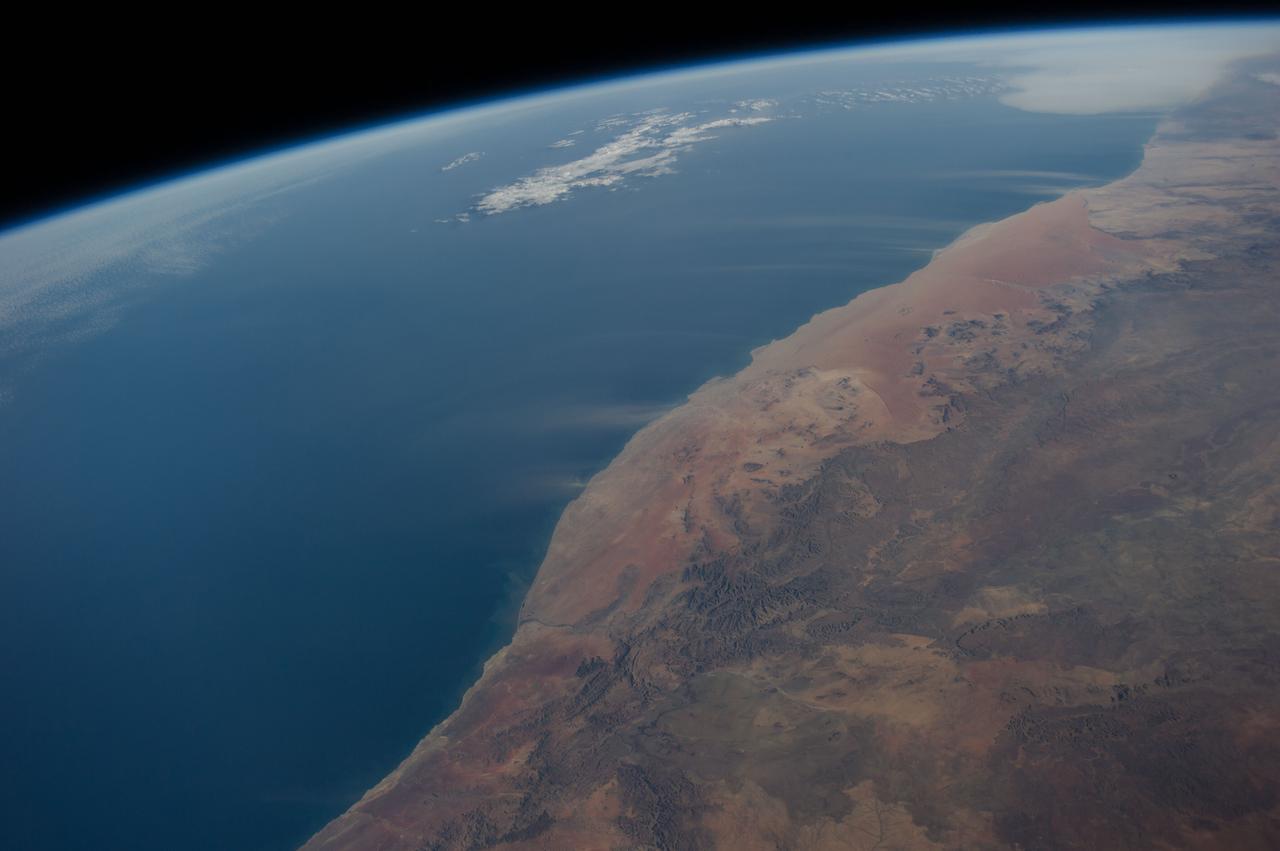
ISS040-E-016513 (21 June 2014) --- Dust plumes and the Namib Desert coast are featured in this image photographed by an Expedition 40 crew member on the International Space Station. Strong, hot winds known as “berg” (mountain) winds are lofting plumes of dust directly out into the Atlantic Ocean in this panoramic image. The southern African equivalent of Santa Ana winds in California, berg winds blow on a few occasions in fall and winter, off all coasts of southern Africa. Other images from the space station have captured these dust plumes. Namibia’s great Sand Sea appears here as a reddish zone along part of the coast (center). The Sand Sea is more than 350 kilometers long, giving a sense of the length of the visible dust plumes. A light-toned sediment plume enters the sea at the mouth of the Orange River (lower left), southern Africa’s largest river.
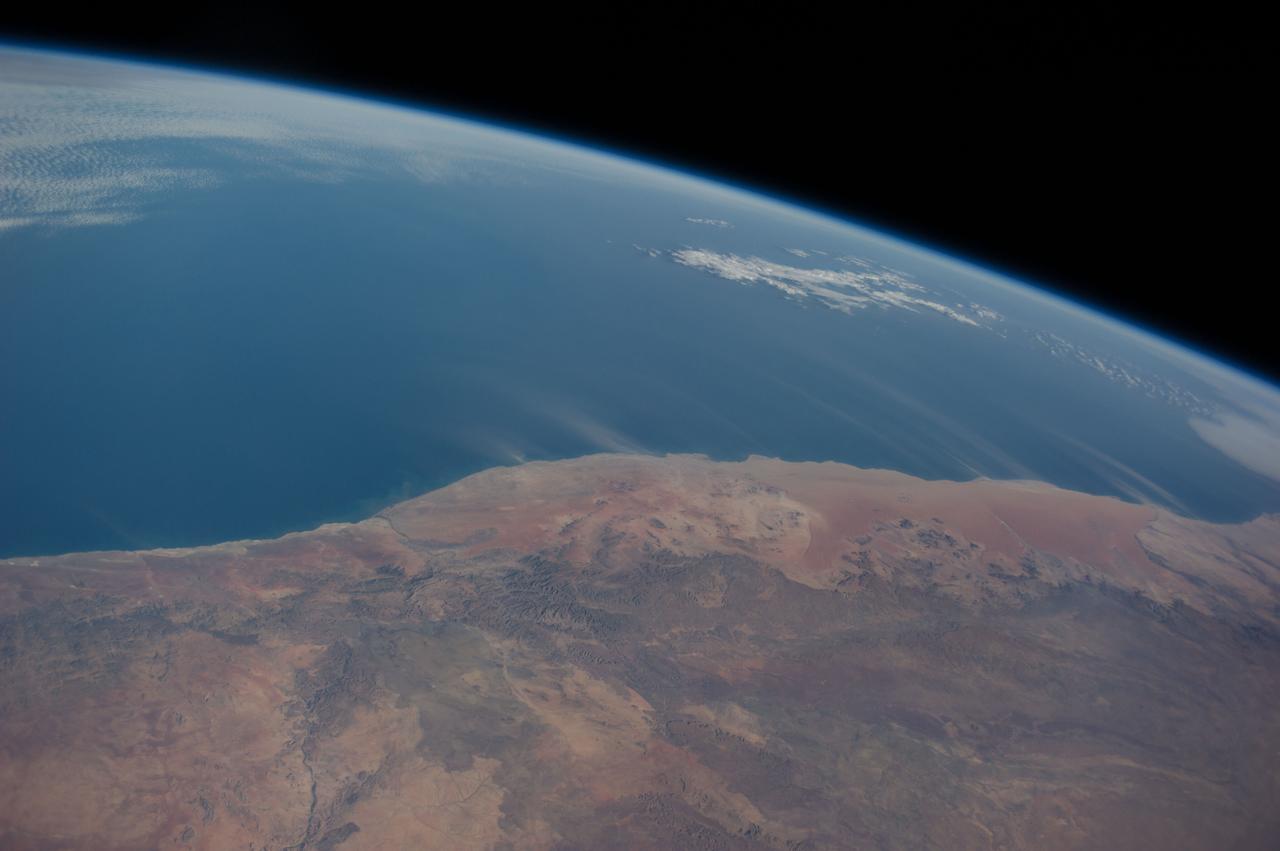
ISS040-E-016514 (21 June 2014) --- Dust plumes and the Namib Desert coast are featured in this image photographed by an Expedition 40 crew member on the International Space Station. Strong, hot winds known as “berg” (mountain) winds are lofting plumes of dust directly out into the Atlantic Ocean in this panoramic image. The southern African equivalent of Santa Ana winds in California, berg winds blow on a few occasions in fall and winter, off all coasts of southern Africa. Other images from the space station have captured these dust plumes. Namibia’s great Sand Sea appears here as a reddish zone along part of the coast (center). The Sand Sea is more than 350 kilometers long, giving a sense of the length of the visible dust plumes. A light-toned sediment plume enters the sea at the mouth of the Orange River (lower left), southern Africa’s largest river.
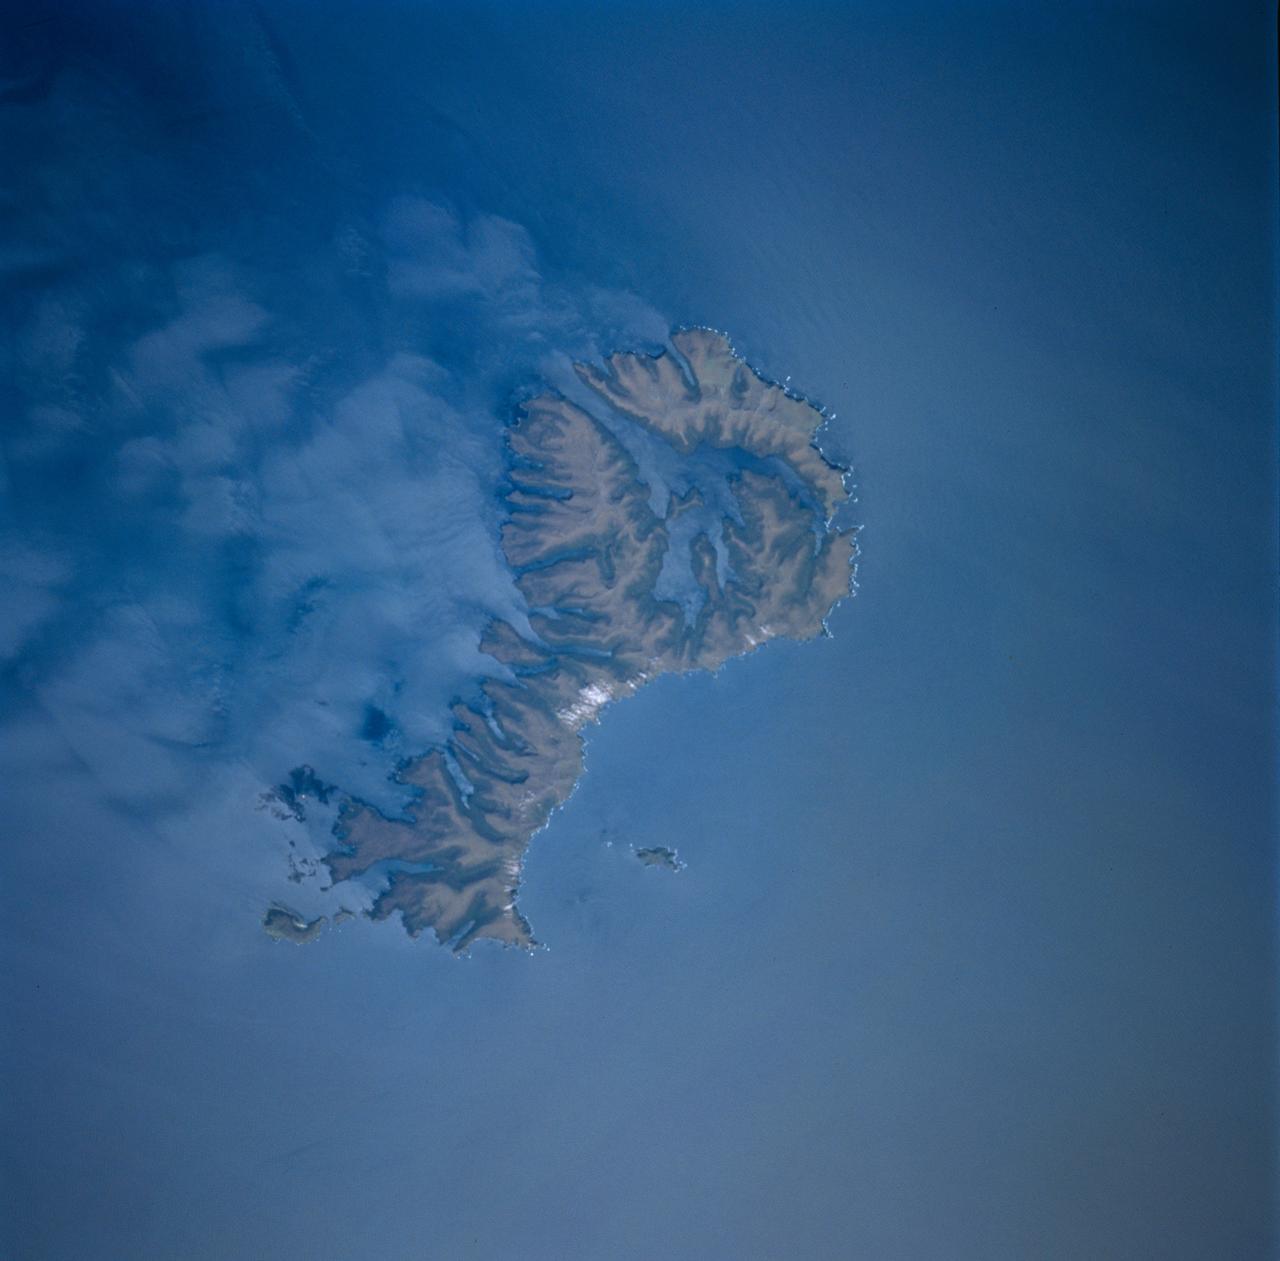
STS089-743-004 (22-31 Jan. 1998) --- This picture showing Auckland Island, New Zealand was photographed with a 70mm handheld camera from the Earth-orbiting space shuttle Endeavour. A spectacular occurrence of internal waves in the ocean is visible in the wake of the island. These waves can be generated by currents or, in some cases, wind across the island. In this case, the observation was that these waves were visible after the sunglint disappeared, suggesting current generated effects. If so, the circum-polar current that moves west-east around Antarctica would generate the scalloped appearance in the water east of the island. There is characteristically very little surface expression to these waves so they would not be noticed by a ship in this region. Fundamental processes of oceanic circulation and interaction are poorly understood. These shots help oceanographers model the dynamics of the open ocean and work out mixing models for ocean layer and ocean-air interaction (important for modeling CO2 budget, for example). The long linear valleys and bays have been excavated by glaciers cutting into this long-extinct volcano. This island is located on the submerged Campbell Plateau, which is an area almost as large as the exposed land of South Island, New Zealand. Scientists report that the plateau was submerged when New Zealand, Antarctica and Australia separated "around 75 million years ago." This could be viewed as one of the tallest mountains on the plateau. Usually the weather in this area is bad so this photo opportunity was considered a "great catch." Photo credit: NASA
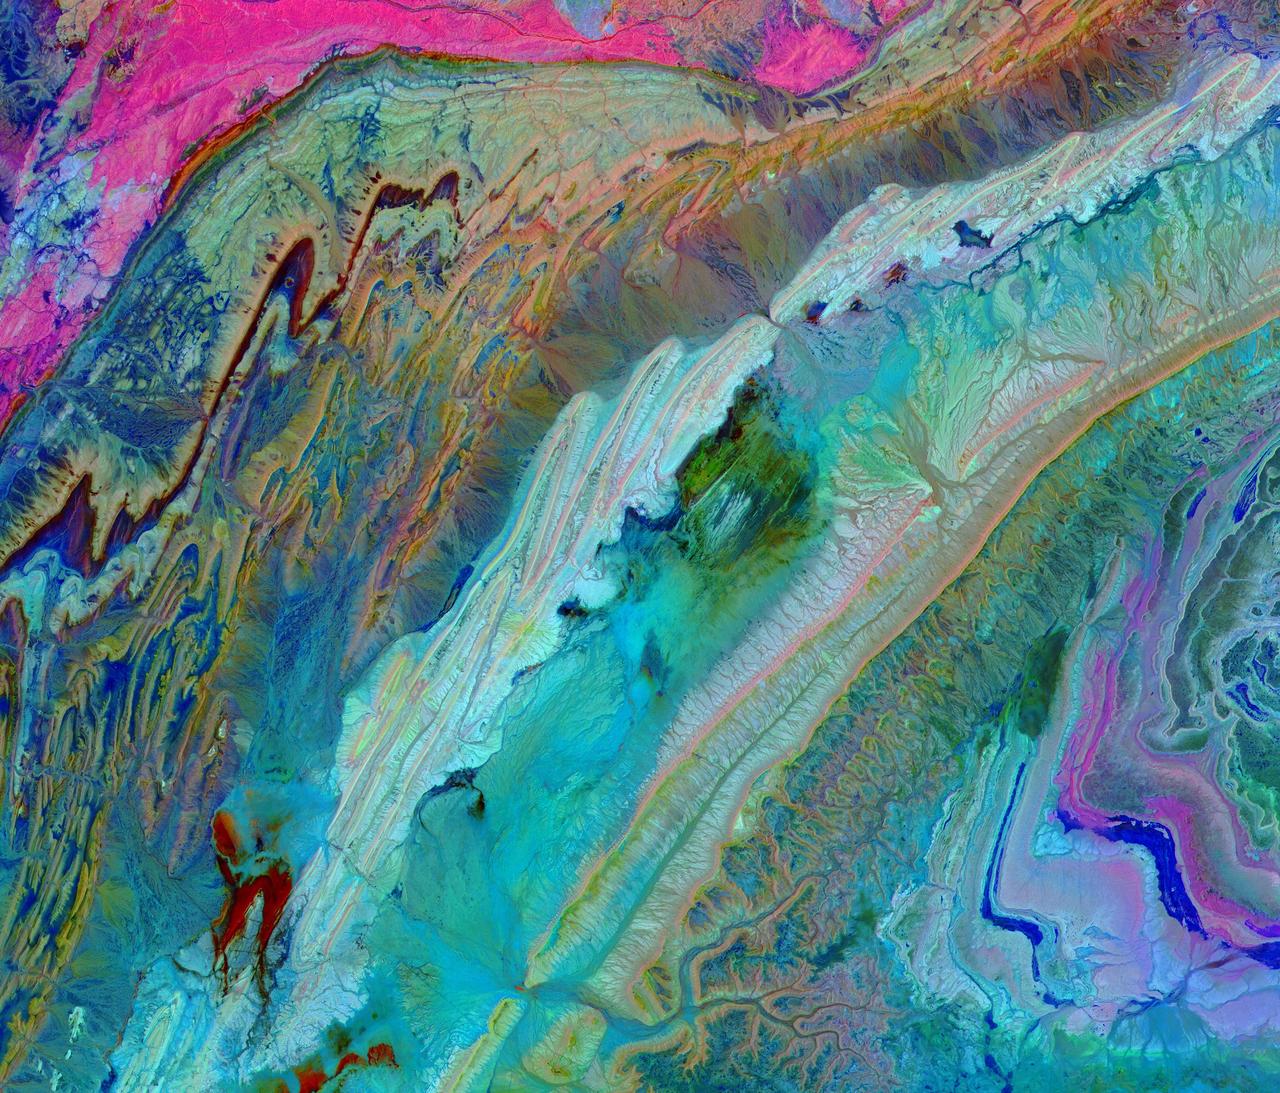
The Anti-Atlas Mountains of Morocco formed as a result of the collision of the African and Eurasian tectonic plates about 80 million years ago. This collision destroyed the Tethys Ocean; the limestone, sandstone, claystone, and gypsum layers that formed the ocean bed were folded and crumpled to create the Anti-Atlas Mountains. In this ASTER image of southwest Morocco, visible, near infrared, and short wavelength infrared bands are combined to dramatically highlight the different rock types, and illustrate the complex folding. The ability to map geology using ASTER data is enhanced by bands that are sensitive to differences in rock mineralogy. The image was acquired on November 5, 2007, covers an area of 51.9 by 60.8 km, and is located at 28.1 degrees north and 10.7 degrees west. With its 14 spectral bands from the visible to the thermal infrared wavelength region and its high spatial resolution of about 50 to 300 feet (15 to 90 meters), ASTER images Earth to map and monitor the changing surface of our planet. ASTER is one of five Earth-observing instruments launched Dec. 18, 1999, on Terra. The instrument was built by Japan's Ministry of Economy, Trade and Industry. A joint U.S./Japan science team is responsible for validation and calibration of the instrument and data products. The broad spectral coverage and high spectral resolution of ASTER provides scientists in numerous disciplines with critical information for surface mapping and monitoring of dynamic conditions and temporal change. Example applications are monitoring glacial advances and retreats; monitoring potentially active volcanoes; identifying crop stress; determining cloud morphology and physical properties; wetlands evaluation; thermal pollution monitoring; coral reef degradation; surface temperature mapping of soils and geology; and measuring surface heat balance. https://photojournal.jpl.nasa.gov/catalog/PIA23533
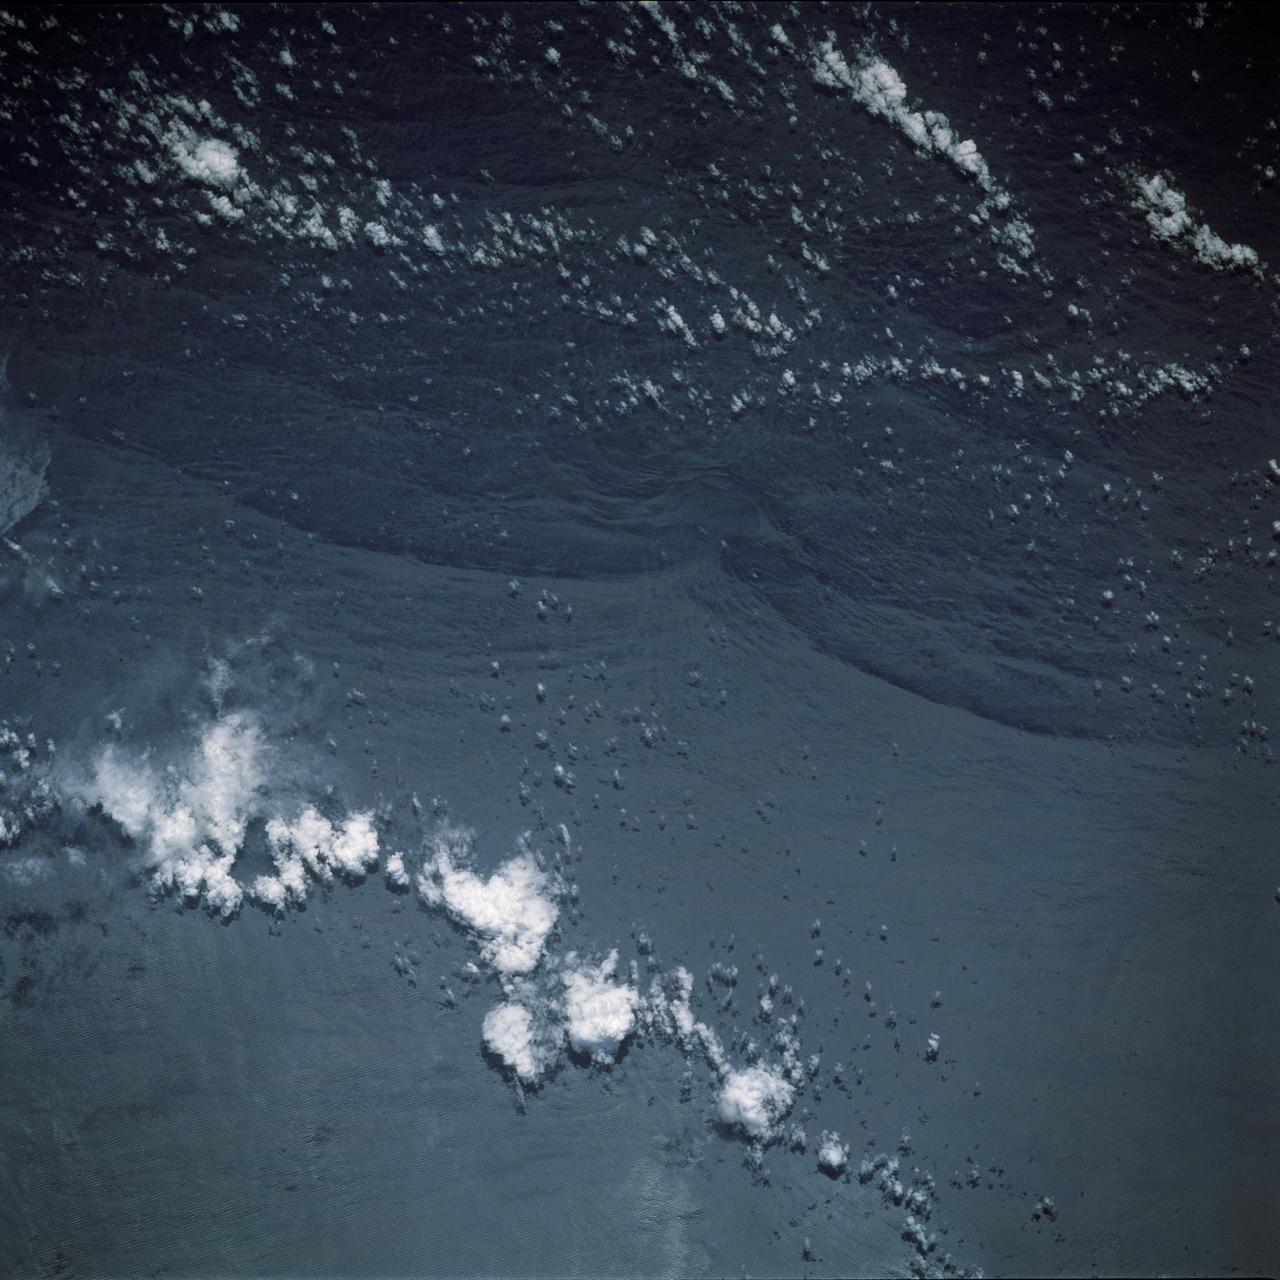
STS044-79-077 (24 Nov.-1 Dec. 1991) --- This photograph, captured from the Earth-orbiting Space Shuttle Atlantis, shows sunglint pattern in the western tropical Indian Ocean. Several large internal waves reflect around a shallow area on the sea floor. NASA scientists studying the STS-44 photography believe the shallow area to be a sediment (a submerged mountain) on top of the Mascarene Plateau, located northeast of Madagascar at approximately 5.6 degrees south latitude and 55.7 degrees east longitude. Internal waves are similar to surface ocean waves, except that they travel inside the water column along the boundary between water layers of different density. At the surface, their passage is marked on the sea surface by bands of smooth and rough water. These bands appear in the sunglint pattern as areas of brighter or darker water. NASA scientists point out that, when the waves encounter an obstacle, such as a near-surface seamount, they bend or refract around the obstacle in the same manner as surface waves bend around an island or headland.
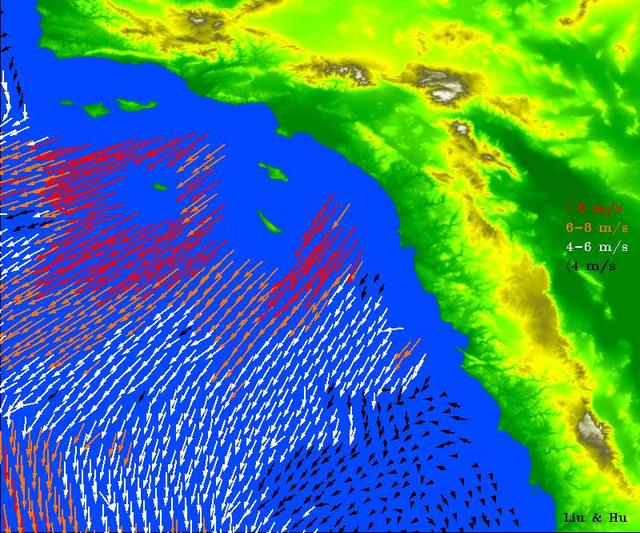
High-resolution ocean surface wind data from NASA's Quick Scatterometer (QuikScat) illustrate the strength of Santa Ana winds that pounded Southern California this week, causing damage and spreading brush fires. The colored arrows represent various ranges of wind speed, which were still well in excess of 30 knots (34 miles per hour), even after reaching the ocean and weakening. Santa Ana winds are offshore and down-slope winds unique to Southern California that are usually channeled through mountain gaps. These Santa Ana winds extend more than 500 kilometers (310 miles) offshore before changing direction to flow along the shore. The wind speeds and directions are retrieved from range-compressed backscatter data measured by QuikScat that has much higher spatial resolution than QuikScat's standard data products. Useful applications of high-resolution science-quality wind products derived from range-compressed backscatter have been demonstrated in two scientific papers: one on Hurricane Floyd and the other on Catalina Eddies. This is the first demonstration on near-real-time retrieval applications. http://photojournal.jpl.nasa.gov/catalog/PIA03892
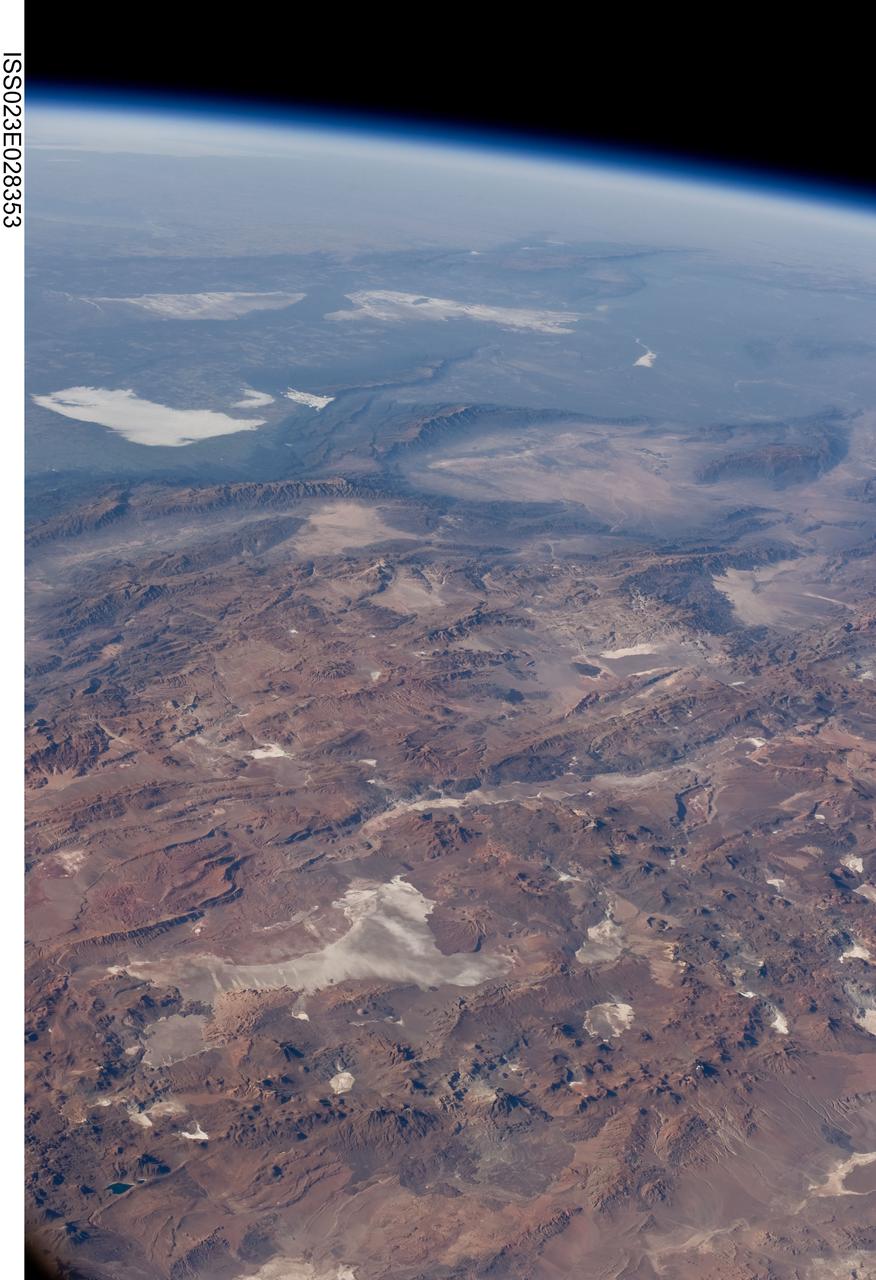
ISS023-E-028353 (26 April 2010) --- Central Andes Mountains, Salar de Arizaro, Argentina are featured in this image photographed by an Expedition 23 crew member on the International Space Station. The high plains (3,000 to greater than 5,000 meters elevation, 13,000 to 19,000 feet) of the Andes Mountains, also known as the Puna, appear in the foreground of this photograph, with a line of young volcanoes facing the much lower Atacama Desert (1,000–2,000 meters elevation). Several large dry lakes, marked by light-toned salt crusts, occupy the basins between major thrust faults in the Puna. Salar de Arizaro (foreground) is the largest of the dry lakes in this view (salar means waterless salt flat in Spanish). This panorama was taken by a station crew member looking southeast across the South American continent when the ISS was almost directly over the Atacama Desert near Chile’s Pacific coast. The Atlantic Ocean coastline (River Plate where Argentina’s capital city of Buenos Aires is located) is dimly visible at top left. A striking geological and landscape contrast is visible at center which separates two distinct geological zones, namely the Puna and the Sierras Pampeanas. The Sierras Pampeanas Mountains are lower in elevation and have few young volcanoes, in contrast to the Puna. Sharp-crested ranges are separated by wide, low valleys in this region. The Salinas Grandes—ephemeral shallow salt lakes at top left (salina means salt lake in Spanish) — occupies one of these valleys. The general color change from reds and browns in the foreground to blues and greens in the upper part of the image reflects the major climatic regions, namely the deserts of the Atacama and Puna, versus the low grassy plains of central Argentina where rainfall is sufficient to promote lush prairie grass growth—known famously as the pampas in Argentina. The Salinas Grandes mark an intermediate semiarid region. What accounts for the changes in landscape? The geology of this part of the Andes is a result of the eastward subduction of the Nazca tectonic plate underneath South America. Investigations using seismic data suggest that the Puna is underlain by a steeply dipping sector of the subducting Nazca plate. The Sierras Pampeanas zone however, is underlain by a sector of the Nazca plate that is almost horizontal, possibly due to the subduction of a submarine mountain range known as the Juan Fernandez Ridge. In the simplest terms, ridges are topographic highs that are difficult to stuff down subduction zones, with profound effects on the volcanism and structures of the upper plate.
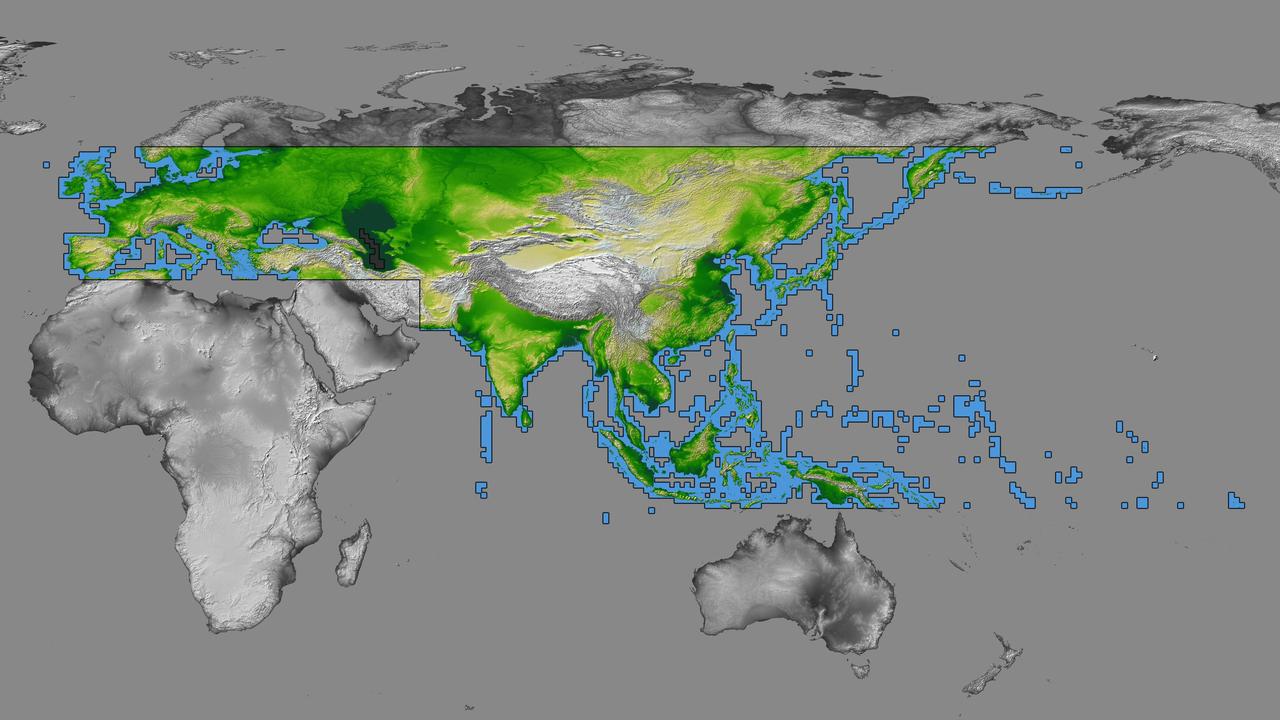
inal Caption Released with Image: The colored regions of this map show the extent of digital elevation data recently released by the Shuttle Radar Topography Mission (SRTM). This release includes data for most of Europe and Asia plus numerous islands in the Indian and Pacific Oceans. SRTM flew on board the Space Shuttle Endeavour in February 2000 and used an interferometric radar system to map the topography of Earth's landmass between latitudes 56 degrees south and 60 degrees north. The data were processed into geographic "tiles," each of which represents one by one degree of latitude and longitude. A degree of latitude measures 111 kilometers (69 miles) north-south, and a degree of longitude measures 111 kilometers or less east-west, decreasing away from the equator. The data are being released to the public on a continent-by-continent basis. This Eurasia segment includes 5,940 tiles, more than a third of the total data set. Previous releases covered North America and South America. Forthcoming releases will include Africa-Arabia and Australia plus an "Islands" release for those islands not included in the continental releases. Together these data releases constitute the world's first high-resolution, near-global elevation model. The resolution of the publicly released data is three arcseconds (1/1,200 of a degree of latitude and longitude), which is about 90 meters (295 feet). European coverage in the current data release stretches eastward from the British Isles and the Iberian Peninsula in the west, across the Alps and Carpathian Mountains, as well as the Northern European Plain, to the Ural and Caucasus Mountains bordering Asia. The Asian coverage includes a great diversity of landforms, including the Tibetan Plateau, Tarin Basin, Mongolian Plateau, and the mountains surrounding Lake Baikal, the world's deepest lake. Mt. Everest in the Himalayas, at 8,848 meters (29,029 feet) is the world's highest mountain. From India's Deccan Plateau, to Southeast Asia, coastal China, and Korea, various landforms place constraints upon land use planning for a great population. Volcanoes in the East Indies, the Philippines, Japan, and the Kamchatka Peninsula form the western part of the "Ring of Fire" around the Pacific Ocean. Many of these regions were previously very poorly mapped due to persistent cloud cover or the inaccessibility of the terrain. Digital elevation data, such as provided by SRTM, are particularly in high demand by scientists studying earthquakes, volcanism, and erosion patterns for use in mapping and modeling hazards to human habitation. But the shape of Earth's surface affects nearly every natural process and human endeavor that occurs there, so elevation data are used in a wide range of applications. In this index map color-coding is directly related to topographic height, with green at the lower elevations, rising through yellow and tan, to white at the highest elevations. The large, very dark green feature in western Asia is the Caspian Sea, which is below sea level. Blue areas on the map represent water within the mapped tiles, each of which includes shorelines or islands. http://photojournal.jpl.nasa.gov/catalog/PIA03398
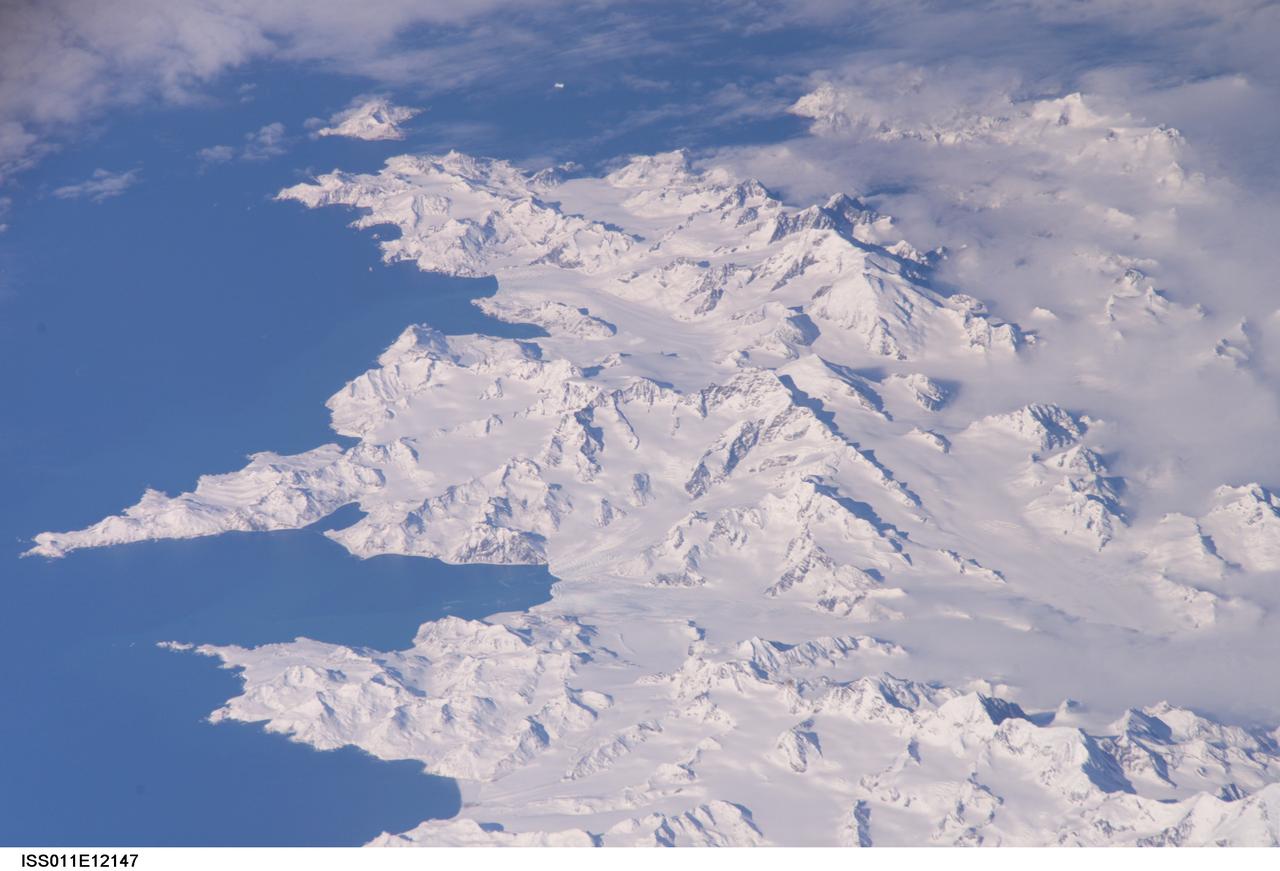
ISS011-E-12147 (26 Aug. 2005) --- South Georgia Island is featured in this image photographed by an Expedition 11 crewmember on the International Space Station. There is no permanent human base on South Georgia Island, a British territory in the South Atlantic Ocean that lies 1300 kilometers east of the Falkland Islands. Using a long lens (800 mm focal length) and positioned for an oblique view, the crew of the international space station was able to capture the rugged and isolated landscape of the northern shore of the island. The high mountains protect the north and eastern coast of the island from the prevailing gales coming from Antarctica and the west. The steep topography also makes deep embayments along the coast that provide habitat for wildlife and anchorages for whaling ships. The island supports major rookeries of penguins and albatrosses, and large seal populations. This view centers on Mt. Paget and Cumberland Bay. The former whaling station Grytviken is located within the bay. The encampment supports the scientific base for the British Antarctic Survey and Bird Island Research Station.
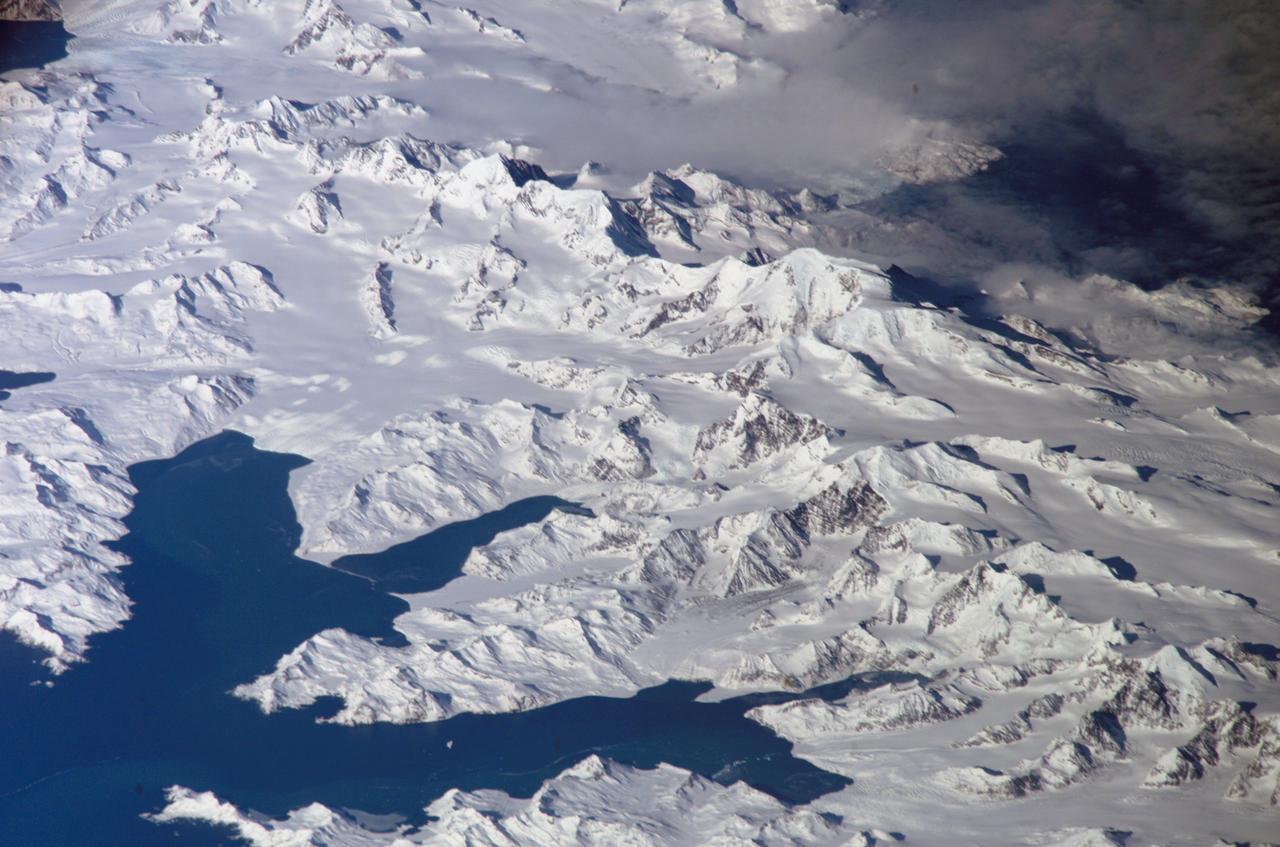
ISS011-E-12148 (26 August 2005) --- South Georgia Island is featured in this image photographed by an Expedition 11 crewmember on the international space station. There is no permanent human base on South Georgia Island, a British territory in the South Atlantic Ocean that lies 1300 kilometers east of the Falkland Islands. Using a long lens (800 mm focal length) and positioned for an oblique view, the crew of the international space station was able to capture the rugged and isolated landscape of the northern shore of the island. The high mountains protect the north and eastern coast of the island from the prevailing gales coming from Antarctica and the west. The steep topography also makes deep embayments along the coast that provide habitat for wildlife and anchorages for whaling ships. The island supports major rookeries of penguins and albatrosses, and large seal populations. This view centers on Mt. Paget and Cumberland Bay. The former whaling station Grytviken is located within the bay. The encampment supports the scientific base for the British Antarctic Survey and Bird Island Research Station.
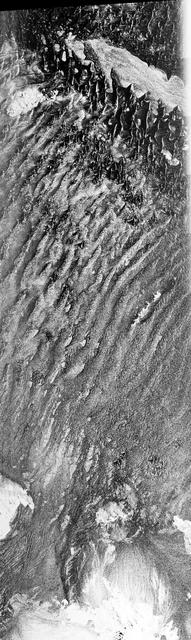
This is a C-band, VV polarization radar image of the Namib desert in southern Namibia, near the coast of South West Africa. The image is centered at about 25 degrees South latitude, 15.5 degrees East longitude. This image was one of the first acquired by the Spaceborne Imaging Radar-C/X-Band Synthetic Aperture Radar (SIR-C/X-SAR) when it was taken on orbit 4 from the shuttle Endeavour on April 9, 1994. The area shown is approximately 78 kilometers by 20 kilometers. The dominant features in the image are complex sand dune patterns formed by the prevailing winds in this part of the Namib desert. The Namib desert is an extremely dry area formed largely because of the influence of the cold Benguela ocean current that flows northward along the coast of Namibia. The bright areas at the bottom of the image are exposed outcrops of Precambrian rocks. This extremely barren area is a region rich in diamonds that through the centuries have washed down from the mountains. The town of Luderitz is located just to the south of the area shown. http://photojournal.jpl.nasa.gov/catalog/PIA01720
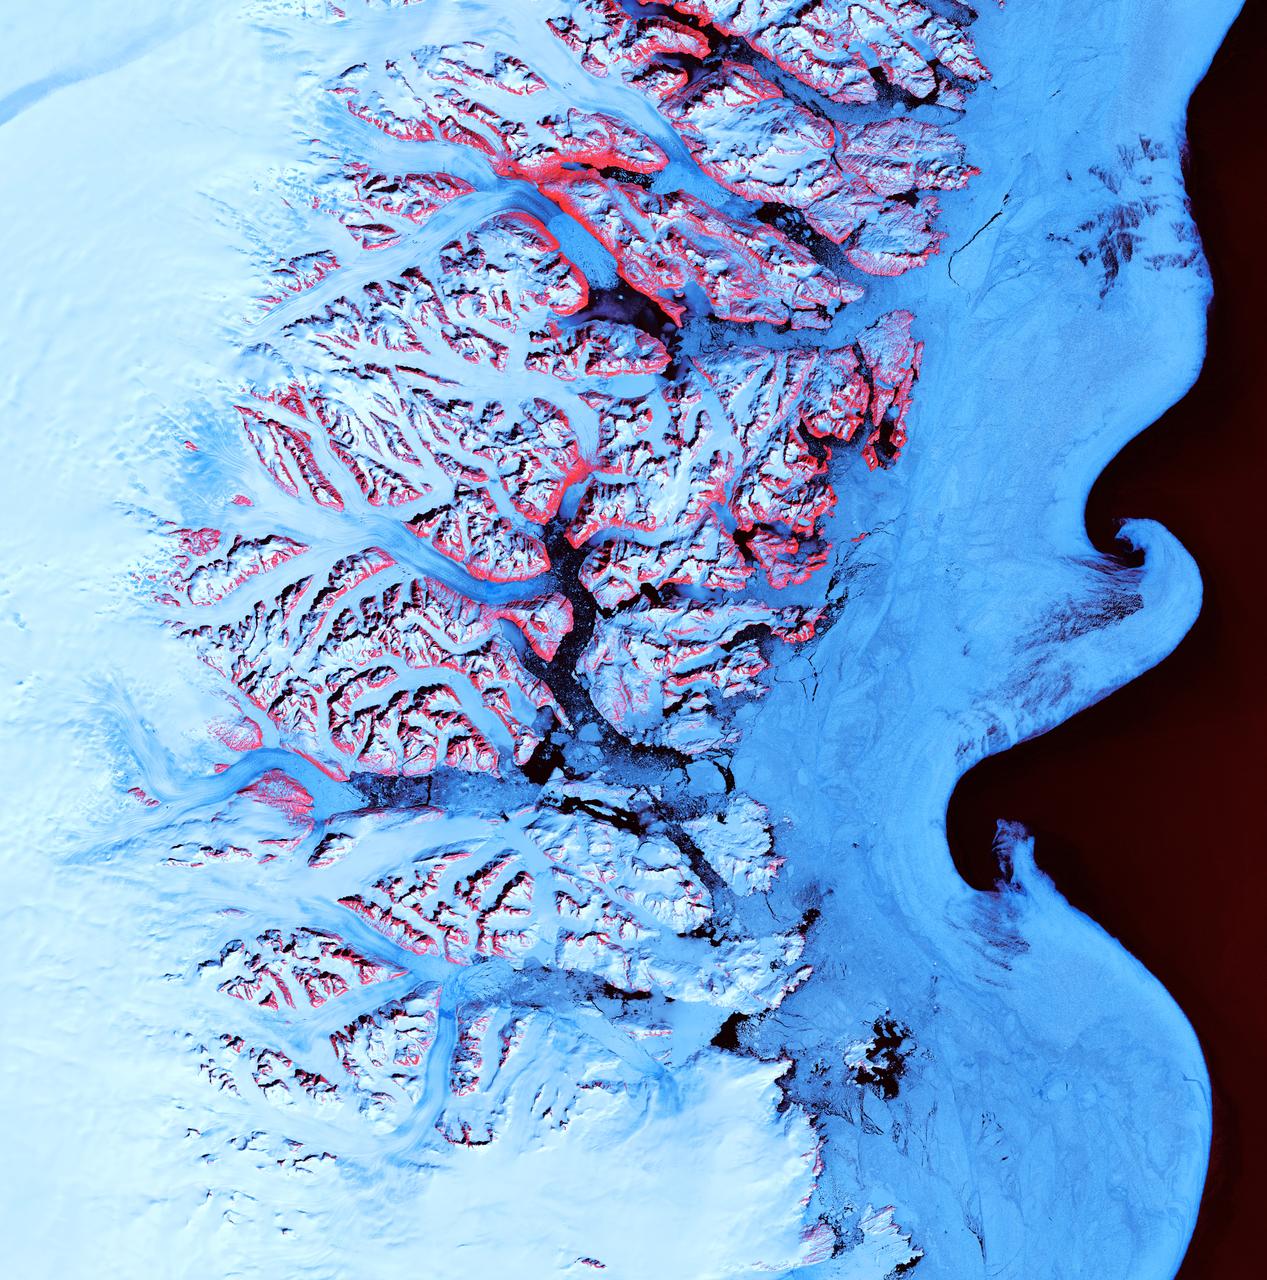
Ice Waves - May 21st, 2001 Description: Along the southeastern coast of Greenland, an intricate network of fjords funnels glacial ice to the Atlantic Ocean. During the summer melting season, newly calved icebergs join slabs of sea ice and older, weathered bergs in an offshore slurry that the southward-flowing East Greenland Current sometimes swirls into stunning shapes. Exposed rock of mountain peaks, tinted red in this image, hints at a hidden landscape. Credit: USGS/NASA/Landsat 7 To learn more about the Landsat satellite go to: <a href="http://landsat.gsfc.nasa.gov/" rel="nofollow">landsat.gsfc.nasa.gov/</a> <b><a href="http://www.nasa.gov/centers/goddard/home/index.html" rel="nofollow">NASA Goddard Space Flight Center</a></b> enables NASA’s mission through four scientific endeavors: Earth Science, Heliophysics, Solar System Exploration, and Astrophysics. Goddard plays a leading role in NASA’s accomplishments by contributing compelling scientific knowledge to advance the Agency’s mission. <b>Follow us on <a href="http://twitter.com/NASA_GoddardPix" rel="nofollow">Twitter</a></b> <b>Join us on <a href="http://www.facebook.com/pages/Greenbelt-MD/NASA-Goddard/395013845897?ref=tsd" rel="nofollow">Facebook</a></b>
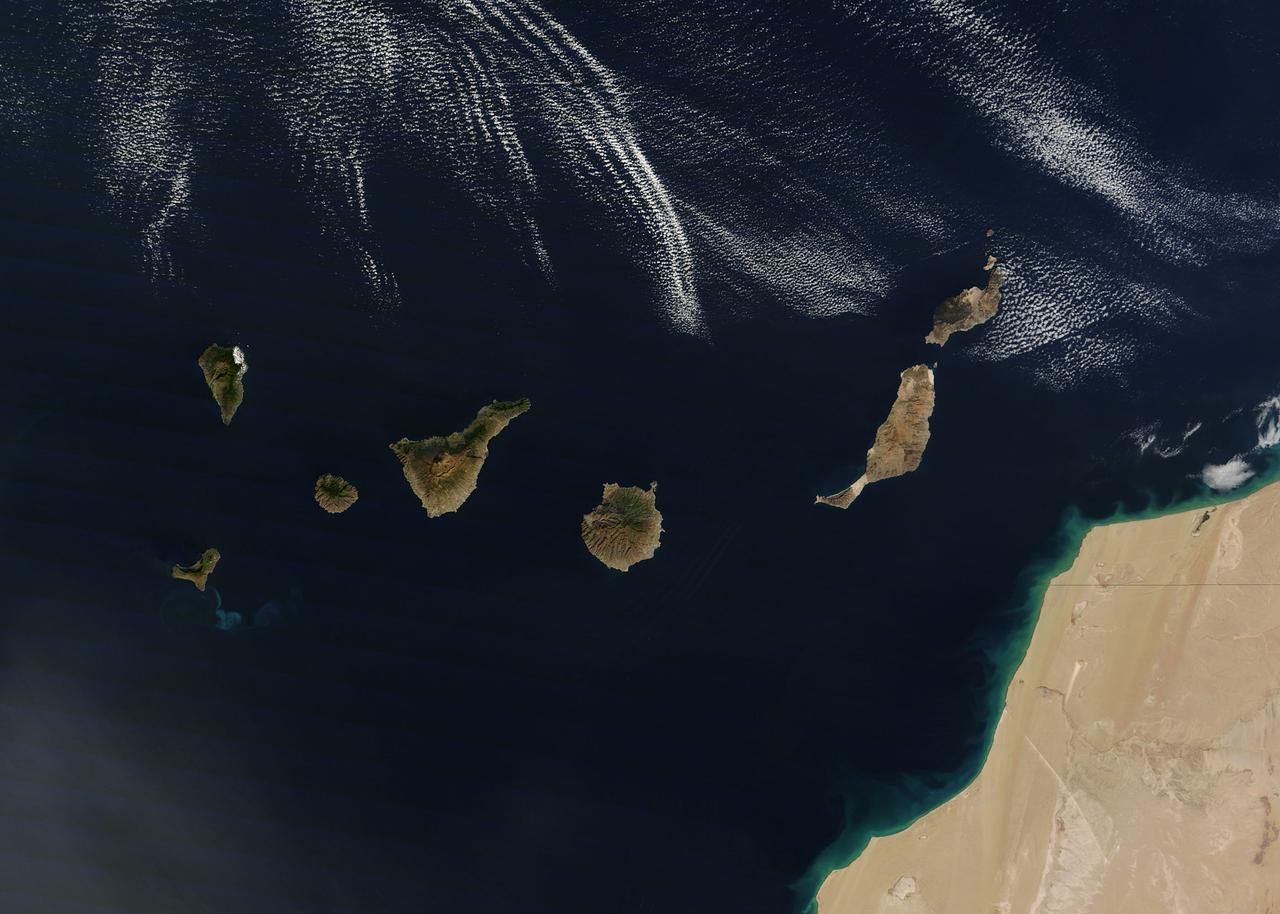
NASA image acquired December 21, 2011 The rugged landscape of the Canary Islands stood out in sharp contrast to the smooth blue waters of the Atlantic Ocean and the flat tan land of northwestern Africa on December 21, 2011, when the Moderate Resolution Imaging Spectroradiometer (MODIS) aboard the Terra satellite captured this true-color image. The Canary Islands are a group of seven large islands and several smaller islets, all volcanic in origin. The eastern edge of the chain lies only 100 kilometers from the coasts of Morocco and Western Sahara, and the chain stretches for about 500 kilometers across the Atlantic. All the islands are mountainous, and Tenerife, the central island in this image is home to Pico de Teinde, the highest peak, which rises 12,198 feet (3,718 meters) above sea level. From east to west, the islands are named Lanzarote, Fuerteventura, Gran Canaria, Tenerife, La Gomera, La Palmera and El Hierro. A bright swirl of peacock blue marks the ocean south of El Hierro, a stain on the sea from an ongoing eruption of a volcano under the waters. Credit: NASA/GSFC/Jeff Schmaltz/MODIS Land Rapid Response Team <b><a href="http://www.nasa.gov/audience/formedia/features/MP_Photo_Guidelines.html" rel="nofollow">NASA image use policy.</a></b> <b><a href="http://www.nasa.gov/centers/goddard/home/index.html" rel="nofollow">NASA Goddard Space Flight Center</a></b> enables NASA’s mission through four scientific endeavors: Earth Science, Heliophysics, Solar System Exploration, and Astrophysics. Goddard plays a leading role in NASA’s accomplishments by contributing compelling scientific knowledge to advance the Agency’s mission. <b>Follow us on <a href="http://twitter.com/NASA_GoddardPix" rel="nofollow">Twitter</a></b> <b>Like us on <a href="http://www.facebook.com/pages/Greenbelt-MD/NASA-Goddard/395013845897?ref=tsd" rel="nofollow">Facebook</a></b> <b>Find us on <a href="http://instagrid.me/nasagoddard/?vm=grid" rel="nofollow">Instagram</a></b>
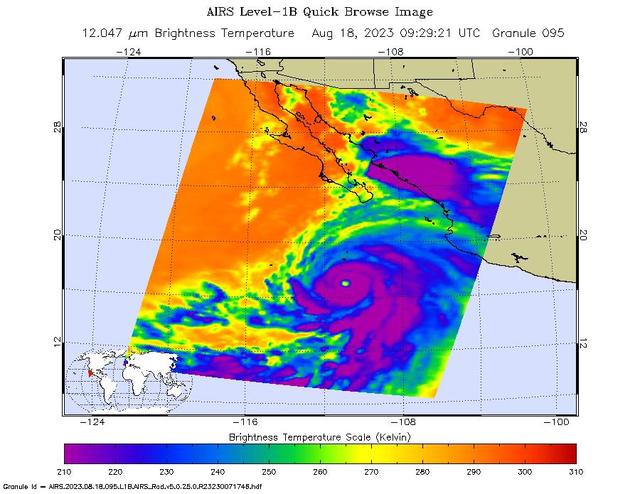
NASA's Atmospheric Infrared Sounder (AIRS) captured Hurricane Hilary on the morning of Aug. 18, 2023, when it was a Category 4 storm roughly 470 miles (760 kilometers) south of Baja California. Hilary could be the first tropical storm to make landfall in California since 1939, according to the National Weather Service. Hilary grew from a tropical storm into a Category 2 hurricane within 24 hours on Aug. 17. Another period of rapid intensification – an increase in maximum sustained wind speed of at least 30 knots (35 mph) within 24 hours – occurred Aug. 17-18. The animation shows some of this rapid growth, with images taken by AIRS Aug. 15-18. This intensification was driven by very warm ocean surface waters and weak wind shear, a term for vertical changes in wind speed. Strong wind shear can keep hurricanes from forming, or can tear them apart. AIRS measures cloud temperatures in infrared wavelengths, which can reveal information about the atmosphere not visible to the human eye. Hilary shows several indicators of a powerful hurricane: a well-defined eye surrounded by a ring of very cold clouds in purple, with warmer outer regions seen in yellows and oranges. Purple and violet areas are colder, between about minus 82 degrees Fahrenheit and minus 46 F (minus 63 degrees Celsius to minus 44 C). Blue and green regions are roughly minus 28 F to 26 F (minus 33 C to minus 3 C). The cooler parts of the clouds are associated with very heavy rainfall. Most hurricanes in the Pacific Ocean off Mexico travel westward, following tropical trade winds. Occasionally, one of these storms will head northward. Hurricane Hilary is being steered by a weak low-pressure system off the coast of California, an area normally dominated by high pressure and an atmospheric circulation pattern that would deflect storms from the region. The current forecast from the National Hurricane Center has Hilary closely following the western coastline of the Baja California peninsula, weakening as it moves north. Rainfall projections for Southern California range from 2 inches (5 centimeters) in coastal areas to 8 or more inches (20 or more centimeters) in local mountains. For comparison, San Diego and Los Angeles receive no rain in August most years, and the wettest parts of the local mountains receive about 1 inch (3 centimeters) of rain over a normal summer. In conjunction with the Advanced Microwave Sounding Unit (AMSU), AIRS senses emitted infrared and microwave radiation from Earth to provide a 3D look at the planet's weather and climate. Working in tandem, the two instruments make simultaneous observations down to Earth's surface. With more than 2,000 channels sensing different regions of the atmosphere, the system creates a global, 3D map of atmospheric temperature and humidity, cloud amounts and heights, greenhouse gas concentrations, and many other atmospheric phenomena. Launched into Earth orbit in 2002 aboard NASA's Aqua spacecraft, the AIRS and AMSU instruments are managed by NASA's Jet Propulsion Laboratory in Southern California, under contract to NASA. JPL is a division of Caltech. Animation available at https://photojournal.jpl.nasa.gov/catalog/PIA25779

NASA image acquired September 6, 2010 The Matusevich Glacier flows toward the coast of East Antarctica, pushing through a channel between the Lazarev Mountains and the northwestern tip of the Wilson Hills. Constrained by surrounding rocks, the river of ice holds together. But stresses resulting from the glacier’s movement make deep crevasses, or cracks, in the ice. After passing through the channel, the glacier has room to spread out as it floats on the ocean. The expanded area and the jostling of ocean waves prompts the ice to break apart, which it often does along existing crevasses. On September 6, 2010, the Advanced Land Imager (ALI) on NASA’s Earth Observing-1 (EO-1) satellite captured this natural-color image of the margin of Matusevich Glacier. Shown here just past the rock-lined channel, the glacier is calving large icebergs. Low-angled sunlight illuminates north-facing surfaces and casts long shadows to the south. Fast ice anchored to the shore surrounds both the glacier tongue and the icebergs it has calved. Compared to the glacier and icebergs, the fast ice is thinner with a smoother surface. Out to sea (image left), the sea ice is even thinner and moves with winds and currents. Matusevich Glacier does not drain a significant amount of ice off of the Antarctic continent, so the glacier’s advances and retreats lack global significance. Like other Antarctic glaciers, however, Matusevich helps glaciologists form a larger picture of Antarctica’s glacial health and ice sheet volume. NASA Earth Observatory image created by Jesse Allen and Robert Simmon, using EO-1 ALI data provided courtesy of the NASA EO-1 team. Caption by Michon Scott based on image interpretation by Robert Bindschadler, NASA Goddard Space Flight Center, and Walt Meier, National Snow and Ice Data Center. Instrument: EO-1 - ALI Credit: <b><a href="http://www.earthobservatory.nasa.gov/" rel="nofollow"> NASA Earth Observatory</a></b> <b><a href="http://www.nasa.gov/centers/goddard/home/index.html" rel="nofollow">NASA Goddard Space Flight Center</a></b> enables NASA’s mission through four scientific endeavors: Earth Science, Heliophysics, Solar System Exploration, and Astrophysics. Goddard plays a leading role in NASA’s accomplishments by contributing compelling scientific knowledge to advance the Agency’s mission. <b>Follow us on <a href="http://twitter.com/NASA_GoddardPix" rel="nofollow">Twitter</a></b> <b>Join us on <a href="http://www.facebook.com/pages/Greenbelt-MD/NASA-Goddard/395013845897?ref=tsd" rel="nofollow">Facebook</a></b> To download the full resolution image go to: <a href="http://earthobservatory.nasa.gov/IOTD/view.php?id=46840" rel="nofollow">earthobservatory.nasa.gov/IOTD/view.php?id=46840</a>
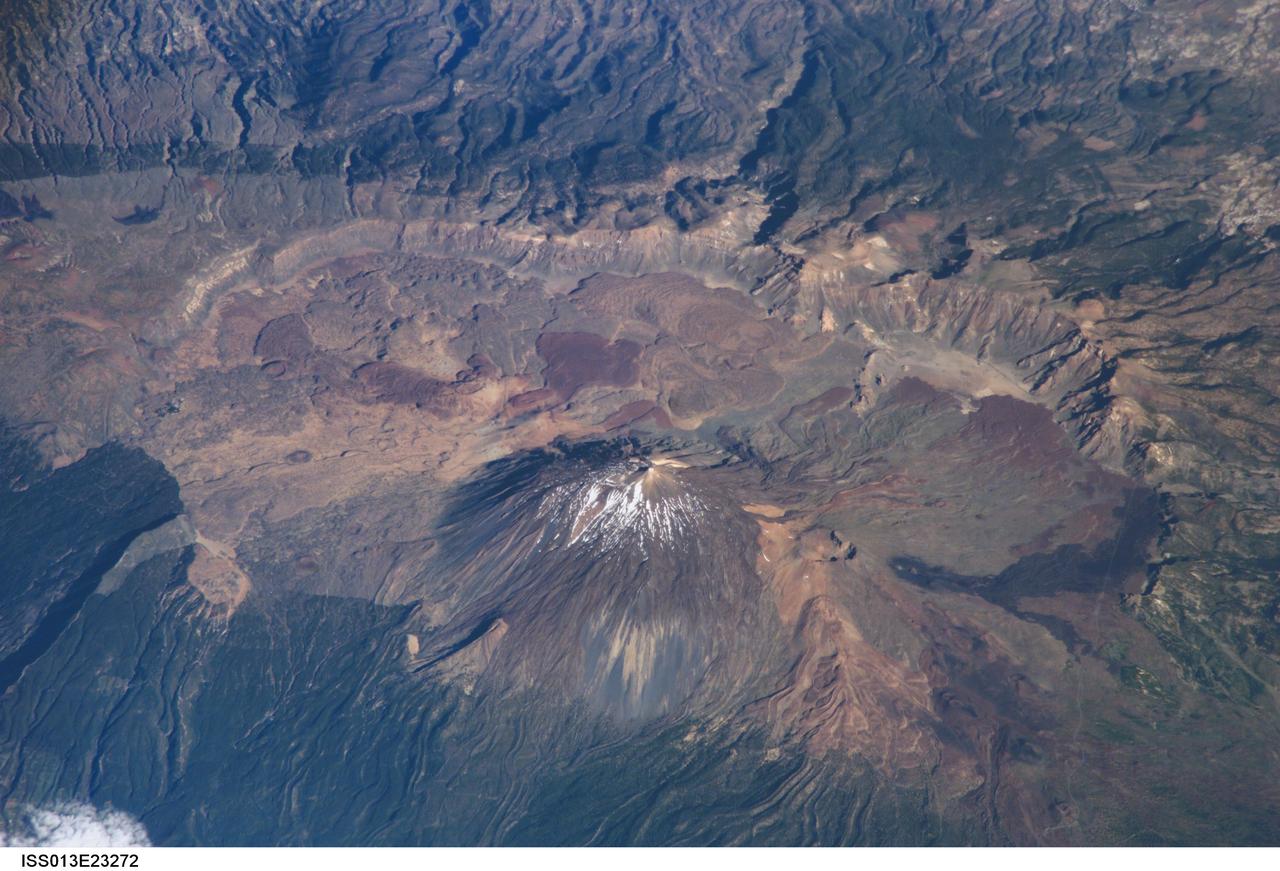
ISS013-E-23272 (8 June 2006) --- Tenerife Island, Spain is featured in this image photographed by an Expedition 13 crewmember on the International Space Station. Tenerife is the largest of the Canary Islands, a Spanish possession located off the northwestern coast of Africa. According to scientists, the islands in the chain could have been produced by eruptions of basaltic shield volcanoes as the African tectonic plate moved over a stationary "hot spot" much like the formation of the Hawaiian Islands. A different hypothesis relates the Canary Islands to magma rise along underwater faults during the uplift of the Atlas Mountains in northern Africa. The island of Tenerife exhibits many excellent volcanic features. The central feature of this image is the elliptical depression of the Las Ca?adas caldera that measures 170 square kilometers in area. A caldera is typically formed when the magma chamber underneath a volcano is completely emptied (usually following a massive eruptive event), and the overlying materials collapse into the newly formed void beneath the surface. A large landslide may have also contributed to (or been the primary cause of) formation of the caldera structure. In this model, part of the original shield volcano forming the bedrock of the island collapsed onto the adjacent sea floor, forming the large depression of the caldera. According to scientists, following formation of the caldera approximately 0.17 million years ago, the composite volcanoes of Mount Teide and Pico Viejo formed. Teide is the highest peak in the Atlantic Ocean with a summit elevation of 3,715 meters. This type of volcano is formed by alternating layers of dense lava flows and more fragmented explosive eruption products, and can build high cones. Many linear flow levees are visible along the flanks of Teide volcano extending from the summit to the base, while a large circular explosion crater marks the summit of Pico Viejo. The floor of the Las Ca?adas caldera is covered with tan, red-brown, and black irregularly-lobed lava flows, the eruptions of which have been observed by settlers and seamen since 1402. The most recent eruption occurred in 1909. The island of Tenerife is actively monitored for further activity.
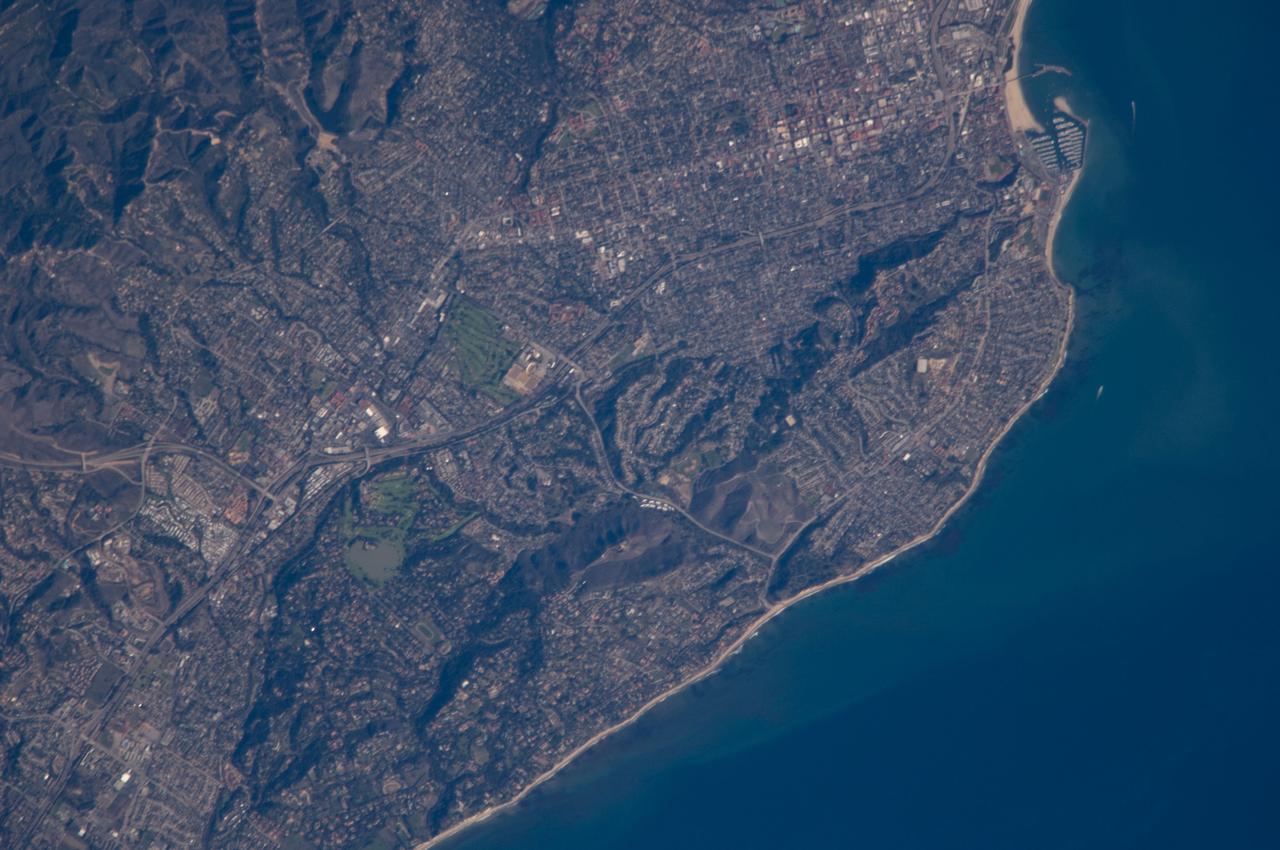
ISS018-E-011096 (6 Dec. 2008) --- Santa Barbara, CA metropolitan area, also known as the ?American Riviera?, is featured in this image photographed by an Expedition 18 crewmember on the International Space Station. The geographic setting of the city - between the Santa Barbara Channel to the south and the steep Santa Ynez Mountains to the north. The city was officially founded as a Spanish mission in 1786, and was incorporated into the United States from Mexico in 1848 following the Mexican-American War. The dramatic landscape of the city is the result of tectonic forces ? the Santa Barbara Channel is part of the boundary between the Pacific oceanic and North American continental crustal plates. Movement along the San Andreas Fault ? the actual zone of contact between the two plates ? over geologic time both raised the Santa Ynez range and lowered the seafloor, forming the deep Santa Barbara Channel. The city has experienced two earthquakes, one in 1812 and another in 1925 that caused significant damage. The urban street grid is defined by white and red rooftops at top center; to the southeast lie beaches and the boat slips of a large marina (top right). Two large golf courses, characterized by expanses of green grass, are visible at center. Low east-west trending hills that parallel the coastline are almost completely covered by residential and commercial development, lending a speckled appearance to the hillsides. Immediately offshore, giant kelp beds are the focus of the Santa Barbara Coastal Long Term Ecological Research site, part of the National Science Foundation?s Long Term Ecological Research Network.
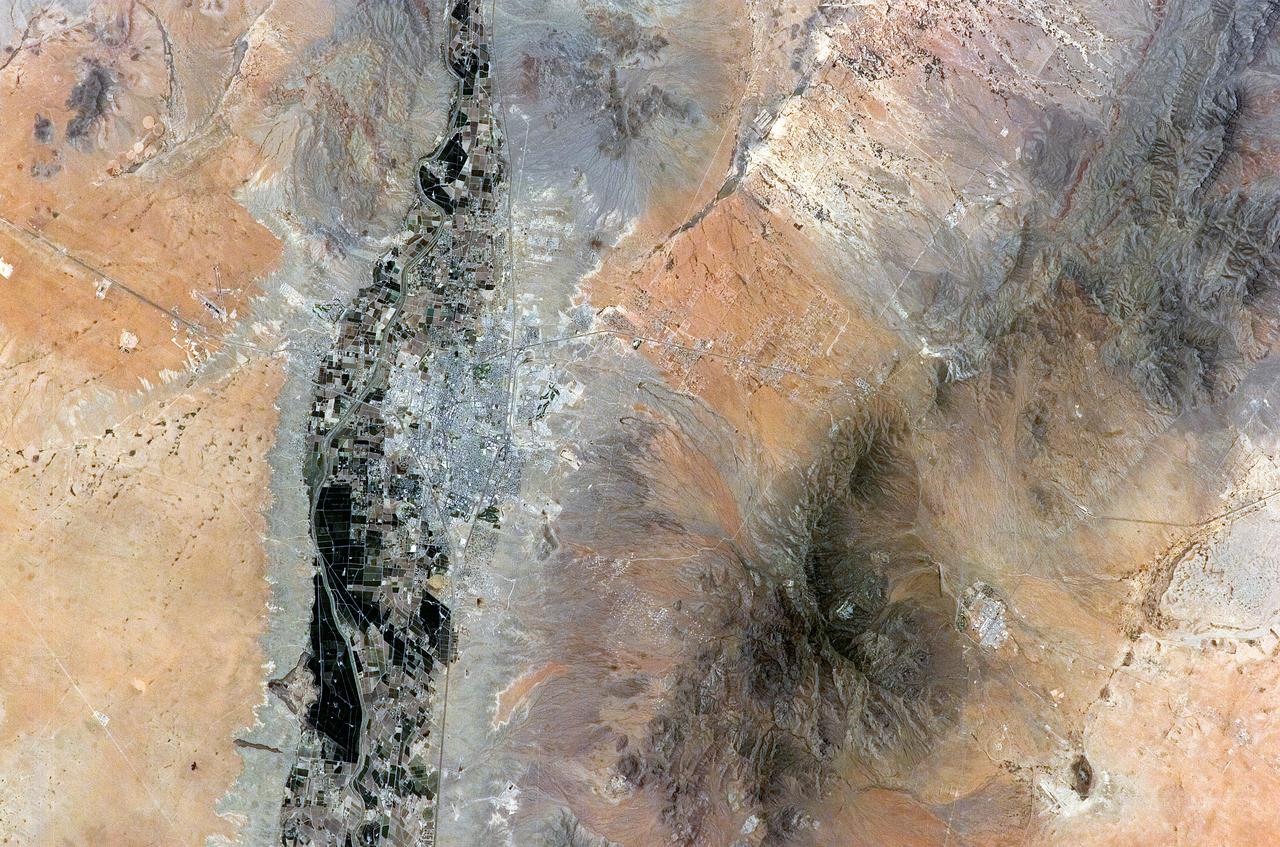
ISS011-E-08410 (9 June 2005) --- Las Cruces, New Mexico is featured in this image photographed by an Expedition 11 crewmember on the International Space Station. The city of Las Cruces is located within the Rio Grande Rift, a large geological feature that extends from Colorado southward into Mexico. According to NASA geologists, rifting usually heralds the breakup of continental landmasses, such as the separation of South America and Africa to form the southern Atlantic Ocean during the Mesozoic Era. The Rift is marked by a series of depressions (known as graben) caused by the subsidence of crustal blocks between parallel faults as the continental crust is pulled apart by tectonic forces. These graben are frequently marked by uplifted rocks along bounding faults — the striking Organ Mountains to the east of Las Cruces are one such uplifted fault block. While separation of the continental crust is no longer occurring, the Rio Grande Rift is still considered active as evidenced by frequent low-intensity earthquakes and hot springs to the north of Las Cruces. The modern city of Las Cruces — the seat of Doña Ana County and home to New Mexico State University — is undergoing rapid urban expansion due to influx of new residents attracted to the climate and landscape. The current urban area (gray to white region at image center) contrasts sharply with agricultural lands (dark green and grey brown) located along the Rio Grande River and the surrounding desert valley floor to the northeast and southwest (brown, blue gray and tan areas).
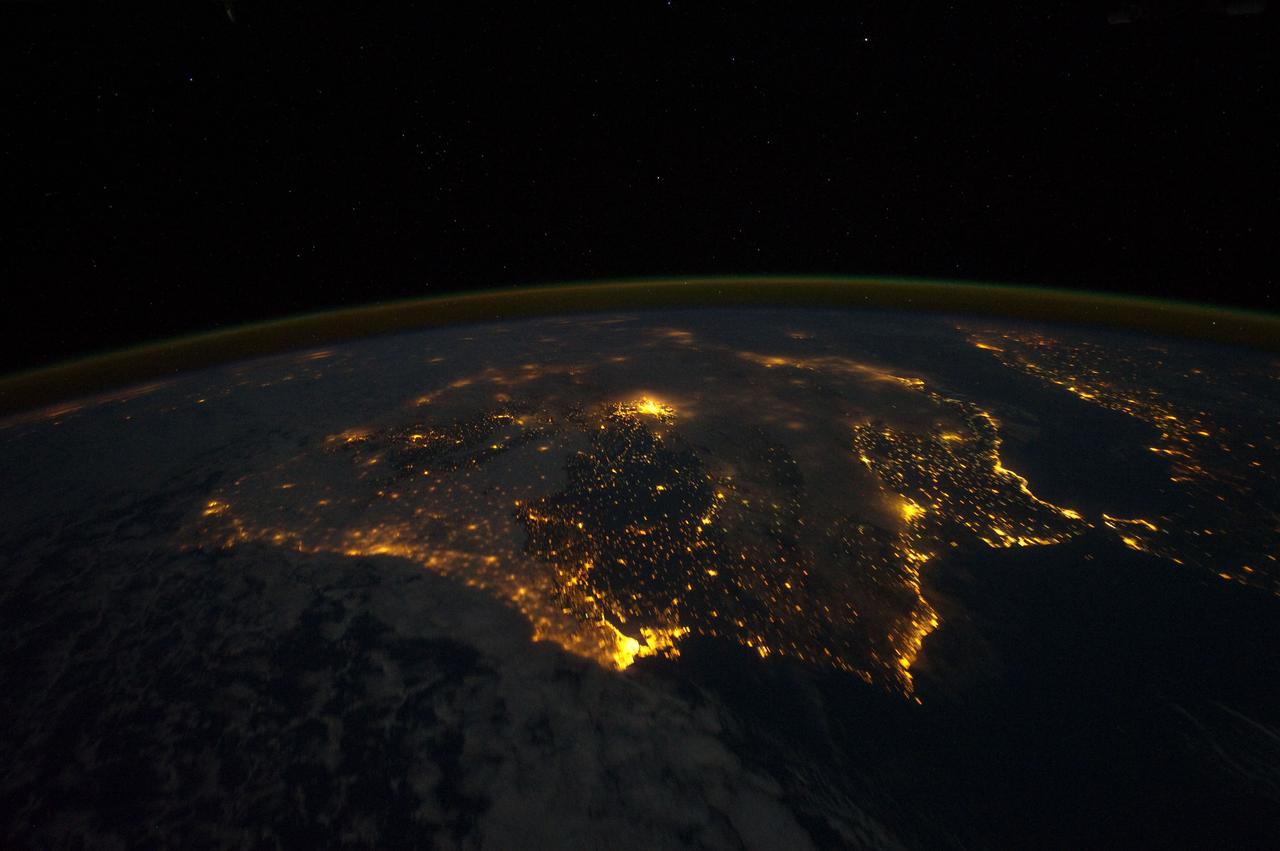
ISS030-E-010008 (4 Dec. 2011) --- One of the Expedition 30 crew members aboard the Earth-orbiting International Space Station photographed this night time scene of the Iberian Peninsula on Dec. 4, 2011. The city lights of Spain and Portugal define the peninsula. Several large metropolitan areas are visible, marked by their relatively large and brightly lit areas, such as two capital cities -- Madrid, Spain, located near the center of the peninsula?s interior, and Lisbon, Portugal, located along the southwestern coastline. Ancient Seville, visible at image right to the north of the approximately 14 kilometer-wide Strait of Gibraltar, is one of the largest cities in Spain. All together, the Principality of Andorra, the Kingdom of Spain and the Portuguese Republic total approximately 590,000 square kilometers of landmass. The peninsula is bounded by the Atlantic Ocean to the northwest, west, and southwest and the Mediterranean Sea to the east. Its northeastern boundary with the rest of continental Europe is marked by the Pyrenees mountain range. The view is looking outwards from the orbital outpost toward the east. The network of smaller cities and towns in the interior and along the coastline attest to the large extent of human presence on the Iberian landscape. Blurring of the city lights is caused by thin cloud cover (image left and center), while the cloud tops are dimly illuminated by moonlight. Though obscured, the lights of France are visible near the horizon line at image upper left, while the lights of northern Africa are more clearly discernable at image right. The gold to green line of airglow, caused by excitation of upper atmosphere gas molecules by ultraviolet radiation, parallels the horizon line (or Earth limb).
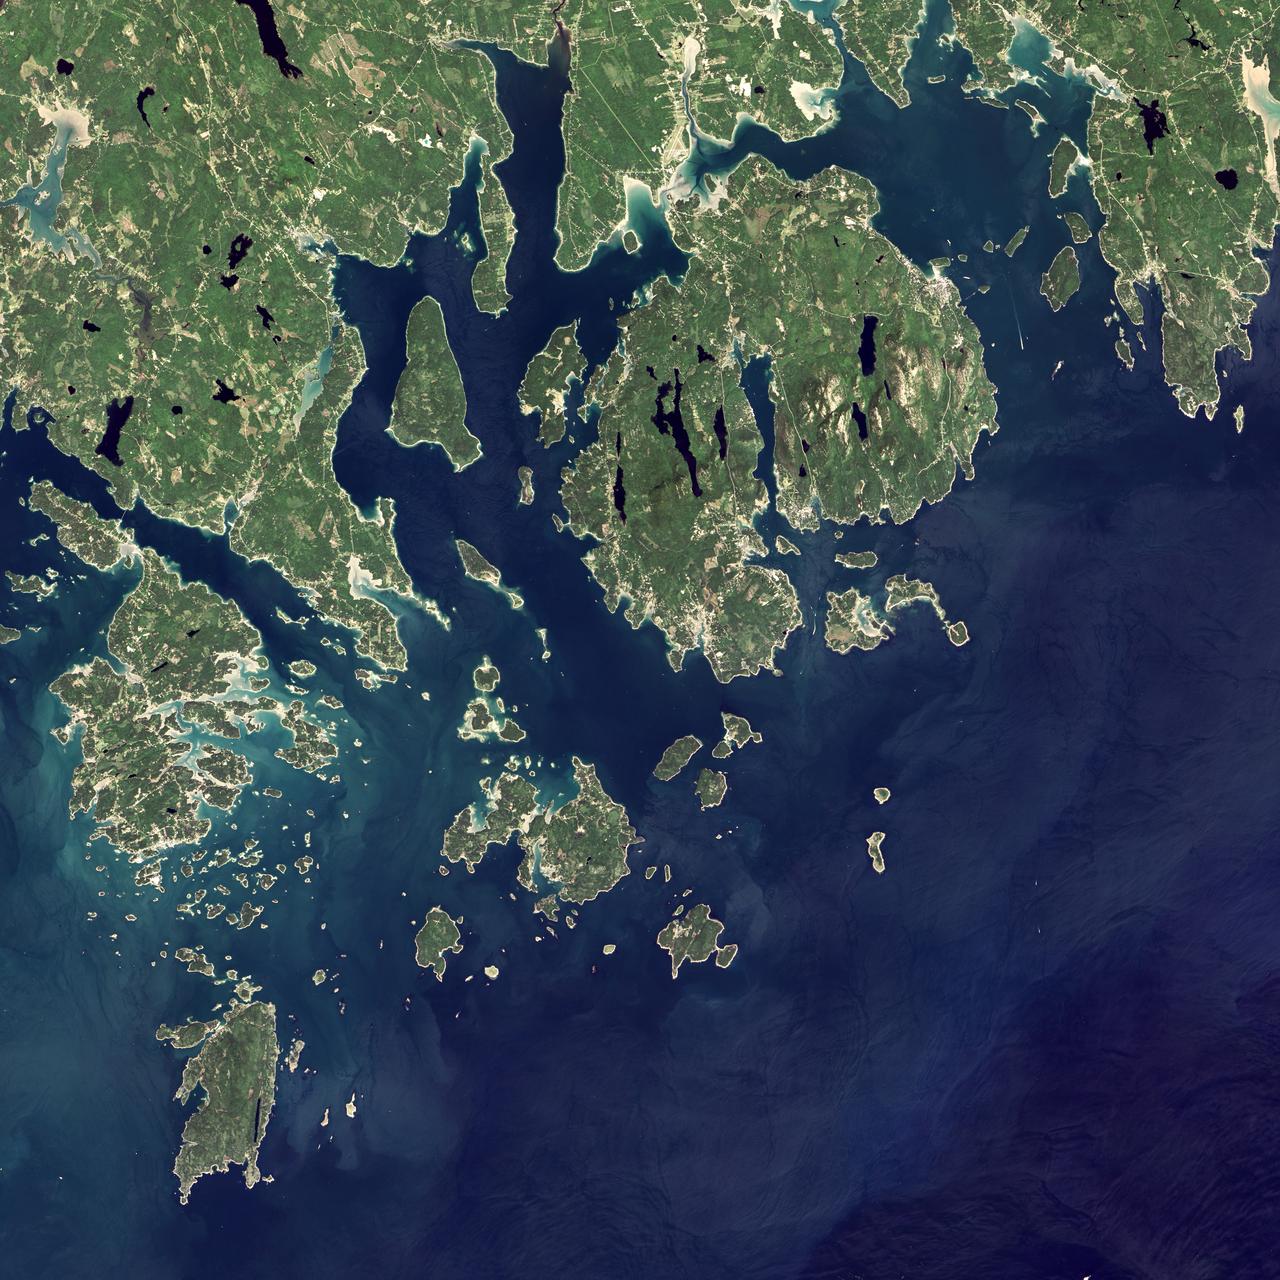
Acadia National Park is one of the most visited parks in America, drawing more than 2.5 million visitors per year to the craggy, jagged coast of Maine. The park is celebrating its 100th anniversary in 2016. On September 6, 2015, the Operational Land Imager (OLI) on the Landsat 8 satellite acquired these images of Acadia National Park and its surroundings. Mountains and hills roll right up to the Atlantic Ocean in this rocky landscape carved by glaciers at the end of the last Ice Age. Since the beginning of the 20th Century, the park has been pieced together by donations and acquisitions of once-private lands, and it is still growing. Of the park’s 47,000 acres, more than 12,000 are privately owned lands under conservation agreements, while the rest is held by the National Park Service. Mount Desert Island is the focal point of the park, which also includes lands around a former naval base (Schoodic Peninsula), Isle au Haut, and several smaller islands. Read more: <a href="http://go.nasa.gov/2adyd8J" rel="nofollow">go.nasa.gov/2adyd8J</a> Credit: NASA/Landsat8 <b><a href="http://www.nasa.gov/audience/formedia/features/MP_Photo_Guidelines.html" rel="nofollow">NASA image use policy.</a></b> <b><a href="http://www.nasa.gov/centers/goddard/home/index.html" rel="nofollow">NASA Goddard Space Flight Center</a></b> enables NASA’s mission through four scientific endeavors: Earth Science, Heliophysics, Solar System Exploration, and Astrophysics. Goddard plays a leading role in NASA’s accomplishments by contributing compelling scientific knowledge to advance the Agency’s mission. <b>Follow us on <a href="http://twitter.com/NASAGoddardPix" rel="nofollow">Twitter</a></b> <b>Like us on <a href="http://www.facebook.com/pages/Greenbelt-MD/NASA-Goddard/395013845897?ref=tsd" rel="nofollow">Facebook</a></b> <b>Find us on <a href="http://instagrid.me/nasagoddard/?vm=grid" rel="nofollow">Instagram</a></b>
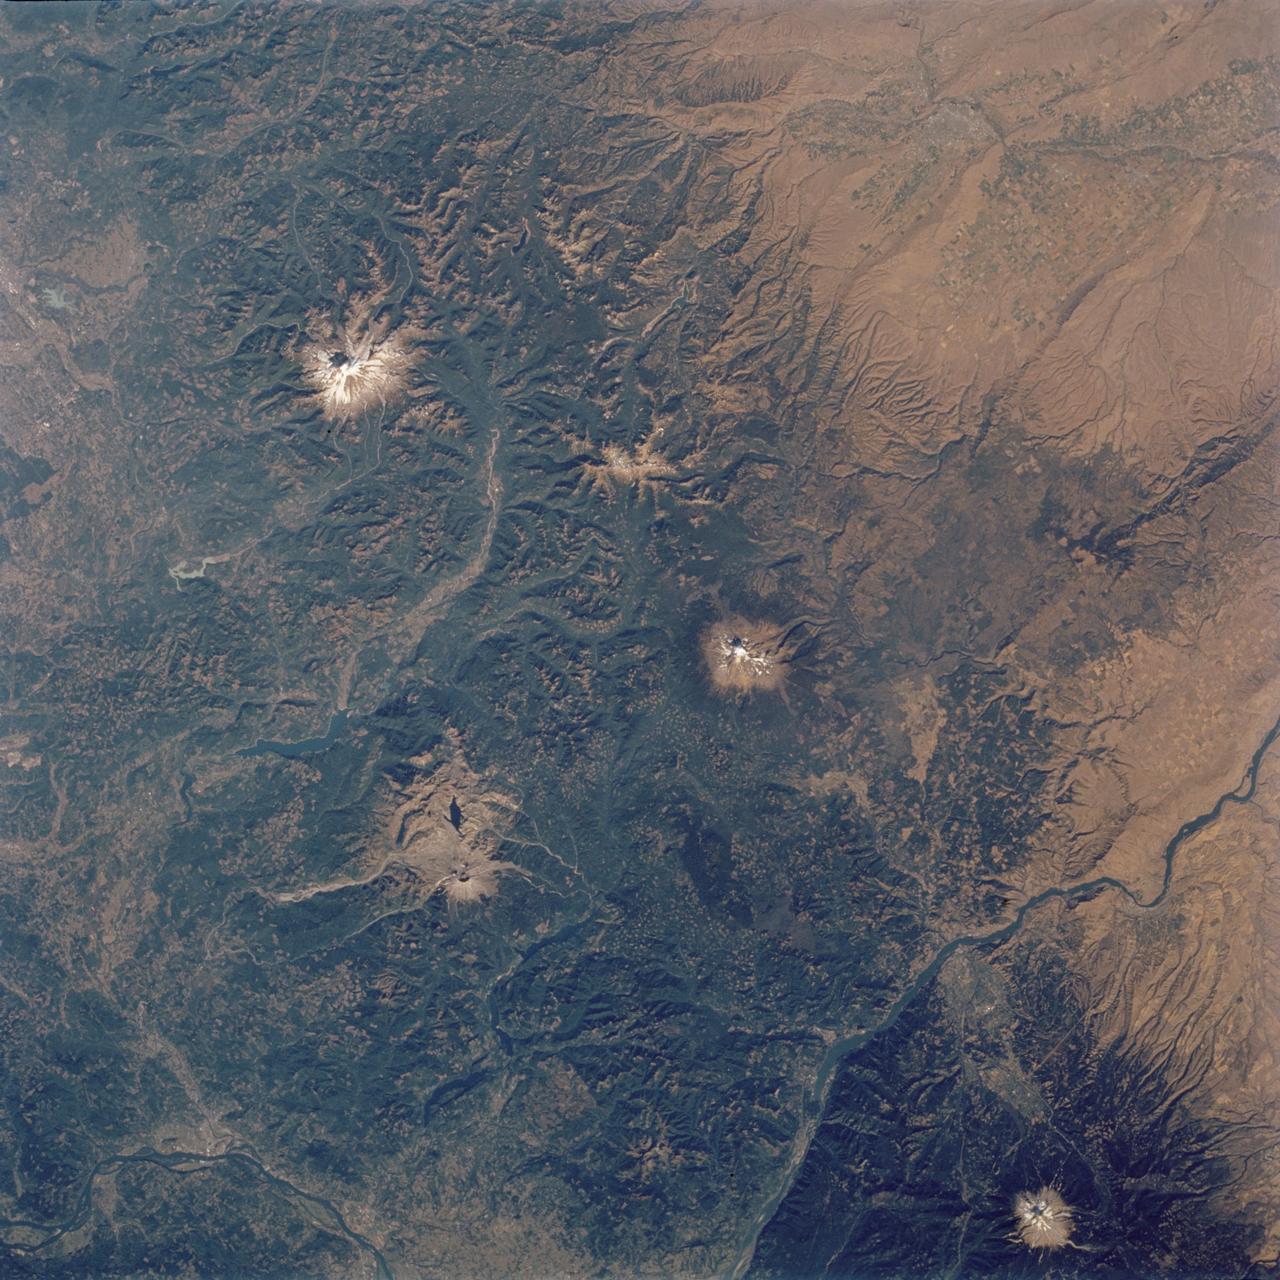
STS112-704-142 (7-18 October 2002) --- (For orientation purposes, north is toward the top left corner). Green colors of the forests of the Cascade Mountains dominate this view, photographed from the Earth-orbiting Space Shuttle Atlantis. Browner colors (top right) are the semiarid plains of the Columbia Basin, in the rain shadow of the Cascades. The highest peaks in this part of the Cascades are four volcanoes. The amount of snow is a good indication of their altitude. The highest is Mt. Rainier (14,410 feet) with the greatest amount of white snow (top left). Seattle lies immediately downslope (top left margin). Mt. Adams (12,276) lies due south in the middle of the view. Mt. Hood (11,235 feet) in the lower right corner, lies south of the great gorge of the Columbia River (which crosses the lower right and then the lower left corners of the view). The river flows broadly west (left) to the Pacific Ocean (out of the picture left). Mt. St Helens (8,364 feet), the snow-free brown patch lower left, was too low to retain snow after the recent fall. According to geologists studying the STS-112 photography, even from the altitude of the Space Shuttle, the intact south half of the cone can be discerned. The geologists point out that the famous blast of 1980 not only destroyed the north side of the cone but blew down the green forest for many square miles on the north side (brown signature).
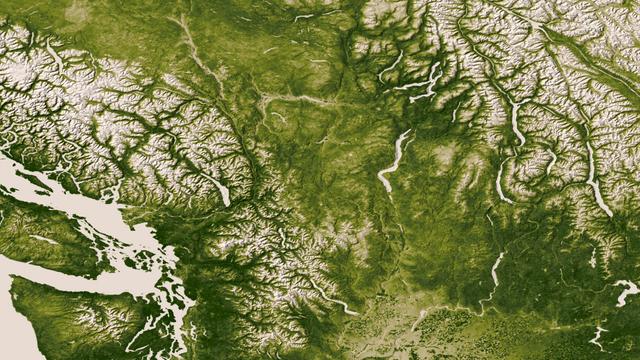
The Rocky, Cascade, and Coast Mountain Ranges dominate the landscape of the Pacific Northwest in this image created June 11-17, 2012 from the Visible-Infrared Imager/Radiometer Suite (VIIRS) instrument aboard the Suomi National Polar-orbiting Partnership or Suomi NPP satellite, a partnership between NASA and the National Oceanic and Atmospheric Administration, or NOAA. Potato and other agriculture can be seen in the bottom center of the image, as the Rockies transition to the plains of Idaho. High values of Normalized Difference Vegetation Index, or NDVI, represent dense green functioning vegetation and low NDVI values represent sparse green vegetation or vegetation under stress from limiting conditions, such as drought. Credit: NASA/NOAA To read more go to: <a href="http://www.nasa.gov/mission_pages/NPP/news/vegetation.html" rel="nofollow">www.nasa.gov/mission_pages/NPP/news/vegetation.html</a> <b><a href="http://www.nasa.gov/audience/formedia/features/MP_Photo_Guidelines.html" rel="nofollow">NASA image use policy.</a></b> <b><a href="http://www.nasa.gov/centers/goddard/home/index.html" rel="nofollow">NASA Goddard Space Flight Center</a></b> enables NASA’s mission through four scientific endeavors: Earth Science, Heliophysics, Solar System Exploration, and Astrophysics. Goddard plays a leading role in NASA’s accomplishments by contributing compelling scientific knowledge to advance the Agency’s mission. <b>Follow us on <a href="http://twitter.com/NASA_GoddardPix" rel="nofollow">Twitter</a></b> <b>Like us on <a href="http://www.facebook.com/pages/Greenbelt-MD/NASA-Goddard/395013845897?ref=tsd" rel="nofollow">Facebook</a></b> <b>Find us on <a href="http://instagram.com/nasagoddard?vm=grid" rel="nofollow">Instagram</a></b>

For the past eight years, Operation IceBridge, a NASA mission that conducts aerial surveys of polar ice, has produced unprecedented three-dimensional views of Arctic and Antarctic ice sheets, providing scientists with valuable data on how polar ice is changing in a warming world. Now, for the first time, the campaign will expand its reach to explore the Arctic’s Eurasian Basin through two research flights based out of Svalbard, a Norwegian archipelago in the northern Atlantic Ocean. More: <a href="http://go.nasa.gov/2ngAxX2" rel="nofollow">go.nasa.gov/2ngAxX2</a> Caption: Ellesmere Island mountain tops bathed in light as the sun began to peak over the horizon during Operation IceBridge’s first flight of its 2017 Arctic campaign, on March 9, 2017. Credits: NASA/Nathan Kurtz <b><a href="http://www.nasa.gov/audience/formedia/features/MP_Photo_Guidelines.html" rel="nofollow">NASA image use policy.</a></b> <b><a href="http://www.nasa.gov/centers/goddard/home/index.html" rel="nofollow">NASA Goddard Space Flight Center</a></b> enables NASA’s mission through four scientific endeavors: Earth Science, Heliophysics, Solar System Exploration, and Astrophysics. Goddard plays a leading role in NASA’s accomplishments by contributing compelling scientific knowledge to advance the Agency’s mission. <b>Follow us on <a href="http://twitter.com/NASAGoddardPix" rel="nofollow">Twitter</a></b> <b>Like us on <a href="http://www.facebook.com/pages/Greenbelt-MD/NASA-Goddard/395013845897?ref=tsd" rel="nofollow">Facebook</a></b> <b>Find us on <a href="http://instagrid.me/nasagoddard/?vm=grid" rel="nofollow">Instagram</a></b>
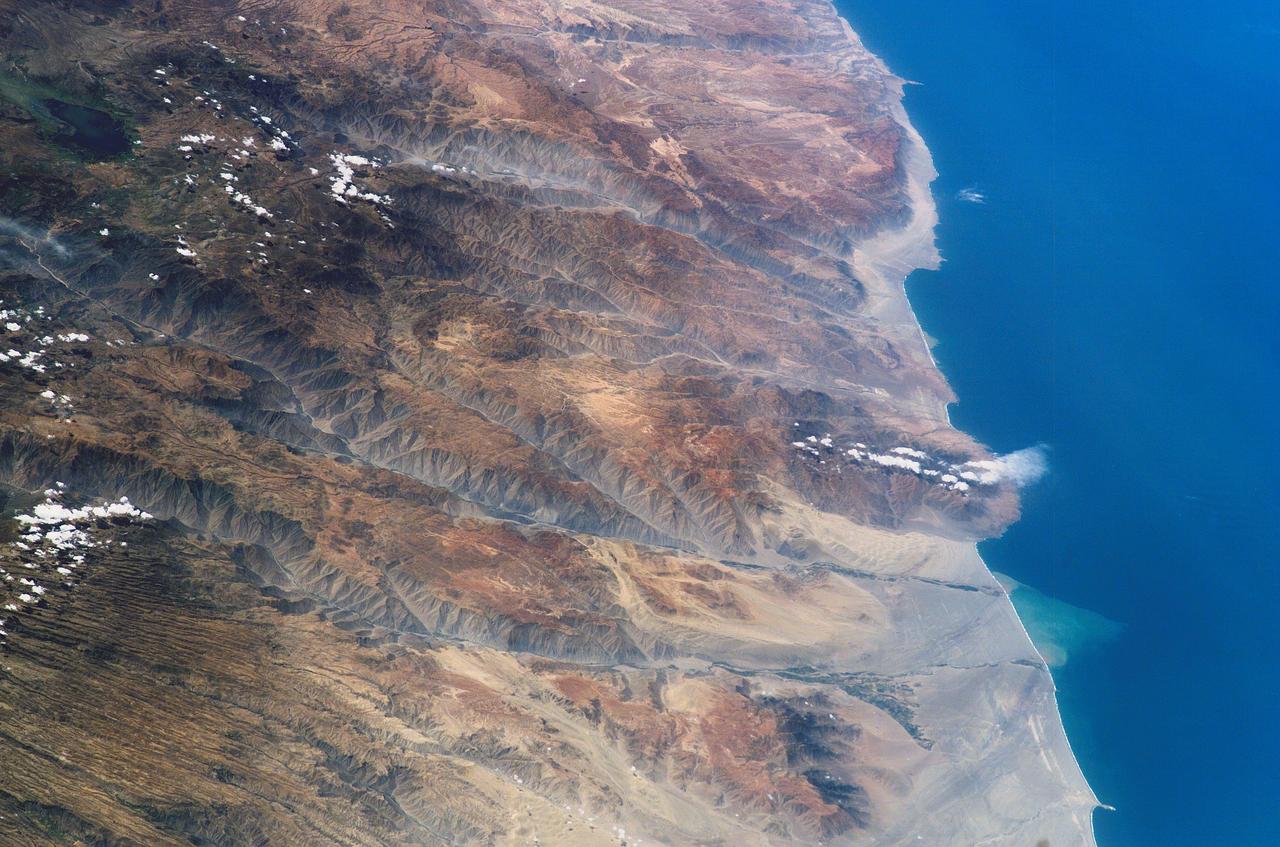
ISS006-E-38306 (14 March 2003) --- The Arid Coast of Peru is featured in this digital image photographed by an Expedition 6 crewmember on the International Space Station (ISS). This oblique, south-looking view shows the dramatic canyons of Peru’s southern coast (15.5 – 17 degrees S). According to NASA scientists studying ISS imagery, these are relatively young features carved by rivers mainly over the past 8 million years following the last major upheaval of the Andes Mountains. The canyons are some of the steepest and deepest on Earth—lake Laguna Parincocha (top left corner) lies on the Andean plateau about 3,250 meters above sea level, only 80 kilometers from the coast. A sheet of volcanic rock (known as an ignimbrite deposit) emplaced during an explosive eruptive event is scored with a dense pattern of parallel dry streams in the lower left corner of the image. Volcanic source regions for the ignimbrite lie outside the left margin of the view. The Yauca and Acarí rivers feed small tan-colored sediment plumes into the sea (lower right). Dark green agricultural fields cluster along the lower courses of the rivers. Strong southerly winds have generated sand dunes and dark wind streaks along the coast, whose alignments re-curve inland into the lower river valleys (lower right). The coast and canyons are commonly hazy due to oceanic air and blowing dust. Yellow lines parallel with the coast and near the small peninsula, according to scientists, are raised shorelines probably caused by tectonic uplift of the coastline.
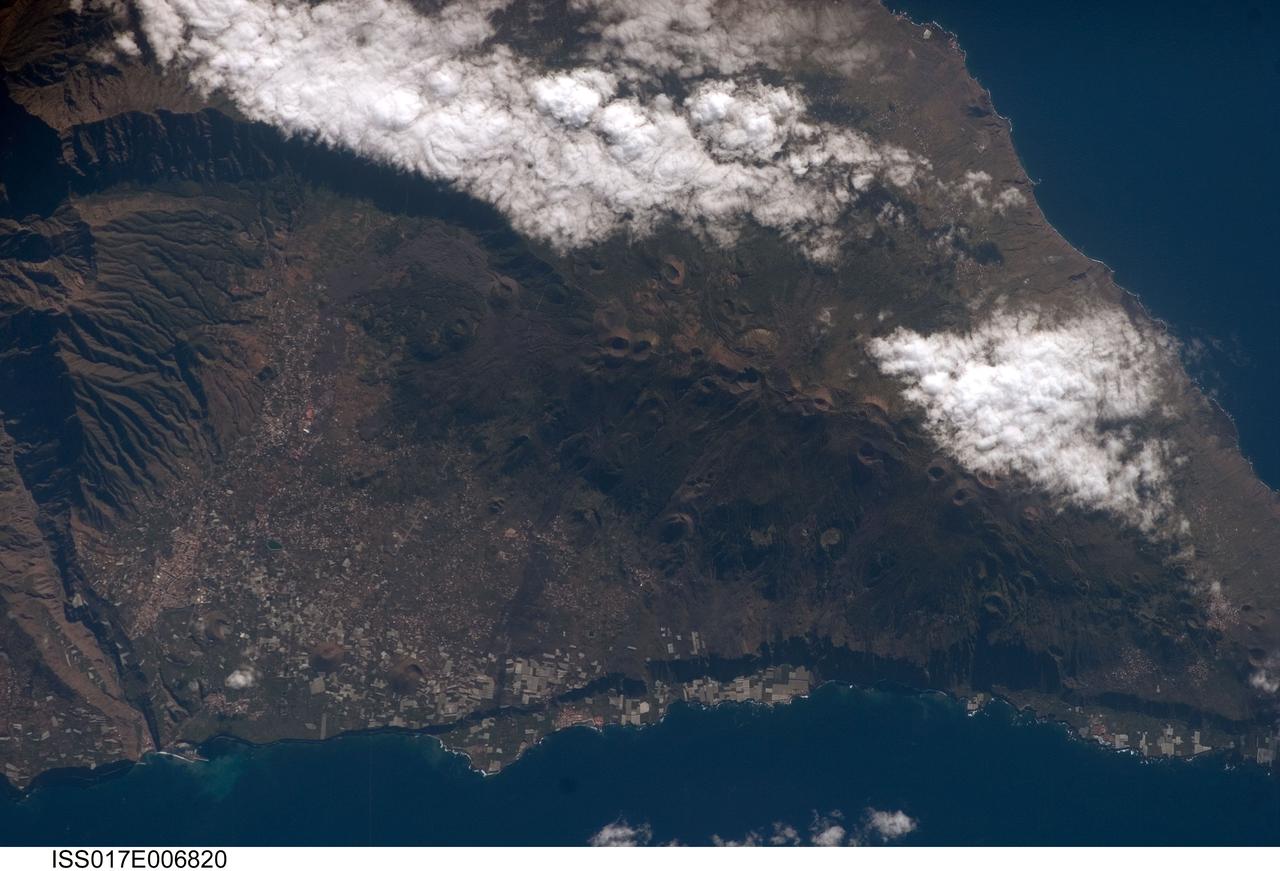
ISS017-E-006820 (13 May 2008) --- Isla de la Palma in the Canary Islands is featured in this image photographed by an Expedition 17 crewmember on the International Space Station. The Canary Islands, a group of volcanic islands, lie just off the west coast of Morocco in the Atlantic Ocean; at the northwest end of the chain of islands is Isla de la Palma. According to scientists, the island started forming as a submarine volcano approximately 3-4 million years ago. Subaerial (above the water surface) volcanic activity and island formation began around 2 million years ago. Most geologists believe the Canary Islands formed over the remnants of an old "hotspot" in the mantle, or mantle plume. The residual hotspot melting produced the magma that resulted in the Canary Island volcanoes. While there is little evidence to support the current existence of a mantle plume, volcanic activity is still taking place -- the most recent lava flows on Isla de Palma were erupted in 1971. In addition to volcanic hazards, the Canary Islands are also subject to occasional dust storms originating in the Sahara Desert. This view highlights volcanic landforms on the southern portion of Isla de Palma. The elongated, 1949-meter high Cumbre Vieja volcanic center is characterized by numerous cinder cones, craters, and gray lava flows that punctuate the green vegetated hillslopes. To the north, the cities of El Paso and Los Llanos de Aridanes nestle against collapsed fragments of the Caldera Taburiente (left), formed by massive slope failure of an older volcanic center to the north. Tourism is a major component of the local economy, but the high mountains and clear air of Isla de la Palma are also attractive to astronomers -- several large observatories (not shown) are located along the northern edge of the Caldera Taburiente.
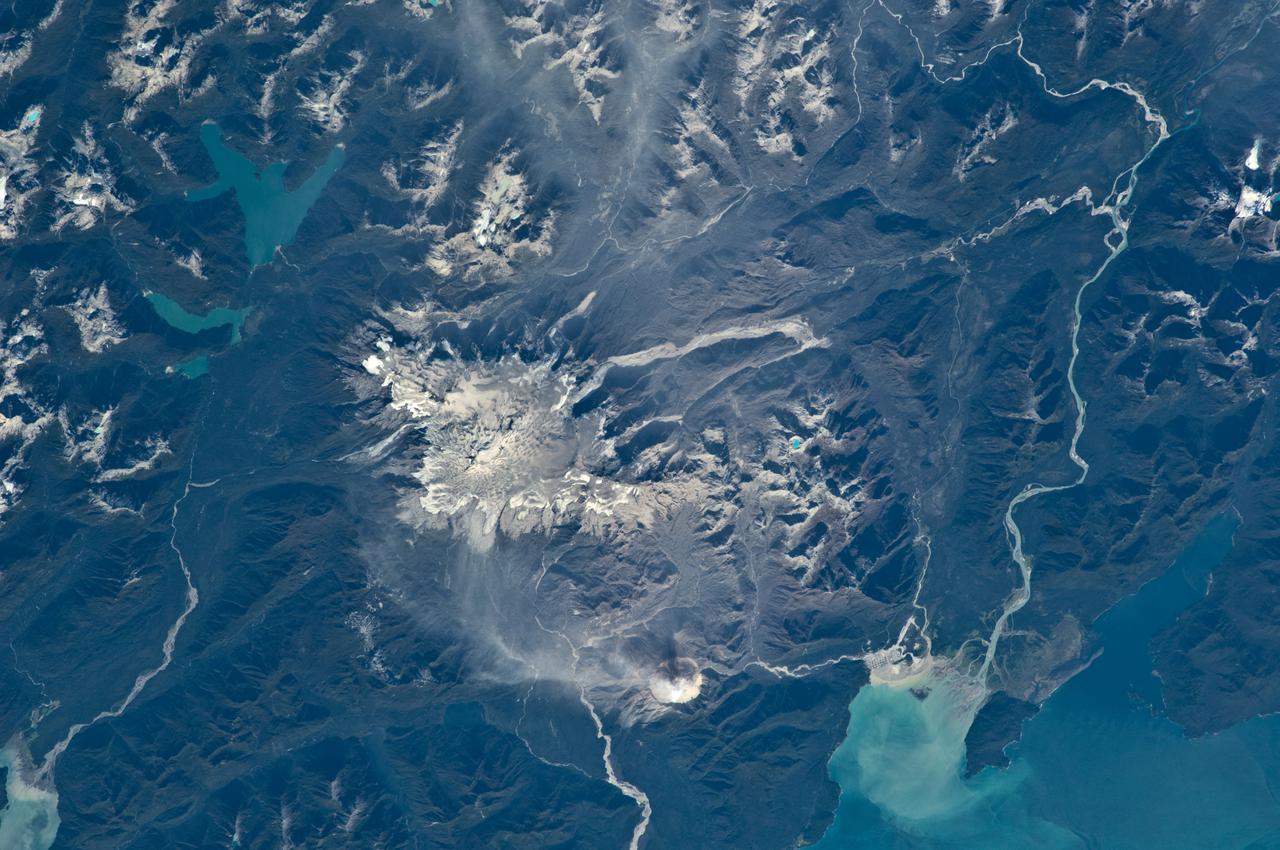
ISS018-E-035716 (24 Feb. 2009) --- Minchinmavida and Chaiten Volcanoes in Chile are featured in this image photographed by an Expedition 18 crewmember on the International Space Station. The Andes mountain chain along the western coastline of South America includes numerous active stratovolcanoes. The majority of these volcanoes are formed, and fed, by magma generated as the oceanic Nazca tectonic plate moves northeastward and plunges beneath the less dense South American continental tectonic plate (a process known as subduction). The line of Andean volcanoes marks the approximate location of the subduction zone. This astronaut photograph highlights two volcanoes located near the southern boundary of the Nazca ? South America subduction zone in southern Chile. Dominating the scene is the massive Minchinmavida stratovolcano at center. An eruption of this glaciated volcano was observed by Charles Darwin during his Galapagos Island voyage in 1834; the last recorded eruption took place the following year. The white, snow covered summit of Minchinmavida is blanketed by gray ash erupted from its much smaller but now active neighbor to the west, Volcan (volcano) Chaiten. The historically inactive Chaiten volcano, characterized by a large lava dome within a caldera (an emptied and collapsed magma chamber beneath a volcano) roared back to life unexpectedly on May 2, 2008, generating dense ash plumes and forcing the evacuation of the nearby town of Chaiten. Volcanic activity continues at Chaiten, including partial collapse of a new lava dome and generation of a pyroclastic flow several days before this photograph was taken. A steam and ash plume is visible extending to the northeast from the eruptive center of the volcano.
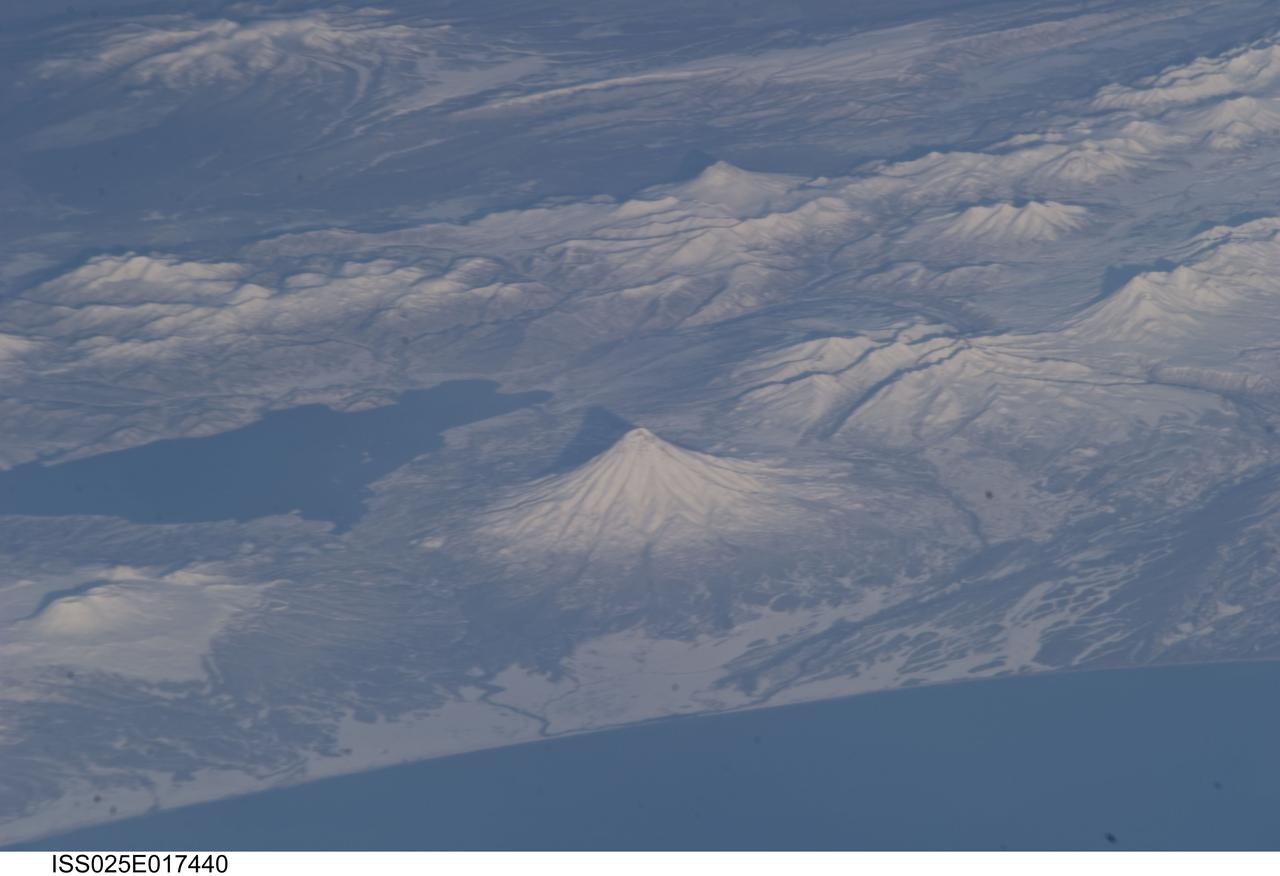
ISS025-E-017440 (19 Nov. 2010) --- Kamchatka volcanoes are featured in this image photographed by an Expedition 25 crew member on the International Space Station. This striking photograph features several snow-covered volcanoes located on the Kamchatka Peninsula of the Russian Federation, as seen from the orbital perspective of the International Space Station (ISS). This image also illustrates one of the unique attributes provided by the ISS – the ability to view Earth landscapes at an angle, rather than the “straight down” view typical of many orbital satellite-based sensors. This oblique view, together with shadows cast by the volcanoes and other mountains provides perspective about the setting and a sense of topography of the region, especially highlighting the symmetrical cones of Kronotsky (center) and Kizimen (top right) stratovolcanoes. Kizimen Volcano last erupted in 1928, while Kronotsky Volcano—one of the largest on the peninsula—last erupted in 1923. Schmidt Volcano, located to the north of Kronotsky, has the morphology of a shield volcano and is not known to have erupted during the period of historical record. To the south of Kronotsky is Krasheninnikov Volcano, comprised of two overlapping stratovolcanoes that formed within an earlier caldera. Scientists believe Krasheninnikov may have last erupted in 1550. The two summit craters of the stratovolcanoes are clearly visible in this image (lower left). Lake Kronotsky (left) is Kamchatka’s largest lake; it was formed when lava flows from Kronotsky Volcano dammed the Listvenichnaya River. The Kamchatka Peninsula lies along the so-called “Ring of Fire” in the Pacific Ocean. The Ring of Fire is characterized by the presence of active volcanoes and frequent earthquakes; these are associated with the many active subduction and transform boundary zones that ring the Pacific tectonic plate. According to scientists, there are currently 114 volcanoes identified on the Kamchatka Peninsula that have erupted during the Holocene Epoch (approximately 12,000 years ago to the present).
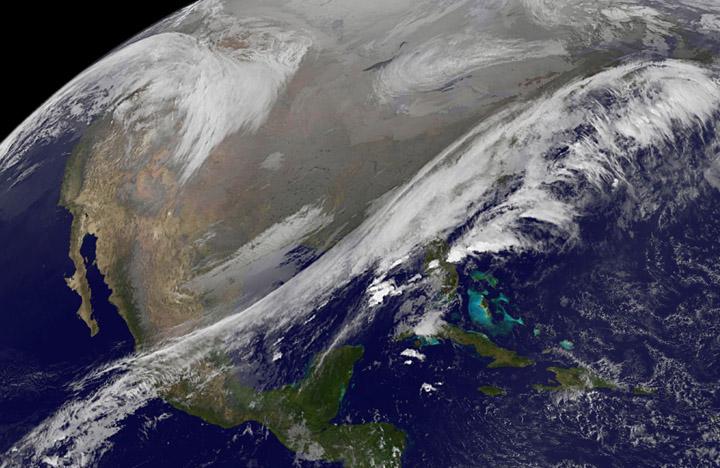
This NOAA's GOES satellite infrared image taken on Nov. 25 at 11:45 UTC (6:45 a.m. EST) shows two main weather systems over the U.S. Credit: NASA/NOAA GOES Project As the U.S. Thanksgiving holiday approaches this Thursday, November 27, NOAA's GOES-East and GOES-West satellites are keeping a weather eye out for storms that may affect early travelers. In an image from Nov. 25, the satellites show an active weather pattern is in place for travelers across the central and eastern U.S. NOAA's GOES-East satellite provides visible and infrared images over the eastern U.S. and the Atlantic Ocean, while NOAA's GOES-West satellite covers the western U.S. and Pacific Ocean from its fixed orbit in space. Data from both satellites were combined at NASA's GOES Project to create a full view of the U.S. on Nov. 25 at 11:45 UTC (6:45 a.m. EST). The image shows clouds associated with cold front stretching from the Gulf of Mexico over northern Florida and along the U.S. East coast to eastern Canada. Clouds associated with another area of low pressure are in the northern Rockies and northwestern U.S. To create the image, NASA/NOAA's GOES Project takes the cloud data from NOAA's GOES-East satellite and overlays it on a true-color image of land and ocean created by data from the Moderate Resolution Imaging Spectroradiometer, or MODIS, instrument that flies aboard NASA's Aqua and Terra satellites. Together, those data created the entire picture of the storm and show its movement. After the storm system passes, the snow on the ground becomes visible. NOAA's National Weather Service Weather Prediction Center said "a storm system will develop off the coast of the Carolinas early Wednesday (Nov. 25) and strengthen as it moves rapidly up the East Coast Wednesday into early Thursday (Nov. 26). Heavy snow is likely to begin in the central Appalachians early Wednesday morning, spreading northeast through the interior Mid-Atlantic into New England by Wednesday night. Winter Storm Watches are in effect for these areas." For travelers in the western U.S., the Northern Rocky Mountains are expected to receive more snow from the north side of a stationary frontal boundary. South of the boundary rain showers will affect the lower valley. The National Weather Service calls for cold weather to continue in the northern Plains and Upper Midwest as a Canadian surface high pressure rules the weather. The U.S. Southwest will experience nice weather for mid-week. In the Pacific Northwest, the National Weather Service noted that a warm front will bring rain, heavy at times, to the Cascades today and tonight. There will be a break in the heavier rains on Wednesday, then another period of heavy rain for the Cascades Wednesday night through Friday morning as a cold front slowly drags through the area. NOAA's GOES satellites provide the kind of continuous monitoring necessary for intensive data analysis. Geostationary describes an orbit in which a satellite is always in the same position with respect to the rotating Earth. This allows GOES to hover continuously over one position on Earth's surface, appearing stationary. As a result, GOES provide a constant vigil for the atmospheric triggers for severe weather conditions such as tornadoes, flash floods, hail storms and hurricanes.
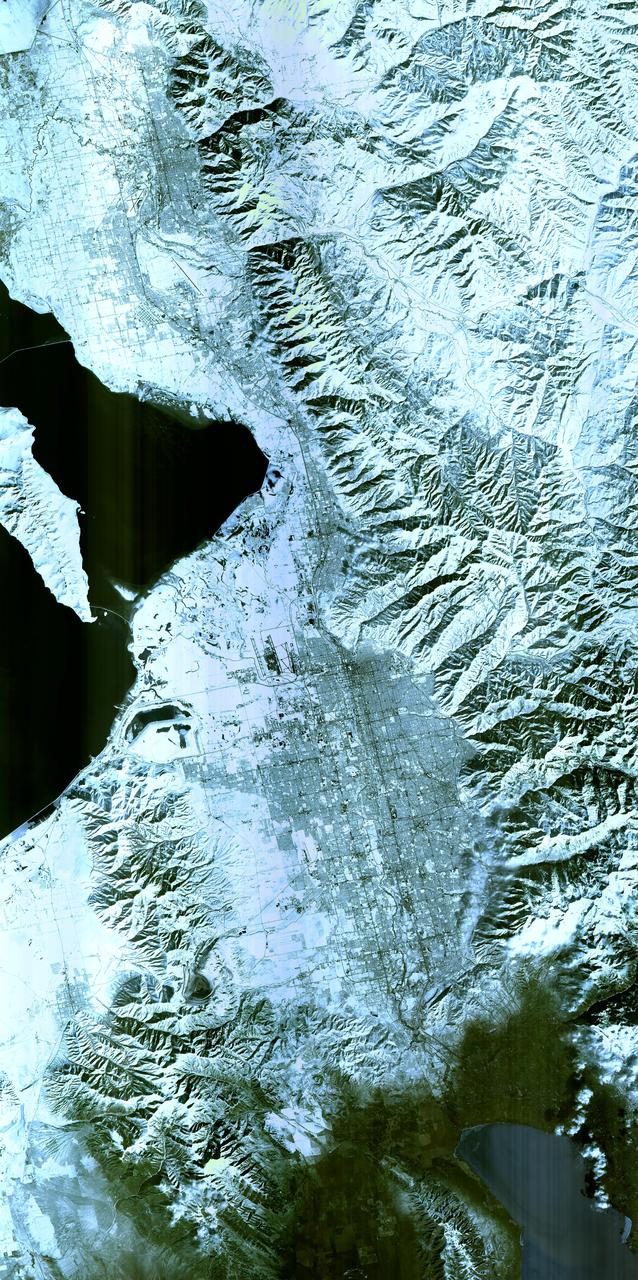
Salt Lake City, Utah, Winter 2001 The 2002 Winter Olympics are hosted by Salt Lake City at several venues within the city, in nearby cities, and within the adjacent Wasatch Mountains. This simulated natural color image presents a snowy, winter view of north central Utah that includes all of the Olympic sites. The image extends from Ogden in the north, to Provo in the south; and includes the snow-capped Wasatch Mountains and the eastern part of the Great Salt Lake. This image was acquired on February 8, 2001 by the Advanced Spaceborne Thermal Emission and Reflection Radiometer (ASTER) on NASA's Terra satellite. With its 14 spectral bands from the visible to the thermal infrared wavelength region, and its high spatial resolution of 15 to 90 meters (about 50 to 300 feet), ASTER will image Earth for the next 6 years to map and monitor the changing surface of our planet. ASTER is one of five Earth-observing instruments launched December 18,1999, on NASA's Terra satellite. The instrument was built by Japan's Ministry of Economy, Trade and Industry. A joint U.S./Japan science team is responsible for validation and calibration of the instrument and the data products. Dr. Anne Kahle at NASA's Jet Propulsion Laboratory, Pasadena, California, is the U.S. Science team leader; Bjorn Eng of JPL is the project manager. ASTER is the only high resolution imaging sensor on Terra. The Terra mission is part of NASA's Earth Science Enterprise, along-term research and technology program designed to examine Earth's land, oceans, atmosphere, ice and life as a total integrated system. The broad spectral coverage and high spectral resolution of ASTER will provide scientists in numerous disciplines with critical information for surface mapping, and monitoring dynamic conditions and temporal change. Example applications are: monitoring glacial advances and retreats; monitoring potentially active volcanoes; identifying crop stress; determining cloud morphology and physical properties; wetlands evaluation; thermal pollution monitoring; coral reef degradation; surface temperature mapping of soils and geology; and measuring surface heat balance. Image credit: NASA/GSFC/METI/ERSDAC/JAROS, and U.S./Japan ASTER Science Team Credit: <b><a href="http://www.earthobservatory.nasa.gov/" rel="nofollow"> NASA Earth Observatory</a></b> <b><a href="http://www.nasa.gov/audience/formedia/features/MP_Photo_Guidelines.html" rel="nofollow">NASA image use policy.</a></b> <b><a href="http://www.nasa.gov/centers/goddard/home/index.html" rel="nofollow">NASA Goddard Space Flight Center</a></b> enables NASA’s mission through four scientific endeavors: Earth Science, Heliophysics, Solar System Exploration, and Astrophysics. Goddard plays a leading role in NASA’s accomplishments by contributing compelling scientific knowledge to advance the Agency’s mission. <b>Follow us on <a href="http://twitter.com/NASAGoddardPix" rel="nofollow">Twitter</a></b> <b>Like us on <a href="http://www.facebook.com/pages/Greenbelt-MD/NASA-Goddard/395013845897?ref=tsd" rel="nofollow">Facebook</a></b> <b>Find us on <a href="http://instagram.com/nasagoddard?vm=grid" rel="nofollow">Instagram</a></b>
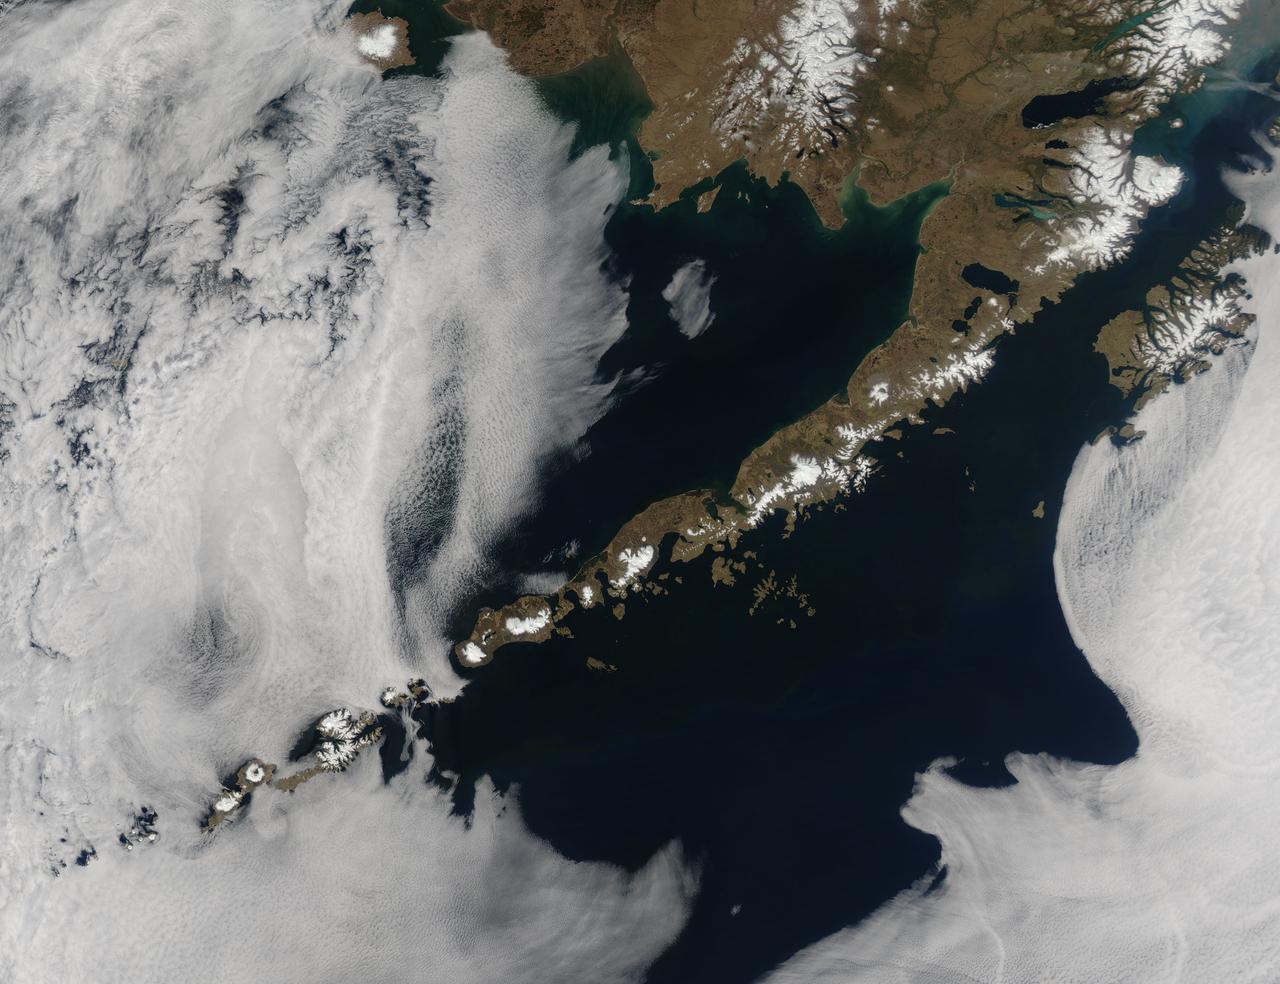
Remote, rugged and extraordinarily beautiful, Alaska’s Aleutian Islands are best known for wildlife reserves, military bases, fishing, furs and fog. The sprawling volcanic archipelago was brought into the spotlight by the Russian-supported expedition of Alexey Chirikov and Vitus Bering in 1741, and soon became controlled by the Russian-American Fur Company. In 1867 the United States purchased Alaska, including the Aleutian Islands, from Russia. By 1900 the port in Unalaska was well established as a shipping port for Alaska gold. The archipelago sweeps about 1,200 miles (1,800 km) from the tip of the Alaskan Peninsula to Attu, the most westward island. Four major island groups hold 14 large islands, about 55 smaller islands, and a large number of islets, adding up to roughly 150 islands/islets in total. This chain separates the Bering Sea (north) from the Pacific Ocean (south) and the islands are connected by the Marine Highway Ferry – at least as far as Unalaska. For the most remote islands, such as birding paradise of Attu, the western-most Aleutian Island, travel becomes trickier and relies primarily on custom charter. The Moderate Resolution Imaging Spectroradiometer (MODIS) flew over the region and captured this spectacular true-color image of the eastern Aleutian Islands on May 15, 2014. In this image, the Alaskan Peninsula protrudes from the mainland and sweeps to the southwest. The first set of islands are called the Fox Island group. Unalaska Island is part of this group and can be identified, with some imagination, as an island formed in the shape of a flying cherub, with two arms (peninsulas) outstretched towards the northeast, seemingly reaching for the round “balls” of Akutan and Akun Islands. The smallest islands in the west of the image belong to the group known as the Islands of Four Mountains. The Aleutians continue far to the west of this image. Fog surrounds the Aleutians, stretching from just off the southwestern Alaska mainland to the western Fox Islands group, then further southwest across the Pacific Ocean. It appears to give way to marine stratocumulus clouds in the west. Fog is common in the area, and can be a hazard to shipping. Credit: NASA/GSFC/Jeff Schmaltz/MODIS Land Rapid Response Team <b><a href="http://www.nasa.gov/audience/formedia/features/MP_Photo_Guidelines.html" rel="nofollow">NASA image use policy.</a></b> <b><a href="http://www.nasa.gov/centers/goddard/home/index.html" rel="nofollow">NASA Goddard Space Flight Center</a></b> enables NASA’s mission through four scientific endeavors: Earth Science, Heliophysics, Solar System Exploration, and Astrophysics. Goddard plays a leading role in NASA’s accomplishments by contributing compelling scientific knowledge to advance the Agency’s mission. <b>Follow us on <a href="http://twitter.com/NASAGoddardPix" rel="nofollow">Twitter</a></b> <b>Like us on <a href="http://www.facebook.com/pages/Greenbelt-MD/NASA-Goddard/395013845897?ref=tsd" rel="nofollow">Facebook</a></b> <b>Find us on <a href="http://instagram.com/nasagoddard?vm=grid" rel="nofollow">Instagram</a></b>

NOAA's GOES-East satellite provided a look at the frigid eastern two-thirds of the U.S. on Jan. 7, 2015, that shows a blanket of northern snow, lake-effect snow from the Great Lakes and clouds behind the Arctic cold front. A visible picture captured at 1600 UTC (11 a.m. EST) showed the effects of the latest Arctic outbreak. The cold front that brought the Arctic air has moved as far south as Florida, and stretches back over the Gulf of Mexico and just west of Texas today. The image shows clouds behind the frontal boundary stretching from the Carolinas west over the Heartland. Farther north, a wide band of fallen snow covers the ground from New England west to Montana, with rivers appearing like veins. The GOES-East satellite image also shows wind-whipped lake-effect snows off the Great Lakes, blowing to the southeast. Meanwhile, Florida, the nation's warm spot appeared almost cloud-free. To create the image, NASA/NOAA's GOES Project used cloud data from NOAA's GOES-East satellite and overlaid it on a true-color image of land and ocean created by data from the Moderate Resolution Imaging Spectroradiometer, or MODIS, instrument that flies aboard NASA's Aqua and Terra satellites. Together, those data created the entire picture of the Arctic outbreak. The forecast from NOAA's National Weather Service Weather Prediction Center (WPC) calls for more snow along the Appalachian Mountains from Tennessee north to upstate New York. Snow is also expected to fall from New England west to Montana, and in eastern New Mexico and the Colorado Rockies. The WPC summary for Jan. 7 noted: Bitter cold will be felt from the western High Plains to the Mid-Atlantic and Northeast U.S. for the next few days. Widespread subzero overnight lows are forecast for the Dakotas, Upper Midwest, Great Lakes, and interior New England. Wind Chill Advisories and Warnings are in effect for many of these areas. GOES-East provides visible and infrared images over the eastern U.S. and the Atlantic Ocean from its fixed orbit in space. NOAA's GOES satellites provide the kind of continuous monitoring necessary for intensive data analysis. Geostationary describes an orbit in which a satellite is always in the same position with respect to the rotating Earth. This allows GOES to hover continuously over one position on Earth's surface, appearing stationary. As a result, GOES provide a constant vigil for the atmospheric triggers for severe weather conditions such as tornadoes, flash floods, hail storms and hurricanes. For updated information about the storm system, visit NOAA's NWS website: <a href="http://www.weather.gov" rel="nofollow">www.weather.gov</a> For more information about GOES satellites, visit: <a href="http://www.goes.noaa.gov/" rel="nofollow">www.goes.noaa.gov/</a> or goes.gsfc.nasa.gov/ Rob Gutro NASA's Goddard Space Flight Center, Greenbelt, Md. <b><a href="http://www.nasa.gov/audience/formedia/features/MP_Photo_Guidelines.html" rel="nofollow">NASA image use policy.</a></b> <b><a href="http://www.nasa.gov/centers/goddard/home/index.html" rel="nofollow">NASA Goddard Space Flight Center</a></b> enables NASA’s mission through four scientific endeavors: Earth Science, Heliophysics, Solar System Exploration, and Astrophysics. Goddard plays a leading role in NASA’s accomplishments by contributing compelling scientific knowledge to advance the Agency’s mission. <b>Follow us on <a href="http://twitter.com/NASAGoddardPix" rel="nofollow">Twitter</a></b> <b>Like us on <a href="http://www.facebook.com/pages/Greenbelt-MD/NASA-Goddard/395013845897?ref=tsd" rel="nofollow">Facebook</a></b> <b>Find us on <a href="http://instagram.com/nasagoddard?vm=grid" rel="nofollow">Instagram</a></b>
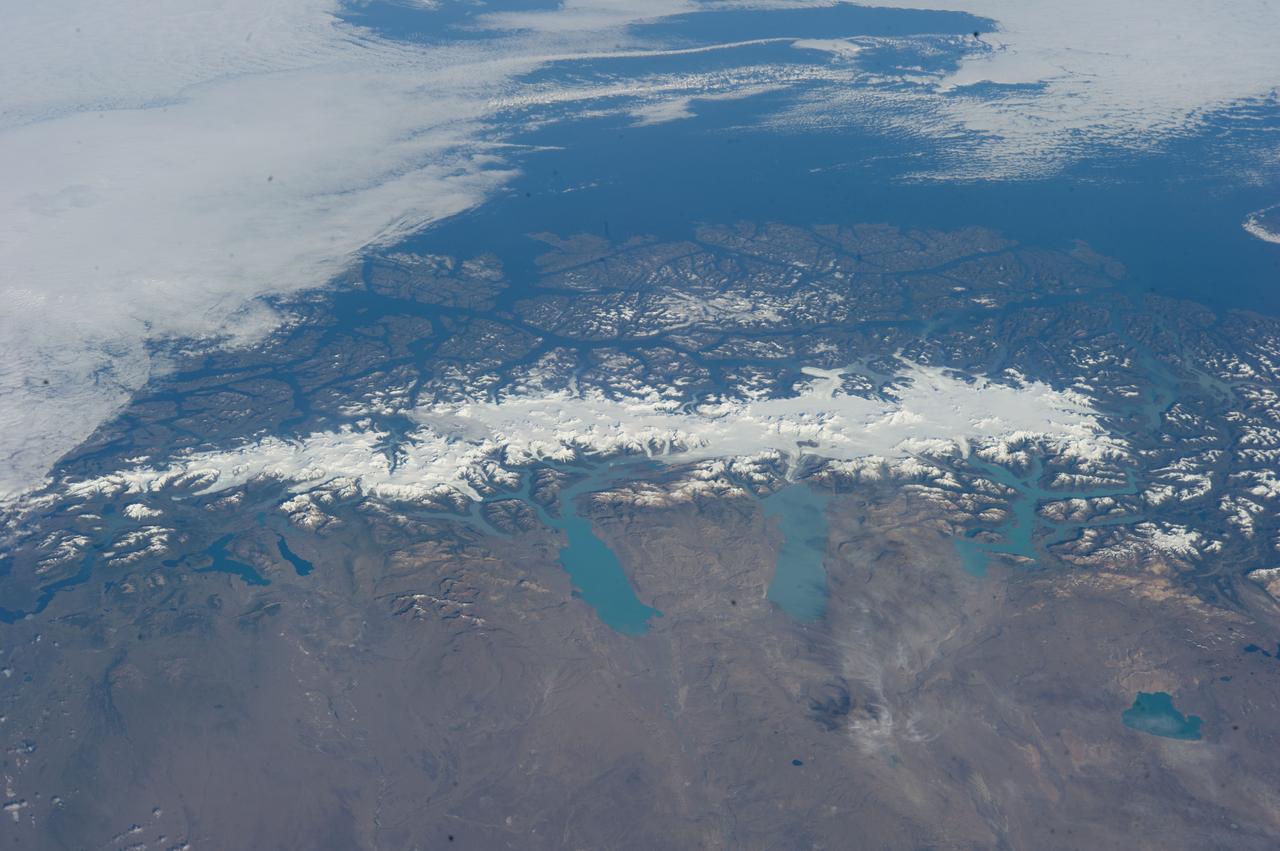
ISS038-E-047324 (13 Feb. 2014) --- This grand panorama of the Southern Patagonia Icefield (center) was imaged by an Expedition 38 crew member on the International Space Station on one of the rare clear days in the southern Andes Mountains. With an area of 13,000 square kilometers, the icefield is the largest temperate ice sheet in the Southern Hemisphere. Storms that swirl into the region from the southern Pacific Ocean (top) bring rain and snow (equivalent to a total of 2-11 meters of rainfall per year) resulting in the buildup of the ice sheet shown here (center). During the ice ages the glaciers were far larger. Geologists now know that ice tongues extended far onto the plains in the foreground, completely filling the great Patagonian lakes on repeated occasions. Similarly, ice tongues extended into the dense network of fjords (arms of the sea) on the Pacific side of the icefield. Ice tongues today appear tiny compared to the view that an "ice age" astronaut would have seen. A study of the surface topography of sixty-three glaciers, based on Shuttle Radar Topography Mission (SRTM) data, compared data from 2000 to data from studies going back about 30 years (1968-1975). Many glacier tongues showed significant annual "retreat" of their ice fronts, a familiar signal of climate change. The study also revealed that the almost invisible loss by glacier thinning is far more significant in explaining ice loss. The researchers concluded that volume loss by frontal collapse is 4-10 times smaller than that caused by thinning. Scaled over the entire icefield, including frontal loss (so-called calving when ice masses collapse into the lakes), it was calculated that 13.5 cubic kilometers of ice was lost each year over the study period. This number becomes more meaningful compared with the rate measured in the last five years of the study (1995-2000), when the rate increased almost threefold, averaging 38.7 cubic kilometers per year. Extrapolating results from the low altitude glacier tongues implies that the high plateau ice on the spine of the Andes is thinning as well. In the decade since this study the often-imaged Upsala Glacier has retreated a further three kilometers, as shown recently in images taken by crew members aboard the space station. Glacier Pio X, named for Pope Pius X, is the only large glacier that is growing in length.
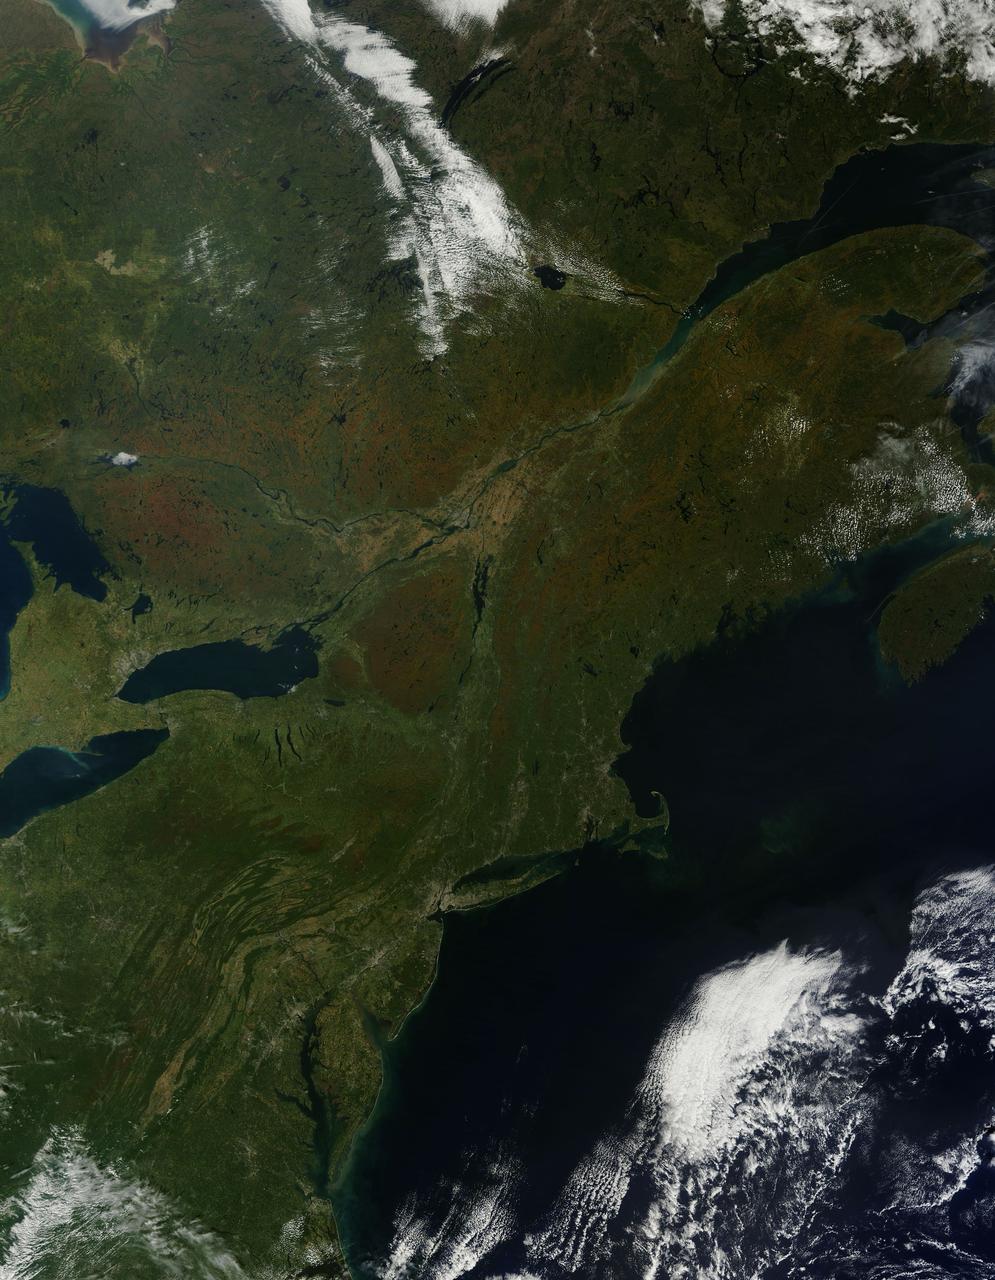
As temperatures dropped and daylight began to shorten, autumn colors began to wash over the deciduous forests of North America. The Moderate Resolution Imaging Spectroradiometer (MODIS) aboard NASA’s Terra satellite captured this true-color image of the northeastern United States and Canada on September 27, 2014. Washes of orange, brown and yellow are brightest in the Upper Peninsula of Michigan, upstate New York, New Hampshire, Vermont, Maine, and southern Quebec and Ontario. Also, faint traces of phytoplankton blooms can be seen in the offshore waters of the Atlantic Ocean. The transition of autumn leaves from green, to glowing with colors, to browning and dropping to the ground, involve several complex interactions and reactions. However, length of sunlight and the temperature changes are dominant factors. Topography also plays a role, as does latitude. Temperature tends to drop faster at higher elevations and at higher latitudes, and day length shortens more quickly at higher latitudes. Color change tends to begin in the north and sweep southward, and change begins at mountain tops then moves into valleys. As explained by the U.S. Forest Service, certain species of trees produce certain colors. Oaks generally turn red, brown, or russet; hickories become golden bronze; aspen and yellow-poplar turn golden. Maples differ by species. Red maple turns brilliant scarlet; sugar maple, orange-red; and black maple, yellow. Leaves of some trees, such as elms, simply become brown. Credit: NASA/GSFC/Jeff Schmaltz/MODIS Land Rapid Response Team <b><a href="http://www.nasa.gov/audience/formedia/features/MP_Photo_Guidelines.html" rel="nofollow">NASA image use policy.</a></b> <b><a href="http://www.nasa.gov/centers/goddard/home/index.html" rel="nofollow">NASA Goddard Space Flight Center</a></b> enables NASA’s mission through four scientific endeavors: Earth Science, Heliophysics, Solar System Exploration, and Astrophysics. Goddard plays a leading role in NASA’s accomplishments by contributing compelling scientific knowledge to advance the Agency’s mission. <b>Follow us on <a href="http://twitter.com/NASAGoddardPix" rel="nofollow">Twitter</a></b> <b>Like us on <a href="http://www.facebook.com/pages/Greenbelt-MD/NASA-Goddard/395013845897?ref=tsd" rel="nofollow">Facebook</a></b> <b>Find us on <a href="http://instagram.com/nasagoddard?vm=grid" rel="nofollow">Instagram</a></b>
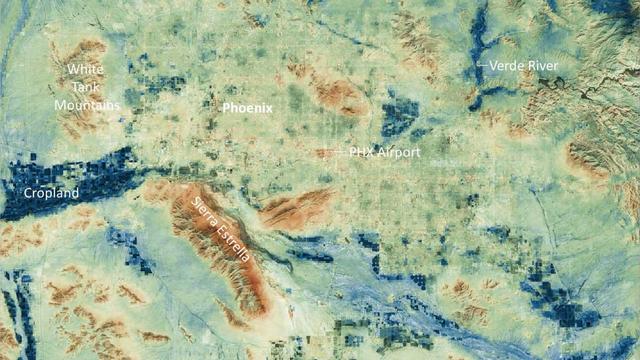
Researchers at NASA's Jet Propulsion Laboratory have created a series of maps showing land-surface temperatures in the Phoenix area in July 2023, when the city experienced a record-breaking run of hot weather. The images reveal the cumulative effect – overnight and across the month – of relentless daytime heating. The data was captured during overnight hours (around 2 a.m.) on several days in July by an instrument called the Visible Infrared Imaging Radiometer Suite (VIIRS) aboard the NOAA-NASA Suomi National Polar-orbiting Partnership (Suomi NPP) satellite managed by the National Oceanic and Atmospheric Administration and NASA. The images show how built surfaces – roads, buildings, airport runways, and the like – retain heat, sometimes hovering around 100 degrees Fahrenheit (38 degrees Celsius) for hours after sunset. From July 1 to July 19, the built surfaces in the maps grew progressively hotter, likely the combined effect of the heat wave intensifying and the cumulative heating of those human-made structures. Due to their high heat capacity, these surfaces didn't fully cool overnight before the onset of the next day's heat. At the center of the images is Phoenix's Sky Harbor International Airport, where VIIRS measured the hottest land-surface temperature within the city. The airport is also where Phoenix takes its official air temperature. By those measurements, the city experienced the hottest month on record in July, including a record 31 consecutive days in which the temperature exceeded 110 degrees Fahrenheit (43.3 degrees Celsius). The previous record was 18 days. Land-surface temperatures in cities are usually warmer than in rural and undeveloped areas because of human activities and the materials used for building. Streets – seen in these maps as a grid pattern – are often the hottest part of the built environment due to dark asphalt paving that absorbs more sunlight than lighter-colored surfaces; asphalt absorbs up to 95% of solar radiation. In the images, the mountains near Phoenix are also notably hot due to their angle to the Sun and greater soil exposure from lack of vegetation. The hot surfaces in and around the city stand in contrast to nearby irrigated surfaces such as agricultural fields, golf courses, and parks, which fell as low as 68 degrees Fahrenheit (18.9 degrees Celsius) during the night. The Verde River and other nearby waterways also were significantly cooler. VIIRS is one of five instruments aboard the NOAA-NASA Suomi NPP satellite. Short for Suomi National Polar-orbiting Partnership, the spacecraft is one of several in the Joint Polar Satellite System. The images were produced from the VNP21IMG Land Surface Temperature product, which is available at NASA's Land, Atmosphere Near-real-time Capability for EOS (LANCE). Animation available at https://photojournal.jpl.nasa.gov/catalog/PIA25868
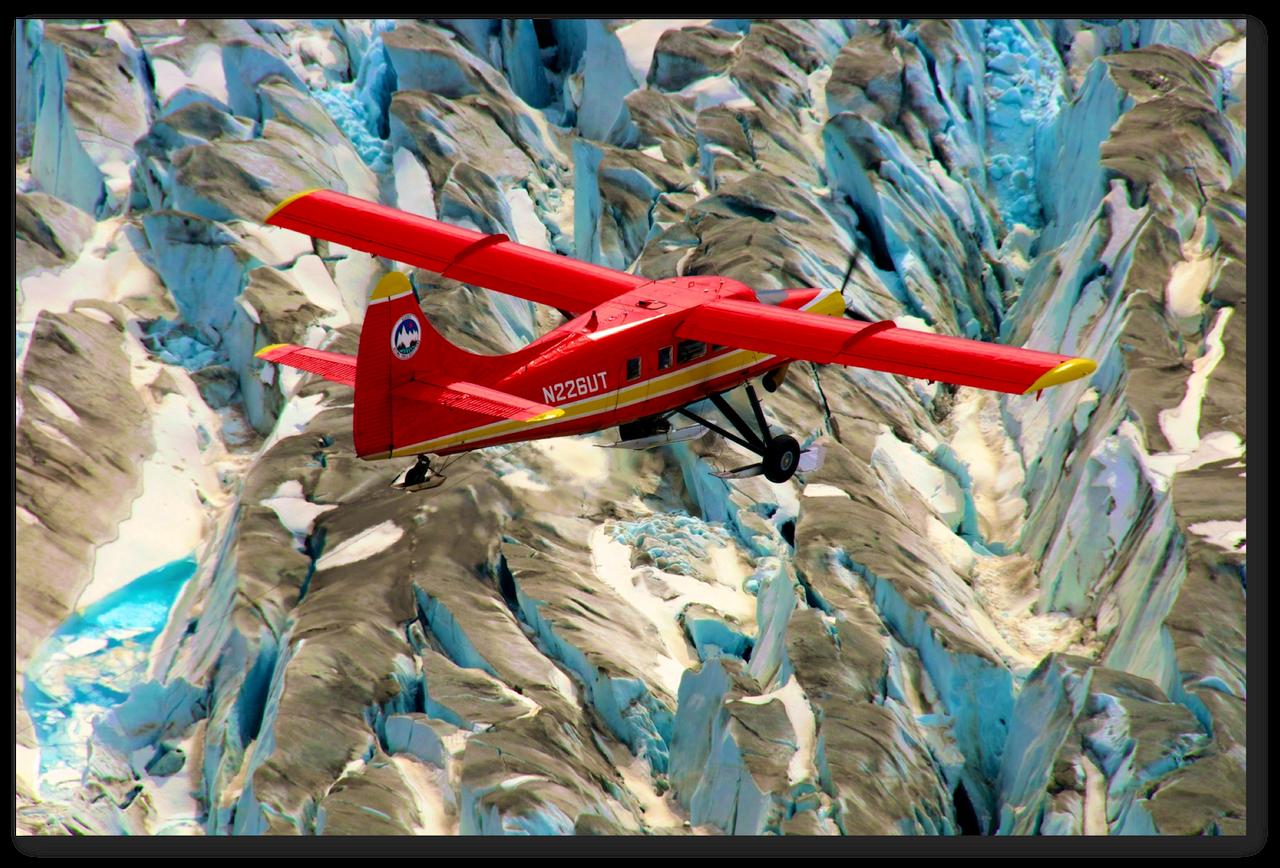
This red plane is a DHC-3 Otter, the plane flown in NASA's Operation IceBridge-Alaska surveys of mountain glaciers in Alaska. Credit: Chris Larsen, University of Alaska-Fairbanks Over the past few decades, average global temperatures have been on the rise, and this warming is happening two to three times faster in the Arctic. As the region’s summer comes to a close, NASA is hard at work studying how rising temperatures are affecting the Arctic. NASA researchers this summer and fall are carrying out three Alaska-based airborne research campaigns aimed at measuring greenhouse gas concentrations near Earth’s surface, monitoring Alaskan glaciers, and collecting data on Arctic sea ice and clouds. Observations from these NASA campaigns will give researchers a better understanding of how the Arctic is responding to rising temperatures. The Arctic Radiation – IceBridge Sea and Ice Experiment, or ARISE, is a new NASA airborne campaign to collect data on thinning sea ice and measure cloud and atmospheric properties in the Arctic. The campaign was designed to address questions about the relationship between retreating sea ice and the Arctic climate. Arctic sea ice reflects sunlight away from Earth, moderating warming in the region. Loss of sea ice means more heat from the sun is absorbed by the ocean surface, adding to Arctic warming. In addition, the larger amount of open water leads to more moisture in the air, which affects the formation of clouds that have their own effect on warming, either enhancing or reducing it. Read more: <a href="http://www.nasa.gov/earthrightnow" rel="nofollow">www.nasa.gov/earthrightnow</a> <b><a href="http://www.nasa.gov/audience/formedia/features/MP_Photo_Guidelines.html" rel="nofollow">NASA image use policy.</a></b> <b><a href="http://www.nasa.gov/centers/goddard/home/index.html" rel="nofollow">NASA Goddard Space Flight Center</a></b> enables NASA’s mission through four scientific endeavors: Earth Science, Heliophysics, Solar System Exploration, and Astrophysics. Goddard plays a leading role in NASA’s accomplishments by contributing compelling scientific knowledge to advance the Agency’s mission. <b>Follow us on <a href="http://twitter.com/NASAGoddardPix" rel="nofollow">Twitter</a></b> <b>Like us on <a href="http://www.facebook.com/pages/Greenbelt-MD/NASA-Goddard/395013845897?ref=tsd" rel="nofollow">Facebook</a></b> <b>Find us on <a href="http://instagram.com/nasagoddard?vm=grid" rel="nofollow">Instagram</a></b>
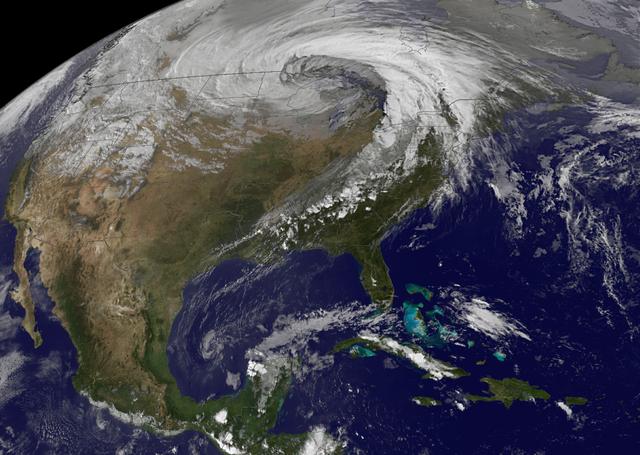
NASA image acquired October 26, 2010 The storm that swept across the center of the United States on October 26 and October 27, 2010, was memorable to those who experienced it because of its strong winds, rain, hail, and widespread tornadoes. Meteorologists get excited about the storm because it set a record for the lowest pressure (not associated with a hurricane) measured over land in the continental United States. At 5:13 p.m. CDT, the weather station in Bigfork, Minnesota recorded 955.2 millibars (28.21 inches of pressure). Pressure is one indicator of a storm’s strength, and this measurement corresponds to the pressure seen in a Category 3 hurricane. This image, taken by the GOES satellite on October 26, shows the storm system circling around the area of extreme low pressure. Such extratropical cyclones form over the United States in the spring and fall, when the temperature difference from north to south is large. Warm, high-pressure air rushes toward the cooler, low-pressure air in the north. Because the Earth is rotating, the air moving in ends up circling the area of low pressure, creating the cyclone shown in the image. The intensity of the storm is determined by the pressure difference between the center and the outer edges. Extreme low pressure in the center of the storm, therefore, is an indicator that the storm was very intense. The animation shows the storm developing starting late on October 25 and running through October 27. The cyclone formed very quickly on October 26, taking a distinctive comma shape as the day went on. The storm developed so quickly, in fact, that it is classified as a bomb, an extremely fast developing storm (dropping at least one millibar of pressure per hour for 24 hours), more common over water than land. The storm was also huge. Though the area of low pressure is centered over the Upper Midwest, the storm reached from the Gulf of Mexico into Canada, and from the Rocky Mountains to the Atlantic Ocean. Extratropical cyclones bring an array of unsettled weather, including strong wind, rain, hail, and tornadoes, and this cyclone brought all of that. On October 26–27, winds gusted up to 78 miles per hour in Michigan, with high winds throughout the Midwest. The National Weather Service reported 61 tornadoes over the two days. Heavy snow also fell in the north. NASA Earth Observatory imagery created by Jesse Allen, using imagery provided courtesy of the NASA GOES Project Science Office. Caption by Holli RIebeek. Instrument: GOES Credit: <b><a href="http://www.earthobservatory.nasa.gov/" rel="nofollow"> NASA Earth Observatory</a></b> <b><a href="http://www.nasa.gov/centers/goddard/home/index.html" rel="nofollow">NASA Goddard Space Flight Center</a></b> enables NASA’s mission through four scientific endeavors: Earth Science, Heliophysics, Solar System Exploration, and Astrophysics. Goddard plays a leading role in NASA’s accomplishments by contributing compelling scientific knowledge to advance the Agency’s mission. <b>Follow us on <a href="http://twitter.com/NASA_GoddardPix" rel="nofollow">Twitter</a></b> <b>Join us on <a href="http://www.facebook.com/pages/Greenbelt-MD/NASA-Goddard/395013845897?ref=tsd" rel="nofollow">Facebook</a></b>
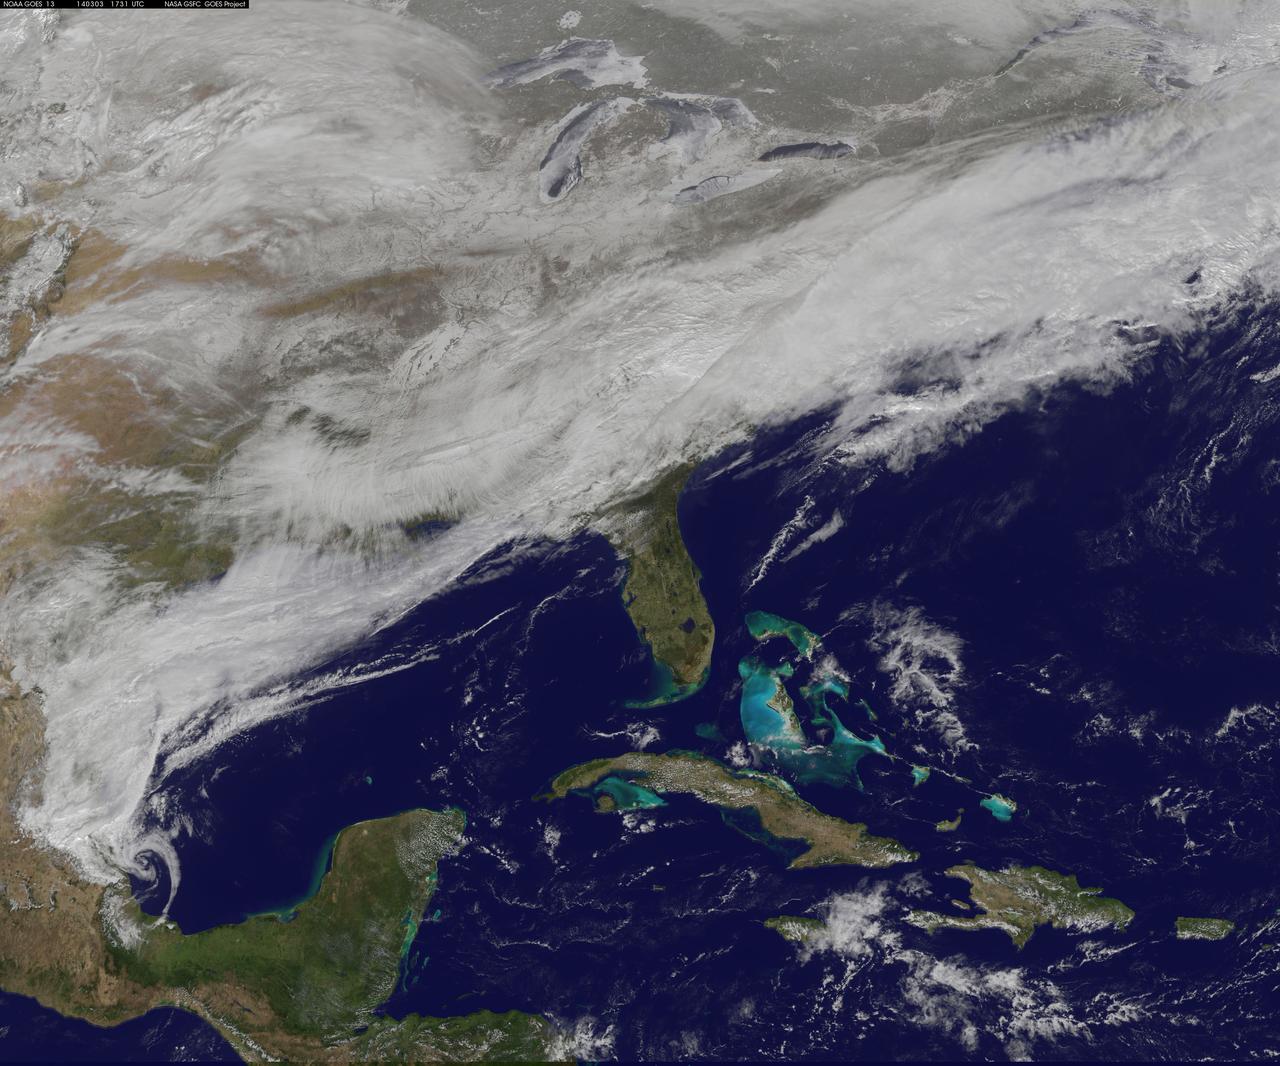
On March 3, a major winter storm brought snow to the mid-Atlantic, freezing rain to the Carolinas and rain and some freezing rain to the Gulf Coast states. NOAA's GOES-East satellite captured an image of the clouds associated with the winter storm on March 3 at 12:45 p.m. EST (1745 UTC)/ as it continued on its march over the mid-Atlantic. Bands of snow and sometimes heavy snow affected the Washington, D.C., region, Delaware and central Virginia, stretching west into West Virginia and eastern Kentucky. Snow also stretched back into the Ohio and Tennessee valleys while rain and freezing rain affected the Carolinas, and while the Gulf Coast states received rain. National Weather Service Winter Storm Warnings remained in effect until 6 p.m. EST on March 3 for Washington, D.C., and Baltimore, Md. In Richmond and Norfolk, Va., the Winter Storm warnings were in effect for six additional hours ending at midnight. On March 3, NOAA's National Weather Prediction Center in College Park, Md., noted the late-season winter storm will continue to shift eastward through the Tennessee Valley and the mid-Atlantic today, making for hazardous travel conditions. NOAA noted that unseasonably cold temperatures more typical of January will prevail east of the Rocky Mountains for the next few days keeping winter around for a while longer. The clouds are associated with a cold front that stretched from eastern Maine through Maryland and west into the Tennessee Valley. At NASA/NOAA's GOES Project at NASA's Goddard Space Flight Center in Greenbelt, Md., the cloud data from NOAA's GOES-East satellite were overlaid on a true-color image of land and ocean created by data from the Moderate Resolution Imaging Spectroradiometer, or MODIS, instrument that flies aboard NASA's Aqua and Terra satellites. Together, those data created the entire picture of the position of this major winter storm. GOES satellites provide the kind of continuous monitoring necessary for intensive data analysis. Geostationary describes an orbit in which a satellite is always in the same position with respect to the rotating Earth. This allows GOES to hover continuously over one position on Earth's surface, appearing stationary. As a result, GOES provide a constant vigil for the atmospheric "triggers" for severe weather conditions such as tornadoes, flash floods, hail storms and hurricanes. For updated information about the storm system, visit NOAA's NWS website: <a href="http://www.weather.gov" rel="nofollow">www.weather.gov</a> For more information about GOES satellites, visit: <a href="http://www.goes.noaa.gov/" rel="nofollow">www.goes.noaa.gov/</a> or goes.gsfc.nasa.gov/ Rob Gutro NASA's Goddard Space Flight Center, Greenbelt, Md. <b><a href="http://www.nasa.gov/audience/formedia/features/MP_Photo_Guidelines.html" rel="nofollow">NASA image use policy.</a></b> <b><a href="http://www.nasa.gov/centers/goddard/home/index.html" rel="nofollow">NASA Goddard Space Flight Center</a></b> enables NASA’s mission through four scientific endeavors: Earth Science, Heliophysics, Solar System Exploration, and Astrophysics. Goddard plays a leading role in NASA’s accomplishments by contributing compelling scientific knowledge to advance the Agency’s mission. <b>Follow us on <a href="http://twitter.com/NASAGoddardPix" rel="nofollow">Twitter</a></b> <b>Like us on <a href="http://www.facebook.com/pages/Greenbelt-MD/NASA-Goddard/395013845897?ref=tsd" rel="nofollow">Facebook</a></b> <b>Find us on <a href="http://instagram.com/nasagoddard?vm=grid" rel="nofollow">Instagram</a></b>
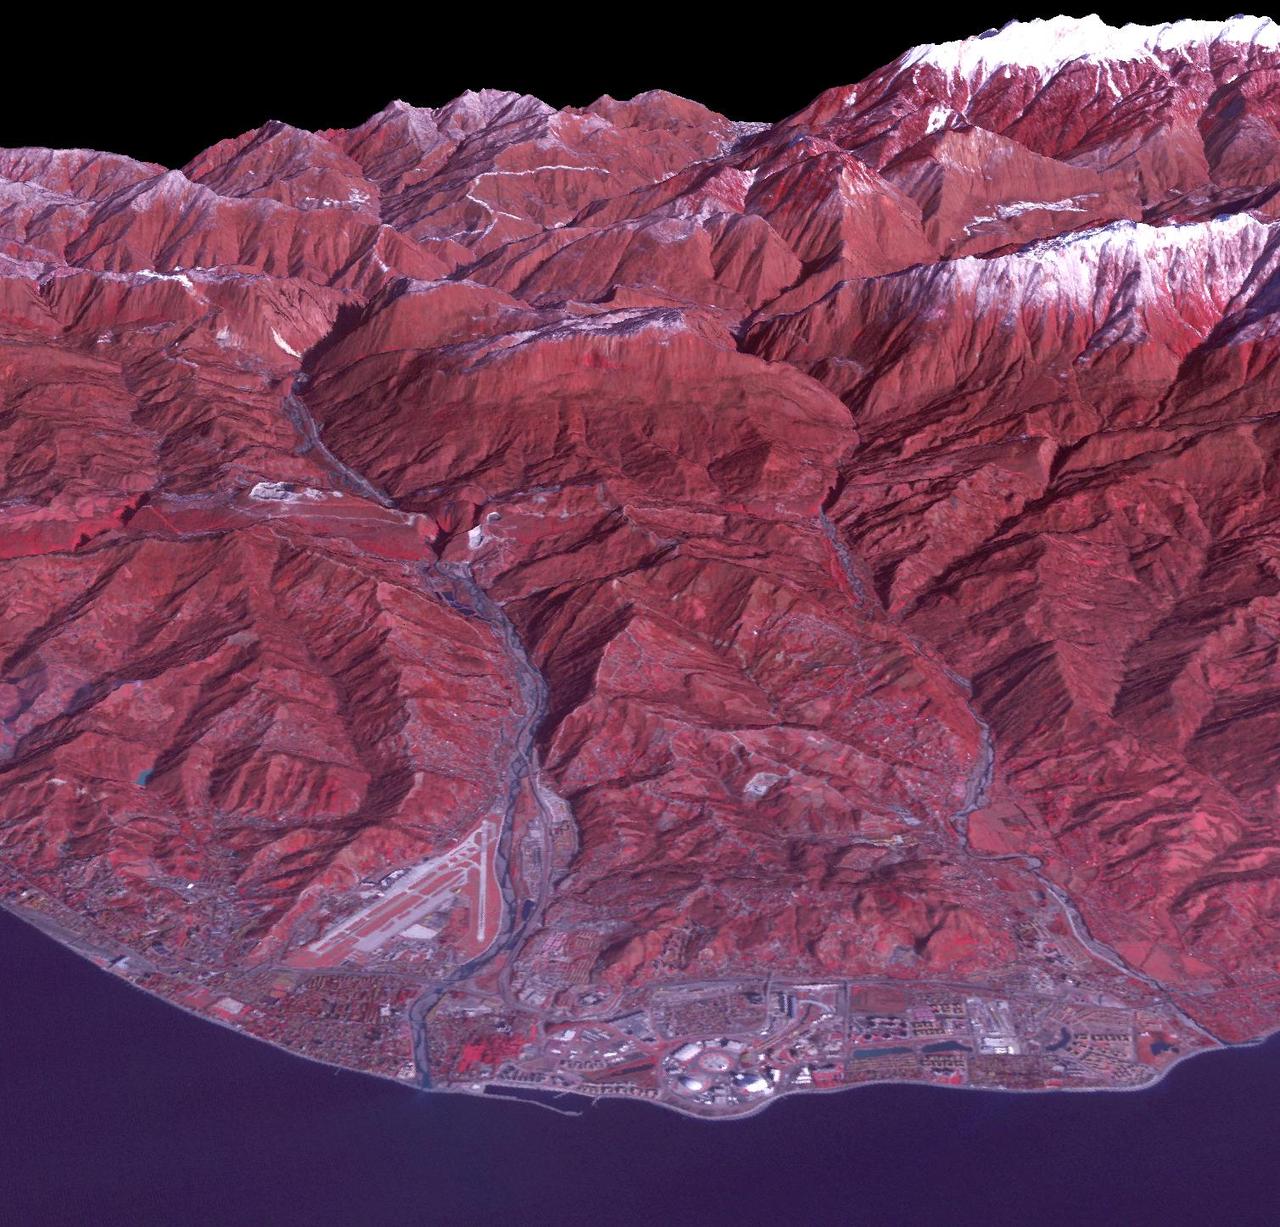
Sochi, Russia Winter Olympic Sites (Coastal Cluster) The Black Sea resort of Sochi, Russia, is the warmest city ever to host the Winter Olympic Games, which open on Feb. 7, 2014, and run through Feb. 23. This north-looking image, acquired on Jan. 4, 2014, by the Advanced Spaceborne Thermal Emission and Reflection Radiometer (ASTER) instrument on NASA's Terra spacecraft, shows the Sochi Olympic Park Coastal Cluster -- the circular area on the shoreline in the bottom center of the image -- which was built for Olympic indoor sports. Even curling has its own arena alongside multiple arenas for hockey and skating. The Olympic alpine events will take place at the Mountain Cluster, located in a snow-capped valley at the top right of the image. Sochi itself, a city of about 400,000, is not visible in the picture. It's farther west (left) along the coast, past the airport at bottom left. In the image, red indicates vegetation, white is snow, buildings are gray and the ocean is dark blue. The area imaged is about 15 miles (24 kilometers) from west to east (left to right) at the coastline and 25 miles (41 kilometers) from front to back. Height is exaggerated 1.5 times. The image was created from the ASTER visible and near-infrared bands, draped over ASTER-derived digital elevation data. With its 14 spectral bands from the visible to the thermal infrared wavelength region and its high spatial resolution of 15 to 90 meters (about 50 to 300 feet), ASTER images Earth to map and monitor the changing surface of our planet. ASTER is one of five Earth-observing instruments launched Dec. 18, 1999, on Terra. The instrument was built by Japan's Ministry of Economy, Trade and Industry. A joint U.S./Japan science team is responsible for validation and calibration of the instrument and data products. The broad spectral coverage and high spectral resolution of ASTER provides scientists in numerous disciplines with critical information for surface mapping and monitoring of dynamic conditions and temporal change. Example applications are: monitoring glacial advances and retreats; monitoring potentially active volcanoes; identifying crop stress; determining cloud morphology and physical properties; wetlands evaluation; thermal pollution monitoring; coral reef degradation; surface temperature mapping of soils and geology; and measuring surface heat balance. The U.S. science team is located at NASA's Jet Propulsion Laboratory, Pasadena, Calif. The Terra mission is part of NASA's Science Mission Directorate, Washington, D.C. More information about ASTER is available at <a href="http://asterweb.jpl.nasa.gov/" rel="nofollow">asterweb.jpl.nasa.gov/</a>. Image credit: NASA/GSFC/METI/ERSDAC/JAROS, and U.S./Japan ASTER Science Team <b><a href="http://www.nasa.gov/audience/formedia/features/MP_Photo_Guidelines.html" rel="nofollow">NASA image use policy.</a></b> <b><a href="http://www.nasa.gov/centers/goddard/home/index.html" rel="nofollow">NASA Goddard Space Flight Center</a></b> enables NASA’s mission through four scientific endeavors: Earth Science, Heliophysics, Solar System Exploration, and Astrophysics. Goddard plays a leading role in NASA’s accomplishments by contributing compelling scientific knowledge to advance the Agency’s mission. <b>Follow us on <a href="http://twitter.com/NASAGoddardPix" rel="nofollow">Twitter</a></b> <b>Like us on <a href="http://www.facebook.com/pages/Greenbelt-MD/NASA-Goddard/395013845897?ref=tsd" rel="nofollow">Facebook</a></b> <b>Find us on <a href="http://instagram.com/nasagoddard?vm=grid" rel="nofollow">Instagram</a></b>