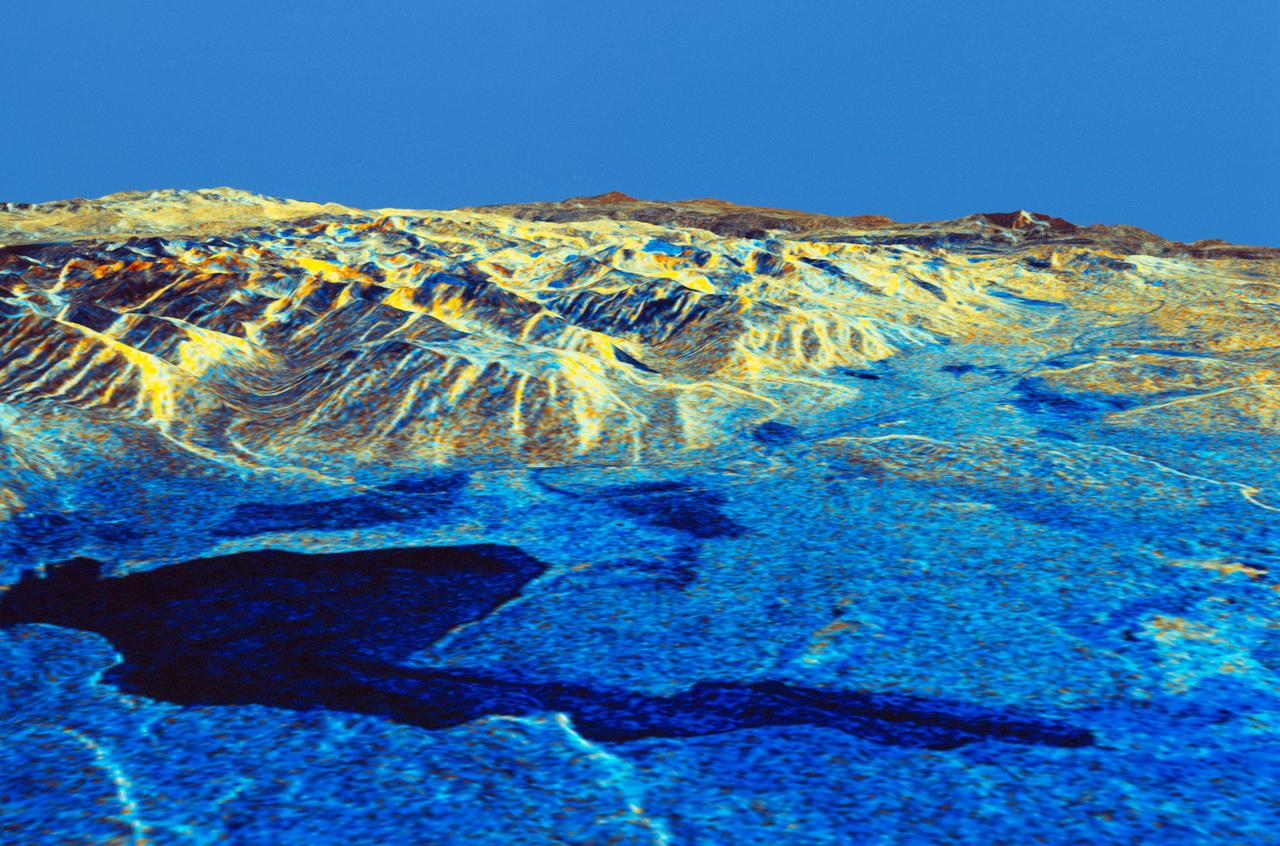
STS059-S-084 (17 April 1994) --- This is a three-dimensional perspective of Mammoth Mountain, California. This view was constructed by overlaying a SIR-C radar image on a U.S. Geological Survey digital elevation map. Vertical exaggeration is 2x. The image is centered at 37.6 degrees north, 119.0 degrees west. It was acquired from the Spaceborne Imaging Radar-C and X-Band Synthetic Aperture Radar (SIR-C/X-SAR) onboard the Space Shuttle Endeavour on its 67th orbit, April 13, 1994. In this color representation, red is C-Band HV-polarization, green is C-Band VV-polarization and blue is the ratio of C-Band VV to C-Band HV. Blue areas are smooth and yellow areas are rock outcrops with varying amounts of snow and vegetation. Crowley Lake is in the foreground and Highway 395 crosses in the middle of the image. Mammoth Mountain is shown in the upper right. SIR-C/X-SAR is part of NASA's Mission to Planet Earth (MTPE). SIR-C/X-SAR radars illuminate Earth with microwaves allowing detailed observations at any time, regardless of weather or sunlight conditions. SIR-C/X-SAR uses three microwave wavelengths: L-Band (24 cm), C-Band (6 cm), and X-Band (3 cm). The multi-frequency data will be used by the international scientific community to better understand the global environment and how it is changing. The SIR-C/X-SAR data, complemented by aircraft and ground studies, will give scientists clearer insights into those environmental changes which are caused by nature and those changes which are induced by human activity. SIR-C was developed by NASA's Jet Propulsion Laboratory (JPL). X-SAR was developed by the Dornire and Alenia Spazio Companies for the German Space Agency, Deutsche Agentur fuer Raumfahrtangelegenheiten (DARA), and the Italian Space Agency, Agenzia Spaziale Italiana (ASI). JPL Photo ID: P-43933
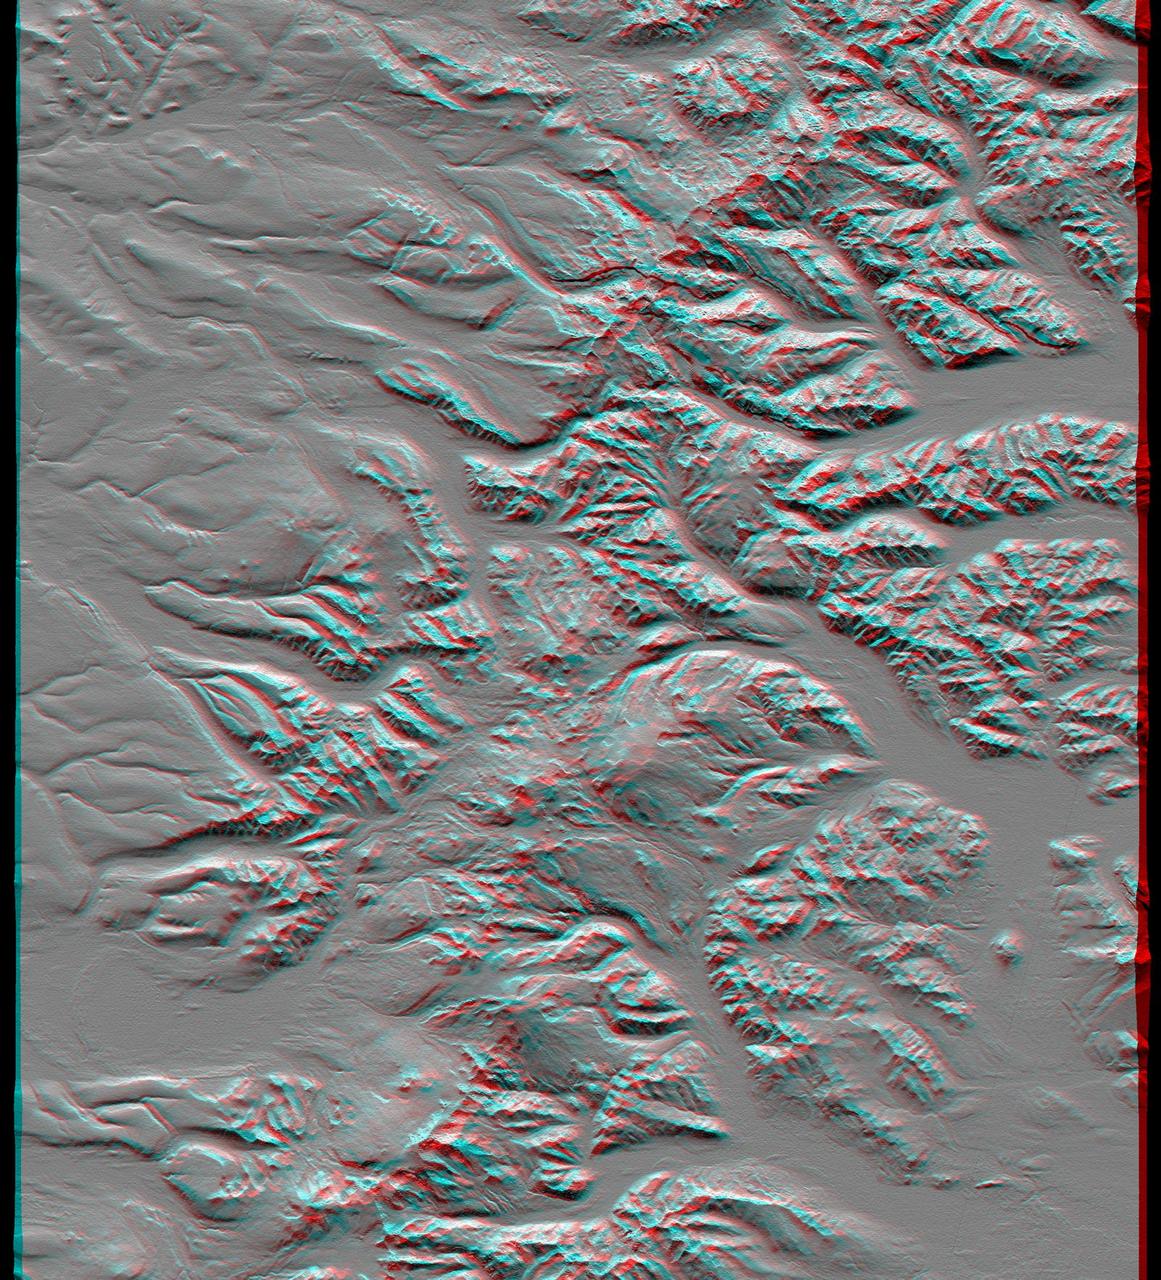
This anaglyph, from NASA Shuttle Radar Topography Mission, is of the Andes Mountains, southeast of San Carlos de Bariloche, Argentina. 3D glasses are necessary to view this image.
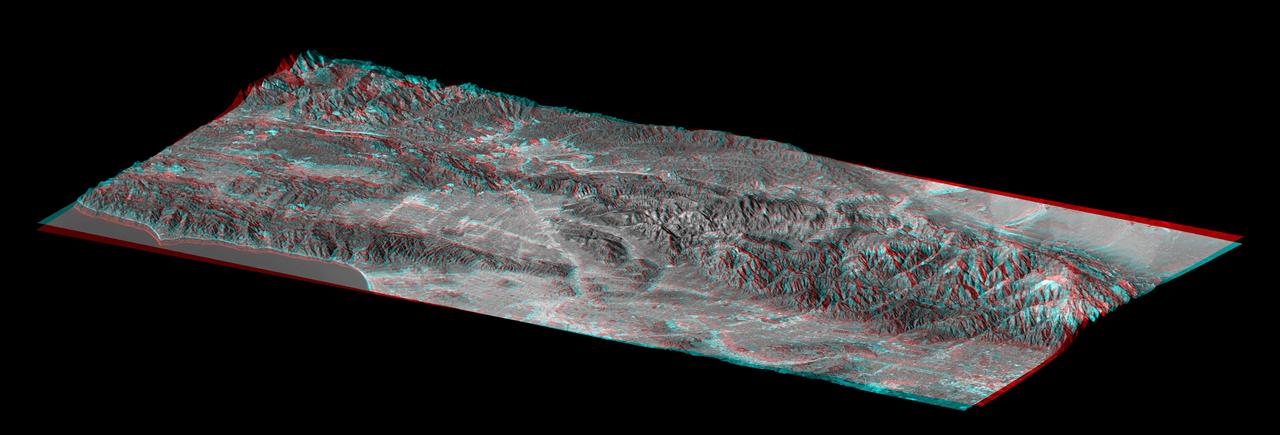
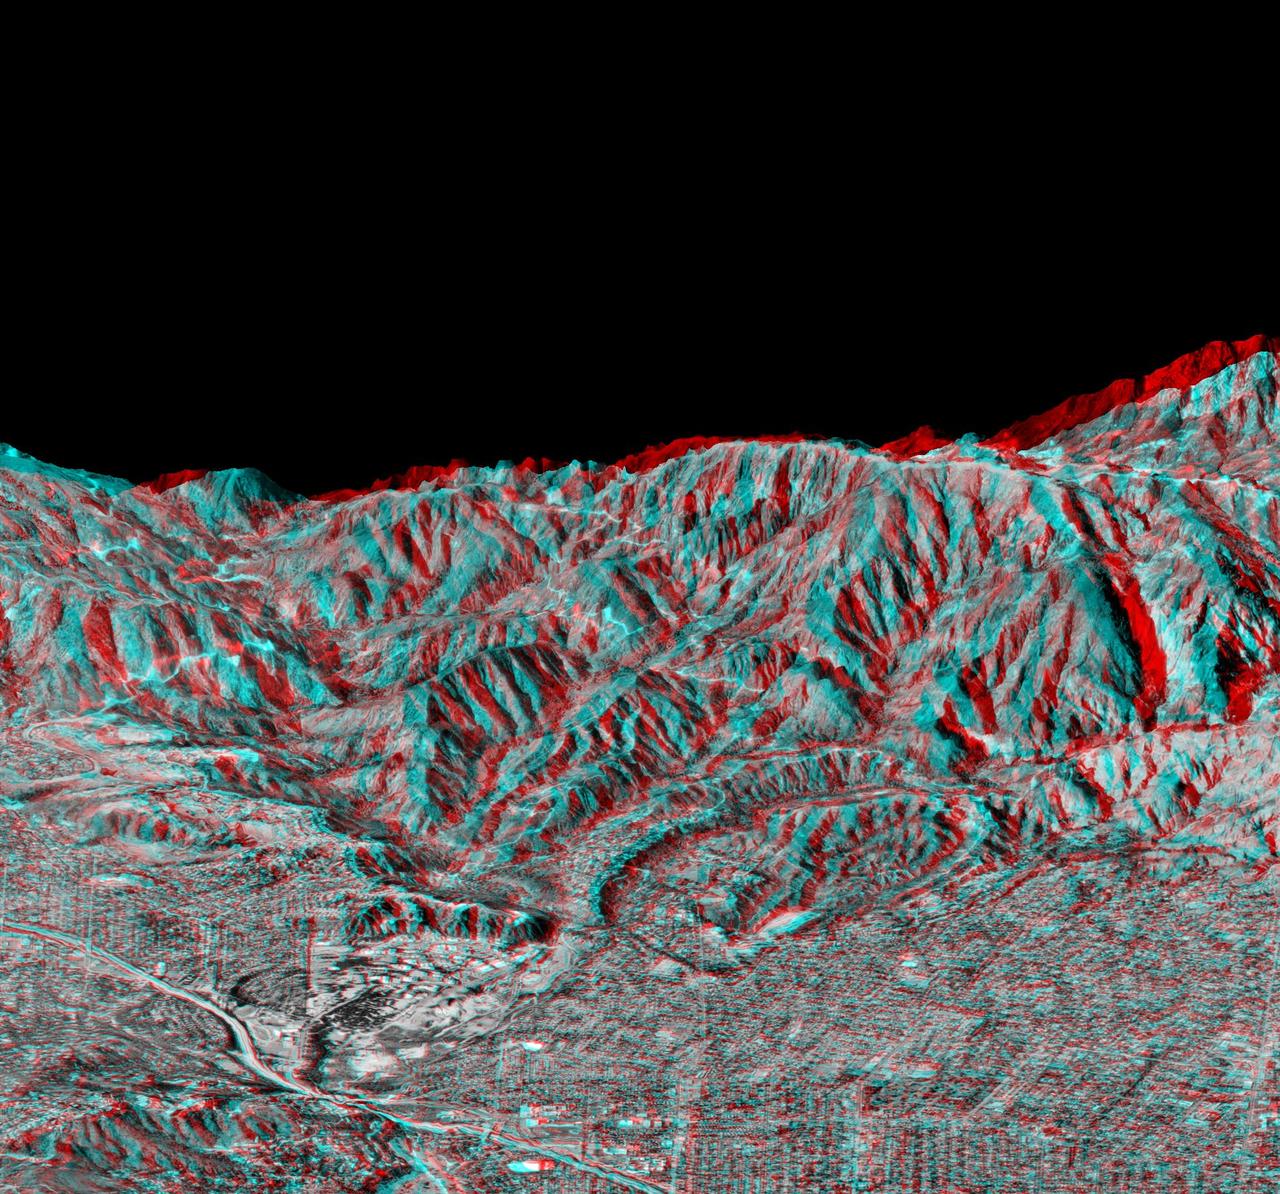
This elevation anaglyph of Los Angeles and adjacent mountainous terrain was created by NASA Shuttle Radar Topography Mission. 3D glasses are necessary to view this image.
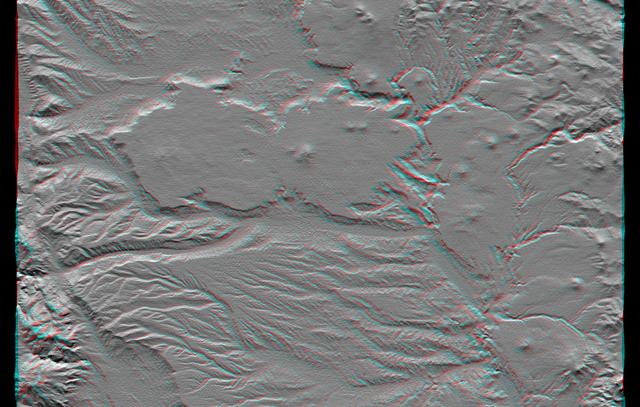
This anaglyph, from NASA Shuttle Radar Topography Mission, is of Massanutten Mountain in the Shenandoah Valley of northern Virginia. 3D glasses are necessary to view this image.
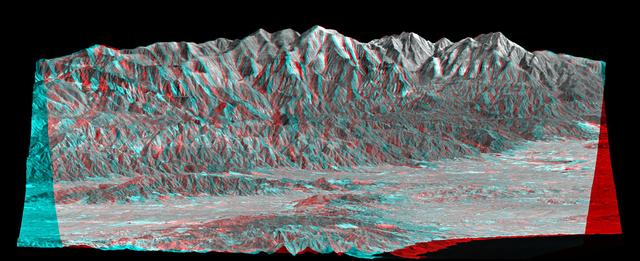
This anaglyph, from NASA Shuttle Radar Topography Mission, is of Pasadena, California, looking north toward the San Gabriel Mountains. 3D glasses are necessary to view this image.
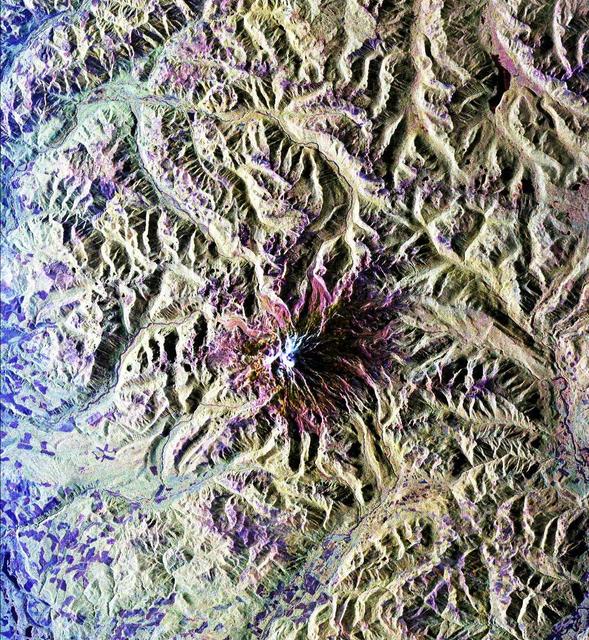
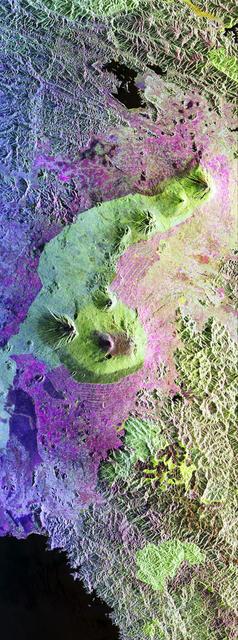
This false-color composite radar image of the Mammoth Mountain area in the Sierra Nevada Mountains, California, was acquired by the Spaceborne Imaging Radar-C and X-band Synthetic Aperture Radar aboard the space shuttle Endeavour on its 67th orbit on October 3, 1994. The image is centered at 37.6 degrees north latitude and 119.0 degrees west longitude. The area is about 39 kilometers by 51 kilometers (24 miles by 31 miles). North is toward the bottom, about 45 degrees to the right. In this image, red was created using L-band (horizontally transmitted/vertically received) polarization data; green was created using C-band (horizontally transmitted/vertically received) polarization data; and blue was created using C-band (horizontally transmitted and received) polarization data. Crawley Lake appears dark at the center left of the image, just above or south of Long Valley. The Mammoth Mountain ski area is visible at the top right of the scene. The red areas correspond to forests, the dark blue areas are bare surfaces and the green areas are short vegetation, mainly brush. The purple areas at the higher elevations in the upper part of the scene are discontinuous patches of snow cover from a September 28 storm. New, very thin snow was falling before and during the second space shuttle pass. In parallel with the operational SIR-C data processing, an experimental effort is being conducted to test SAR data processing using the Jet Propulsion Laboratory's massively parallel supercomputing facility, centered around the Cray Research T3D. These experiments will assess the abilities of large supercomputers to produce high throughput Synthetic Aperture Radar processing in preparation for upcoming data-intensive SAR missions. The image released here was produced as part of this experimental effort. http://photojournal.jpl.nasa.gov/catalog/PIA01746
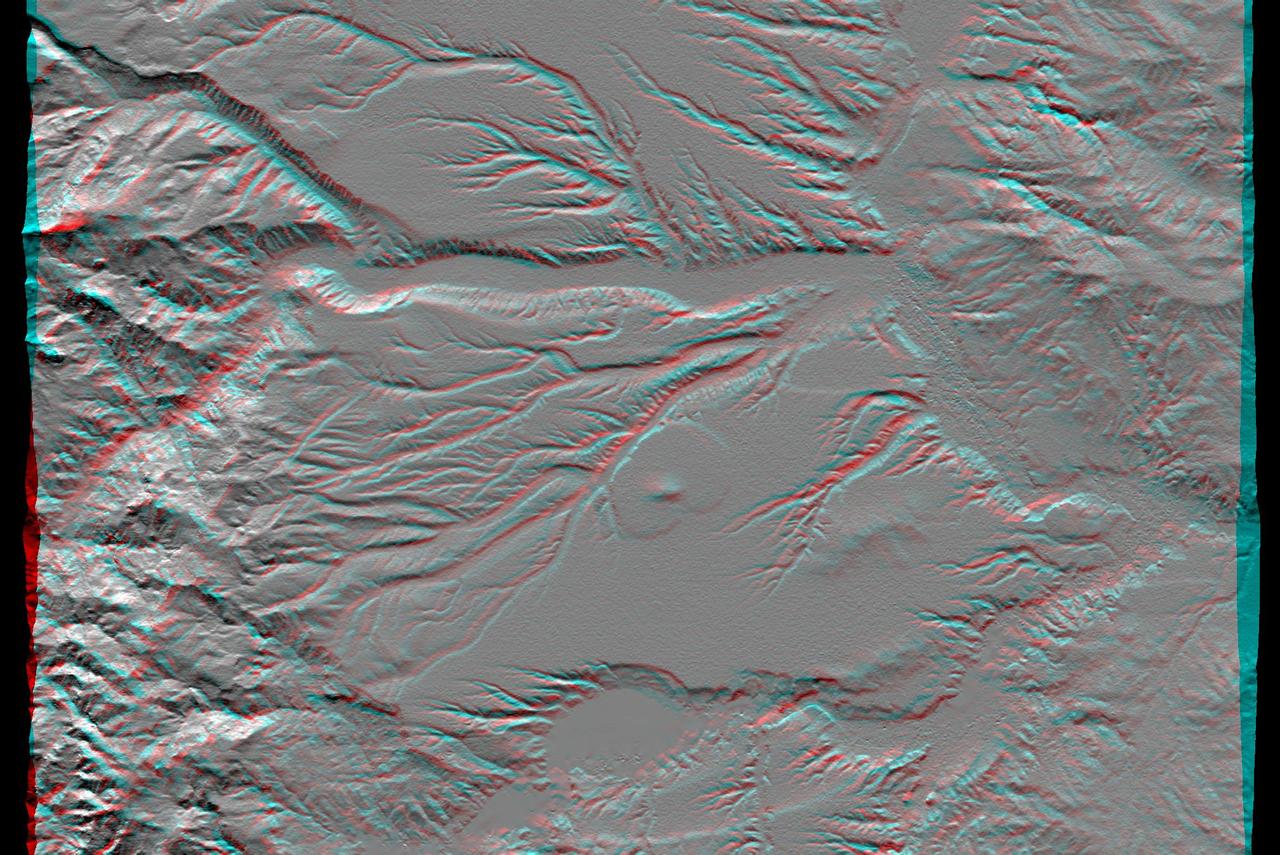
This anaglyph, from NASA Shuttle Radar Topography Mission, shows the eastern flank of the Andes Mountains, southeast of San Martin de Los Andes, Argentina. 3D glasses are necessary to view this image.
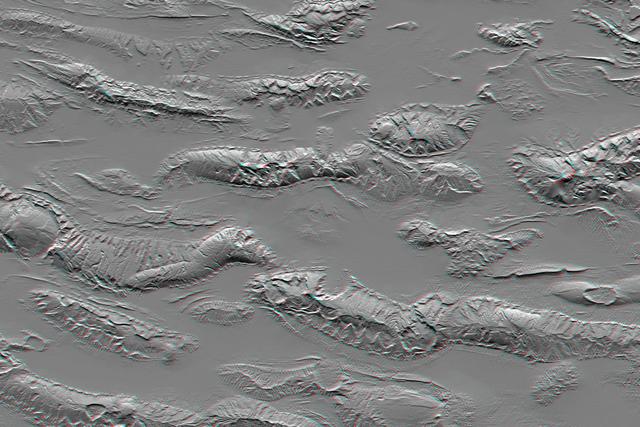
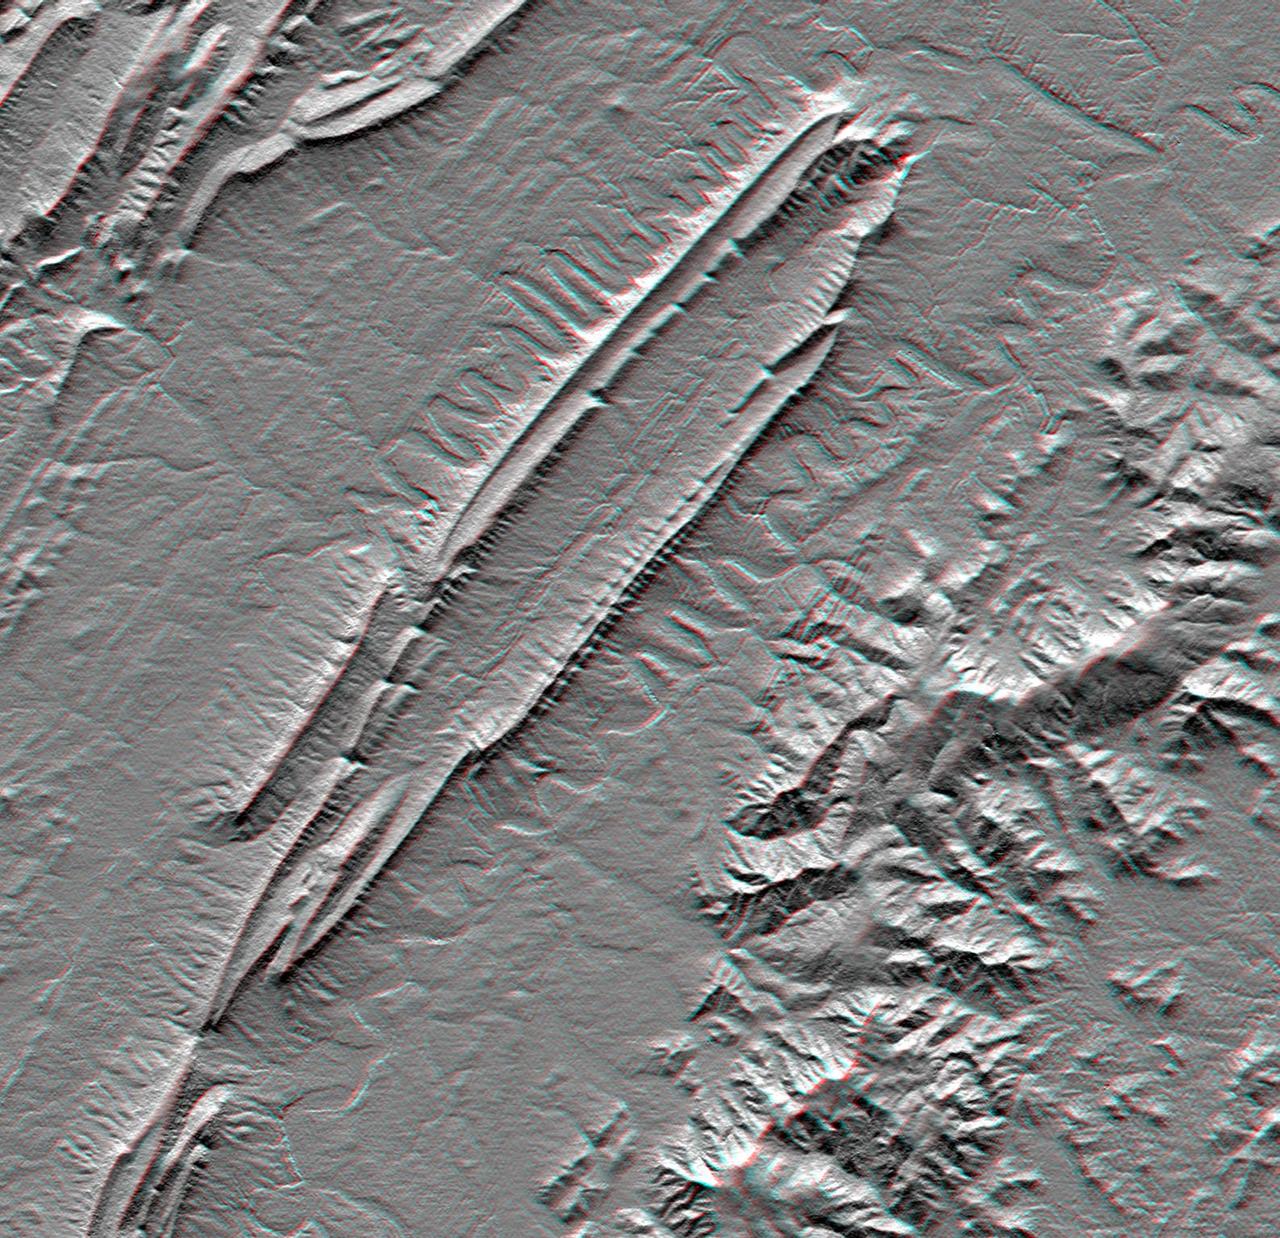
The Zagros Mountains in Iran offer a visually stunning topographic display of geologic structure in layered sedimentary rocks in this anaglyph from NASA Shuttle Radar Topography Mission. 3D glasses are necessary to view this image.
This anaglyph, from NASA Shuttle Radar Topography Mission, shows the Kamchatka Peninsula in eastern Russia. Sredinnyy Khrebet, the mountain range that makes up the spine of the peninsula. 3D glasses are necessary to view this image.
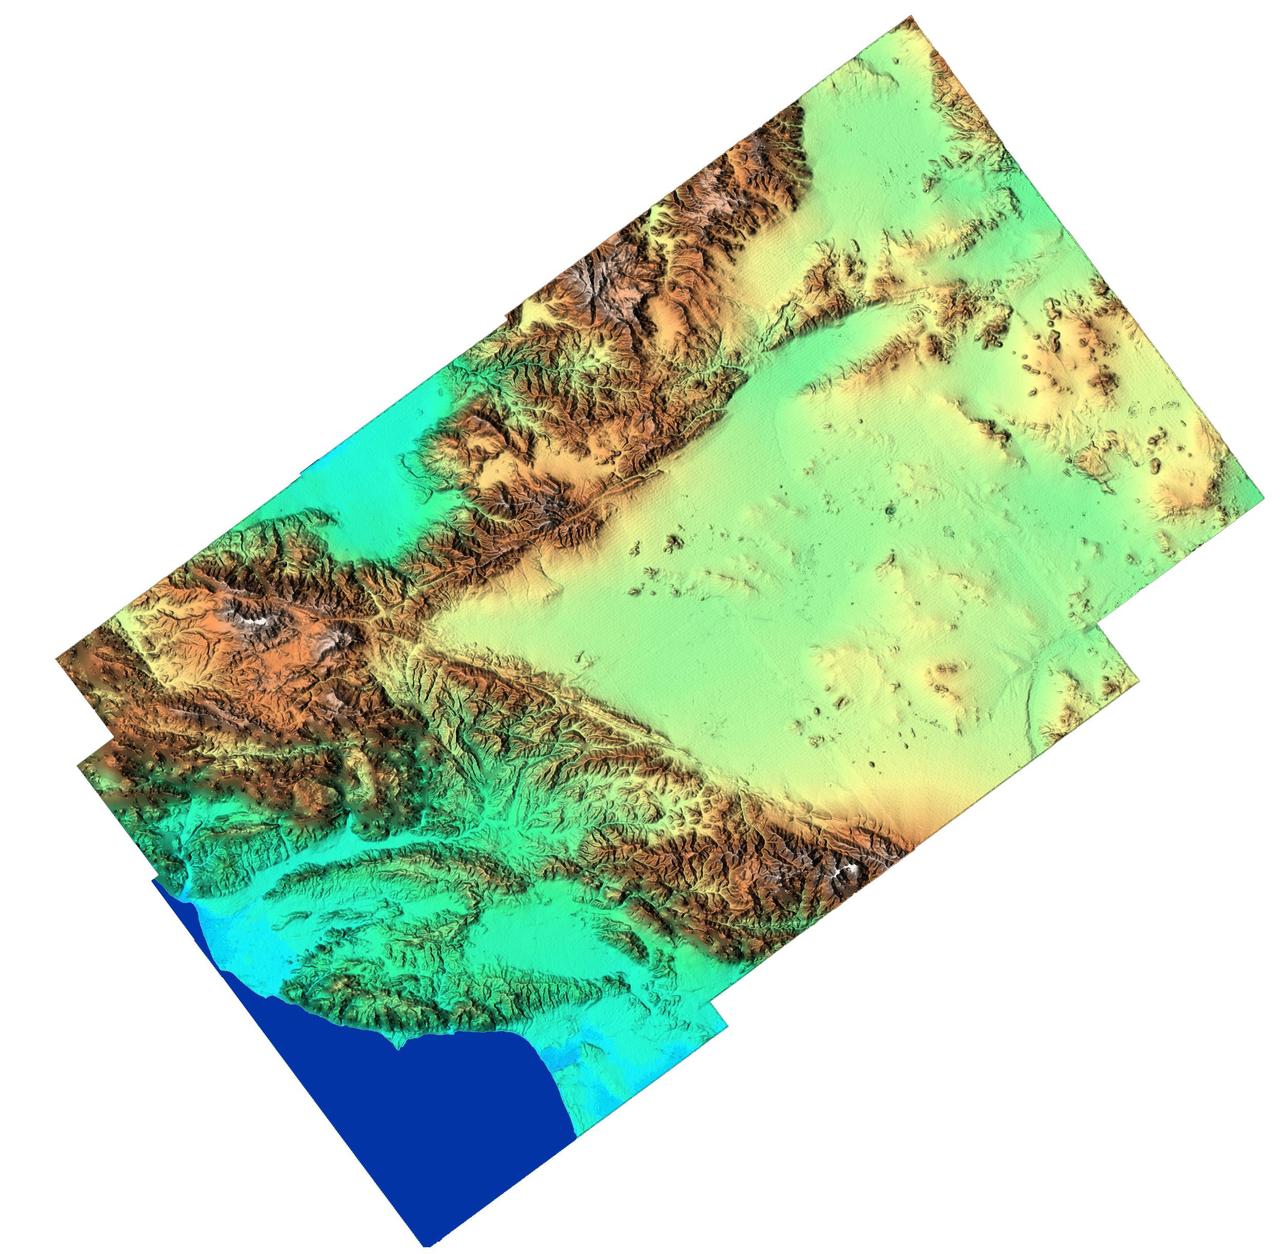
From the desert to the mountains to the sea, this image acquired by NASA Shuttle Radar Topography Mission SRTM in Feb. 2000, shows in striking detail the varied topography of Southern California.
Mount San Antonio more commonly known as Mount Baldy crowns the San Gabriel Mountains northeast of Los Angeles, Calif., in this anaglyph from NASA Shuttle Radar Topography Mission. 3D glasses are necessary to view this image.
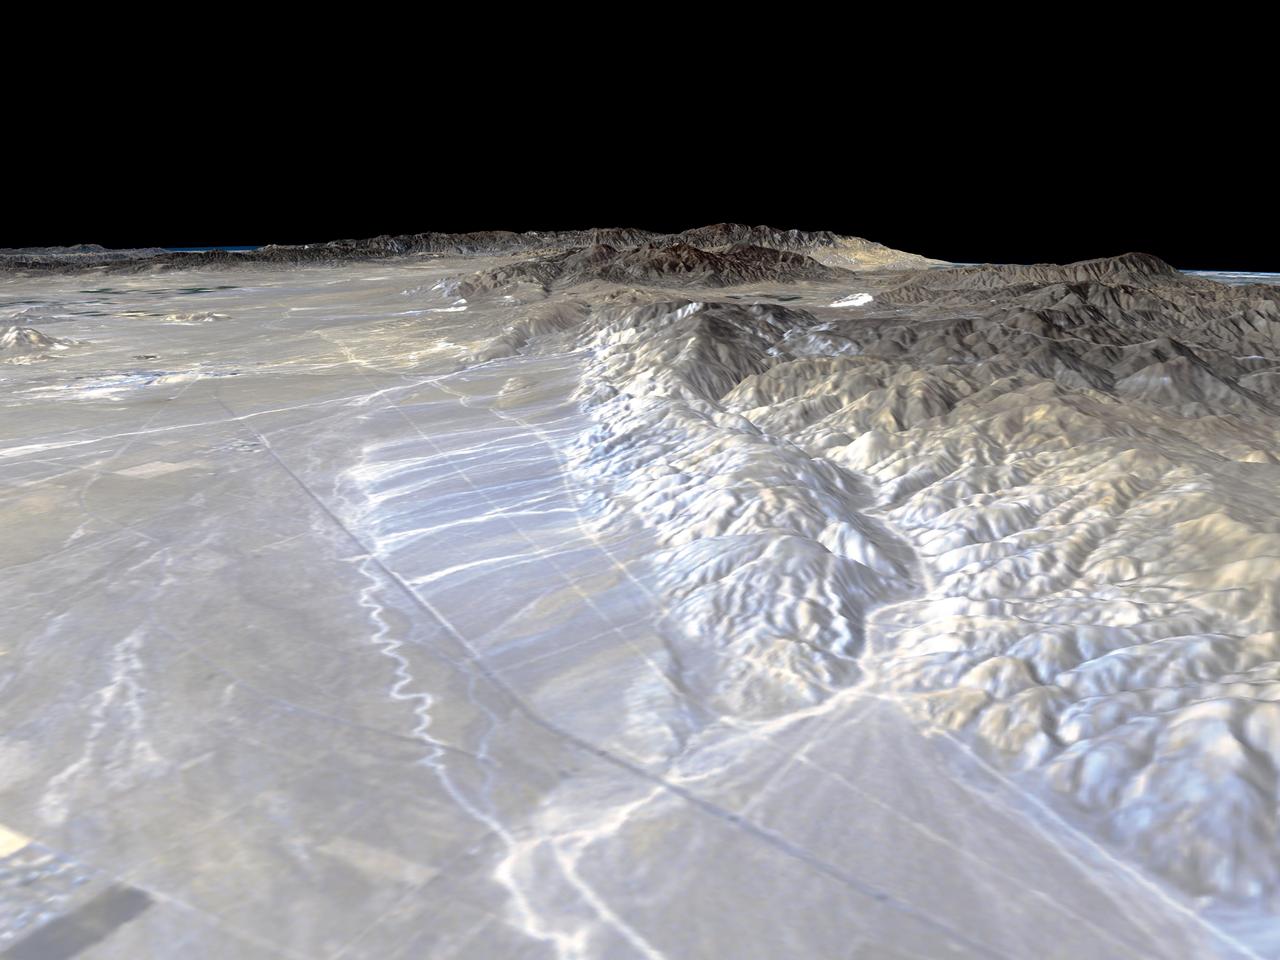
California Garlock Fault, marking the northwestern boundary of the Mojave Desert, lies at the foot of the mountains, running from the lower right to the top center of this image, which was created with data from NASA shuttle Radar Topography Mission.
This anaglyph, from NASA Shuttle Radar Topography Mission, in South America is dominated by the Andes Mountains, which extend all along the Pacific Coast. 3D glasses are necessary to view this image.
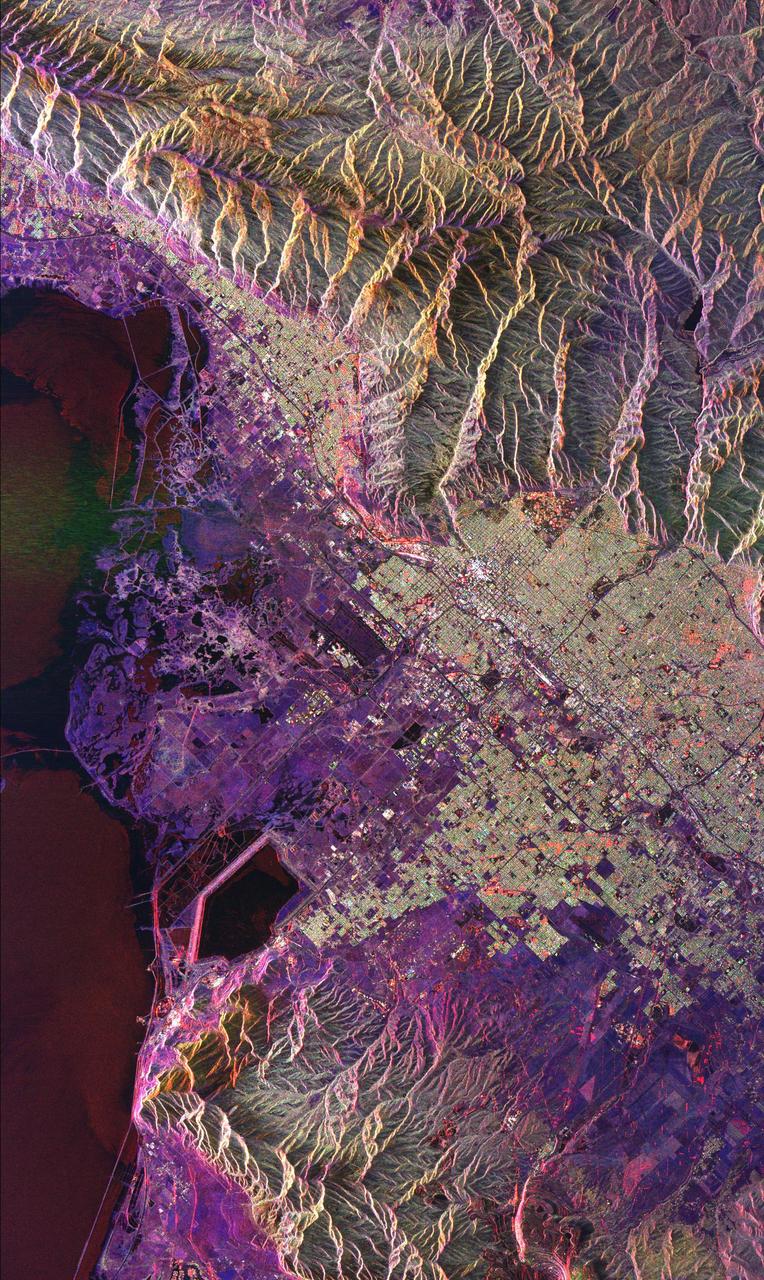
This radar image shows the massive urbanization of Los Angeles, California. The image extends from the Santa Monica Bay at the left to the San Gabriel Mountains at the right. Downtown Los Angeles is in the center of the image. The runways of the Los Angeles International Airport appear as black strips at the left center of the image. The waterways of Marina del Rey are seen just above the airport. The San Gabriel Mountains and the city of Pasadena are at the right center of the image. Black areas on the mountains on the right are fire scars from the 1993 Altadena fire. The Rose Bowl is shown as a small circle near the right center. The complex freeway system is visible as dark lines throughout the image. Some city areas, such as Santa Monica in the upper left, appear red due to the alignment of streets and buildings to the incoming radar beam. The image was acquired by the Spaceborne Imaging Radar-C/X-band Synthetic Aperture Radar (SIR-C/X-SAR) onboard the space shuttle Endeavour on October 3, 1994. SIR-C/X-SAR, a joint mission of the German, Italian and the United States space agencies, is part of NASA's Mission to Planet Earth. This image is centered at 34.04 degrees North latitude and 118.2 degrees West longitude with North pointing toward the upper right. The area shown measures 40 kilometers by 50 kilometers (25 miles by 31 miles). http://photojournal.jpl.nasa.gov/catalog/PIA01789
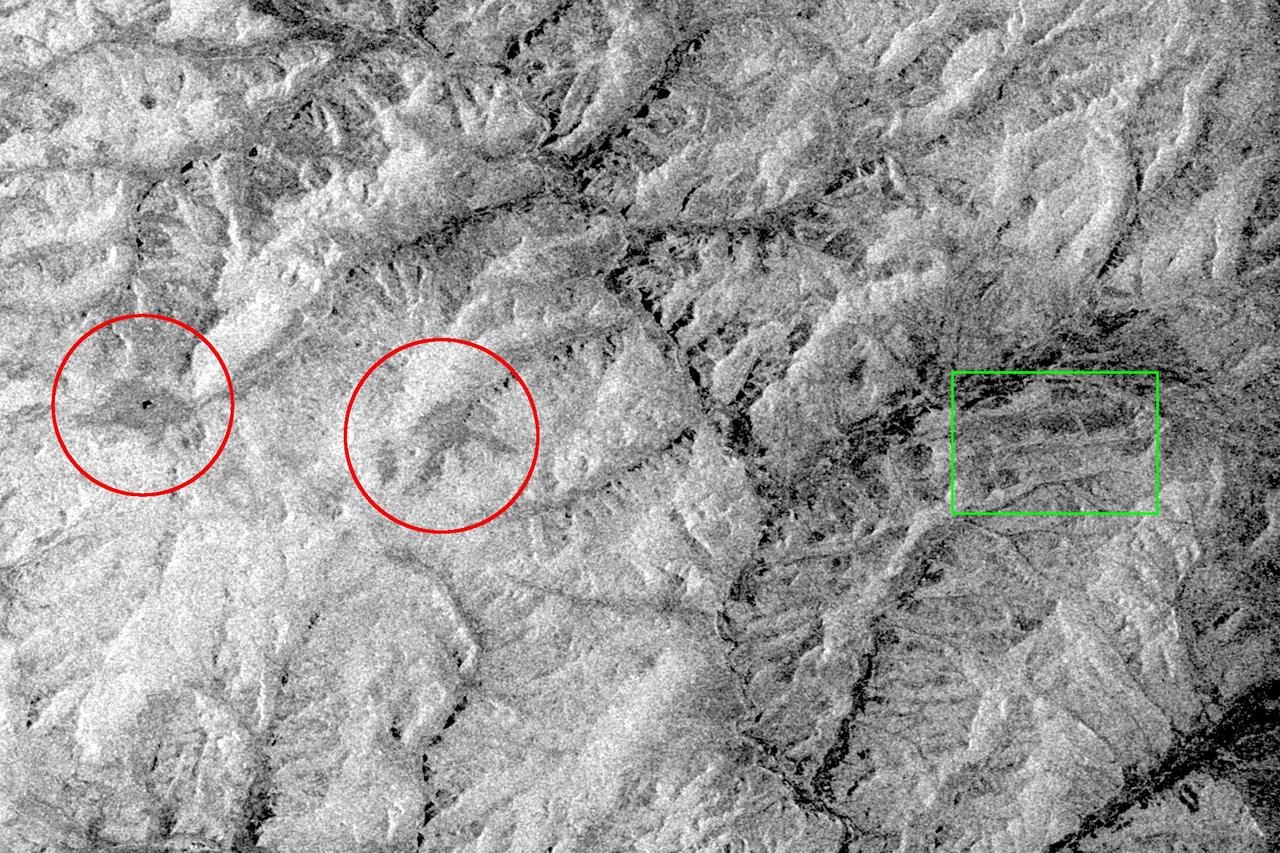
This is an X-band black-and-white image of the forests east of the Baikal Forest in the Jablonowy Mountains of Russia. The image is centered at 52.5 degrees north latitude and 116 degrees east longitude near the mining town of Bukatschatscha. This image was acquired by the Spaceborne Imaging Radar-C/X-band Synthetic Aperture Radar aboard the space shuttle Endeavour on October 4, 1994, during the second flight of the spaceborne radar. This area is part of an international research project known as the Taiga Aerospace Investigation using Geographic Information System Applications. http://photojournal.jpl.nasa.gov/catalog/PIA01754
STS059-S-072 (13 April 1994) --- This image is a false-color composite of Oetztal, Austria located in the Central Alps, centered at 46.8 degrees north latitude, and 10.70 degrees east longitude, at the border between Switzerland (top), Italy (left) and Austria (right and bottom). The area shown is 50 kilometers (30 miles) south of Innsbruck, Austria. This image was acquired by the Spaceborne Imaging Radar-C and X-Band Synthetic Aperture Radar (SIR-C/X-SAR) aboard the Space Shuttle Endeavour on its 14th orbit. Oetztal is a SIR-C/X-SAR hydrology supersite. Approximately one quarter of this image is covered by glaciers, the largest of which, Gepatschferner, is visible as a triangular yellow patch in the center of the scene. The summits of the main peaks reach elevations between 3,500 and 3,768 meters (11,500 and 12,362 feet) above sea level. The tongues of the glaciers are descending from elevated plateaus down into narrow valleys which were formed during the last ice age. This color image was produced in C-Band using multi-polarization information (Red=CHV, Green=CVV, Blue=CVV/CHV). The blue areas are lakes (Gepatsch Dam at center right; Lake Muta at top right) and glacier ice. The yellow areas are slopes facing the radar and areas of dry snow. Purple corresponds to slopes facing away from the radar. Yellow in the valley bottom corresponds to tree covered areas. There is 30 to 50 centimeters (12 to 20 inches) of dry, fresh snow on the glaciers, and about 10 centimeters (4 inches) in the valley at the city of Vent, Austria (center). At these data were taken, the weather was cold, with snow and thick fog. The entire area would appear white to an optical sensor because it is all covered under a winter snowpack. Researchers are interested in Oetztal because knowing how glaciers shrink and grow over time is an important indication of climatic change. SIR-C/X-SAR is part of NASA's Mission to Planet Earth (MTPE). SIR-C/X-SAR radars illuminate Earth with microwaves allowing detailed observations at any time, regardless of weather or sunlight conditions. SIR-C/X-SAR uses three microwave wavelengths: L-Band (24 cm), C-Band (6 cm), and X-Band (3 cm). The multi-frequency data will be used by the international scientific community to better understand the global environment and how it is changing. The SIR-C/X-SAR data, complemented by aircraft and ground studies, will give scientists clearer insights into those environmental changes which are caused by nature and those changes which are induced by human activity. SIR-C was developed by NASA's Jet Propulsion Laboratory (JPL). X-SAR was developed by the Dornire and Alenia Spazio Companies for the German Space Agency, Deutsche Agentur fuer Raumfahrtangelegenheiten (DARA), and the Italian Space Agency, Agenzia Spaziale Italiana (ASI). JPL Photo ID: P-43890
This is a radar image of Mount Rainier in Washington state. The volcano last erupted about 150 years ago and numerous large floods and debris flows have originated on its slopes during the last century. Today the volcano is heavily mantled with glaciers and snowfields. More than 100,000 people live on young volcanic mudflows less than 10,000 years old and, consequently, are within the range of future, devastating mudslides. This image was acquired by the Spaceborne Imaging Radar-C and X-band Synthetic Aperture Radar (SIR-C/X-SAR) aboard the space shuttle Endeavour on its 20th orbit on October 1, 1994. The area shown in the image is approximately 59 kilometers by 60 kilometers (36.5 miles by 37 miles). North is toward the top left of the image, which was composed by assigning red and green colors to the L-band, horizontally transmitted and vertically, and the L-band, horizontally transmitted and vertically received. Blue indicates the C-band, horizontally transmitted and vertically received. In addition to highlighting topographic slopes facing the space shuttle, SIR-C records rugged areas as brighter and smooth areas as darker. The scene was illuminated by the shuttle's radar from the northwest so that northwest-facing slopes are brighter and southeast-facing slopes are dark. Forested regions are pale green in color; clear cuts and bare ground are bluish or purple; ice is dark green and white. The round cone at the center of the image is the 14,435-foot (4,399-meter) active volcano, Mount Rainier. On the lower slopes is a zone of rock ridges and rubble (purple to reddish) above coniferous forests (in yellow/green). The western boundary of Mount Rainier National Park is seen as a transition from protected, old-growth forest to heavily logged private land, a mosaic of recent clear cuts (bright purple/blue) and partially regrown timber plantations (pale blue). The prominent river seen curving away from the mountain at the top of the image (to the northwest) is the White River, and the river leaving the mountain at the bottom right of the image (south) is the Nisqually River, which flows out of the Nisqually glacier on the mountain. The river leaving to the left of the mountain is the Carbon River, leading west and north toward heavily populated regions near Tacoma. The dark patch at the top right of the image is Bumping Lake. Other dark areas seen to the right of ridges throughout the image are radar shadow zones. Radar images can be used to study the volcanic structure and the surrounding regions with linear rock boundaries and faults. In addition, the recovery of forested lands from natural disasters and the success of reforestation programs can also be monitored. Ultimately this data may be used to study the advance and retreat of glaciers and other forces of global change. http://photojournal.jpl.nasa.gov/catalog/PIA01727
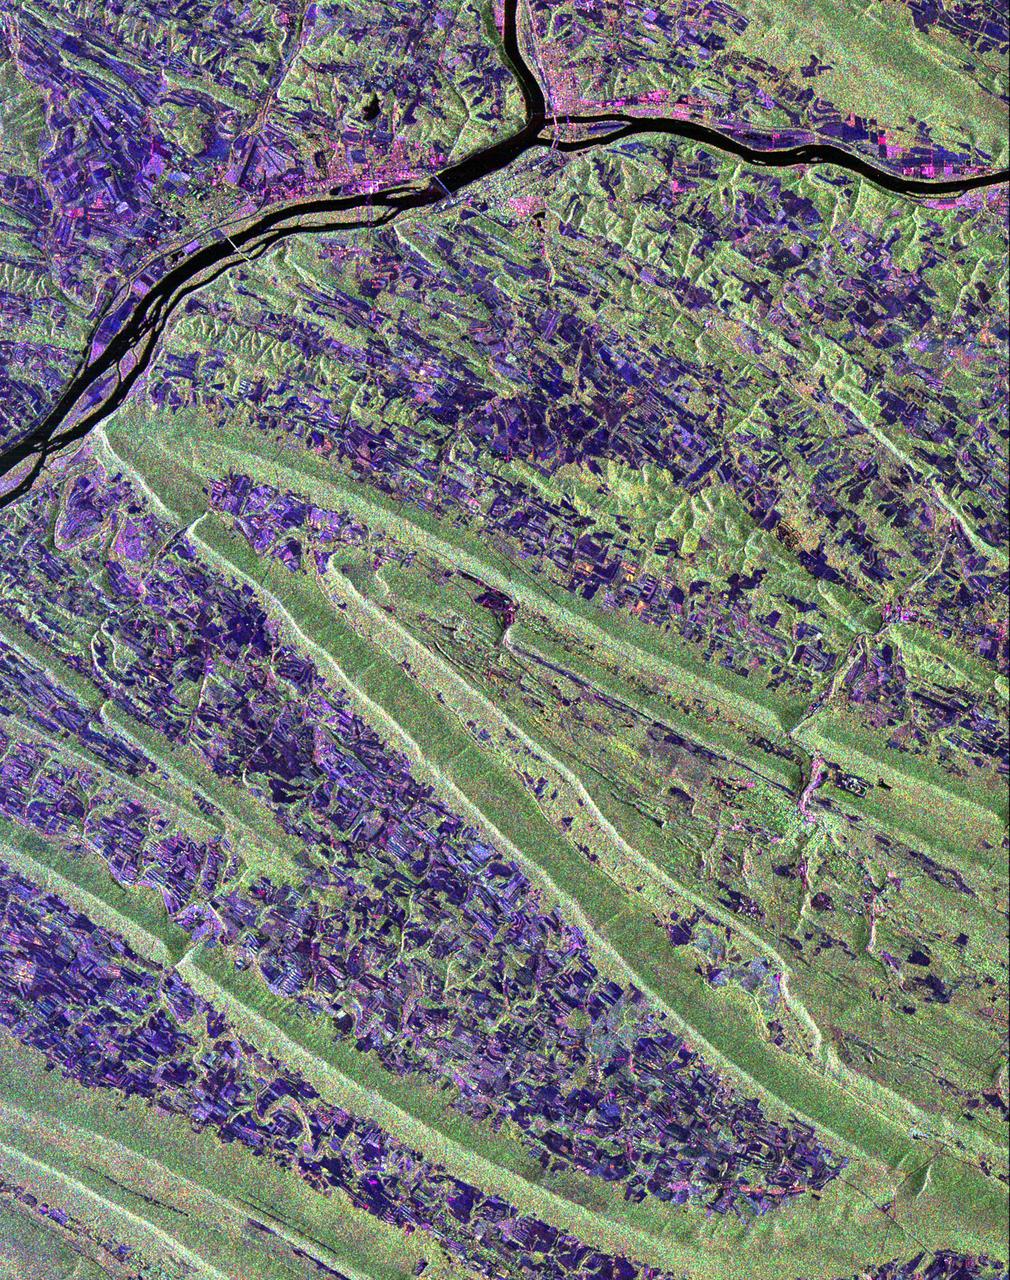
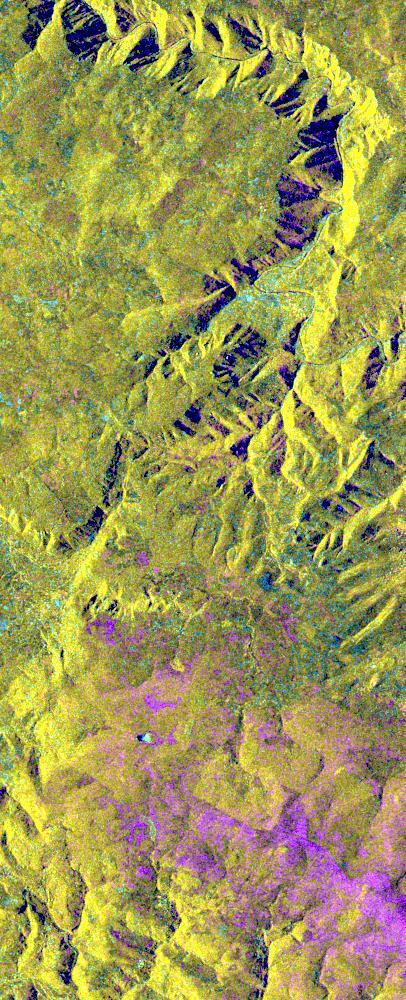
Scientists are using this radar image of the area surrounding Sunbury, Pennsylvania to study the geologic structure and land use patterns in the Appalachian Valley and Ridge province. This image was collected on October 6, 1994 by the Spaceborne Imaging Radar-C/ X-Band Synthetic Aperture Radar (SIR-C/X-SAR) on orbit 102 of the space shuttle Endeavour. The image is centered on latitude 40.85 degrees North latitude and 76.79 degrees West longitude. The area shown is approximately 30.5 km by 38 km. (19 miles by 24 miles). North is towards the upper right of the image. The Valley and Ridge province occurs in the north-central Appalachians, primarily in Pennsylvania, Maryland, and Virginia. It is an area of adjacent valleys and ridges that formed when the Appalachian mountain were created some 370 to 390 million years ago. During the continental collision that formed the Appalachians, the rocks in this area were pushed from the side and buckled much like a rug when pushed from one end. Subsequent erosion has produced the landscape we see in this image. The more resistant rocks, such as sandstone, form the tops of the ridges which appear as forested greenish areas on this image. The less resistant rocks, such as limestone, form the lower valleys which are cleared land and farm fields and are purple in this image. Smaller rivers and streams in the area flow along the valleys and in places cut across the ridges in "water gaps." In addition to defining the geography of this region, the Valley and Ridge province also provides this area with natural resources. The valleys provide fertile farmland and the folded mountains form natural traps for oil and gas accumulation; coal deposits are also found in the mountains. The colors in the image are assigned to different frequencies and polarizations of the SIR-C radar as follows: red is L-band horizontally transmitted, horizontally received; green is L-band horizontally transmitted, vertically received; blue is C-band horizontally transmitted, horizontally received. The river junction near the top of the image is where the West Branch River flows into the Susquehanna River, which then flows to the south-southwest past the state capitol of Harrisburg, 70 km (43 miles) to the south and not visible in this image. The town of Sunbury is shown along the Susquehanna on the east just to the southeast of the junction with West Branch. Three structures that cross the Susquehanna; the northern and southern of these structures are bridges and middle structure is the Shamokin Dam which confines the Susquehanna just south of the junction with West Branch. The prominent S-shaped mountain ridge in the center of the image is, from north to south, Little Mountain (the top of the S), Line Mountain (the middle of the S), and Mahantango Mountain (the bottom of the S). http://photojournal.jpl.nasa.gov/catalog/PIA01306
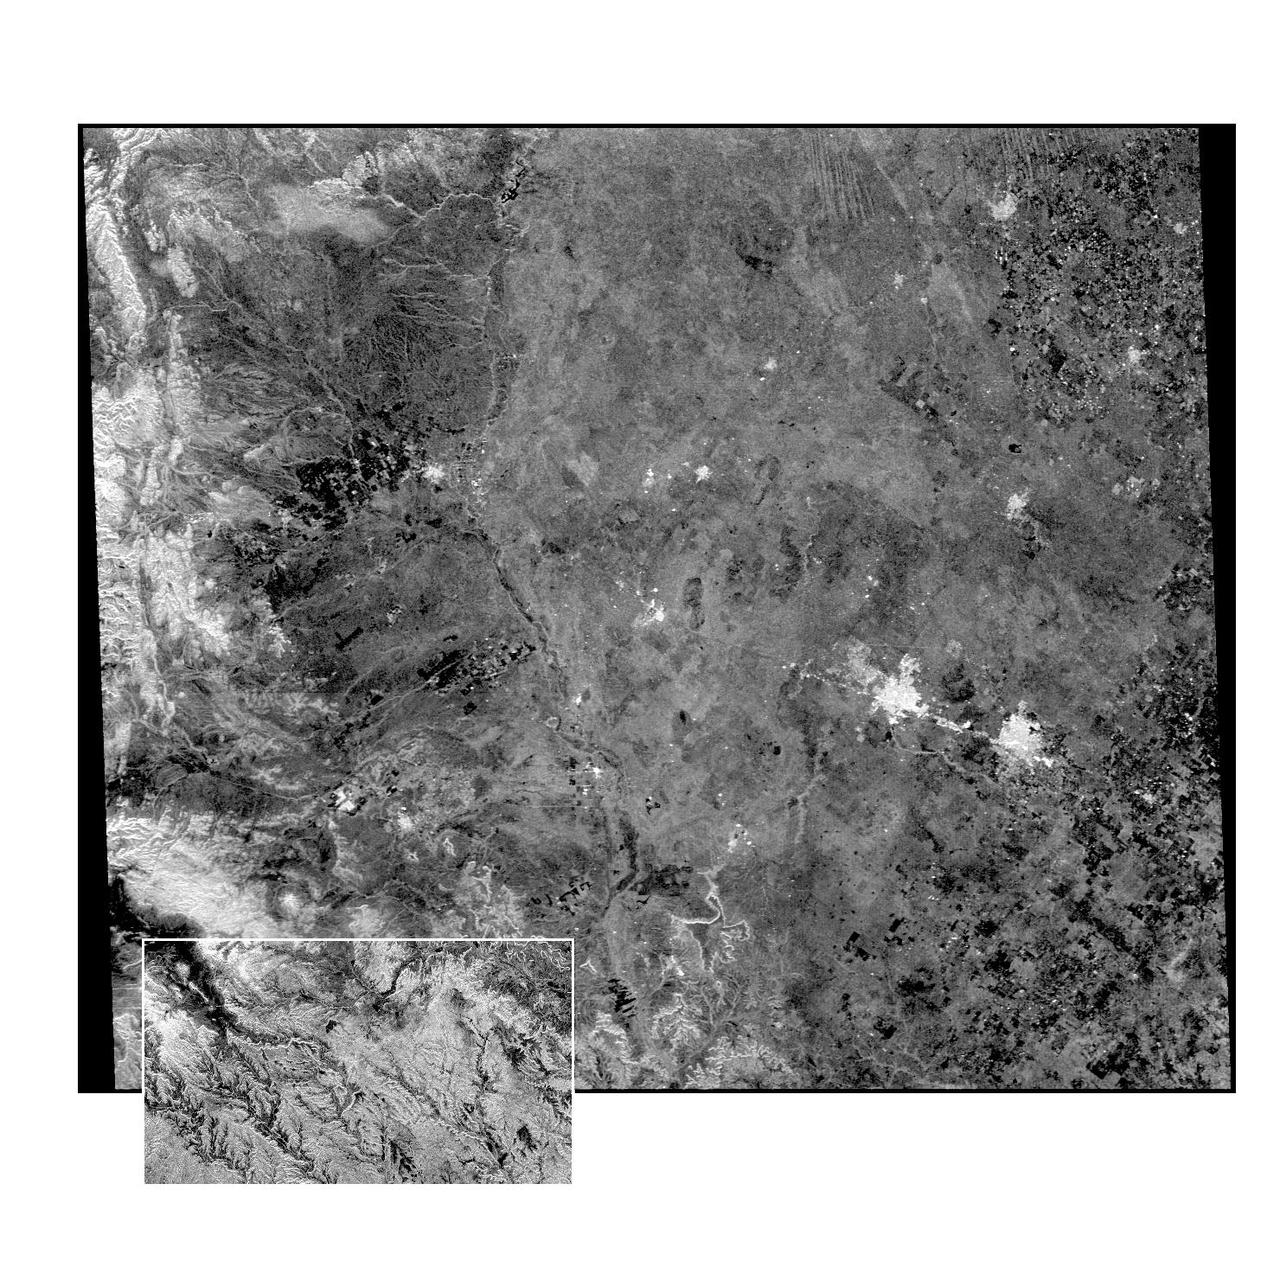
This radar image of the Midland/Odessa region of West Texas, demonstrates an experimental technique, called ScanSAR, that allows scientists to rapidly image large areas of the Earth's surface. The large image covers an area 245 kilometers by 225 kilometers (152 miles by 139 miles). It was obtained by the Spaceborne Imaging Radar-C/X-Band Synthetic Aperture Radar (SIR-C/X-SAR) flying aboard the space shuttle Endeavour on October 5, 1994. The smaller inset image is a standard SIR-C image showing a portion of the same area, 100 kilometers by 57 kilometers (62 miles by 35 miles) and was taken during the first flight of SIR-C on April 14, 1994. The bright spots on the right side of the image are the cities of Odessa (left) and Midland (right), Texas. The Pecos River runs from the top center to the bottom center of the image. Along the left side of the image are, from top to bottom, parts of the Guadalupe, Davis and Santiago Mountains. North is toward the upper right. Unlike conventional radar imaging, in which a radar continuously illuminates a single ground swath as the space shuttle passes over the terrain, a Scansar radar illuminates several adjacent ground swaths almost simultaneously, by "scanning" the radar beam across a large area in a rapid sequence. The adjacent swaths, typically about 50 km (31 miles) wide, are then merged during ground processing to produce a single large scene. Illumination for this L-band scene is from the top of the image. The beams were scanned from the top of the scene to the bottom, as the shuttle flew from left to right. This scene was acquired in about 30 seconds. A normal SIR-C image is acquired in about 13 seconds. The ScanSAR mode will likely be used on future radar sensors to construct regional and possibly global radar images and topographic maps. The ScanSAR processor is being designed for 1996 implementation at NASA's Alaska SAR Facility, located at the University of Alaska Fairbanks, and will produce digital images from the forthcoming Canadian RADARSAT satellite. http://photojournal.jpl.nasa.gov/catalog/PIA01787
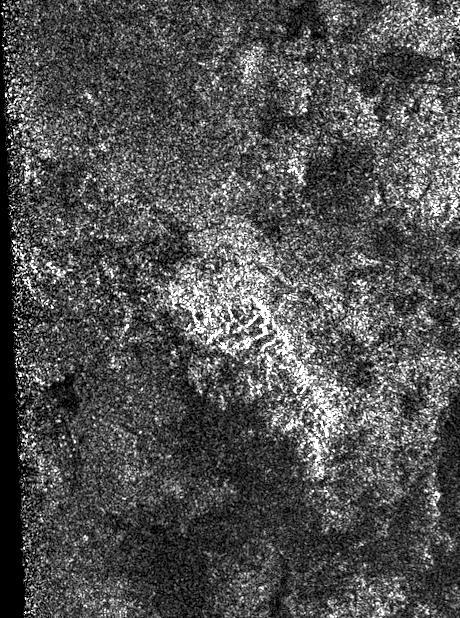
This synthetic-aperture radar image was obtained by NASA's Cassini spacecraft during its T-120 pass over Titan's southern latitudes on June 7, 2016. The area shown here measures about 40 by 60 miles (70 by 100 kilometers) and is centered at about 60 degrees south latitude, 130 degrees west longitude. Radar illuminates the scene from the left at a 28-degree incidence angle. At the center of the image is a bright feature oriented from upper left to lower right. This is interpreted to be a long ridge with jagged peaks, likely created by methane rainfall erosion. Some of the individual peaks rise about 2,400 feet (800 meters) above the valley floor. The ridge has a considerably gentler slope on its left side (which appears brighter here) than on its right. Frequently, mountains shaped like this on Earth are fractured blocks of the planet's crust, thrusted upward and then tilted, creating a shallow slope on one side and a steeper slope on the fractured, faulted edge. Also presented here is an annotated version of the image, along with a radar image of the Dragoon Mountains in Arizona just east of Tucson. The Dragoon feature represents a tilted fault block, formed by spreading that has occurred across the western U.S., and has a similar shape to that of the Titan ridge. The Dragoon radar image was produced using data from NASA's Shuttle Radar Topography Mission (credit: NASA/JPL-Caltech/NGA). Radar illuminates the scene from the left in that image as well. Titan has displayed many features that are strikingly similar to Earth: lakes, seas, rivers, dunes and mountains. Scientists think it possible that, like Earth, the giant moon's crust has experienced familiar processes of uplift and spreading, followed by erosion. http://photojournal.jpl.nasa.gov/catalog/PIA20709
This radar image of Salt Lake City, Utah, illustrates the different land use patterns that are present in the Utah Valley. Salt Lake City lies between the shores of the Great Salt Lake (the dark area on the left side of the image) and the Wasatch Front Range (the mountains in the upper half of the image). The Salt Lake City area is of great interest to urban planners because of the combination of lake, valley and alpine environments that coexist in the region. Much of the southern shore of the Great Salt Lake is a waterfowl management area. The green grid pattern in the right center of the image is Salt Lake City and its surrounding communities. The Salt Lake City airport is visible as the brown rectangle near the center of the image. Interstate Highway 15 runs from the middle right edge to the upper left of the image. The bright white patch east of Interstate 15 is the downtown area, including Temple Square and the state capitol. The University of Utah campus is the yellowish area that lies at the base of the mountains, east of Temple Square. The large reservoir in the lower left center is a mine tailings pond. The semi-circular feature in the mountains at the bottom edge of the image is the Kennecott Copper Mine. The area shown is 60 kilometers by 40 kilometers (37 miles by 25 miles) and is centered at 40.6 degrees north latitude, 112.0 degrees west longitude. North is toward the upper left. This image was acquired by the Spaceborne Imaging Radar-C/X-Band Synthetic Aperture Radar (SIR-C/X-SAR) aboard the space shuttle Endeavour on April 10, 1994. The colors in this image represent the following radar channels and polarizations: red is L-band, horizontally transmitted and received; green is L-band, horizontally transmitted and vertically received; and blue is C-band, horizontally transmitted and vertically received. SIR-C/X-SAR, a joint mission of the German, Italian and United States space agencies, is part of NASA's Mission to Planet Earth program. http://photojournal.jpl.nasa.gov/catalog/PIA01798
STS068-S-052 (3 October 1994) --- This is a radar image of Mount Rainier in Washington state. The volcano last erupted about 150 years ago and numerous large floods and debris flows have originated on its slopes during the last century. Today the volcano is heavily mantled with glaciers and snow fields. More than 100,000 people live on young volcanic mud flows less than 10,000 years old and, are within the range of future, devastating mud slides. This image was acquired by the Spaceborne Imaging Radar-C/X-Band Synthetic Aperture Radar (SIR-C/X-SAR) aboard the Space Shuttle Endeavour on its 20th orbit on October 1, 1994. The area shown in the image is approximately 59 by 60 kilometers (36.5 by 37 miles). North is toward the top left of the image, which was composed by assigning red and green colors to the L-Band, horizontally transmitted and vertically, and the L-Band, horizontally transmitted and vertically received. Blue indicates the C-Band, horizontally transmitted and vertically received. In addition to highlighting topographic slopes facing the Space Shuttle, SIR-C records rugged areas as brighter and smooth areas as darker. The scene was illuminated by the Shuttle's radar from the northwest so that northwest-facing slopes are brighter and southeast-facing slopes are dark. Forested regions are pale green in color, clear cuts and bare ground are bluish or purple; ice is dark green and white. The round cone at the center of the image is the 14,435 feet (4,399 meters) active volcano, Mount Rainier. On the lower slopes is a zone of rock ridges and rubble (purple to reddish) above coniferous forests (in yellow/green). The western boundary of Mount Rainier National Park is seen as a transition from protected, old-growth forest to heavily logged private land, a mosaic of recent clear cuts (bright purple/blue) and partially re-grown timber plantations (pale blue). The prominent river seen curving away from the mountain at the top of the image (to the northwest) is the White River, and the river leaving the mountain at the bottom right of the image (south) is the Nisqually River, which flows out of the Nisqually glacier on the mountain. The river leaving to the left of the mountain is the Carbon River, leading west and north toward heavily populated regions near Tacoma. The dark patch at the top right of the image is Bumping Lake. Other dark areas seen to the right of ridges throughout the image are radar shadow zones. Radar images can be used to study the volcanic structure and the surrounding regions with linear rock boundaries and faults. In addition, the recovery of forested lands from natural disasters and the success of re-forestation programs can also be monitored. Ultimately this data may be used to study the advance and retreat of glaciers and other forces of global change. Spaceborne Imaging Radar-C/X-Band Synthetic Aperture Radar (SIR-C/X-SAR) is part of NASA's Mission to Planet Earth. (P-44703)
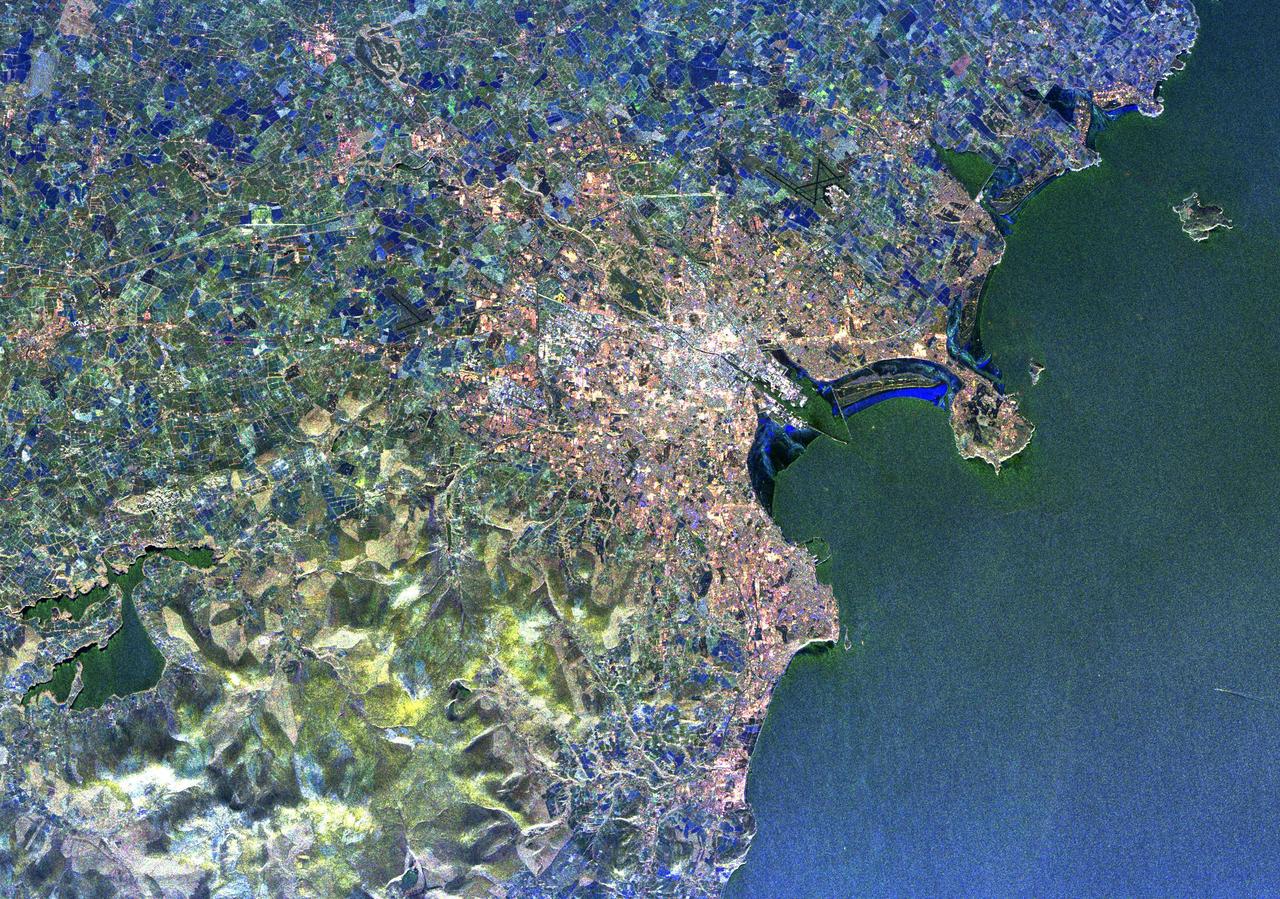
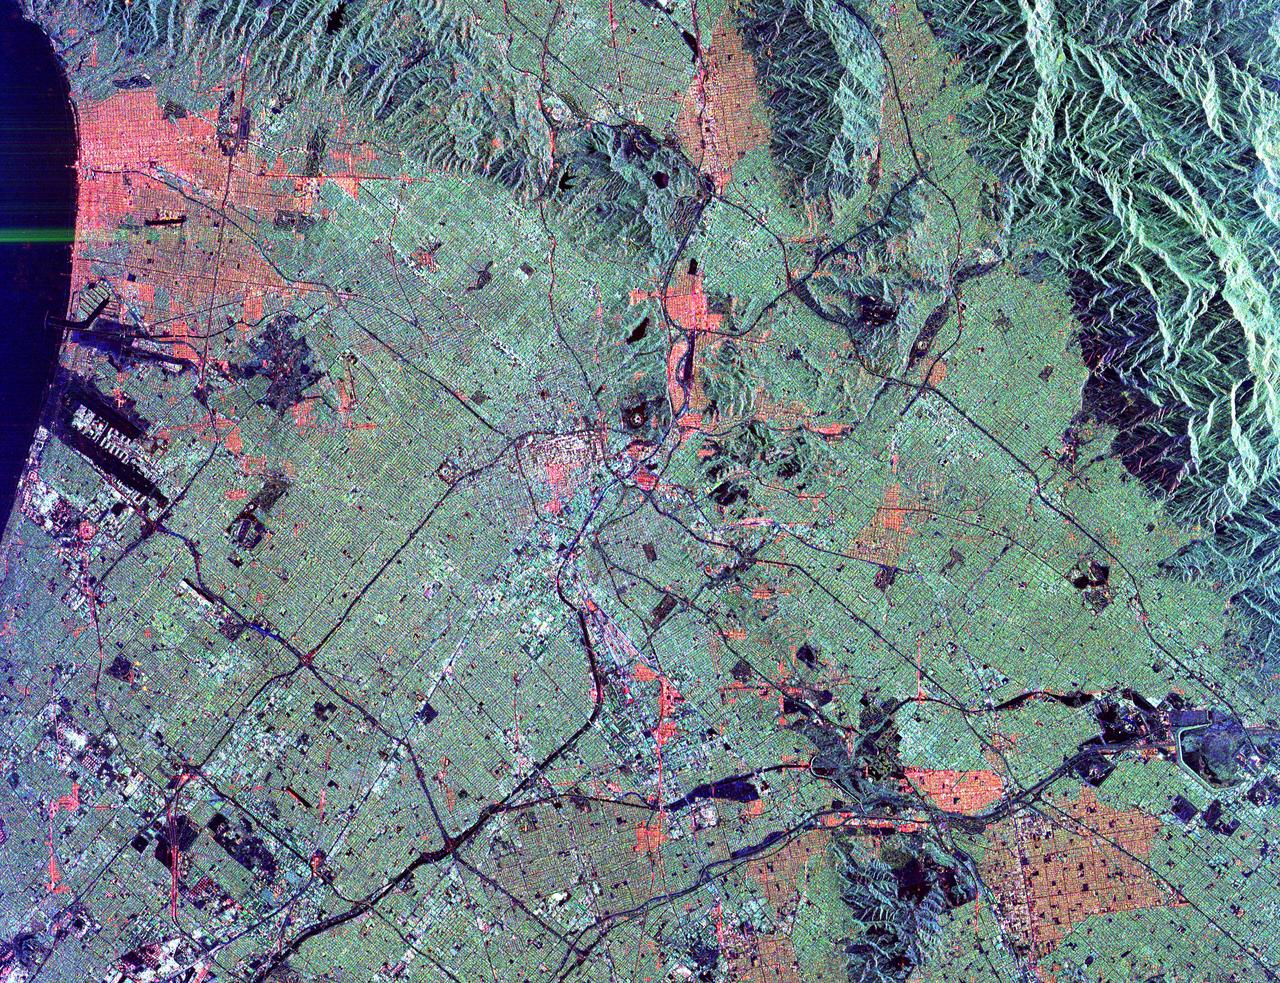
Visualization Date 1994-04-11 This radar image of Dublin, Ireland, shows how the radar distingishes between densely populated urban areas and nearby areas that are relatively unsettled. In the center of the image is the city's natural harbor along the Irish Sea. The pinkish areas in the center are the densely populated parts of the city and the blue/green areas are the suburbs. The two ends of the Dublin Bay are Howth Point, the circular peninsula near the upper right side of the image, and Dun Laoghaire, the point to the south. The small island just north of Howth is called "Ireland's Eye," and the larger island, near the upper right corner of the image is Lambay Island. The yellow/green mountains in the lower left of the image (south) are the Wicklow Mountains. The large lake in the lower left, nestled within these mountains, is the Poulaphouca Reservoir along River Liffey. The River Liffey, the River Dodder and the Tolka River are the three rivers that flow into Dublin. The straight features west of the city are the Grand Canal and the three rivers are the faint lines above and below these structures. The dark X-shaped feature just to the north of the city is the Dublin International Airport. The image was acquired by the Spaceborne Imaging Radar-C/X-band Synthetic Aperture (SIR-C/X-SAR) when it flew aboard the space shuttle Endeavour on April 11, 1994. This area is centered at 53.3 degrees north latitude, 6.2 degrees west longitude. The area shown is approximately 55 kilometers by 42 kilometers (34 miles by 26 miles). The colors are assigned to different frequencies and polarizations of the radar as follows: Red is L-band horizontally transmitted, horizontally received; green is L-band vertically transmitted, vertically received; and blue is C-band vertically transmitted, vertically received. SIR-C/X-SAR, a joint mission of the German, Italian, and the United States space agencies, is part of NASA's Mission to Planet Earth. Credit: NASA/GSFC For more information go to: <a href="http://visibleearth.nasa.gov/view_rec.php?id=467" rel="nofollow">visibleearth.nasa.gov/view_rec.php?id=467</a>
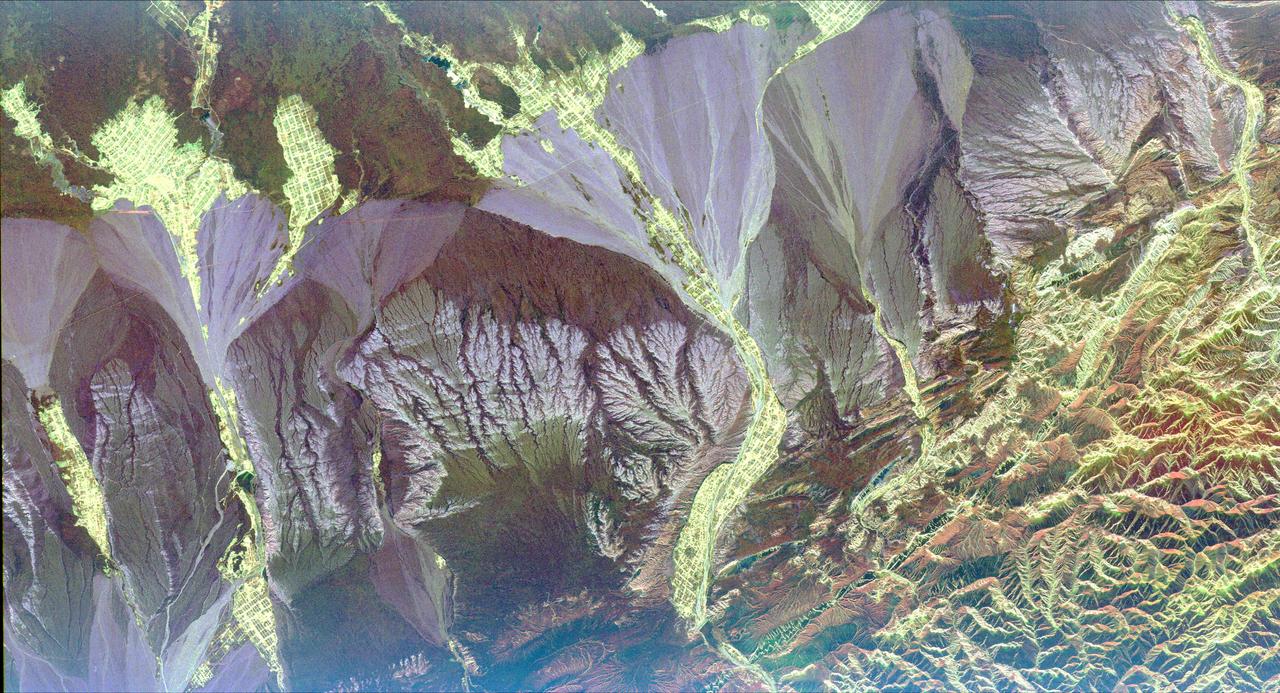
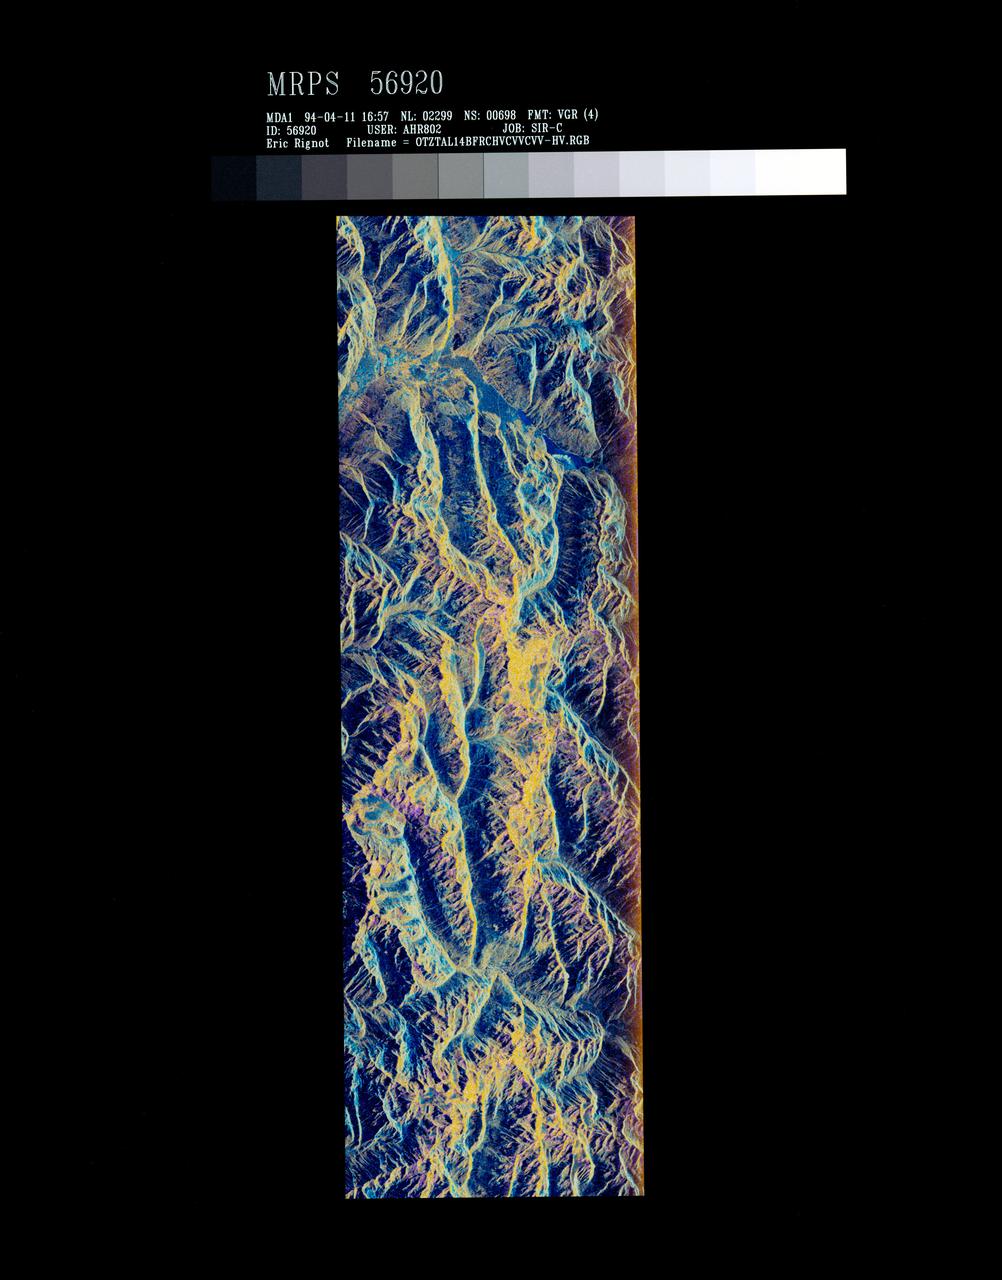
This radar image is centered near the small town of Pishan in northwest China, about 280 km (174 miles) southeast of the city of Kashgar along the ancient Silk Route in the Taklamakan desert of the Xinjiang Province. Geologists are using this radar image as a map to study past climate changes and tectonics of the area. The irregular lavender branching patterns in the center of the image are the remains of ancient alluvial fans, gravel deposits that have accumulated at the base of the mountains during times of wetter climate. The subtle striped pattern cutting across the ancient fans are caused by thrusting of the Kun Lun Mountains north. This motion is caused by the continuing plate-tectonic collision of India with Asia. Modern fans show up as large lavender triangles above the ancient fan deposits. Yellow areas on the modern fans are vegetated oases. The gridded pattern results from the alignment of poplar trees that have been planted as wind breaks. The reservoir at the top of the image is part of a sophisticated irrigation system that supplies water to the oases. This image was acquired by the Spaceborne Imaging Radar-C/X-band Synthetic Aperture Radar (SIR-C/X-SAR) aboard the space shuttle Endeavour in April 1994. This image is centered at 37.4 degrees north latitude, 78.3 degrees east longitude and shows an area approximately 50 km by 100 km (31 miles by 62 miles). The colors are assigned to different frequencies and polarizations of the radar as follows: Red is L-band horizontally transmitted, horizontally received; green is L-band horizontally transmitted, vertically received; and blue is C-band horizontally transmitted and vertically received. SIR-C/X-SAR, a joint mission of the German, Italian, and the United States space agencies, is part of NASA's Mission to Planet Earth. http://photojournal.jpl.nasa.gov/catalog/PIA01796
This is a false-color radar image of Central Africa, showing the Virunga Volcano chain along the borders of Rwanda, Zaire and Uganda. This area is home to the endangered mountain gorillas. This C-band L-band image was acquired on April 12, 1994, on orbit 58 of space shuttle Endeavour by the Spaceborne Imaging Radar-C/X-band Synthetic Aperture Radar (SIR-C/X-SAR). The area is centered at about 1.75 degrees south latitude and 29.5 degrees east longitude. The image covers an area 58 kilometers by 178 kilometers (48 miles by 178 miles). The false-color composite is created by displaying the L-band HH return in red, the L-band HV return in green and the C-band HH return in blue. The dark area in the bottom of the image is Lake Kivu, which forms the border between Zaire (to the left) and Rwanda (to the right). The airport at Goma, Zaire is shown as a dark line just above the lake in the bottom left corner of the image. Volcanic flows from the 1977 eruption of Mt. Nyiragongo are shown just north of the airport. Mt. Nyiragongo is not visible in this image because it is located just to the left of the image swath. Very fluid lava flows from the 1977 eruption killed 70 people. http://photojournal.jpl.nasa.gov/catalog/PIA01724
This is an X-band seasonal image of the central part of Lozere Departement situated south of the Massif Central in France. The image is 10 kilometers by 25 kilometers (6 miles by 15.5 miles) and is centered at approximately 44.3 degrees north latitude and 3 degrees east longitude. This image was acquired by the Spaceborne Imaging Radar-C/X-band Synthetic Aperture Radar aboard the space shuttle Endeavour on April 15, 1994 and on October 6, 1994. The image channels have the following color assignments: red was acquired in April; green was acquired in October; and blue is the ratio of the two data sets combined. Seasonal differences in the vegetation are visible in pink, which are heaths growing in the spring. This research area features two large limestone plateaus cut by the famous Gorges du Tarn, standing in parallel with the granite mountain range known as the Cevennes Mountains nearby. Land-use consists mainly of grasslands, heaths and forests. Forest types seen in the images are Austrian pines,Scots pines, spruce, fir and beech trees. Most forests were planted at the end of the 19th century through a national reforestation program aimed at reducing the strong erosion risks in these areas. This program was so successful that today the forests are exploited for forest pulpwood and sawlogs, but also remain protected as conservation regions. The study being performed in this area will assess the potential of spaceborne radar remote sensing for temperate forest type mapping and forest resource monitoring. The combination of X-band SAR data with lower frequency data (such as the SIR-C L-band data) allows scientists to distinguish forest tree species and biomass, or areas of ground vegetation. The lessons learned from the radar images of these controlled forest regions can be applied to larger areas and naturally grown forests to help ecologists protect and maintain them. The SIR-C/X-SAR images will be investigated by scientists from the remote sensing laboratory Cemagref in Montpellier and the National Forestry Board in Mende, France. http://photojournal.jpl.nasa.gov/catalog/PIA01755
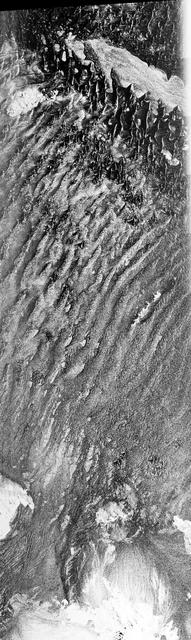
This is a C-band, VV polarization radar image of the Namib desert in southern Namibia, near the coast of South West Africa. The image is centered at about 25 degrees South latitude, 15.5 degrees East longitude. This image was one of the first acquired by the Spaceborne Imaging Radar-C/X-Band Synthetic Aperture Radar (SIR-C/X-SAR) when it was taken on orbit 4 from the shuttle Endeavour on April 9, 1994. The area shown is approximately 78 kilometers by 20 kilometers. The dominant features in the image are complex sand dune patterns formed by the prevailing winds in this part of the Namib desert. The Namib desert is an extremely dry area formed largely because of the influence of the cold Benguela ocean current that flows northward along the coast of Namibia. The bright areas at the bottom of the image are exposed outcrops of Precambrian rocks. This extremely barren area is a region rich in diamonds that through the centuries have washed down from the mountains. The town of Luderitz is located just to the south of the area shown. http://photojournal.jpl.nasa.gov/catalog/PIA01720
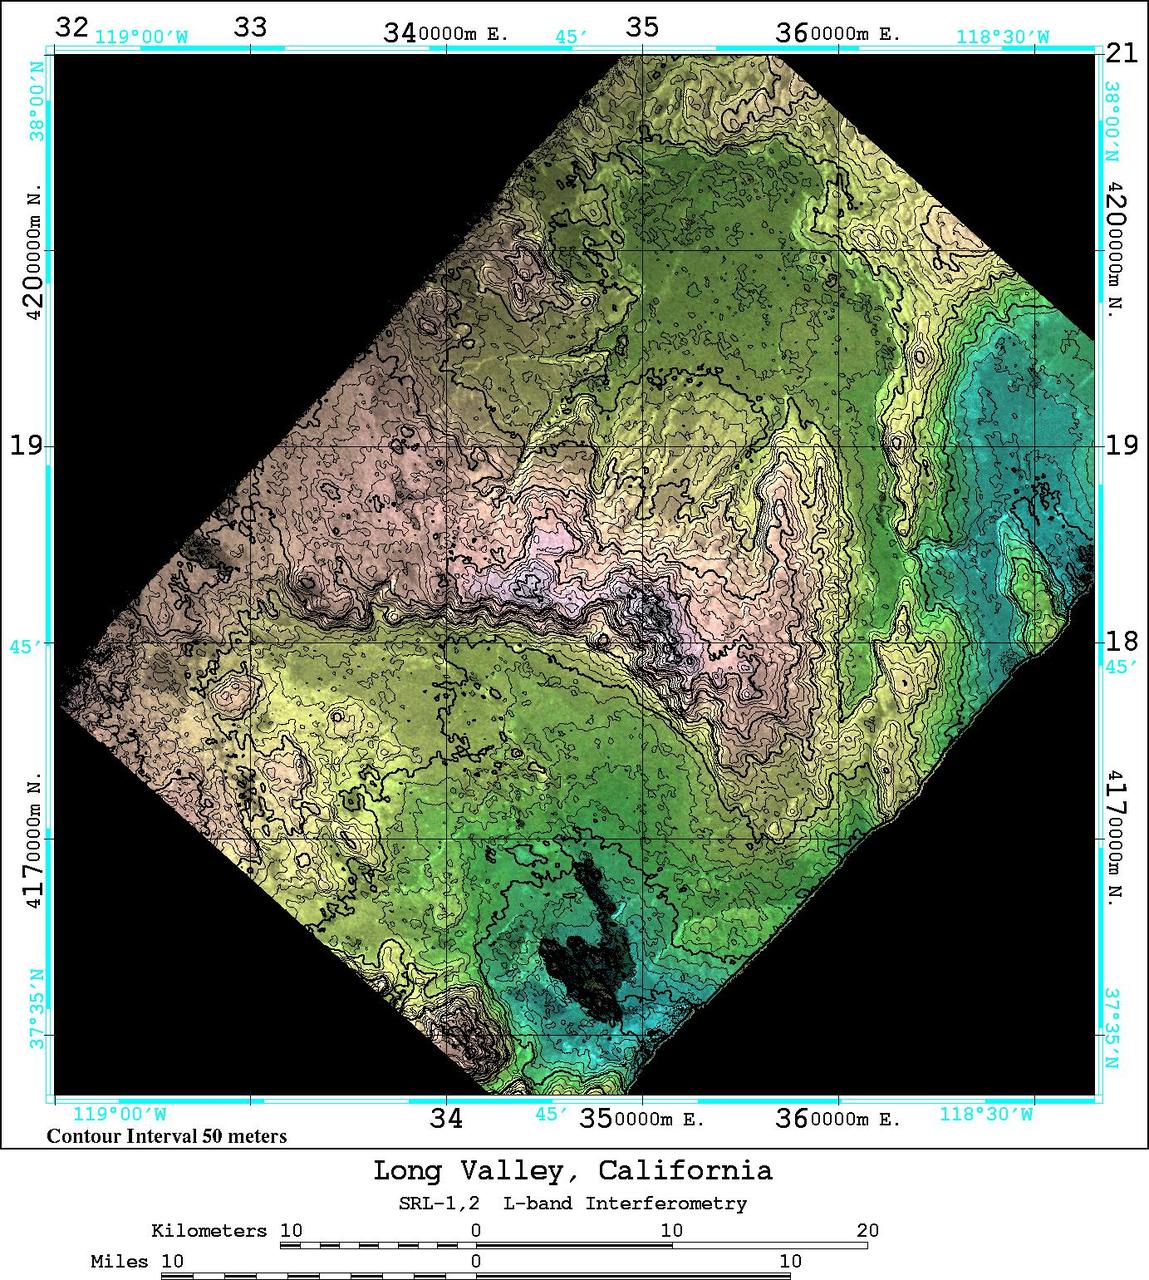
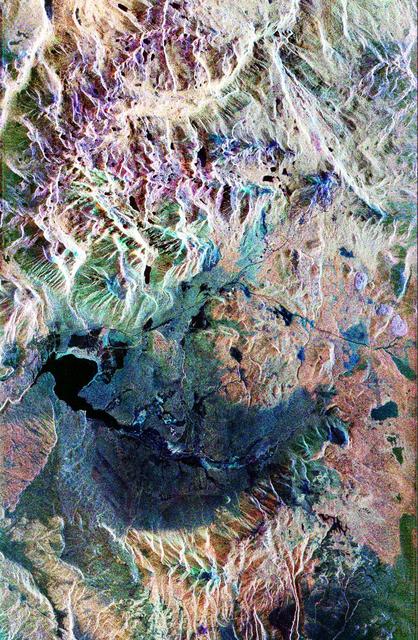
An area near Long Valley, California, was mapped by the Spaceborne Imaging Radar-C and X-band Synthetic Aperture Radar aboard the space shuttle Endeavor on April 13, 1994, during the first flight of the radar instrument, and on October 4, 1994, during the second flight of the radar instrument. The orbital configurations of the two data sets were ideal for interferometric combination -- that is overlaying the data from one image onto a second image of the same area to create an elevation map and obtain estimates of topography. Once the topography is known, any radar-induced distortions can be removed and the radar data can be geometrically projected directly onto a standard map grid for use in a geographical information system. The 50 kilometer by 50 kilometer (31 miles by 31 miles) map shown here is entirely derived from SIR-C L-band radar (horizontally transmitted and received) results. The color shown in this image is produced from the interferometrically determined elevations, while the brightness is determined by the radar backscatter. The map is in Universal Transverse Mercator (UTM) coordinates. Elevation contour lines are shown every 50 meters (164 feet). Crowley Lake is the dark feature near the south edge of the map. The Adobe Valley in the north and the Long Valley in the south are separated by the Glass Mountain Ridge, which runs through the center of the image. The height accuracy of the interferometrically derived digital elevation model is estimated to be 20 meters (66 feet) in this image. http://photojournal.jpl.nasa.gov/catalog/PIA01749
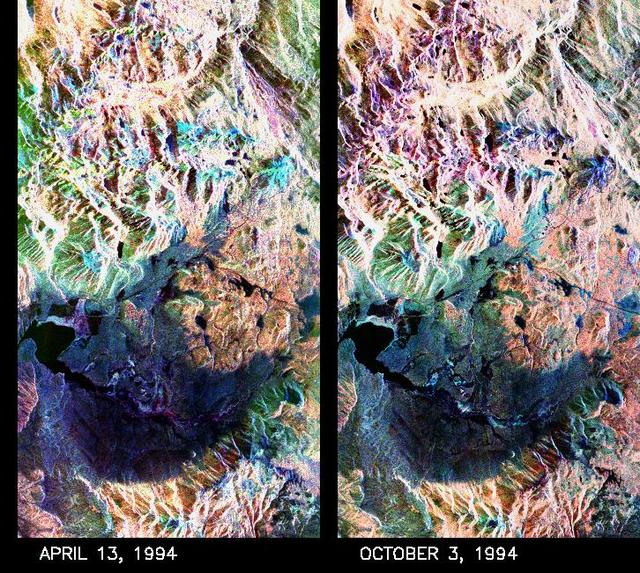
These two false-color composite images of the Mammoth Mountain area in the Sierra Nevada Mountains, Calif., show significant seasonal changes in snow cover. The image at left was acquired by the Spaceborne Imaging Radar-C and X-band Synthetic Aperture Radar aboard the space shuttle Endeavour on its 67th orbit on April 13, 1994. The image is centered at 37.6 degrees north latitude and 119 degrees west longitude. The area is about 36 kilometers by 48 kilometers (22 miles by 29 miles). In this image, red is L-band (horizontally transmitted and vertically received) polarization data; green is C-band (horizontally transmitted and vertically received) polarization data; and blue is C-band (horizontally transmitted and received) polarization data. The image at right was acquired on October 3, 1994, on the space shuttle Endeavour's 67th orbit of the second radar mission. Crowley Lake appears dark at the center left of the image, just above or south of Long Valley. The Mammoth Mountain ski area is visible at the top right of the scene. The red areas correspond to forests, the dark blue areas are bare surfaces and the green areas are short vegetation, mainly brush. The changes in color tone at the higher elevations (e.g. the Mammoth Mountain ski area) from green-blue in April to purple in September reflect changes in snow cover between the two missions. The April mission occurred immediately following a moderate snow storm. During the mission the snow evolved from a dry, fine-grained snowpack with few distinct layers to a wet, coarse-grained pack with multiple ice inclusions. Since that mission, all snow in the area has melted except for small glaciers and permanent snowfields on the Silver Divide and near the headwaters of Rock Creek. On October 3, 1994, only discontinuous patches of snow cover were present at very high elevations following the first snow storm of the season on September 28, 1994. For investigations in hydrology and land-surface climatology, seasonal snow cover and alpine glaciers are critical to the radiation and water balances. SIR-C/X-SAR is a powerful tool because it is sensitive to most snowpack conditions and is less influenced by weather conditions than other remote sensing instruments, such as Landsat. In parallel with the operational SIR-C data processing, an experimental effort is being conducted to test SAR data processing using the Jet Propulsion Laboratory's massively parallel supercomputing facility, centered around the Cray Research T3D. These experiments will assess the abilities of large supercomputers to produce high throughput SAR processing in preparation for upcoming data-intensive SAR missions. The images released here were produced as part of this experimental effort. http://photojournal.jpl.nasa.gov/catalog/PIA01753
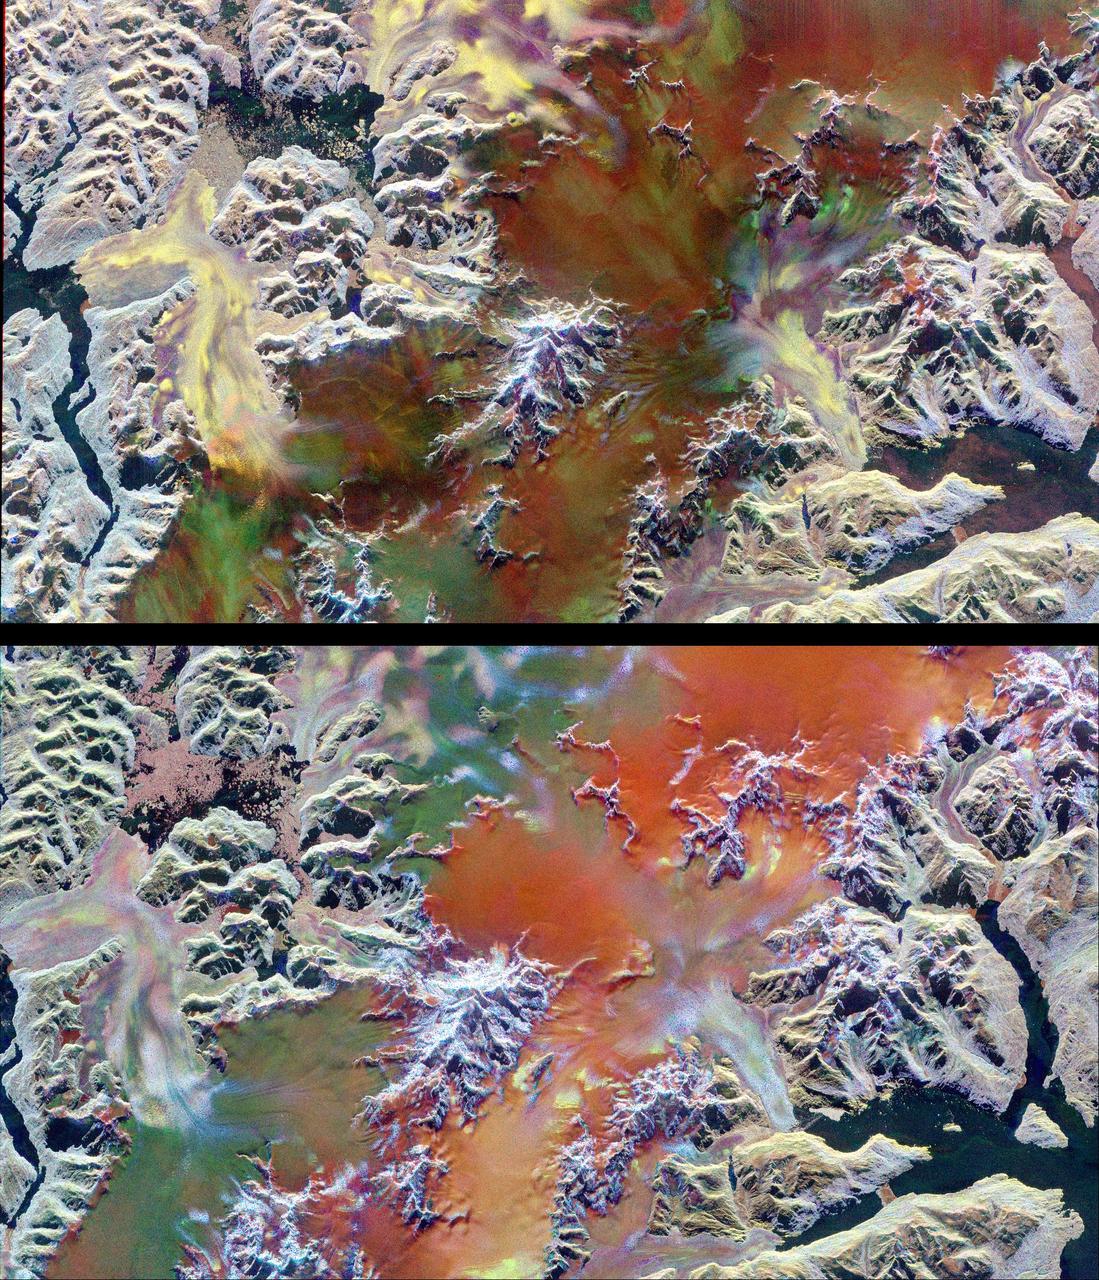
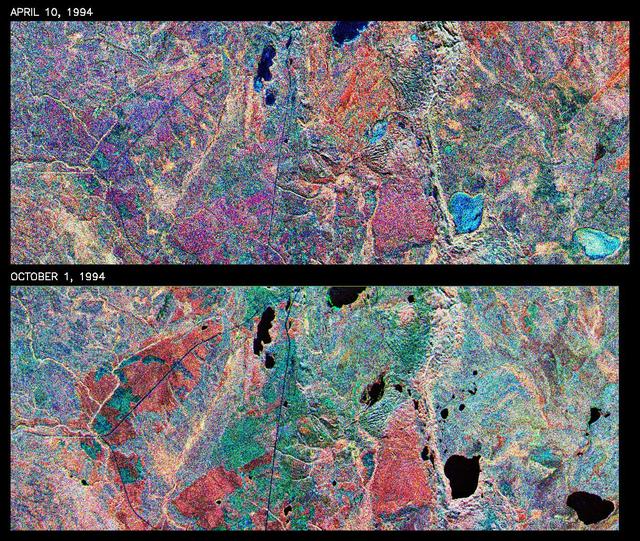
This pair of images illustrates the ability of multi-parameter radar imaging sensors such as the Spaceborne Imaging Radar-C/X-band Synthetic Aperture radar to detect climate-related changes on the Patagonian ice fields in the Andes Mountains of Chile and Argentina. The images show nearly the same area of the south Patagonian ice field as it was imaged during two space shuttle flights in 1994 that were conducted five-and-a-half months apart. The images, centered at 49.0 degrees south latitude and 73.5degrees west longitude, include several large outlet glaciers. The images were acquired by SIR-C/X-SAR on board the space shuttle Endeavour during April and October 1994. The top image was acquired on April 14, 1994, at 10:46 p.m. local time, while the bottom image was acquired on October 5,1994, at 10:57 p.m. local time. Both were acquired during the 77th orbit of the space shuttle. The area shown is approximately 100 kilometers by 58 kilometers (62 miles by 36 miles) with north toward the upper right. The colors in the images were obtained using the following radar channels: red represents the C-band (horizontally transmitted and received); green represents the L-band (horizontally transmitted and received); blue represents the L-band (horizontally transmitted and vertically received). The overall dark tone of the colors in the central portion of the April image indicates that the interior of the ice field is covered with thick wet snow. The outlet glaciers, consisting of rough bare ice, are the brightly colored yellow and purple lobes which terminate at calving fronts into the dark waters of lakes and fiords. During the second mission the temperatures were colder and the corresponding change in snow and ice conditions is readily apparent by comparing the images. The interior of the ice field is brighter because of increased radar return from the dryer snow. The distinct green/orange boundary on the ice field indicates an abrupt change in the structure of the snowcap, a direct indication of the steep meteorological gradients known to exist in this region. The bluer color of the outlet glaciers is probably due to a thin snow cover. A portion of the terminus of the outlet glacier at the top left center of the images has advanced approximately 600 meters (1,970 feet) in the five-and-a-half months between the two missions. Because of the persistent cloud cover this observation was only possible by using the orbiting, remote imaging radar system. http://photojournal.jpl.nasa.gov/catalog/PIA01778
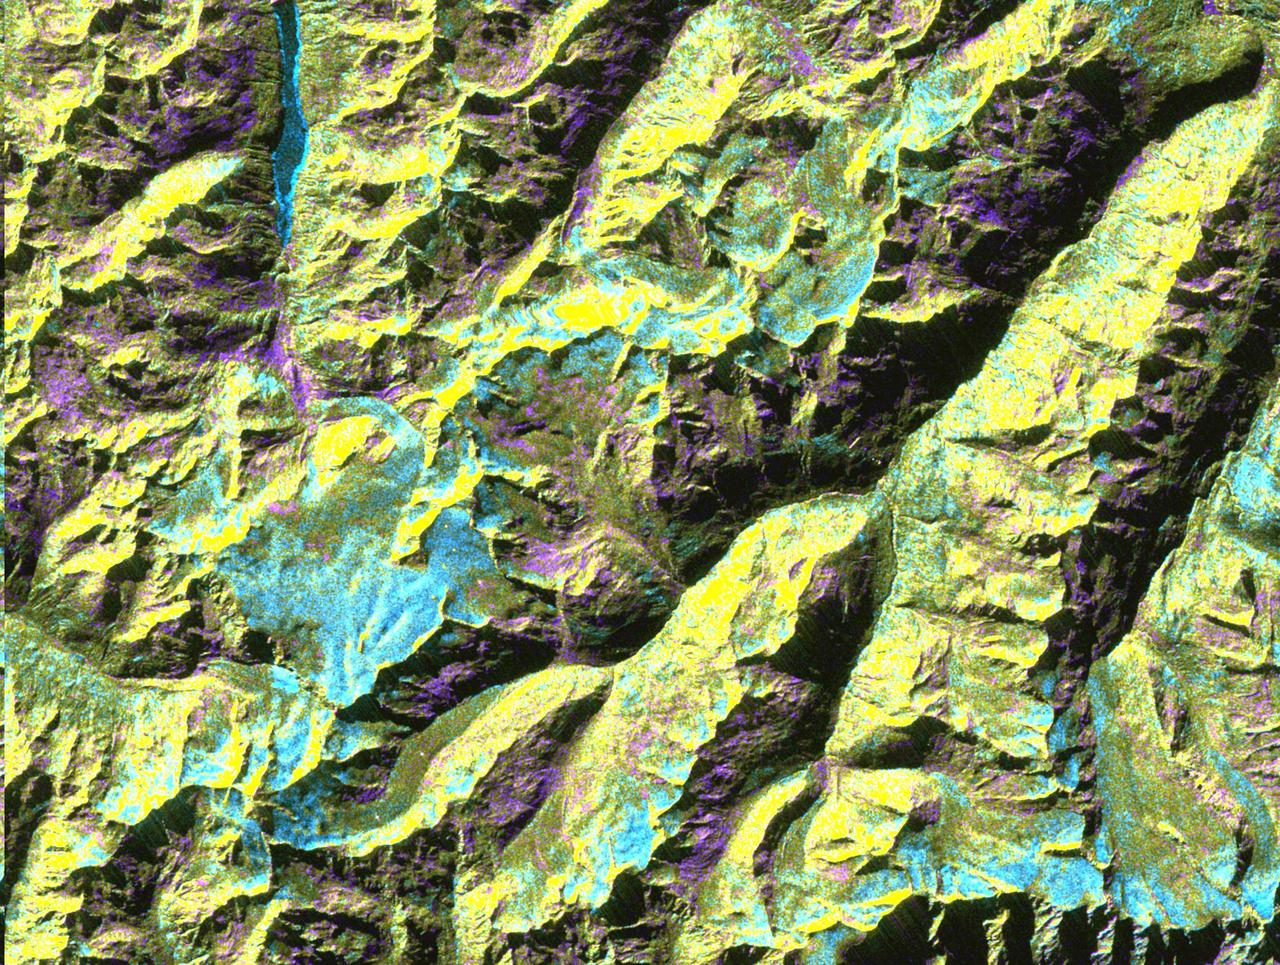
This is a digital elevation model that was geometrically coded directly onto an X-band seasonal change image of the Oetztal supersite in Austria. The image is centered at 46.82 degrees north latitude and 10.79 degrees east longitude. This image is located in the Central Alps at the border between Switzerland, Italy and Austria, 50 kilometers (31 miles) southwest of Innsbruck. It was acquired by the Spaceborne Imaging Radar-C/X-band Synthetic Aperture aboard the space shuttle Endeavour on April 14, 1994 and on October 5, 1994. It was produced by combining data from these two different data sets. Data obtained in April is green; data obtained in October appears in red and blue, and was used as an enhancement based on the ratio of the two data sets. Areas with a decrease in backscatter from April to October appear in light blue (cyan), such as the large Gepatschferner glacier seen at the left of the image center, and most of the other glaciers in this view. A light blue hue is also visible at the east border of the dark blue Lake Reschensee at the upper left side. This shows a significant rise in the water level. Magenta represents areas with an increase of backscatter from April 10 to October 5. Yellow indicates areas with high radar signal response during both passes, such as the mountain slopes facing the radar. Low radar backscatter signals refer to smooth surface (lakes) or radar grazing areas to radar shadow areas, seen in the southeast slopes. The area is approximately 29 kilometers by 21 kilometers (18 miles by 13.5 miles). The summit of the main peaks reaches elevations of 3,500 to 3,768 meters (xx feet to xx feet) above sea level. The test site's core area is the glacier region of Venter Valley, which is one of the most intensively studied areas for glacier research in the world. Research in Venter Valley (below center) includes studies of glacier dynamics, glacier-climate regions, snowpack conditions and glacier hydrology. About 25 percent of the core test site is covered by glaciers. Corner reflectors are set up for calibration. Five corner reflectors can be seen on the Gepatschferner and two can be seen on the Vernagtferner. http://photojournal.jpl.nasa.gov/catalog/PIA01760
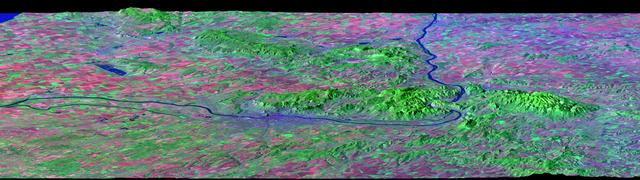
After draining the northern flank of the Alps Mountains in Germany and Austria, the Danube River flows east as it enters this west-looking scene (upper right) and forms the border between Slovakia and Hungary. The river then leaves the border as it enters Hungary and transects the Transdanubian Mountains, which trend southwest to northeast. Upon exiting the mountains, the river turns southward, flowing past Budapest (purplish blue area) and along the western margin of the Great Hungarian Plain. South and west of the Danube, the Transdanubian Mountains have at most only about 400 meters (about 1300 feet) of relief but they exhibit varied landforms, which include volcanic, tectonic, fluvial (river), and eolian (wind) features. A thick deposit of loess (dust deposits likely blown from ancient glacial outwash) covers much of this area, and winds from the northwest, funneled between the Alps and the Carpathian Mountains, are apparently responsible for a radial pattern of erosional streaks across the entire region. This image was generated from a Landsat satellite image draped over an elevation model produced by the Shuttle Radar Topography Mission (SRTM). The view uses a 3-times vertical exaggeration to enhance topographic expression. The false colors of the scene result from displaying Landsat bands 1, 4, and 7 in blue, green, and red, respectively. Band 1 is visible blue light, but bands 4 and 7 are reflected infrared light. This band combination maximizes color contrasts between the major land cover types, namely vegetation (green), bare ground (red), and water (blue). Shading of the elevation model was used to further highlight the topographic features. http://photojournal.jpl.nasa.gov/catalog/PIA04952
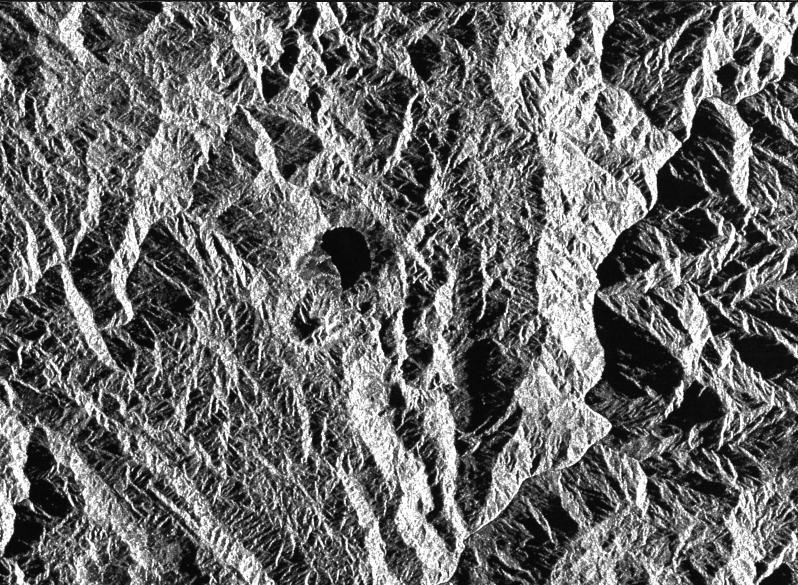
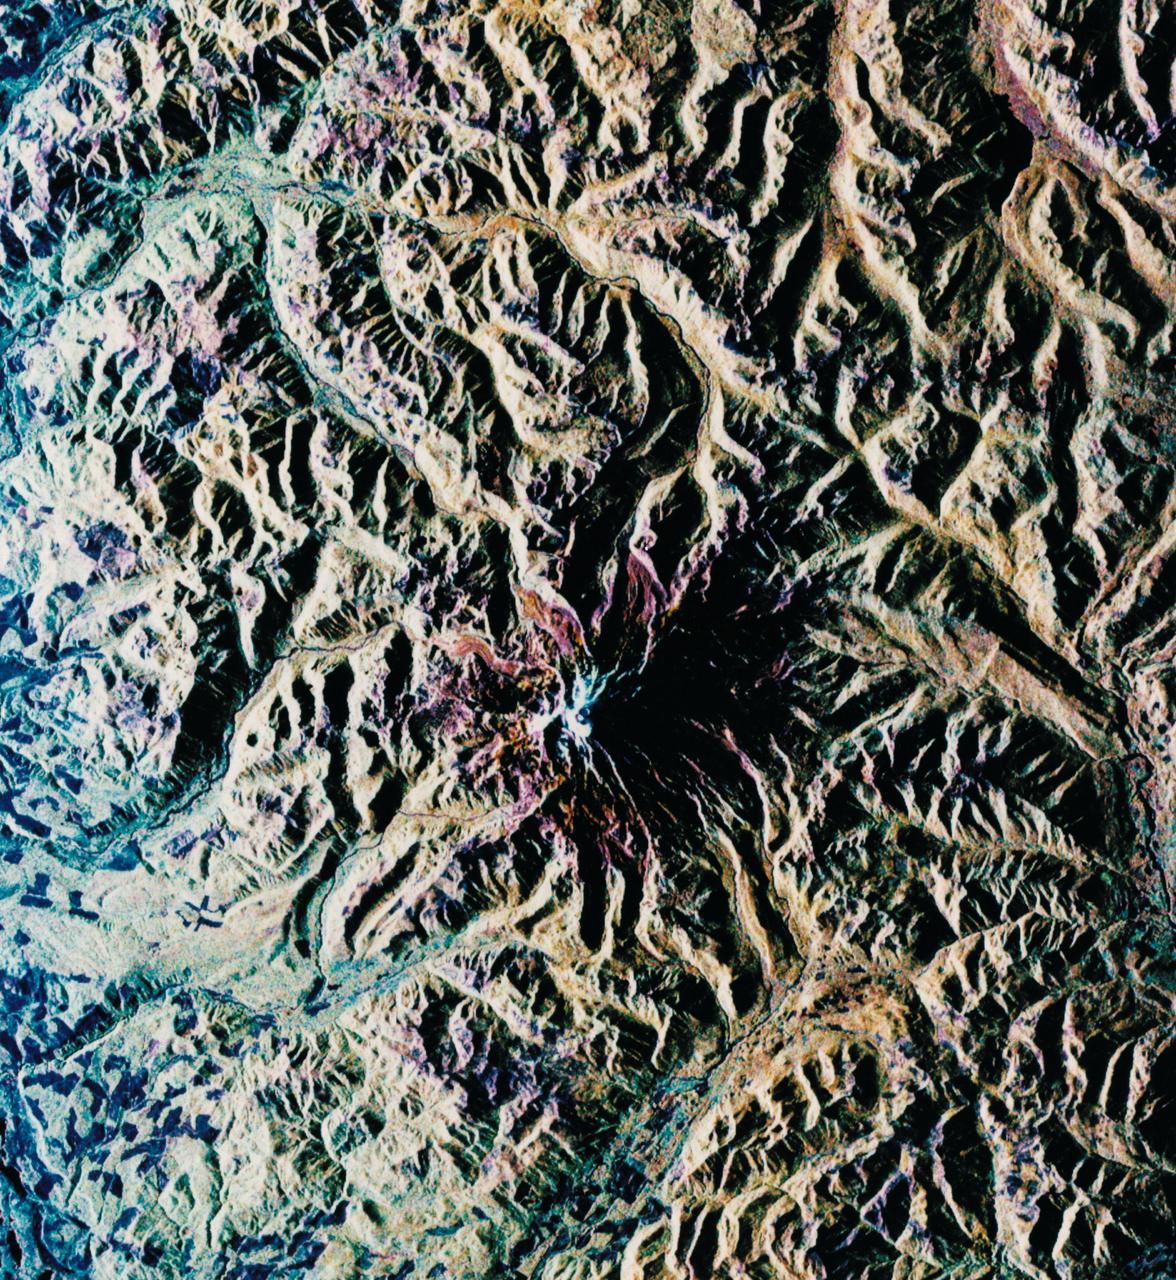
This is a radar image of a little known volcano in northern Colombia. The image was acquired on orbit 80 of space shuttle Endeavour on April 14, 1994, by NASA Spaceborne Imaging Radar C/X-Band Synthetic Aperture Radar SIR-C/X-SAR. The volcano near the center of the image is located at 5.6 degrees north latitude, 75.0 degrees west longitude, about 100 kilometers (65 miles) southeast of Medellin, Colombia. The conspicuous dark spot is a lake at the bottom of an approximately 3-kilometer-wide (1.9-mile) volcanic collapse depression or caldera. A cone-shaped peak on the bottom left (northeast rim) of the caldera appears to have been the source for a flow of material into the caldera. This is the northern-most known volcano in South America and because of its youthful appearance, should be considered dormant rather than extinct. The volcano's existence confirms a fracture zone proposed in 1985 as the northern boundary of volcanism in the Andes. The SIR-C/X-SAR image reveals another, older caldera further south in Colombia, along another proposed fracture zone. Although relatively conspicuous, these volcanoes have escaped widespread recognition because of frequent cloud cover that hinders remote sensing imaging in visible wavelengths. Four separate volcanoes in the Northern Andes nations of Colombia and Ecuador have been active during the last 10 years, killing more than 25,000 people, including scientists who were monitoring the volcanic activity. Detection and monitoring of volcanoes from space provides a safe way to investigate volcanism. The recognition of previously unknown volcanoes is important for hazard evaluations because a number of major eruptions this century have occurred at mountains that were not previously recognized as volcanoes. http://photojournal.jpl.nasa.gov/catalog/PIA01722
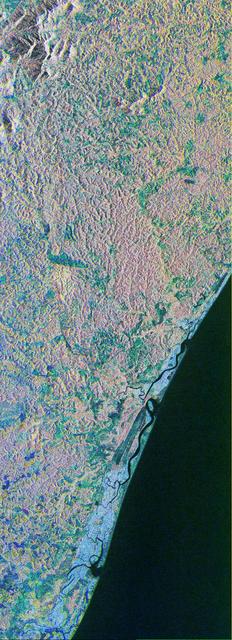
This is a color composite image of southern Bahia, Brazil, centered at 15.22 degree south latitude and 39.07 degrees west longitude. The image was acquired by the Spaceborne Imaging Radar-C/X-band Synthetic Aperture Radar aboard the space shuttle Endeavour on its 38th orbit of Earth on October 2, 1994. The image covers an area centered over the Una Biological Reserve, one the largest protected areas in northeastern Brazil. The 7,000-hectare reserve is administered by the Brazilian Institute for the Environment and is part of the larger Atlantic coastal forest, a narrow band of rain forest extending along the eastern coast of Brazil. The Atlantic coastal forest of southern Bahia is one of the world's most threatened and diverse ecosystems. Due to widespread settlement, only 2 to 5 percent of the original forest cover remains. Yet the region still contains an astounding variety of plants and animals, including a large number of endemic species. More than half of the region's tree species and 80 percent of its animal species are indigenous and found nowhere else on Earth. The Una Reserve is also the only federally protected habitat for the golden-headed lion tamarin, the yellow-breasted capuchin monkey and many other endangered species. In the past few years, scientists from Brazilian and international conservation organizations have coordinated efforts to study the biological diversity of this region and to develop practical and economically viable options for preserving the remaining primary forests in southern Bahia. The shuttle imaging radar is used in this study to identify various land uses and vegetation types, including remaining patches of primary forest, cabruca forest (cacao planted in the understory of the native forest), secondary forest, pasture and coastal mangrove. Standard remote-sensing technology that relies on light reflected from the forest canopy cannot accurately distinguish between cabruca and undisturbed forest. Optical remote sensing is also limited by the nearly continuous cloud cover in the region and heavy rainfall, which occurs more than 150 days each year. The ability of the shuttle radars to "see" through the forest canopy to the cultivated cacao below -- independent of weather or sunlight conditions --will allow researchers to distinguish forest from cabruca in unprecedented detail. This SIR-C/X-SAR image was produced by assigning red to the L-band, green to the C-band and blue to the X-band. The Una Reserve is located in the middle of the image west of the coastline and slightly northwest of Comandatuba River. The reserve's primary forests are easily detected by the pink areas in the image. The intensity of red in these areas is due to the high density of forest vegetation (biomass) detected by the radar's L-band (horizontally transmitted and vertically received) channel. Secondary forest is visible along the reserve's eastern border. The Serrado Mar mountain range is located in the top left portion of the image. Cabruca forest to the west of Una Reserve has a different texture and a yellow color. The removal of understory in cabruca forest reduces its biomass relative to primary forest, which changes the L-band and C-band penetration depth and returns, and produces a different texture and color in the image. The region along the Atlantic is mainly mangrove swamp, agricultural fields and urban areas. The high intensity of blue in this region is a result of increasing X-band return in areas covered with swamp and low vegetation. The image clearly separates the mangrove region (east of coastal Highway 001, shown in blue) from the taller and dryer forest west of the highway. The high resolution capability of SIR-C/X-SAR imaging and the sensitivity of its frequency and polarization channels to various land covers will be used for monitoring and mapping areas of importance for conservation. http://photojournal.jpl.nasa.gov/catalog/PIA01764
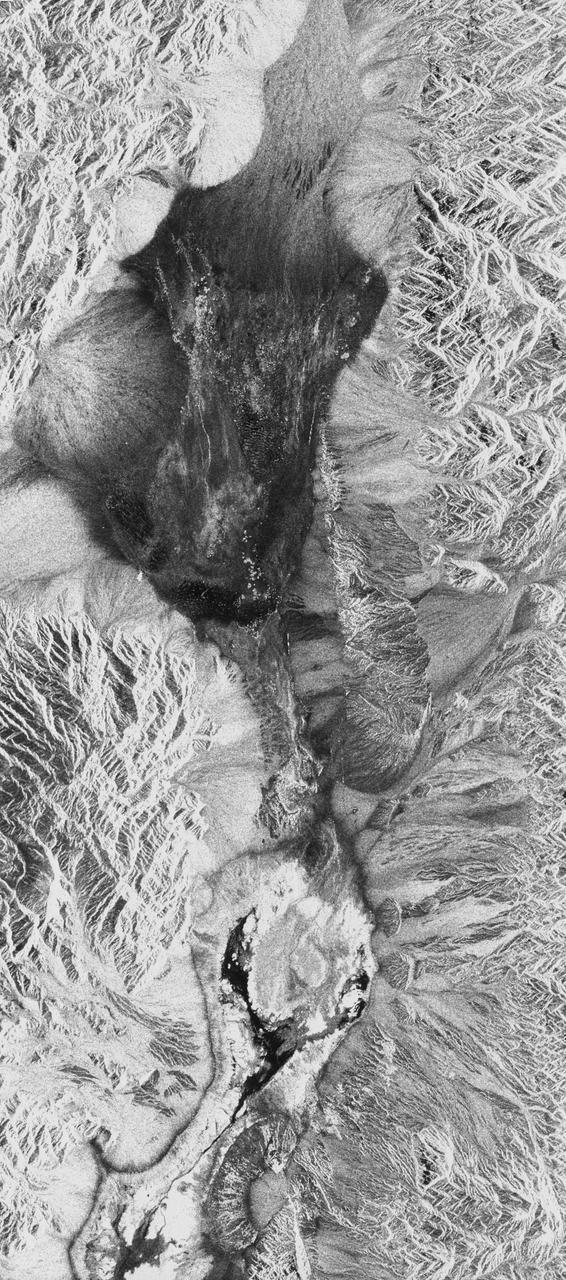
STS059-S-026 (11 April 1994) --- This is an image of Death Valley, California, centered at 36.629 degrees north latitude, 117.069 degrees west longitude. The image shows Furnace Creek alluvial fan and Furnace Creek Ranch at the far right, and the sand dunes near Stove Pipe Wells at the center. The dark fork-shaped feature between Furnace Creek fan and the dunes is a smooth flood-plain which encloses Cottonball Basin. The SIR-C/X-SAR supersite is an area of extensive field investigations and has been visited by both Space Radar Lab astronaut crews. Elevations in the Valley range from 70 meters below sea level, the lowest in the United States, to more than 3300 meters above sea level. Scientists are using SIR-C/X-SAR data from Death Valley to help answer a number of different questions about the Earth's geology. One question concerns how alluvial fans are formed and change through time under the influence of climatic changes and earthquakes. Alluvial fans are gravel deposits that wash down from the mountains over time. They are visible in the image as circular, fan-shaped bright areas extending into the darker valley floor from the mountains. Information about the alluvial fans help scientists study Earth's ancient climate. Scientists know the fans are bulit up through climatic and tectonic processes and they will use the SIR-C/X-SAR data to understand the nature and rates of weathering processes on the fans, soil formation, and the transport of sand and dust by the wind. SIR-C/X-SAR's sensitivity to centimeter-scale (or inch-scale) roughness provides detailed maps of surface texture. Such information can be used to study the occurrence and movement of dust storms and sand dunes. the goal of these studies is to gain a better understanding of the record of past climatic changes and the effects of those changes on a sensitive environment. This may lead to a better ability to predict future response of the land to different potential global cimate-change scenarios. Death Valley is also one of the primary calibration sites for SIR-C/X-SAR. The bright dots near the center of the image are corner reflectors that have been set-up to calibrate the radar as the Shuttle passes overhead. Thirty triangular-shaped reflectors (they look like aluminum pyramids) have been deployed by the calibration team from JPL over a 40 kilometer by 40 kilometer area in and around Death Valley. The calibration team will also deploy transponders (electronic reflectors) and recievers to measure the radar signals from SIR-C/X-SAR on the ground. Spaceborne Imaging Radar-C and X-Synthetic Aperture Radar (SIR-C/X-SAR) is part of NASA's Mission to Planet Earth (MTPE). The radars illuminate Earth with microwaves allowing detailed observations at any time, regardless of weather or sunlight conditions. SIR-C/X-SAR uses three microwave wavelengths: L-Band (24 cm), C-Band (6 cm), and X-Band (3 cm). The multi-frequency data will be used by the international scientific community to better understand the global environment and how it is changing. The SIR-C/X-SAR data, complemented by aircraft and ground studies, will give scientists clearer insights into those environmental changes which are caused by nature and those changes which are induced by human activity. SIR-C was develpoed by NASA's Jet Propulsion Laboratory (JPL). X-SAR was developed by the Dornire and Alenia Spazio Companies for the German Space Agency, Deutsche Agentur fuer Raumfahrtangelegenheiten (DARA), and the Italian Space Agency, Agenzia Spaziale Italiana (ASI). JPL Photo ID: P-43883
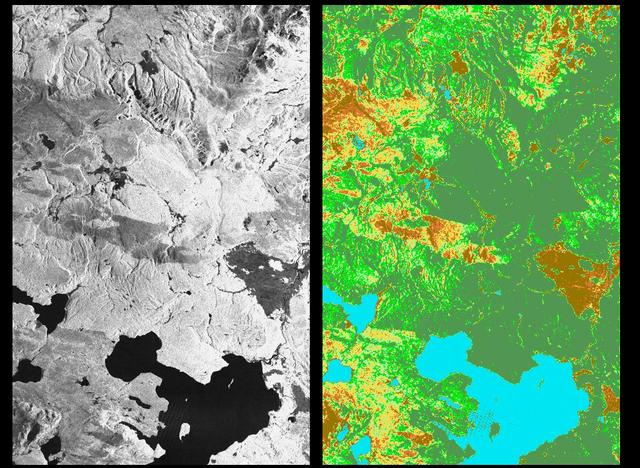
These two radar images show the majestic Yellowstone National Park, Wyoming, the oldest national park in the United States and home to the world's most spectacular geysers and hot springs. The region supports large populations of grizzly bears, elk and bison. In 1988, the park was burned by one of the most widespread fires to occur in the northern Rocky Mountains in the last 50 years. Surveys indicated that 793,880 acres of land burned. Of that, 41 percent was burned forest, with tree canopies totally consumed by the fire; 35 percent was a combination of unburned, scorched and blackened trees; 13 percent was surface burn under an unburned canopy; 6 percent was non-forest burn; and 5 percent was undifferentiated burn. Six years later, the burned areas are still clearly visible in these false-color radar images obtained by the Spaceborne Imaging Radar-C/X-band Synthetic Aperture Radar on board the space shuttle Endeavour. The image at the left was obtained using the L-band radar channel, horizontally received and vertically transmitted, on the shuttle's 39th orbit on October 2, 1994. The area shown is 45 kilometers by 71 kilometers (28 miles by 44 miles) in size and centered at 44.6 degrees north latitude, 110.7 degrees west longitude. North is toward the top of the image (to the right). Most trees in this area are lodge pole pines at different stages of fire succession. Yellowstone Lake appears as a large dark feature at the bottom of the scene. At right is a map of the forest crown, showing its biomass, or amount of vegetation, which includes foliage and branches. The map was created by inverting SIR-C data and using in situ estimates of crown biomass gathered by the Yellowstone National Biological Survey. The map is displayed on a color scale from blue (rivers and lakes with no biomass) to brown (non-forest areas with crown biomass of less than 4 tons per hectare) to light brown (areas of canopy burn with biomass of between 4 and 12 tons per hectare). Yellow indicates areas of canopy burn and mixed burn with a biomass of between 12 to 20 tons per hectare; light green is mixed burn and on-burn forest with a biomass of 20 to 35 tons per hectare; and green is non-burned forest with a biomass of greater than 35 tons per hectare. Forest recovery from the fire seems to depend on fire intensity and soil conditions. In areas of severe canopy burn and poor soil conditions, crown biomass was still low in 1994 (indicated by the brown areas at the center left), whereas in areas of mixed burn with nutrient-rich soils, seen west of Yellowstone Lake, crown biomass has increased significantly in six years (indicated by the yellow and light green areas). Imaging fire-affected regions with spaceborne radar illustrates SIR-C/X-SAR's keen abilities to monitor regrowth after a fire. Knowing the amount of carbon accumulated in the atmosphere by regenerating forest in the 20 to 50 years following a fire disturbance is also a significant factor in understanding the global carbon cycle. Measuring crown biomass is necessary to evaluate the effects of past and future fires in specific regions. http://photojournal.jpl.nasa.gov/catalog/PIA01741
This is a comparison of images over Prince Albert, produced by NASA Spaceborne Imaging Radar-C and X-band Synthetic Aperture Radar aboard the space shuttle Endeavour on its 20th orbit on April 10, 1994. The area is centered at 53.91 degrees north latitude and 104.69 degrees west longitude and is located 40 kilometers (25 miles) north and 30 kilometers (18.5 miles) east of the town of Prince Albert in the Saskatchewan province of Canada. The image covers the area east of Candle Lake, between the gravel highway of 120 and west of highway 106. The area imaged is near the southern limit of the boreal forest. The boreal forest of North America is a continuous vegetation belt at high latitudes stretching across the continent from the Atlantic shoreline of central Labrador and then westward across Canada to the interior mountains and central coastal plains of Alaska. The forest is also part of a larger northern hemisphere circumpolar boreal forest belt. Coniferous trees dominate the entire forest but deciduous trees are also present. During the month of April, the forest experiences seasonal changes from a frozen condition to a thawed condition. The trees are completely frozen over the winter season and the forest floor is covered by snow. As the average temperature rises in the spring, the trees are thawed and the snow melts. This transition has an impact on the rate of moisture evaporation and release of carbon dioxide into the atmosphere. In late September and early October, the boreal forest experiences a relatively different seasonal change. At this time, the leaves on deciduous trees start changing color and dropping off. The soil and trees are quite often moist due to frequent rainfall and cloud cover. The evaporation of moisture and carbon dioxide into the atmosphere also diminishes at this time. SIR-C/X-SAR is sensitive to the moisture of soil and vegetation and can sense this freeze-thaw cycle and the summer-fall seasonal transition over forested areas in particular. Optical sensors, by contrast, are blind to these regions, which are perpetually obscured by thick cloud cover. These changes were detected by comparing the April and October color composite images of L-band data in red, C-band data in green and X-band (vertically received and transmitted) in blue. The changes in intensity of each color over lakes, various forest stands and clear cuts in the two images is striking. Lakes such as Lake Heiberg, Crabtree Lake and Williams Lake, in the right middle part of the image, are frozen in April (appearing in bright blue) and melted (appearing in black) in October. The higher intensity of blue over lakes in April is due to low penetration of the X-band (vertically received and transmitted) and the radar's high sensitivity to surface features. Forest stands also exhibit major changes between the two images. The red areas in the October image are old jack pine canopies that cause higher return at L-band because of their moist condition in late summer compared to their partially frozen condition in April (in purple). Similarly, in the areas near the middle of the image, where black spruce and mixed aspen and jack pine trees dominate, the contrast between blue in October and red and green in April is an indication that the top of the canopy (needles and branches) were frozen in April and moist in October. The changes due to deforestation by logging companies or natural fires can also be detected by comparing the images. For example, the small blue area near the intersection of Harding Road and Highway 120 is the result of logging which occurred after the April data was acquired. The surface area of clear cut is approximately 4 hectares, which is calculated from the high-resolution capability of the radar images and verified by scientists participating in field work during the mission. http://photojournal.jpl.nasa.gov/catalog/PIA01732
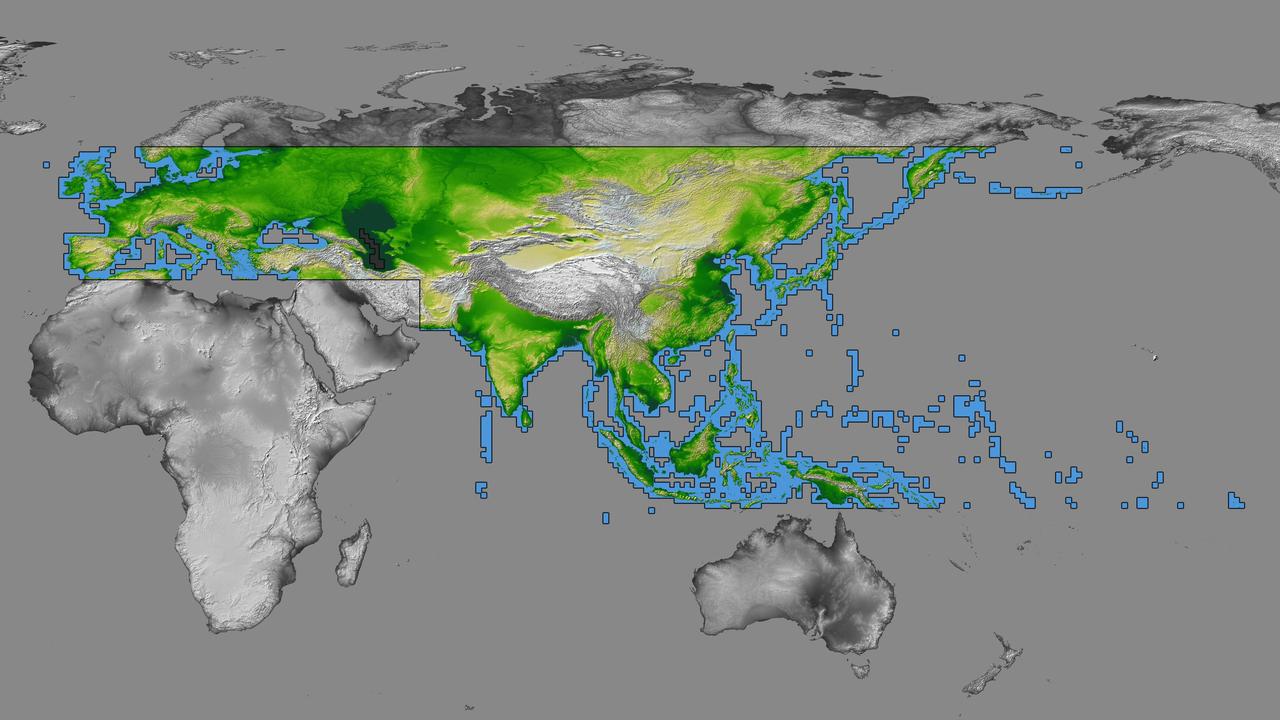
inal Caption Released with Image: The colored regions of this map show the extent of digital elevation data recently released by the Shuttle Radar Topography Mission (SRTM). This release includes data for most of Europe and Asia plus numerous islands in the Indian and Pacific Oceans. SRTM flew on board the Space Shuttle Endeavour in February 2000 and used an interferometric radar system to map the topography of Earth's landmass between latitudes 56 degrees south and 60 degrees north. The data were processed into geographic "tiles," each of which represents one by one degree of latitude and longitude. A degree of latitude measures 111 kilometers (69 miles) north-south, and a degree of longitude measures 111 kilometers or less east-west, decreasing away from the equator. The data are being released to the public on a continent-by-continent basis. This Eurasia segment includes 5,940 tiles, more than a third of the total data set. Previous releases covered North America and South America. Forthcoming releases will include Africa-Arabia and Australia plus an "Islands" release for those islands not included in the continental releases. Together these data releases constitute the world's first high-resolution, near-global elevation model. The resolution of the publicly released data is three arcseconds (1/1,200 of a degree of latitude and longitude), which is about 90 meters (295 feet). European coverage in the current data release stretches eastward from the British Isles and the Iberian Peninsula in the west, across the Alps and Carpathian Mountains, as well as the Northern European Plain, to the Ural and Caucasus Mountains bordering Asia. The Asian coverage includes a great diversity of landforms, including the Tibetan Plateau, Tarin Basin, Mongolian Plateau, and the mountains surrounding Lake Baikal, the world's deepest lake. Mt. Everest in the Himalayas, at 8,848 meters (29,029 feet) is the world's highest mountain. From India's Deccan Plateau, to Southeast Asia, coastal China, and Korea, various landforms place constraints upon land use planning for a great population. Volcanoes in the East Indies, the Philippines, Japan, and the Kamchatka Peninsula form the western part of the "Ring of Fire" around the Pacific Ocean. Many of these regions were previously very poorly mapped due to persistent cloud cover or the inaccessibility of the terrain. Digital elevation data, such as provided by SRTM, are particularly in high demand by scientists studying earthquakes, volcanism, and erosion patterns for use in mapping and modeling hazards to human habitation. But the shape of Earth's surface affects nearly every natural process and human endeavor that occurs there, so elevation data are used in a wide range of applications. In this index map color-coding is directly related to topographic height, with green at the lower elevations, rising through yellow and tan, to white at the highest elevations. The large, very dark green feature in western Asia is the Caspian Sea, which is below sea level. Blue areas on the map represent water within the mapped tiles, each of which includes shorelines or islands. http://photojournal.jpl.nasa.gov/catalog/PIA03398
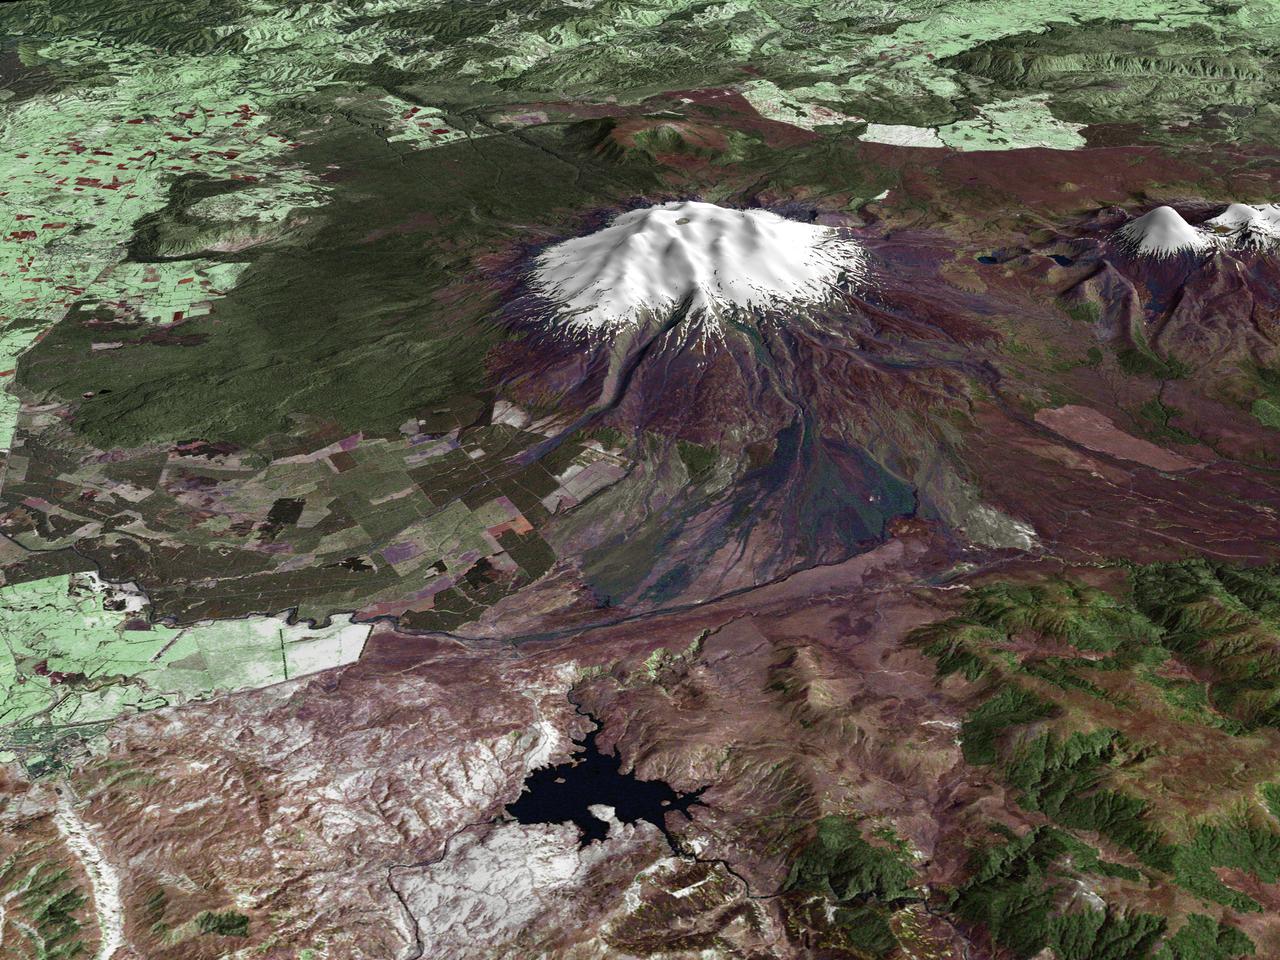
All around the world, people live in places where the threat of natural disaster is high. On the North Island of New Zealand, the Mount Ruapehu volcano is just such a threat. A towering, active stratovolcano (the classic cone-shaped volcano), snow-capped Ruapehu Volcano is pictured in this enhanced-color image. The image is made from topography data collected by the Shuttle Radar Topography Mission aboard the Space Shuttle Endeavour, launched on February 11, 2000, and imagery collected by the Landsat satellite on October 23, 2002. Ruapehu is one of New Zealand’s most active volcanoes, with ten eruptions since 1861. The eruptions aren’t the only threat from the volcano, however. Among the most serious threats is a volcanic mudflow called a lahar. In between eruptions, a lake forms in the volcano’s caldera from melting snow. If a previous eruption has deposited a dam of ash, rocks and mud in the lake’s natural overflow point, then the lake becomes dangerously full, held back only by the temporary dam. In this scene, the lake is nestled among the ridges at the top of the volcano. Eventually, the dam gives way and a massive flow of mud and debris churns down the mountain toward farmland and towns below. Scientists estimate that Ruapehu has experienced 60 lahars in the last 150 years. A devastating lahar in 1953 killed more than 150 people, who died when a passenger train plunged into a ravine when a railroad bridge was taken out by the lahar. The flank of the volcano below the lake is deeply carved by the path of previous lahars; the gouge can be seen just left of image center. Currently scientists in the region are predicting that the lake will overflow in a lahar sometime in the next year. There is great controversy about how to deal with the threat. News reports from the region indicate that the government is planning to invest in a high-tech warning system that will alert those who might be affected well in advance of any catastrophic release. Others feel that the government should combat the threat through engineering at the top of the mountain, for example, by undertaking a controlled release of the lake. Credit Landsat data provided courtesy of the University of Maryland Global Land Cover Facility Landsat processing by Laura Rocchio, Landsat Project Science Office SRTM 3-arcsecond elevation data courtesy of SRTM Team NASA/JPL/NIMA Visualization created by Earth Observatory staff. <b><a href="http://www.nasa.gov/centers/goddard/home/index.html" rel="nofollow">NASA Goddard Space Flight Center</a></b> enables NASA’s mission through four scientific endeavors: Earth Science, Heliophysics, Solar System Exploration, and Astrophysics. Goddard plays a leading role in NASA’s accomplishments by contributing compelling scientific knowledge to advance the Agency’s mission. <b>Follow us on <a href="http://twitter.com/NASA_GoddardPix" rel="nofollow">Twitter</a></b> <b>Join us on <a href="http://www.facebook.com/pages/Greenbelt-MD/NASA-Goddard/395013845897?ref=tsd" rel="nofollow">Facebook</a></b>
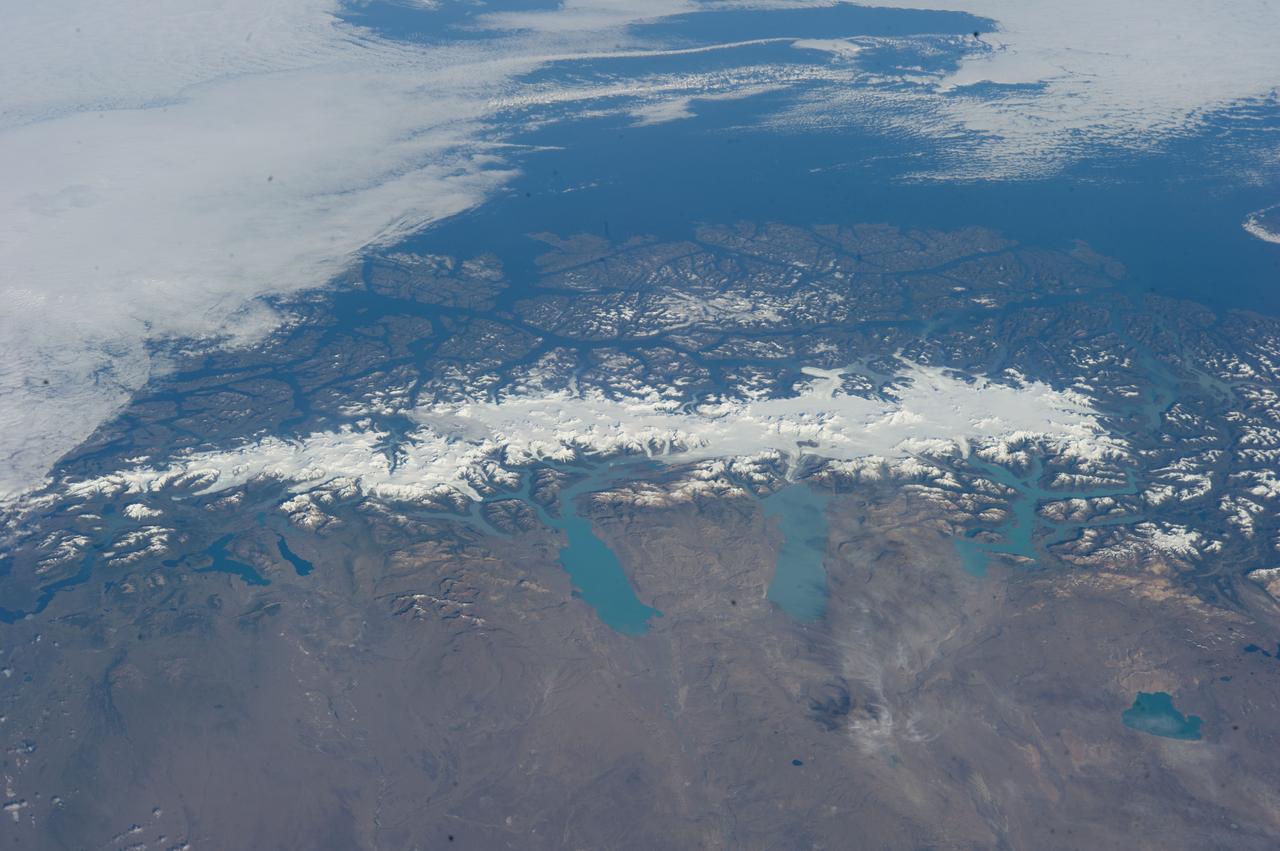
ISS038-E-047324 (13 Feb. 2014) --- This grand panorama of the Southern Patagonia Icefield (center) was imaged by an Expedition 38 crew member on the International Space Station on one of the rare clear days in the southern Andes Mountains. With an area of 13,000 square kilometers, the icefield is the largest temperate ice sheet in the Southern Hemisphere. Storms that swirl into the region from the southern Pacific Ocean (top) bring rain and snow (equivalent to a total of 2-11 meters of rainfall per year) resulting in the buildup of the ice sheet shown here (center). During the ice ages the glaciers were far larger. Geologists now know that ice tongues extended far onto the plains in the foreground, completely filling the great Patagonian lakes on repeated occasions. Similarly, ice tongues extended into the dense network of fjords (arms of the sea) on the Pacific side of the icefield. Ice tongues today appear tiny compared to the view that an "ice age" astronaut would have seen. A study of the surface topography of sixty-three glaciers, based on Shuttle Radar Topography Mission (SRTM) data, compared data from 2000 to data from studies going back about 30 years (1968-1975). Many glacier tongues showed significant annual "retreat" of their ice fronts, a familiar signal of climate change. The study also revealed that the almost invisible loss by glacier thinning is far more significant in explaining ice loss. The researchers concluded that volume loss by frontal collapse is 4-10 times smaller than that caused by thinning. Scaled over the entire icefield, including frontal loss (so-called calving when ice masses collapse into the lakes), it was calculated that 13.5 cubic kilometers of ice was lost each year over the study period. This number becomes more meaningful compared with the rate measured in the last five years of the study (1995-2000), when the rate increased almost threefold, averaging 38.7 cubic kilometers per year. Extrapolating results from the low altitude glacier tongues implies that the high plateau ice on the spine of the Andes is thinning as well. In the decade since this study the often-imaged Upsala Glacier has retreated a further three kilometers, as shown recently in images taken by crew members aboard the space station. Glacier Pio X, named for Pope Pius X, is the only large glacier that is growing in length.