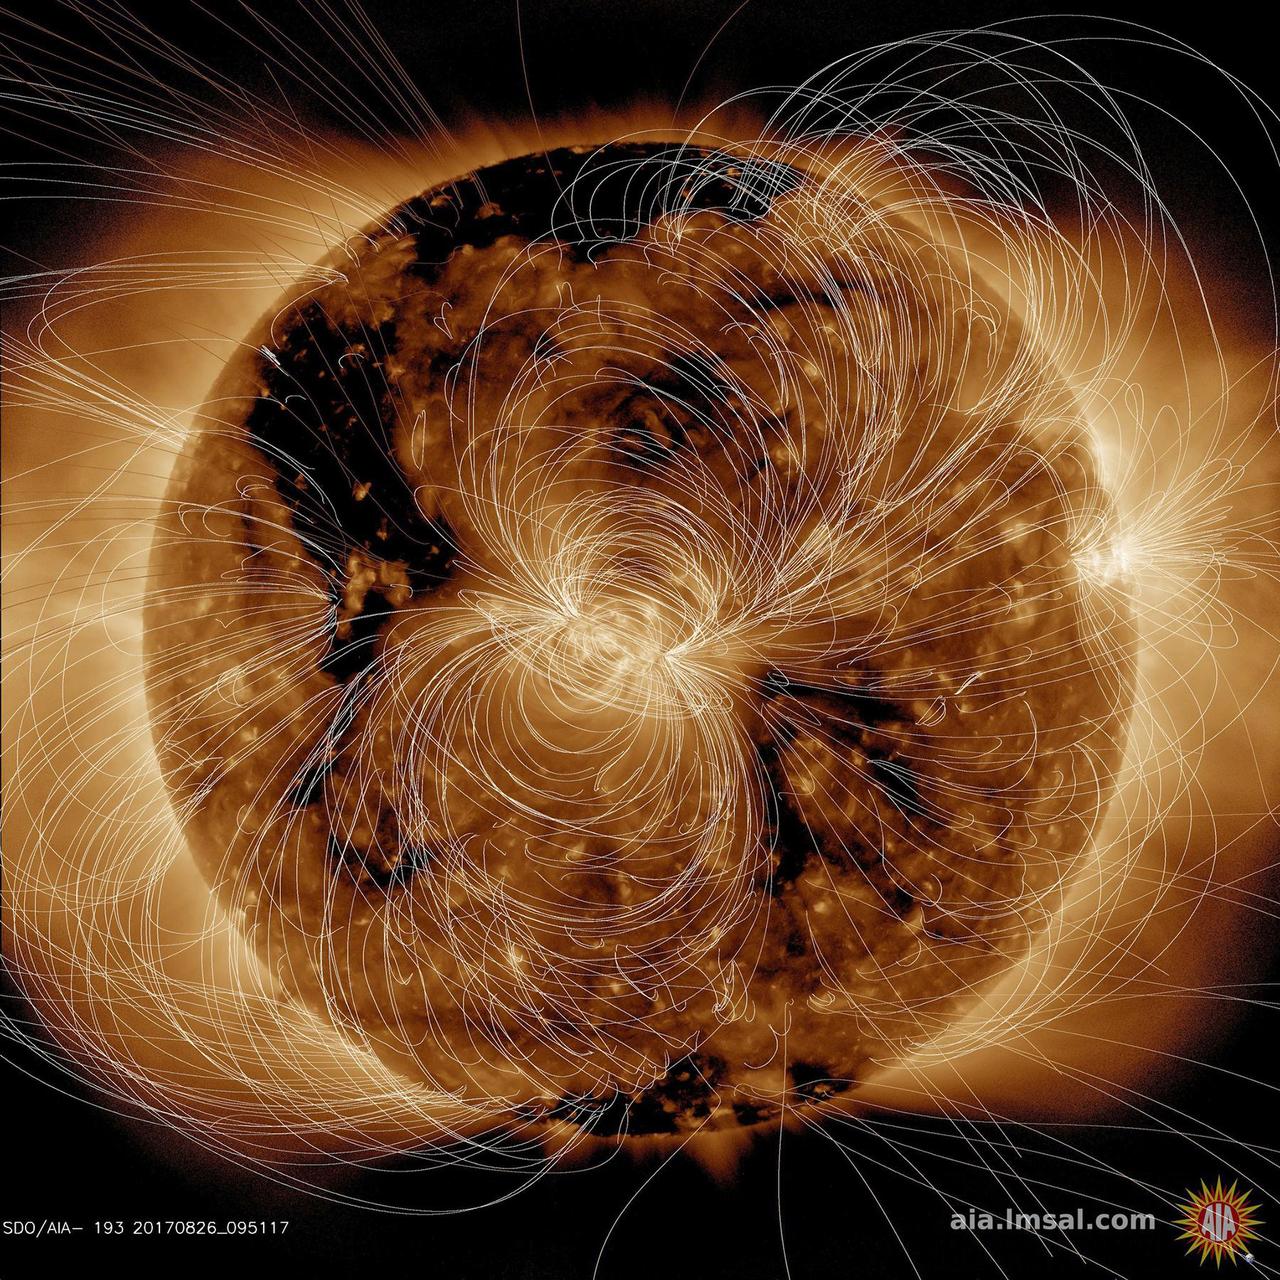
Scientists have developed a way to produce models of where the magnetic field lines are several times each day. Here we have created a time-lapse version of these models over four days (2-3 each day) to give you a peek at how these change over time. The spiraling arcs of magnetic field lines emerge from active regions and connect back to areas with the opposite polarity. The field lines are more concentrated where regions are more magnetically intense. And of course, they rotate with the rotation of the Sun. Credit: NASA/Solar Dynamics Observatory <b><a href="http://www.nasa.gov/audience/formedia/features/MP_Photo_Guidelines.html" rel="nofollow">NASA image use policy.</a></b> <b><a href="http://www.nasa.gov/centers/goddard/home/index.html" rel="nofollow">NASA Goddard Space Flight Center</a></b> enables NASA’s mission through four scientific endeavors: Earth Science, Heliophysics, Solar System Exploration, and Astrophysics. Goddard plays a leading role in NASA’s accomplishments by contributing compelling scientific knowledge to advance the Agency’s mission. <b>Follow us on <a href="http://twitter.com/NASAGoddardPix" rel="nofollow">Twitter</a></b> <b>Like us on <a href="http://www.facebook.com/pages/Greenbelt-MD/NASA-Goddard/395013845897?ref=tsd" rel="nofollow">Facebook</a></b> <b>Find us on <a href="http://instagram.com/nasagoddard?vm=grid" rel="nofollow">Instagram</a></b>
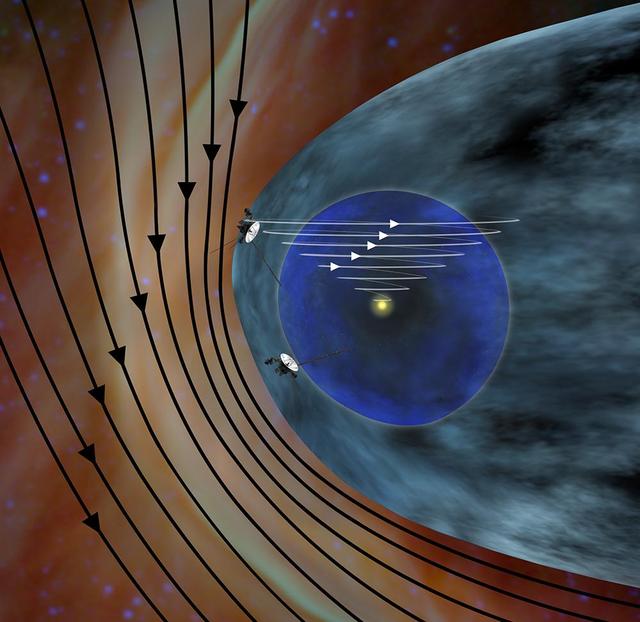
This artist concept shows the different expected directions of the magnetic fields in interstellar space black lines and the magnetic field emanating from our sun white lines as NASA Voyager 1 spacecraft travels northward out of the heliosphere.
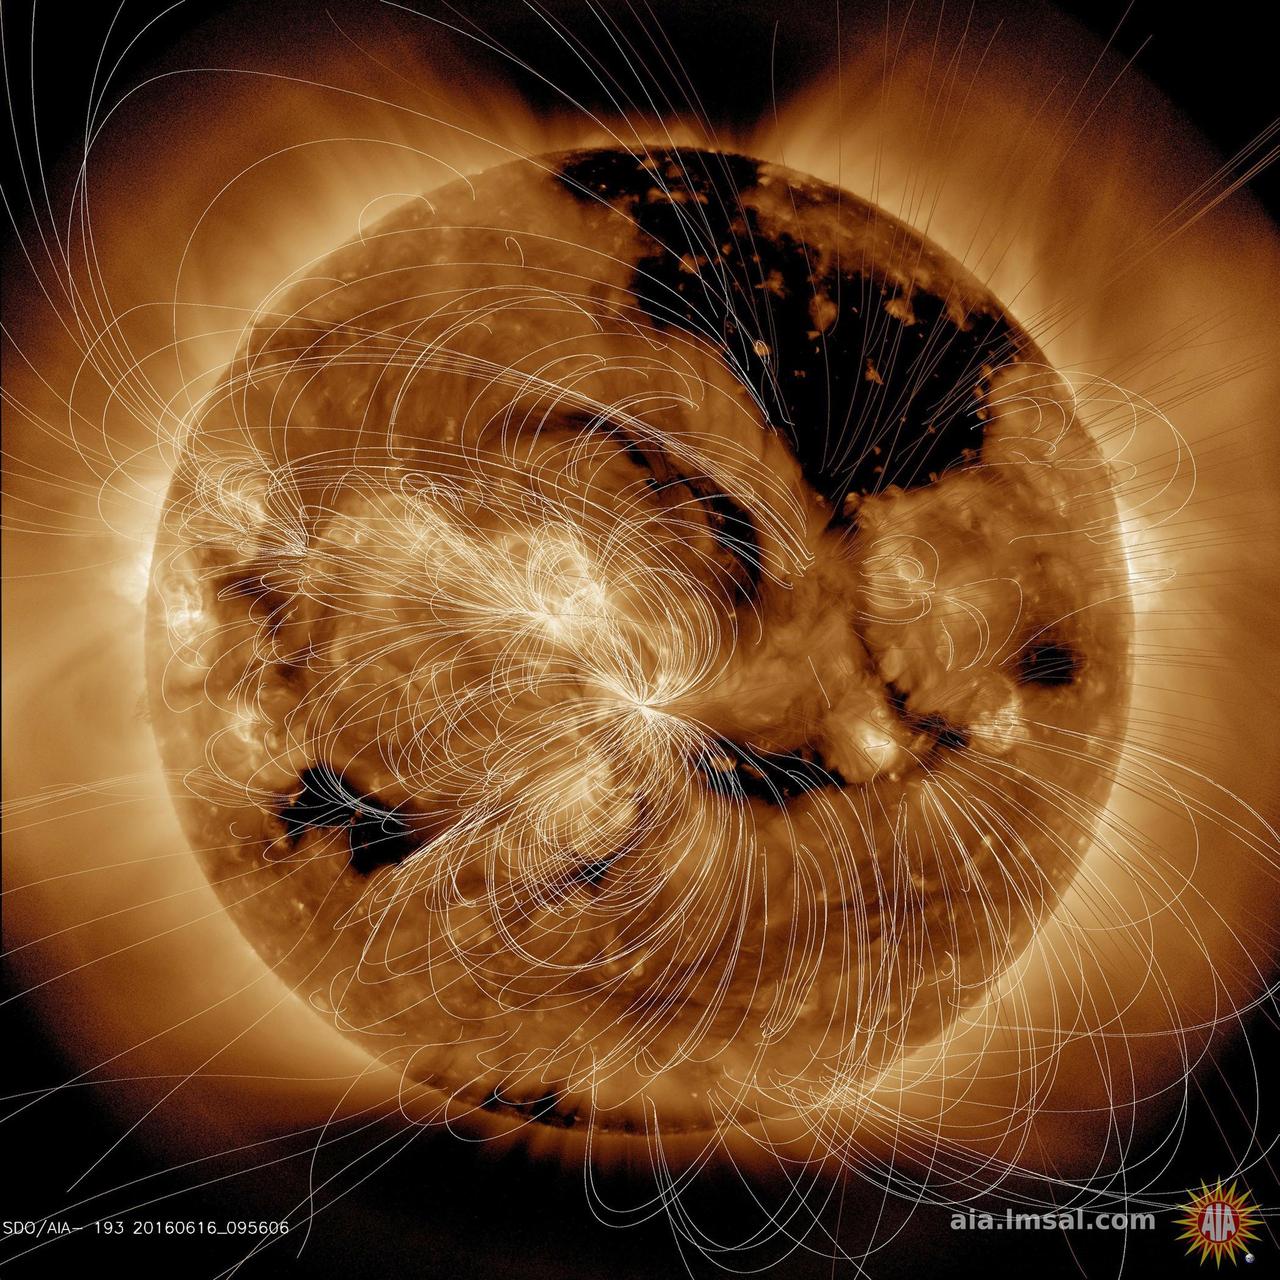
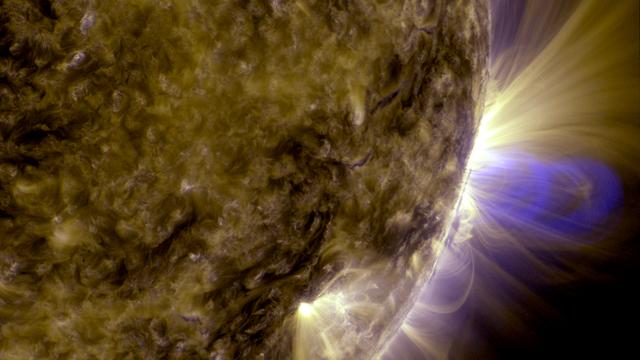
Each day NASA solar scientists produce overlays (in white lines) that show their estimation of how the magnetic field lines above the sun are configured (June16, 2016). In the video clip we show the sun in a wavelength of extreme ultraviolet light, then reveal the magnetic field line configuration in the same wavelength. Notice how the lines are tightly bundled near the lighter-toned active regions, which are magnetically intense regions. The magnetic lines from the darker areas, called coronal holes, open out into space and the extended lines show that. Our magnetically active sun is a dynamic body that changes all the time. Movie are also available at the Photojournal. http://photojournal.jpl.nasa.gov/catalog/PIA20881
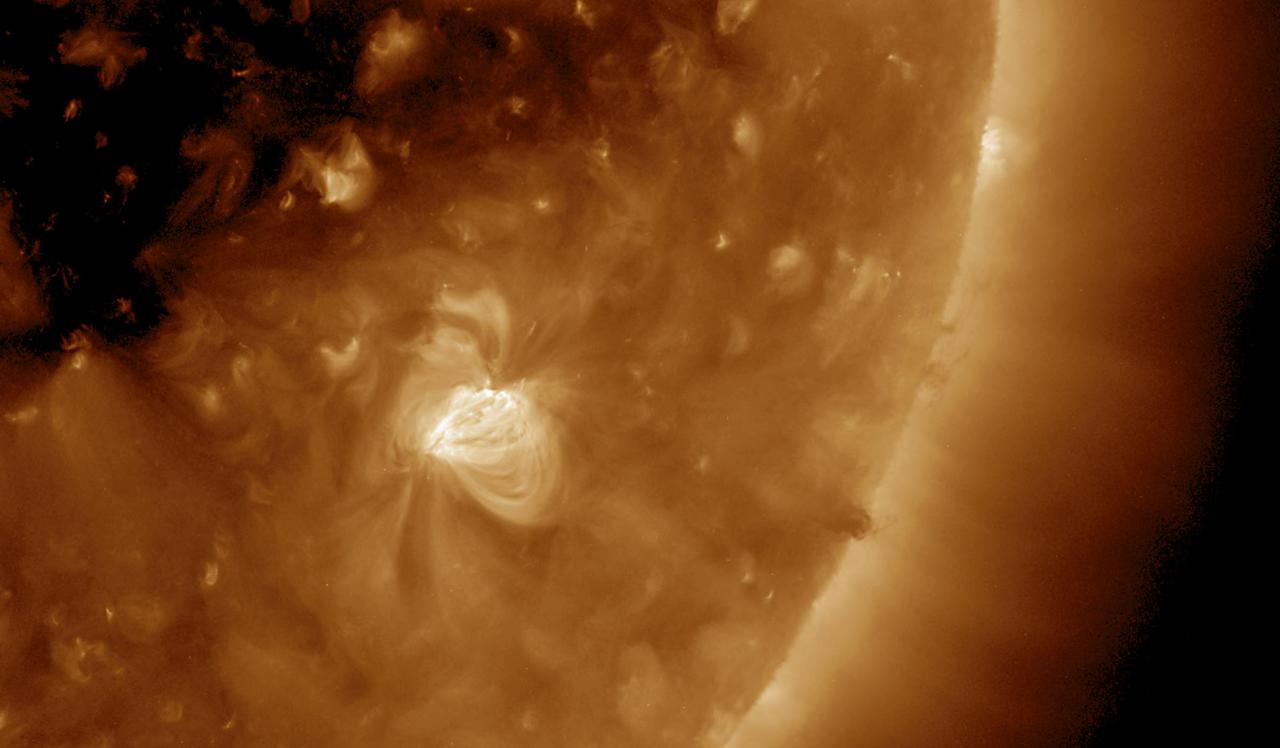
NASA's Solar Dynamics Observatory (SDO) scientists use their computer models to generate a view of the sun's magnetic field (Aug. 10, 2018). We took the opportunity to compare an extreme ultraviolet view of the sun with the same image showing the superimposed field lines. The bright active region right at the central area of the sun clearly shows a concentration of field lines, as well as the small active region at the sun's right edge, but to a lesser extent. Magnetism drives the dynamic activity near the sun's surface. Movies are available at https://photojournal.jpl.nasa.gov/catalog/PIA22662
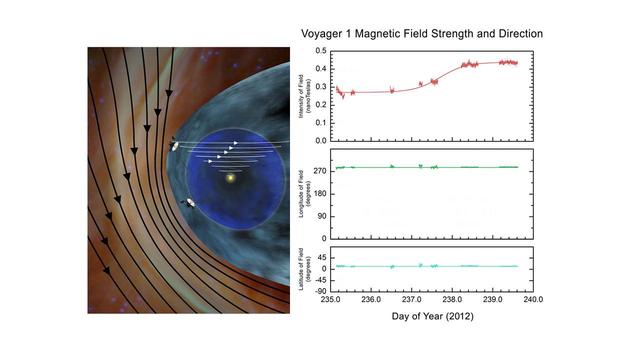
The artist concept on left is based on theoretical models predicting the direction and strength of magnetic field lines coming from the sun and interstellar space.
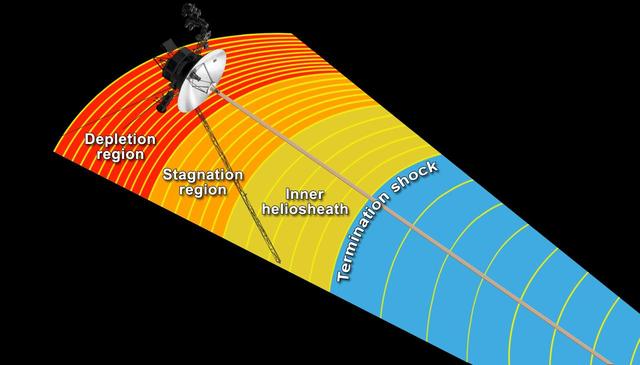
This artist concept shows NASA Voyager 1 spacecraft in a new region at the edge of our solar system where the magnetic field lines generated by our sun are piling up and intensifying.
This artist concept shows NASA Voyager 1 spacecraft in a new region at the edge of our solar system where the magnetic field lines generated by our sun are piling up and intensifying.
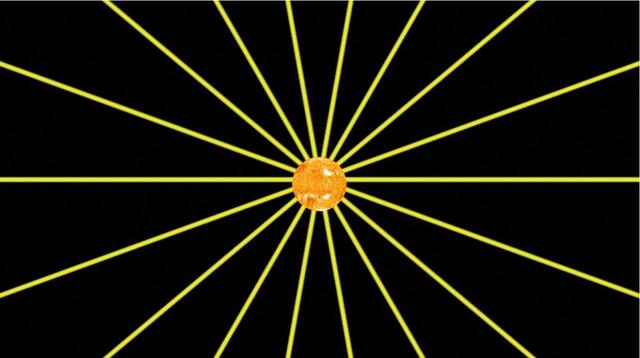
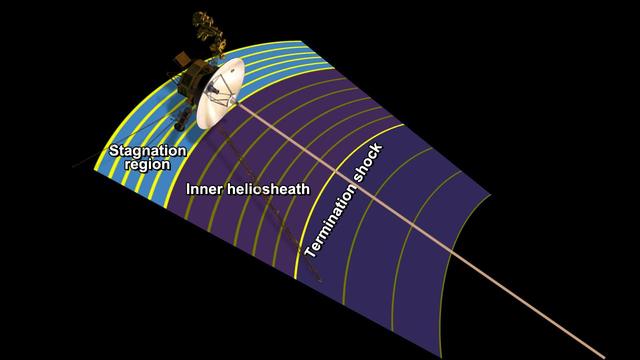
This frame from an animation shows how the magnetic field lines emanating from our sun spiral out into the solar system as the sun rotates. NASA Voyager 1 is in an area scientists are calling the stagnation region, at the outer layer of the heliosphere.

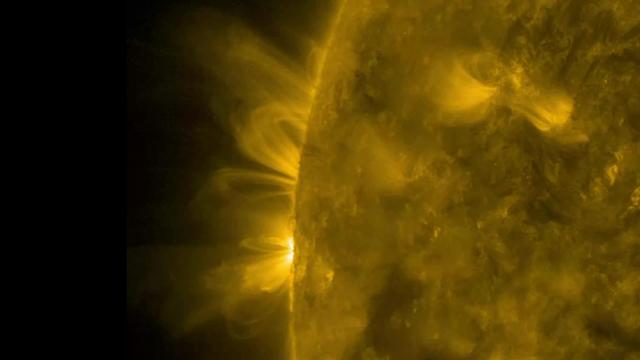
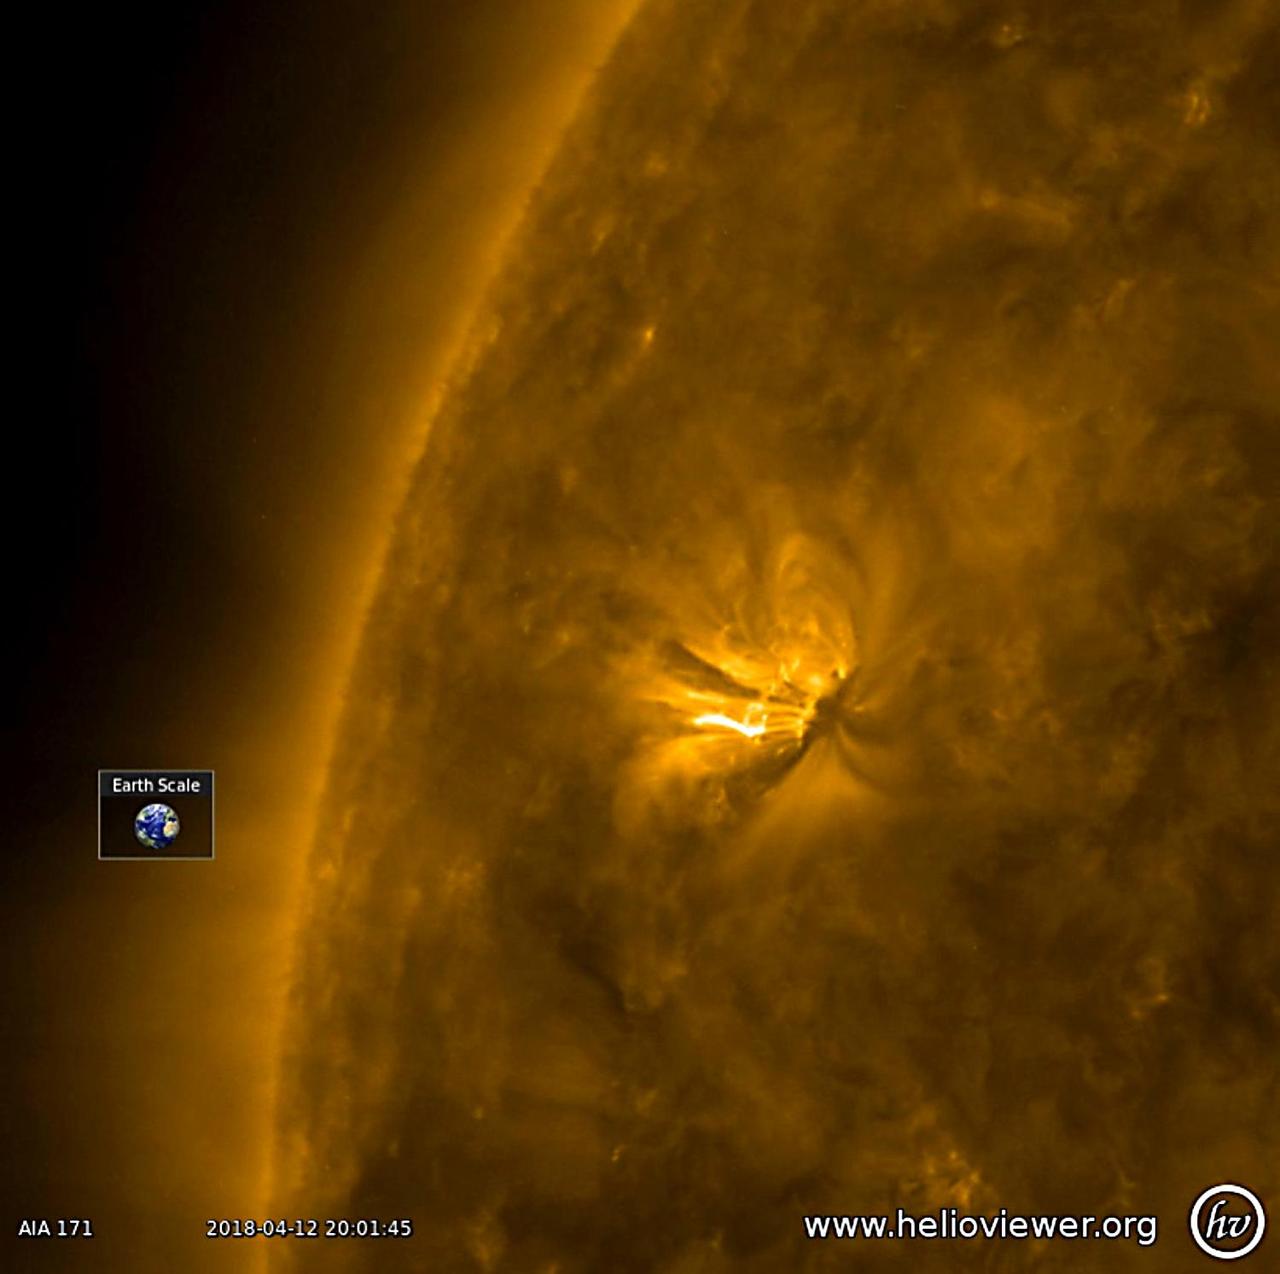
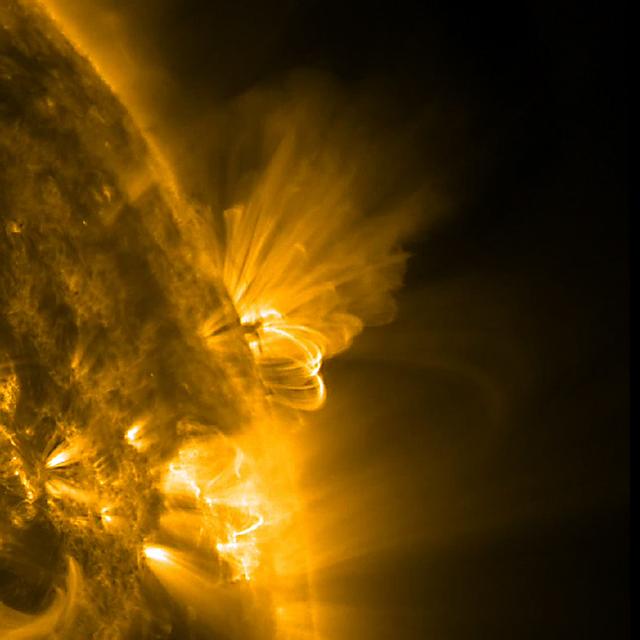
The lone active region visible on the sun put on a fine display with its tangled magnetic field lines swaying and twisting above it (Apr. 24-26, 2018) when viewed in a wavelength of extreme ultraviolet light. The charged particles spinning along these field lines illuminate them. The region did not erupt with any significant solar storms, although it still might. Videos are available at https://photojournal.jpl.nasa.gov/catalog/PIA22449
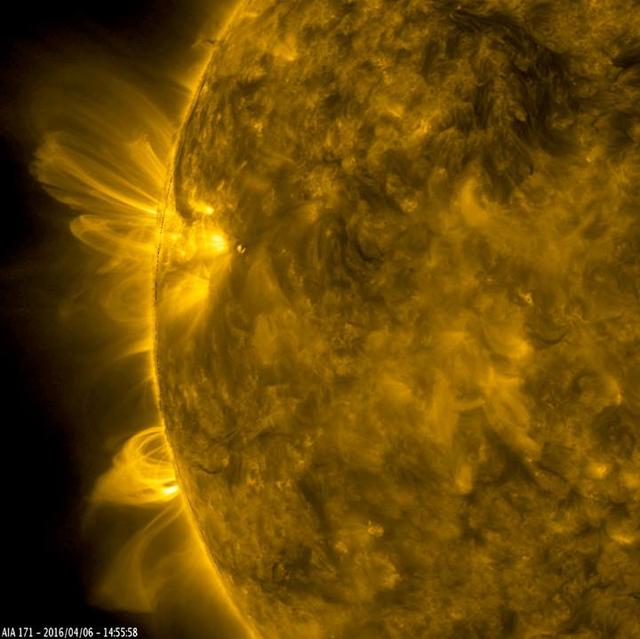
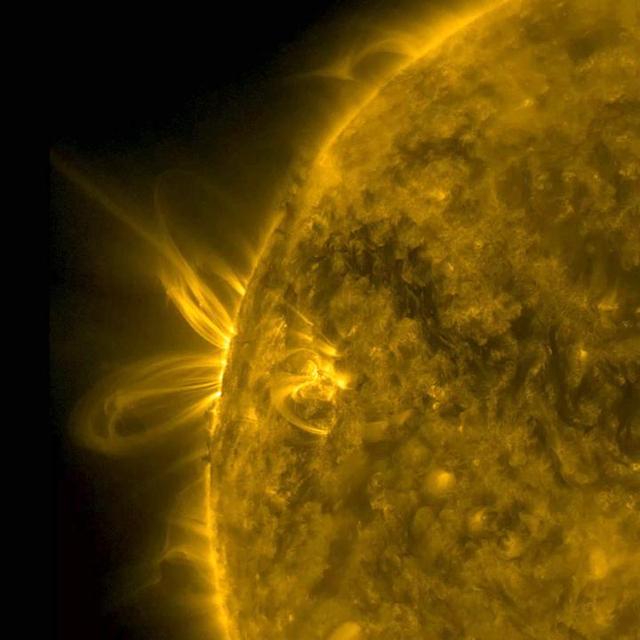
This still image from an animation from NASA GSFC Solar Dynamics Observatory shows arches of magnetic field lines towered over the edge of the Sun as a pair of active regions began to rotate into view Apr. 5-6, 2016.

These banana-shaped loops are part of a computer-generated snapshot of our sun's magnetic field. The solar magnetic-field lines loop through the sun's corona, break through the sun's surface, and cornect regions of magnetic activity, such as sunspots. This image --part of a magnetic-field study of the sun by NASA's Allen Gary -- shows the outer portion (skins) of interconnecting systems of hot (2 million degrees Kelvin) coronal loops within and between two active magnetic regions on opposite sides of the sun's equator. The diameter of these coronal loops at their foot points is approximately the same size as the Earth's radius (about 6,000 kilometers).
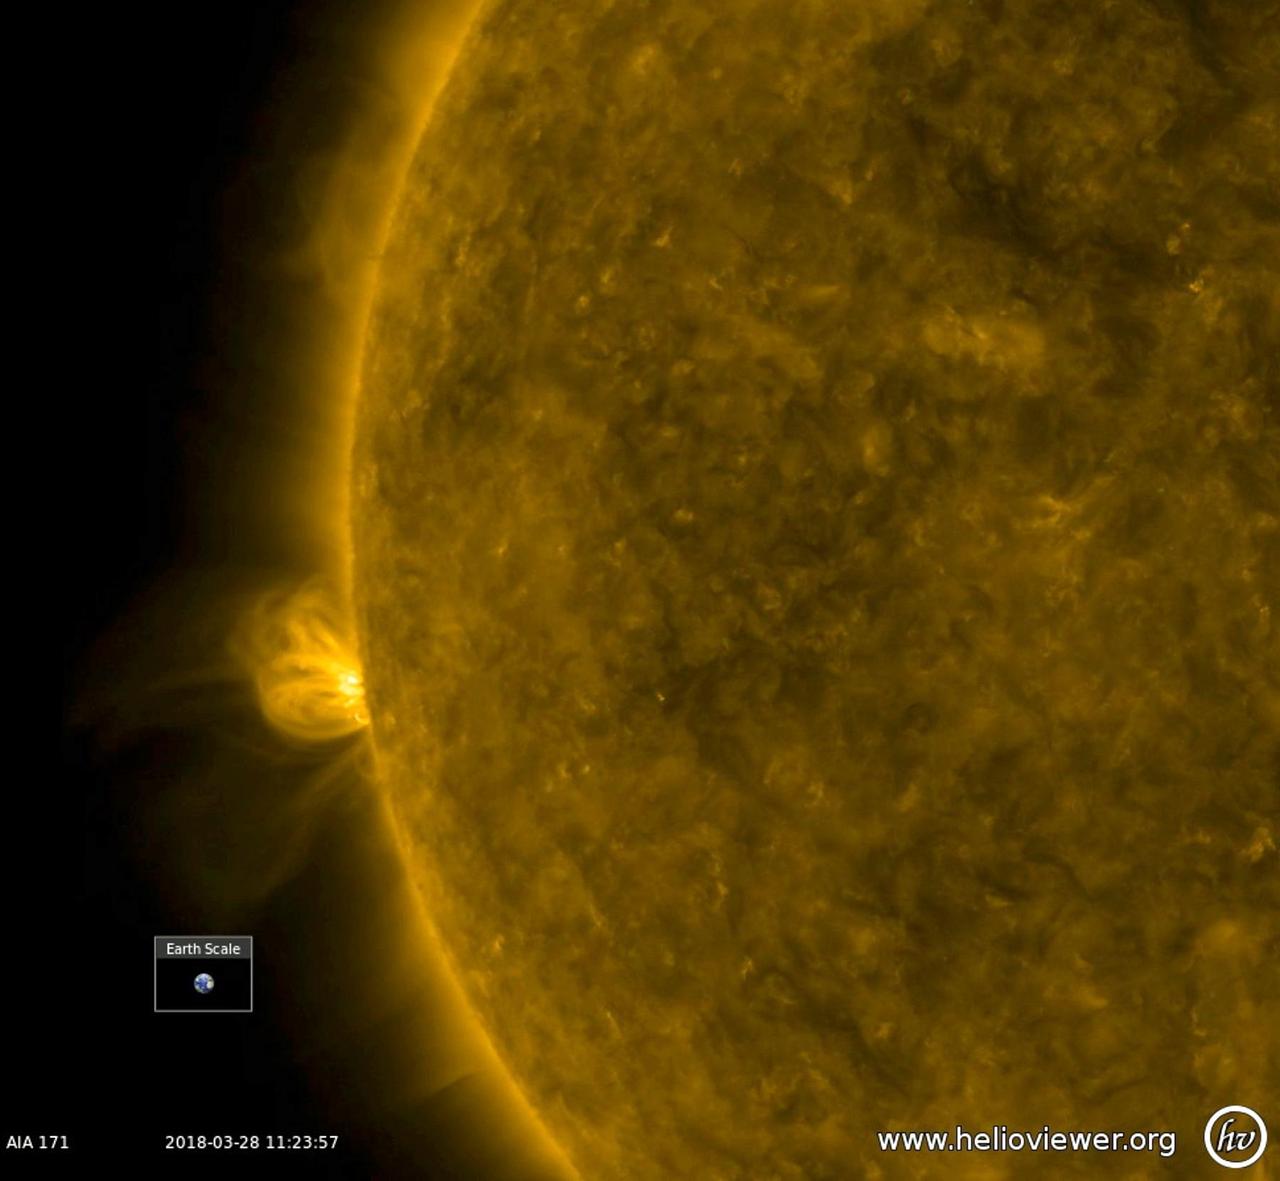
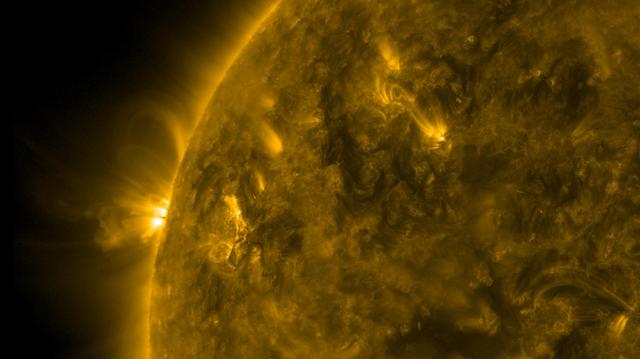
With no active regions currently on the face of the sun, a bristling active region has begun to rotate into view (Mar. 27-28, 2018). In this extreme ultraviolet view, the active region has numerous arches of bright, magnetic field lines blossoming out and towering above it. Whether this region will produce solar storms remains to be seen, but at least there is some new activity to observe. The video was produced with Helioviewer software. Animations are available at https://photojournal.jpl.nasa.gov/catalog/PIA22411

This still image from an animation from NASA GSFC Solar Dynamics Observatory shows magnetically charged particles forming a nicely symmetrical arch at the edge of the Sun as they followed the magnetic field lines of an active region Aug.4-5, 2015. Before long the arch begins to fade, but a fainter and taller arch appears for a time in the same place. Note that several other bright active regions display similar kinds of loops above them. These images of ionized iron at about one million degrees were taken in a wavelength of extreme ultraviolet light. The video covers about 30 hours of activity. http://photojournal.jpl.nasa.gov/catalog/PIA19874
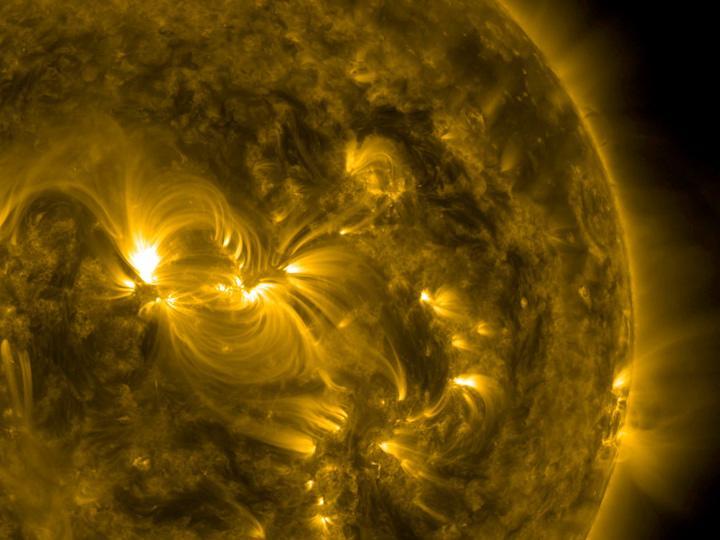
One broad active region sported a wonderful example of coiled magnetic field lines over almost a four-day period (July 15-18, 2016). The magnetic lines are easily visible in this 171 Angstrom wavelength of extreme ultraviolet light be cause charged particles are spiraling along the lines. The active region is a hotbed of struggling magnetic forces that were pushing out above the sun's surface. http://photojournal.jpl.nasa.gov/catalog/PIA17911
A close-up view of one day in the life of a rather small active region shows the agitation and dynamism of its magnetic field (Dec. 21, 2016). This wavelength of extreme ultraviolet light reveals particles as they spin along the cascading arches of magnetic field lines above the active region. Some darker plasma rises up and spins around at the edge of the sun near the end of the video clip also being pulled by unseen magnetic forces. Movies are available at http://photojournal.jpl.nasa.gov/catalog/PIA15032

Several small sunspots appeared this week, giving NASA Solar Dynamics Observatory a chance to illustrate their sources Mar. 2, 2017. The first image is a magnetogram or magnetic image of the sun's surface. The MDI instrument can observe where positive and negative particles are moving toward or away from strong magnetic areas. These active regions have stronger magnetic fields and appear as strongly black or white. The yellow image shows the surface in filtered light, and there the same active regions appear as dark, cooler splotches called sunspots. Higher up in the sun's atmosphere, the golden image (in extreme ultraviolet light) shows arches of light above the active regions, which are charged particles spinning along magnetic field lines. Note that they all align very well with each other. Magnetic forces are the dynamic drivers here in these regions of the sun. Movies are available at http://photojournal.jpl.nasa.gov/catalog/PIA21557

A small prominence observed in profile arched up and sent streams of plasma curling back into the sun over a 30-hour period (Dec. 13-14, 2017). We are observing charged particles streaming along magnetic field lines made visible in extreme ultraviolet light. Prominences are cooler strands of plasma tethered above the sun's surface by magnetic forces. They are quite unstable and frequently fall apart within hours or days. Movies are available at https://photojournal.jpl.nasa.gov/catalog/PIA22196
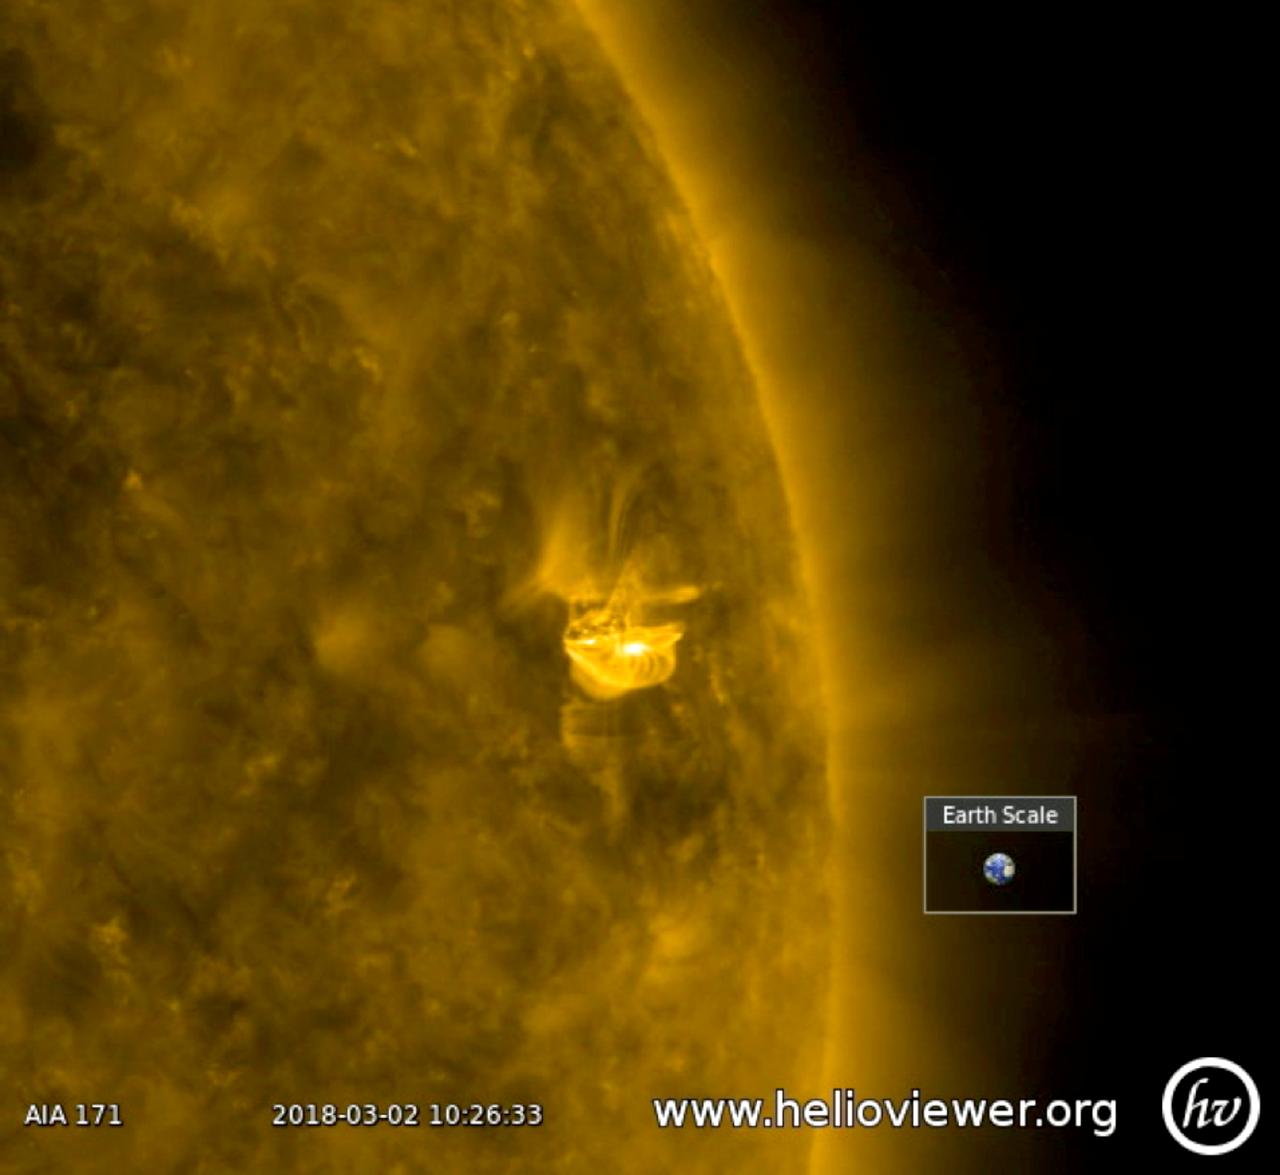
A relatively small active region erupted twice in 18 hours (Mar. 2, 2018). After each burst, one can see the magnetic fields lines, which appear as bright coils, spiraling around the region. They are reorganizing the disrupted magnetic field. The quick second when the screen goes black was caused by the Earth passing between the spacecraft and the sun. Images were taken in a wavelength of extreme ultraviolet light. The video was produced using the free Helioviewer software at Helioviewer.org. Videos are available at https://photojournal.jpl.nasa.gov/catalog/PIA22260
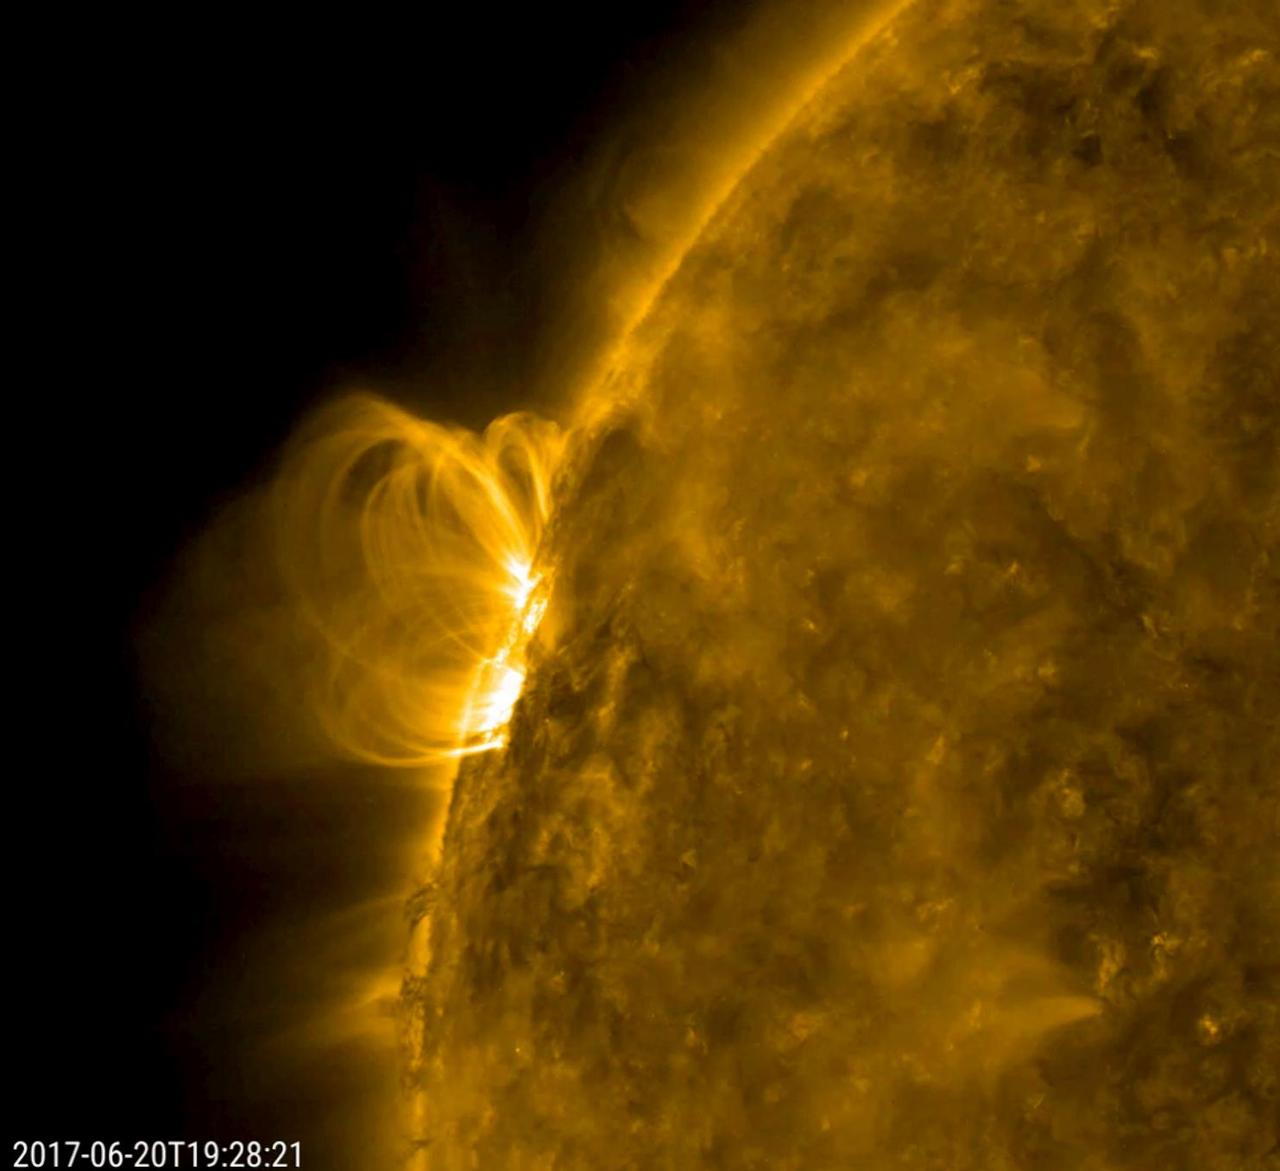
A smallish solar filament looks like it collapsed into the sun and set off a minor eruption that hurled plasma into space (June 20, 2017). Then, the disrupted magnetic field immediately began to reorganize itself, hence the bright series of spirals coiling up over that area. The magnetic field lines are made visible in extreme ultraviolet light as charged particles spin along them. Also of interest are the darker, cooler strands of plasma being pulled and twisted at the edge of the sun just below the active region. The activity here is in a 21-hour period. Movies are available at https://photojournal.jpl.nasa.gov/catalog/PIA21764

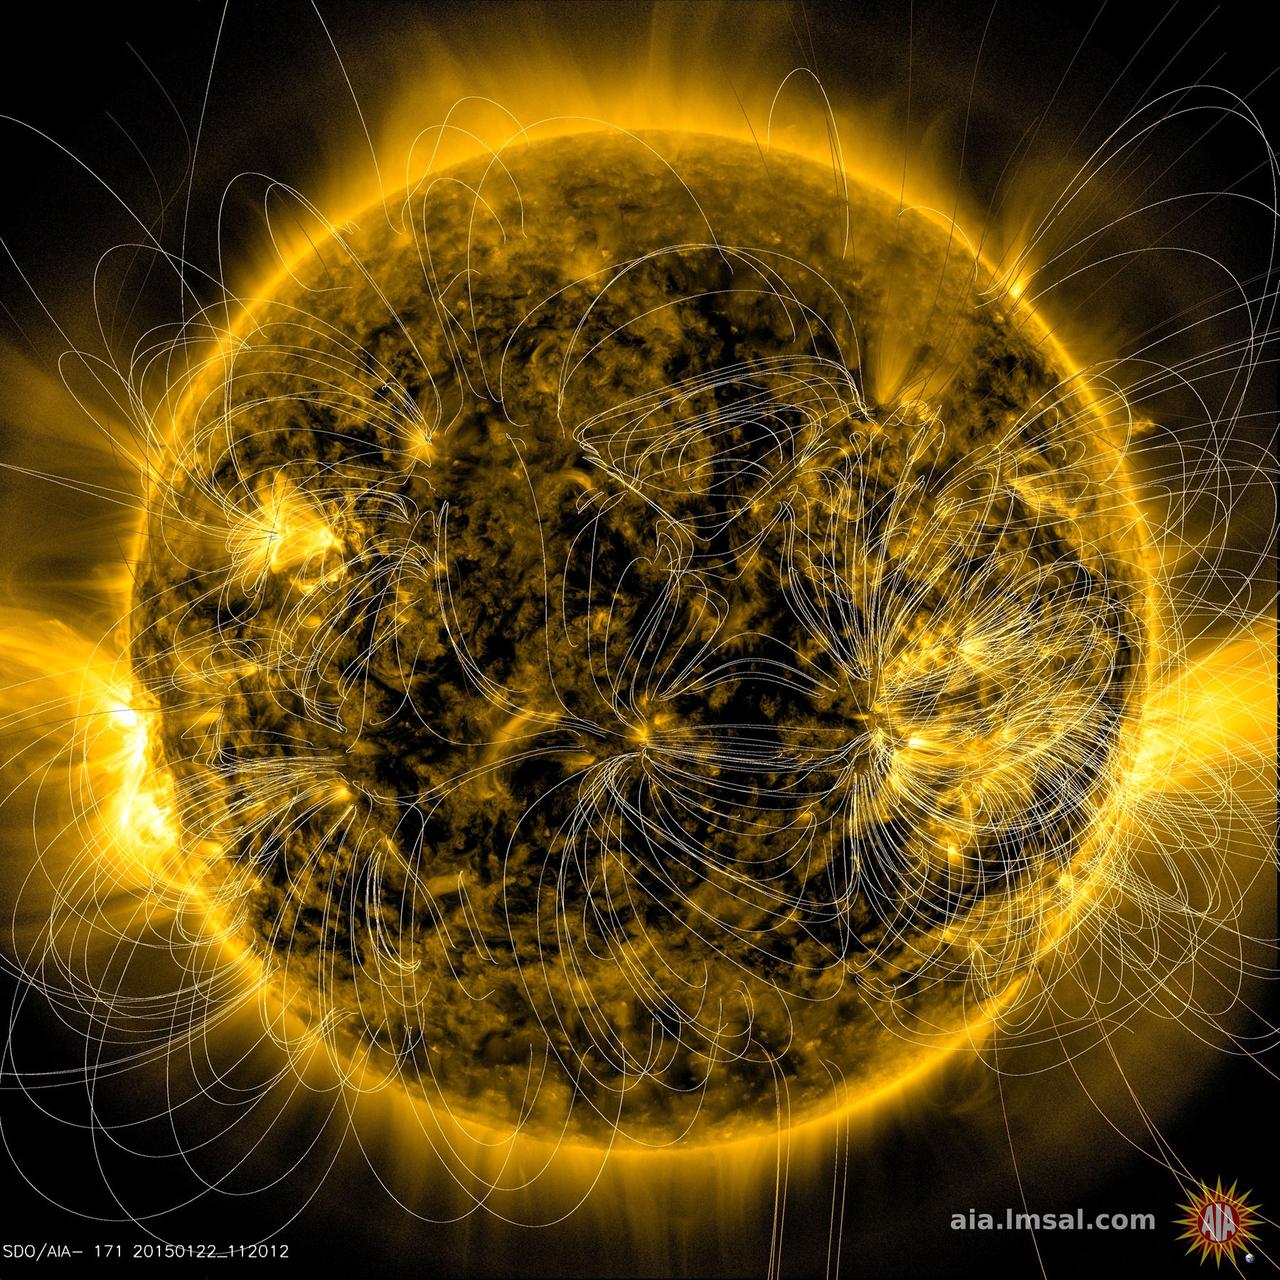
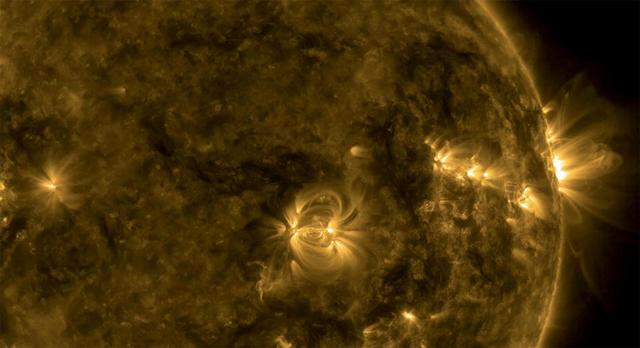
This illustration lays a depiction of the sun's magnetic fields over an image captured by NASA’s Solar Dynamics Observatory on March 12, 2016. The complex overlay of lines can teach scientists about the ways the sun's magnetism changes in response to the constant movement on and inside the sun. Note how the magnetic fields are densest near the bright spots visible on the sun – which are magnetically strong active regions – and many of the field lines link one active region to another. This magnetic map was created using the PFSS – Potential Field Source Surface – model, a model of the magnetic field in the sun’s atmosphere based on magnetic measurements of the solar surface. The underlying image was taken in extreme ultraviolet wavelengths of 171 angstroms. This type of light is invisible to our eyes, but is colorized here in gold. Credits: NASA/SDO/AIA/LMSAL <b><a href="http://www.nasa.gov/audience/formedia/features/MP_Photo_Guidelines.html" rel="nofollow">NASA image use policy.</a></b> <b><a href="http://www.nasa.gov/centers/goddard/home/index.html" rel="nofollow">NASA Goddard Space Flight Center</a></b> enables NASA’s mission through four scientific endeavors: Earth Science, Heliophysics, Solar System Exploration, and Astrophysics. Goddard plays a leading role in NASA’s accomplishments by contributing compelling scientific knowledge to advance the Agency’s mission. <b>Follow us on <a href="http://twitter.com/NASAGoddardPix" rel="nofollow">Twitter</a></b> <b>Like us on <a href="http://www.facebook.com/pages/Greenbelt-MD/NASA-Goddard/395013845897?ref=tsd" rel="nofollow">Facebook</a></b> <b>Find us on <a href="http://instagrid.me/nasagoddard/?vm=grid" rel="nofollow">Instagram</a></b>
As an active region rotated into view, NASA Solar Dynamics Observatory was able to observe well-defined magnetic loops gyrating above the sun between Mar, 23-24, 2017. These loops appear because charged particles spinning along the magnetic field lines above this active region are made visible in this wavelength of extreme ultraviolet light. The video clip covers about a day and a half of activity. Movies are available at https://photojournal.jpl.nasa.gov/catalog/PIA21583
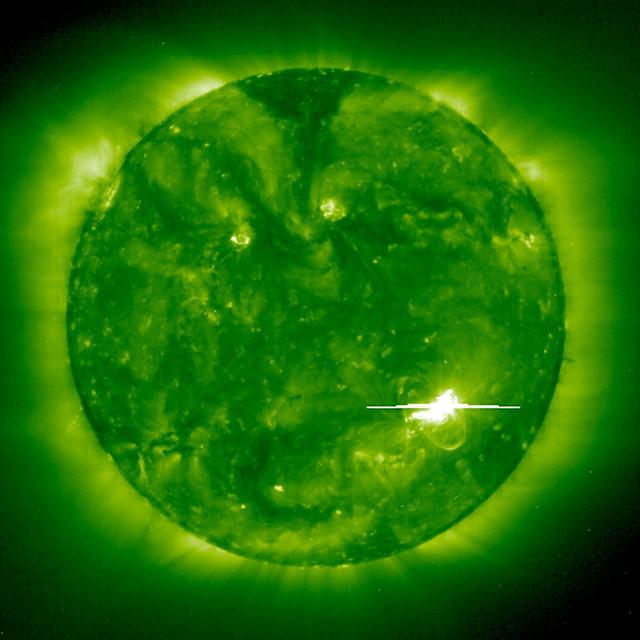
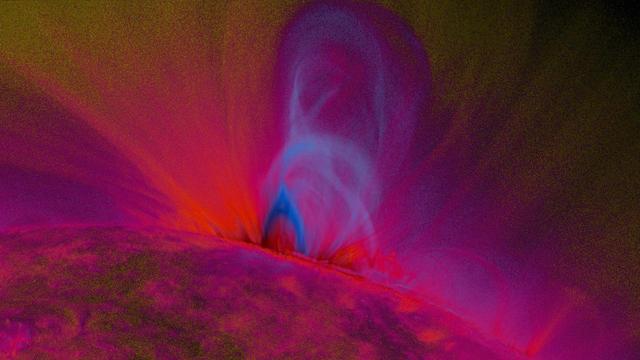
A bright solar flare is captured by the EIT 195Å instrument on 1998 May 2. A solar flare (a sudden, rapid, and intense variation in brightness) occurs when magnetic energy that has built up in the solar atmosphere is suddenly released, launching material outward at millions of km per hour. The Sun’s magnetic fields tend to restrain each other and force the buildup of tremendous energy, like twisting rubber bands, so much that they eventually break. At some point, the magnetic lines of force merge and cancel in a process known as magnetic reconnection, causing plasma to forcefully escape from the Sun. Credit: NASA/GSFC/SOHO/ESA To learn more go to the SOHO website: <a href="http://sohowww.nascom.nasa.gov/home.html" rel="nofollow">sohowww.nascom.nasa.gov/home.html</a> To learn more about NASA's Sun Earth Day go here: <a href="http://sunearthday.nasa.gov/2010/index.php" rel="nofollow">sunearthday.nasa.gov/2010/index.php</a>
This Solar Dynamics Observatory image of the Sun taken on February 1, 2013 in extreme ultraviolet light captures a heart-shaped dark coronal hole. Coronal holes are areas of the Sun's surface that are the source of open magnetic field lines that head way out into space. They are also the source regions of the fast solar wind, which is characterized by a relatively steady speed of approximately 800 km/s (about 1.8 million mph).
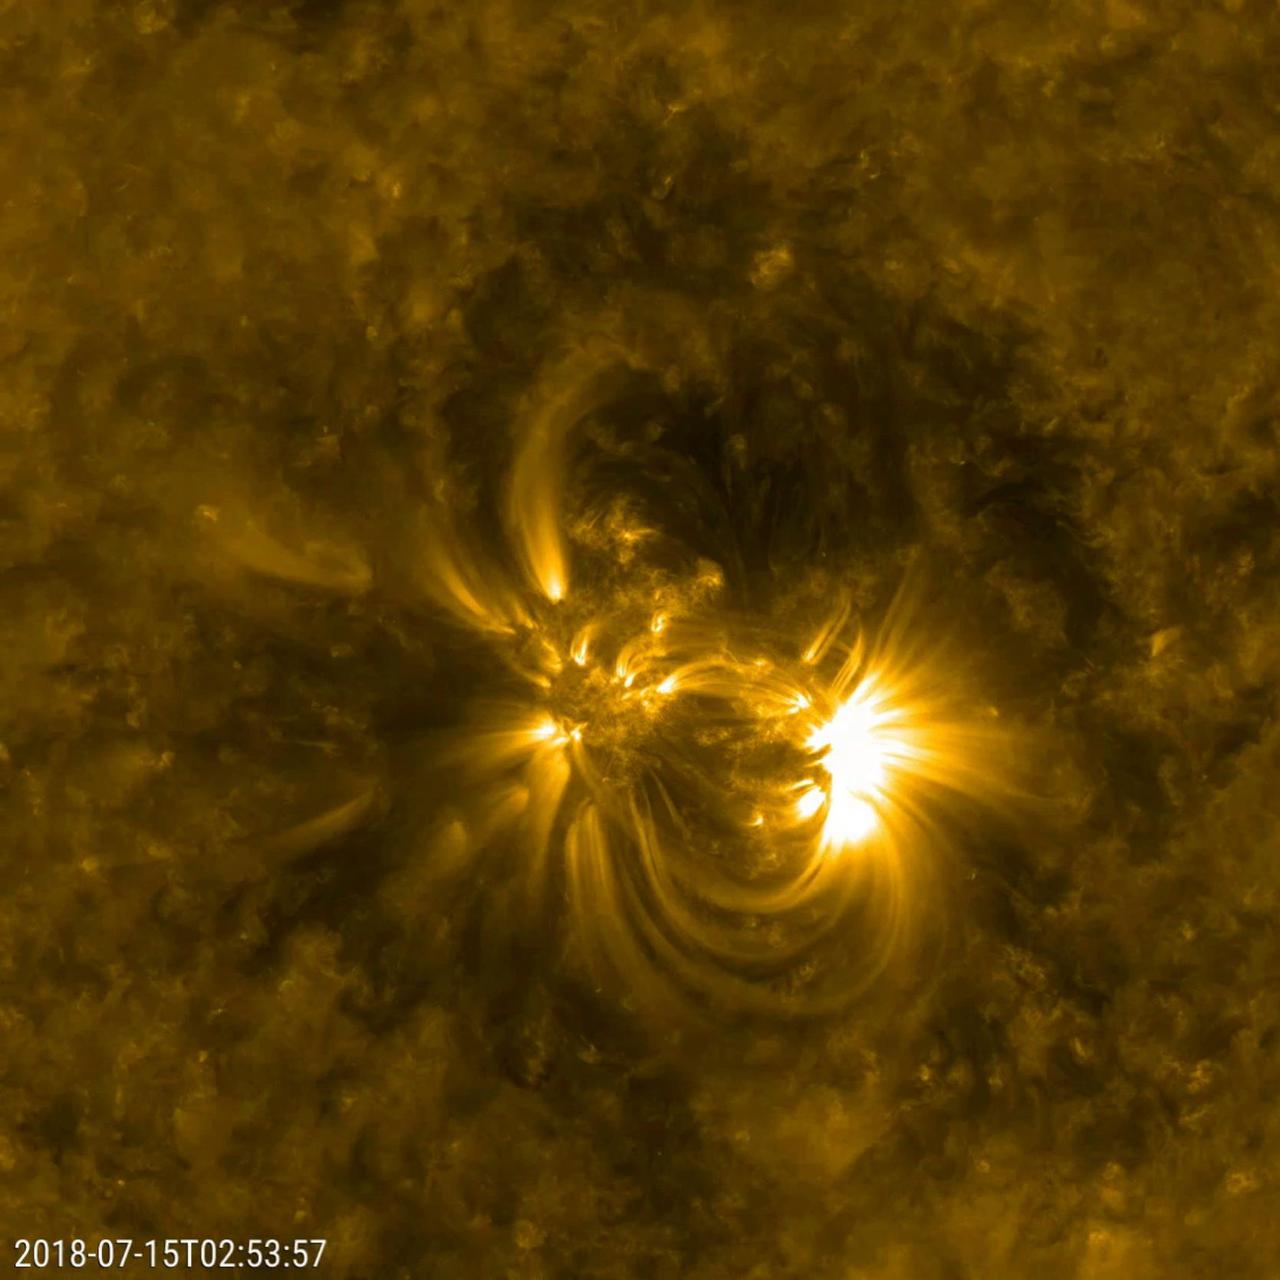
NASA's Solar Dynamics Observatory (SDO) zoomed in to watch close-up the dynamics of this single active region on the sun over a two-day period (July 14-16, 2018). The loops SDO observed in extreme ultraviolet light are illuminated by charged particles spinning along the magnetic field lines above an active region. Active regions are magnetically intense areas that are pushed up to the surface of the sun from below. These regions are often the sources of large eruptions that cause solar storms, though no large eruptions seem to have occurred during this period. To give a sense of scale, these loops are rising up many times the diameter of Earth. Movies are available at https://photojournal.jpl.nasa.gov/catalog/PIA22645

Giant, bright coronal loops trace out the magnetic field lines above an active region from June 4-6, 2018. The wavelength of extreme ultraviolet light shown here is emitted by ionized iron travelling along the field lines, super-heated to approximately 1 million degrees K. Coronal loops were not seen in this level of detail until the Solar Dynamics Observatory was launched in 2010 and came online, giving solar scientists new data with which to study the Sun and its processes. Videos are available at https://photojournal.jpl.nasa.gov/catalog/PIA22508
Magnetic arcs of solar material spewing from our favorite sphere of hot plasma, the sun. Magnetic arcs of solar material held their shapes fairly well as they spiraled above two solar active regions over 18 hours on Jan. 11-12, 2017. The charged solar material, called plasma, traces out the magnetic field lines above the active regions when viewed in wavelengths of extreme ultraviolet light, captured here by NASA’s Solar Dynamics Observatory. Extreme ultraviolet light is typically invisible to our eyes, but is colorized here in gold for easy viewing. Credit: NASA/SDO
Every day, invisible magnetic explosions are happening around Earth, on the surface of the sun and across the universe. These explosions, known as magnetic reconnection, occur when magnetic field lines cross, releasing stored magnetic energy. Such explosions are a key way that clouds of charged particles — plasmas — are accelerated throughout the universe. In Earth’s magnetosphere — the giant magnetic bubble surrounding our planet — these magnetic reconnections can fling charged particles toward Earth, triggering auroras. Read more: <a href="http://go.nasa.gov/2mnMtDm" rel="nofollow">go.nasa.gov/2mnMtDm</a> Video caption - In this simulation, a reconnection even pushes a blob of plasma toward Earth. The jet blown in the opposite direction wobbles due to the unstable conditions. Credit: NASA’s Goddard Space Flight Center/Yi-Hsin Liu/Joy Ng, producer
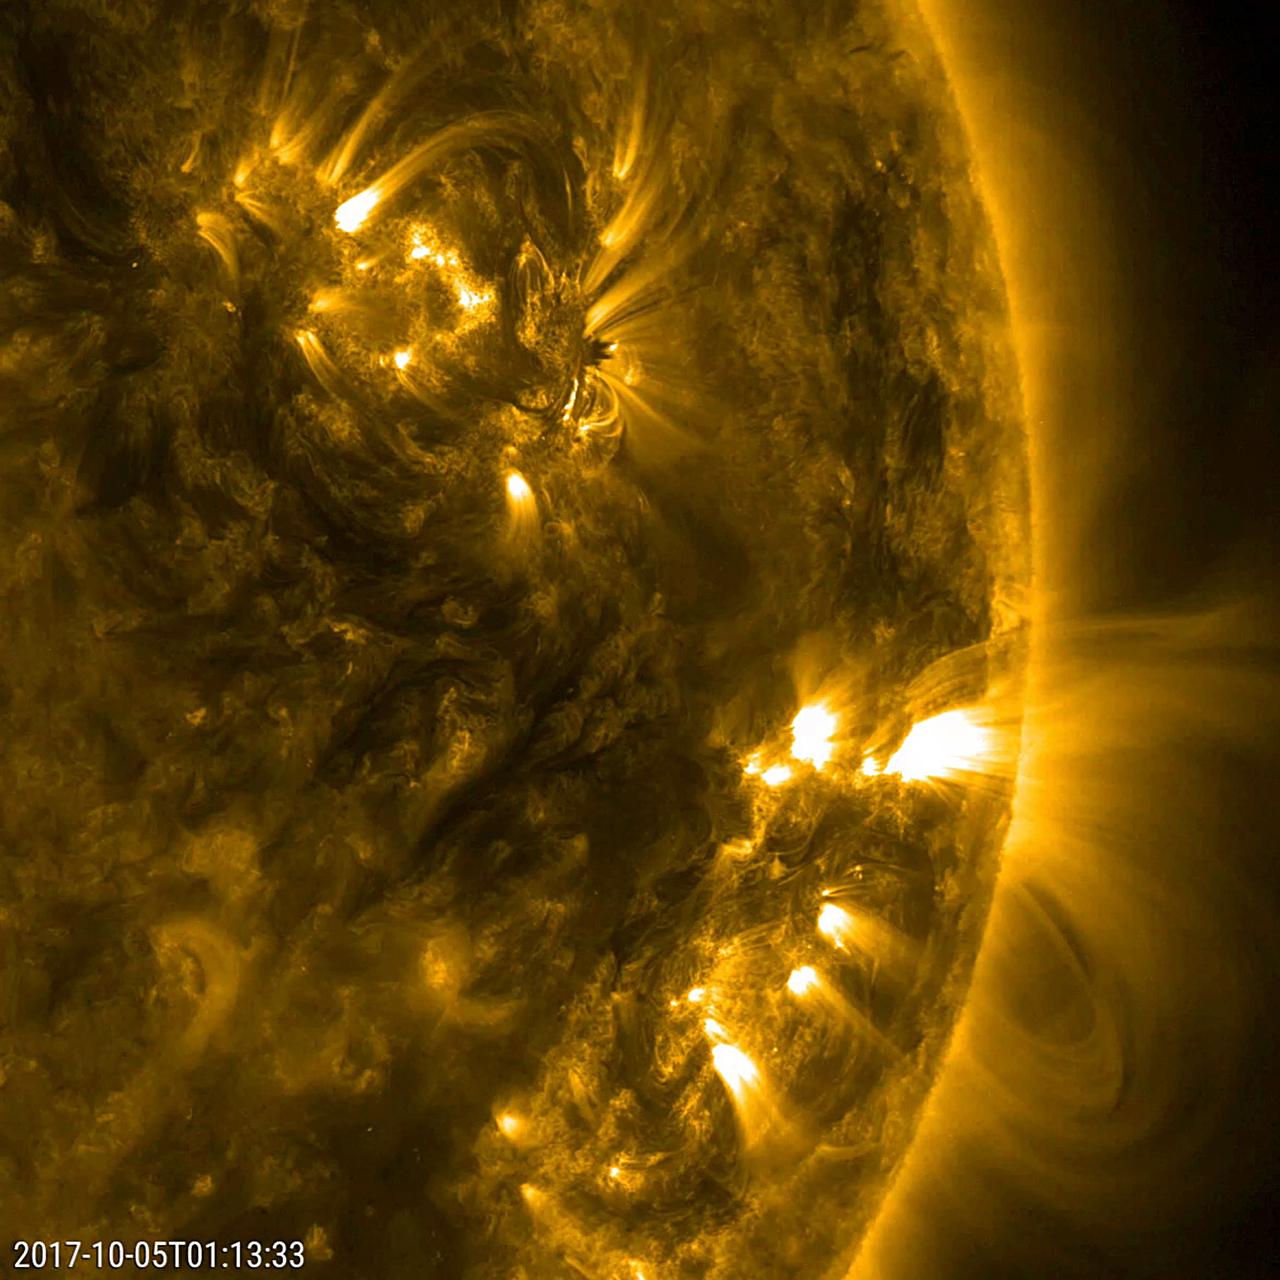
This close-up video clip shows a pair of active regions (the brighter areas) move and change as they rotate with the sun over just a 17-hour period (Oct. 4-5, 2017). They were observed in a wavelength of extreme ultraviolet light that reveals plasma heated to over a million degrees. The arches above the regions consist of charge particles spinning along and revealing magnetic field lines. Each one shows a few minor bursts of material none of them were serious. Animations are available at https://photojournal.jpl.nasa.gov/catalog/PIA22039
A good-sized active region with bright, towering arches began to rotate into view (Apr. 18-19, 2018). The arches consist of charged particles spiraling along magnetic field lines revealed in this wavelength of extreme ultraviolet light. They rise up above the sun's surface many times the size of Earth. The video covers just 16 hours of activity. We will keep our eyes on this region to see if it has the kind of dynamism to produce solar storms. Videos are available at https://photojournal.jpl.nasa.gov/catalog/PIA22430
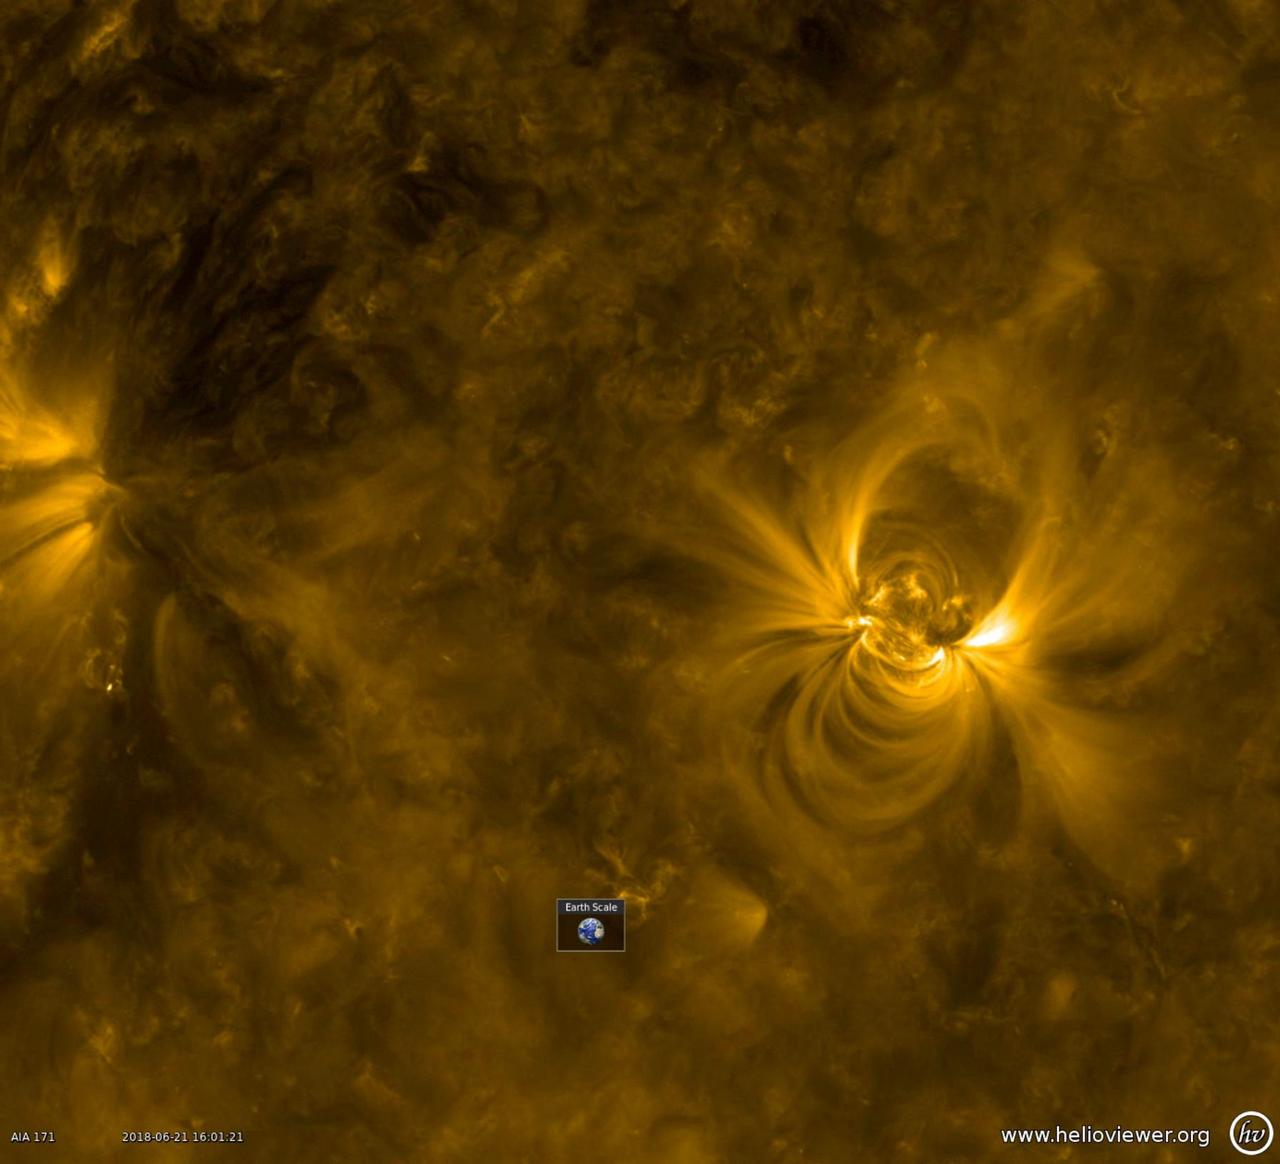
A new active region appeared on June 19th, quickly growing in size over two days (June 20-22, 2018). Active regions are areas of enhanced magnetic activity on the Sun's surface, generating the huge loops and dynamic surges observed here. Charged particles spinning along the field lines above the active region are illuminated in this wavelength of extreme ultraviolet light. The superimposed Earth icon gives a sense of just how large these loops are. Movies are available at https://photojournal.jpl.nasa.gov/catalog/PIA22582
When an active region rotated over to the edge of the sun, it presented us with a nice profile view of its elongated loops stretching and swaying above it (Mar. 8-9, 2017). These loops are actually charged particles (made visible in extreme ultraviolet light) swirling along the magnetic field lines of the active region. The video covers about 30 hours of activity. Also of note is a darker twisting mass of plasma to the left of the active region being pulled and spun about by magnetic forces. Video is available at http://photojournal.jpl.nasa.gov/catalog/PIA21562
Several arcing loops rotated into view and swirled above an active region, which gave us a nice profile view of the action (June 26-27, 2016). The arcing plasma is tracing magnetic field lines extending out from the active region. Some darker matter also jiggled back and forth near the active region as well, pulled about by magnetic forces. At one point a lick of plasma pushed its way out from the region but quickly fell back into the sun. The images were taken in a wavelength of extreme ultraviolet light. Movies are also available at the Photojournal. http://photojournal.jpl.nasa.gov/catalog/PIA20882
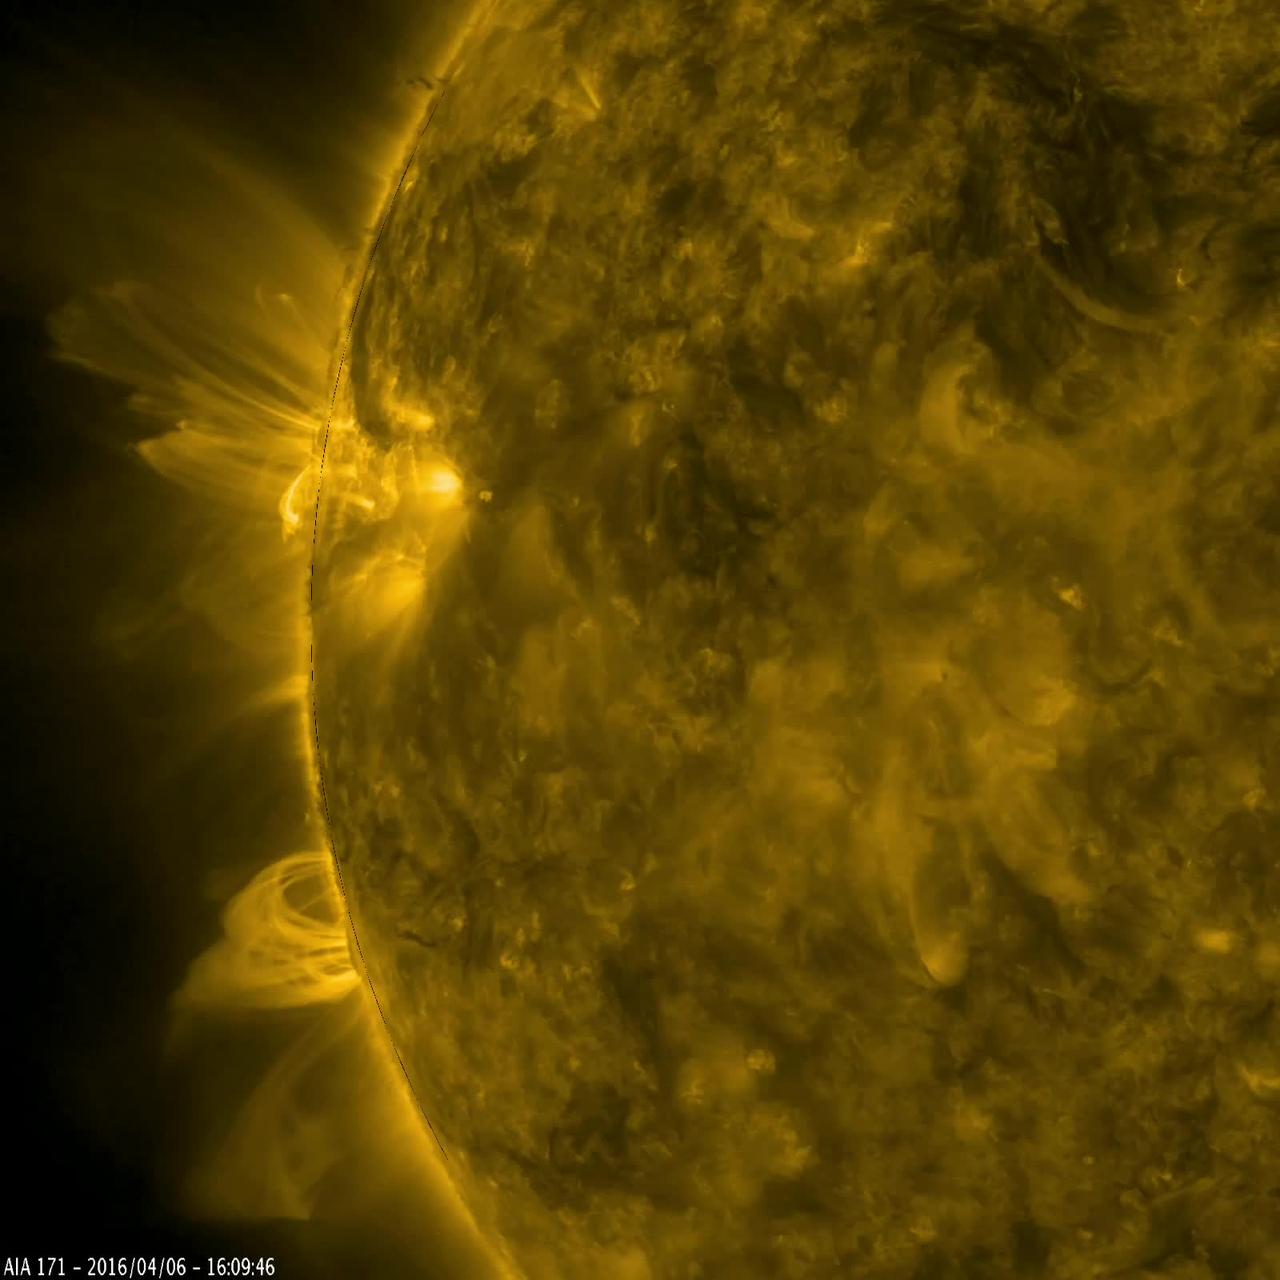
Arches of magnetic field lines towered over the sun’s edge as a pair of active regions began to rotate into view in this video captured by NASA’s Solar Dynamics Observatory on April 5-6, 2016. Active regions are areas of very concentrated magnetic field. Charged particles spiraling along these magnetic fields emit extreme ultraviolet light, which is typically not visible to our eyes, but colorized here in gold. The light given off from the particles helps trace out the magnetic field lines, which are otherwise invisible. Scientists use images such as this to observe how magnetic fields move around the sun and learn more about what causes active regions. Credit: NASA/Goddard/SDO <b><a href="http://www.nasa.gov/audience/formedia/features/MP_Photo_Guidelines.html" rel="nofollow">NASA image use policy.</a></b> <b><a href="http://www.nasa.gov/centers/goddard/home/index.html" rel="nofollow">NASA Goddard Space Flight Center</a></b> enables NASA’s mission through four scientific endeavors: Earth Science, Heliophysics, Solar System Exploration, and Astrophysics. Goddard plays a leading role in NASA’s accomplishments by contributing compelling scientific knowledge to advance the Agency’s mission. <b>Follow us on <a href="http://twitter.com/NASAGoddardPix" rel="nofollow">Twitter</a></b> <b>Like us on <a href="http://www.facebook.com/pages/Greenbelt-MD/NASA-Goddard/395013845897?ref=tsd" rel="nofollow">Facebook</a></b> <b>Find us on <a href="http://instagrid.me/nasagoddard/?vm=grid" rel="nofollow">Instagram</a></b>
A series of active regions stretched along the right side of the sun exhibited a wide variety of loops cascading above them (Sept. 12-14, 2016). The active region near the center has tightly coiled loops, while the region rotating over the right edge has some elongated and some very stretched loops above it. The loops are actually charged particles spiraling along magnetic field lines, observed here in a wavelength of extreme ultraviolet light. Near the middle of the video the Earth quickly passes in front of a portion of the sun as viewed by SDO. http://photojournal.jpl.nasa.gov/catalog/PIA16997
Caption: This is an image of magnetic loops on the sun, captured by NASA's Solar Dynamics Observatory (SDO). It has been processed to highlight the edges of each loop to make the structure more clear. A series of loops such as this is known as a flux rope, and these lie at the heart of eruptions on the sun known as coronal mass ejections (CMEs.) This is the first time scientists were able to discern the timing of a flux rope's formation. (SDO AIA 131 and 171 difference blended image of flux ropes during CME.) Credit: NASA/Goddard Space Flight Center/SDO ---- On July 18, 2012, a fairly small explosion of light burst off the lower right limb of the sun. Such flares often come with an associated eruption of solar material, known as a coronal mass ejection or CME – but this one did not. Something interesting did happen, however. Magnetic field lines in this area of the sun's atmosphere, the corona, began to twist and kink, generating the hottest solar material – a charged gas called plasma – to trace out the newly-formed slinky shape. The plasma glowed brightly in extreme ultraviolet images from the Atmospheric Imaging Assembly (AIA) aboard NASA’s Solar Dynamics Observatory (SDO) and scientists were able to watch for the first time the very formation of something they had long theorized was at the heart of many eruptive events on the sun: a flux rope. Eight hours later, on July 19, the same region flared again. This time the flux rope's connection to the sun was severed, and the magnetic fields escaped into space, dragging billions of tons of solar material along for the ride -- a classic CME. "Seeing this structure was amazing," says Angelos Vourlidas, a solar scientist at the Naval Research Laboratory in Washington, D.C. "It looks exactly like the cartoon sketches theorists have been drawing of flux ropes since the 1970s. It was a series of figure eights lined up to look like a giant slinky on the sun." <b>To read more about this new discovery go to: <a href="http://1.usa.gov/14UHsTt" rel="nofollow">1.usa.gov/14UHsTt</a> </b>
Caption: This is an image of magnetic loops on the sun, captured by NASA's Solar Dynamics Observatory (SDO). It has been processed to highlight the edges of each loop to make the structure more clear. A series of loops such as this is known as a flux rope, and these lie at the heart of eruptions on the sun known as coronal mass ejections (CMEs.) This is the first time scientists were able to discern the timing of a flux rope's formation. (SDO AIA 131 and 171 difference blended image of flux ropes during CME.) Credit: NASA/Goddard Space Flight Center/SDO ---- On July 18, 2012, a fairly small explosion of light burst off the lower right limb of the sun. Such flares often come with an associated eruption of solar material, known as a coronal mass ejection or CME – but this one did not. Something interesting did happen, however. Magnetic field lines in this area of the sun's atmosphere, the corona, began to twist and kink, generating the hottest solar material – a charged gas called plasma – to trace out the newly-formed slinky shape. The plasma glowed brightly in extreme ultraviolet images from the Atmospheric Imaging Assembly (AIA) aboard NASA’s Solar Dynamics Observatory (SDO) and scientists were able to watch for the first time the very formation of something they had long theorized was at the heart of many eruptive events on the sun: a flux rope. Eight hours later, on July 19, the same region flared again. This time the flux rope's connection to the sun was severed, and the magnetic fields escaped into space, dragging billions of tons of solar material along for the ride -- a classic CME. "Seeing this structure was amazing," says Angelos Vourlidas, a solar scientist at the Naval Research Laboratory in Washington, D.C. "It looks exactly like the cartoon sketches theorists have been drawing of flux ropes since the 1970s. It was a series of figure eights lined up to look like a giant slinky on the sun." <b>To read more about this new discovery go to: <a href="http://1.usa.gov/14UHsTt" rel="nofollow">1.usa.gov/14UHsTt</a> </b>
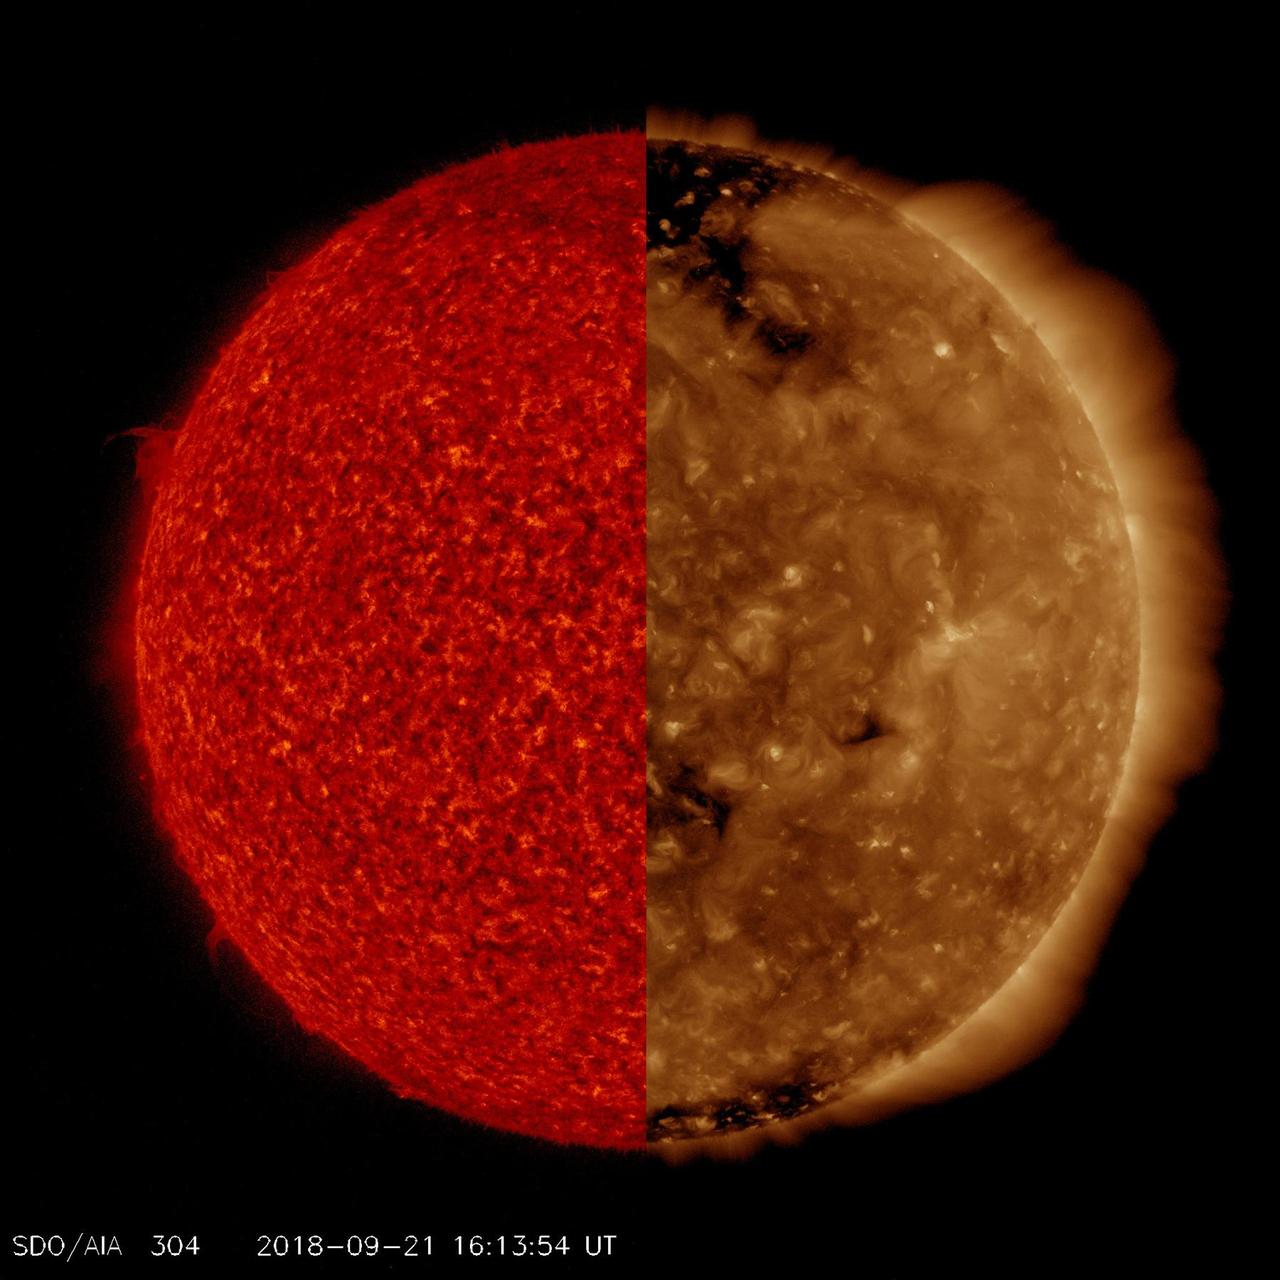
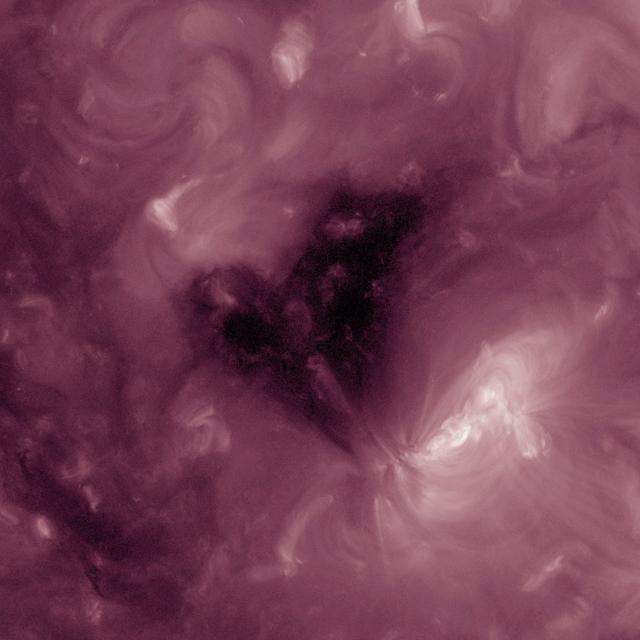
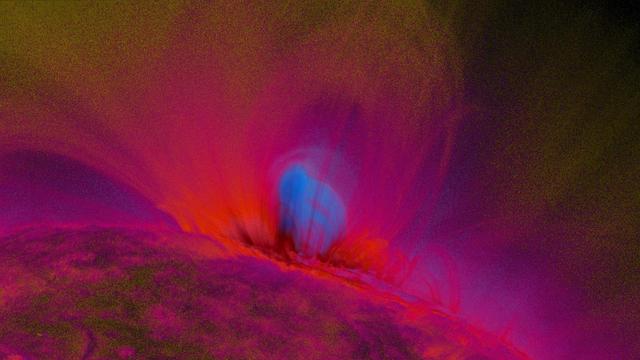
NASA's Solar Dynamics Observatory observes the Sun in ten different wavelengths because each wavelength reveals different solar features. Here, we have selected two images taken at virtually the same time but in different wavelengths of extreme ultraviolet light. The red tinted image, which captures material not far above the Sun's surface, is especially good for revealing details along the edge of the Sun, like the small prominence at the ten o'clock position. The brown tinted image clearly shows two large coronal holes (darker areas) as well as some faint magnetic field lines and hints of solar activity (lighter areas), neither of which are apparent in the red image. This activity is occurring somewhat higher in the Sun's corona. In a way it is like peeling away the layers of an onion, a little at a time. Animations are available at https://photojournal.jpl.nasa.gov/catalog/PIA22724
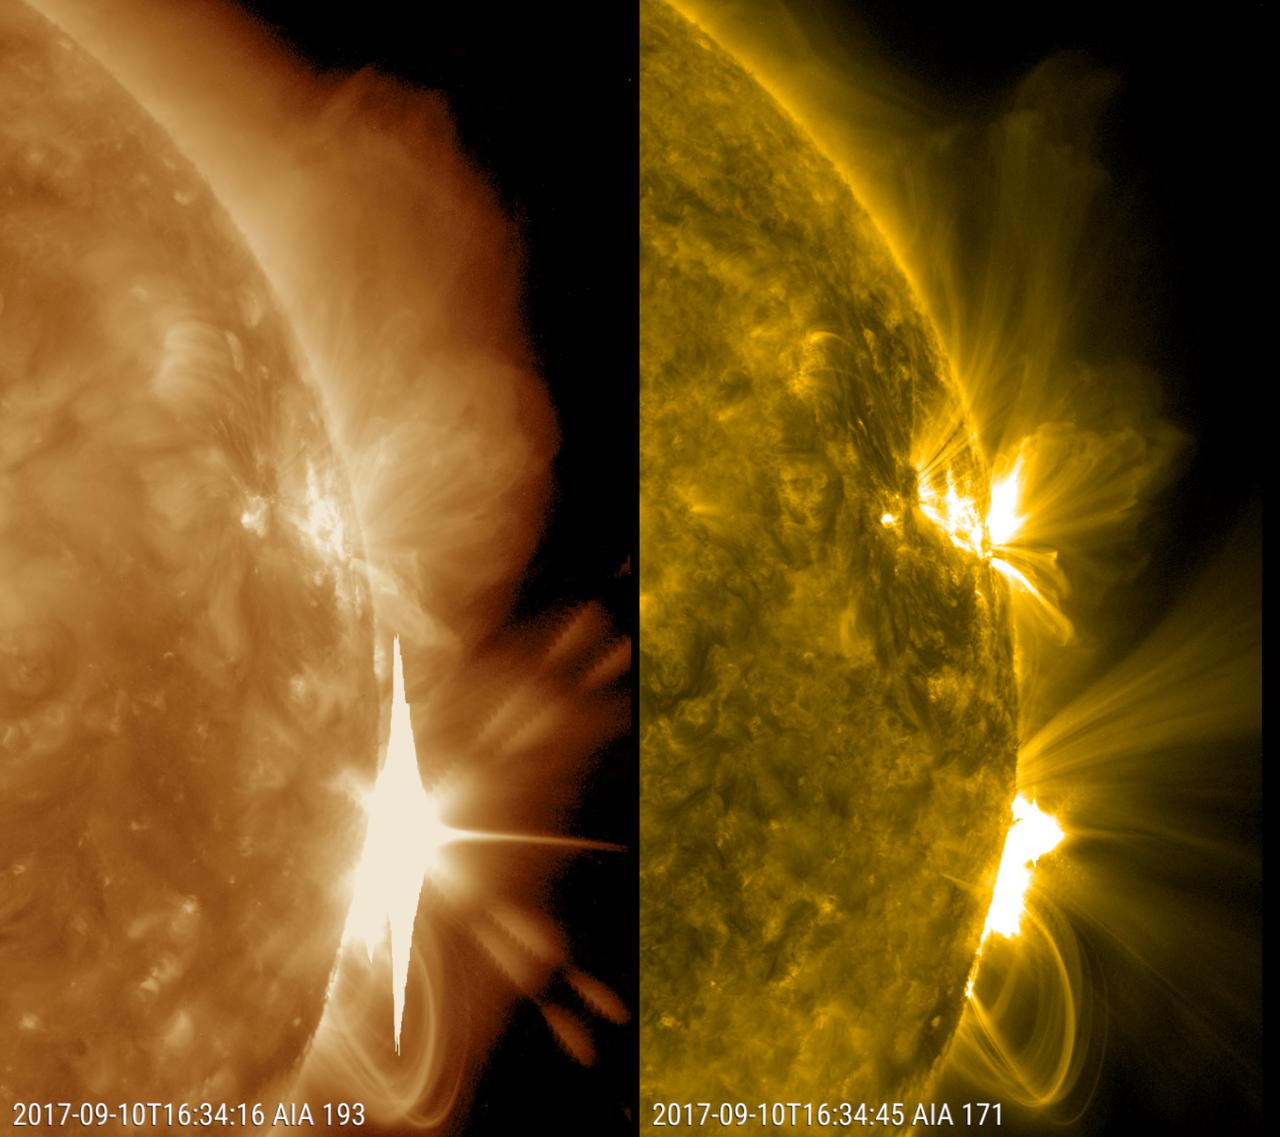
The Sun erupted with an X8 solar flare, one of the largest of the current solar cycle (Sept. 10, 2017). Its source was the same sunspot region that produced an X9 flare last week. This is shown in two wavelengths of extreme ultraviolet light at the same time and each reveals different features. Both are colorized to identify in which wavelength they were observed. The coils of loops after the flare are the magnetic field lines reorganizing themselves after the eruption. The video clip covers about six hours. Movies are available at https://photojournal.jpl.nasa.gov/catalog/PIA21958

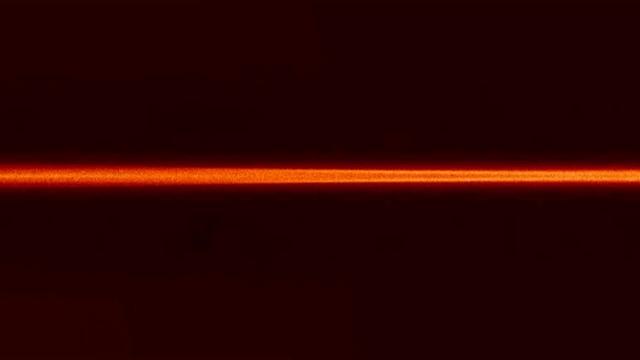
This artist's concept depicts a magnetar – a type of neutron star with a strong magnetic field – losing material into space in an ejection that would have caused the object's rotation to slow. Shown as thin green lines, the magnetic field lines influence the movement of charged material around the magnetar. In October 2022, astronomers using NASA's NICER (Neutron Star Interior Composition Explorer) on the International Space Station and NuSTAR (Nuclear Spectroscopic Telescope Array) in low Earth orbit observed a rapid slowdown in a nearby magnetar called SGR 1935+2154. They believe the slowdown was caused by a rapid loss of material. The slowdown coincided with the release a fast radio burst – an eruption of radio waves that last only for a fraction of a second but can release about as much energy as the Sun does in a year. The light also forms a laser-like beam, setting them apart from more chaotic cosmic explosions. The telescopes were able to observe SGR 1935+2154 for hours, catching a glimpse of what happened on its surface and in its immediate surroundings both before and after the fast radio burst. https://photojournal.jpl.nasa.gov/catalog/PIA26274
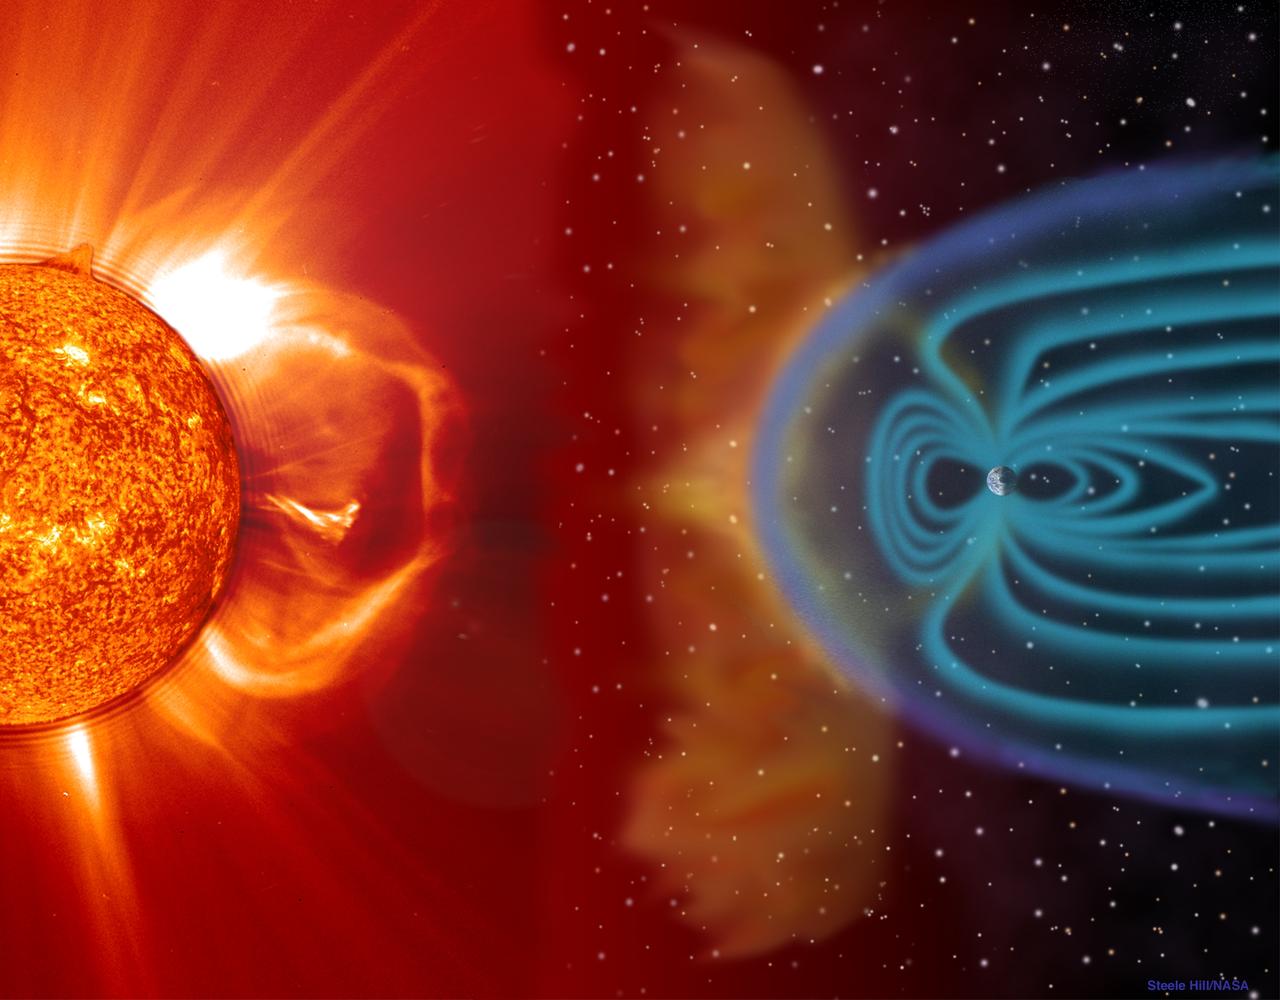
CME blast and subsequent impact at Earth -- This illustration shows a CME blasting off the Sun’s surface in the direction of Ea CME blast and subsequent impact at Earth -- This illustration shows a CME blasting off the Sun’s surface in the direction of Earth. This left portion is composed of an EIT 304 image superimposed on a LASCO C2 coronagraph. Two to four days later, the CME cloud is shown striking and beginning to be mostly deflected around the Earth’s magnetosphere. The blue paths emanating from the Earth’s poles represent some of its magnetic field lines. The magnetic cloud of plasma can extend to 30 million miles wide by the time it reaches earth. These storms, which occur frequently, can disrupt communications and navigational equipment, damage satellites, and even cause blackouts. (Objects in the illustration are not drawn to scale.) Credit: NASA/GSFC/SOHO/ESA To learn more go to the SOHO website: <a href="http://sohowww.nascom.nasa.gov/home.html" rel="nofollow">sohowww.nascom.nasa.gov/home.html</a> To learn more about NASA's Sun Earth Day go here: <a href="http://sunearthday.nasa.gov/2010/index.php" rel="nofollow">sunearthday.nasa.gov/2010/index.php</a>
Caption: This is an image of magnetic loops on the sun, captured by NASA's Solar Dynamics Observatory on July 18, 2012. It has been processed to highlight the edges of each loop to make the structure more clear. A series of loops such as this is known as a flux rope, and these lie at the heart of eruptions on the sun known as coronal mass ejections (CMEs.) This is the first time scientists were able to discern the timing of a flux rope's formation. Credit: NASA/Goddard Space Flight Center/SDO ---- On July 18, 2012, a fairly small explosion of light burst off the lower right limb of the sun. Such flares often come with an associated eruption of solar material, known as a coronal mass ejection or CME – but this one did not. Something interesting did happen, however. Magnetic field lines in this area of the sun's atmosphere, the corona, began to twist and kink, generating the hottest solar material – a charged gas called plasma – to trace out the newly-formed slinky shape. The plasma glowed brightly in extreme ultraviolet images from the Atmospheric Imaging Assembly (AIA) aboard NASA’s Solar Dynamics Observatory (SDO) and scientists were able to watch for the first time the very formation of something they had long theorized was at the heart of many eruptive events on the sun: a flux rope. Eight hours later, on July 19, the same region flared again. This time the flux rope's connection to the sun was severed, and the magnetic fields escaped into space, dragging billions of tons of solar material along for the ride -- a classic CME. "Seeing this structure was amazing," says Angelos Vourlidas, a solar scientist at the Naval Research Laboratory in Washington, D.C. "It looks exactly like the cartoon sketches theorists have been drawing of flux ropes since the 1970s. It was a series of figure eights lined up to look like a giant slinky on the sun." <b>To read more about this new discovery go to: <a href="http://1.usa.gov/14UHsTt" rel="nofollow">1.usa.gov/14UHsTt</a> </b> <b><a href="http://www.nasa.gov/audience/formedia/features/MP_Photo_Guidelines.html" rel="nofollow">NASA image use policy.</a></b> <b><a href="http://www.nasa.gov/centers/goddard/home/index.html" rel="nofollow">NASA Goddard Space Flight Center</a></b> enables NASA’s mission through four scientific endeavors: Earth Science, Heliophysics, Solar System Exploration, and Astrophysics. Goddard plays a leading role in NASA’s accomplishments by contributing compelling scientific knowledge to advance the Agency’s mission. <b>Follow us on <a href="http://twitter.com/NASA_GoddardPix" rel="nofollow">Twitter</a></b> <b>Like us on <a href="http://www.facebook.com/pages/Greenbelt-MD/NASA-Goddard/395013845897?ref=tsd" rel="nofollow">Facebook</a></b> <b>Find us on <a href="http://instagram.com/nasagoddard?vm=grid" rel="nofollow">Instagram</a></b>
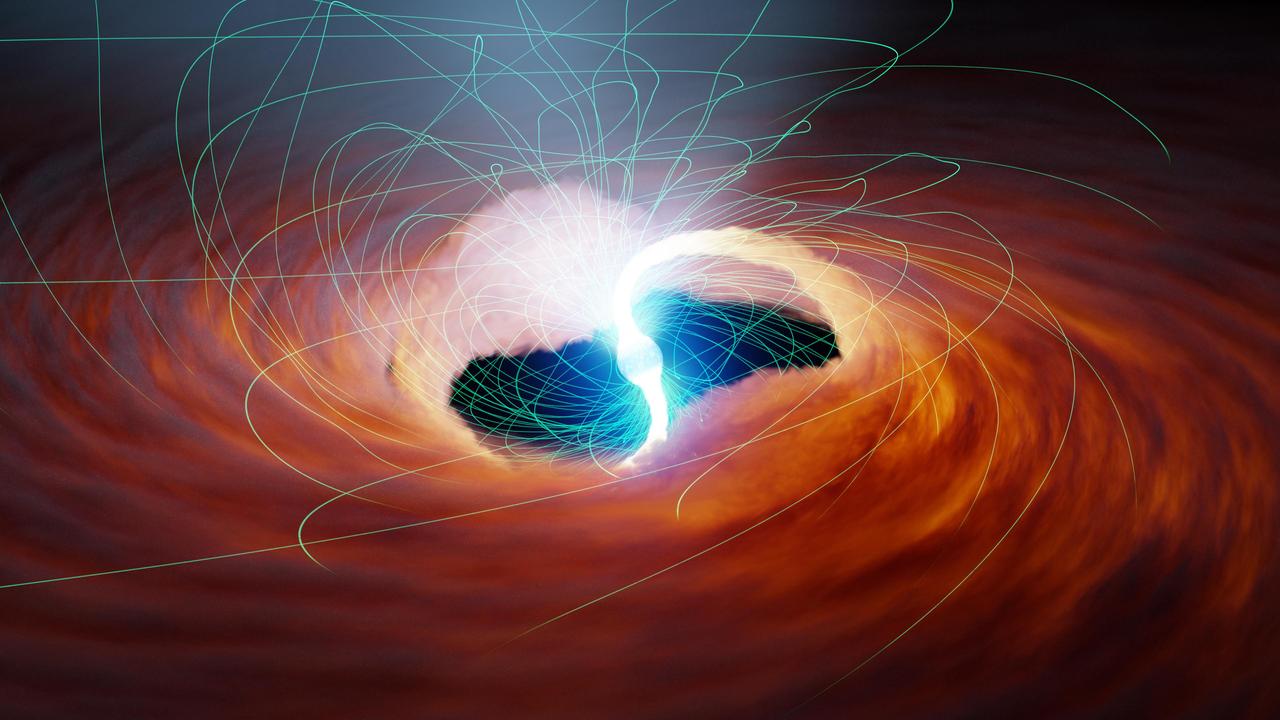
Two rivers of hot gas are siphoned onto the surface of a neutron star (the collapsed remains of a dead star) in this illustration. Neutron stars pack roughly the mass of our Sun into an area about 10 miles (6 kilometers) across. The gravity at the neutron star's surface is about 100 trillion times stronger than the gravitational pull on Earth's surface. Under those conditions, the captured gas accelerates to millions of miles per hour, releasing tremendous energy and radiation when it hits the neutron star's surface. Because these sources of light emit primarily X-rays, they are known as ultra-luminous X-ray sources (ULXs), and are visible by telescopes like NASA's NuSTAR (the Nuclear Spectroscopic Telescope Array). The neutron star's twisted magnetic field lines are illustrated in green. Some scientists hypothesize that strong magnetic fields like the ones produced by neutron stars can distort the normal shape of atoms from roughly spherical to elongated, stringy shapes. This may ultimately increase an object's maximum possible brightness. https://photojournal.jpl.nasa.gov/catalog/PIA25781
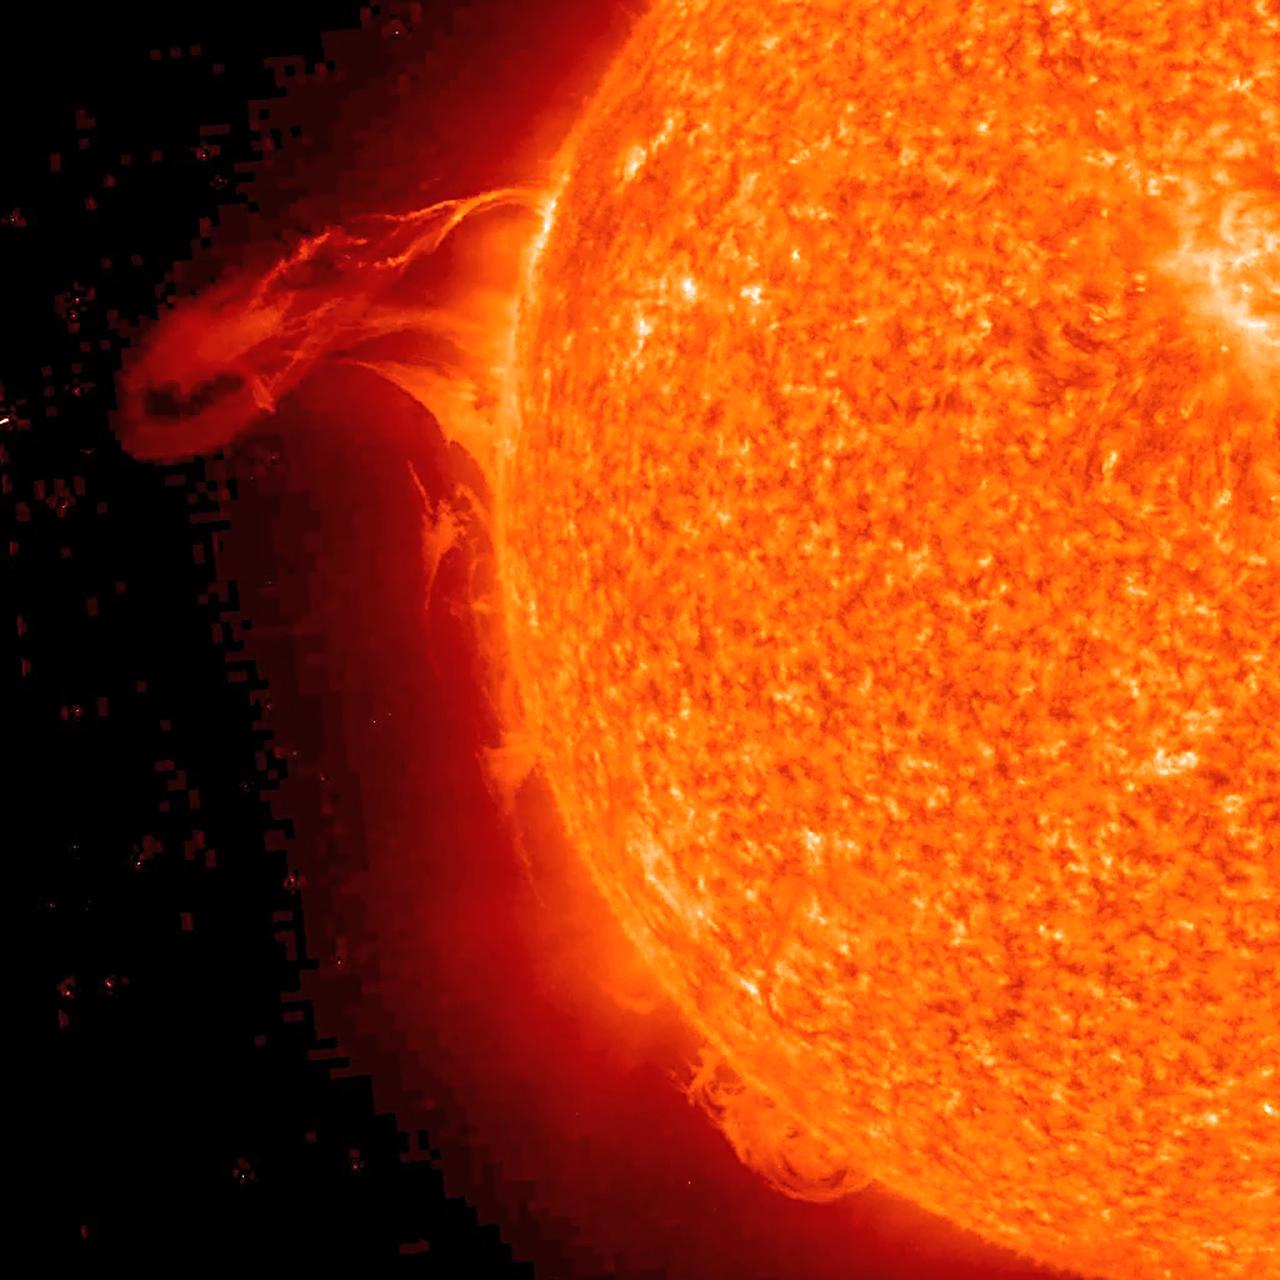
NASA image acquired May 1, 2010. As an active region rotated into view, it blew out three relatively small eruptions over about two days (Apr. 30 - May 2) as STEREO (Ahead) observed in extreme UV light. The first one was the largest and exhibited a pronounced twisting motion (shown in the still from May 1, 2010). The plasma, not far above the Sun's surface in these images, is ionized Helium heated to about 60,000 degrees. Note, too, the movement of plasma flowing along magnetic field lines that extend out beyond and loop back into the Sun's surface. Such activity occurs every day and is part of the dynamism of the changing Sun. Credit: NASA/GSFC/STEREO To learn more about STEREO go to: <a href="http://soho.nascom.nasa.gov/home.html" rel="nofollow">soho.nascom.nasa.gov/home.html</a> <b><a href="http://www.nasa.gov/centers/goddard/home/index.html" rel="nofollow">NASA Goddard Space Flight Center</a></b> is home to the nation's largest organization of combined scientists, engineers and technologists that build spacecraft, instruments and new technology to study the Earth, the sun, our solar system, and the universe.
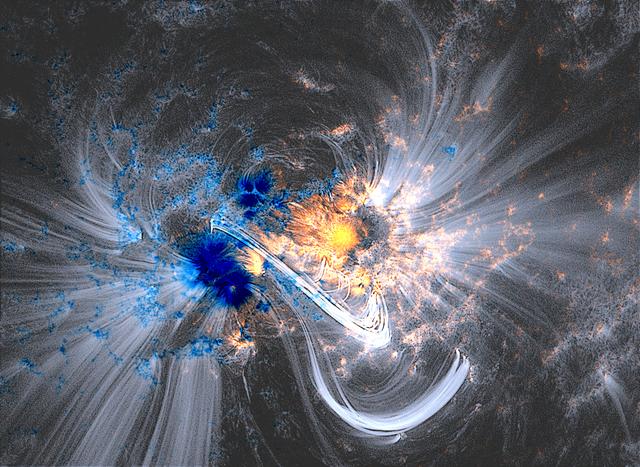
Magnetic Dance: Solar material traces out giant magnetic fields soaring through the sun to create what's called coronal loops. Here they can be seen as white lines in a sharpened AIA image from Oct. 24, 2014, laid over data from SDO's Helioseismic Magnetic Imager, which shows magnetic fields on the sun's surface in false color. Credit: NASA/SDO/HMI/AIA/LMSAL Read more: <a href="http://www.nasa.gov/content/goddard/sdo-telescope-collects-its-100-millionth-image/" rel="nofollow">www.nasa.gov/content/goddard/sdo-telescope-collects-its-1...</a> <b><a href="http://www.nasa.gov/audience/formedia/features/MP_Photo_Guidelines.html" rel="nofollow">NASA image use policy.</a></b> <b><a href="http://www.nasa.gov/centers/goddard/home/index.html" rel="nofollow">NASA Goddard Space Flight Center</a></b> enables NASA’s mission through four scientific endeavors: Earth Science, Heliophysics, Solar System Exploration, and Astrophysics. Goddard plays a leading role in NASA’s accomplishments by contributing compelling scientific knowledge to advance the Agency’s mission. <b>Follow us on <a href="http://twitter.com/NASAGoddardPix" rel="nofollow">Twitter</a></b> <b>Like us on <a href="http://www.facebook.com/pages/Greenbelt-MD/NASA-Goddard/395013845897?ref=tsd" rel="nofollow">Facebook</a></b> <b>Find us on <a href="http://instagram.com/nasagoddard?vm=grid" rel="nofollow">Instagram</a></b>

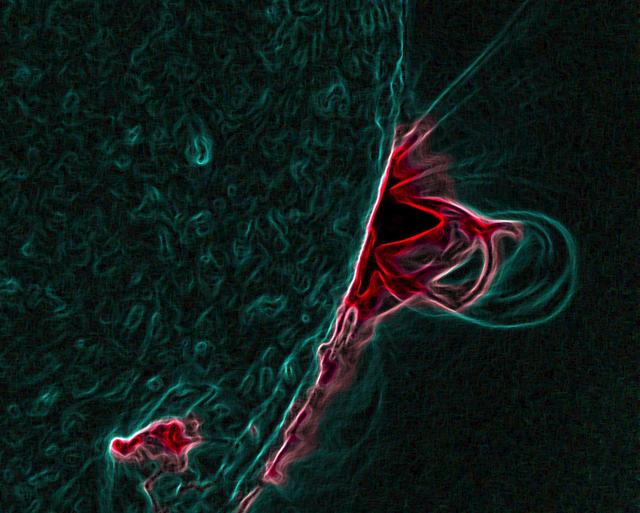
<b>To view a video of the Gradient Sun go to: <a href="http://www.flickr.com/photos/gsfc/8103212817">www.flickr.com/photos/gsfc/8103212817</a></b> Looking at a particularly beautiful image of the sun helps show how the lines between science and art can sometimes blur. But there is more to the connection between the two disciplines: science and art techniques are often quite similar, indeed one may inform the other or be improved based on lessons from the other arena. One such case is a technique known as a "gradient filter" – recognizable to many people as an option available on a photo-editing program. Gradients are, in fact, a mathematical description that highlights the places of greatest physical change in space. A gradient filter, in turn, enhances places of contrast, making them all the more obviously different, a useful tool when adjusting photos. Scientists, too, use gradient filters to enhance contrast, using them to accentuate fine structures that might otherwise be lost in the background noise. On the sun, for example, scientists wish to study a phenomenon known as coronal loops, which are giant arcs of solar material constrained to travel along that particular path by the magnetic fields in the sun's atmosphere. Observations of the loops, which can be more or less tangled and complex during different phases of the sun's 11-year activity cycle, can help researchers understand what's happening with the sun's complex magnetic fields, fields that can also power great eruptions on the sun such as solar flares or coronal mass ejections. The still here shows an unfiltered image from the sun next to one that has been processed using a gradient filter. Note how the coronal loops are sharp and defined, making them all the more easy to study. On the other hand, gradients also make great art. NASA/Goddard Space Flight Center To download this video go to: <a href="http://svs.gsfc.nasa.gov/goto?11112" rel="nofollow">svs.gsfc.nasa.gov/goto?11112</a> <b><a href="http://www.nasa.gov/audience/formedia/features/MP_Photo_Guidelines.html" rel="nofollow">NASA image use policy.</a></b> <b><a href="http://www.nasa.gov/centers/goddard/home/index.html" rel="nofollow">NASA Goddard Space Flight Center</a></b> enables NASA’s mission through four scientific endeavors: Earth Science, Heliophysics, Solar System Exploration, and Astrophysics. Goddard plays a leading role in NASA’s accomplishments by contributing compelling scientific knowledge to advance the Agency’s mission. <b>Follow us on <a href="http://twitter.com/NASA_GoddardPix" rel="nofollow">Twitter</a></b> <b>Like us on <a href="http://www.facebook.com/pages/Greenbelt-MD/NASA-Goddard/395013845897?ref=tsd" rel="nofollow">Facebook</a></b> <b>Find us on <a href="http://instagrid.me/nasagoddard/?vm=grid" rel="nofollow">Instagram</a></b>
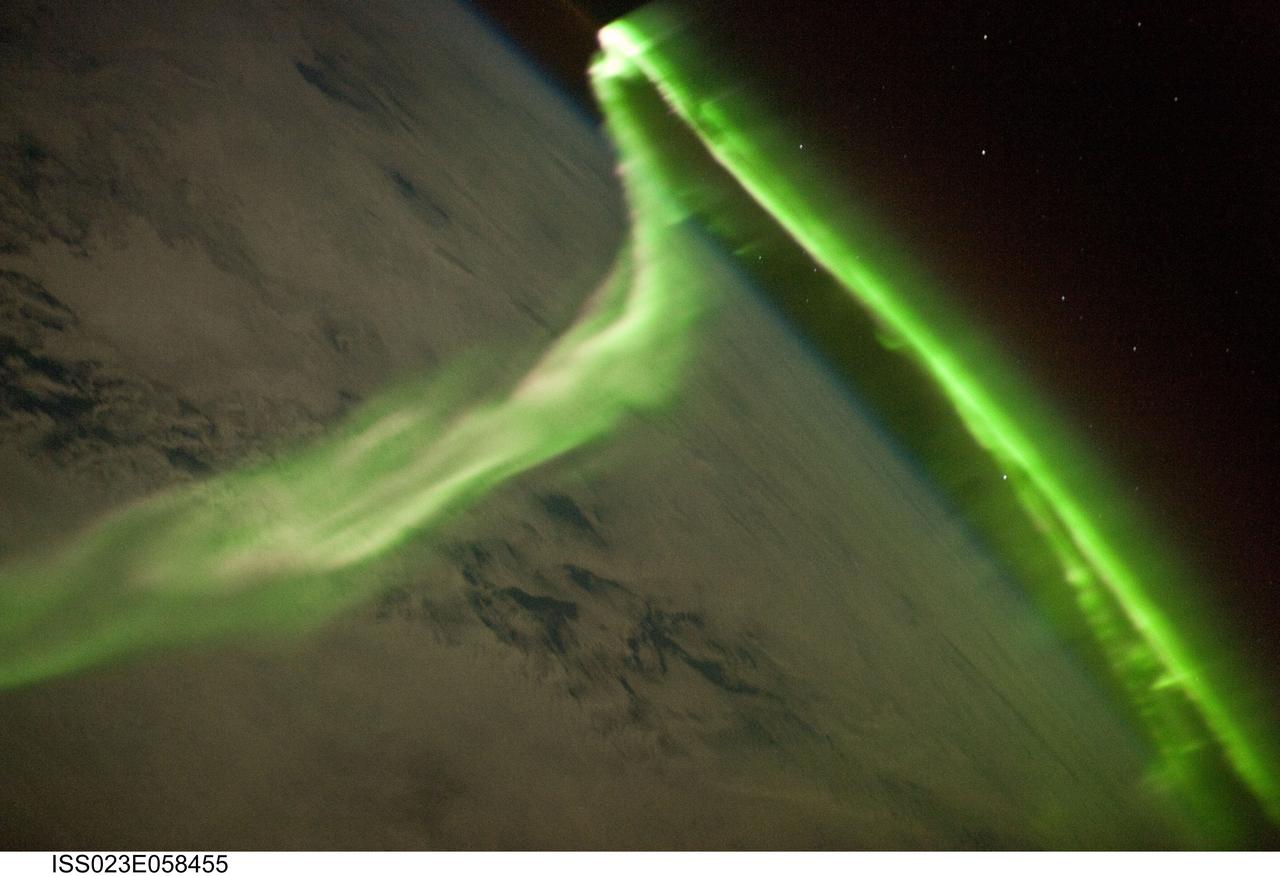
ISS023-E-058455 (29 May 2010) --- Aurora Australis is featured in this image photographed by an Expedition 23 crew member on the International Space Station. Among the views of Earth afforded crew members aboard the ISS, surely one of the most spectacular is of the aurora. These ever-shifting displays of colored ribbons, curtains, rays, and spots are most visible near the North (Aurora Borealis) and South (Aurora Australis) Poles as charged particles streaming from the sun (the solar wind) interact with Earth’s magnetic field, resulting in collisions with atoms of oxygen and nitrogen in the upper atmosphere. The atoms are excited by these collisions, and typically emit photons as a means of returning to their original energy state. The photons form the aurora that we see. The most commonly observed color of aurora is green, caused by photons (light) emitted by excited oxygen atoms at wavelengths centered at 0.558 micrometers, or millionths of a meter. Visible light is reflected from healthy (green) plant leaves at approximately the same wavelength. Red auroras are generated by light emitted at a longer wavelength (0.630 micrometers), and other colors such as blue and purple are also sometimes observed. While auroras are generally only visible close to the poles, severe magnetic storms impacting Earth’s magnetic field can shift them towards the equator. This striking aurora image was taken during a geomagnetic storm that was most likely caused by a coronal mass ejection from the sun on May 24, 2010. The ISS was located over the Southern Indian Ocean at an altitude of 350 kilometers, with the observer most likely looking towards Antarctica (not visible) and the South Pole. The aurora has a sinuous ribbon shape that separates into discrete spots near the lower right corner of the image. While the dominant coloration of the aurora is green, there are faint suggestions of red photon emission as well (light fuscia tones at center left). Dense cloud cover is dimly visible below the aurora. The curvature of Earth’s horizon, or limb, is clearly visible as is the faint blue line of the upper atmosphere directly above at top center. Several stars appear as bright pinpoints against the blackness of space at top right.
Caption: This is an image of magnetic loops on the sun, captured by NASA's Solar Dynamics Observatory (SDO). It has been processed to highlight the edges of each loop to make the structure more clear. A series of loops such as this is known as a flux rope, and these lie at the heart of eruptions on the sun known as coronal mass ejections (CMEs.) This is the first time scientists were able to discern the timing of a flux rope's formation. (Blended 131 Angstrom and 171 Angstrom images of July 19, 2012 flare and CME.) Credit: NASA/Goddard Space Flight Center/SDO ---- On July 18, 2012, a fairly small explosion of light burst off the lower right limb of the sun. Such flares often come with an associated eruption of solar material, known as a coronal mass ejection or CME – but this one did not. Something interesting did happen, however. Magnetic field lines in this area of the sun's atmosphere, the corona, began to twist and kink, generating the hottest solar material – a charged gas called plasma – to trace out the newly-formed slinky shape. The plasma glowed brightly in extreme ultraviolet images from the Atmospheric Imaging Assembly (AIA) aboard NASA’s Solar Dynamics Observatory (SDO) and scientists were able to watch for the first time the very formation of something they had long theorized was at the heart of many eruptive events on the sun: a flux rope. Eight hours later, on July 19, the same region flared again. This time the flux rope's connection to the sun was severed, and the magnetic fields escaped into space, dragging billions of tons of solar material along for the ride -- a classic CME. "Seeing this structure was amazing," says Angelos Vourlidas, a solar scientist at the Naval Research Laboratory in Washington, D.C. "It looks exactly like the cartoon sketches theorists have been drawing of flux ropes since the 1970s. It was a series of figure eights lined up to look like a giant slinky on the sun." <b>To read more about this new discovery go to: <a href="http://1.usa.gov/14UHsTt" rel="nofollow">1.usa.gov/14UHsTt</a> </b> <b><a href="http://www.nasa.gov/audience/formedia/features/MP_Photo_Guidelines.html" rel="nofollow">NASA image use policy.</a></b> <b><a href="http://www.nasa.gov/centers/goddard/home/index.html" rel="nofollow">NASA Goddard Space Flight Center</a></b> enables NASA’s mission through four scientific endeavors: Earth Science, Heliophysics, Solar System Exploration, and Astrophysics. Goddard plays a leading role in NASA’s accomplishments by contributing compelling scientific knowledge to advance the Agency’s mission. <b>Follow us on <a href="http://twitter.com/NASA_GoddardPix" rel="nofollow">Twitter</a></b> <b>Like us on <a href="http://www.facebook.com/pages/Greenbelt-MD/NASA-Goddard/395013845897?ref=tsd" rel="nofollow">Facebook</a></b> <b>Find us on <a href="http://instagram.com/nasagoddard?vm=grid" rel="nofollow">Instagram</a></b>
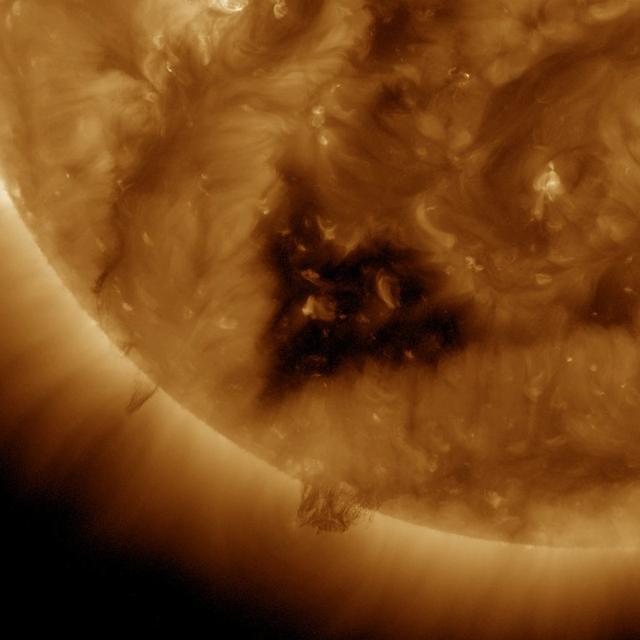
This Solar Dynamics Observatory (SDO) image of the Sun taken on January 20, 2012 in extreme ultraviolet light captures a heart-shaped dark coronal hole. Coronal holes are areas of the Sun's surface that are the source of open magnetic field lines that head way out into space. They are also the source regions of the fast solar wind, which is characterized by a relatively steady speed of approximately 800 km/s (about 1.8 million mph). <b><a href="http://www.nasa.gov/audience/formedia/features/MP_Photo_Guidelines.html" rel="nofollow">NASA image use policy.</a></b> <b><a href="http://www.nasa.gov/centers/goddard/home/index.html" rel="nofollow">NASA Goddard Space Flight Center</a></b> enables NASA’s mission through four scientific endeavors: Earth Science, Heliophysics, Solar System Exploration, and Astrophysics. Goddard plays a leading role in NASA’s accomplishments by contributing compelling scientific knowledge to advance the Agency’s mission. <b>Follow us on <a href="http://twitter.com/NASA_GoddardPix" rel="nofollow">Twitter</a></b> <b>Like us on <a href="http://www.facebook.com/pages/Greenbelt-MD/NASA-Goddard/395013845897?ref=tsd" rel="nofollow">Facebook</a></b> <b>Find us on <a href="http://instagram.com/nasagoddard?vm=grid" rel="nofollow">Instagram</a></b>

This Solar Dynamics Observatory (SDO) image of the Sun taken on January 20, 2012 in extreme ultraviolet light captures a heart-shaped dark coronal hole. Coronal holes are areas of the Sun's surface that are the source of open magnetic field lines that head way out into space. They are also the source regions of the fast solar wind, which is characterized by a relatively steady speed of approximately 800 km/s (about 1.8 million mph). <b><a href="http://www.nasa.gov/audience/formedia/features/MP_Photo_Guidelines.html" rel="nofollow">NASA image use policy.</a></b> <b><a href="http://www.nasa.gov/centers/goddard/home/index.html" rel="nofollow">NASA Goddard Space Flight Center</a></b> enables NASA’s mission through four scientific endeavors: Earth Science, Heliophysics, Solar System Exploration, and Astrophysics. Goddard plays a leading role in NASA’s accomplishments by contributing compelling scientific knowledge to advance the Agency’s mission. <b>Follow us on <a href="http://twitter.com/NASA_GoddardPix" rel="nofollow">Twitter</a></b> <b>Like us on <a href="http://www.facebook.com/pages/Greenbelt-MD/NASA-Goddard/395013845897?ref=tsd" rel="nofollow">Facebook</a></b> <b>Find us on <a href="http://instagram.com/nasagoddard?vm=grid" rel="nofollow">Instagram</a></b>
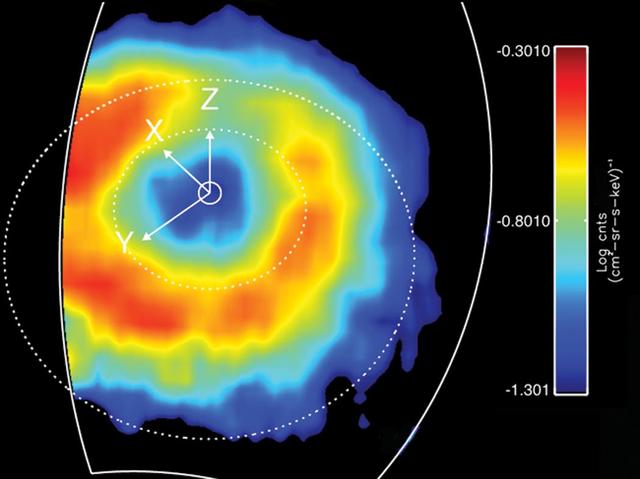
Like Earth, Saturn has an invisible ring of energetic ions trapped in its magnetic field. This feature is known as a "ring current." This ring current has been imaged with a special camera on Cassini sensitive to energetic neutral atoms. This is a false color map of the intensity of the energetic neutral atoms emitted from the ring current through a processed called charged exchange. In this process a trapped energetic ion steals and electron from cold gas atoms and becomes neutral and escapes the magnetic field. The Cassini Magnetospheric Imaging Instrument's ion and neutral camera records the intensity of the escaping particles, which provides a map of the ring current. In this image, the colors represent the intensity of the neutral emission, which is a reflection of the trapped ions. This "ring" is much farther from Saturn (roughly five times farther) than Saturn's famous icy rings. Red in the image represents the higher intensity of the particles, while blue is less intense. Saturn's ring current had not been mapped before on a global scale, only "snippets" or areas were mapped previously but not in this detail. This instrument allows scientists to produce movies (see PIA10083) that show how this ring changes over time. These movies reveal a dynamic system, which is usually not as uniform as depicted in this image. The ring current is doughnut shaped but in some instances it appears as if someone took a bite out of it. This image was obtained on March 19, 2007, at a latitude of about 54.5 degrees and radial distance 1.5 million kilometres (920,000 miles). Saturn is at the center, and the dotted circles represent the orbits of the moon's Rhea and Titan. The Z axis points parallel to Saturn's spin axis, the X axis points roughly sunward in the sun-spin axis plane, and the Y axis completes the system, pointing roughly toward dusk. The ion and neutral camera's field of view is marked by the white line and accounts for the cut-off of the image on the left. The image is an average of the activity over a (roughly) 3-hour period. http://photojournal.jpl.nasa.gov/catalog/PIA10094
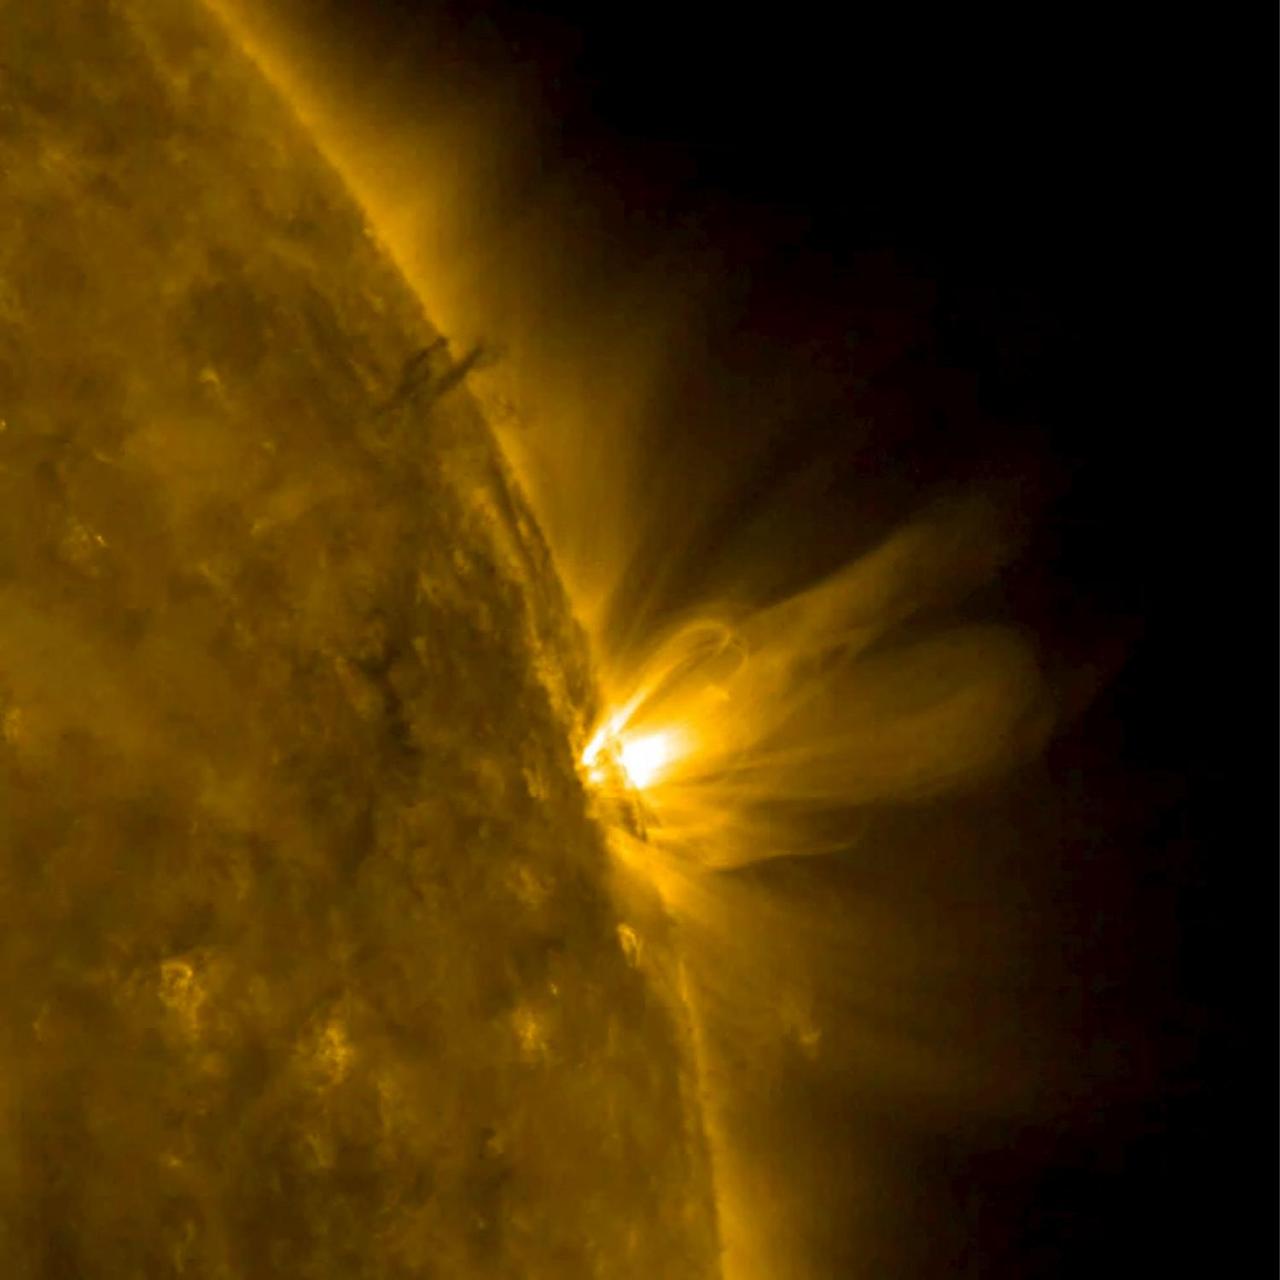
This close-up image of the sun presents an active region in profile as it rotated out of view. We can observe both the bright arching field lines and smaller pieces of darker matter in their midst being pulled back and forth just above the Sun's surface over about 36 hours (July 20-22, 2011). Both of these physical responses were caused by strong, tangled magnetic forces that are constantly evolving and reorganizing within the active region. Other active regions can be seen in the foreground as well. The image and movie were taken in extreme ultraviolet light of ionized iron heated to one million degrees. To view a hd video of this event go here: <a href="http://www.flickr.com/photos/gsfc/6006013038">www.flickr.com/photos/gsfc/6006013038</a> Credit: NASA/GSFC/SDO <b><a href="http://www.nasa.gov/centers/goddard/home/index.html" rel="nofollow">NASA Goddard Space Flight Center</a></b> enables NASA’s mission through four scientific endeavors: Earth Science, Heliophysics, Solar System Exploration, and Astrophysics. Goddard plays a leading role in NASA’s accomplishments by contributing compelling scientific knowledge to advance the Agency’s mission. <b>Follow us on <a href="http://twitter.com/NASA_GoddardPix" rel="nofollow">Twitter</a></b> <b>Like us on <a href="http://www.facebook.com/pages/Greenbelt-MD/NASA-Goddard/395013845897?ref=tsd" rel="nofollow">Facebook</a></b> <b>Find us on <a href="http://web.stagram.com/n/nasagoddard/?vm=grid" rel="nofollow">Instagram</a></b>
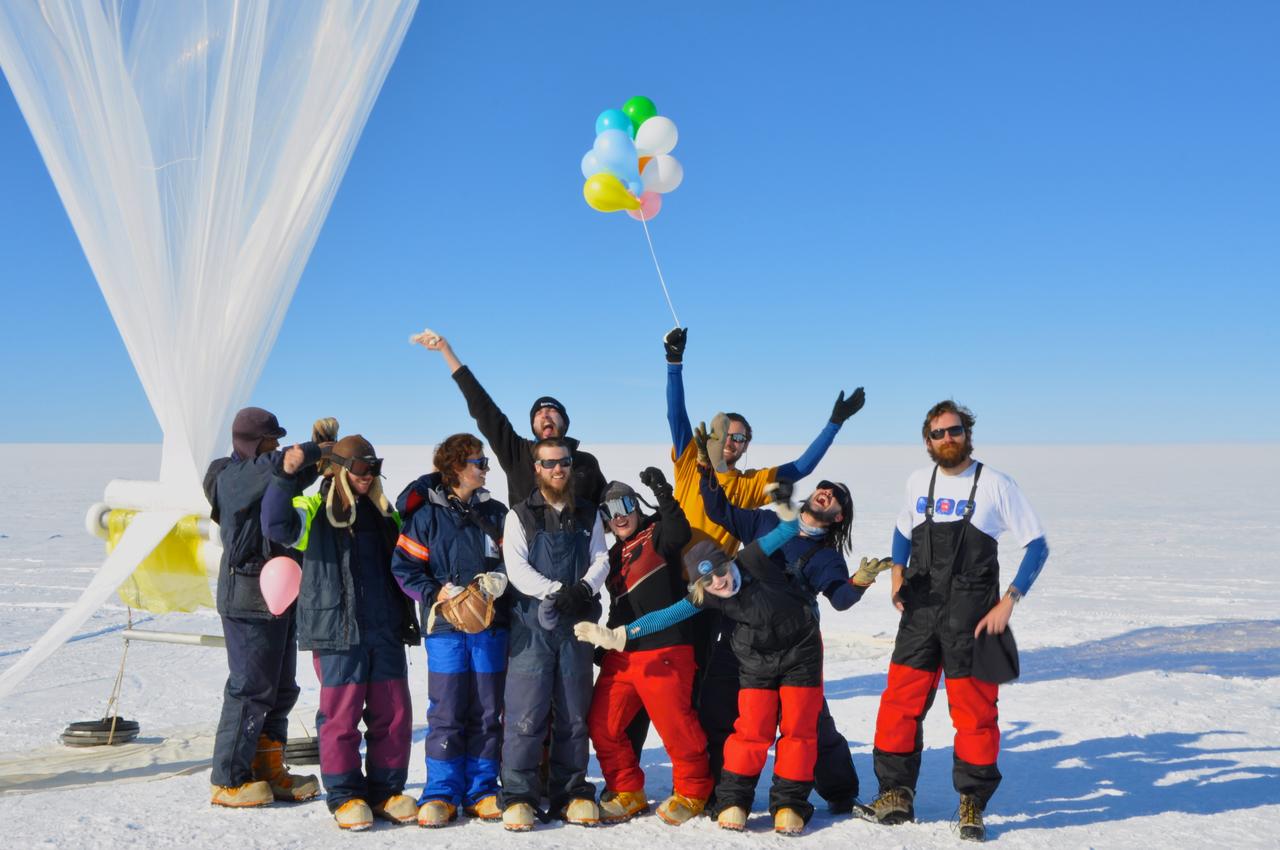
The BARREL team at the SANAE IV research station celebrates their final launch in the Antarctica sun. Credit: NASA --- In Antarctica in January, 2013 – the summer at the South Pole – scientists launched 20 balloons up into the air to study an enduring mystery of space weather: when the giant radiation belts surrounding Earth lose material, where do the extra particles actually go? The mission is called BARREL (Balloon Array for Radiation belt Relativistic Electron Losses) and it is led by physicist Robyn Millan of Dartmouth College in Hanover, NH. Millan provided photographs from the team’s time in Antarctica. The team launched a balloon every day or two into the circumpolar winds that circulate around the pole. Each balloon floated for anywhere from 3 to 40 days, measuring X-rays produced by fast-moving electrons high up in the atmosphere. BARREL works hand in hand with another NASA mission called the Van Allen Probes, which travels through the Van Allen radiation belts surrounding Earth. The belts wax and wane over time in response to incoming energy and material from the sun, sometimes intensifying the radiation through which satellites must travel. Scientists wish to understand this process better, and even provide forecasts of this space weather, in order to protect our spacecraft. As the Van Allen Probes were observing what was happening in the belts, BARREL tracked electrons that precipitated out of the belts and hurtled down Earth’s magnetic field lines toward the poles. By comparing data, scientists will be able to track how what’s happening in the belts correlates to the loss of particles – information that can help us understand this mysterious, dynamic region that can impact spacecraft. Having launched balloons in early 2013, the team is back at home building the next set of payloads. They will launch 20 more balloons in 2014. <b><a href="http://www.nasa.gov/audience/formedia/features/MP_Photo_Guidelines.html" rel="nofollow">NASA image use policy.</a></b> <b><a href="http://www.nasa.gov/centers/goddard/home/index.html" rel="nofollow">NASA Goddard Space Flight Center</a></b> enables NASA’s mission through four scientific endeavors: Earth Science, Heliophysics, Solar System Exploration, and Astrophysics. Goddard plays a leading role in NASA’s accomplishments by contributing compelling scientific knowledge to advance the Agency’s mission. <b>Follow us on <a href="http://twitter.com/NASA_GoddardPix" rel="nofollow">Twitter</a></b> <b>Like us on <a href="http://www.facebook.com/pages/Greenbelt-MD/NASA-Goddard/395013845897?ref=tsd" rel="nofollow">Facebook</a></b> <b>Find us on <a href="http://instagram.com/nasagoddard?vm=grid" rel="nofollow">Instagram</a></b>
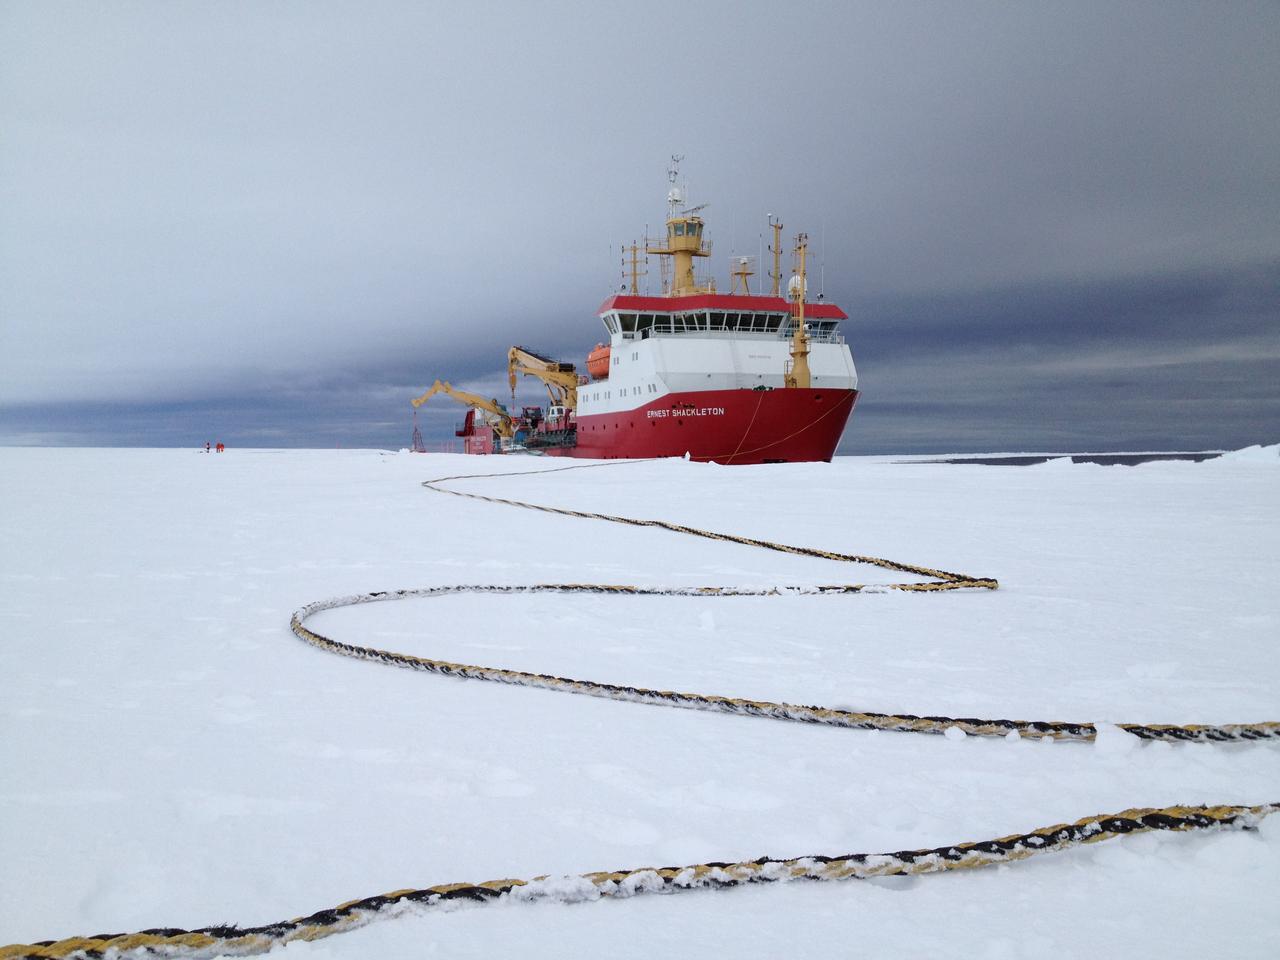
Arrival of the RRS Ernest Shackleton near Halley Research Station in Antarctica. The Shackleton is the regular resupply ship for the station and it also brought in some of the BARREL team scientists. The long tether is for the ship’s mooring. Credit: NASA --- In Antarctica in January, 2013 – the summer at the South Pole – scientists launched 20 balloons up into the air to study an enduring mystery of space weather: when the giant radiation belts surrounding Earth lose material, where do the extra particles actually go? The mission is called BARREL (Balloon Array for Radiation belt Relativistic Electron Losses) and it is led by physicist Robyn Millan of Dartmouth College in Hanover, NH. Millan provided photographs from the team’s time in Antarctica. The team launched a balloon every day or two into the circumpolar winds that circulate around the pole. Each balloon floated for anywhere from 3 to 40 days, measuring X-rays produced by fast-moving electrons high up in the atmosphere. BARREL works hand in hand with another NASA mission called the Van Allen Probes, which travels through the Van Allen radiation belts surrounding Earth. The belts wax and wane over time in response to incoming energy and material from the sun, sometimes intensifying the radiation through which satellites must travel. Scientists wish to understand this process better, and even provide forecasts of this space weather, in order to protect our spacecraft. As the Van Allen Probes were observing what was happening in the belts, BARREL tracked electrons that precipitated out of the belts and hurtled down Earth’s magnetic field lines toward the poles. By comparing data, scientists will be able to track how what’s happening in the belts correlates to the loss of particles – information that can help us understand this mysterious, dynamic region that can impact spacecraft. Having launched balloons in early 2013, the team is back at home building the next set of payloads. They will launch 20 more balloons in 2014. <b><a href="http://www.nasa.gov/audience/formedia/features/MP_Photo_Guidelines.html" rel="nofollow">NASA image use policy.</a></b> <b><a href="http://www.nasa.gov/centers/goddard/home/index.html" rel="nofollow">NASA Goddard Space Flight Center</a></b> enables NASA’s mission through four scientific endeavors: Earth Science, Heliophysics, Solar System Exploration, and Astrophysics. Goddard plays a leading role in NASA’s accomplishments by contributing compelling scientific knowledge to advance the Agency’s mission. <b>Follow us on <a href="http://twitter.com/NASA_GoddardPix" rel="nofollow">Twitter</a></b> <b>Like us on <a href="http://www.facebook.com/pages/Greenbelt-MD/NASA-Goddard/395013845897?ref=tsd" rel="nofollow">Facebook</a></b> <b>Find us on <a href="http://instagram.com/nasagoddard?vm=grid" rel="nofollow">Instagram</a></b>
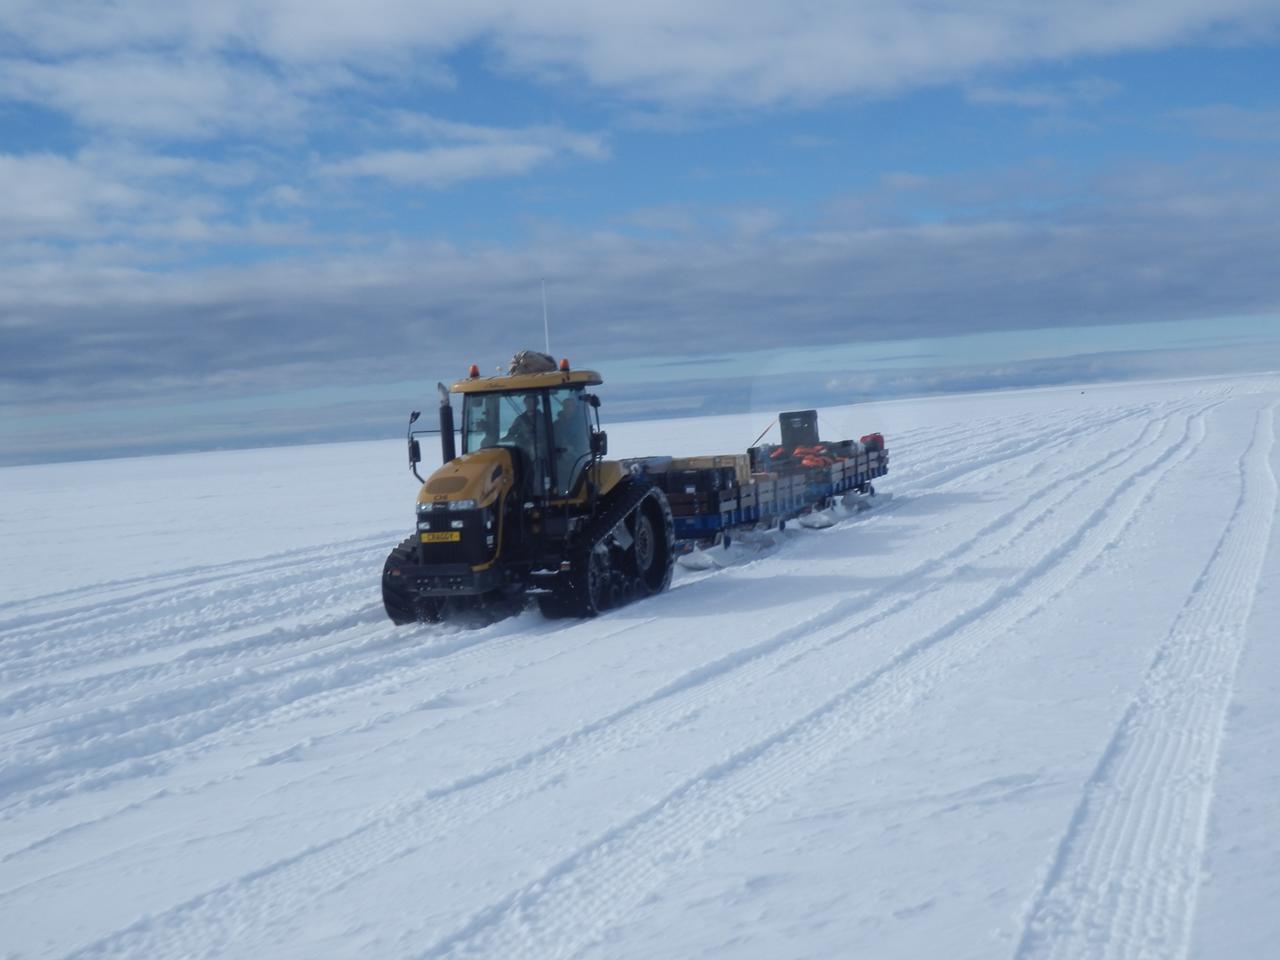
The BARREL cargo on its four-hour journey from the supply ship to the research station. Credit: NASA --- In Antarctica in January, 2013 – the summer at the South Pole – scientists launched 20 balloons up into the air to study an enduring mystery of space weather: when the giant radiation belts surrounding Earth lose material, where do the extra particles actually go? The mission is called BARREL (Balloon Array for Radiation belt Relativistic Electron Losses) and it is led by physicist Robyn Millan of Dartmouth College in Hanover, NH. Millan provided photographs from the team’s time in Antarctica. The team launched a balloon every day or two into the circumpolar winds that circulate around the pole. Each balloon floated for anywhere from 3 to 40 days, measuring X-rays produced by fast-moving electrons high up in the atmosphere. BARREL works hand in hand with another NASA mission called the Van Allen Probes, which travels through the Van Allen radiation belts surrounding Earth. The belts wax and wane over time in response to incoming energy and material from the sun, sometimes intensifying the radiation through which satellites must travel. Scientists wish to understand this process better, and even provide forecasts of this space weather, in order to protect our spacecraft. As the Van Allen Probes were observing what was happening in the belts, BARREL tracked electrons that precipitated out of the belts and hurtled down Earth’s magnetic field lines toward the poles. By comparing data, scientists will be able to track how what’s happening in the belts correlates to the loss of particles – information that can help us understand this mysterious, dynamic region that can impact spacecraft. Having launched balloons in early 2013, the team is back at home building the next set of payloads. They will launch 20 more balloons in 2014. <b><a href="http://www.nasa.gov/audience/formedia/features/MP_Photo_Guidelines.html" rel="nofollow">NASA image use policy.</a></b> <b><a href="http://www.nasa.gov/centers/goddard/home/index.html" rel="nofollow">NASA Goddard Space Flight Center</a></b> enables NASA’s mission through four scientific endeavors: Earth Science, Heliophysics, Solar System Exploration, and Astrophysics. Goddard plays a leading role in NASA’s accomplishments by contributing compelling scientific knowledge to advance the Agency’s mission. <b>Follow us on <a href="http://twitter.com/NASA_GoddardPix" rel="nofollow">Twitter</a></b> <b>Like us on <a href="http://www.facebook.com/pages/Greenbelt-MD/NASA-Goddard/395013845897?ref=tsd" rel="nofollow">Facebook</a></b> <b>Find us on <a href="http://instagram.com/nasagoddard?vm=grid" rel="nofollow">Instagram</a></b>

Pumping helium into the first BARREL balloon to launch from Halley Research Satation. Credit: NASA --- In Antarctica in January, 2013 – the summer at the South Pole – scientists launched 20 balloons up into the air to study an enduring mystery of space weather: when the giant radiation belts surrounding Earth lose material, where do the extra particles actually go? The mission is called BARREL (Balloon Array for Radiation belt Relativistic Electron Losses) and it is led by physicist Robyn Millan of Dartmouth College in Hanover, NH. Millan provided photographs from the team’s time in Antarctica. The team launched a balloon every day or two into the circumpolar winds that circulate around the pole. Each balloon floated for anywhere from 3 to 40 days, measuring X-rays produced by fast-moving electrons high up in the atmosphere. BARREL works hand in hand with another NASA mission called the Van Allen Probes, which travels through the Van Allen radiation belts surrounding Earth. The belts wax and wane over time in response to incoming energy and material from the sun, sometimes intensifying the radiation through which satellites must travel. Scientists wish to understand this process better, and even provide forecasts of this space weather, in order to protect our spacecraft. As the Van Allen Probes were observing what was happening in the belts, BARREL tracked electrons that precipitated out of the belts and hurtled down Earth’s magnetic field lines toward the poles. By comparing data, scientists will be able to track how what’s happening in the belts correlates to the loss of particles – information that can help us understand this mysterious, dynamic region that can impact spacecraft. Having launched balloons in early 2013, the team is back at home building the next set of payloads. They will launch 20 more balloons in 2014. <b><a href="http://www.nasa.gov/audience/formedia/features/MP_Photo_Guidelines.html" rel="nofollow">NASA image use policy.</a></b> <b><a href="http://www.nasa.gov/centers/goddard/home/index.html" rel="nofollow">NASA Goddard Space Flight Center</a></b> enables NASA’s mission through four scientific endeavors: Earth Science, Heliophysics, Solar System Exploration, and Astrophysics. Goddard plays a leading role in NASA’s accomplishments by contributing compelling scientific knowledge to advance the Agency’s mission. <b>Follow us on <a href="http://twitter.com/NASA_GoddardPix" rel="nofollow">Twitter</a></b> <b>Like us on <a href="http://www.facebook.com/pages/Greenbelt-MD/NASA-Goddard/395013845897?ref=tsd" rel="nofollow">Facebook</a></b> <b>Find us on <a href="http://instagram.com/nasagoddard?vm=grid" rel="nofollow">Instagram</a></b>

A crane lowers two BARREL balloon payloads onto the platform at Halley Research Station in Antarctica. Credit: NASA --- In Antarctica in January, 2013 – the summer at the South Pole – scientists launched 20 balloons up into the air to study an enduring mystery of space weather: when the giant radiation belts surrounding Earth lose material, where do the extra particles actually go? The mission is called BARREL (Balloon Array for Radiation belt Relativistic Electron Losses) and it is led by physicist Robyn Millan of Dartmouth College in Hanover, NH. Millan provided photographs from the team’s time in Antarctica. The team launched a balloon every day or two into the circumpolar winds that circulate around the pole. Each balloon floated for anywhere from 3 to 40 days, measuring X-rays produced by fast-moving electrons high up in the atmosphere. BARREL works hand in hand with another NASA mission called the Van Allen Probes, which travels through the Van Allen radiation belts surrounding Earth. The belts wax and wane over time in response to incoming energy and material from the sun, sometimes intensifying the radiation through which satellites must travel. Scientists wish to understand this process better, and even provide forecasts of this space weather, in order to protect our spacecraft. As the Van Allen Probes were observing what was happening in the belts, BARREL tracked electrons that precipitated out of the belts and hurtled down Earth’s magnetic field lines toward the poles. By comparing data, scientists will be able to track how what’s happening in the belts correlates to the loss of particles – information that can help us understand this mysterious, dynamic region that can impact spacecraft. Having launched balloons in early 2013, the team is back at home building the next set of payloads. They will launch 20 more balloons in 2014. <b><a href="http://www.nasa.gov/audience/formedia/features/MP_Photo_Guidelines.html" rel="nofollow">NASA image use policy.</a></b> <b><a href="http://www.nasa.gov/centers/goddard/home/index.html" rel="nofollow">NASA Goddard Space Flight Center</a></b> enables NASA’s mission through four scientific endeavors: Earth Science, Heliophysics, Solar System Exploration, and Astrophysics. Goddard plays a leading role in NASA’s accomplishments by contributing compelling scientific knowledge to advance the Agency’s mission. <b>Follow us on <a href="http://twitter.com/NASA_GoddardPix" rel="nofollow">Twitter</a></b> <b>Like us on <a href="http://www.facebook.com/pages/Greenbelt-MD/NASA-Goddard/395013845897?ref=tsd" rel="nofollow">Facebook</a></b> <b>Find us on <a href="http://instagram.com/nasagoddard?vm=grid" rel="nofollow">Instagram</a></b>
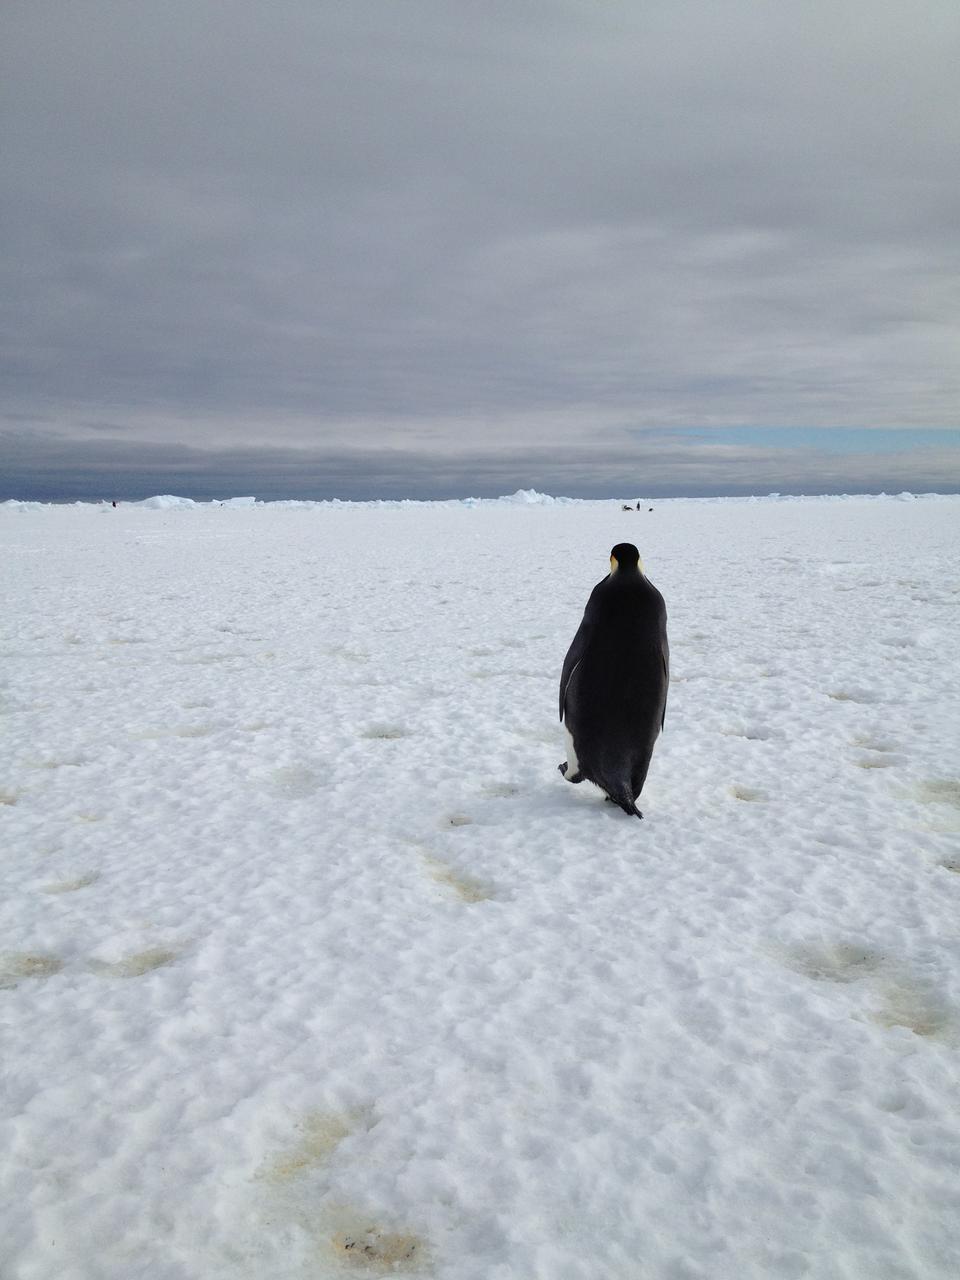
An emperor penguin waddles away on Christmas morning in Antarctica. On Christmas day, the BARREL team visited a penguin colony. Credit: NASA --- In Antarctica in January, 2013 – the summer at the South Pole – scientists launched 20 balloons up into the air to study an enduring mystery of space weather: when the giant radiation belts surrounding Earth lose material, where do the extra particles actually go? The mission is called BARREL (Balloon Array for Radiation belt Relativistic Electron Losses) and it is led by physicist Robyn Millan of Dartmouth College in Hanover, NH. Millan provided photographs from the team’s time in Antarctica. The team launched a balloon every day or two into the circumpolar winds that circulate around the pole. Each balloon floated for anywhere from 3 to 40 days, measuring X-rays produced by fast-moving electrons high up in the atmosphere. BARREL works hand in hand with another NASA mission called the Van Allen Probes, which travels through the Van Allen radiation belts surrounding Earth. The belts wax and wane over time in response to incoming energy and material from the sun, sometimes intensifying the radiation through which satellites must travel. Scientists wish to understand this process better, and even provide forecasts of this space weather, in order to protect our spacecraft. As the Van Allen Probes were observing what was happening in the belts, BARREL tracked electrons that precipitated out of the belts and hurtled down Earth’s magnetic field lines toward the poles. By comparing data, scientists will be able to track how what’s happening in the belts correlates to the loss of particles – information that can help us understand this mysterious, dynamic region that can impact spacecraft. Having launched balloons in early 2013, the team is back at home building the next set of payloads. They will launch 20 more balloons in 2014. <b><a href="http://www.nasa.gov/audience/formedia/features/MP_Photo_Guidelines.html" rel="nofollow">NASA image use policy.</a></b> <b><a href="http://www.nasa.gov/centers/goddard/home/index.html" rel="nofollow">NASA Goddard Space Flight Center</a></b> enables NASA’s mission through four scientific endeavors: Earth Science, Heliophysics, Solar System Exploration, and Astrophysics. Goddard plays a leading role in NASA’s accomplishments by contributing compelling scientific knowledge to advance the Agency’s mission. <b>Follow us on <a href="http://twitter.com/NASA_GoddardPix" rel="nofollow">Twitter</a></b> <b>Like us on <a href="http://www.facebook.com/pages/Greenbelt-MD/NASA-Goddard/395013845897?ref=tsd" rel="nofollow">Facebook</a></b> <b>Find us on <a href="http://instagram.com/nasagoddard?vm=grid" rel="nofollow">Instagram</a></b>
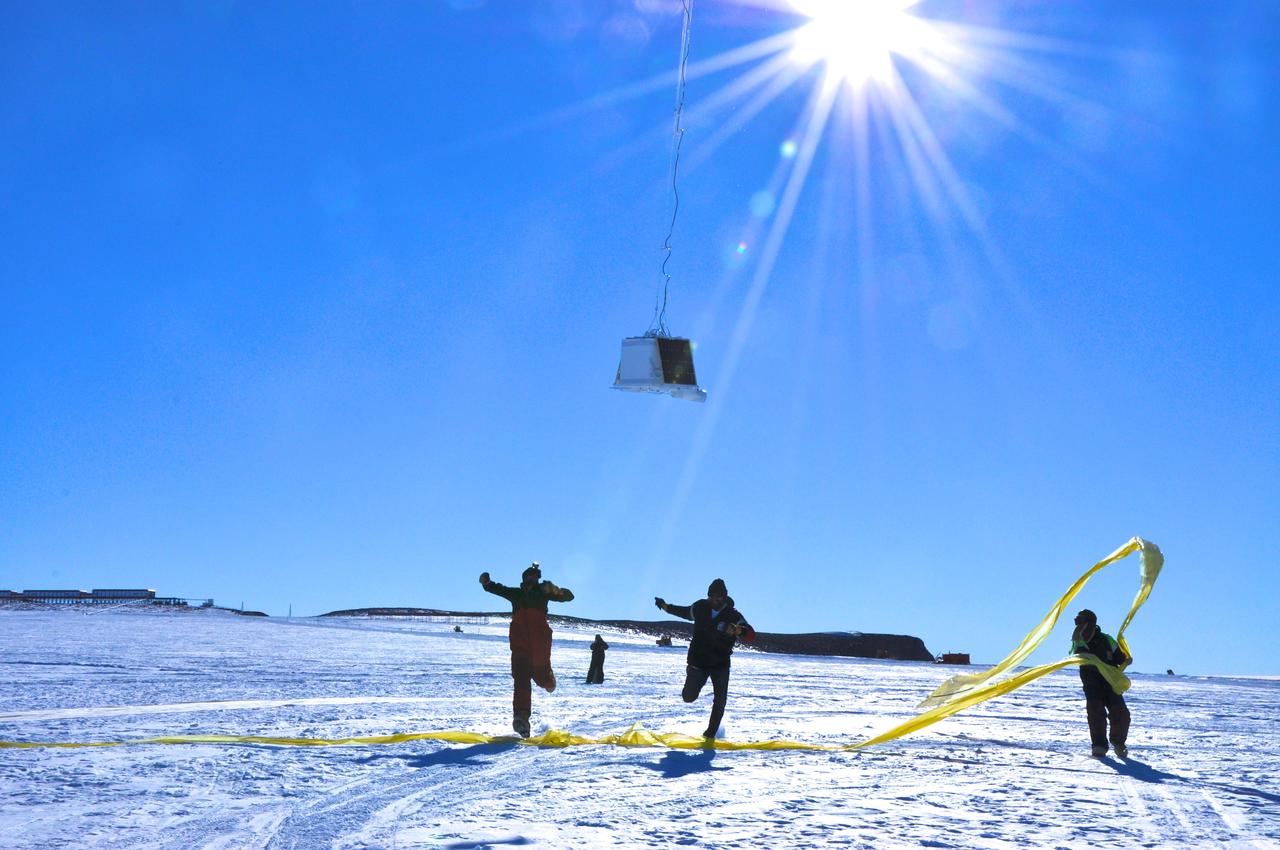
BARREL team members run under the payload as the balloon first takes flight at the SANAE IV research station in Antarctica. Credit: NASA --- In Antarctica in January, 2013 – the summer at the South Pole – scientists launched 20 balloons up into the air to study an enduring mystery of space weather: when the giant radiation belts surrounding Earth lose material, where do the extra particles actually go? The mission is called BARREL (Balloon Array for Radiation belt Relativistic Electron Losses) and it is led by physicist Robyn Millan of Dartmouth College in Hanover, NH. Millan provided photographs from the team’s time in Antarctica. The team launched a balloon every day or two into the circumpolar winds that circulate around the pole. Each balloon floated for anywhere from 3 to 40 days, measuring X-rays produced by fast-moving electrons high up in the atmosphere. BARREL works hand in hand with another NASA mission called the Van Allen Probes, which travels through the Van Allen radiation belts surrounding Earth. The belts wax and wane over time in response to incoming energy and material from the sun, sometimes intensifying the radiation through which satellites must travel. Scientists wish to understand this process better, and even provide forecasts of this space weather, in order to protect our spacecraft. As the Van Allen Probes were observing what was happening in the belts, BARREL tracked electrons that precipitated out of the belts and hurtled down Earth’s magnetic field lines toward the poles. By comparing data, scientists will be able to track how what’s happening in the belts correlates to the loss of particles – information that can help us understand this mysterious, dynamic region that can impact spacecraft. Having launched balloons in early 2013, the team is back at home building the next set of payloads. They will launch 20 more balloons in 2014. <b><a href="http://www.nasa.gov/audience/formedia/features/MP_Photo_Guidelines.html" rel="nofollow">NASA image use policy.</a></b> <b><a href="http://www.nasa.gov/centers/goddard/home/index.html" rel="nofollow">NASA Goddard Space Flight Center</a></b> enables NASA’s mission through four scientific endeavors: Earth Science, Heliophysics, Solar System Exploration, and Astrophysics. Goddard plays a leading role in NASA’s accomplishments by contributing compelling scientific knowledge to advance the Agency’s mission. <b>Follow us on <a href="http://twitter.com/NASA_GoddardPix" rel="nofollow">Twitter</a></b> <b>Like us on <a href="http://www.facebook.com/pages/Greenbelt-MD/NASA-Goddard/395013845897?ref=tsd" rel="nofollow">Facebook</a></b> <b>Find us on <a href="http://instagram.com/nasagoddard?vm=grid" rel="nofollow">Instagram</a></b>

Some of the BARREL balloon launches took place at the South African National Antarctic Expedition Research base, called SANAE IV, the others at Halley Research Station. This balloon is taking flight at SANAE IV. Credit: NASA --- In Antarctica in January, 2013 – the summer at the South Pole – scientists launched 20 balloons up into the air to study an enduring mystery of space weather: when the giant radiation belts surrounding Earth lose material, where do the extra particles actually go? The mission is called BARREL (Balloon Array for Radiation belt Relativistic Electron Losses) and it is led by physicist Robyn Millan of Dartmouth College in Hanover, NH. Millan provided photographs from the team’s time in Antarctica. The team launched a balloon every day or two into the circumpolar winds that circulate around the pole. Each balloon floated for anywhere from 3 to 40 days, measuring X-rays produced by fast-moving electrons high up in the atmosphere. BARREL works hand in hand with another NASA mission called the Van Allen Probes, which travels through the Van Allen radiation belts surrounding Earth. The belts wax and wane over time in response to incoming energy and material from the sun, sometimes intensifying the radiation through which satellites must travel. Scientists wish to understand this process better, and even provide forecasts of this space weather, in order to protect our spacecraft. As the Van Allen Probes were observing what was happening in the belts, BARREL tracked electrons that precipitated out of the belts and hurtled down Earth’s magnetic field lines toward the poles. By comparing data, scientists will be able to track how what’s happening in the belts correlates to the loss of particles – information that can help us understand this mysterious, dynamic region that can impact spacecraft. Having launched balloons in early 2013, the team is back at home building the next set of payloads. They will launch 20 more balloons in 2014. <b><a href="http://www.nasa.gov/audience/formedia/features/MP_Photo_Guidelines.html" rel="nofollow">NASA image use policy.</a></b> <b><a href="http://www.nasa.gov/centers/goddard/home/index.html" rel="nofollow">NASA Goddard Space Flight Center</a></b> enables NASA’s mission through four scientific endeavors: Earth Science, Heliophysics, Solar System Exploration, and Astrophysics. Goddard plays a leading role in NASA’s accomplishments by contributing compelling scientific knowledge to advance the Agency’s mission. <b>Follow us on <a href="http://twitter.com/NASA_GoddardPix" rel="nofollow">Twitter</a></b> <b>Like us on <a href="http://www.facebook.com/pages/Greenbelt-MD/NASA-Goddard/395013845897?ref=tsd" rel="nofollow">Facebook</a></b> <b>Find us on <a href="http://instagram.com/nasagoddard?vm=grid" rel="nofollow">Instagram</a></b>

Watching a BARREL balloon – and the instruments dangling below – float up over the SANAE IV research base in Antarctica. Credit: NASA --- In Antarctica in January, 2013 – the summer at the South Pole – scientists launched 20 balloons up into the air to study an enduring mystery of space weather: when the giant radiation belts surrounding Earth lose material, where do the extra particles actually go? The mission is called BARREL (Balloon Array for Radiation belt Relativistic Electron Losses) and it is led by physicist Robyn Millan of Dartmouth College in Hanover, NH. Millan provided photographs from the team’s time in Antarctica. The team launched a balloon every day or two into the circumpolar winds that circulate around the pole. Each balloon floated for anywhere from 3 to 40 days, measuring X-rays produced by fast-moving electrons high up in the atmosphere. BARREL works hand in hand with another NASA mission called the Van Allen Probes, which travels through the Van Allen radiation belts surrounding Earth. The belts wax and wane over time in response to incoming energy and material from the sun, sometimes intensifying the radiation through which satellites must travel. Scientists wish to understand this process better, and even provide forecasts of this space weather, in order to protect our spacecraft. As the Van Allen Probes were observing what was happening in the belts, BARREL tracked electrons that precipitated out of the belts and hurtled down Earth’s magnetic field lines toward the poles. By comparing data, scientists will be able to track how what’s happening in the belts correlates to the loss of particles – information that can help us understand this mysterious, dynamic region that can impact spacecraft. Having launched balloons in early 2013, the team is back at home building the next set of payloads. They will launch 20 more balloons in 2014. <b><a href="http://www.nasa.gov/audience/formedia/features/MP_Photo_Guidelines.html" rel="nofollow">NASA image use policy.</a></b> <b><a href="http://www.nasa.gov/centers/goddard/home/index.html" rel="nofollow">NASA Goddard Space Flight Center</a></b> enables NASA’s mission through four scientific endeavors: Earth Science, Heliophysics, Solar System Exploration, and Astrophysics. Goddard plays a leading role in NASA’s accomplishments by contributing compelling scientific knowledge to advance the Agency’s mission. <b>Follow us on <a href="http://twitter.com/NASA_GoddardPix" rel="nofollow">Twitter</a></b> <b>Like us on <a href="http://www.facebook.com/pages/Greenbelt-MD/NASA-Goddard/395013845897?ref=tsd" rel="nofollow">Facebook</a></b> <b>Find us on <a href="http://instagram.com/nasagoddard?vm=grid" rel="nofollow">Instagram</a></b>
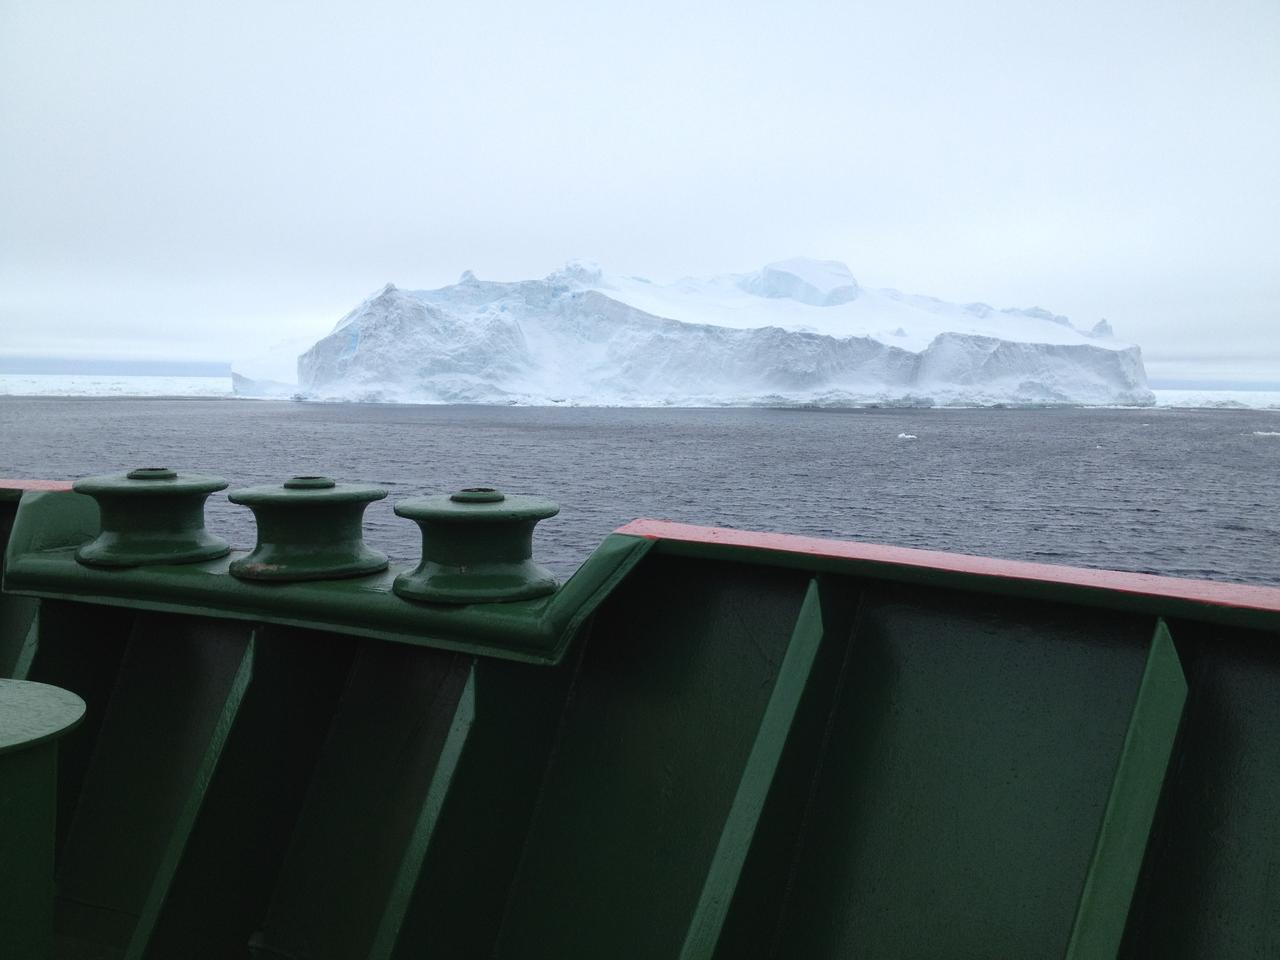
An iceberg as viewed from the bow of the RRS Ernest Shackleton a few days before the BARREL team reached Halley Research Station in Antarctica. This research vessel regularly carries scientists and supplies to Halley. Credit: NASA --- In Antarctica in January, 2013 – the summer at the South Pole – scientists launched 20 balloons up into the air to study an enduring mystery of space weather: when the giant radiation belts surrounding Earth lose material, where do the extra particles actually go? The mission is called BARREL (Balloon Array for Radiation belt Relativistic Electron Losses) and it is led by physicist Robyn Millan of Dartmouth College in Hanover, NH. Millan provided photographs from the team’s time in Antarctica. The team launched a balloon every day or two into the circumpolar winds that circulate around the pole. Each balloon floated for anywhere from 3 to 40 days, measuring X-rays produced by fast-moving electrons high up in the atmosphere. BARREL works hand in hand with another NASA mission called the Van Allen Probes, which travels through the Van Allen radiation belts surrounding Earth. The belts wax and wane over time in response to incoming energy and material from the sun, sometimes intensifying the radiation through which satellites must travel. Scientists wish to understand this process better, and even provide forecasts of this space weather, in order to protect our spacecraft. As the Van Allen Probes were observing what was happening in the belts, BARREL tracked electrons that precipitated out of the belts and hurtled down Earth’s magnetic field lines toward the poles. By comparing data, scientists will be able to track how what’s happening in the belts correlates to the loss of particles – information that can help us understand this mysterious, dynamic region that can impact spacecraft. Having launched balloons in early 2013, the team is back at home building the next set of payloads. They will launch 20 more balloons in 2014. <b><a href="http://www.nasa.gov/audience/formedia/features/MP_Photo_Guidelines.html" rel="nofollow">NASA image use policy.</a></b> <b><a href="http://www.nasa.gov/centers/goddard/home/index.html" rel="nofollow">NASA Goddard Space Flight Center</a></b> enables NASA’s mission through four scientific endeavors: Earth Science, Heliophysics, Solar System Exploration, and Astrophysics. Goddard plays a leading role in NASA’s accomplishments by contributing compelling scientific knowledge to advance the Agency’s mission. <b>Follow us on <a href="http://twitter.com/NASA_GoddardPix" rel="nofollow">Twitter</a></b> <b>Like us on <a href="http://www.facebook.com/pages/Greenbelt-MD/NASA-Goddard/395013845897?ref=tsd" rel="nofollow">Facebook</a></b> <b>Find us on <a href="http://instagram.com/nasagoddard?vm=grid" rel="nofollow">Instagram</a></b>
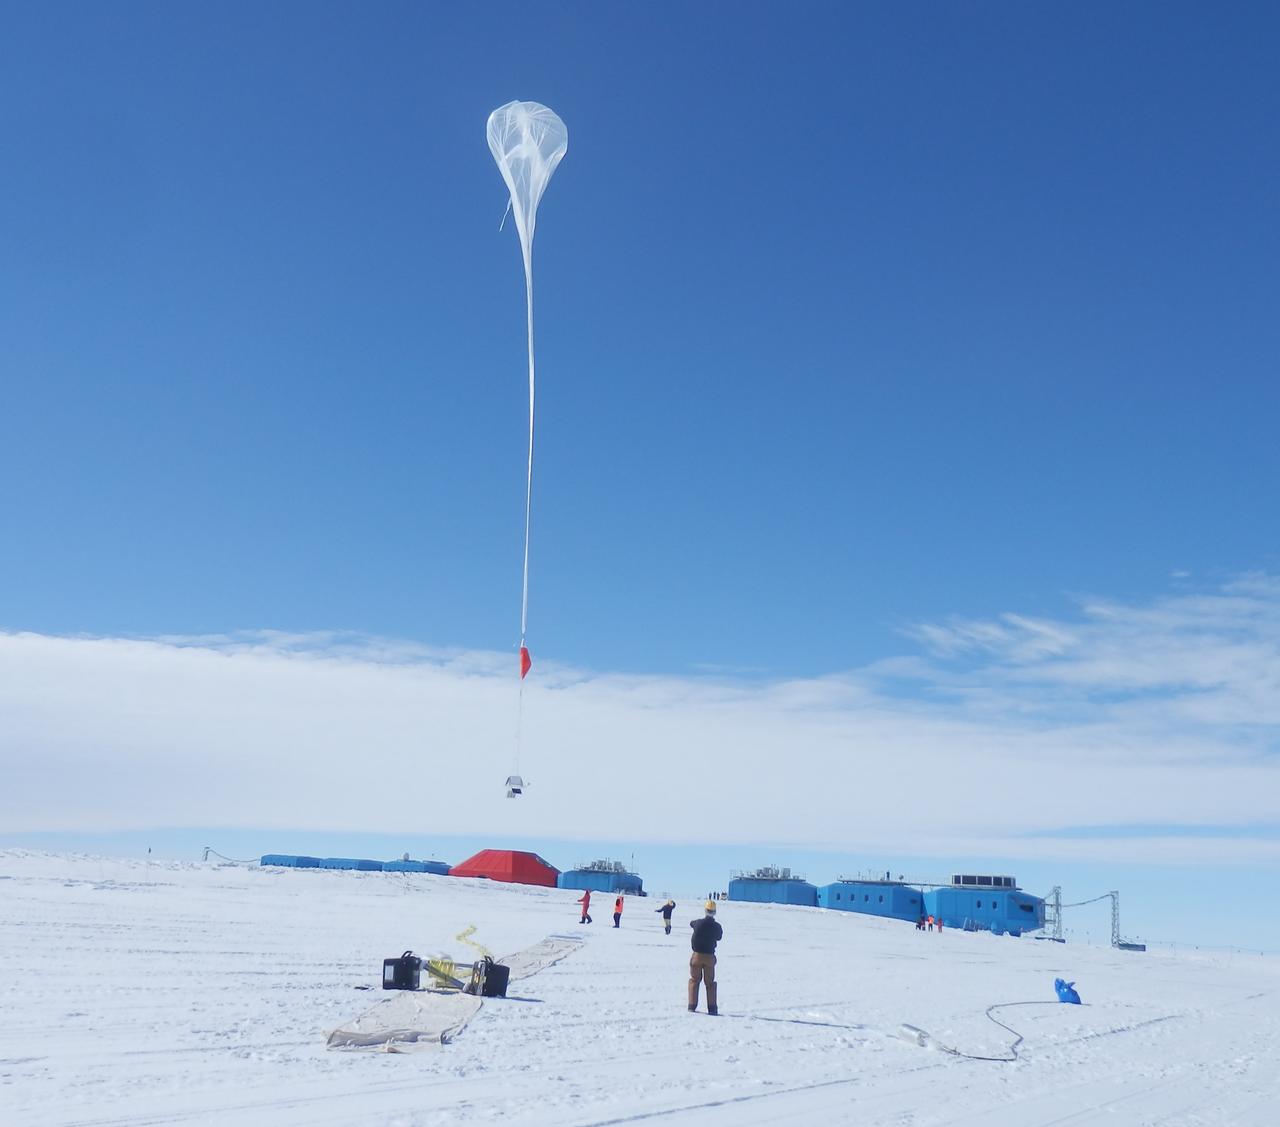
Liftoff! A balloon begins to rise over the brand new Halley VI Research Station, which had its grand opening in February 2013. Credit: NASA --- In Antarctica in January, 2013 – the summer at the South Pole – scientists launched 20 balloons up into the air to study an enduring mystery of space weather: when the giant radiation belts surrounding Earth lose material, where do the extra particles actually go? The mission is called BARREL (Balloon Array for Radiation belt Relativistic Electron Losses) and it is led by physicist Robyn Millan of Dartmouth College in Hanover, NH. Millan provided photographs from the team’s time in Antarctica. The team launched a balloon every day or two into the circumpolar winds that circulate around the pole. Each balloon floated for anywhere from 3 to 40 days, measuring X-rays produced by fast-moving electrons high up in the atmosphere. BARREL works hand in hand with another NASA mission called the Van Allen Probes, which travels through the Van Allen radiation belts surrounding Earth. The belts wax and wane over time in response to incoming energy and material from the sun, sometimes intensifying the radiation through which satellites must travel. Scientists wish to understand this process better, and even provide forecasts of this space weather, in order to protect our spacecraft. As the Van Allen Probes were observing what was happening in the belts, BARREL tracked electrons that precipitated out of the belts and hurtled down Earth’s magnetic field lines toward the poles. By comparing data, scientists will be able to track how what’s happening in the belts correlates to the loss of particles – information that can help us understand this mysterious, dynamic region that can impact spacecraft. Having launched balloons in early 2013, the team is back at home building the next set of payloads. They will launch 20 more balloons in 2014. <b><a href="http://www.nasa.gov/audience/formedia/features/MP_Photo_Guidelines.html" rel="nofollow">NASA image use policy.</a></b> <b><a href="http://www.nasa.gov/centers/goddard/home/index.html" rel="nofollow">NASA Goddard Space Flight Center</a></b> enables NASA’s mission through four scientific endeavors: Earth Science, Heliophysics, Solar System Exploration, and Astrophysics. Goddard plays a leading role in NASA’s accomplishments by contributing compelling scientific knowledge to advance the Agency’s mission. <b>Follow us on <a href="http://twitter.com/NASA_GoddardPix" rel="nofollow">Twitter</a></b> <b>Like us on <a href="http://www.facebook.com/pages/Greenbelt-MD/NASA-Goddard/395013845897?ref=tsd" rel="nofollow">Facebook</a></b> <b>Find us on <a href="http://instagram.com/nasagoddard?vm=grid" rel="nofollow">Instagram</a></b>
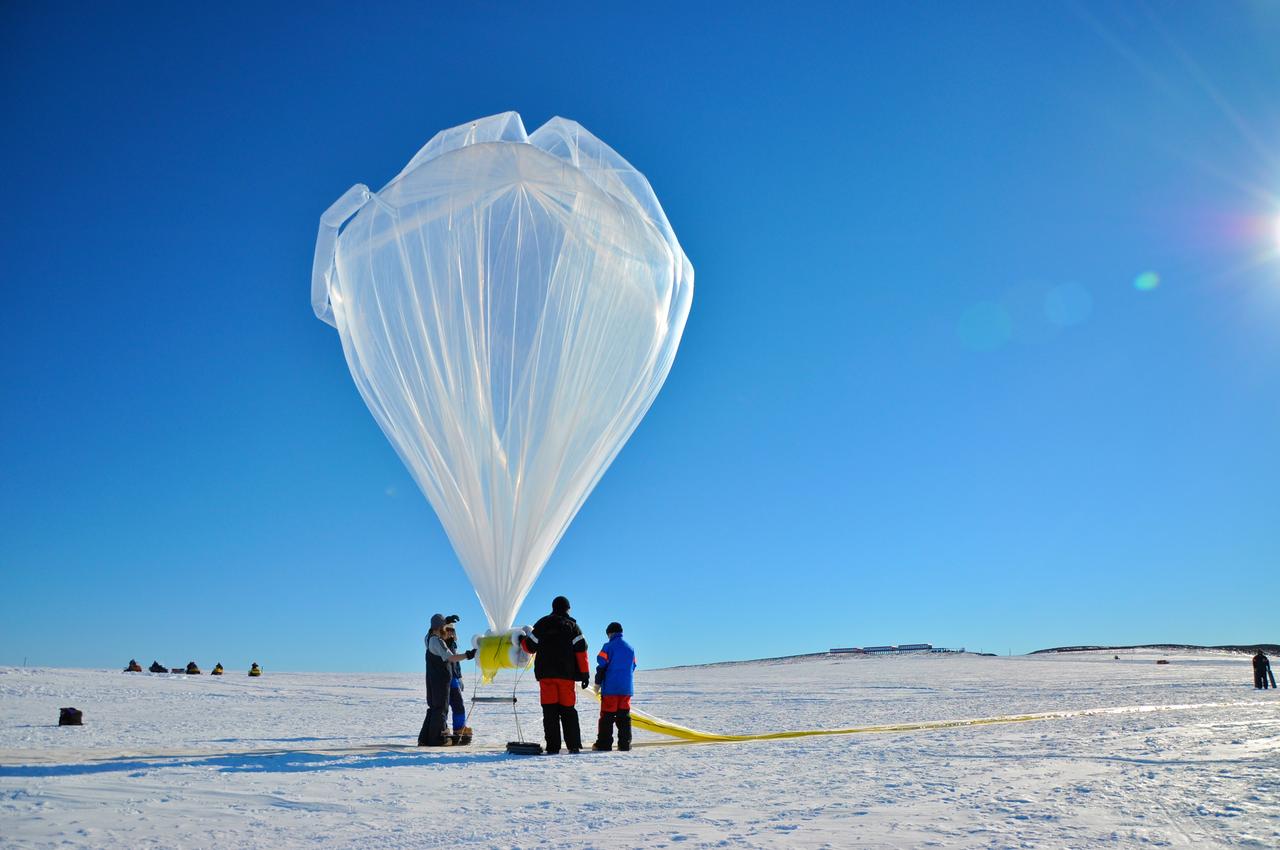
A BARREL balloon floats into the sky as it is partially filled. When fully inflated, each balloon is 90 feet in diameter and carries an instrument suite that weighs 50 pounds. This is small for an Antarctica balloon launch, which can have balloons Typical balloons l the size of a football field with payloads of some 3,000 pounds. Credit: NASA --- In Antarctica in January, 2013 – the summer at the South Pole – scientists launched 20 balloons up into the air to study an enduring mystery of space weather: when the giant radiation belts surrounding Earth lose material, where do the extra particles actually go? The mission is called BARREL (Balloon Array for Radiation belt Relativistic Electron Losses) and it is led by physicist Robyn Millan of Dartmouth College in Hanover, NH. Millan provided photographs from the team’s time in Antarctica. The team launched a balloon every day or two into the circumpolar winds that circulate around the pole. Each balloon floated for anywhere from 3 to 40 days, measuring X-rays produced by fast-moving electrons high up in the atmosphere. BARREL works hand in hand with another NASA mission called the Van Allen Probes, which travels through the Van Allen radiation belts surrounding Earth. The belts wax and wane over time in response to incoming energy and material from the sun, sometimes intensifying the radiation through which satellites must travel. Scientists wish to understand this process better, and even provide forecasts of this space weather, in order to protect our spacecraft. As the Van Allen Probes were observing what was happening in the belts, BARREL tracked electrons that precipitated out of the belts and hurtled down Earth’s magnetic field lines toward the poles. By comparing data, scientists will be able to track how what’s happening in the belts correlates to the loss of particles – information that can help us understand this mysterious, dynamic region that can impact spacecraft. Having launched balloons in early 2013, the team is back at home building the next set of payloads. They will launch 20 more balloons in 2014. <b><a href="http://www.nasa.gov/audience/formedia/features/MP_Photo_Guidelines.html" rel="nofollow">NASA image use policy.</a></b> <b><a href="http://www.nasa.gov/centers/goddard/home/index.html" rel="nofollow">NASA Goddard Space Flight Center</a></b> enables NASA’s mission through four scientific endeavors: Earth Science, Heliophysics, Solar System Exploration, and Astrophysics. Goddard plays a leading role in NASA’s accomplishments by contributing compelling scientific knowledge to advance the Agency’s mission. <b>Follow us on <a href="http://twitter.com/NASA_GoddardPix" rel="nofollow">Twitter</a></b> <b>Like us on <a href="http://www.facebook.com/pages/Greenbelt-MD/NASA-Goddard/395013845897?ref=tsd" rel="nofollow">Facebook</a></b> <b>Find us on <a href="http://instagram.com/nasagoddard?vm=grid" rel="nofollow">Instagram</a></b>