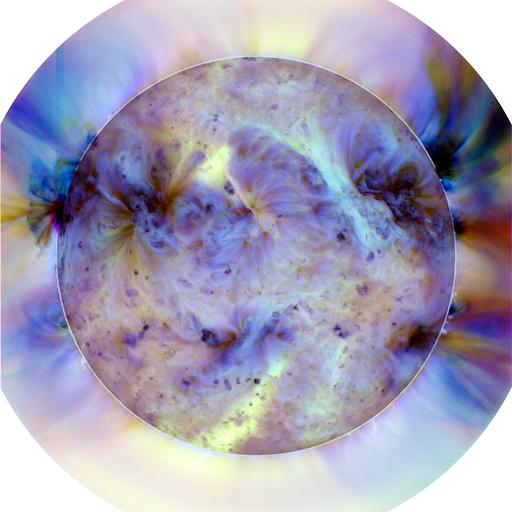
Filtering The Sun: Scientists process AIA images to focus in on areas of interest. This three-color image is a combination of three AIA images using a filter to increase the contrast and an inverted color table to make the small areas more visible. In this image, the dark spots represent the hotter regions. Credit: NASA/SDO Read more: <a href="http://www.nasa.gov/content/goddard/sdo-telescope-collects-its-100-millionth-image/" rel="nofollow">www.nasa.gov/content/goddard/sdo-telescope-collects-its-1...</a> <b><a href="http://www.nasa.gov/audience/formedia/features/MP_Photo_Guidelines.html" rel="nofollow">NASA image use policy.</a></b> <b><a href="http://www.nasa.gov/centers/goddard/home/index.html" rel="nofollow">NASA Goddard Space Flight Center</a></b> enables NASA’s mission through four scientific endeavors: Earth Science, Heliophysics, Solar System Exploration, and Astrophysics. Goddard plays a leading role in NASA’s accomplishments by contributing compelling scientific knowledge to advance the Agency’s mission. <b>Follow us on <a href="http://twitter.com/NASAGoddardPix" rel="nofollow">Twitter</a></b> <b>Like us on <a href="http://www.facebook.com/pages/Greenbelt-MD/NASA-Goddard/395013845897?ref=tsd" rel="nofollow">Facebook</a></b> <b>Find us on <a href="http://instagram.com/nasagoddard?vm=grid" rel="nofollow">Instagram</a></b>
NASA's Mars Reconnaissance Orbiter captured this image of a meteoroid impact that was first detected by the agency's InSight lander using its seismometer. This crater was formed on Aug. 30, 2021. MRO's High Resolution Imaging Science Experiment (HiRISE) camera captured this scene in color. The ground is not actually blue; this enhanced-color image highlights certain hues in the scene to make details more visible to the human eye – in this case, dust and soil disturbed by the impact. https://photojournal.jpl.nasa.gov/catalog/PIA25411
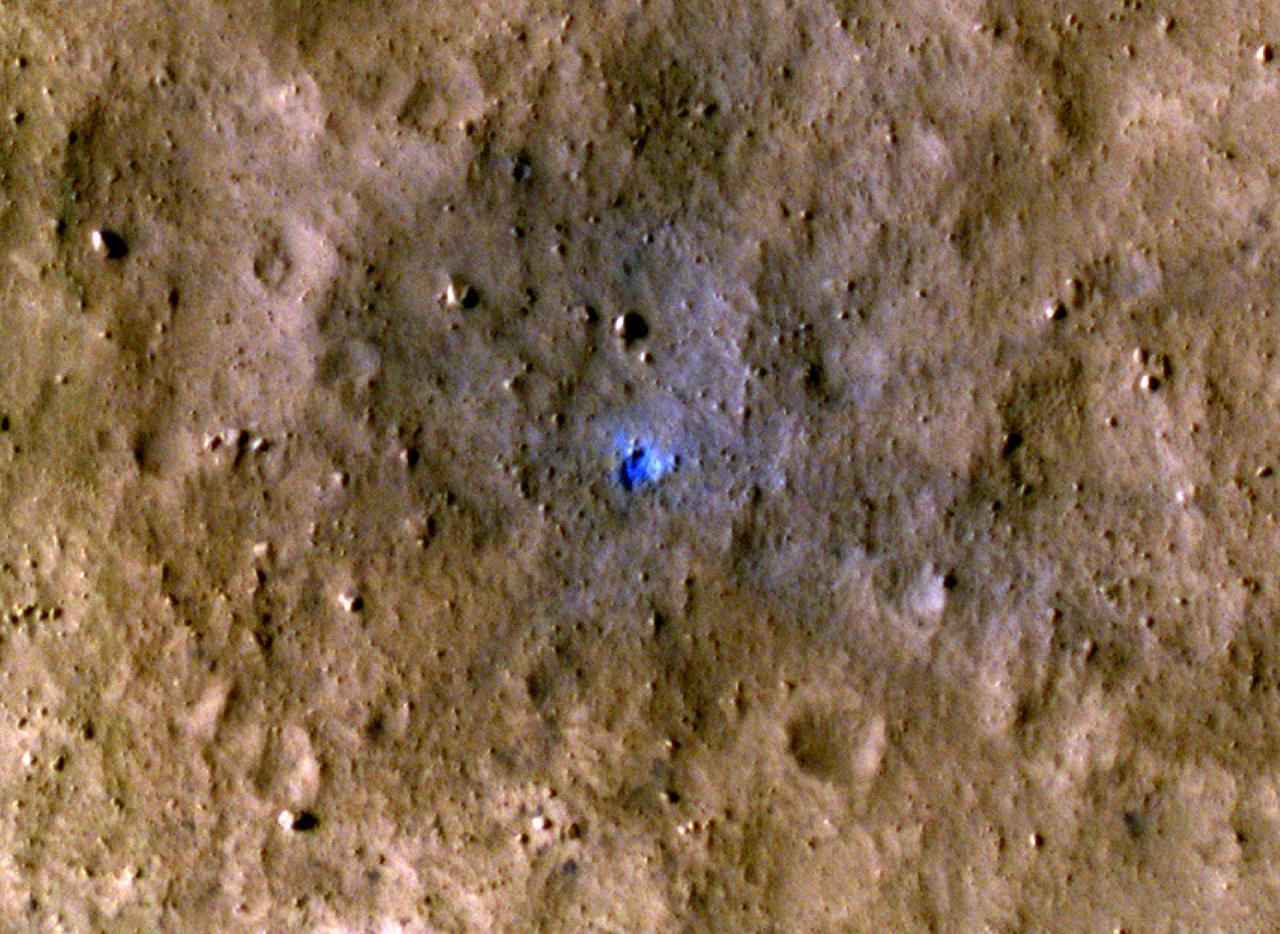
NASA's Mars Reconnaissance Orbiter captured this image of a meteoroid impact that was first detected by the agency's InSight lander using its seismometer. This crater was formed on Feb. 18, 2021. MRO's High Resolution Imaging Science Experiment (HiRISE) camera captured this scene in color. The ground is not actually blue; this enhanced-color image highlights certain hues in the scene to make details more visible to the human eye – in this case, dust and soil disturbed by the impact. https://photojournal.jpl.nasa.gov/catalog/PIA25409
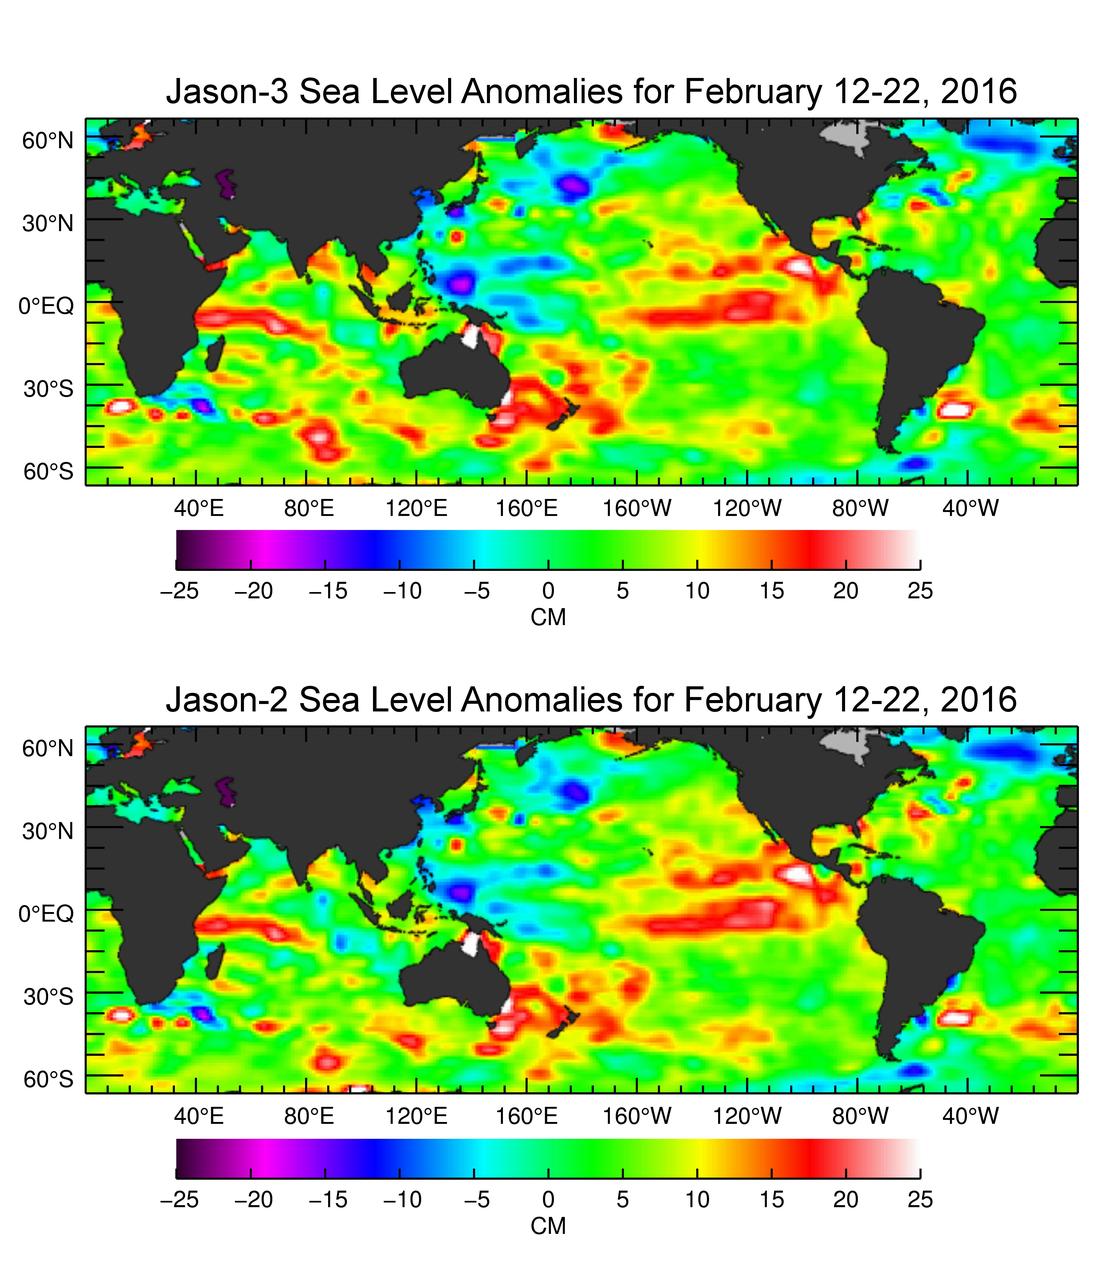
The U.S./European Jason-3 satellite has produced its first map of sea surface height, which corresponds well to data from its predecessor, Jason-2. Higher-than-normal sea levels are red; lower-than-normal sea levels are blue. El Niño is visible as the red blob in the eastern equatorial Pacific. Extending the timeline of ocean surface topography measurements begun by the Topex/Poseidon and Jason 1 and 2 satellites, Jason 3 will make highly detailed measurements of sea-level on Earth to gain insight into ocean circulation and climate change. http://photojournal.jpl.nasa.gov/catalog/PIA20532
NASA's Mars Reconnaissance Orbiter captured this image of a meteoroid impact that was later associated with a seismic event detected by the agency's InSight lander using its seismometer. This crater was formed on May 27, 2020. MRO's Context Camera originally located the impact. Then, the spacecraft's High Resolution Imaging Science Experiment (HiRISE) camera captured this scene in color. The ground is not actually blue; this enhanced-color image highlights certain hues in the scene to make details more visible to the human eye – in this case, dust and soil disturbed by the impact. https://photojournal.jpl.nasa.gov/catalog/PIA25410
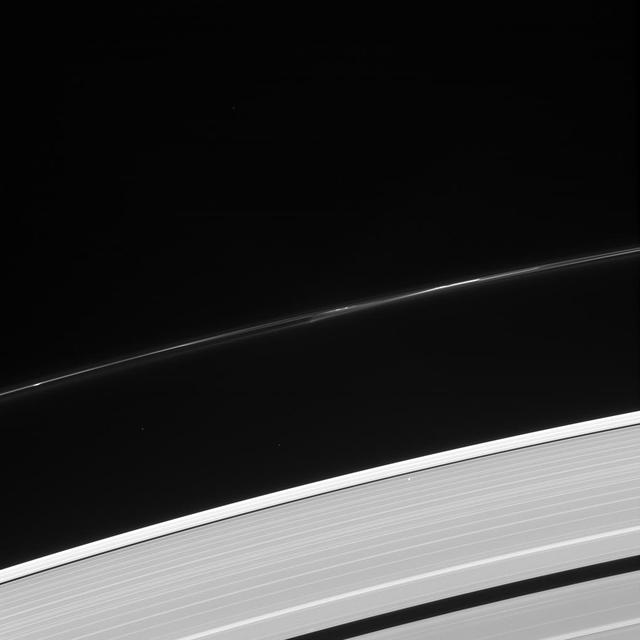
What's that bright point of light in the outer A ring? It's a star, bright enough to be visible through the ring! Quick, make a wish! This star -- seen in the lower right quadrant of the image -- was not captured by coincidence, it was part of a stellar occultation. By monitoring the brightness of stars as they pass behind the rings, scientists using this powerful observation technique can inspect detailed structures within the rings and how they vary with location. This view looks toward the sunlit side of the rings from about 44 degrees above the ringplane. The image was taken in visible light with the Cassini spacecraft narrow-angle camera on Oct. 8, 2013. The view was acquired at a distance of approximately 1.1 million miles (1.8 million kilometers) from the rings and at a Sun-Rings-Spacecraft, or phase, angle of 96 degrees. Image scale is 6.8 miles (11 kilometers) per pixel. http://photojournal.jpl.nasa.gov/catalog/PIA18297
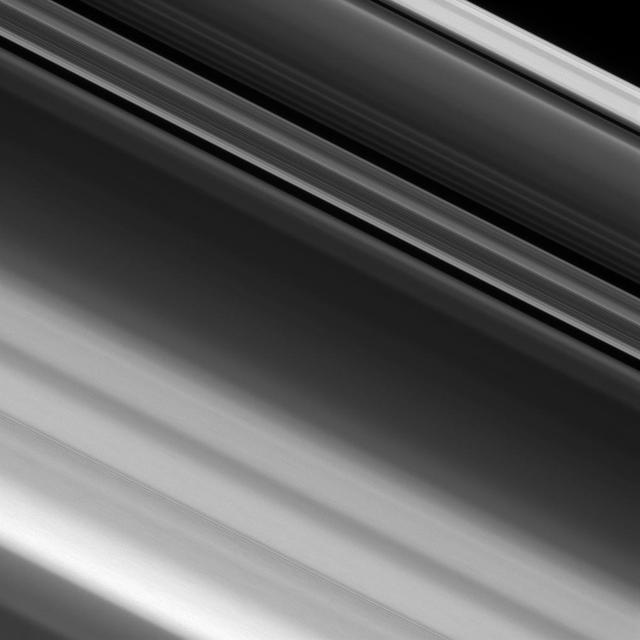
NASA's Cassini spacecraft zoomed in on Saturn's A ring, revealing narrow, detailed structures that get even finer as the cameras' resolution increases. Even at this level of detail, it is still not fine enough to resolve the individual particles that make up the ring. High-resolution images like this help scientists map the fine structure of Saturn's rings. Features less than a half a mile (one kilometer) in size are resolvable here. But the particles in the A ring typically range in size from several meters across down to centimeters, making them still far too small to see individually here. This view looks toward the sunlit side of the rings from about 38 degrees above the ring plane. The image was taken in visible light with the Cassini spacecraft narrow-angle camera on Jan. 9, 2017. The view was obtained at a distance of approximately 70,000 miles (113,000 kilometers) from Saturn and at a Sun-Saturn-spacecraft, or phase, angle of 11 degrees. Image scale is 2,300 feet (690 meters) per pixel. http://photojournal.jpl.nasa.gov/catalog/PIA20526
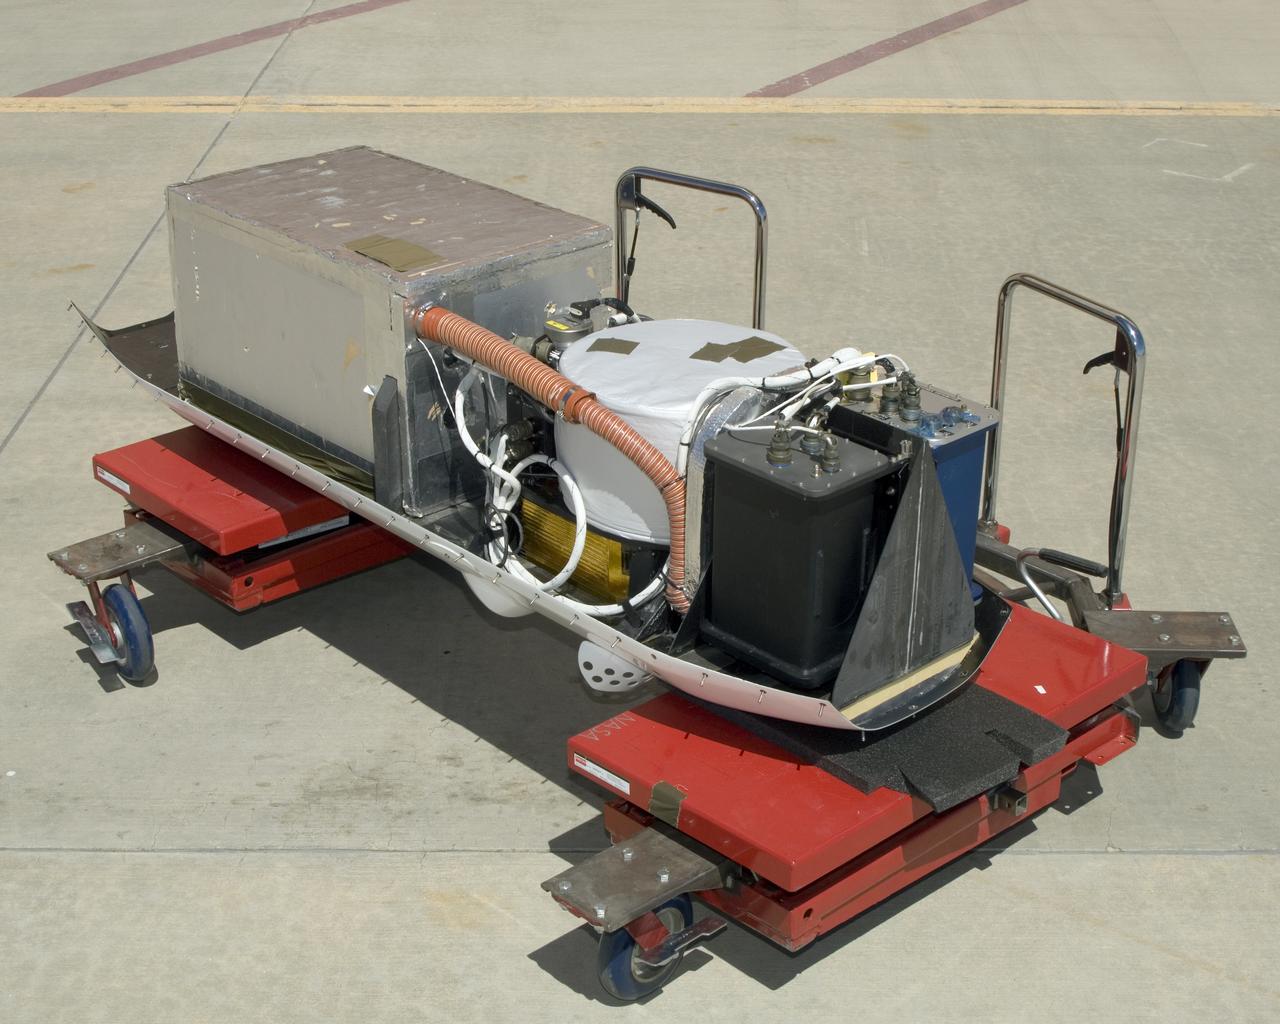
The instruments that make up the Ames Autonomous Module Scanner (AMS) that provided precise thermal-infrared imaging during the Western States Fire Mission in 2007 are detailed in this photo of the AMS as mounted on Ikhana's pod tray. The large foil-covered foam-insulated box at left covers the pressure vessel containing the data system computers and other electronics. The round white-topped assembly is the scan head, including the scan mirror, folded telescope, blackbody references, spectrometer and detectors. Two pressure boxes visible at the forward end of the tray contain the Applanix POS/AV precision navigation subsystem (black) and the power distributor including circuit breakers and ancillary wiring, scan motor controller and the blackbody reference temperature controller (blue).
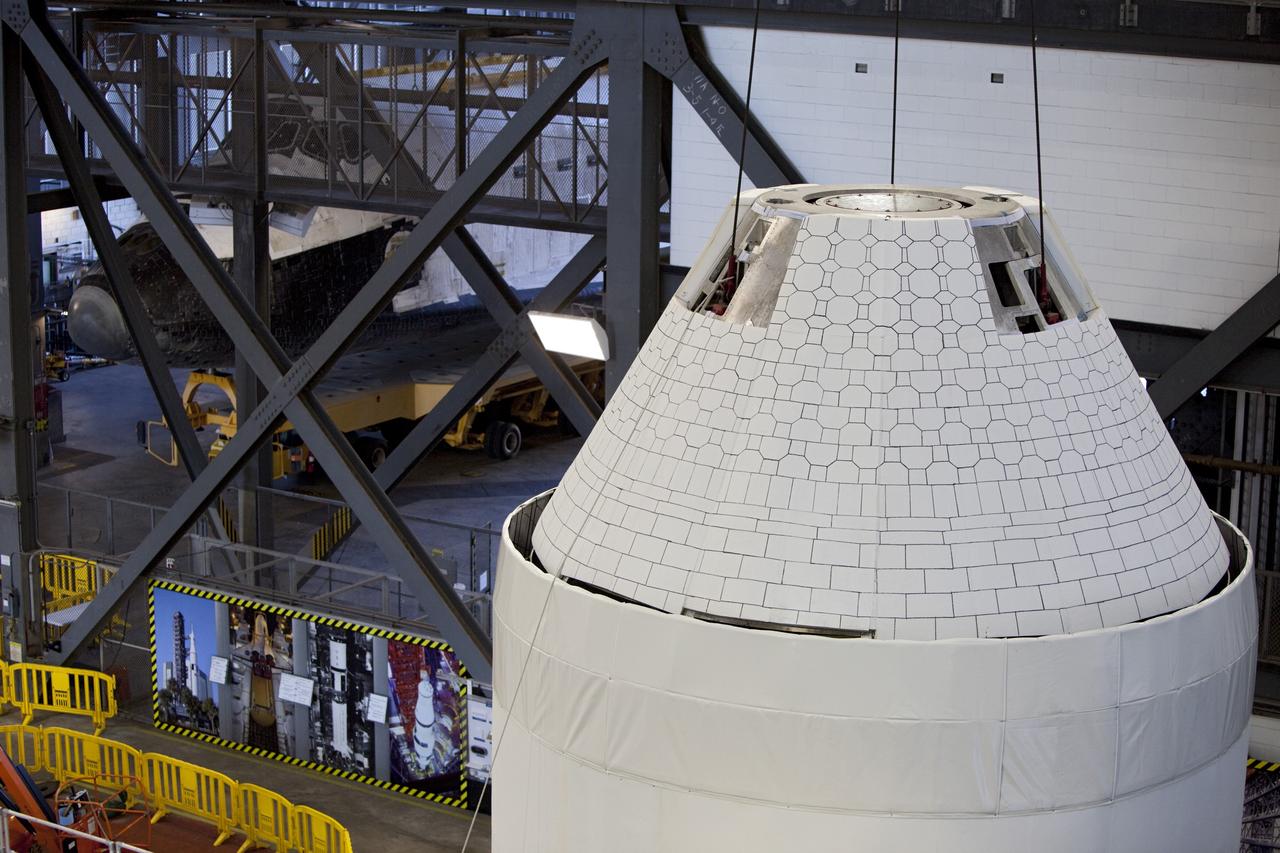
CAPE CANAVERAL, Fla. – An Orion mockup spacecraft atop its service module simulator is lifted in the transfer aisle of the Vehicle Assembly Building, or VAB, at NASA's Kennedy Space Center in Florida. The Orion mockup is exact in details on the outside, but mostly empty on the inside. The work in the VAB is crucial to making sure the designs are accurate. Visible in the background on the left is the space shuttle Atlantis being readied for its move to the Kennedy Space Center Visitor Complex. Orion is the exploration spacecraft designed to carry crews to space beyond low Earth orbit. It will provide emergency abort capability, sustain the crew during the space travel and provide safe re-entry from deep space return velocities. The first unpiloted test flight of the Orion is scheduled to launch in 2014 atop a Delta IV rocket and in 2017 on a Space Launch System rocket. For more information, visit http://www.nasa.gov/orion Photo credit: NASA/ Dmitri Gerondidakis
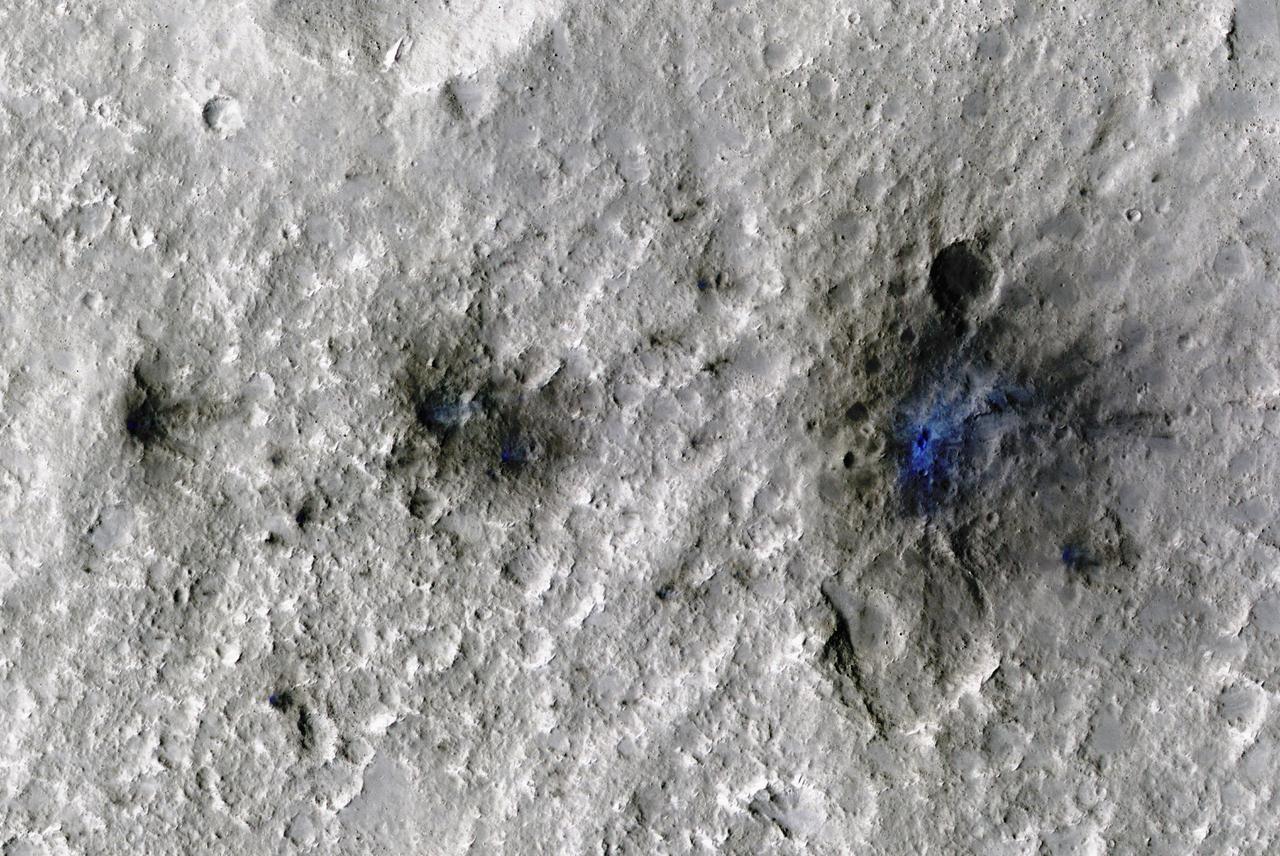
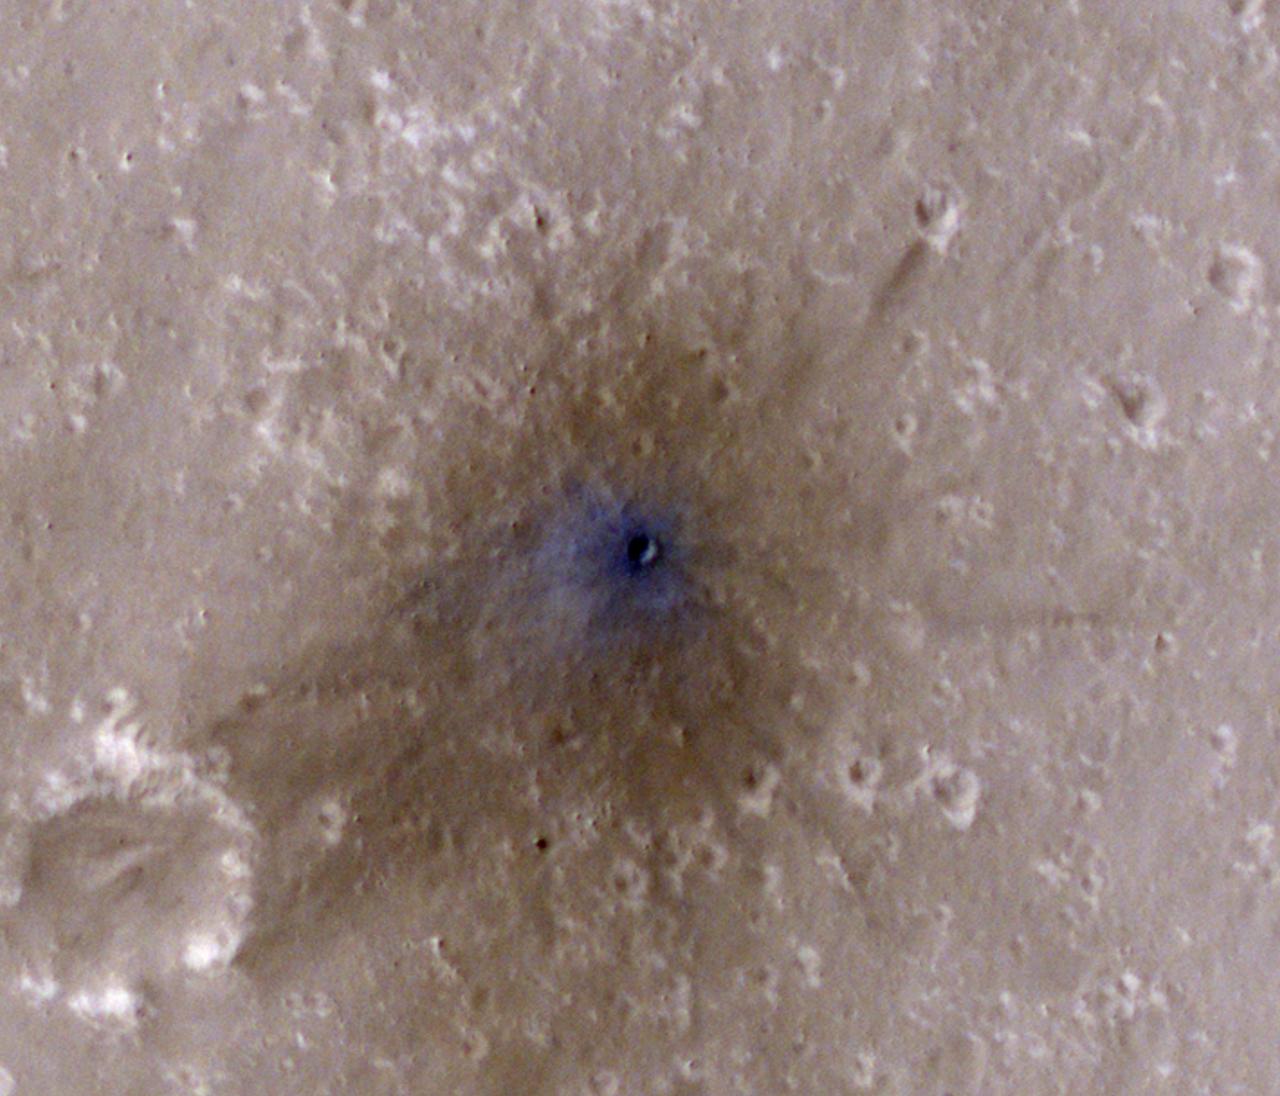
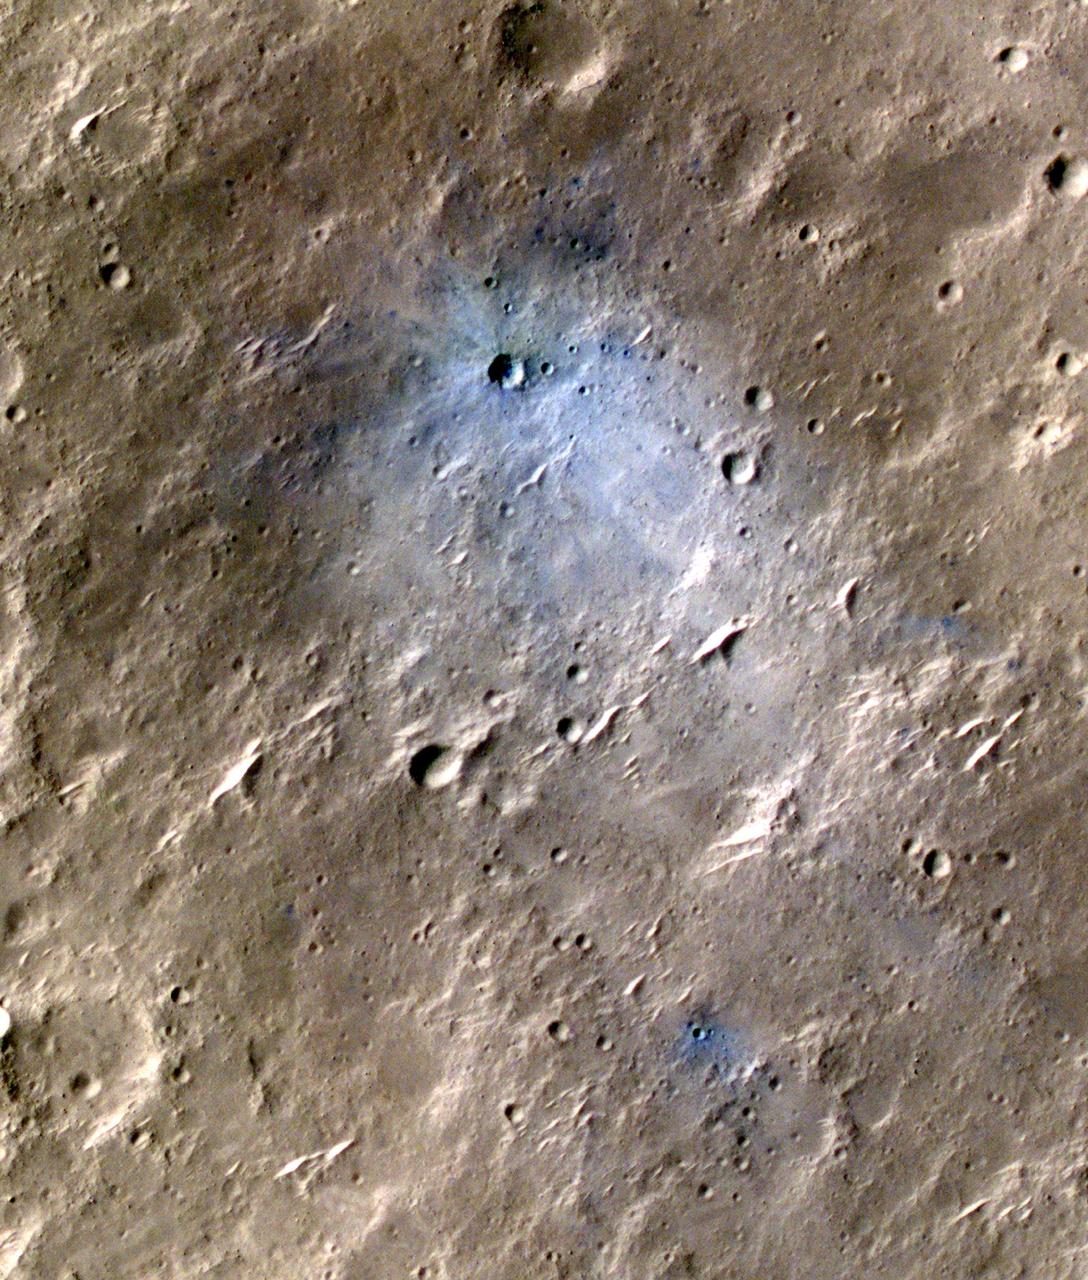
The craters seen here in blue were formed by a meteoroid impact on Mars on Sept. 5, 2021. The impact was the first to be detected by NASA's InSight mission; the image was taken later by NASA's Mars Reconnaissance Orbiter using its High Resolution Imaging Science Experiment (HiRISE) camera. The initial impact itself created a small marsquake that was detected by InSight's seismometer. The instrument recorded seismological data that showed the moment the meteoroid entered Mars' atmosphere, its explosion into pieces in the atmosphere, and finally, the impact that created a series of at least three craters in the surface. MRO then flew over the approximate site where the impact was "felt" to look for darkened patches of ground using its Context Camera. After finding this location, HiRISE captured the scene in color. The ground is not actually blue; this enhanced-color image highlights certain hues in the scene to make details more visible to the human eye – in this case, dust and soil disturbed by the impact. https://photojournal.jpl.nasa.gov/catalog/PIA25408
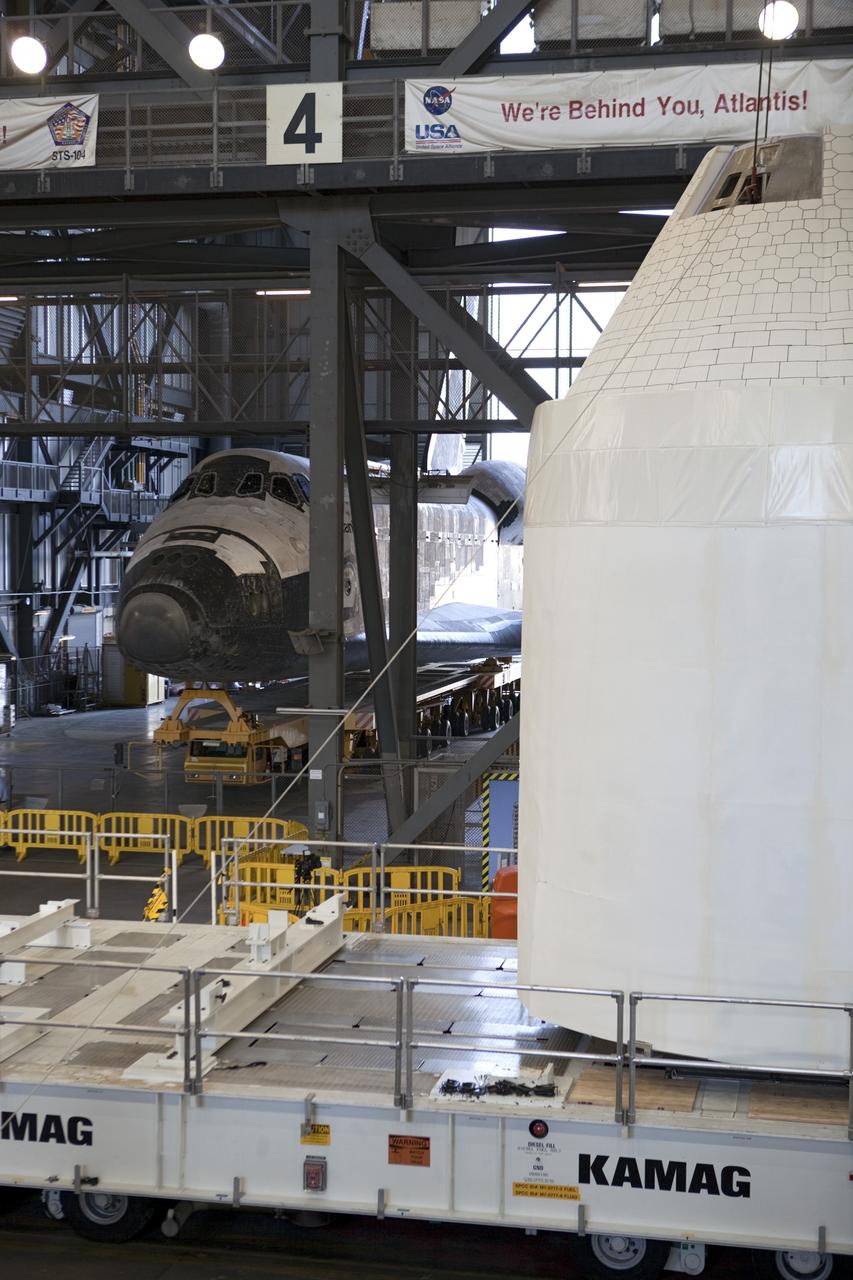
CAPE CANAVERAL, Fla. – An Orion mockup spacecraft atop its service module simulator is lowered onto a transporter in the transfer aisle of the Vehicle Assembly Building, or VAB, at NASA's Kennedy Space Center in Florida. The Orion mockup is exact in details on the outside, but mostly empty on the inside. The work in the VAB is crucial to making sure the designs are accurate. Visible in the background on the left is the space shuttle Atlantis being readied for its move to the Kennedy Space Center Visitor Complex. Orion is the exploration spacecraft designed to carry crews to space beyond low Earth orbit. It will provide emergency abort capability, sustain the crew during the space travel and provide safe re-entry from deep space return velocities. The first unpiloted test flight of the Orion is scheduled to launch in 2014 atop a Delta IV rocket and in 2017 on a Space Launch System rocket. For more information, visit http://www.nasa.gov/orion Photo credit: NASA/ Dmitri Gerondidakis
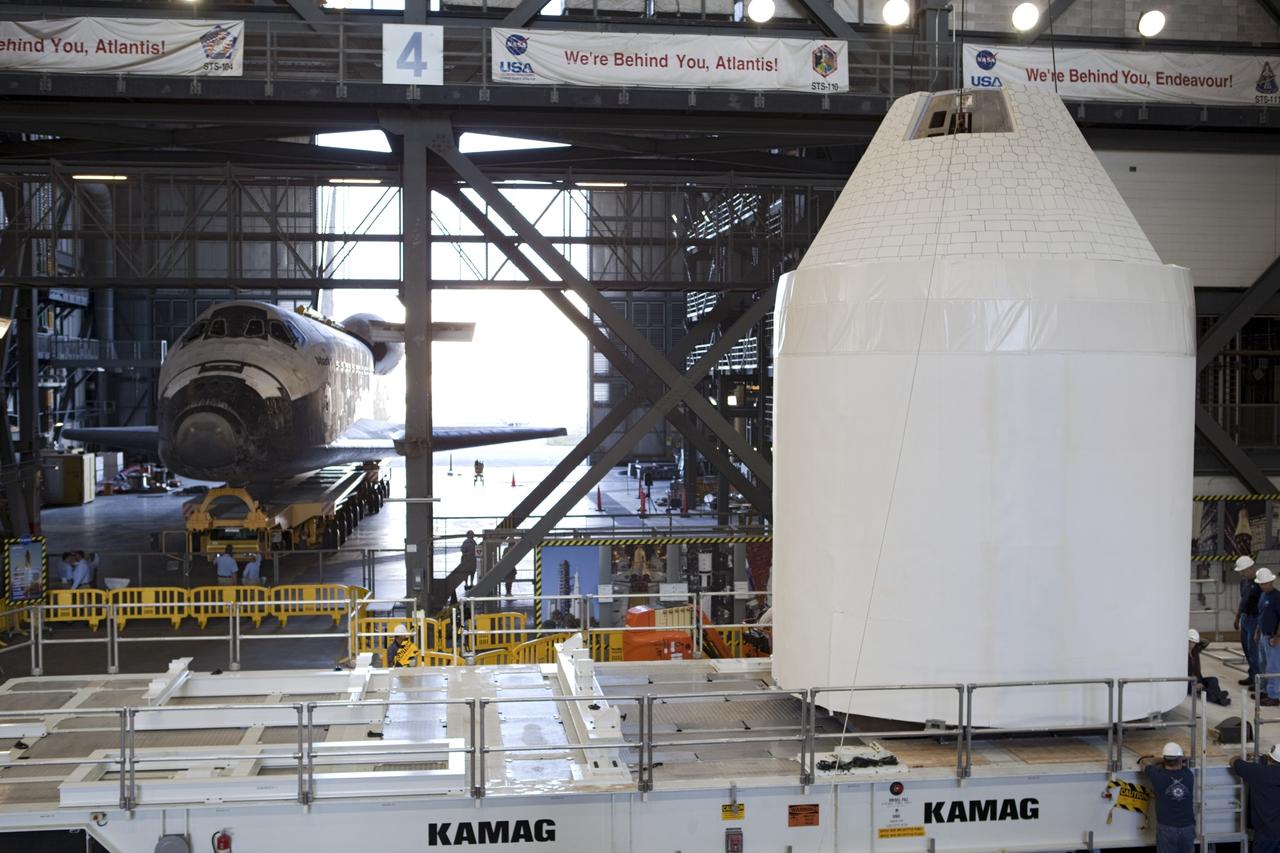
CAPE CANAVERAL, Fla. – An Orion mockup spacecraft atop its service module simulator is lowered onto a transporter in the transfer aisle of the Vehicle Assembly Building, or VAB, at NASA's Kennedy Space Center in Florida. The Orion mockup is exact in details on the outside, but mostly empty on the inside. The work in the VAB is crucial to making sure the designs are accurate. Visible in the background on the left is the space shuttle Atlantis being readied for its move to the Kennedy Space Center Visitor Complex. Orion is the exploration spacecraft designed to carry crews to space beyond low Earth orbit. It will provide emergency abort capability, sustain the crew during the space travel and provide safe re-entry from deep space return velocities. The first unpiloted test flight of the Orion is scheduled to launch in 2014 atop a Delta IV rocket and in 2017 on a Space Launch System rocket. For more information, visit http://www.nasa.gov/orion Photo credit: NASA/ Dmitri Gerondidakis
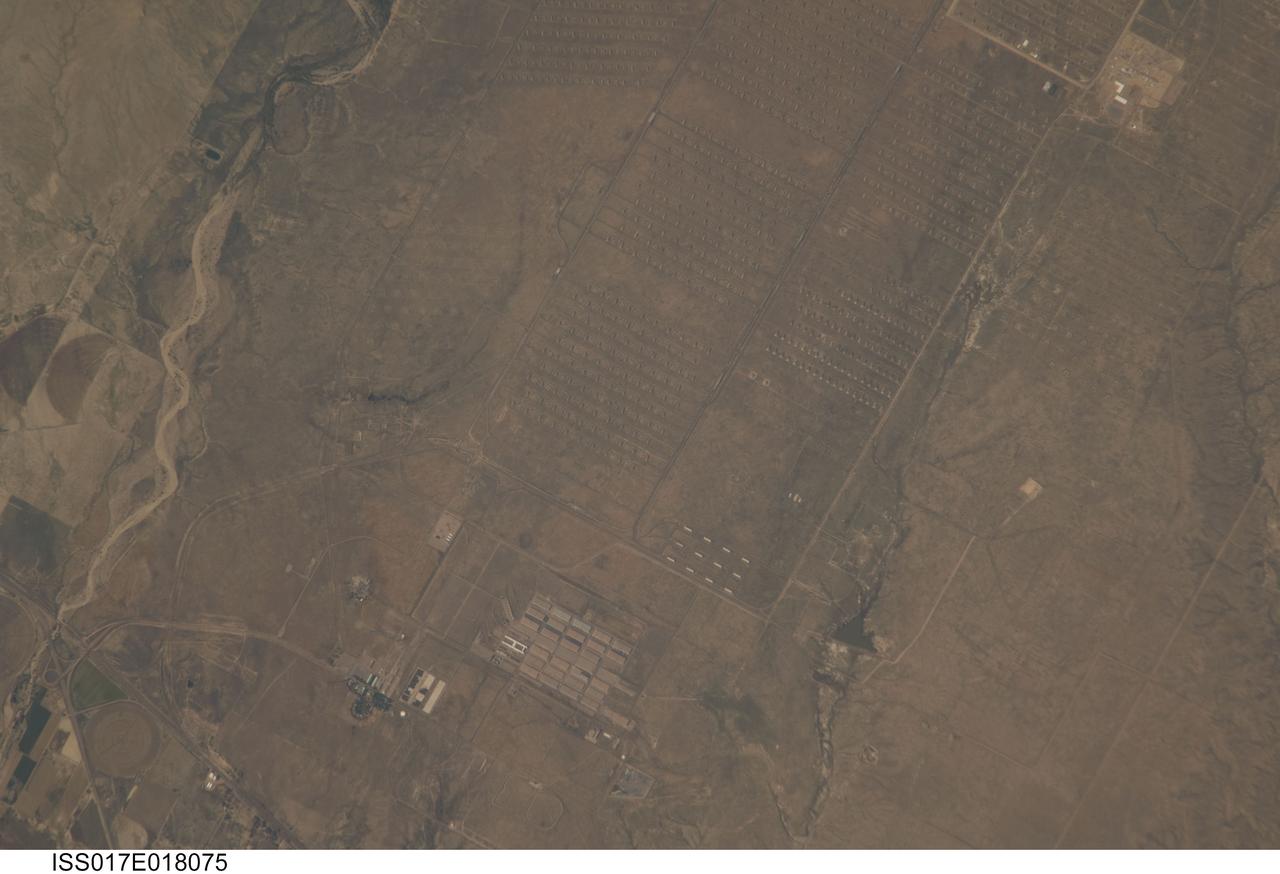
ISS017-E-018075 (1 Oct. 2008) --- The Pueblo Chemical Depot in Colorado is featured in this image photographed by an Expedition 17 crewmember on the International Space Station. This view illustrates the unusual man-made landscape of the Pueblo Chemical Depot located near the city of Pueblo, Colorado. The Depot was built during World War II by the U.S. Army to house and ship ammunition needed for war efforts, and this role transitioned to missile repair and maintenance during the Cold War with the Soviet Union. The current use of the Depot is to house chemical munitions, but changes are underway by the U.S. Army Chemical Materials Agency to destroy these munitions and make the site environmentally safe for reuse -- while also protecting the surrounding local environment. The stippled landscape pattern visible from low Earth orbit is due to hundreds of concrete and earth-covered storage "igloos" that form ordered rows across the site (top). It is within these igloos that chemical munitions and other materials are stored. Larger, white roofed maintenance buildings once used for munitions storage were built with separate compartments to minimize potential damage from explosions. Other features visible in this detailed image include linear roadway (light tan) and rail (dark brown) lines, black irregular surface impoundments of water, and various rectangular office and industrial buildings at lower left.
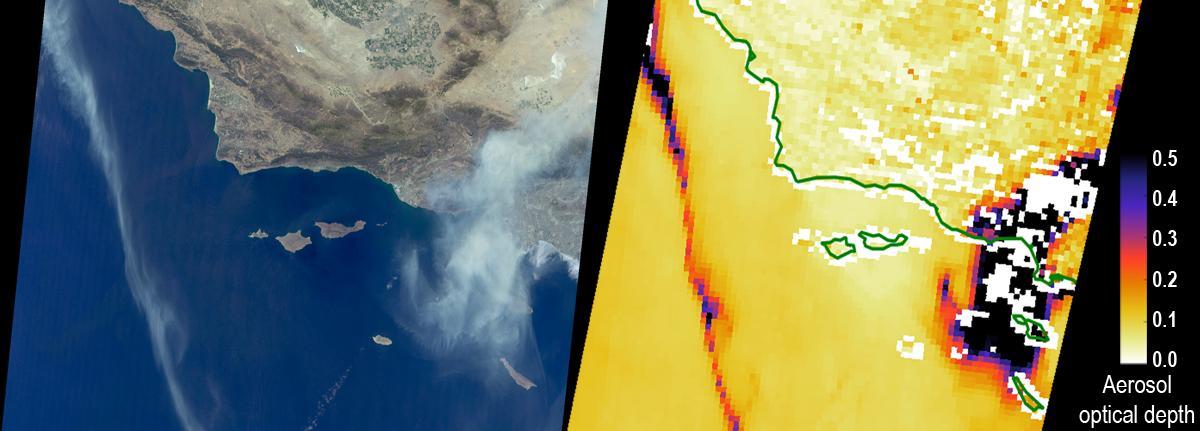
The Sand Fire in the Santa Clarita Valley area of Southern California erupted on Friday, July 22, 2016, and rapidly grew to more than 37,000 acres (58 square miles, or 150 square kilometers) over the weekend. As of Tuesday, July 26, hundreds of residents still remain under evacuation orders, and the fire claimed the life of a local resident. The fire is currently 25 percent contained. The Multi-angle Imaging SpectroRadiometer (MISR) instrument aboard NASA's Terra satellite passed over the region on July 23 around 11:50 a.m. PDT. At left is an image acquired by MISR's 60-degree forward-viewing camera. The oblique view angle makes the smoke more apparent than it would be in a more conventional vertical view. Smoke from the Sand Fire is visible on the right-hand side of the image, and a long streamer of smoke from the Soberanes Fire near Big Sur in Central California is visible over the ocean near the left-hand side of the image. Like the Sand Fire, the Soberanes Fire also broke out on July 22, and quickly grew to more than 19,000 acres (30 square miles, or 77 square kilometers), causing the evacuation of hundreds of people and closure of several state parks. The Soberanes Fire is currently only 10 percent contained. The swath width of the MISR image is 257 miles (414 kilometers). At right is a map of aerosol optical depth, a quantitative measure of the smoke abundance in the atmosphere, derived from the images acquired by MISR's nine differently angled cameras. The thick smoke from both fires is apparent. Individual squares making up this map measure 2.7 miles (4.4 kilometers) on a side. The product shown here is a prototype of a new version of the MISR aerosol product to be publicly released in the near future, and increases the spatial resolution of the aerosol information by a factor of 16 compared to the currently available product, making it possible to discern finer details in the distribution of the smoke. These data were captured during Terra orbit 88284. http://photojournal.jpl.nasa.gov/catalog/PIA20720
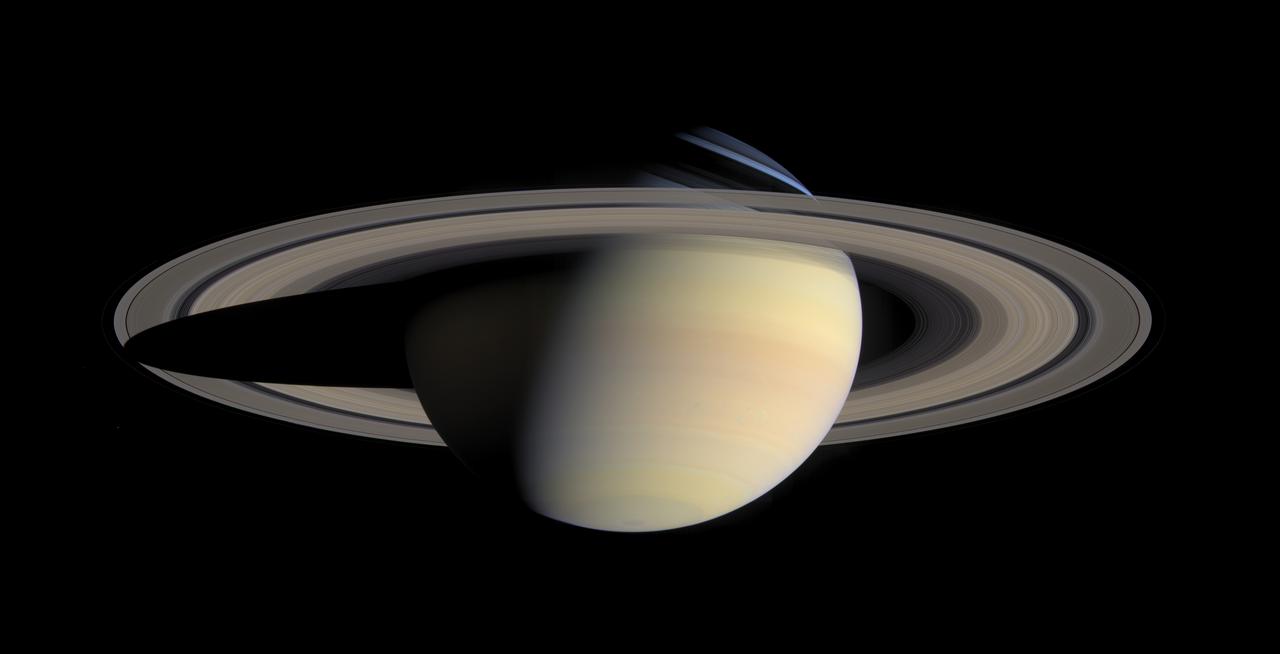
While cruising around Saturn in early October 2004, Cassini captured a series of images that have been composed into the largest, most detailed, global natural color view of Saturn and its rings ever made. This grand mosaic consists of 126 images acquired in a tile-like fashion, covering one end of Saturn's rings to the other and the entire planet in between. The images were taken over the course of two hours on Oct. 6, 2004, while Cassini was approximately 6.3 million kilometers (3.9 million miles) from Saturn. Since the view seen by Cassini during this time changed very little, no re-projection or alteration of any of the images was necessary. Three images (red, green and blue) were taken of each of 42 locations, or "footprints," across the planet. The full color footprints were put together to produce a mosaic that is 8,888 pixels across and 4,544 pixels tall. The smallest features seen here are 38 kilometers (24 miles) across. Many of Saturn's splendid features noted previously in single frames taken by Cassini are visible in this one detailed, all-encompassing view: subtle color variations across the rings, the thread-like F ring, ring shadows cast against the blue northern hemisphere, the planet's shadow making its way across the rings to the left, and blue-grey storms in Saturn's southern hemisphere to the right. Tiny Mimas and even smaller Janus are both faintly visible at the lower left. The Sun-Saturn-Cassini, or phase, angle at the time was 72 degrees; hence, the partial illumination of Saturn in this portrait. Later in the mission, when the spacecraft's trajectory takes it far from Saturn and also into the direction of the Sun, Cassini will be able to look back and view Saturn and its rings in a more fully-illuminated geometry. http://photojournal.jpl.nasa.gov/catalog/PIA06193
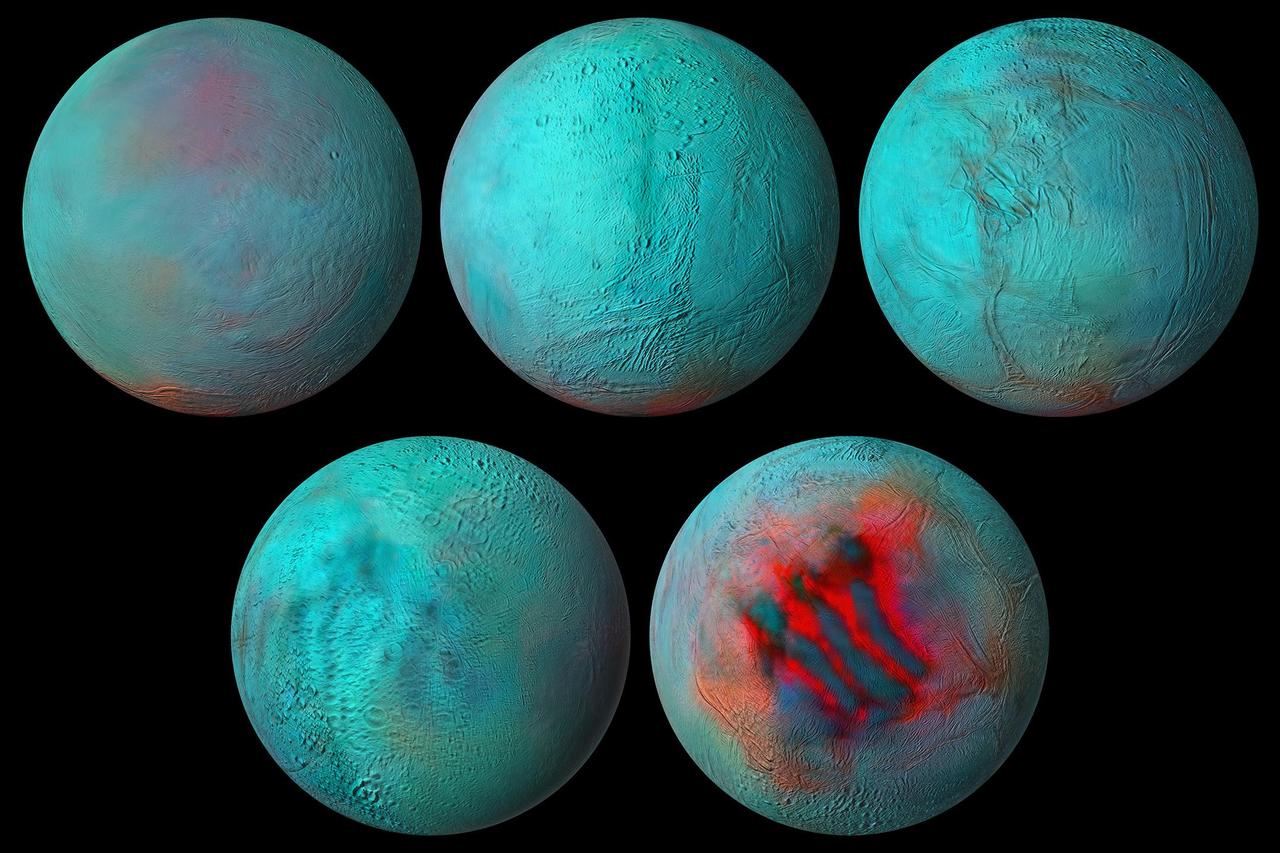
New composite images made from NASA's Cassini spacecraft data are the most detailed global infrared views ever produced of Saturn's moon Enceladus. And data used to build those images provides strong evidence that the northern hemisphere of the moon has been resurfaced with ice from its interior. During Cassini's 13-year exploration of the Saturn system, the spacecraft's Visible and Infrared Mapping Spectrometer (VIMS) collected light — both visible to the human eye and infrared light — reflected off the planet, its rings, and its 10 major icy moons. VIMS then separated light into its various wavelengths, information that tells scientists more about the makeup of the material reflecting it. Combined with detailed images captured by Cassini's Imaging Science Subsystem, the VIMS data was used to make the new global spectral map of Enceladus. It shows that infrared signals correlate with the geologic activity known to be ongoing at the south pole, where plumes of ice grains and vapor shoot out from an ocean that lies under the icy crust. The so-called "tiger stripe" gashes, where the plumes originate, are seen here. But some of the same infrared features are also seen in the northern hemisphere. That tells scientists not just that the northern area is covered with fresh ice but that the same kind of geologic activity, a resurfacing of the landscape, has occurred in both hemispheres. The resurfacing in the north may be due to icy jets, or a more gradual movement of ice through fractures in the crust, from the subsurface ocean to the surface. Movie available at https://photojournal.jpl.nasa.gov/catalog/PIA24023
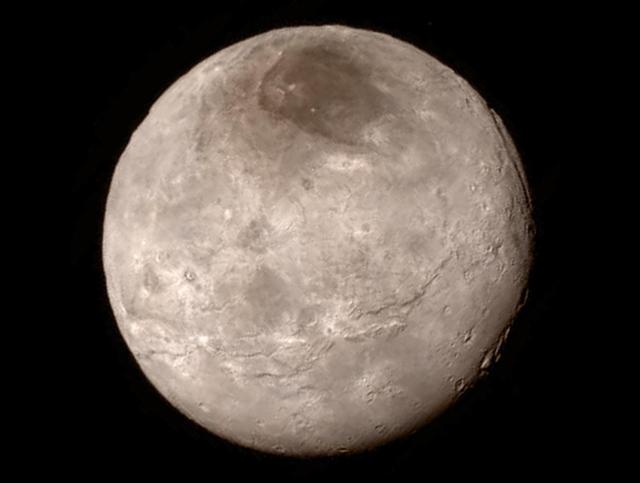
Remarkable new details of Pluto's largest moon Charon are revealed in this image from New Horizons' Long Range Reconnaissance Imager (LORRI), taken late on July 13, 2015 from a distance of 289,000 miles (466,000 kilometers). A swath of cliffs and troughs stretches about 600 miles (1,000 kilometers) from left to right, suggesting widespread fracturing of Charon's crust, likely a result of internal processes. At upper right, along the moon's curving edge, is a canyon estimated to be 4 to 6 miles (7 to 9 kilometers) deep. Mission scientists are surprised by the apparent lack of craters on Charon. South of the moon's equator, at the bottom of this image, terrain is lit by the slanting rays of the sun, creating shadows that make it easier to distinguish topography. Even here, however, relatively few craters are visible, indicating a relatively young surface that has been reshaped by geologic activity. In Charon's north polar region, a dark marking prominent in New Horizons' approach images is now seen to have a diffuse boundary, suggesting it is a thin deposit of dark material. Underlying it is a distinct, sharply bounded, angular feature; higher resolution images still to come are expected to shed more light on this enigmatic region. The image has been compressed to reduce its file size for transmission to Earth. In high-contrast areas of the image, features as small as 3 miles (5 kilometers) across can be seen. Some lower-contrast detail is obscured by the compression of the image, which may make some areas appear smoother than they really are. The uncompressed version still resides in New Horizons' computer memory and is scheduled to be transmitted at a later date. The image has been combined with color information obtained by New Horizons' Ralph instrument on July 13. New Horizons traveled more than three billion miles over nine-and-a-half years to reach the Pluto system. http://photojournal.jpl.nasa.gov/catalog/PIA19709
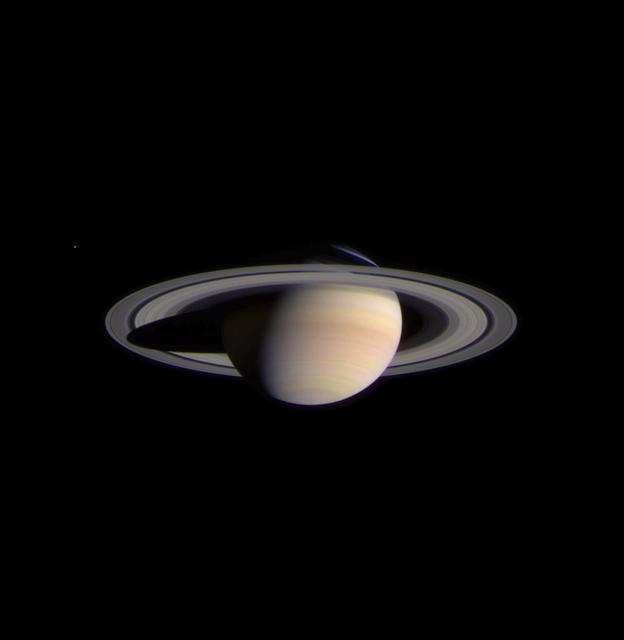
The narrow angle camera onboard NASA's Cassini spacecraft took a series of exposures of Saturn and its rings and moons on February 9, 2004, which were composited to create this stunning, color image. At the time, Cassini was 69.4 million kilometers (43.1 million miles) from Saturn, less than half the distance from Earth to the Sun. The image contrast and colors have been slightly enhanced to aid visibility. The smallest features visible in this image are approximately 540 kilometers across (336 miles). Fine details in the rings and atmosphere are beginning to emerge, and will grow in sharpness and clarity over the coming months. The optical thickness of Saturn's B (middle) ring and the comparative translucence of the A (outer) ring, when seen against the planet, are now apparent. Subtle color differences in the finely banded Saturnian atmosphere, as well as structure within the diaphanous, inner C ring can be easily seen. Noticeably absent are the ghostly spoke-like dark markings in Saturn's B ring, first discovered by NASA's Voyager spacecraft on approach to the planet 23 years ago. The icy moon Enceladus (520 kilometers or 323 miles across) is faintly visible on the left in the image. Its brightness has been increased seven times relative to the planet. Cassini will make several very close approaches to Enceladus, returning images in which features as small as 50 meters (165 feet) or less will be detectable. The composite image signals the start of Cassini's final approach to the ringed planet and the beginning of monitoring and data collection on Saturn and its environment. This phase of the mission will continue until Cassini enters orbit around Saturn on July 1, 2004. http://photojournal.jpl.nasa.gov/catalog/PIA05380
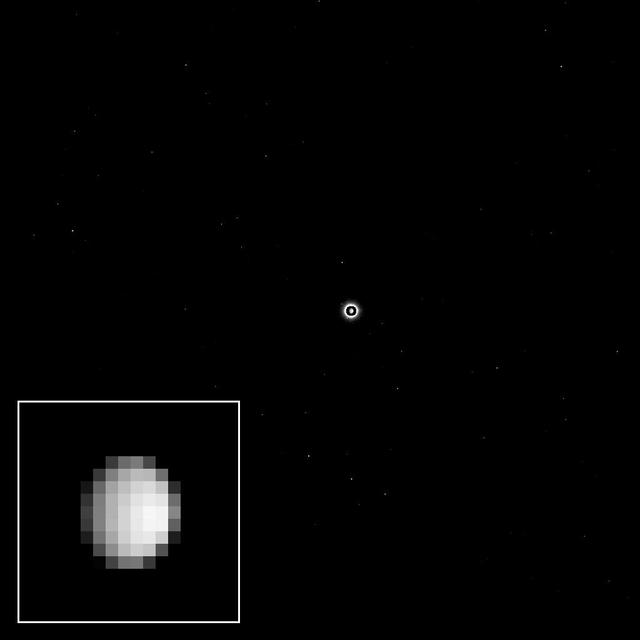
As the Dawn spacecraft flies through space toward the dwarf planet Ceres, the unexplored world appears to its camera as a bright light in the distance, full of possibility for scientific discovery. This view was acquired as part of a final calibration of the science camera before Dawn's arrival at Ceres. To accomplish this, the camera needed to take pictures of a target that appears just a few pixels across. On Dec. 1, 2014, Ceres was about nine pixels in diameter, nearly perfect for this calibration. The images provide data on very subtle optical properties of the camera that scientists will use when they analyze and interpret the details of some of the pictures returned from orbit. Ceres is the bright spot in the center of the image. Because the dwarf planet is much brighter than the stars in the background, the camera team selected a long exposure time to make the stars visible. The long exposure made Ceres appear overexposed, and exaggerated its size; this was corrected by superimposing a shorter exposure of the dwarf planet in the center of the image. A cropped, magnified view of Ceres appears in the inset image at lower left. The image was taken on Dec. 1, 2014 with the Dawn spacecraft's framing camera, using a clear spectral filter. Dawn was about 740,000 miles (1.2 million kilometers) from Ceres at the time. Ceres is 590 miles (950 kilometers) across and was discovered in 1801. http://photojournal.jpl.nasa.gov/catalog/PIA19050
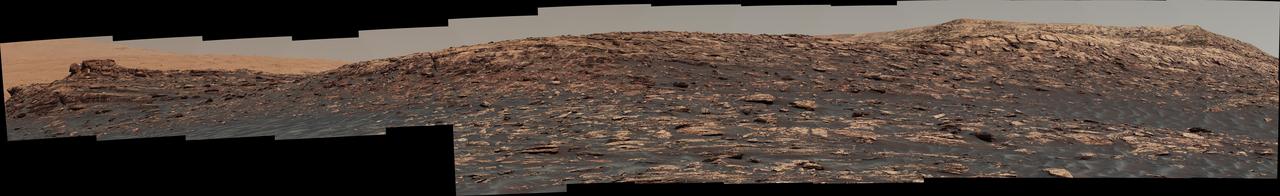
"Vera Rubin Ridge," a favored destination for NASA's Curiosity Mars rover even before the rover landed in 2012, rises near the rover nearly five years later in this panorama from Curiosity's Mast Camera (Mastcam). The scene combines 23 images taken with the Mastcam's right-eye, telephoto-lens camera, on June 22, 2017, during the 1,734th Martian day, or sol, of Curiosity's work on Mars. The rover began ascending the ridge in September 2017. This and other Mastcam panoramas show details of the sedimentary rocks that make up the "Vera Rubin Ridge." This distinct topographic feature located on the lower slopes of Mount Sharp (Aeolis Mons) is characterized by the presence of hematite, an iron-oxide mineral, which has been detected from orbit. The Mastcam images show that the rocks making up the lower part of the ridge are characterized by distinct horizontal stratification with individual rock layers of the order of several inches (tens of centimeters) thick. Scientists on the mission are using such images to determine the ancient environment these rocks were deposited in. The repeated beds indicate progressive accumulation of sediments that now make up the lower part of Mount Sharp, although from this distance it is not possible to know if they were formed by aqueous or wind-blown processes. Close-up images collected as the rover climbs the ridge will help answer this question. The stratified rocks are cross cut by veins filled with a white mineral, likely calcium sulfate, that provide evidence of later episodes of fluid flow through the rocks. The panorama has been white-balanced so that the colors of the rock materials resemble how they would appear under daytime lighting conditions on Earth. It spans about 65 compass degrees, centered toward the south-southeast. Higher portions of Mount Sharp are visible at upper left. The Sol 1734 location just north of the ridge is shown in a Sol 1732 traverse map. An annotated figure is shown at https://photojournal.jpl.nasa.gov/catalog/PIA21849
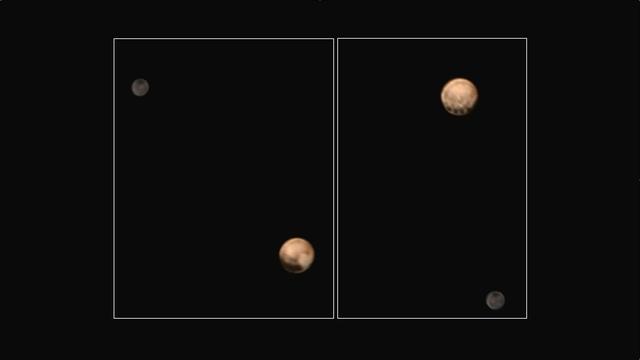
This pair of approximately true color images of Pluto and its big moon Charon, taken by NASA's New Horizons spacecraft, highlight the dramatically different appearance of different sides of the dwarf planet, and reveal never-before-seen details on Pluto's varied surface. The views were made by combining high-resolution black-and-white images from the Long Range Reconnaissance Imager (LORRI) with color information from the lower-resolution color camera that is part of the Ralph instrument. The left-hand image shows the side of Pluto that always faces away from Charon -- this is the side that will be seen at highest resolution by New Horizons when it makes its close approach to Pluto on July 14th. This hemisphere is dominated by a very dark region that extends along the equator and is redder than its surroundings, alongside a strikingly bright, paler-colored region which straddles the equator on the right-hand side of the disk. The opposite hemisphere, the side that faces Charon, is seen in the right-hand image. The most dramatic feature on this side of Pluto is a row of dark dots arranged along the equator. The origin of all these features is still mysterious, but may be revealed in the much more detailed images that will be obtained as the spacecraft continues its approach to Pluto. In both images, Charon shows a darker and grayer color than Pluto, and a conspicuous dark polar region. The left-hand image was obtained at 5:37 UT on June 25th 2015, at a distance from Pluto of 22.9 million kilometers (14.3 million miles) and has a central longitude of 152 degrees. The right-hand image was obtained at 23:15 UT on June 27th 2015, at a distance from Pluto of 19.7 million kilometers (12.2 million miles) with a central longitude of 358 degrees. Insets show the orientation of Pluto in each image -- the solid lines mark the equator and the prime meridian, which is defined to be the longitude that always faces Charon. The smallest visible features are about 200 km (120 miles) across. http://photojournal.jpl.nasa.gov/catalog/PIA19693

This composite image of the Jovian moon Io was generated using data collected by the JunoCam imager aboard NASA's Juno spacecraft during four separate flybys. The resolution of the images gets progressively better as the distance between spacecraft and moon decreases with each flyby. The image of the moon on the far left has a resolution 44 miles (71 kilometers) per pixel. It was taken on April 9, 2022, during Juno's 41st orbit of Jupiter (perijove 41, or PJ41), when the spacecraft flew past Io at a distance of about 66,000 miles (106,000 kilometers). Note the gray, roughly triangular patch at the terminator near the moon's center. Citizen scientist Björn Jónsson created this image using data from JunoCam. The center-left image was acquired on July 5, 2022, during Juno's 43rd orbit of Jupiter (PJ43) at a distance of 53,000 miles (86,000 kilometers). The resolution in this image has improved to 36 miles (58 kilometers) per pixel. In this view, more detail of the gray patch is seen (from a different perspective). Citizen scientist Jason Perry created this image using data from JunoCam. By the time the center-right image of Io was taken on Dec. 14, 2022, (PJ47), the distance between spacecraft and moon had decreased to 40,000 miles (64,000 kilometers), which increased the resolution to 27 miles (43 kilometers) per pixel. Here, the gray triangle appears as three distinct volcanoes with the central vents visible as dark spots in their centers. Characteristics of other nearby volcanoes also begin to stand out. Citizen scientist Mike Ravine created this image using data from JunoCam. The far-right image, taken during Juno's 49th flyby (PJ49) on March 1, 2023, shows that the spacecraft again approached the moon from a changed perspective, allowing different territory on Io's surface to be viewed. The triplet of volcanoes that make up the gray triangular patch are visible near the top of the image, and more detail of the volcanic terrain can be made out. The altitude at the time of closest approach was about 32,000 miles (51,500 kilometers), allowing resolution to increase to 22 miles (35 kilometers) per pixel. Citizen scientist Kevin M. Gill created this image using data from JunoCam. https://photojournal.jpl.nasa.gov/catalog/PIA25887
S73-35080 (July-September 1973) --- A vertical view of northeast Oklahoma and the metropolitan Tulsa area is seen in this Skylab 3 Earth Resources Experiments Package S190-B (five-inch Earth terrain camera) photograph taken from the Skylab space station in Earth orbit. THE PICTURE SHOULD BE HELD WITH THE CLOCK ON THE LEFT AND THE LAKE IN THE CORNER ON THE RIGHT. THE LONG STRETCH OF HIGHWAY (U.S. 75) RUNS STRAIGHT NORTH FROM TULSA. Tulsa, a rapidly expanding city in the heart of the mid-continent oil field, has a population of approximately 330,000. The Arkansas River meanders across the southern (lower) portion of the photograph passing through Tulsa as it flows southeastward. Oologah Reservoir, the long body of water, is located northeast of Tulsa. Lake Hudson is the body of water in the right corner of the picture. Keystone Reservoir is to the west and upstream from Tulsa. Westward from Tulsa U.S. 64 makes a 45 degree bend as it turns northwest to cross the Keystone Reservoir. The thin white line over the Oologah Reservoir is a highway bridge. Bartlesville is on U.S. 75 near the north (top) corner of the picture. The Tulsa International Airport is immediately northeast of downtown Tulsa. Several smaller airfields are visible in the surrounding area. The toll roads and other major highways are clearly visible in the picture. Claremore is northeast of Tulsa on U.S. 66 with the Will Rogers Turnpike passing nearby. Sapulpa is southwest of Tulsa on the Turner Turnpike which leads toward Oklahoma City. The detailed information contained in this photograph can be extracted by direct observation and applied to updating land use and cultural maps of Tulsa and to numerous surrounding satellite cities. All EREP photography is available to the public through the Department of Interior?s Earth Resources Observations Systems Data Center, Sioux Falls, South Dakota, 57198. (Alternate number SL3-83-206) Photo credit: NASA
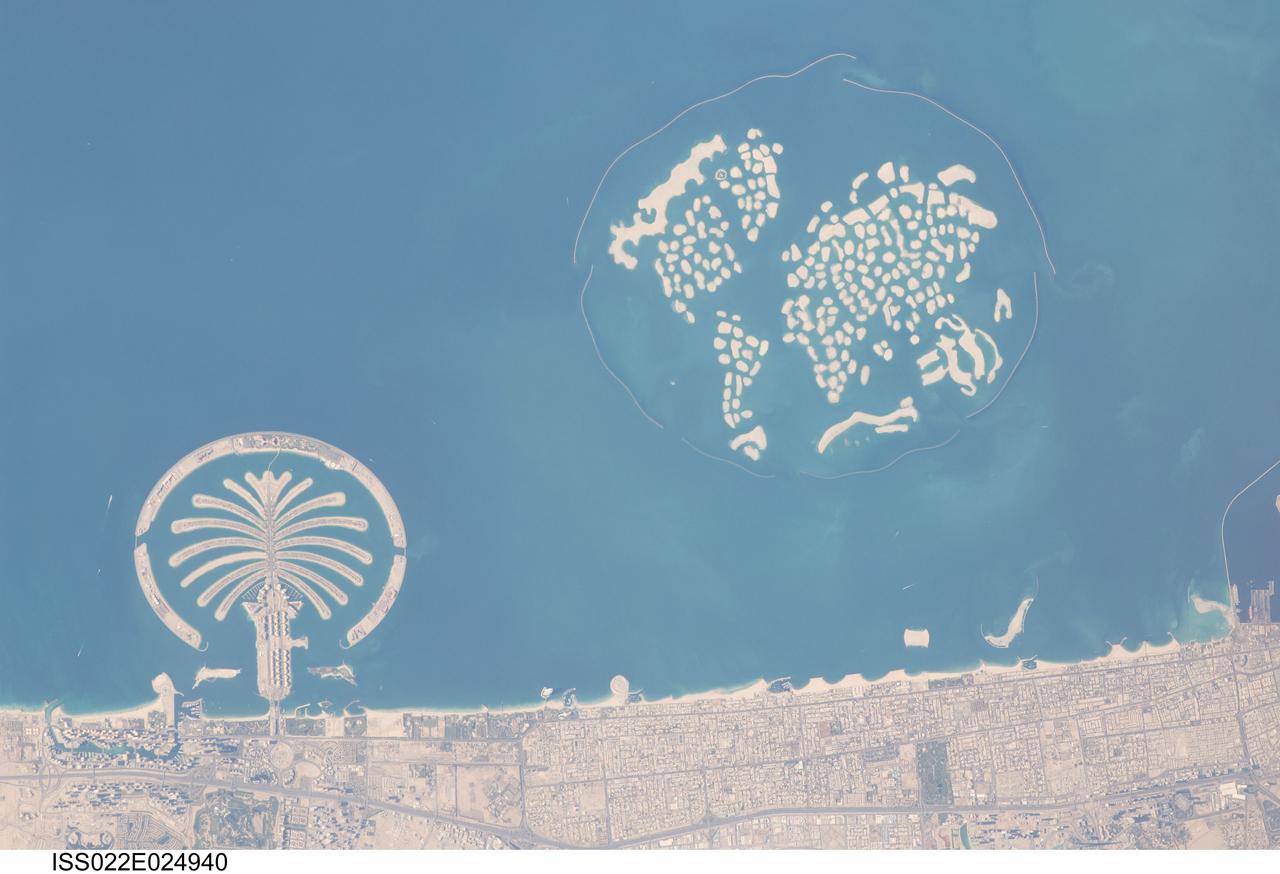
ISS022-E-024940 (13 Jan. 2010) --- Man-made archipelagos near Dubai, United Arab Emirates are featured in this image photographed by an Expedition 22 crew member on the International Space Station. The municipality of Dubai is the largest city of the Persian Gulf emirate of the same name, and has built a global reputation for large-scale developments and architectural works. Among the most visible of these developments ? particularly from the perspective of astronauts onboard the ISS ? are three man-made archipelagos. The two Palm Islands (Palm Jumeirah and Palm Jebel Ali) appear as stylized palm trees when viewed from above. The World Islands evoke a rough map of the world from an air- or space-borne perspective. Palm Jumeirah and the World Islands are highlighted in this view. Palm Jumeirah (lower left) was begun in 2001 and required more than 50 million cubic meters of dredged sand to raise the islands above the Persian Gulf sea level. Construction of the Palm Jumeirah islands was completed in 2006; they are now being developed for residential and commercial housing and infrastructure. Creation of the 300 World Islands (upper right) was begun in 2003 and completed in 2008, using 320 million cubic meters of sand and 37 million tons of rock for the surrounding 27 kilometer-long protective breakwater. Also visible at the lower edge of the image is another notable built structure ? the Burj Tower (white rectangle at lower right and inset image). The Burj Tower ? or Burj Khalifa ? stands 800 meters high, and is currently the world?s tallest structure. The photograph captures enough detail to make out the tapering outline of the building as well as its dark needle-like shadow pointing towards the northeast.
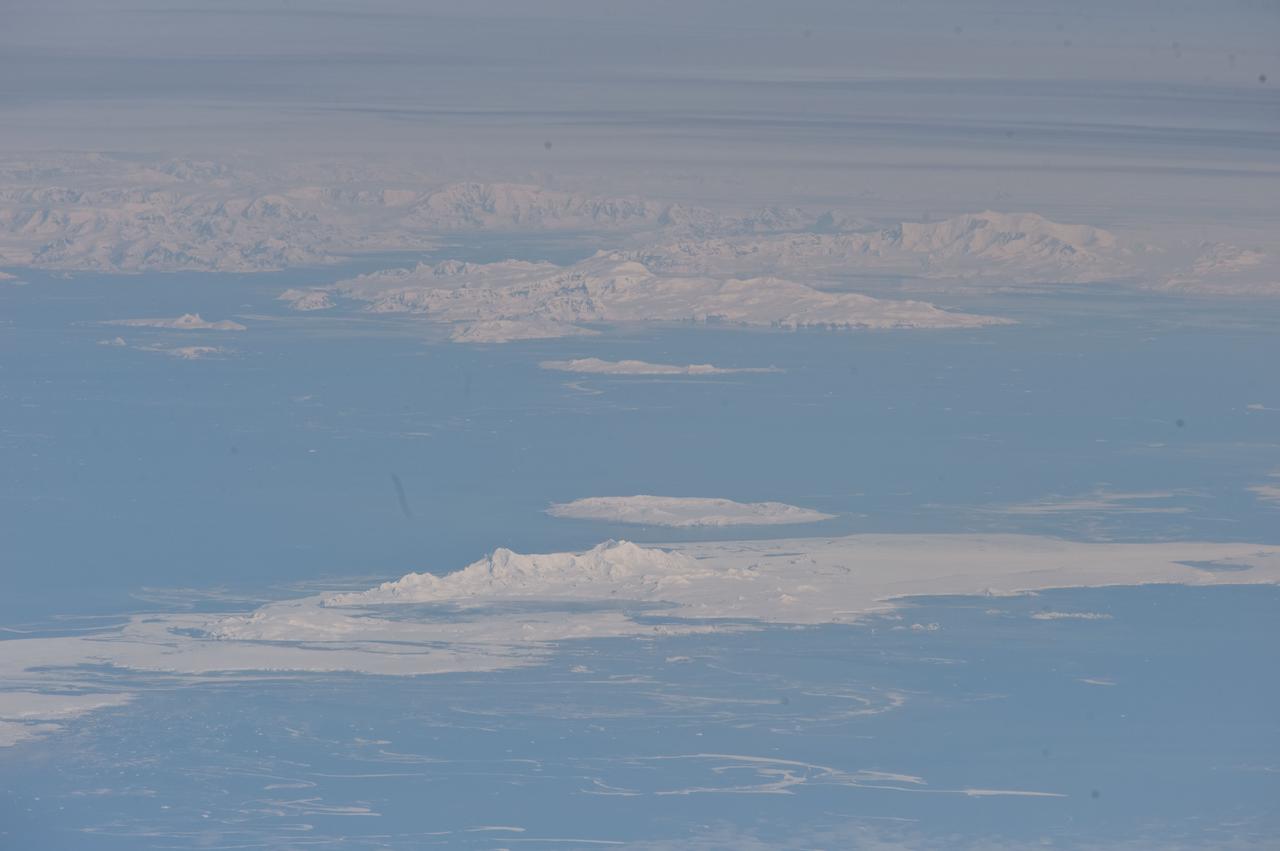
ISS029-E-041836 (4 Oct. 2011) --- South Shetland Islands and Antarctic Peninsula are featured in this image photographed by an Expedition 29 crew member on the International Space Station (ISS). The inclined equatorial orbit of the space station limits nadir Earth views?looking ?straight down? at the surface from the spacecraft?to latitudes between approximately 52 North and 52 South. When viewing conditions are ideal, the crew can obtain detailed oblique imagery?looking outwards at an angle from the space station?of regions at higher latitudes such as Greenland or, in this image, Antarctica. While the bulk of the continent of Antarctica is currently situated over the South Pole, the narrow Antarctic Peninsula extends like a finger towards the southern tip of South America. The northernmost part of the Peninsula is known as Graham Land, a small portion of which (located at approximately 64 South latitude) can be seen at top left in this photograph. Two of the South Shetland Islands that lay off the coast of Graham Land to the north-northwest, Livingston Island and Deception Island, are visible in the image. While both islands have a volcanic origin, active volcanism at Deception Island has been recorded since 1800; the last verified eruptive activity occurred in 1970. Closer to the coastline of Graham Land, Brabant Island (not considered to be part of the South Shetlands) also includes numerous outcrops of volcanic rock attesting to the complex tectonic history of the region. The space station was located over the South Atlantic Ocean, approximately 1,800 kilometers to the northeast in terms of its ground track, when this image was taken. This long viewing distance, combined with the highly oblique viewing angle, accentuates shadowing of the ground surface and provides a sense of the topography similar to the view one gets from an airplane. It also causes foreshortening of features visible in the image, making them appear closer to each other than they actually are ? for example, the actual distance between Livingston and Deception Islands is approximately 20 kilometers.
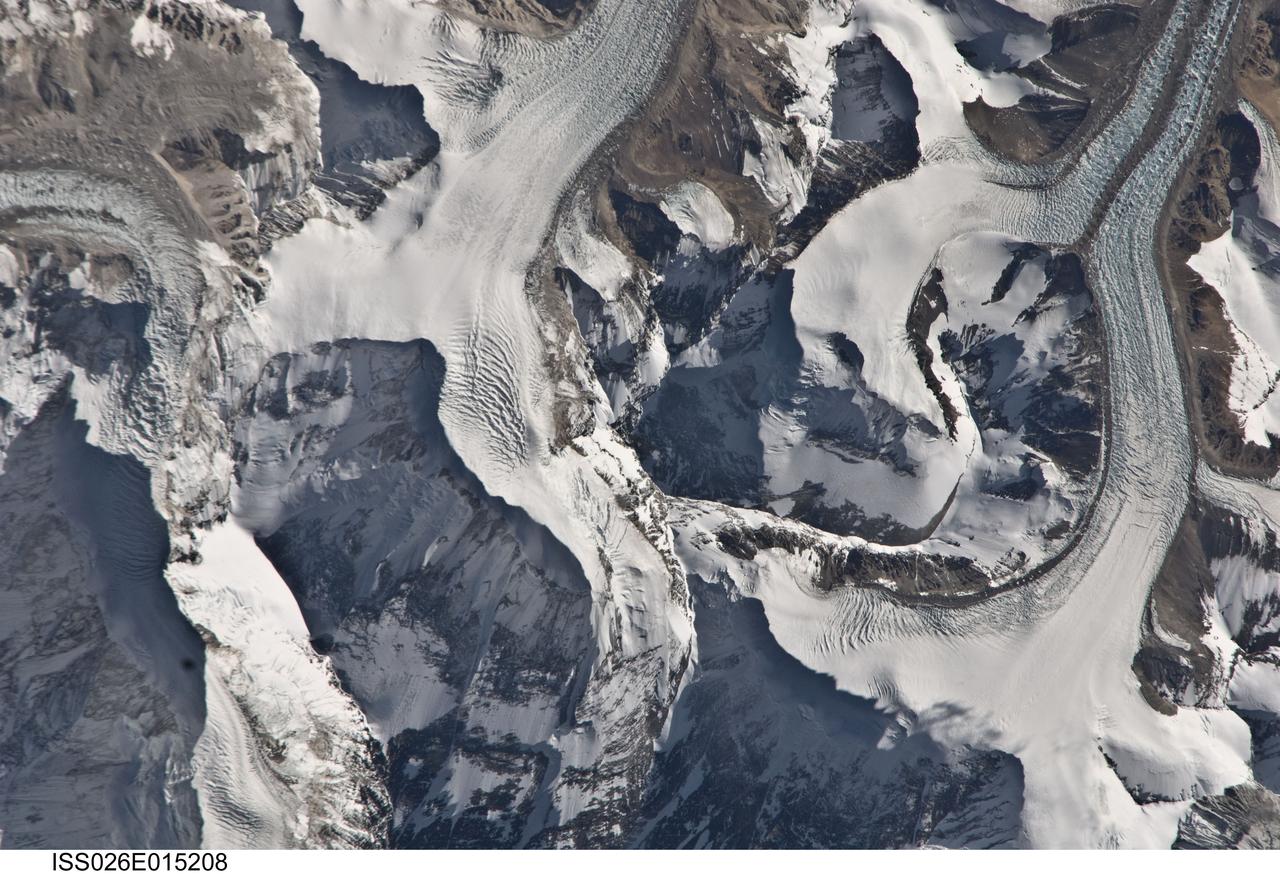
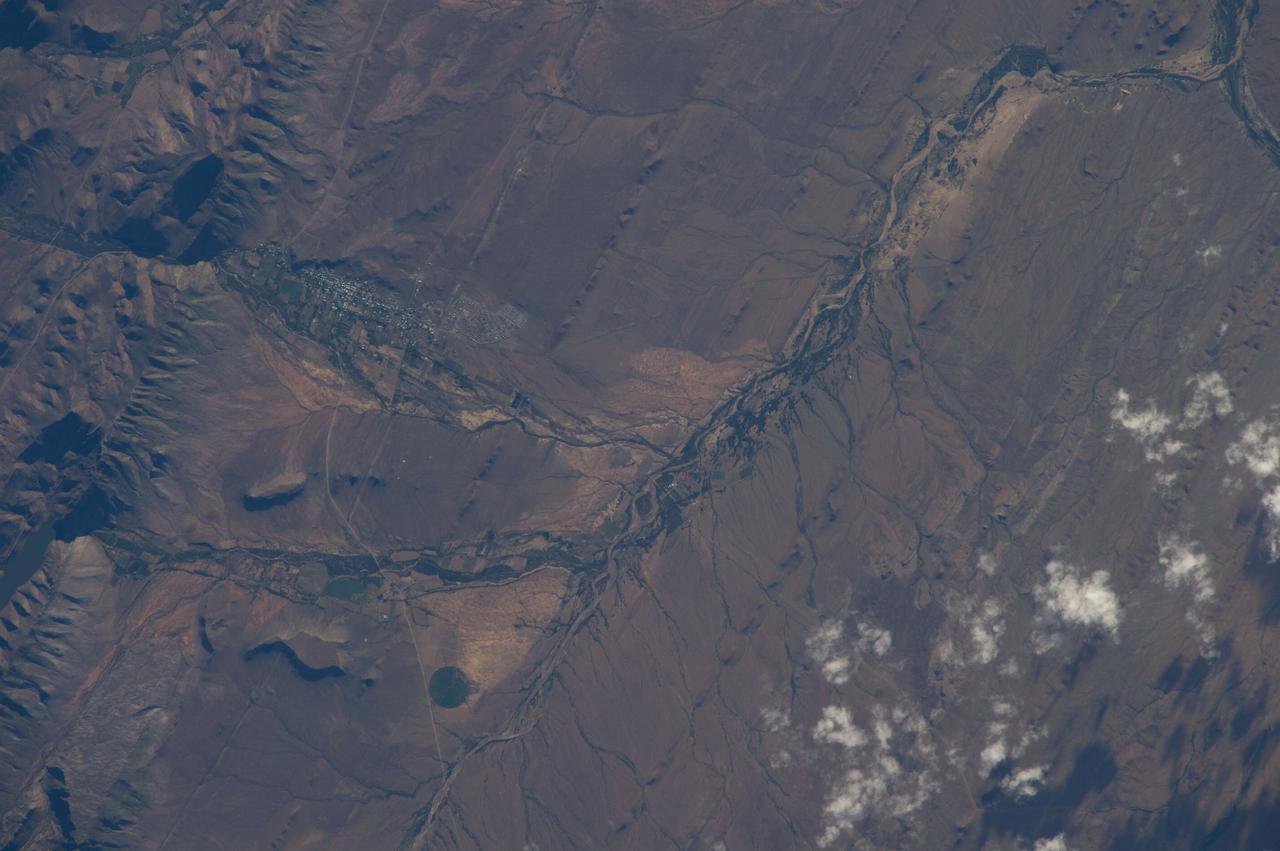
ISS026-E-015208 (6 Jan. 2011) --- Photographed by an Expedition 26 crew member on the International Space Station, this detailed photograph highlights the northern approach to Mount Everest from Tibet. Known as the northeast ridge route, climbers travel along the East Rongbuk Glacier (top right) to camp at the base of Changtse mountain. From this point at approximately 6,100 meters above sea level, the North Col--a sharp-edged pass carved by glaciers, center--is ascended to reach a series of progressively higher camps along the North Face of Everest, culminating in Camp VI at 8,230 meters above sea level. Climbers make their final push to the summit (not visible, just off the bottom edge of the image) from this altitude. While the near-nadir viewing angle--almost looking "straight down" from the International Space Station--tends to flatten the topography, crew members have also taken images that highlight the rugged nature of the area. Everest (or Sagarmatha in Nepali), located within the Himalaya mountain chain, is Earth’s highest mountain with its summit at 8,848 meters above sea level. Khumbutse mountain, visible at top left, has a summit elevation of 6,640 meters above sea level. Climbing to the summit of Everest requires much advance planning, conditioning, and situational awareness on the part of mountaineers to avoid potentially fatal consequences--as of 2010, there have been over 200 reported fatalities.
ISS028-E-018675 (23 July 2011) --- Biomass burning in southern Africa is featured in this image photographed by an Expedition 28 crew member on the International Space Station. A smoke pall of subcontinental proportions dominates this view of tropical southern Africa. In what has been described as the most fire-prone part of the world, numerous fires give rise to regional smoke palls every dry season. Fires are both natural and set by local people to clear woodland for agricultural fields. This recent, oblique, northwest-looking view taken in July 2011 at the end of the dry season shows the extent of the smoke on the African plateau?from central Zimbabwe (lower left) to northern Malawi more than 1,000 kilometers away (top right)?and in the wide coastal plains of the lower Zambezi River valley of Mozambique (lower right). Here smoke can be seen blowing inland (left to right), channeled up the Zambezi River valley and contributing to the pall on the plateau. The light gray smoke plumes contrast with higher altitude, brighter patchy cloud cover at lower right. The smoke palls obscure much surface detail, so that Lake Malawi, one of Africa?s Great Lakes, is barely visible, as is Lake Cahora Bassa, Africa?s fourth largest reservoir, in the Zambezi valley. The sun?s reflection off its surface (sunglint) makes Lake Kariba most prominent in the view at left. Kariba is the world?s largest artificial reservoir by volume, and is 220 kilometers long, giving a sense of the scale of the view. The steep, shadowed, mid-afternoon faces of the Inyanga Mountains on the Mozambique-Zimbabwe border protrude above the smoke layer at lower left. Solar panels extending from Russian spacecraft docked at the International Space Station are visible in the foreground at left.
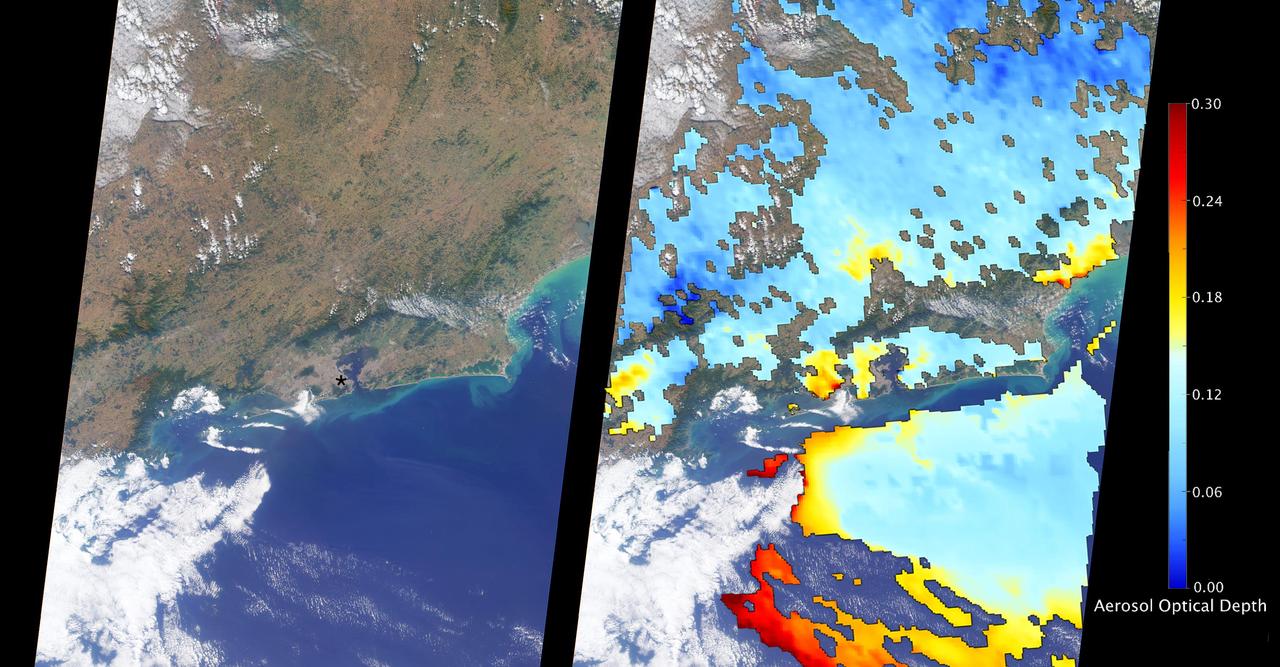
The Multi-angle Imaging SpectroRadiometer (MISR) instrument aboard NASA's Terra satellite passed directly over Rio de Janeiro, Brazil, on Aug. 2, 2016, just prior to the opening of the Summer Olympic Games. On the left is an image from MISR's nadir (downward-looking) camera; the width of the image is 235 miles (378 kilometers), and Rio de Janeiro is visible as the large gray area on the coast in the center. The black asterisk marks the location of the Maracanã Stadium in downtown, where the opening ceremonies were held. In the weeks leading up to the Aug. 5 opening ceremonies in Rio de Janeiro, there have been reports of elevated levels of particulate matter in the region. Particulate matter refers to tiny airborne droplets or pieces of soot and dust that can end up in the lungs, comprising an all-too-common problem for many cities around the world. MISR data are routinely used to estimate the amount of air pollution via measurements of aerosol optical depth, which is a measure of how much incoming light from the sun is blocked by particles in the atmosphere. On the right, a map of aerosol optical depth is superimposed on the image. Individual squares making up this map measure 2.7 miles (4.4 kilometers) on a side, and holes in the map occur where an aerosol amount could not be determined, such as where clouds are present. Optical depth over Rio is slightly elevated compared to its surroundings, most likely due to the presence of air pollution, with values from 0.15-0.25. For reference, an optical depth of 0.2 corresponds to light haze. The product shown here is a prototype of a new version of the MISR aerosol product to be publicly released in the near future, and increases the spatial resolution of the aerosol information by a factor of 16 compared to the currently available product, making it possible to observe the fine details of optical depth over urban areas. These data were captured during Terra orbit 88426. http://photojournal.jpl.nasa.gov/catalog/PIA20885
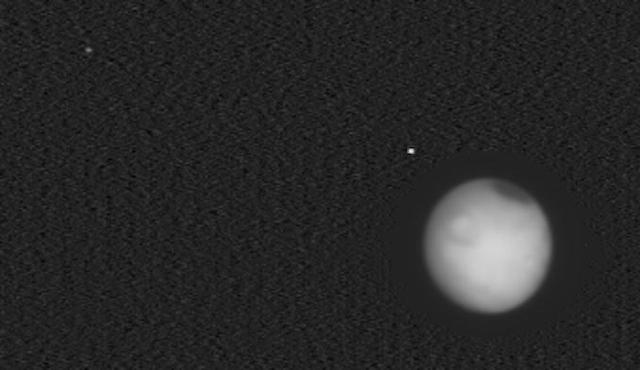
NASA's Europa Clipper captured this infrared image of the heat radiation from Mars and its moons Phobos (closest to Mars) and Deimos (seen in upper left corner) on Feb. 28, 2025, as the spacecraft approached the Red Planet while en route to the Jupiter system to investigate the icy moon Europa. The mission flew by Mars the next day, using the planet's gravity to help shape the spacecraft's trajectory. When the image was taken by the mission's Europa Thermal Emission Imaging System (E-THEMIS), the spacecraft was about 560,000 miles (900,000 kilometers) from the Red Planet. The image is composed of 200 individual frames, part of a continuous scan of 1,100 frames taken roughly a second apart over a period of 20 minutes. Scientists are using the tiny, point-like images of the moons to check the camera's focus. The image was captured using the middle of E-THEMIS's three long-wave infrared wavelength bands, which extend from about 14 to 28 micrometers. (A previously released E-THEMIS image of Mars used the shortest of the instrument's wavelength bands, extending from 7 to 14 micrometers and showing Mars in higher contrast.) The dark oval near the top of Mars is the planet's cold northern polar cap and is about minus 190 degrees Fahrenheit (minus 125 degrees Celsius). The circular feature seen on Mars is the region around Elysium Mons. The faint halo seen around the planet is due to the processing of the image. The two moons are about 250 times fainter than Mars, so scientists brightened the image (except for a region circling the planet) to make the moons more visible. The brightening also makes image noise more visible; the area surrounding Mars within the halo appears comparatively dark because it wasn't brightened. Europa Clipper launched from NASA's Kennedy Space Center in Florida on Oct. 14, 2024, and will arrive at the Jupiter system in 2030 to conduct about 50 flybys of Europa. The mission's main science goal is to determine whether there are places below Europa's surface that could support life. The mission's three main science objectives are to determine the thickness of the moon's icy shell and its surface interactions with the ocean below, to investigate its composition, and to characterize its geology. The mission's detailed exploration of Europa will help scientists better understand the astrobiological potential for habitable worlds beyond our planet. https://photojournal.jpl.nasa.gov/catalog/PIA26567
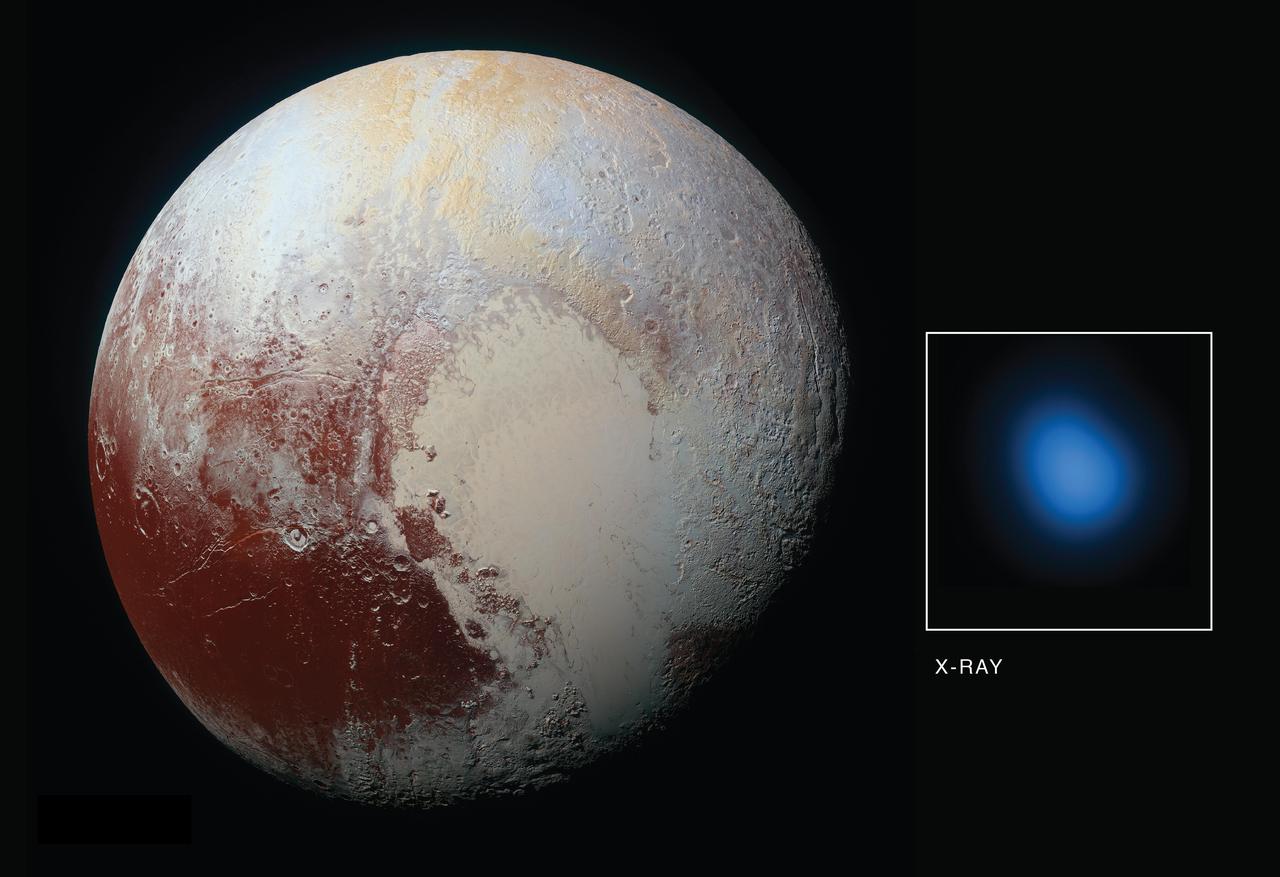
The first detection of Pluto in X-rays has been made using NASA's Chandra X-ray Observatory in conjunction with observations from NASA's New Horizons spacecraft. As New Horizons approached Pluto in late 2014 and then flew by the planet during the summer of 2015, Chandra obtained data during four separate observations. During each observation, Chandra detected low-energy X-rays from the small planet. The main panel in this graphic is an optical image taken from New Horizons on its approach to Pluto, while the inset shows an image of Pluto in X-rays from Chandra. There is a significant difference in scale between the optical and X-ray images. New Horizons made a close flyby of Pluto but Chandra is located near the Earth, so the level of detail visible in the two images is very different. The Chandra image is 180,000 miles across at the distance of Pluto, but the planet is only 1,500 miles across. Pluto is detected in the X-ray image as a point source, showing the sharpest level of detail available for Chandra or any other X-ray observatory. This means that details over scales that are smaller than the X-ray source cannot be seen here. Detecting X-rays from Pluto is a somewhat surprising result given that Pluto - a cold, rocky world without a magnetic field - has no natural mechanism for emitting X-rays. However, scientists knew from previous observations of comets that the interaction between the gases surrounding such planetary bodies and the solar wind - the constant streams of charged particles from the sun that speed throughout the solar system -- can create X-rays. The researchers were particularly interested in learning more about the interaction between the gases in Pluto's atmosphere and the solar wind. The New Horizon spacecraft carries an instrument designed to measure that activity up-close -- Solar Wind Around Pluto (SWAP) -- and scientists examined that data and proposed that Pluto contains a very mild, close-in bowshock, where the solar wind first "meets" Pluto (similar to a shock wave that forms ahead of a supersonic aircraft) and a small wake or tail behind the planet. The immediate mystery is that Chandra's readings on the brightness of the X-rays are much higher than expected from the solar wind interacting with Pluto's atmosphere. The Chandra detection is also surprising since New Horizons discovered Pluto's atmosphere was much more stable than the rapidly escaping, "comet-like" atmosphere that many scientists expected before the spacecraft flew past in July 2015. In fact, New Horizons found that Pluto's interaction with the solar wind is much more like the interaction of the solar wind with Mars, than with a comet. While Pluto is releasing enough gas from its atmosphere to make the observed X-rays, there isn't enough solar wind flowing directly at Pluto at its great distance from the Sun to make them according to certain theoretical models. There are several suggested possibilities for the enhanced X-ray emission from Pluto. These include a much wider and longer tail of gases trailing Pluto than New Horizons detected using its SWAP instrument. Because Pluto is so small compared to the size of a Chandra point source, scientists may be unable to detect such a tail in X-rays. Other possibilities are that interplanetary magnetic fields are focusing more particles than expected from the solar wind into the region around Pluto, or the low density of the solar wind in the outer solar system at the distance of Pluto could allow for the formation of a doughnut, or torus, of neutral gas centered around Pluto's orbit. It will take deeper and higher resolution images of X-rays from Pluto's environment than we currently have from Chandra to distinguish between these possibilities. http://photojournal.jpl.nasa.gov/catalog/PIA21061
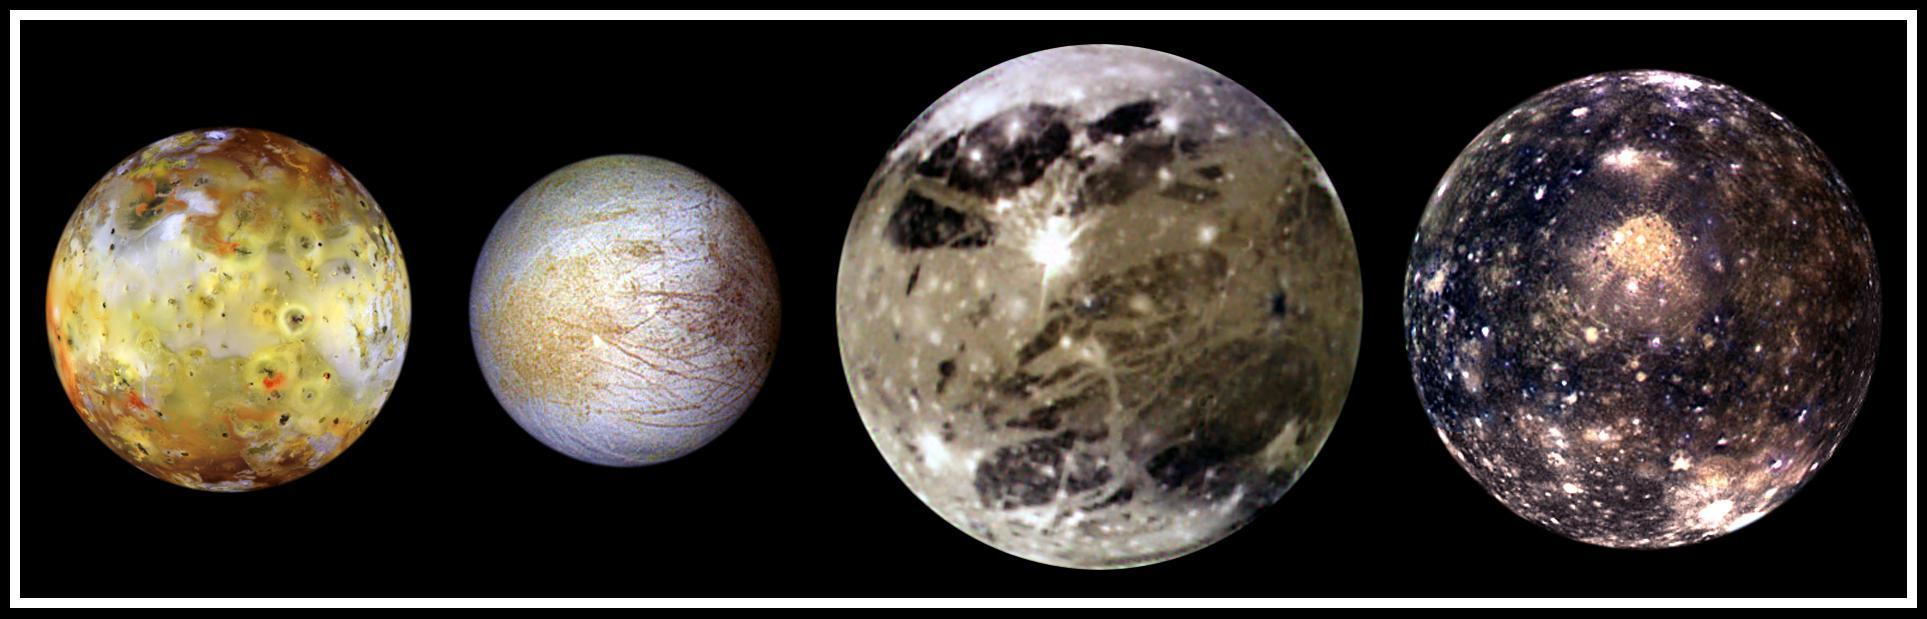
In this "family portrait," the four Galilean Satellites are shown to scale. These four largest moons of Jupiter shown in increasing distance from Jupiter are (left to right) Io, Europa, Ganymede, and Callisto. These global views show the side of volcanically active Io which always faces away from Jupiter, icy Europa, the Jupiter-facing side of Ganymede, and heavily cratered Callisto. The appearances of these neighboring satellites are amazingly different even though they are relatively close to Jupiter (350,000 kilometers for Io; 1, 800,000 kilometers for Callisto). These images were acquired on several orbits at very low "phase" angles (the sun, spacecraft, moon angle) so that the sun is illuminating the Jovian moons from completely behind the spacecraft, in the same way a full moon is viewed from Earth. The colors have been enhanced to bring out subtle color variations of surface features. North is to the top of all the images which were taken by the Solid State Imaging (SSI) system on NASA's Galileo spacecraft. Io, which is slightly larger than Earth's moon, is the most colorful of the Galilean satellites. Its surface is covered by deposits from actively erupting volcanoes, hundreds of lava flows, and volcanic vents which are visible as small dark spots. Several of these volcanoes are very hot; at least one reached a temperature of 2000 degrees Celsius (3600 degrees Fahrenheit) in the summer of 1997. Prometheus, a volcano located slightly right of center on Io's image, was active during the Voyager flybys in 1979 and is still active as Galileo images were obtained. This global view was obtained in September 1996 when Galileo was 485,000 kilometers from Io; the finest details that can be discerned are about 10 km across. The bright, yellowish and white materials located at equatorial latitudes are believed to be composed of sulfur and sulfur dioxide. The polar caps are darker and covered by a redder material. Europa has a very different surface from its rocky neighbor, Io. Galileo images hint at the possibility of liquid water beneath the icy crust of this moon. The bright white and bluish parts of Europa's surface are composed almost completely of water ice. In contrast, the brownish mottled regions on the right side of the image may be covered by salts (such as hydrated magnesium-sulfate) and an unknown red component. The yellowish mottled terrain on the left side of the image is caused by some other, unknown contaminant. This global view was obtained in June 1997 when Galileo was 1.25 million kilometers from Europa; the finest details that can be discerned are 25 kilometers across. Ganymede, larger than the planet Mercury, is the largest Jovian satellite. Its distinctive surface is characterized by patches of dark and light terrain. Bright frost is visible at the north and south poles. The very bright icy impact crater, Tros, is near the center of the image in a region known as Phrygia Sulcus. The dark area to the northwest of Tros is Perrine Regio; the dark terrain to the south and southeast is Nicholson Regio. Ganymede's surface is characterized by a high degree of crustal deformation. Much of the surface is covered by water ice, with a higher amount of rocky material in the darker areas. This global view was taken in September 1997 when Galileo was 1.68 million kilometers from Ganymede; the finest details that can be discerned are about 67 kilometers across. Callisto's dark surface is pocked by numerous bright impact craters. The large Valhalla multi-ring structure (visible near the center of the image) has a diameter of about 4,000 kilometers, making it one of the largest impact features in the Solar System. Although many crater rims exhibit bright icy "bedrock" material, a dark layer composed of hydrated minerals and organic components (tholins) is seen inside many craters and in other low lying areas. Evidence of tectonic and volcanic activity, seen on the other Galilean satellites, appears to be absent on Callisto. This global view was obtained in November 1997 when Galileo was 684,500 kilometers from Callisto; the finest details that can be discerned are about 27 kilometers across. http://photojournal.jpl.nasa.gov/catalog/PIA01400

This side-by-side comparison shows observations of the Southern Ring Nebula in near-infrared light, at left, and mid-infrared light, at right, from NASA’s Webb Telescope. This scene was created by a white dwarf star – the remains of a star like our Sun after it shed its outer layers and stopped burning fuel though nuclear fusion. Those outer layers now form the ejected shells all along this view. In the Near-Infrared Camera (NIRCam) image, the white dwarf appears to the lower left of the bright, central star, partially hidden by a diffraction spike. The same star appears – but brighter, larger, and redder – in the Mid-Infrared Instrument (MIRI) image. This white dwarf star is cloaked in thick layers of dust, which make it appear larger. The brighter star in both images hasn’t yet shed its layers. It closely orbits the dimmer white dwarf, helping to distribute what it’s ejected. Over thousands of years and before it became a white dwarf, the star periodically ejected mass – the visible shells of material. As if on repeat, it contracted, heated up – and then, unable to push out more material, pulsated. Stellar material was sent in all directions – like a rotating sprinkler – and provided the ingredients for this asymmetrical landscape. Today, the white dwarf is heating up the gas in the inner regions – which appear blue at left and red at right. Both stars are lighting up the outer regions, shown in orange and blue, respectively. The images look very different because NIRCam and MIRI collect different wavelengths of light. NIRCam observes near-infrared light, which is closer to the visible wavelengths our eyes detect. MIRI goes farther into the infrared, picking up mid-infrared wavelengths. The second star more clearly appears in the MIRI image, because this instrument can see the gleaming dust around it, bringing it more clearly into view. The stars – and their layers of light – steal more attention in the NIRCam image, while dust plays the lead in the MIRI image, specifically dust that is illuminated. Peer at the circular region at the center of both images. Each contains a wobbly, asymmetrical belt of material. This is where two “bowls” that make up the nebula meet. (In this view, the nebula is at a 40-degree angle.) This belt is easier to spot in the MIRI image – look for the yellowish circle – but is also visible in the NIRCam image. The light that travels through the orange dust in the NIRCam image – which look like spotlights – disappear at longer infrared wavelengths in the MIRI image. In near-infrared light, stars have more prominent diffraction spikes because they are so bright at these wavelengths. In mid-infrared light, diffraction spikes also appear around stars, but they are fainter and smaller (zoom in to spot them). Physics is the reason for the difference in the resolution of these images. NIRCam delivers high-resolution imaging because these wavelengths of light are shorter. MIRI supplies medium-resolution imagery because its wavelengths are longer – the longer the wavelength, the coarser the images are. But both deliver an incredible amount of detail about every object they observe – providing never-before-seen vistas of the universe. For a full array of Webb’s first images and spectra, including downloadable files, please visit: https://webbtelescope.org/news/first-images NIRCam was built by a team at the University of Arizona and Lockheed Martin’s Advanced Technology Center. MIRI was contributed by ESA and NASA, with the instrument designed and built by a consortium of nationally funded European Institutes (The MIRI European Consortium) in partnership with JPL and the University of Arizona.
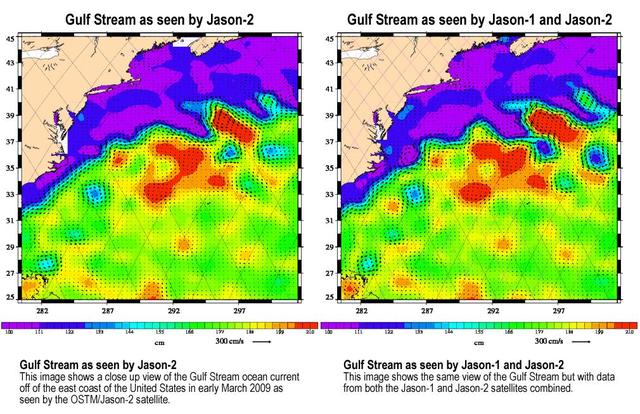
Created with altimeter data from NASA's Ocean Surface Topography Mission (OSTM)/Jason-2 satellite and the Jason-1 satellite, this image shows a portion of the Gulf Stream off the east coast of the United States. It demonstrates how much more detail is visible in the ocean surface when measured by two satellites than by one alone. The image on the left was created with data from OSTM/Jason-2. The image on the right is the same region but made with combined data from OSTM/Jason-2 and Jason-1.It shows the Gulf Stream's eddies and rings much more clearly. This image is a product of the new interleaved tandem mission of the Jason-1 and Ocean Surface Topography Mission (OSTM)/Jason-2 satellites. (The first global map from this tandem mission is available at PIA11859.) In January 2009, Jason-1 was maneuvered into orbit on the opposite side of Earth from its successor, OSTM/Jason-2 satellite. It takes 10 days for the satellites to cover the globe and return to any one place over the ocean. So, in this new tandem configuration, Jason-1 flies over the same region of the ocean that OSTM/Jason-2 flew over five days earlier. Its ground tracks fall mid-way between those of Jason-2, which are about 315 kilometers (195 miles) apart at the equator. Working together, the two spacecraft measure the surface topography of the ocean twice as often as would be possible with one satellite, and over a 10-day period, they return twice the amount of detailed measurements. Combining data from the two satellites makes it possible to map smaller, more rapidly changing features than one satellite could alone. These images show sea-level anomaly data from the first 14 days of the interleaved orbit of Jason-1 and OSTM/Jason-2, the period beginning on Feb. 20, 2009. An anomaly is a departure from a value averaged over a long period of time. Red and yellow are regions where sea levels are higher than normal. Purple and dark blue show where sea levels are lower. A higher-than-normal sea surface is usually a sign of warm waters below, while lower sea levels indicate cooler than normal temperatures. http://photojournal.jpl.nasa.gov/catalog/PIA11997

Caption: In this composite image, visible-light observations by NASA’s Hubble Space Telescope are combined with infrared data from the ground-based Large Binocular Telescope in Arizona to assemble a dramatic view of the well-known Ring Nebula. Credit: NASA, ESA, C.R. Robert O’Dell (Vanderbilt University), G.J. Ferland (University of Kentucky), W.J. Henney and M. Peimbert (National Autonomous University of Mexico) Credit for Large Binocular Telescope data: David Thompson (University of Arizona) ---- The Ring Nebula's distinctive shape makes it a popular illustration for astronomy books. But new observations by NASA's Hubble Space Telescope of the glowing gas shroud around an old, dying, sun-like star reveal a new twist. "The nebula is not like a bagel, but rather, it's like a jelly doughnut, because it's filled with material in the middle," said C. Robert O'Dell of Vanderbilt University in Nashville, Tenn. He leads a research team that used Hubble and several ground-based telescopes to obtain the best view yet of the iconic nebula. The images show a more complex structure than astronomers once thought and have allowed them to construct the most precise 3-D model of the nebula. "With Hubble's detail, we see a completely different shape than what's been thought about historically for this classic nebula," O'Dell said. "The new Hubble observations show the nebula in much clearer detail, and we see things are not as simple as we previously thought." The Ring Nebula is about 2,000 light-years from Earth and measures roughly 1 light-year across. Located in the constellation Lyra, the nebula is a popular target for amateur astronomers. Read more: <a href="http://1.usa.gov/14VAOMk" rel="nofollow">1.usa.gov/14VAOMk</a> <b><a href="http://www.nasa.gov/audience/formedia/features/MP_Photo_Guidelines.html" rel="nofollow">NASA image use policy.</a></b> <b><a href="http://www.nasa.gov/centers/goddard/home/index.html" rel="nofollow">NASA Goddard Space Flight Center</a></b> enables NASA’s mission through four scientific endeavors: Earth Science, Heliophysics, Solar System Exploration, and Astrophysics. Goddard plays a leading role in NASA’s accomplishments by contributing compelling scientific knowledge to advance the Agency’s mission. <b>Follow us on <a href="http://twitter.com/NASA_GoddardPix" rel="nofollow">Twitter</a></b> <b>Like us on <a href="http://www.facebook.com/pages/Greenbelt-MD/NASA-Goddard/395013845897?ref=tsd" rel="nofollow">Facebook</a></b> <b>Find us on <a href="http://instagram.com/nasagoddard?vm=grid" rel="nofollow">Instagram</a></b>

The Hubble Space Telescope has spotted a UFO — well, the UFO Galaxy, to be precise. NGC 2683 is a spiral galaxy seen almost edge-on, giving it the shape of a classic science fiction spaceship. This is why the astronomers at the Astronaut Memorial Planetarium and Observatory gave it this attention-grabbing nickname. While a bird’s eye view lets us see the detailed structure of a galaxy (such as this Hubble image of a barred spiral), a side-on view has its own perks. In particular, it gives astronomers a great opportunity to see the delicate dusty lanes of the spiral arms silhouetted against the golden haze of the galaxy’s core. In addition, brilliant clusters of young blue stars shine scattered throughout the disc, mapping the galaxy’s star-forming regions. Perhaps surprisingly, side-on views of galaxies like this one do not prevent astronomers from deducing their structures. Studies of the properties of the light coming from NGC 2683 suggest that this is a barred spiral galaxy, even though the angle we see it at does not let us see this directly. NGC 2683, discovered on 5 February 1788 by the famous astronomer William Herschel, lies in the Northern constellation of Lynx. A constellation named not because of its resemblance to the feline animal, but because it is fairly faint, requiring the “sensitive eyes of a cat” to discern it. And when you manage to get a look at it, you’ll find treasures like this, making it well worth the effort. This image is produced from two adjacent fields observed in visible and infrared light by Hubble’s Advanced Camera for Surveys. A narrow strip which appears slightly blurred and crosses most the image horizontally is a result of a gap between Hubble’s detectors. This strip has been patched using images from observations of the galaxy made by ground-based telescopes, which show significantly less detail. The field of view is approximately 6.5 by 3.3 arcminutes. Credit: ESA/Hubble & NASA <b><a href="http://www.nasa.gov/audience/formedia/features/MP_Photo_Guidelines.html" rel="nofollow">NASA image use policy.</a></b> <b><a href="http://www.nasa.gov/centers/goddard/home/index.html" rel="nofollow">NASA Goddard Space Flight Center</a></b> enables NASA’s mission through four scientific endeavors: Earth Science, Heliophysics, Solar System Exploration, and Astrophysics. Goddard plays a leading role in NASA’s accomplishments by contributing compelling scientific knowledge to advance the Agency’s mission. <b>Follow us on <a href="http://twitter.com/NASA_GoddardPix" rel="nofollow">Twitter</a></b> <b>Like us on <a href="http://www.facebook.com/pages/Greenbelt-MD/NASA-Goddard/395013845897?ref=tsd" rel="nofollow">Facebook</a></b> <b>Find us on <a href="http://instagrid.me/nasagoddard/?vm=grid" rel="nofollow">Instagram</a></b>
First quarter. Visible high in the southern sky in early evening. NASA's Lunar Reconnaissance Orbiter (LRO) has been in orbit around the Moon since the summer of 2009. Its laser altimeter (LOLA) and camera (LROC) are recording the rugged, airless lunar terrain in exceptional detail, making it possible to visualize the Moon with unprecedented fidelity. This is especially evident in the long shadows cast near the terminator, or day-night line. The pummeled, craggy landscape thrown into high relief at the terminator would be impossible to recreate in the computer without global terrain maps like those from LRO. To download, learn more about this visualization, or to see what the Moon will look like at any hour in 2015, visit <a href="http://svs.gsfc.nasa.gov/goto?4236" rel="nofollow">svs.gsfc.nasa.gov/goto?4236</a> <b><a href="http://www.nasa.gov/audience/formedia/features/MP_Photo_Guidelines.html" rel="nofollow">NASA image use policy.</a></b> <b><a href="http://www.nasa.gov/centers/goddard/home/index.html" rel="nofollow">NASA Goddard Space Flight Center</a></b> enables NASA’s mission through four scientific endeavors: Earth Science, Heliophysics, Solar System Exploration, and Astrophysics. Goddard plays a leading role in NASA’s accomplishments by contributing compelling scientific knowledge to advance the Agency’s mission. <b>Follow us on <a href="http://twitter.com/NASAGoddardPix" rel="nofollow">Twitter</a></b> <b>Like us on <a href="http://www.facebook.com/pages/Greenbelt-MD/NASA-Goddard/395013845897?ref=tsd" rel="nofollow">Facebook</a></b> <b>Find us on <a href="http://instagram.com/nasagoddard?vm=grid" rel="nofollow">Instagram</a></b>
ISS038-E-039032 (30 Jan. 2014) --- Prince Albert, South Africa is featured in this image photographed by an Expedition 38 crew member on the International Space Station. Space station crews sometimes take detailed images with an 800mm lens, such as this view of the small town of Prince Albert (population just more than 7,000). The town lies at the foot of the mountains known as the Great Swartberg in southern South Africa, about 220 miles (355 kilometers) east of Cape Town. Prince Albert, named after Queen Victoria's husband, appears as a cluster of whitewashed buildings (left) at the foot of the mountains, larger dwellings nearer the steep mountain front and smaller dwellings further away. Despite its small size, the dry climate and the water supply from gorges immediately upstream (a small reservoir appears extreme left) have made it well-known as a productive point in the Karroo semidesert. Olive groves especially, with other crops, flourish on the valleys floors, surrounded by sheep and ostrich ranches. Founded 250 years ago, this small town retains more than a dozen registered historic buildings in the Victorian and Cape Dutch styles. Based on this and other small Karroo towns as get-aways from South Africa's large, crowded cities, tourism has developed significantly in the last 20 years. Swartberg means Black Mountain in Afrikaans, and winter snow (not visible in this image) along the mountain tops (4,500-6,500 feet; 1,370-1,980 meters, above the town) makes for spectacular scenery. The mountains are part of the ancient Cape Fold Mountain Belt. Gorges through the mountains provide impressive side-on views of tightly folded and broken rock layers associated with the mountain-building episode.
At first glance this NASA/ESA Hubble Space Telescope image seems to show an array of different cosmic objects, but the speckling of stars shown here actually forms a single body — a nearby dwarf galaxy known as Leo A. Its few million stars are so sparsely distributed that some distant background galaxies are visible through it. Leo A itself is at a distance of about 2.5 million light-years from Earth and a member of the Local Group of galaxies; a group that includes the Milky Way and the well-known Andromeda galaxy. Astronomers study dwarf galaxies because they are very numerous and are simpler in structure than their giant cousins. However, their small size makes them difficult to study at great distances. As a result, the dwarf galaxies of the Local Group are of particular interest, as they are close enough to study in detail. As it turns out, Leo A is a rather unusual galaxy. It is one of the most isolated galaxies in the Local Group, has no obvious structural features beyond being a roughly spherical mass of stars, and shows no evidence for recent interactions with any of its few neighbours. However, the galaxy’s contents are overwhelmingly dominated by relatively young stars, something that would normally be the result of a recent interaction with another galaxy. Around 90% of the stars in Leo A are less than eight billion years old — young in cosmic terms! This raises a number of intriguing questions about why star formation in Leo A did not take place on the “usual” timescale, but instead waited until it was good and ready.

ISS012-E-09567 (28 Nov. 2005) --- Houston Ship Channel, Texas is featured in this image photographed by an Expedition 12 crewmember on the International Space Station. This view depicts the San Jacinto River portion of the Houston Ship Channel, one of the United States' busiest sea ports. The Channel provides a conduit between the continental interior and the Gulf of Mexico for both petrochemical products and Midwestern grain. The original watercourse for the Channel, Buffalo Bayou, has its headwaters 30 miles to the west of the city of Houston and has been used to move goods to the sea since at least 1836. Wakes of ships traveling along the channel are visible to the south of the Goat Islands (bright oblong islands at top center of image). The close proximity to Texas oilfields led to the establishment of numerous petrochemical refineries along the waterway, such as the Exxon Mobil Baytown installation on the eastern bank of the San Jacinto River. While much of the Ship Channel is associated with heavy industry, two icons of Texas history are also located along its length. A close search of the photo's details reveals both the battleship U.S.S. Texas and the neighboring San Jacinto Monument. The Texas saw service during both World Wars, and is the last remaining example of a dreadnought-class battleship in existence. The nearby San Jacinto Monument commemorates the 1836 battle in which Texas won its independence from Mexico. The monument itself is a 570 feet (173 meters) high shaft topped by a 34 feet (10 meters) high star, making it 15 feet (5 meters) higher than the Washington Monument in Washington, D.C. The Houston Ship Channel has been periodically widened and deepened to accommodate ever-larger ships, and is currently 530 feet (161 meters) wide by 45 feet (14 meters) deep by 50 miles (80 kilometers) long. The islands in the ship channel are part of the ongoing channel widening and deepening project--created by dredge spoils, salt marshes and bird islands are part of the Houston Port Authority's beneficial use and environmental mitigation responsibilities.

At first glance, this NASA/ESA Hubble Space Telescope image seems to show an array of different cosmic objects, but the speckling of stars shown here actually forms a single body — a nearby dwarf galaxy known as Leo A. Its few million stars are so sparsely distributed that some distant background galaxies are visible through it. Leo A itself is at a distance of about 2.5 million light-years from Earth and a member of the Local Group of galaxies; a group that includes the Milky Way and the well-known Andromeda galaxy. Astronomers study dwarf galaxies because they are very numerous and are simpler in structure than their giant cousins. However, their small size makes them difficult to study at great distances. As a result, the dwarf galaxies of the Local Group are of particular interest, as they are close enough to study in detail. As it turns out, Leo A is a rather unusual galaxy. It is one of the most isolated galaxies in the Local Group, has no obvious structural features beyond being a roughly spherical mass of stars, and shows no evidence for recent interactions with any of its few neighbors. However, the galaxy’s contents are overwhelmingly dominated by relatively young stars, something that would normally be the result of a recent interaction with another galaxy. Around 90% of the stars in Leo A are less than eight billion years old — young in cosmic terms! This raises a number of intriguing questions about why star formation in Leo A did not take place on the “usual” timescale, but instead waited until it was good and ready. Image credit: ESA/Hubble & NASA; Acknowledgment: Judy Schmidt
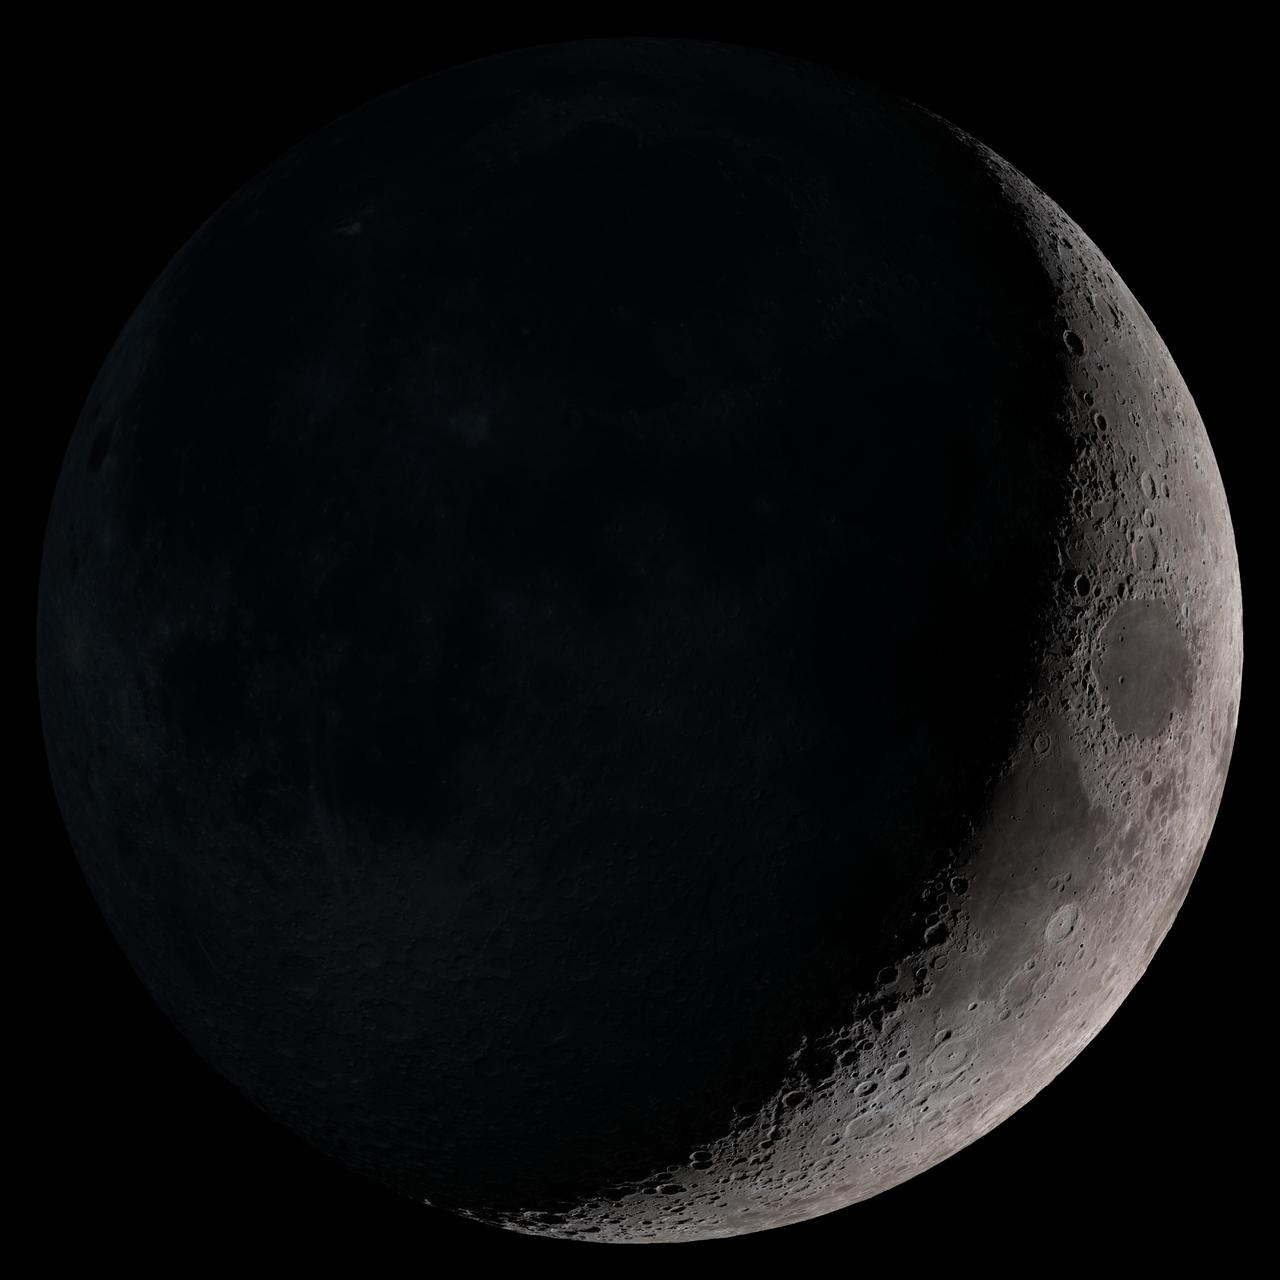
New Moon. By the modern definition, New Moon occurs when the Moon and Sun are at the same geocentric ecliptic longitude. The part of the Moon facing us is completely in shadow then. Pictured here is the traditional New Moon, the earliest visible waxing crescent, which signals the start of a new month in many lunar and lunisolar calendars. NASA's Lunar Reconnaissance Orbiter (LRO) has been in orbit around the Moon since the summer of 2009. Its laser altimeter (LOLA) and camera (LROC) are recording the rugged, airless lunar terrain in exceptional detail, making it possible to visualize the Moon with unprecedented fidelity. This is especially evident in the long shadows cast near the terminator, or day-night line. The pummeled, craggy landscape thrown into high relief at the terminator would be impossible to recreate in the computer without global terrain maps like those from LRO. To download, learn more about this visualization, or to see what the Moon will look like at any hour in 2015, visit <a href="http://svs.gsfc.nasa.gov/goto?4236" rel="nofollow">svs.gsfc.nasa.gov/goto?4236</a> <b><a href="http://www.nasa.gov/audience/formedia/features/MP_Photo_Guidelines.html" rel="nofollow">NASA image use policy.</a></b> <b><a href="http://www.nasa.gov/centers/goddard/home/index.html" rel="nofollow">NASA Goddard Space Flight Center</a></b> enables NASA’s mission through four scientific endeavors: Earth Science, Heliophysics, Solar System Exploration, and Astrophysics. Goddard plays a leading role in NASA’s accomplishments by contributing compelling scientific knowledge to advance the Agency’s mission. <b>Follow us on <a href="http://twitter.com/NASAGoddardPix" rel="nofollow">Twitter</a></b> <b>Like us on <a href="http://www.facebook.com/pages/Greenbelt-MD/NASA-Goddard/395013845897?ref=tsd" rel="nofollow">Facebook</a></b> <b>Find us on <a href="http://instagram.com/nasagoddard?vm=grid" rel="nofollow">Instagram</a></b>
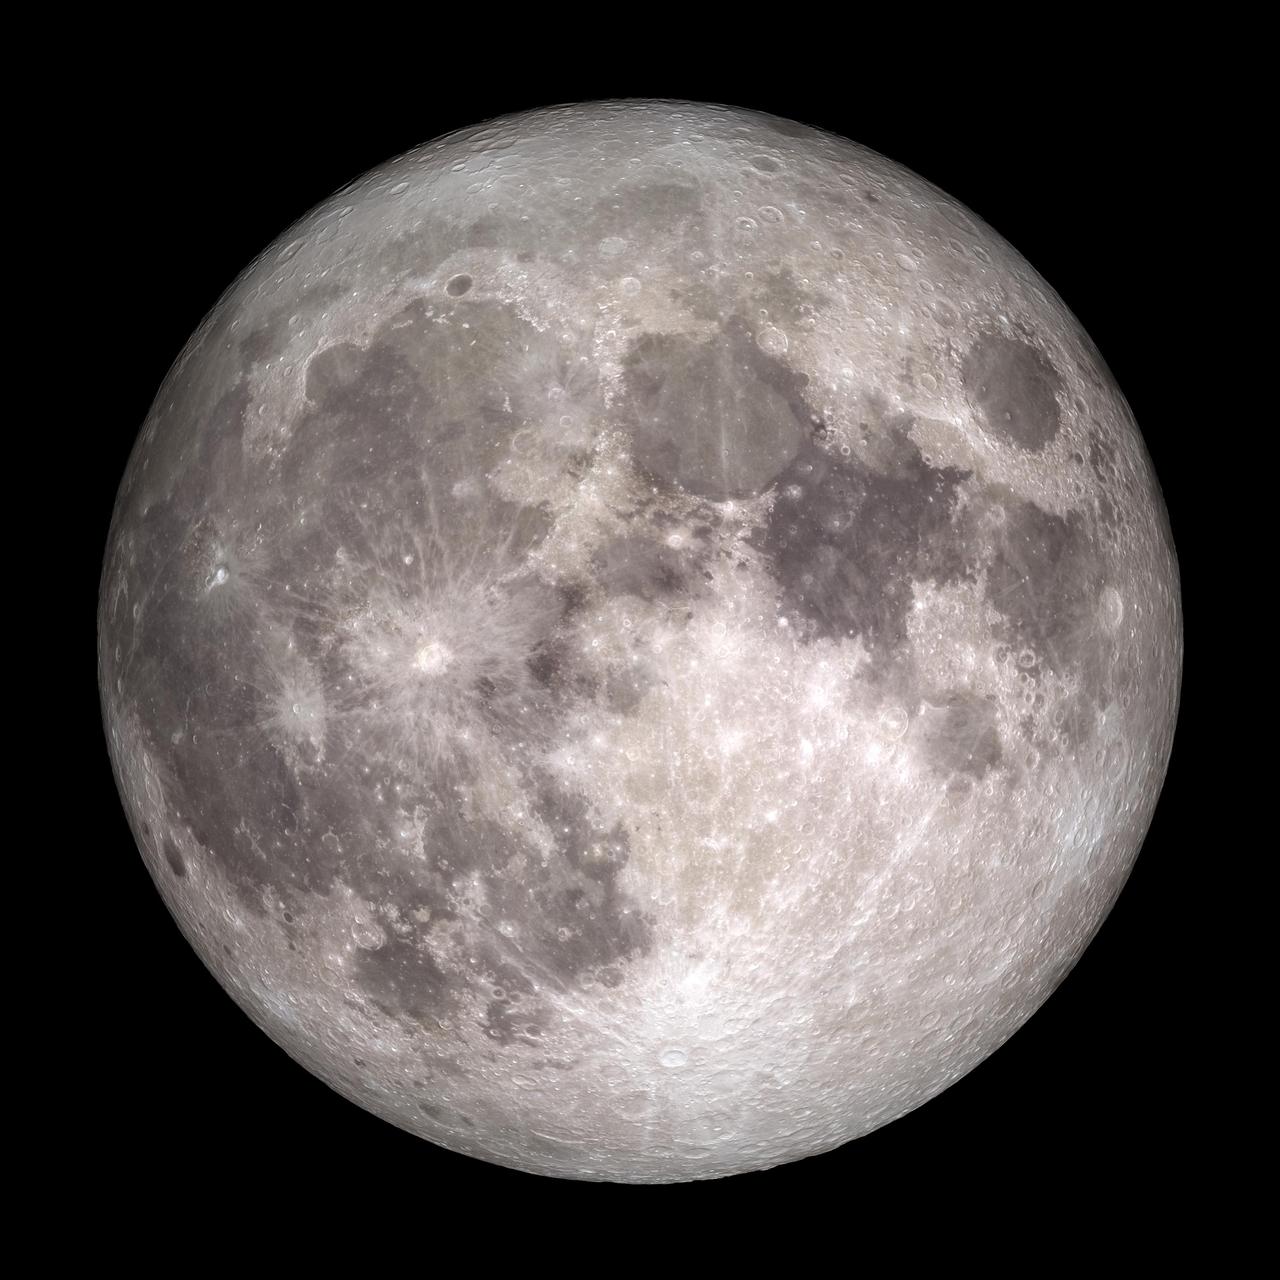
Full Moon. Rises at sunset, high in the sky around midnight. Visible all night. NASA's Lunar Reconnaissance Orbiter (LRO) has been in orbit around the Moon since the summer of 2009. Its laser altimeter (LOLA) and camera (LROC) are recording the rugged, airless lunar terrain in exceptional detail, making it possible to visualize the Moon with unprecedented fidelity. This is especially evident in the long shadows cast near the terminator, or day-night line. The pummeled, craggy landscape thrown into high relief at the terminator would be impossible to recreate in the computer without global terrain maps like those from LRO. To download, learn more about this visualization, or to see what the Moon will look like at any hour in 2015, visit <a href="http://svs.gsfc.nasa.gov/goto?4236" rel="nofollow">svs.gsfc.nasa.gov/goto?4236</a> <b><a href="http://www.nasa.gov/audience/formedia/features/MP_Photo_Guidelines.html" rel="nofollow">NASA image use policy.</a></b> <b><a href="http://www.nasa.gov/centers/goddard/home/index.html" rel="nofollow">NASA Goddard Space Flight Center</a></b> enables NASA’s mission through four scientific endeavors: Earth Science, Heliophysics, Solar System Exploration, and Astrophysics. Goddard plays a leading role in NASA’s accomplishments by contributing compelling scientific knowledge to advance the Agency’s mission. <b>Follow us on <a href="http://twitter.com/NASAGoddardPix" rel="nofollow">Twitter</a></b> <b>Like us on <a href="http://www.facebook.com/pages/Greenbelt-MD/NASA-Goddard/395013845897?ref=tsd" rel="nofollow">Facebook</a></b> <b>Find us on <a href="http://instagram.com/nasagoddard?vm=grid" rel="nofollow">Instagram</a></b>
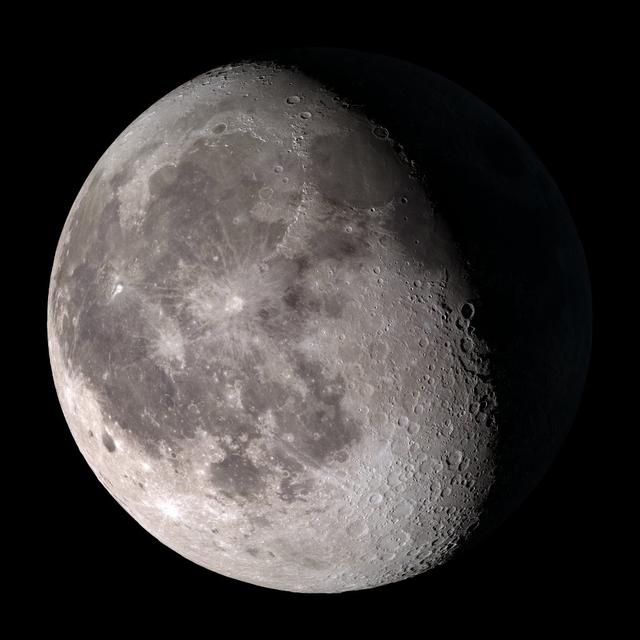
Waning gibbous. Rises after sunset, high in the sky after midnight, visible to the southwest after sunrise. NASA's Lunar Reconnaissance Orbiter (LRO) has been in orbit around the Moon since the summer of 2009. Its laser altimeter (LOLA) and camera (LROC) are recording the rugged, airless lunar terrain in exceptional detail, making it possible to visualize the Moon with unprecedented fidelity. This is especially evident in the long shadows cast near the terminator, or day-night line. The pummeled, craggy landscape thrown into high relief at the terminator would be impossible to recreate in the computer without global terrain maps like those from LRO. To download, learn more about this visualization, or to see what the Moon will look like at any hour in 2015, visit <a href="http://svs.gsfc.nasa.gov/goto?4236" rel="nofollow">svs.gsfc.nasa.gov/goto?4236</a> <b><a href="http://www.nasa.gov/audience/formedia/features/MP_Photo_Guidelines.html" rel="nofollow">NASA image use policy.</a></b> <b><a href="http://www.nasa.gov/centers/goddard/home/index.html" rel="nofollow">NASA Goddard Space Flight Center</a></b> enables NASA’s mission through four scientific endeavors: Earth Science, Heliophysics, Solar System Exploration, and Astrophysics. Goddard plays a leading role in NASA’s accomplishments by contributing compelling scientific knowledge to advance the Agency’s mission. <b>Follow us on <a href="http://twitter.com/NASAGoddardPix" rel="nofollow">Twitter</a></b> <b>Like us on <a href="http://www.facebook.com/pages/Greenbelt-MD/NASA-Goddard/395013845897?ref=tsd" rel="nofollow">Facebook</a></b> <b>Find us on <a href="http://instagram.com/nasagoddard?vm=grid" rel="nofollow">Instagram</a></b>
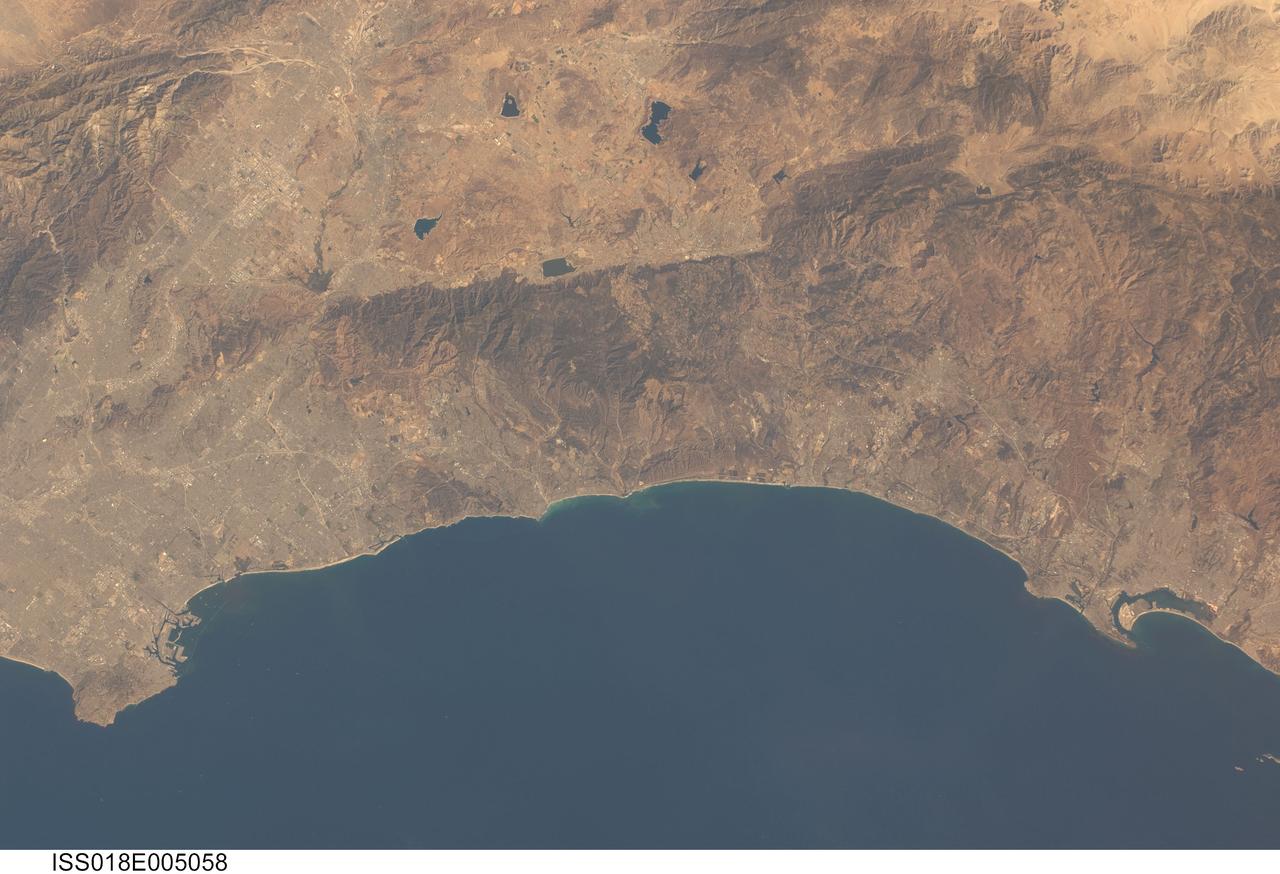
ISS018-E-005058 (24 Oct. 2008) --- Southern California's coastline, from southern Los Angeles to Tijuana in Mexico, a distance of about 225 kilometers, is featured in this image photographed by an Expedition 18 crewmember on the International Space Station. Port facilities of Los Angeles Harbor give much detail to the coastline at the north end and arcuate San Diego Bay is highly recognizable at the south end (right bottom). The image includes much of one of the most densely populated parts of the USA, with approximately 20 million people within the parts of five counties shown here. The dense urban areas appear gray, with the largest conurbation in the north of the view, in the region Long Beach--Los Angeles--San Bernardino. A smaller zone appears around San Diego--Tijuana in the south. Major highways with their associated strip development snake through these dense urban areas. The geography and geomorphology of Southern California is defined by long linear features that are surface traces of large transform faults. These faults, including the Elsinore fault and San Jacinto fault seen here, are generally considered part of the San Andreas system, and make up the broad zone comprising the tectonic plate boundary between North America to the east and the Pacific plate to the west. The Elsinore fault marks the steep eastern scarp of the Santa Ana Mountains, as well as the precipitation boundary between the wetter mountains and the drier deserts to the east. The rainfall difference is reflected in the darker appearance (more vegetation) of the mountains and coastal regions. Inland of the mountains, climates are far drier, and the natural vegetation is scrubby and much less dense which allows brown and yellow soils to show through. However, the entire region is arid; water management is a critical issue for the large urban areas of the state. Several reservoirs that are visible east of the Santa Ana Mountains provide water for both cities and agriculture in southern California.
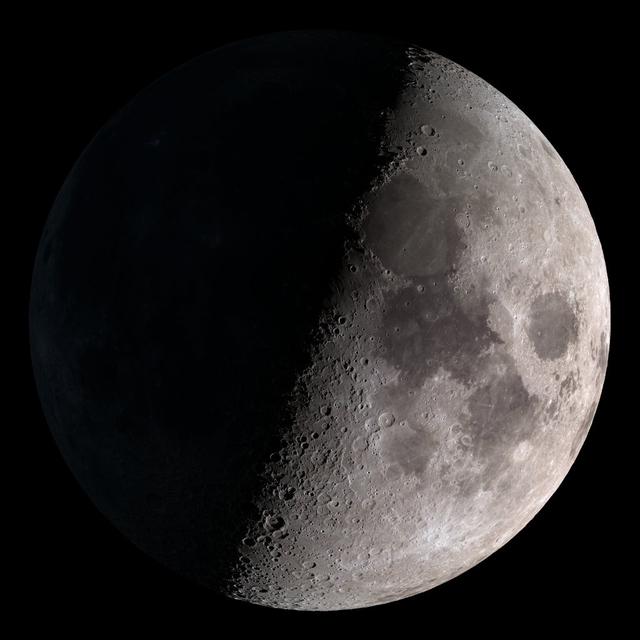
Waxing crescent. Visible toward the southwest in early evening. NASA's Lunar Reconnaissance Orbiter (LRO) has been in orbit around the Moon since the summer of 2009. Its laser altimeter (LOLA) and camera (LROC) are recording the rugged, airless lunar terrain in exceptional detail, making it possible to visualize the Moon with unprecedented fidelity. This is especially evident in the long shadows cast near the terminator, or day-night line. The pummeled, craggy landscape thrown into high relief at the terminator would be impossible to recreate in the computer without global terrain maps like those from LRO. To download, learn more about this visualization, or to see what the Moon will look like at any hour in 2015, visit <a href="http://svs.gsfc.nasa.gov/goto?4236" rel="nofollow">svs.gsfc.nasa.gov/goto?4236</a> <b><a href="http://www.nasa.gov/audience/formedia/features/MP_Photo_Guidelines.html" rel="nofollow">NASA image use policy.</a></b> <b><a href="http://www.nasa.gov/centers/goddard/home/index.html" rel="nofollow">NASA Goddard Space Flight Center</a></b> enables NASA’s mission through four scientific endeavors: Earth Science, Heliophysics, Solar System Exploration, and Astrophysics. Goddard plays a leading role in NASA’s accomplishments by contributing compelling scientific knowledge to advance the Agency’s mission. <b>Follow us on <a href="http://twitter.com/NASAGoddardPix" rel="nofollow">Twitter</a></b> <b>Like us on <a href="http://www.facebook.com/pages/Greenbelt-MD/NASA-Goddard/395013845897?ref=tsd" rel="nofollow">Facebook</a></b> <b>Find us on <a href="http://instagram.com/nasagoddard?vm=grid" rel="nofollow">Instagram</a></b>
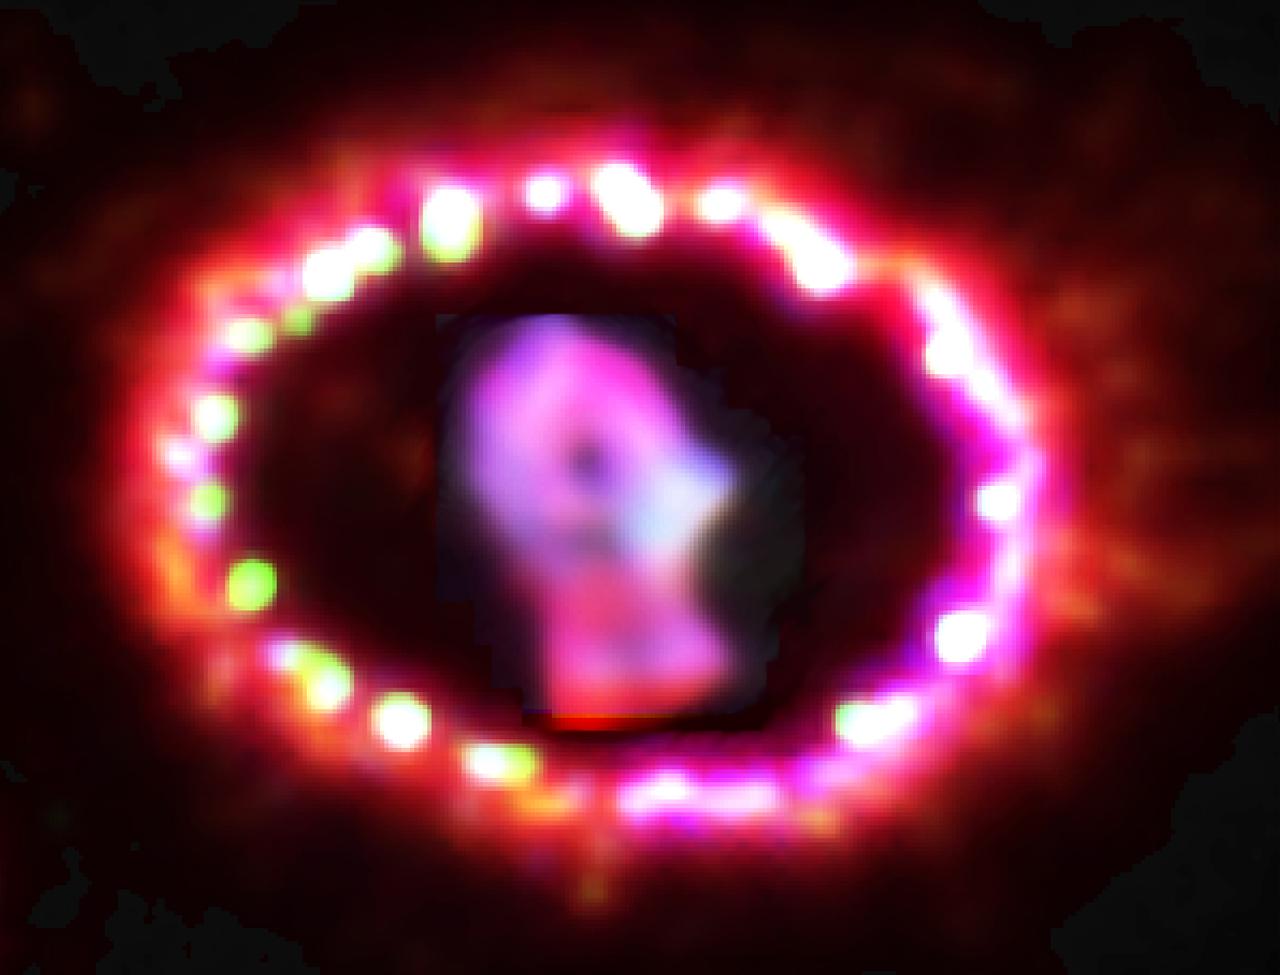
NASA image release June 10, 2011 Astronomers using NASA's Hubble Space Telescope are witnessing the unprecedented transition of a supernova to a supernova remnant, where light from an exploding star in a neighboring galaxy, the Large Magellanic Cloud, reached Earth in February 1987. Named Supernova 1987A, it was the closest supernova explosion witnessed in almost 400 years. The supernova's close proximity to Earth has allowed astronomers to study it in detail as it evolves. Now, the supernova debris, which has faded over the years, is brightening. This means that a different power source has begun to light the debris. The debris of SN 1987A is beginning to impact the surrounding ring, creating powerful shock waves that generate X-rays observed with NASA's Chandra X-ray Observatory. Those X-rays are illuminating the supernova debris and shock heating is making it glow in visible light. The results are being reported in the June 9, 2011, issue of the journal Nature by a team including Robert Kirshner of the Harvard-Smithsonian Center for Astrophysics (CfA), who leads a long-term study of SN 1987A with Hubble. Since its launch in 1990, the Hubble telescope has provided a continuous record of the changes in SN 1987A. Credit: NASA, ESA, and P. Challis (Harvard-Smithsonian Center for Astrophysics) <b><a href="http://www.nasa.gov/centers/goddard/home/index.html" rel="nofollow">NASA Goddard Space Flight Center</a></b> enables NASA’s mission through four scientific endeavors: Earth Science, Heliophysics, Solar System Exploration, and Astrophysics. Goddard plays a leading role in NASA’s accomplishments by contributing compelling scientific knowledge to advance the Agency’s mission. <b>Follow us on <a href="http://twitter.com/NASAGoddardPix" rel="nofollow">Twitter</a></b> <b>Join us on <a href="http://www.facebook.com/pages/Greenbelt-MD/NASA-Goddard/395013845897?ref=tsd" rel="nofollow">Facebook</a></b> <b>Find us on <a href="http://web.stagram.com/n/nasagoddard/?vm=grid" rel="nofollow">Instagram</a></b>

ISS025-E-008532 (5 Oct. 2010) --- Photographed by an Expedition 25 crew member on the International Space Station, this highly detailed photograph highlights the Reliant Park area of the Houston, TX “inner loop”, defined as that part of the metropolitan area located within Interstate Highway 610 that rings the downtown area. Reliant Park includes two large sports complexes visible at center, Reliant Stadium and Reliant Astrodome. Houston is the location of the NASA Johnson Space Center (out of frame) and is notable among major US metropolitan areas for its lack of formal zoning ordinances (other forms of regulation play a similar role here). This leads to highly mixed land use within the urban and suburban areas of the city. The land uses adjacent to Reliant Park include large asphalt parking areas, vacant lots with a mixture of green grass cover and brown exposed topsoil, and both single- and multi-family residential areas. A forested area (dark green, lower left) is located less than two kilometers from the parking lots of Reliant Park. This subset of a handheld digital camera image has a spatial resolution of 2-3 meters per pixel (or picture element), making it one of the highest spatial resolution images yet obtained from the space station. Such high image resolution is made possible by using lens “doublers” to increase the optical magnification of camera lenses. As important is active ISS motion compensation by experienced astronauts during photography. Motion compensation requires the astronaut to pan the camera by hand at just the right rate, keeping the object at the same point in the viewfinder. The technique involves bracing oneself against the space station bulkhead to prevent movement related to weightlessness. Early attempts produce a “smeared” image that looks out of focus. Traditional short lens photography is easier because it does not require motion compensation.
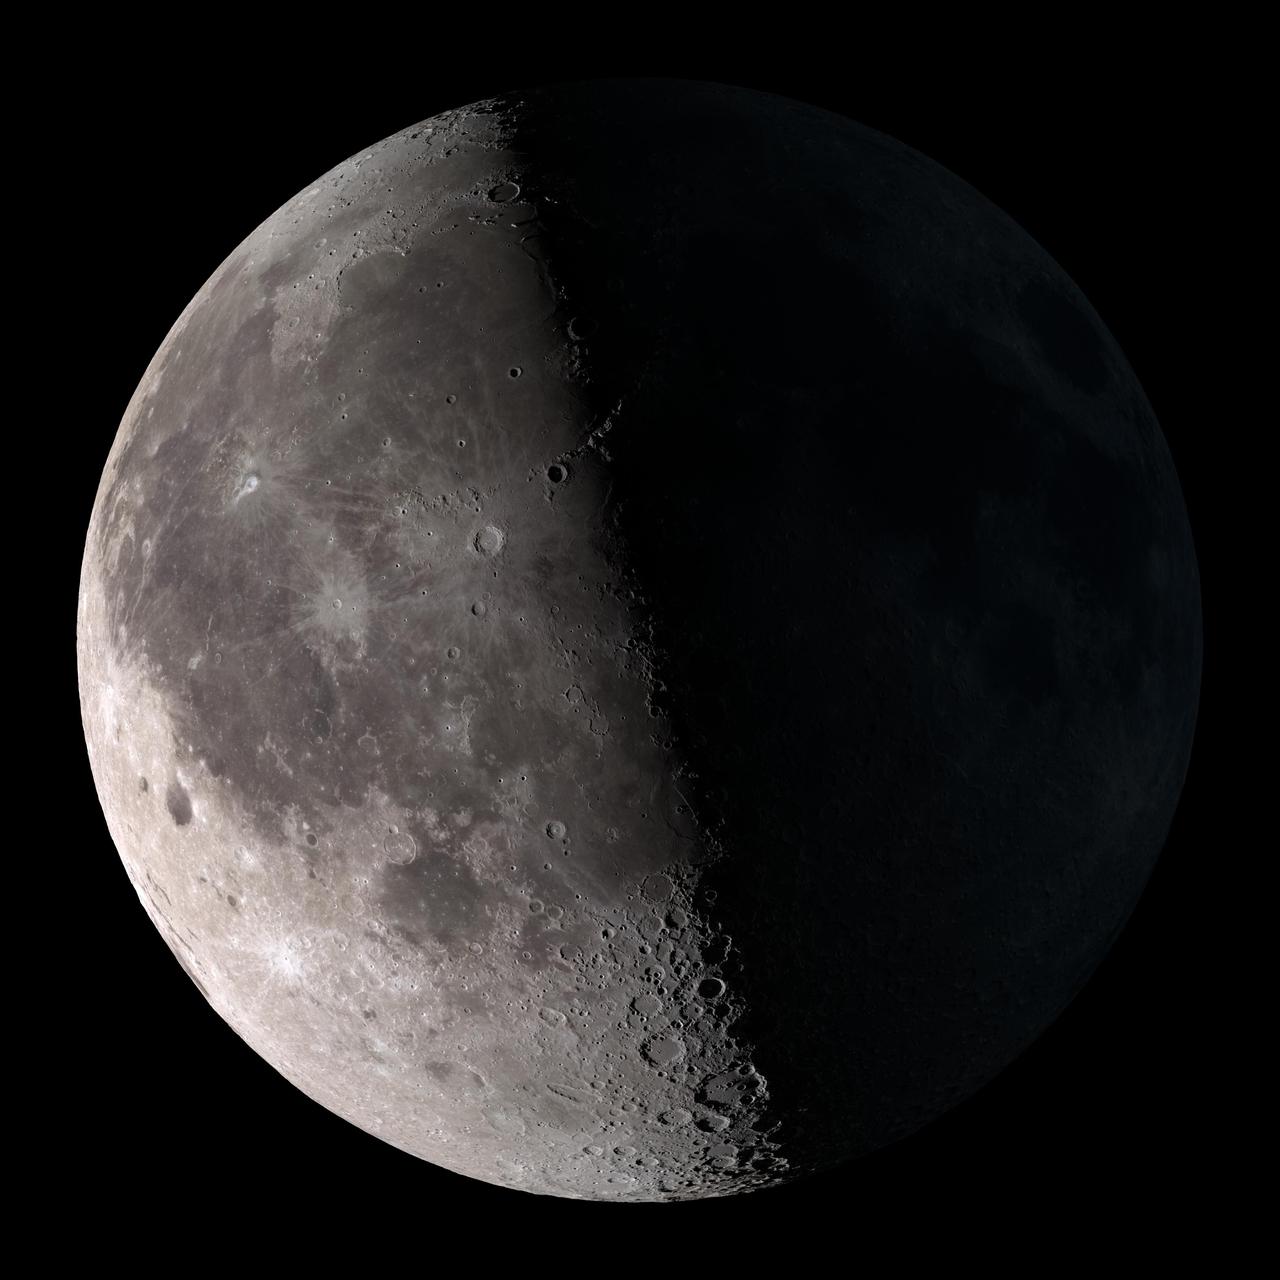
Third quarter. Rises around midnight, visible to the south after sunrise. NASA's Lunar Reconnaissance Orbiter (LRO) has been in orbit around the Moon since the summer of 2009. Its laser altimeter (LOLA) and camera (LROC) are recording the rugged, airless lunar terrain in exceptional detail, making it possible to visualize the Moon with unprecedented fidelity. This is especially evident in the long shadows cast near the terminator, or day-night line. The pummeled, craggy landscape thrown into high relief at the terminator would be impossible to recreate in the computer without global terrain maps like those from LRO. To download, learn more about this visualization, or to see what the Moon will look like at any hour in 2015, visit <a href="http://svs.gsfc.nasa.gov/goto?4236" rel="nofollow">svs.gsfc.nasa.gov/goto?4236</a> <b><a href="http://www.nasa.gov/audience/formedia/features/MP_Photo_Guidelines.html" rel="nofollow">NASA image use policy.</a></b> <b><a href="http://www.nasa.gov/centers/goddard/home/index.html" rel="nofollow">NASA Goddard Space Flight Center</a></b> enables NASA’s mission through four scientific endeavors: Earth Science, Heliophysics, Solar System Exploration, and Astrophysics. Goddard plays a leading role in NASA’s accomplishments by contributing compelling scientific knowledge to advance the Agency’s mission. <b>Follow us on <a href="http://twitter.com/NASAGoddardPix" rel="nofollow">Twitter</a></b> <b>Like us on <a href="http://www.facebook.com/pages/Greenbelt-MD/NASA-Goddard/395013845897?ref=tsd" rel="nofollow">Facebook</a></b> <b>Find us on <a href="http://instagram.com/nasagoddard?vm=grid" rel="nofollow">Instagram</a></b>
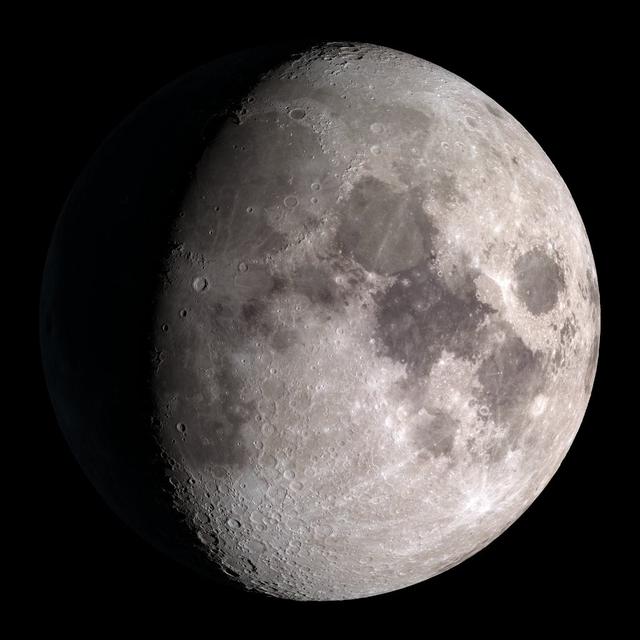
Waxing gibbous. Visible to the southeast in early evening, up for most of the night. NASA's Lunar Reconnaissance Orbiter (LRO) has been in orbit around the Moon since the summer of 2009. Its laser altimeter (LOLA) and camera (LROC) are recording the rugged, airless lunar terrain in exceptional detail, making it possible to visualize the Moon with unprecedented fidelity. This is especially evident in the long shadows cast near the terminator, or day-night line. The pummeled, craggy landscape thrown into high relief at the terminator would be impossible to recreate in the computer without global terrain maps like those from LRO. To download, learn more about this visualization, or to see what the Moon will look like at any hour in 2015, visit <a href="http://svs.gsfc.nasa.gov/goto?4236" rel="nofollow">svs.gsfc.nasa.gov/goto?4236</a> <b><a href="http://www.nasa.gov/audience/formedia/features/MP_Photo_Guidelines.html" rel="nofollow">NASA image use policy.</a></b> <b><a href="http://www.nasa.gov/centers/goddard/home/index.html" rel="nofollow">NASA Goddard Space Flight Center</a></b> enables NASA’s mission through four scientific endeavors: Earth Science, Heliophysics, Solar System Exploration, and Astrophysics. Goddard plays a leading role in NASA’s accomplishments by contributing compelling scientific knowledge to advance the Agency’s mission. <b>Follow us on <a href="http://twitter.com/NASAGoddardPix" rel="nofollow">Twitter</a></b> <b>Like us on <a href="http://www.facebook.com/pages/Greenbelt-MD/NASA-Goddard/395013845897?ref=tsd" rel="nofollow">Facebook</a></b> <b>Find us on <a href="http://instagram.com/nasagoddard?vm=grid" rel="nofollow">Instagram</a></b>
![These six infrared images of Saturn's moon Titan represent some of the clearest, most seamless-looking global views of the icy moon's surface produced so far. The views were created using 13 years of data acquired by the Visual and Infrared Mapping Spectrometer (VIMS) instrument on board NASA's Cassini spacecraft. The images are the result of a focused effort to smoothly combine data from the multitude of different observations VIMS made under a wide variety of lighting and viewing conditions over the course of Cassini's mission. Previous VIMS maps of Titan (for example, PIA02145) display great variation in imaging resolution and lighting conditions, resulting in obvious seams between different areas of the surface. With the seams now gone, this new collection of images is by far the best representation of how the globe of Titan might appear to the casual observer if it weren't for the moon's hazy atmosphere, and it likely will not be superseded for some time to come. Observing the surface of Titan in the visible region of the spectrum is difficult, due to the globe enshrouding haze that envelops the moon. This is primarily because small particles called aerosols in Titan's upper atmosphere strongly scatter visible light. But Titan's surface can be more readily imaged in a few infrared "windows" -- infrared wavelengths where scattering and absorption is much weaker. This is where the VIMS instrument excelled, parting the haze to obtain clear images of Titan's surface. (For comparison, Figure 1 shows Titan as it appears in visible light, as does PIA11603.) Making mosaics of VIMS images of Titan has always been a challenge because the data were obtained over many different flybys with different observing geometries and atmospheric conditions. One result is that very prominent seams appear in the mosaics that are quite difficult for imaging scientists to remove. But, through laborious and detailed analyses of the data, along with time consuming hand processing of the mosaics, the seams have been mostly removed. This is an update to the work previously discussed in PIA20022. Any full color image is comprised of three color channels: red, green and blue. Each of the three color channels combined to create these views was produced using a ratio between the brightness of Titan's surface at two different wavelengths (1.59/1.27 microns [red], 2.03/1.27 microns [green] and 1.27/1.08 microns [blue]). This technique (called a "band-ratio" technique) reduces the prominence of seams, as well as emphasizing subtle spectral variations in the materials on Titan's surface. For example, the moon's equatorial dune fields appear a consistent brown color here. There are also bluish and purplish areas that may have different compositions from the other bright areas, and may be enriched in water ice. For a map of Titan with latitudes, longitudes and labeled surface features, see PIA20713. It is quite clear from this unique set of images that Titan has a complex surface, sporting myriad geologic features and compositional units. The VIMS instrument has paved the way for future infrared instruments that could image Titan at much higher resolution, revealing features that were not detectable by any of Cassini's instruments. https://photojournal.jpl.nasa.gov/catalog/PIA21923](https://images-assets.nasa.gov/image/PIA21923/PIA21923~medium.jpg)
These six infrared images of Saturn's moon Titan represent some of the clearest, most seamless-looking global views of the icy moon's surface produced so far. The views were created using 13 years of data acquired by the Visual and Infrared Mapping Spectrometer (VIMS) instrument on board NASA's Cassini spacecraft. The images are the result of a focused effort to smoothly combine data from the multitude of different observations VIMS made under a wide variety of lighting and viewing conditions over the course of Cassini's mission. Previous VIMS maps of Titan (for example, PIA02145) display great variation in imaging resolution and lighting conditions, resulting in obvious seams between different areas of the surface. With the seams now gone, this new collection of images is by far the best representation of how the globe of Titan might appear to the casual observer if it weren't for the moon's hazy atmosphere, and it likely will not be superseded for some time to come. Observing the surface of Titan in the visible region of the spectrum is difficult, due to the globe enshrouding haze that envelops the moon. This is primarily because small particles called aerosols in Titan's upper atmosphere strongly scatter visible light. But Titan's surface can be more readily imaged in a few infrared "windows" -- infrared wavelengths where scattering and absorption is much weaker. This is where the VIMS instrument excelled, parting the haze to obtain clear images of Titan's surface. (For comparison, Figure 1 shows Titan as it appears in visible light, as does PIA11603.) Making mosaics of VIMS images of Titan has always been a challenge because the data were obtained over many different flybys with different observing geometries and atmospheric conditions. One result is that very prominent seams appear in the mosaics that are quite difficult for imaging scientists to remove. But, through laborious and detailed analyses of the data, along with time consuming hand processing of the mosaics, the seams have been mostly removed. This is an update to the work previously discussed in PIA20022. Any full color image is comprised of three color channels: red, green and blue. Each of the three color channels combined to create these views was produced using a ratio between the brightness of Titan's surface at two different wavelengths (1.59/1.27 microns [red], 2.03/1.27 microns [green] and 1.27/1.08 microns [blue]). This technique (called a "band-ratio" technique) reduces the prominence of seams, as well as emphasizing subtle spectral variations in the materials on Titan's surface. For example, the moon's equatorial dune fields appear a consistent brown color here. There are also bluish and purplish areas that may have different compositions from the other bright areas, and may be enriched in water ice. For a map of Titan with latitudes, longitudes and labeled surface features, see PIA20713. It is quite clear from this unique set of images that Titan has a complex surface, sporting myriad geologic features and compositional units. The VIMS instrument has paved the way for future infrared instruments that could image Titan at much higher resolution, revealing features that were not detectable by any of Cassini's instruments. https://photojournal.jpl.nasa.gov/catalog/PIA21923

NASA image release June 6, 2010 Like a July 4 fireworks display a young, glittering collection of stars looks like an aerial burst. The cluster is surrounded by clouds of interstellar gas and dust - the raw material for new star formation. The nebula, located 20,000 light-years away in the constellation Carina, contains a central cluster of huge, hot stars, called NGC 3603. This environment is not as peaceful as it looks. Ultraviolet radiation and violent stellar winds have blown out an enormous cavity in the gas and dust enveloping the cluster, providing an unobstructed view of the cluster. Most of the stars in the cluster were born around the same time but differ in size, mass, temperature, and color. The course of a star's life is determined by its mass, so a cluster of a given age will contain stars in various stages of their lives, giving an opportunity for detailed analyses of stellar life cycles. NGC 3603 also contains some of the most massive stars known. These huge stars live fast and die young, burning through their hydrogen fuel quickly and ultimately ending their lives in supernova explosions. Star clusters like NGC 3603 provide important clues to understanding the origin of massive star formation in the early, distant universe. Astronomers also use massive clusters to study distant starbursts that occur when galaxies collide, igniting a flurry of star formation. The proximity of NGC 3603 makes it an excellent lab for studying such distant and momentous events. This Hubble Space Telescope image was captured in August 2009 and December 2009 with the Wide Field Camera 3 in both visible and infrared light, which trace the glow of sulfur, hydrogen, and iron. The Hubble Space Telescope is a project of international cooperation between NASA and the European Space Agency. NASA’s Goddard Space Flight Center manages the telescope. The Space Telescope Science Institute (STScI) conducts Hubble science operations. STScI is operated for NASA by the Association of Universities for Research in Astronomy, Inc. in Washington, D.C. Credit: NASA, ESA, R. O'Connell (University of Virginia), F. Paresce (National Institute for Astrophysics, Bologna, Italy), E. Young (Universities Space Research Association/Ames Research Center), the WFC3 Science Oversight Committee, and the Hubble Heritage Team (STScI/AURA) <b><a href="http://www.nasa.gov/centers/goddard/home/index.html" rel="nofollow">NASA Goddard Space Flight Center</a></b> is home to the nation's largest organization of combined scientists, engineers and technologists that build spacecraft, instruments and new technology to study the Earth, the sun, our solar system, and the universe.
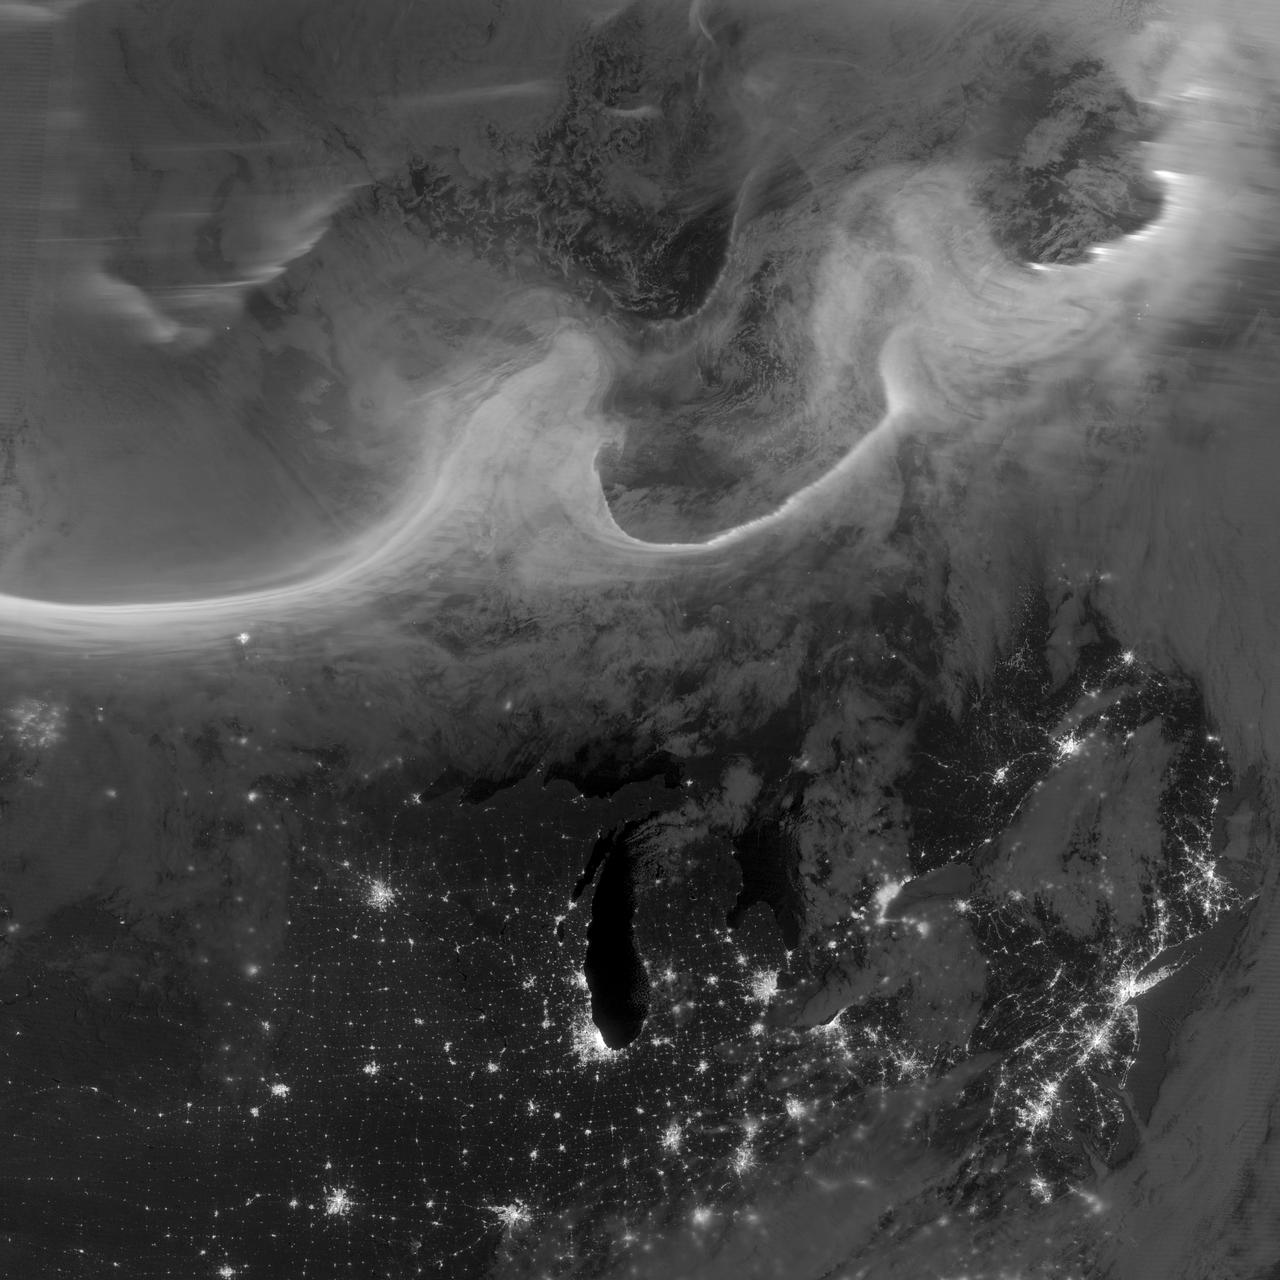
Overnight on October 4-5, 2012, a mass of energetic particles from the atmosphere of the Sun were flung out into space, a phenomenon known as a coronal mass ejection. Three days later, the storm from the Sun stirred up the magnetic field around Earth and produced gorgeous displays of northern lights. NASA satellites track such storms from their origin to their crossing of interplanetary space to their arrival in the atmosphere of Earth. Using the “day-night band” (DNB) of the Visible Infrared Imaging Radiometer Suite (VIIRS), the Suomi National Polar-orbiting Partnership (Suomi NPP) satellite acquired this view of the aurora borealis early on the morning of October 8, 2012. The northern lights stretch across Canada’s Quebec and Ontario provinces in the image, and are part of the auroral oval that expanded to middle latitudes because of a geomagnetic storm. The DNB sensor detects dim light signals such as auroras, airglow, gas flares, city lights, and reflected moonlight. In the case of the image above, the sensor detected the visible light emissions as energetic particles rained down from Earth’s magnetosphere and into the gases of the upper atmosphere. The images are similar to those collected by the Operational Linescan System flown on U.S. Defense Meteorological Satellite Program (DMSP) satellites for the past three decades. “When I first saw images like this as a graduate student, I was immediately struck by the fluid dynamic characteristics of the aurora,” said Tom Moore, a space physicist at NASA's Goddard Space Flight Center. “Viewing the aurora in this way makes it immediately clear that space weather is an interaction of fluids from the Sun with those of the Earth's upper atmosphere. The electrodynamics make for important differences between plasmas and ordinary fluids, but familiar behaviors (for example, waves and vortices) are still very apparent. It makes me wonder at the ability of apparently empty space to behave like a fluid.” Auroras typically occur when solar flares and coronal mass ejections—or even an active solar wind stream—disturb and distort the magnetosphere, the cocoon of space protected by Earth’s magnetic field. The collision of solar particles and pressure into our planet’s magnetosphere accelerates particles trapped in the space around Earth (such as in the radiation belts). Those particles are sent crashing down into Earth’s upper atmosphere—at altitudes of 100 to 400 kilometers (60 to 250 miles)—where they excite oxygen and nitrogen molecules and release photons of light. The results are rays, sheets, and curtains of dancing light in the sky. Auroras are a beautiful expression of the connection between Sun and Earth, but not all of the connections are benign. Auroras are connected to geomagnetic storms, which can distort radio communications (particularly high frequencies), disrupt electric power systems on the ground, and give slight but detectable doses of radiation to flight crews and passengers on high-latitude airplane flights and on spacecraft. The advantage of images like those from VIIRS and DMSP is resolution, according to space physicist Patrick Newell of the Johns Hopkins University Applied Physics Laboratory. “You can see very fine detail in the aurora because of the low altitude and the high resolution of the camera,” he said. Most aurora scientists prefer to use images from missions dedicated to aurora studies (such as Polar, IMAGE, and ground-based imagers), which can offer many more images of a storm (rather than one per orbit) and can allow researchers to calculate the energy moving through the atmosphere. There are no science satellites flying right now that provide such a view, though astronauts regularly photograph and film auroras from the International Space Station. NASA Earth Observatory image by Jesse Allen and Robert Simmon, using VIIRS Day-Night Band data from the Suomi National Polar-orbiting Partnership (Suomi NPP) and the University of Wisconsin's Community Satellite Processing Package. Suomi NPP is the result of a partnership between NASA, the National Oceanic and Atmospheric Administration, and the Department of Defense. Caption by Mike Carlowicz. Instrument: Suomi NPP - VIIRS Credit: <b><a href="http://www.earthobservatory.nasa.gov/" rel="nofollow"> NASA Earth Observatory</a></b> <b><a href="http://www.nasa.gov/audience/formedia/features/MP_Photo_Guidelines.html" rel="nofollow">NASA image use policy.</a></b> <b><a href="http://www.nasa.gov/centers/goddard/home/index.html" rel="nofollow">NASA Goddard Space Flight Center</a></b> enables NASA’s mission through four scientific endeavors: Earth Science, Heliophysics, Solar System Exploration, and Astrophysics. Goddard plays a leading role in NASA’s accomplishments by contributing compelling scientific knowledge to advance the Agency’s mission. <b>Follow us on <a href="http://twitter.com/NASA_GoddardPix" rel="nofollow">Twitter</a></b> <b>Like us on <a href="http://www.facebook.com/pages/Greenbelt-MD/NASA-Goddard/395013845897?ref=tsd" rel="nofollow">Facebook</a></b> <b>Find us on <a href="http://instagrid.me/nasagoddard/?vm=grid" rel="nofollow">Instagram</a></b>

Waxing gibbous. Visible to the southeast in early evening, up for most of the night. This marks the first time that accurate shadows at this level of detail are possible in such a computer simulation. The shadows are based on the global elevation map being developed from measurements by the Lunar Orbiter Laser Altimeter (LOLA) aboard the Lunar Reconnaissance Orbiter (LRO). LOLA has already taken more than 10 times as many elevation measurements as all previous missions combined. The Moon always keeps the same face to us, but not exactly the same face. Because of the tilt and shape of its orbit, we see the Moon from slightly different angles over the course of a month. When a month is compressed into 12 seconds, as it is in this animation, our changing view of the Moon makes it look like it's wobbling. This wobble is called libration. The word comes from the Latin for "balance scale" (as does the name of the zodiac constellation Libra) and refers to the way such a scale tips up and down on alternating sides. The sub-Earth point gives the amount of libration in longitude and latitude. The sub-Earth point is also the apparent center of the Moon's disk and the location on the Moon where the Earth is directly overhead. The Moon is subject to other motions as well. It appears to roll back and forth around the sub-Earth point. The roll angle is given by the position angle of the axis, which is the angle of the Moon's north pole relative to celestial north. The Moon also approaches and recedes from us, appearing to grow and shrink. The two extremes, called perigee (near) and apogee (far), differ by more than 10%. The most noticed monthly variation in the Moon's appearance is the cycle of phases, caused by the changing angle of the Sun as the Moon orbits the Earth. The cycle begins with the waxing (growing) crescent Moon visible in the west just after sunset. By first quarter, the Moon is high in the sky at sunset and sets around midnight. The full Moon rises at sunset and is high in the sky at midnight. The third quarter Moon is often surprisingly conspicuous in the daylit western sky long after sunrise. Celestial north is up in these images, corresponding to the view from the northern hemisphere. The descriptions of the print resolution stills also assume a northern hemisphere orientation. To adjust for southern hemisphere views, rotate the images 180 degrees, and substitute "north" for "south" in the descriptions. Credit: <a href="http://svs.gsfc.nasa.gov/index.html" rel="nofollow">NASA/Goddard Space Flight Center Scientific Visualization Studio</a> <b><a href="http://www.nasa.gov/centers/goddard/home/index.html" rel="nofollow">NASA Goddard Space Flight Center</a></b> enables NASA’s mission through four scientific endeavors: Earth Science, Heliophysics, Solar System Exploration, and Astrophysics. Goddard plays a leading role in NASA’s accomplishments by contributing compelling scientific knowledge to advance the Agency’s mission. <b>Follow us on <a href="http://twitter.com/NASA_GoddardPix" rel="nofollow">Twitter</a></b> <b>Join us on <a href="http://www.facebook.com/pages/Greenbelt-MD/NASA-Goddard/395013845897?ref=tsd" rel="nofollow">Facebook</a></b> <b>Find us on <a href="http://web.stagram.com/n/nasagoddard/?vm=grid" rel="nofollow">Instagram</a></b>
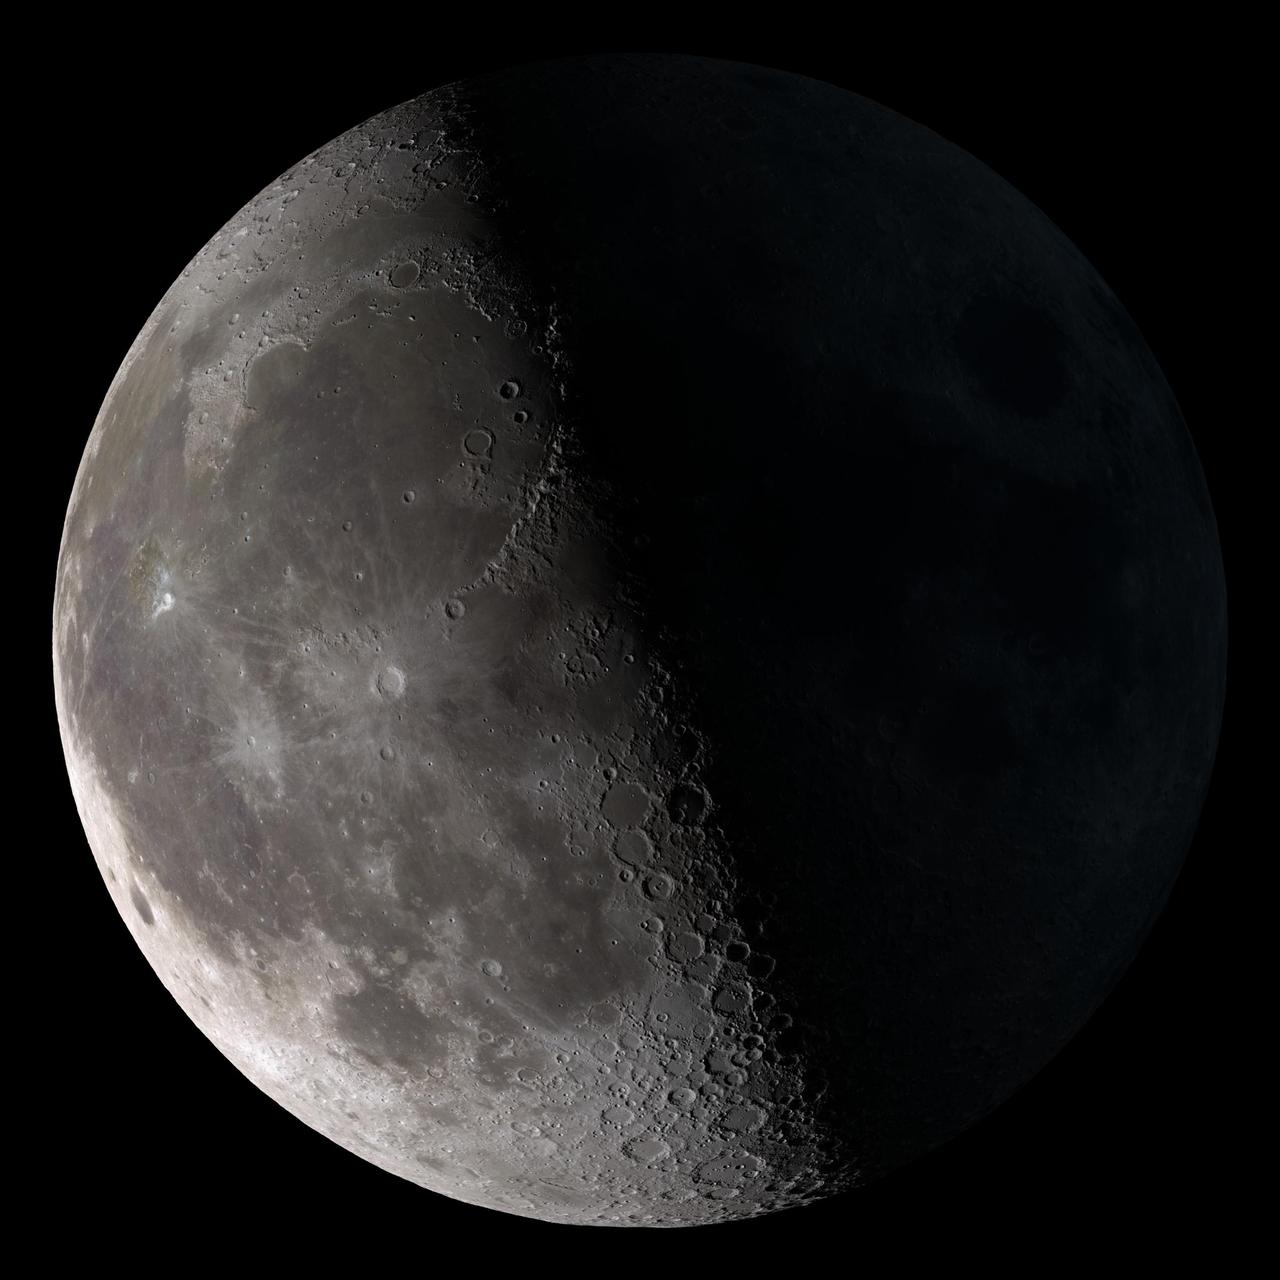
Third quarter. Rises around midnight, visible to the south after sunrise. This marks the first time that accurate shadows at this level of detail are possible in such a computer simulation. The shadows are based on the global elevation map being developed from measurements by the Lunar Orbiter Laser Altimeter (LOLA) aboard the Lunar Reconnaissance Orbiter (LRO). LOLA has already taken more than 10 times as many elevation measurements as all previous missions combined. The Moon always keeps the same face to us, but not exactly the same face. Because of the tilt and shape of its orbit, we see the Moon from slightly different angles over the course of a month. When a month is compressed into 12 seconds, as it is in this animation, our changing view of the Moon makes it look like it's wobbling. This wobble is called libration. The word comes from the Latin for "balance scale" (as does the name of the zodiac constellation Libra) and refers to the way such a scale tips up and down on alternating sides. The sub-Earth point gives the amount of libration in longitude and latitude. The sub-Earth point is also the apparent center of the Moon's disk and the location on the Moon where the Earth is directly overhead. The Moon is subject to other motions as well. It appears to roll back and forth around the sub-Earth point. The roll angle is given by the position angle of the axis, which is the angle of the Moon's north pole relative to celestial north. The Moon also approaches and recedes from us, appearing to grow and shrink. The two extremes, called perigee (near) and apogee (far), differ by more than 10%. The most noticed monthly variation in the Moon's appearance is the cycle of phases, caused by the changing angle of the Sun as the Moon orbits the Earth. The cycle begins with the waxing (growing) crescent Moon visible in the west just after sunset. By first quarter, the Moon is high in the sky at sunset and sets around midnight. The full Moon rises at sunset and is high in the sky at midnight. The third quarter Moon is often surprisingly conspicuous in the daylit western sky long after sunrise. Celestial north is up in these images, corresponding to the view from the northern hemisphere. The descriptions of the print resolution stills also assume a northern hemisphere orientation. To adjust for southern hemisphere views, rotate the images 180 degrees, and substitute "north" for "south" in the descriptions. Credit: <a href="http://svs.gsfc.nasa.gov/index.html" rel="nofollow">NASA/Goddard Space Flight Center Scientific Visualization Studio</a> <b><a href="http://www.nasa.gov/centers/goddard/home/index.html" rel="nofollow">NASA Goddard Space Flight Center</a></b> enables NASA’s mission through four scientific endeavors: Earth Science, Heliophysics, Solar System Exploration, and Astrophysics. Goddard plays a leading role in NASA’s accomplishments by contributing compelling scientific knowledge to advance the Agency’s mission. <b>Follow us on <a href="http://twitter.com/NASA_GoddardPix" rel="nofollow">Twitter</a></b> <b>Join us on <a href="http://www.facebook.com/pages/Greenbelt-MD/NASA-Goddard/395013845897?ref=tsd" rel="nofollow">Facebook</a></b> <b>Find us on <a href="http://web.stagram.com/n/nasagoddard/?vm=grid" rel="nofollow">Instagram</a></b>
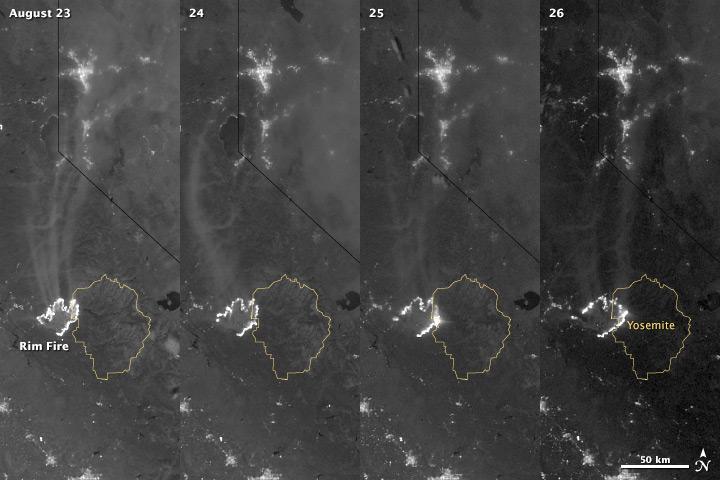
The winter of 2013 was among the driest on record for California, setting the stage for an active fire season. By August 26, the Rim Fire had made its way into the record books. At just 15 percent contained, the fire is now the 13th largest in California since records began in 1932. Apart from being large, the fire is also threatening one of the United States’ greatest natural treasures: Yosemite National Park. The Visible Infrared Imaging Radiometer Suite (VIIRS) on the Suomi NPP satellite tracked the growth of the fire between August 23 and August 26 in this series of nighttime images. The VIIRS day-night band is extremely sensitive to low light, making it possible to see the fire front from space. The brightest, most intense parts of the fire glow white, exceeding the brightness of the lights of Reno, Nevada to the north. Pale gray smoke streams north away from the fire throughout the sequence. The perimeter of the fire grows from day to day along different fronts, depending on winds and fire fighting efforts. On August 24, fire fighters focused their efforts on containing the western edge of the fire to prevent it from burning into Tuolumne City and the populated Highway 108 corridor. They also fought the eastern edge of the fire to protect Yosemite National Park. These efforts are evident in the image: Between August 23 and 24, the eastern edge of the fire held steady, and the western edge receded. The fire grew in the southeast. On the morning of August 25 fire managers reported that the fire was growing in the north and east. In the image, the most intense activity is just inside Yosemite National Park. Fire fighters reported that the Rim Fire continued to be extremely active on its eastern front on the morning of August 26, and this activity is visible in the image. By 8:00 a.m., the fire had burned 149,780 acres. The fire forced firefighters in Yosemite National Park to take measures to protect the Merced and Tuolumne Groves of Giant Sequoias, but the National Park Service reported that the trees were not in imminent danger. While parts of the park are closed, webcams show that most of the park has not been impacted. The Rim Fire started on the afternoon of August 17. It has destroyed 23 structures and threatened 4,500 other buildings. Its cause is under investigation. More details: <a href="http://1.usa.gov/18ilEAA" rel="nofollow">1.usa.gov/18ilEAA</a> NASA Earth Observatory image by Jesse Allen and Robert Simmon, using VIIRS Day Night Band data. Caption by Holli Riebeek. Instrument: Suomi NPP - VIIRS <b><a href="http://www.nasa.gov/audience/formedia/features/MP_Photo_Guidelines.html" rel="nofollow">NASA image use policy.</a></b> <b><a href="http://www.nasa.gov/centers/goddard/home/index.html" rel="nofollow">NASA Goddard Space Flight Center</a></b> enables NASA’s mission through four scientific endeavors: Earth Science, Heliophysics, Solar System Exploration, and Astrophysics. Goddard plays a leading role in NASA’s accomplishments by contributing compelling scientific knowledge to advance the Agency’s mission. <b>Follow us on <a href="http://twitter.com/NASA_GoddardPix" rel="nofollow">Twitter</a></b> <b>Like us on <a href="http://www.facebook.com/pages/Greenbelt-MD/NASA-Goddard/395013845897?ref=tsd" rel="nofollow">Facebook</a></b> <b>Find us on <a href="http://instagram.com/nasagoddard?vm=grid" rel="nofollow">Instagram</a></b>
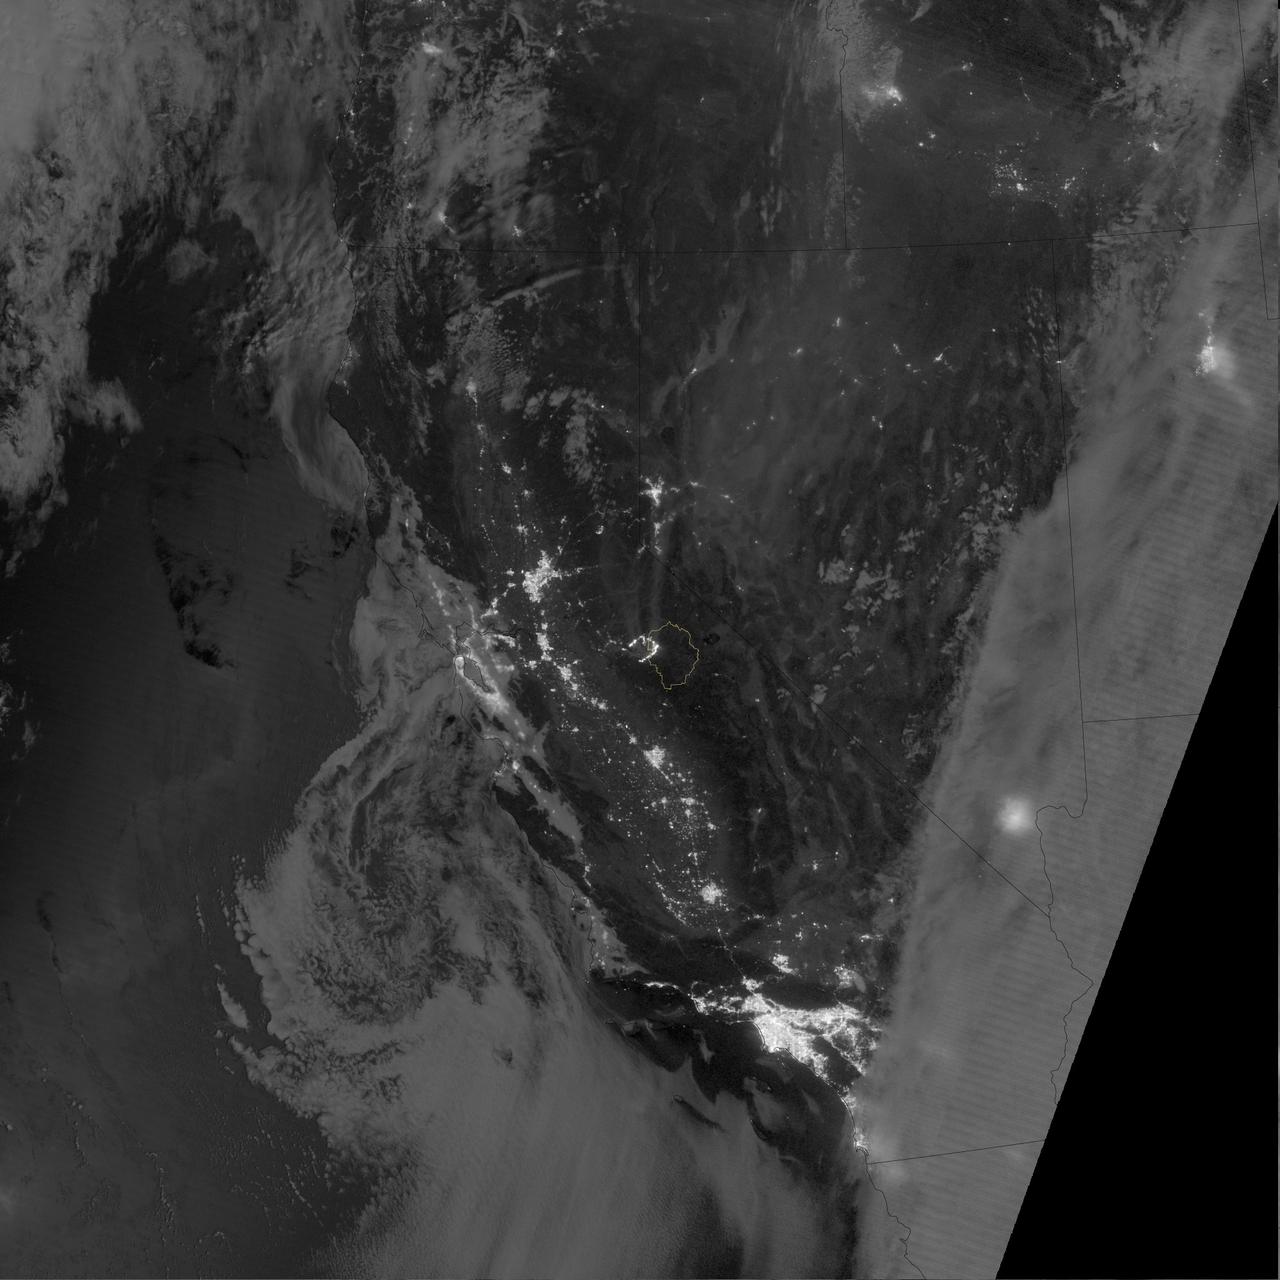
The winter of 2013 was among the driest on record for California, setting the stage for an active fire season. By August 26, the Rim Fire had made its way into the record books. At just 15 percent contained, the fire is now the 13th largest in California since records began in 1932. Apart from being large, the fire is also threatening one of the United States’ greatest natural treasures: Yosemite National Park. The Visible Infrared Imaging Radiometer Suite (VIIRS) on the Suomi NPP satellite tracked the growth of the fire between August 23 and August 26 in a series of nighttime images. The VIIRS day-night band is extremely sensitive to low light, making it possible to see the fire front from space. The brightest, most intense parts of the fire glow white, exceeding the brightness of the lights of Reno, Nevada to the north. Pale gray smoke streams north away from the fire throughout the sequence. The perimeter of the fire grows from day to day along different fronts, depending on winds and fire fighting efforts. On August 24, fire fighters focused their efforts on containing the western edge of the fire to prevent it from burning into Tuolumne City and the populated Highway 108 corridor. They also fought the eastern edge of the fire to protect Yosemite National Park. These efforts are evident in the image: Between August 23 and 24, the eastern edge of the fire held steady, and the western edge receded. The fire grew in the southeast. On the morning of August 25 fire managers reported that the fire was growing in the north and east. In the image, the most intense activity is just inside Yosemite National Park. Fire fighters reported that the Rim Fire continued to be extremely active on its eastern front on the morning of August 26, and this activity is visible in the image. By 8:00 a.m., the fire had burned 149,780 acres. The fire forced firefighters in Yosemite National Park to take measures to protect the Merced and Tuolumne Groves of Giant Sequoias, but the National Park Service reported that the trees were not in imminent danger. While parts of the park are closed, webcams show that most of the park has not been impacted. The Rim Fire started on the afternoon of August 17. It has destroyed 23 structures and threatened 4,500 other buildings. Its cause is under investigation. More details: <a href="http://1.usa.gov/18ilEAA" rel="nofollow">1.usa.gov/18ilEAA</a> NASA Earth Observatory image by Jesse Allen and Robert Simmon, using VIIRS Day Night Band data. Caption by Holli Riebeek. Instrument: Suomi NPP - VIIRS <b><a href="http://www.nasa.gov/audience/formedia/features/MP_Photo_Guidelines.html" rel="nofollow">NASA image use policy.</a></b> <b><a href="http://www.nasa.gov/centers/goddard/home/index.html" rel="nofollow">NASA Goddard Space Flight Center</a></b> enables NASA’s mission through four scientific endeavors: Earth Science, Heliophysics, Solar System Exploration, and Astrophysics. Goddard plays a leading role in NASA’s accomplishments by contributing compelling scientific knowledge to advance the Agency’s mission. <b>Follow us on <a href="http://twitter.com/NASA_GoddardPix" rel="nofollow">Twitter</a></b> <b>Like us on <a href="http://www.facebook.com/pages/Greenbelt-MD/NASA-Goddard/395013845897?ref=tsd" rel="nofollow">Facebook</a></b> <b>Find us on <a href="http://instagram.com/nasagoddard?vm=grid" rel="nofollow">Instagram</a></b>
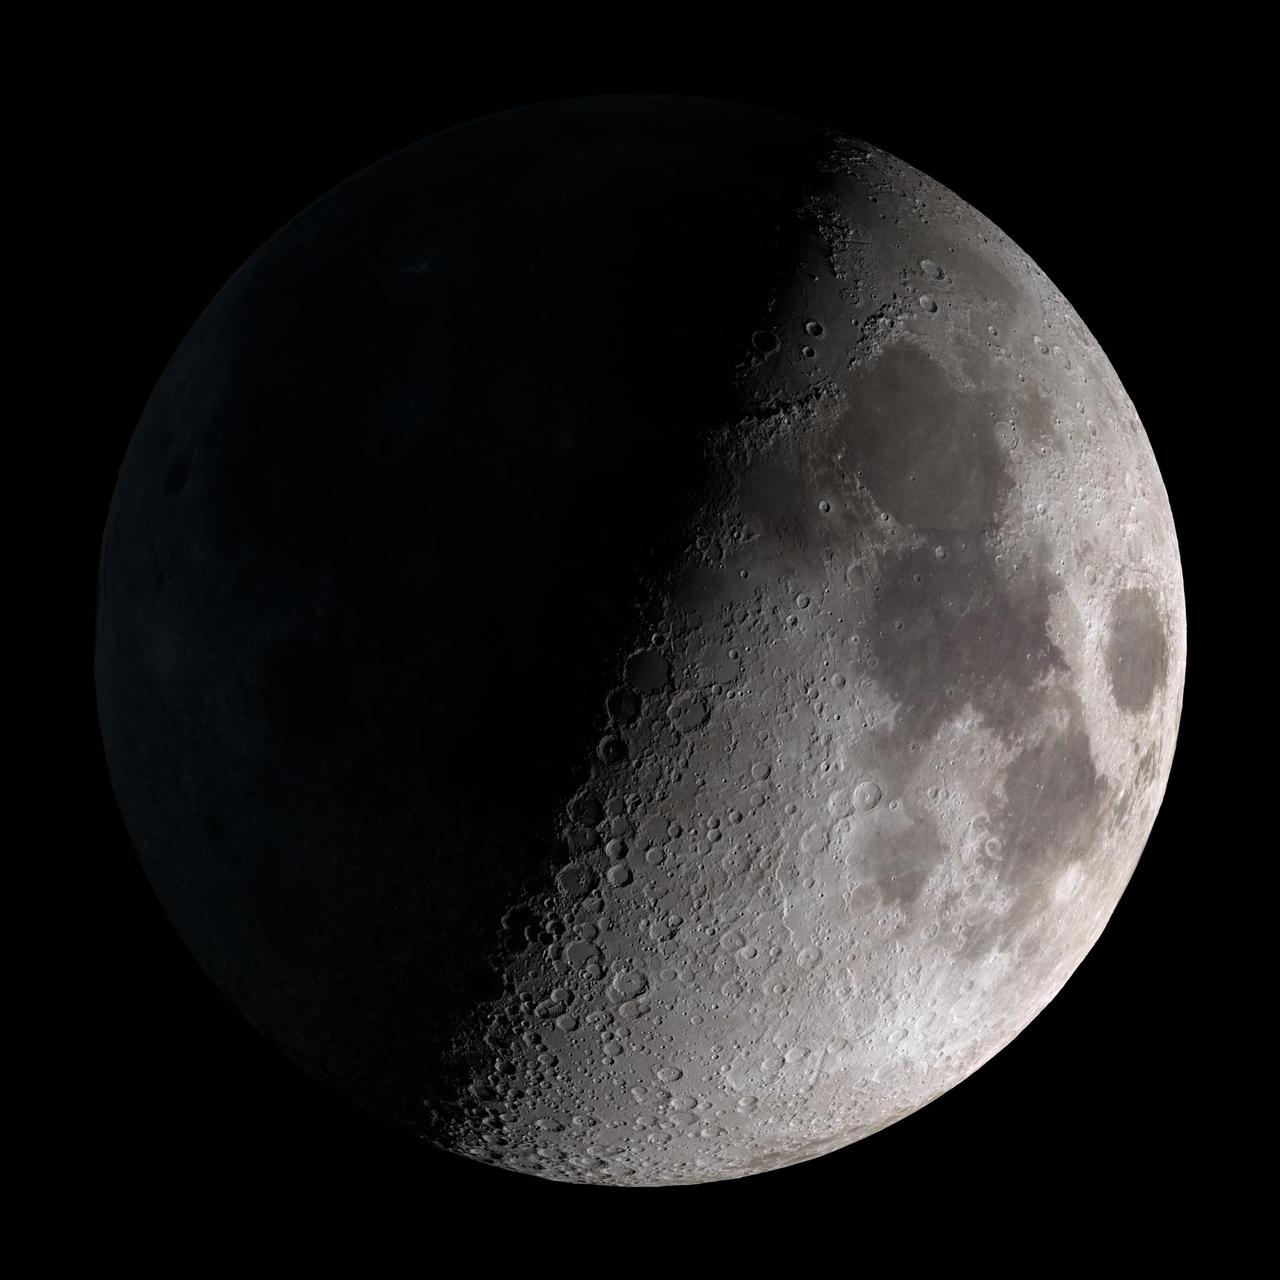
First quarter. Visible high in the southern sky in early evening. This marks the first time that accurate shadows at this level of detail are possible in such a computer simulation. The shadows are based on the global elevation map being developed from measurements by the Lunar Orbiter Laser Altimeter (LOLA) aboard the Lunar Reconnaissance Orbiter (LRO). LOLA has already taken more than 10 times as many elevation measurements as all previous missions combined. The Moon always keeps the same face to us, but not exactly the same face. Because of the tilt and shape of its orbit, we see the Moon from slightly different angles over the course of a month. When a month is compressed into 12 seconds, as it is in this animation, our changing view of the Moon makes it look like it's wobbling. This wobble is called libration. The word comes from the Latin for "balance scale" (as does the name of the zodiac constellation Libra) and refers to the way such a scale tips up and down on alternating sides. The sub-Earth point gives the amount of libration in longitude and latitude. The sub-Earth point is also the apparent center of the Moon's disk and the location on the Moon where the Earth is directly overhead. The Moon is subject to other motions as well. It appears to roll back and forth around the sub-Earth point. The roll angle is given by the position angle of the axis, which is the angle of the Moon's north pole relative to celestial north. The Moon also approaches and recedes from us, appearing to grow and shrink. The two extremes, called perigee (near) and apogee (far), differ by more than 10%. The most noticed monthly variation in the Moon's appearance is the cycle of phases, caused by the changing angle of the Sun as the Moon orbits the Earth. The cycle begins with the waxing (growing) crescent Moon visible in the west just after sunset. By first quarter, the Moon is high in the sky at sunset and sets around midnight. The full Moon rises at sunset and is high in the sky at midnight. The third quarter Moon is often surprisingly conspicuous in the daylit western sky long after sunrise. Celestial north is up in these images, corresponding to the view from the northern hemisphere. The descriptions of the print resolution stills also assume a northern hemisphere orientation. To adjust for southern hemisphere views, rotate the images 180 degrees, and substitute "north" for "south" in the descriptions. Credit: <a href="http://svs.gsfc.nasa.gov/index.html" rel="nofollow">NASA/Goddard Space Flight Center Scientific Visualization Studio</a> <b><a href="http://www.nasa.gov/centers/goddard/home/index.html" rel="nofollow">NASA Goddard Space Flight Center</a></b> enables NASA’s mission through four scientific endeavors: Earth Science, Heliophysics, Solar System Exploration, and Astrophysics. Goddard plays a leading role in NASA’s accomplishments by contributing compelling scientific knowledge to advance the Agency’s mission. <b>Follow us on <a href="http://twitter.com/NASA_GoddardPix" rel="nofollow">Twitter</a></b> <b>Join us on <a href="http://www.facebook.com/pages/Greenbelt-MD/NASA-Goddard/395013845897?ref=tsd" rel="nofollow">Facebook</a></b> <b>Find us on <a href="http://web.stagram.com/n/nasagoddard/?vm=grid" rel="nofollow">Instagram</a></b>

Full Moon. Rises at sunset, high in the sky around midnight. Visible all night. This marks the first time that accurate shadows at this level of detail are possible in such a computer simulation. The shadows are based on the global elevation map being developed from measurements by the Lunar Orbiter Laser Altimeter (LOLA) aboard the Lunar Reconnaissance Orbiter (LRO). LOLA has already taken more than 10 times as many elevation measurements as all previous missions combined. The Moon always keeps the same face to us, but not exactly the same face. Because of the tilt and shape of its orbit, we see the Moon from slightly different angles over the course of a month. When a month is compressed into 12 seconds, as it is in this animation, our changing view of the Moon makes it look like it's wobbling. This wobble is called libration. The word comes from the Latin for "balance scale" (as does the name of the zodiac constellation Libra) and refers to the way such a scale tips up and down on alternating sides. The sub-Earth point gives the amount of libration in longitude and latitude. The sub-Earth point is also the apparent center of the Moon's disk and the location on the Moon where the Earth is directly overhead. The Moon is subject to other motions as well. It appears to roll back and forth around the sub-Earth point. The roll angle is given by the position angle of the axis, which is the angle of the Moon's north pole relative to celestial north. The Moon also approaches and recedes from us, appearing to grow and shrink. The two extremes, called perigee (near) and apogee (far), differ by more than 10%. The most noticed monthly variation in the Moon's appearance is the cycle of phases, caused by the changing angle of the Sun as the Moon orbits the Earth. The cycle begins with the waxing (growing) crescent Moon visible in the west just after sunset. By first quarter, the Moon is high in the sky at sunset and sets around midnight. The full Moon rises at sunset and is high in the sky at midnight. The third quarter Moon is often surprisingly conspicuous in the daylit western sky long after sunrise. Celestial north is up in these images, corresponding to the view from the northern hemisphere. The descriptions of the print resolution stills also assume a northern hemisphere orientation. To adjust for southern hemisphere views, rotate the images 180 degrees, and substitute "north" for "south" in the descriptions. Credit: <a href="http://svs.gsfc.nasa.gov/index.html" rel="nofollow">NASA/Goddard Space Flight Center Scientific Visualization Studio</a> <b><a href="http://www.nasa.gov/centers/goddard/home/index.html" rel="nofollow">NASA Goddard Space Flight Center</a></b> enables NASA’s mission through four scientific endeavors: Earth Science, Heliophysics, Solar System Exploration, and Astrophysics. Goddard plays a leading role in NASA’s accomplishments by contributing compelling scientific knowledge to advance the Agency’s mission. <b>Follow us on <a href="http://twitter.com/NASA_GoddardPix" rel="nofollow">Twitter</a></b> <b>Join us on <a href="http://www.facebook.com/pages/Greenbelt-MD/NASA-Goddard/395013845897?ref=tsd" rel="nofollow">Facebook</a></b> <b>Find us on <a href="http://web.stagram.com/n/nasagoddard/?vm=grid" rel="nofollow">Instagram</a></b>
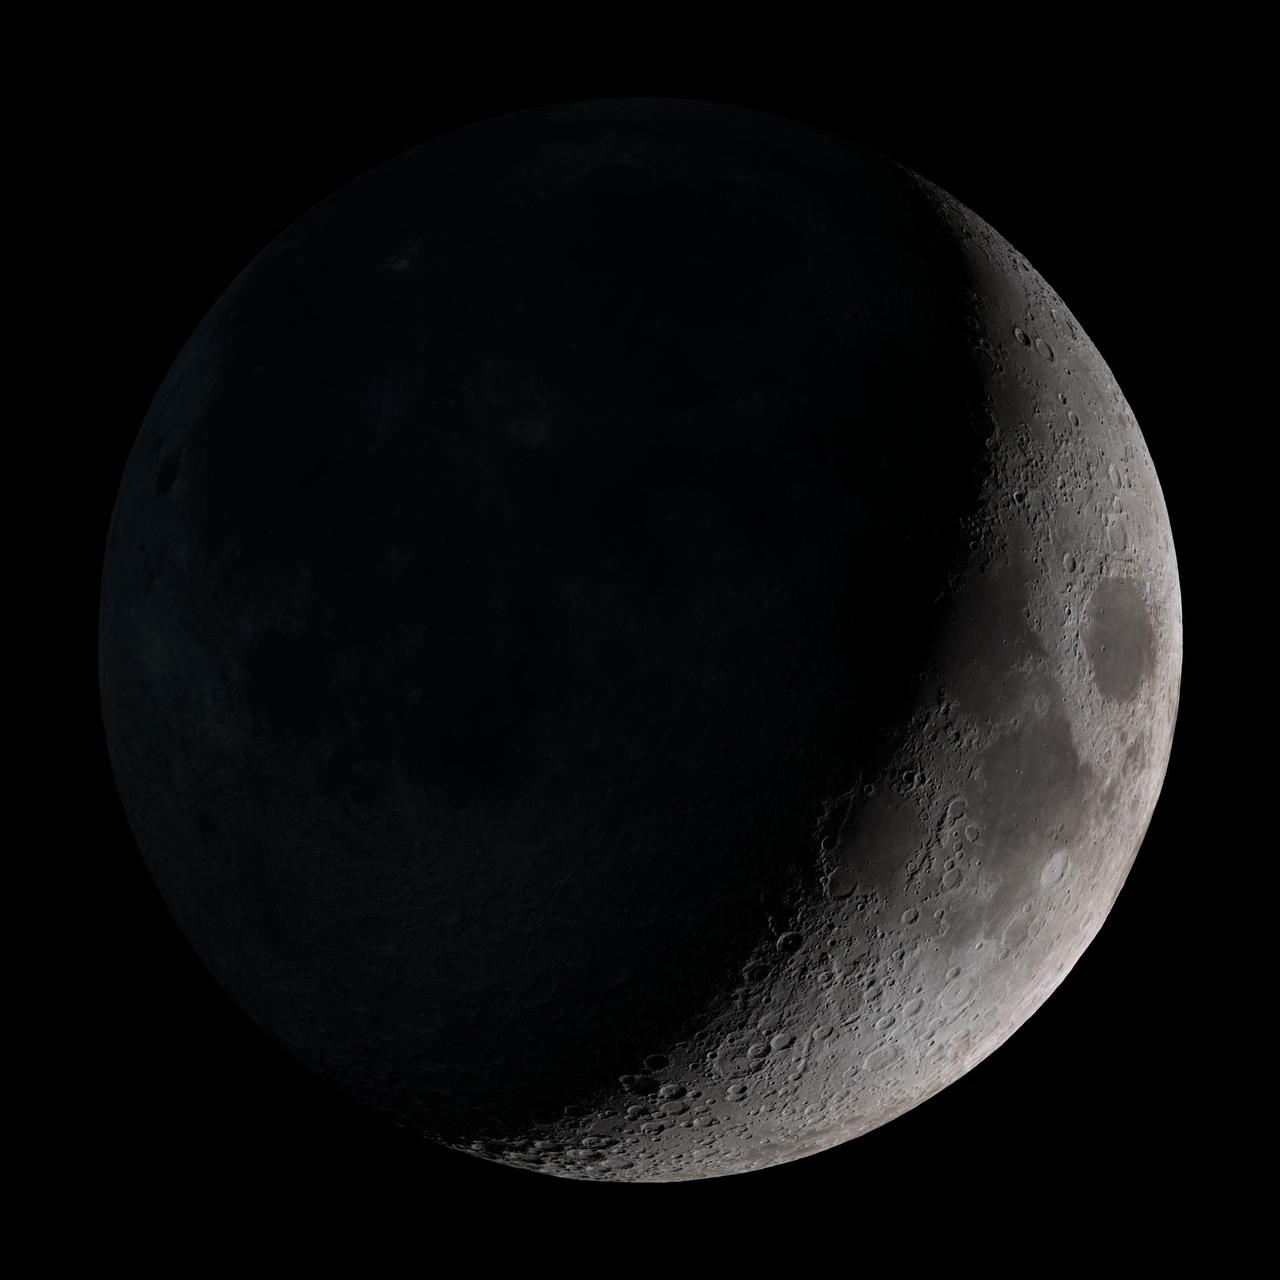
Waxing crescent. Visible toward the southwest in early evening. This marks the first time that accurate shadows at this level of detail are possible in such a computer simulation. The shadows are based on the global elevation map being developed from measurements by the Lunar Orbiter Laser Altimeter (LOLA) aboard the Lunar Reconnaissance Orbiter (LRO). LOLA has already taken more than 10 times as many elevation measurements as all previous missions combined. The Moon always keeps the same face to us, but not exactly the same face. Because of the tilt and shape of its orbit, we see the Moon from slightly different angles over the course of a month. When a month is compressed into 12 seconds, as it is in this animation, our changing view of the Moon makes it look like it's wobbling. This wobble is called libration. The word comes from the Latin for "balance scale" (as does the name of the zodiac constellation Libra) and refers to the way such a scale tips up and down on alternating sides. The sub-Earth point gives the amount of libration in longitude and latitude. The sub-Earth point is also the apparent center of the Moon's disk and the location on the Moon where the Earth is directly overhead. The Moon is subject to other motions as well. It appears to roll back and forth around the sub-Earth point. The roll angle is given by the position angle of the axis, which is the angle of the Moon's north pole relative to celestial north. The Moon also approaches and recedes from us, appearing to grow and shrink. The two extremes, called perigee (near) and apogee (far), differ by more than 10%. The most noticed monthly variation in the Moon's appearance is the cycle of phases, caused by the changing angle of the Sun as the Moon orbits the Earth. The cycle begins with the waxing (growing) crescent Moon visible in the west just after sunset. By first quarter, the Moon is high in the sky at sunset and sets around midnight. The full Moon rises at sunset and is high in the sky at midnight. The third quarter Moon is often surprisingly conspicuous in the daylit western sky long after sunrise. Celestial north is up in these images, corresponding to the view from the northern hemisphere. The descriptions of the print resolution stills also assume a northern hemisphere orientation. To adjust for southern hemisphere views, rotate the images 180 degrees, and substitute "north" for "south" in the descriptions. Credit: <a href="http://svs.gsfc.nasa.gov/index.html" rel="nofollow">NASA/Goddard Space Flight Center Scientific Visualization Studio</a> <b><a href="http://www.nasa.gov/centers/goddard/home/index.html" rel="nofollow">NASA Goddard Space Flight Center</a></b> enables NASA’s mission through four scientific endeavors: Earth Science, Heliophysics, Solar System Exploration, and Astrophysics. Goddard plays a leading role in NASA’s accomplishments by contributing compelling scientific knowledge to advance the Agency’s mission. <b>Follow us on <a href="http://twitter.com/NASA_GoddardPix" rel="nofollow">Twitter</a></b> <b>Join us on <a href="http://www.facebook.com/pages/Greenbelt-MD/NASA-Goddard/395013845897?ref=tsd" rel="nofollow">Facebook</a></b> <b>Find us on <a href="http://web.stagram.com/n/nasagoddard/?vm=grid" rel="nofollow">Instagram</a></b>
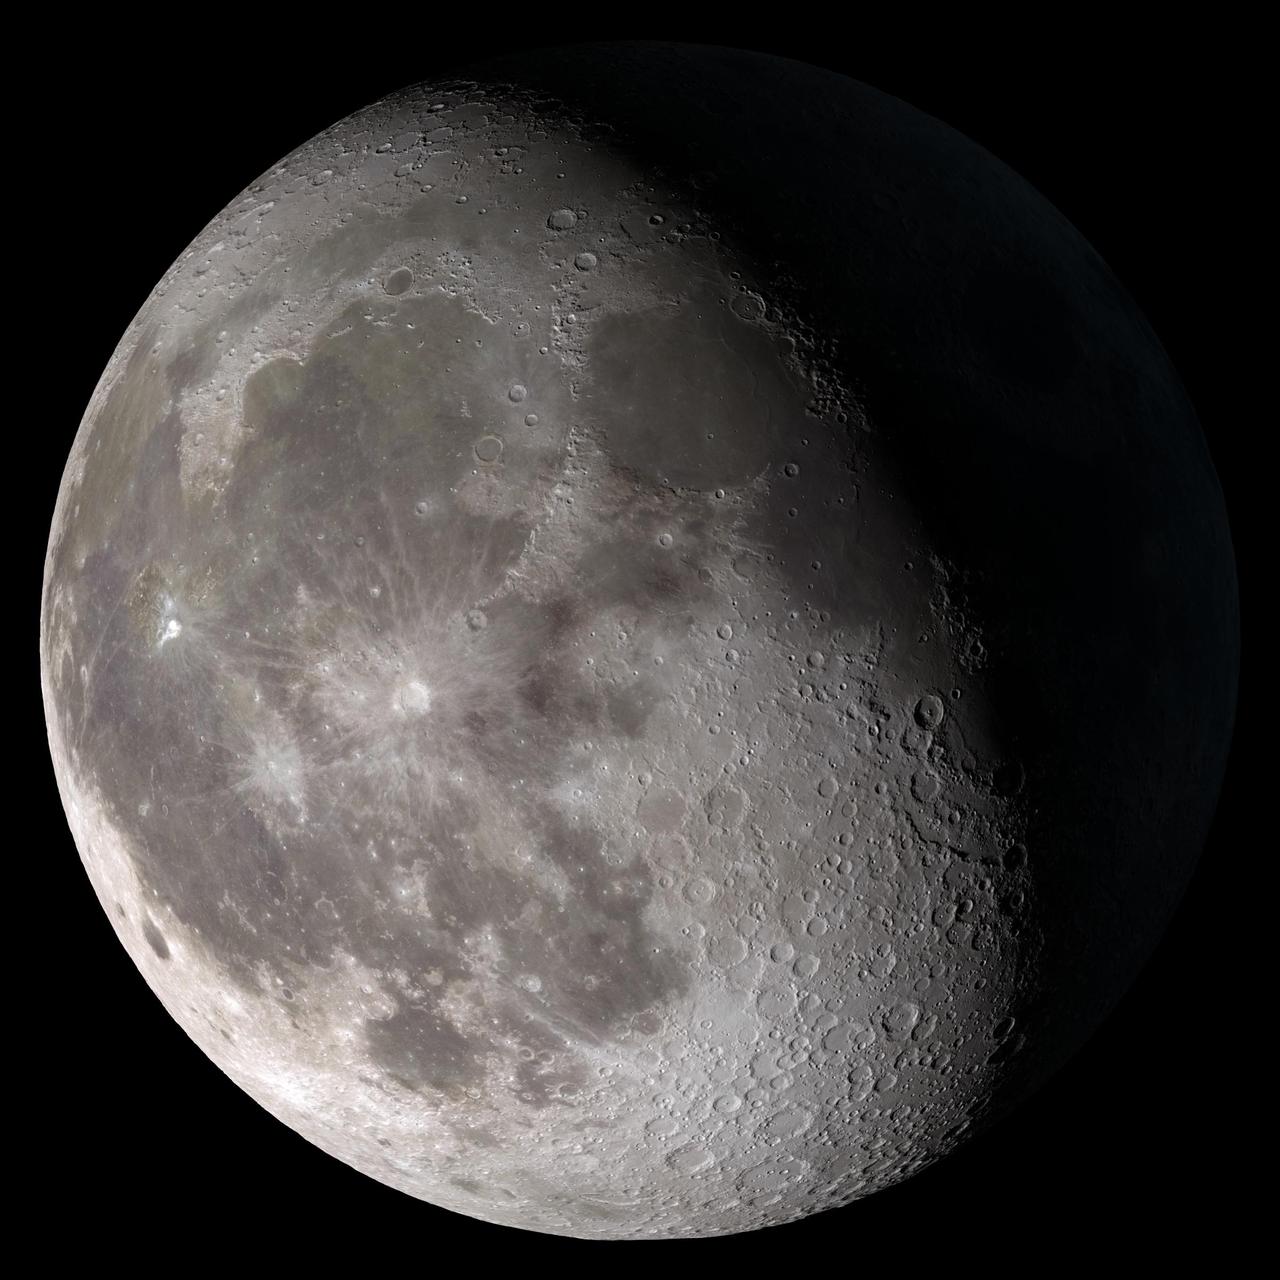
Waning gibbous. Rises after sunset, high in the sky after midnight, visible to the southwest after sunrise. This marks the first time that accurate shadows at this level of detail are possible in such a computer simulation. The shadows are based on the global elevation map being developed from measurements by the Lunar Orbiter Laser Altimeter (LOLA) aboard the Lunar Reconnaissance Orbiter (LRO). LOLA has already taken more than 10 times as many elevation measurements as all previous missions combined. The Moon always keeps the same face to us, but not exactly the same face. Because of the tilt and shape of its orbit, we see the Moon from slightly different angles over the course of a month. When a month is compressed into 12 seconds, as it is in this animation, our changing view of the Moon makes it look like it's wobbling. This wobble is called libration. The word comes from the Latin for "balance scale" (as does the name of the zodiac constellation Libra) and refers to the way such a scale tips up and down on alternating sides. The sub-Earth point gives the amount of libration in longitude and latitude. The sub-Earth point is also the apparent center of the Moon's disk and the location on the Moon where the Earth is directly overhead. The Moon is subject to other motions as well. It appears to roll back and forth around the sub-Earth point. The roll angle is given by the position angle of the axis, which is the angle of the Moon's north pole relative to celestial north. The Moon also approaches and recedes from us, appearing to grow and shrink. The two extremes, called perigee (near) and apogee (far), differ by more than 10%. The most noticed monthly variation in the Moon's appearance is the cycle of phases, caused by the changing angle of the Sun as the Moon orbits the Earth. The cycle begins with the waxing (growing) crescent Moon visible in the west just after sunset. By first quarter, the Moon is high in the sky at sunset and sets around midnight. The full Moon rises at sunset and is high in the sky at midnight. The third quarter Moon is often surprisingly conspicuous in the daylit western sky long after sunrise. Celestial north is up in these images, corresponding to the view from the northern hemisphere. The descriptions of the print resolution stills also assume a northern hemisphere orientation. To adjust for southern hemisphere views, rotate the images 180 degrees, and substitute "north" for "south" in the descriptions. Credit: <a href="http://svs.gsfc.nasa.gov/index.html" rel="nofollow">NASA/Goddard Space Flight Center Scientific Visualization Studio</a> <b><a href="http://www.nasa.gov/centers/goddard/home/index.html" rel="nofollow">NASA Goddard Space Flight Center</a></b> enables NASA’s mission through four scientific endeavors: Earth Science, Heliophysics, Solar System Exploration, and Astrophysics. Goddard plays a leading role in NASA’s accomplishments by contributing compelling scientific knowledge to advance the Agency’s mission. <b>Follow us on <a href="http://twitter.com/NASA_GoddardPix" rel="nofollow">Twitter</a></b> <b>Join us on <a href="http://www.facebook.com/pages/Greenbelt-MD/NASA-Goddard/395013845897?ref=tsd" rel="nofollow">Facebook</a></b> <b>Find us on <a href="http://web.stagram.com/n/nasagoddard/?vm=grid" rel="nofollow">Instagram</a></b>
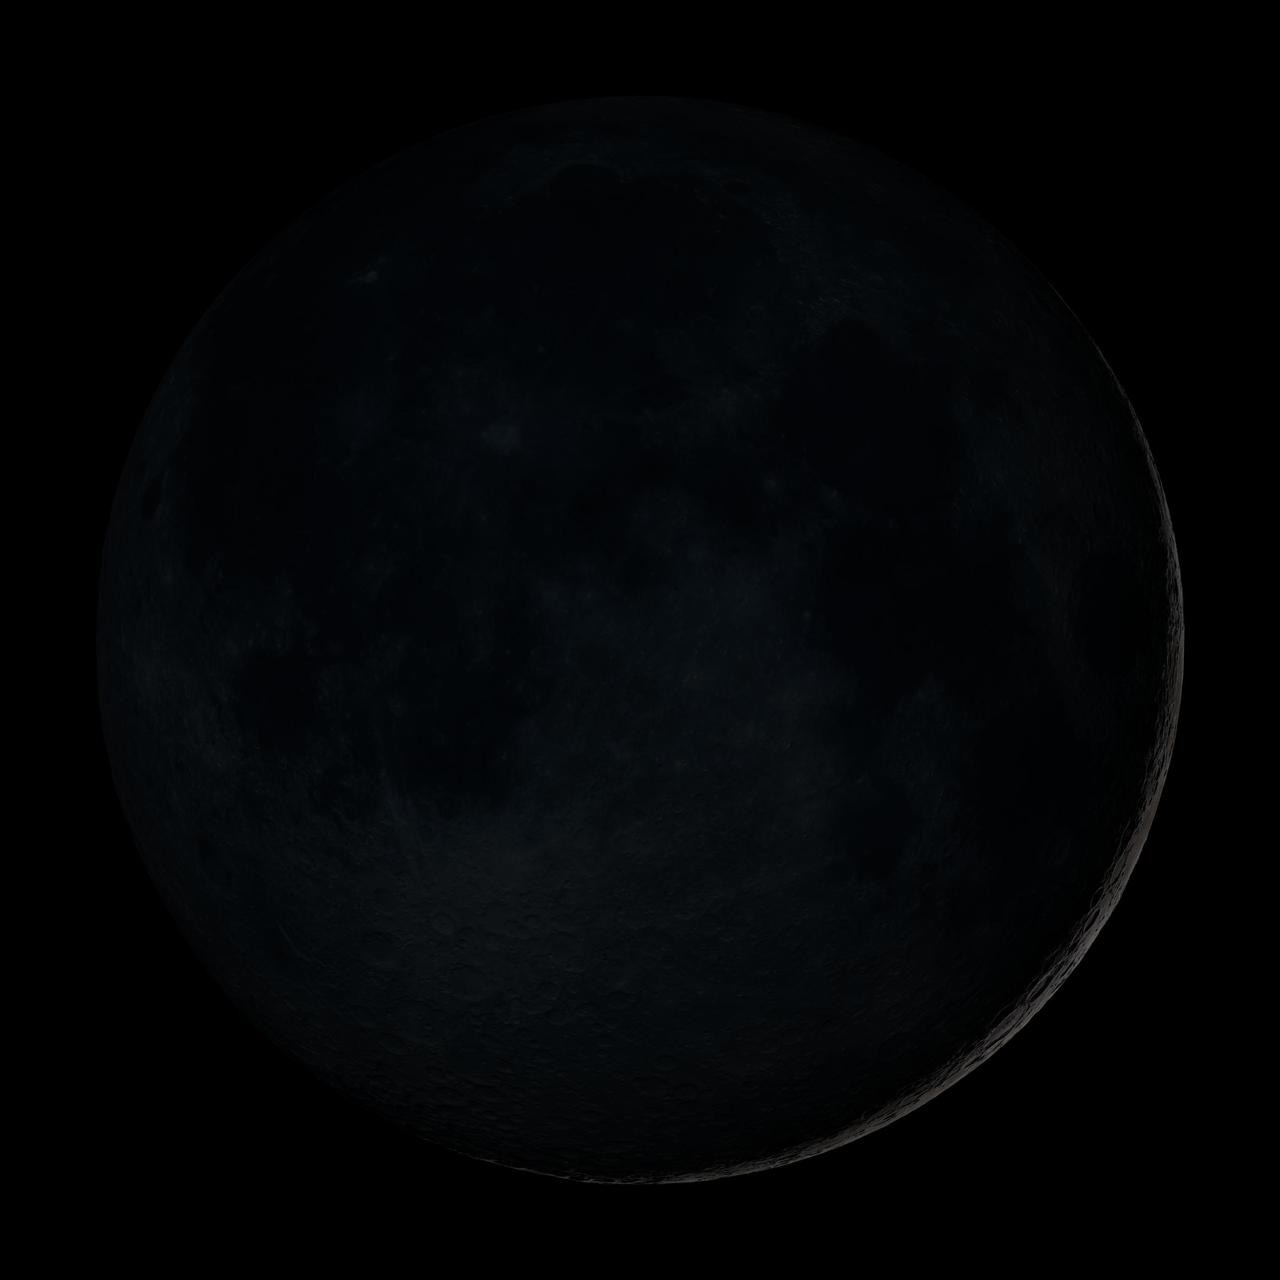
New Moon. By the modern definition, New Moon occurs when the Moon and Sun are at the same geocentric ecliptic longitude. The part of the Moon facing us is completely in shadow then. Pictured here is the traditional New Moon, the earliest visible waxing crescent, which signals the start of a new month in many lunar and lunisolar calendars. This marks the first time that accurate shadows at this level of detail are possible in such a computer simulation. The shadows are based on the global elevation map being developed from measurements by the Lunar Orbiter Laser Altimeter (LOLA) aboard the Lunar Reconnaissance Orbiter (LRO). LOLA has already taken more than 10 times as many elevation measurements as all previous missions combined. The Moon always keeps the same face to us, but not exactly the same face. Because of the tilt and shape of its orbit, we see the Moon from slightly different angles over the course of a month. When a month is compressed into 12 seconds, as it is in this animation, our changing view of the Moon makes it look like it's wobbling. This wobble is called libration. The word comes from the Latin for "balance scale" (as does the name of the zodiac constellation Libra) and refers to the way such a scale tips up and down on alternating sides. The sub-Earth point gives the amount of libration in longitude and latitude. The sub-Earth point is also the apparent center of the Moon's disk and the location on the Moon where the Earth is directly overhead. The Moon is subject to other motions as well. It appears to roll back and forth around the sub-Earth point. The roll angle is given by the position angle of the axis, which is the angle of the Moon's north pole relative to celestial north. The Moon also approaches and recedes from us, appearing to grow and shrink. The two extremes, called perigee (near) and apogee (far), differ by more than 10%. The most noticed monthly variation in the Moon's appearance is the cycle of phases, caused by the changing angle of the Sun as the Moon orbits the Earth. The cycle begins with the waxing (growing) crescent Moon visible in the west just after sunset. By first quarter, the Moon is high in the sky at sunset and sets around midnight. The full Moon rises at sunset and is high in the sky at midnight. The third quarter Moon is often surprisingly conspicuous in the daylit western sky long after sunrise. Celestial north is up in these images, corresponding to the view from the northern hemisphere. The descriptions of the print resolution stills also assume a northern hemisphere orientation. To adjust for southern hemisphere views, rotate the images 180 degrees, and substitute "north" for "south" in the descriptions. Credit: <a href="http://svs.gsfc.nasa.gov/index.html" rel="nofollow">NASA/Goddard Space Flight Center Scientific Visualization Studio</a> <b><a href="http://www.nasa.gov/centers/goddard/home/index.html" rel="nofollow">NASA Goddard Space Flight Center</a></b> enables NASA’s mission through four scientific endeavors: Earth Science, Heliophysics, Solar System Exploration, and Astrophysics. Goddard plays a leading role in NASA’s accomplishments by contributing compelling scientific knowledge to advance the Agency’s mission. <b>Follow us on <a href="http://twitter.com/NASA_GoddardPix" rel="nofollow">Twitter</a></b> <b>Join us on <a href="http://www.facebook.com/pages/Greenbelt-MD/NASA-Goddard/395013845897?ref=tsd" rel="nofollow">Facebook</a></b> <b>Find us on <a href="http://web.stagram.com/n/nasagoddard/?vm=grid" rel="nofollow">Instagram</a></b>

NASA's Wallops Flight Facility is located on Wallops Island, Va. and is the site of tonight's moon mission launch. Satellite imagery from NOAA's GOES-East satellite shows that high pressure remains in control over the Mid-Atlantic region, providing an almost cloud-free sky. This visible image of the Mid-Atlantic was captured by NOAA's GOES-East satellite at 17:31 UTC/1:31 p.m. EDT and shows some fair weather clouds over the Delmarva Peninsula (which consists of the state of Delaware and parts of Maryland and Virginia - which together is "Delmarva") and eastern Virginia and North Carolina. Most of the region is cloud-free, making for a perfect viewing night to see a launch. NOAA operates GOES-East and NASA's GOES Project at the NASA Goddard Space Flight Center in Greenbelt, Md. creates images and animations from the data. NOAA's National Weather Service forecast for tonight, Sept. 6 calls for winds blowing from the east to 11 mph, with clear skies and overnight temperatures dropping to the mid-fifties. The Lunar Atmosphere and Dust Environment Explorer, known as LADEE (pronounced like "laddie"), launches tonight at 11:27 p.m. EDT from Pad 0B at the Mid-Atlantic Regional Spaceport, at NASA Wallops and will be visible along the Mid-Atlantic with tonight's perfect weather conditions. LADEE is managed by NASA's Ames Research Center in Moffett Field, Calif. This will be the first launch to lunar orbit from NASA Wallops and the first launch of a Minotaur V rocket – the biggest ever launched from Wallops. NASA's LADEE is a robotic mission that will orbit the moon to gather detailed information about the lunar atmosphere, conditions near the surface and environmental influences on lunar dust. A thorough understanding of these characteristics will address long-standing unknowns, and help scientists understand other planetary bodies as well. LADEE also carries an important secondary payload, the Lunar Laser Communication Demonstration, or LLCD, which will help us open a new era of space communications by becoming NASA's first high rate, two-way, space laser system. Live coverage of the launch can be seen beginning at 9:30 p.m. EDT on NASA-TV at: <a href="http://www.nasa.gov/ntv" rel="nofollow">www.nasa.gov/ntv</a> For more information about LADEE, visit: <a href="http://www.nasa.gov/ladee" rel="nofollow">www.nasa.gov/ladee</a> <b><a href="http://www.nasa.gov/audience/formedia/features/MP_Photo_Guidelines.html" rel="nofollow">NASA image use policy.</a></b> <b><a href="http://www.nasa.gov/centers/goddard/home/index.html" rel="nofollow">NASA Goddard Space Flight Center</a></b> enables NASA’s mission through four scientific endeavors: Earth Science, Heliophysics, Solar System Exploration, and Astrophysics. Goddard plays a leading role in NASA’s accomplishments by contributing compelling scientific knowledge to advance the Agency’s mission. <b>Follow us on <a href="http://twitter.com/NASA_GoddardPix" rel="nofollow">Twitter</a></b> <b>Like us on <a href="http://www.facebook.com/pages/Greenbelt-MD/NASA-Goddard/395013845897?ref=tsd" rel="nofollow">Facebook</a></b> <b>Find us on <a href="http://instagram.com/nasagoddard?vm=grid" rel="nofollow">Instagram</a></b>

The veils of Saturn's most mysterious moon have begun to lift in Cassini's eagerly awaited first glimpse of the surface of Titan, a world where scientists believe organic matter rains from hazy skies and seas of liquid hydrocarbons dot a frigid surface. Surface features previously observed only from Earth-based telescopes are now visible in images of Titan taken in mid-April by Cassini through one of the narrow angle camera's spectral filters specifically designed to penetrate the thick atmosphere. The image scale is 230 kilometers (143 miles) per pixel, and it rivals the best Earth-based images. The two images displayed here show Titan from a vantage point 17 degrees below its equator, yielding a view from 50 degrees north latitude all the way to its south pole. The image on the left was taken four days after the image on the right. Titan rotated 90 degrees in that time. The two images combined cover a region extending halfway around the moon. The observed brightness variations suggest a diverse surface, with variations in average reflectivity on scales of a couple hundred kilometers. The images were taken through a narrow filter centered at 938 nanometers, a spectral region in which the only obstacle to light is the carbon-based, organic haze. Despite the rather long 38-second exposure times, there is no noticeable smear due to spacecraft motion. The images have been magnified 10 times and enhanced in contrast to bring out details. No further processing to remove the effects of the overlying atmosphere has been performed. The superimposed grid over the images illustrates the orientation of Titan -- north is up and rotated 25 degrees to the left -- as well as the geographical regions of the satellite that are illuminated and visible. The yellow curve marks the position of the boundary between day and night on Titan. The enhanced image contrast makes the region within 20 degrees of this day and night division darker than usual. The Sun illuminates Titan from the right at a phase angle of 66 degrees. Because the Sun is in the southern hemisphere as seen from Titan, the north pole is canted relative to the boundary between day and night by 25 degrees. Also shown here is a map of relative surface brightness variations on Titan as measured in images taken in the 1080-nanometer spectral region in 1997 and 1998 by the Near Infrared Camera and Multi-Object Spectrometer on NASA's Hubble Space Telescope. These images have scales of 300 kilometers (186 miles) per pixel. The map colors indicate different surface reflectivities. From darkest to brightest, the color progression is: deep blue (darkest), light blue, green, yellow, red and deep red (brightest). The large, continent-sized, red feature extending from 60 degrees to 150 degrees west longitude is called Xanadu. It is unclear whether Xanadu is a mountain range, giant basin, smooth plain, or a combination of all three. It may be dotted with hydrocarbon lakes but that is also unknown. All that is presently known is that in Earth-based images, it is the brightest region on Titan. A comparison between the Cassini images and the Hubble map indicates that Xanadu is visible as a bright region in the Cassini image on the right. The dark blue northwest-southeast trending feature from 210 degrees to 250 degrees west longitude, and the bright yellow/green region to the east (right) and southeast of it at minus 50 degrees latitude and 180 to 230 degrees west longitude on the Hubble map, can both be seen in the image on the left. It is noteworthy that the surface is visible to Cassini from its present approach viewing geometry, which is not the most favourable for surface viewing. These early Cassini observations are promising for upcoming imaging sequences of Titan in which the resolution improves by a factor of five over the next two months. These results are encouraging for future, in-orbit observations of Titan that will be acquired from lower, more favorable phase angles. The first opportunity to view small-scale features (2 kilometers or 1.2 miles) on the surface comes during a 350,000 kilometer (217,500 mile) flyby over Titan's south pole on July 2, 2004, only 30 hours after Cassini's insertion into orbit around the ringed planet. http://photojournal.jpl.nasa.gov/catalog/PIA05390

NASA's Lunar Reconnaissance Orbiter (LRO) recently captured a unique view of Earth from the spacecraft's vantage point in orbit around the moon. "The image is simply stunning," said Noah Petro, Deputy Project Scientist for LRO at NASA's Goddard Space Flight Center in Greenbelt, Maryland. "The image of the Earth evokes the famous 'Blue Marble' image taken by Astronaut Harrison Schmitt during Apollo 17, 43 years ago, which also showed Africa prominently in the picture." In this composite image we see Earth appear to rise over the lunar horizon from the viewpoint of the spacecraft, with the center of the Earth just off the coast of Liberia (at 4.04 degrees North, 12.44 degrees West). The large tan area in the upper right is the Sahara Desert, and just beyond is Saudi Arabia. The Atlantic and Pacific coasts of South America are visible to the left. On the moon, we get a glimpse of the crater Compton, which is located just beyond the eastern limb of the moon, on the lunar farside. LRO was launched on June 18, 2009, and has collected a treasure trove of data with its seven powerful instruments, making an invaluable contribution to our knowledge about the moon. LRO experiences 12 earthrises every day; however the spacecraft is almost always busy imaging the lunar surface so only rarely does an opportunity arise such that its camera instrument can capture a view of Earth. Occasionally LRO points off into space to acquire observations of the extremely thin lunar atmosphere and perform instrument calibration measurements. During these movements sometimes Earth (and other planets) pass through the camera's field of view and dramatic images such as the one shown here are acquired. This image was composed from a series of images taken Oct. 12, when LRO was about 83 miles (134 kilometers) above the moon's farside crater Compton. Capturing an image of the Earth and moon with LRO's Lunar Reconnaissance Orbiter Camera (LROC) instrument is a complicated task. First the spacecraft must be rolled to the side (in this case 67 degrees), then the spacecraft slews with the direction of travel to maximize the width of the lunar horizon in LROC's Narrow Angle Camera image. All this takes place while LRO is traveling faster than 3,580 miles per hour (over 1,600 meters per second) relative to the lunar surface below the spacecraft! The high-resolution Narrow Angle Camera (NAC) on LRO takes black-and-white images, while the lower resolution Wide Angle Camera (WAC) takes color images, so you might wonder how we got a high-resolution picture of the Earth in color. Since the spacecraft, Earth, and moon are all in motion, we had to do some special processing to create an image that represents the view of the Earth and moon at one particular time. The final Earth image contains both WAC and NAC information. WAC provides the color, and the NAC provides high-resolution detail. "From the Earth, the daily moonrise and moonset are always inspiring moments," said Mark Robinson of Arizona State University in Tempe, principal investigator for LROC. "However, lunar astronauts will see something very different: viewed from the lunar surface, the Earth never rises or sets. Since the moon is tidally locked, Earth is always in the same spot above the horizon, varying only a small amount with the slight wobble of the moon. The Earth may not move across the 'sky', but the view is not static. Future astronauts will see the continents rotate in and out of view and the ever-changing pattern of clouds will always catch one's eye, at least on the nearside. The Earth is never visible from the farside; imagine a sky with no Earth or moon - what will farside explorers think with no Earth overhead?" NASA's first Earthrise image was taken with the Lunar Orbiter 1 spacecraft in 1966. Perhaps NASA's most iconic Earthrise photo was taken by the crew of the Apollo 8 mission as the spacecraft entered lunar orbit on Christmas Eve Dec. 24, 1968. That evening, the astronauts -- Commander Frank Borman, Command Module Pilot Jim Lovell, and Lunar Module Pilot William Anders -- held a live broadcast from lunar orbit, in which they showed pictures of the Earth and moon as seen from their spacecraft. Said Lovell, "The vast loneliness is awe-inspiring and it makes you realize just what you have back there on Earth." Credit: NASA/Goddard/Arizona State University <b><a href="http://www.nasa.gov/audience/formedia/features/MP_Photo_Guidelines.html" rel="nofollow">NASA image use policy.</a></b> <b><a href="http://www.nasa.gov/centers/goddard/home/index.html" rel="nofollow">NASA Goddard Space Flight Center</a></b> enables NASA’s mission through four scientific endeavors: Earth Science, Heliophysics, Solar System Exploration, and Astrophysics. Goddard plays a leading role in NASA’s accomplishments by contributing compelling scientific knowledge to advance the Agency’s mission. <b>Follow us on <a href="http://twitter.com/NASAGoddardPix" rel="nofollow">Twitter</a></b> <b>Like us on <a href="http://www.facebook.com/pages/Greenbelt-MD/NASA-Goddard/395013845897?ref=tsd" rel="nofollow">Facebook</a></b> <b>Find us on <a href="http://instagrid.me/nasagoddard/?vm=grid" rel="nofollow">Instagram</a></b>
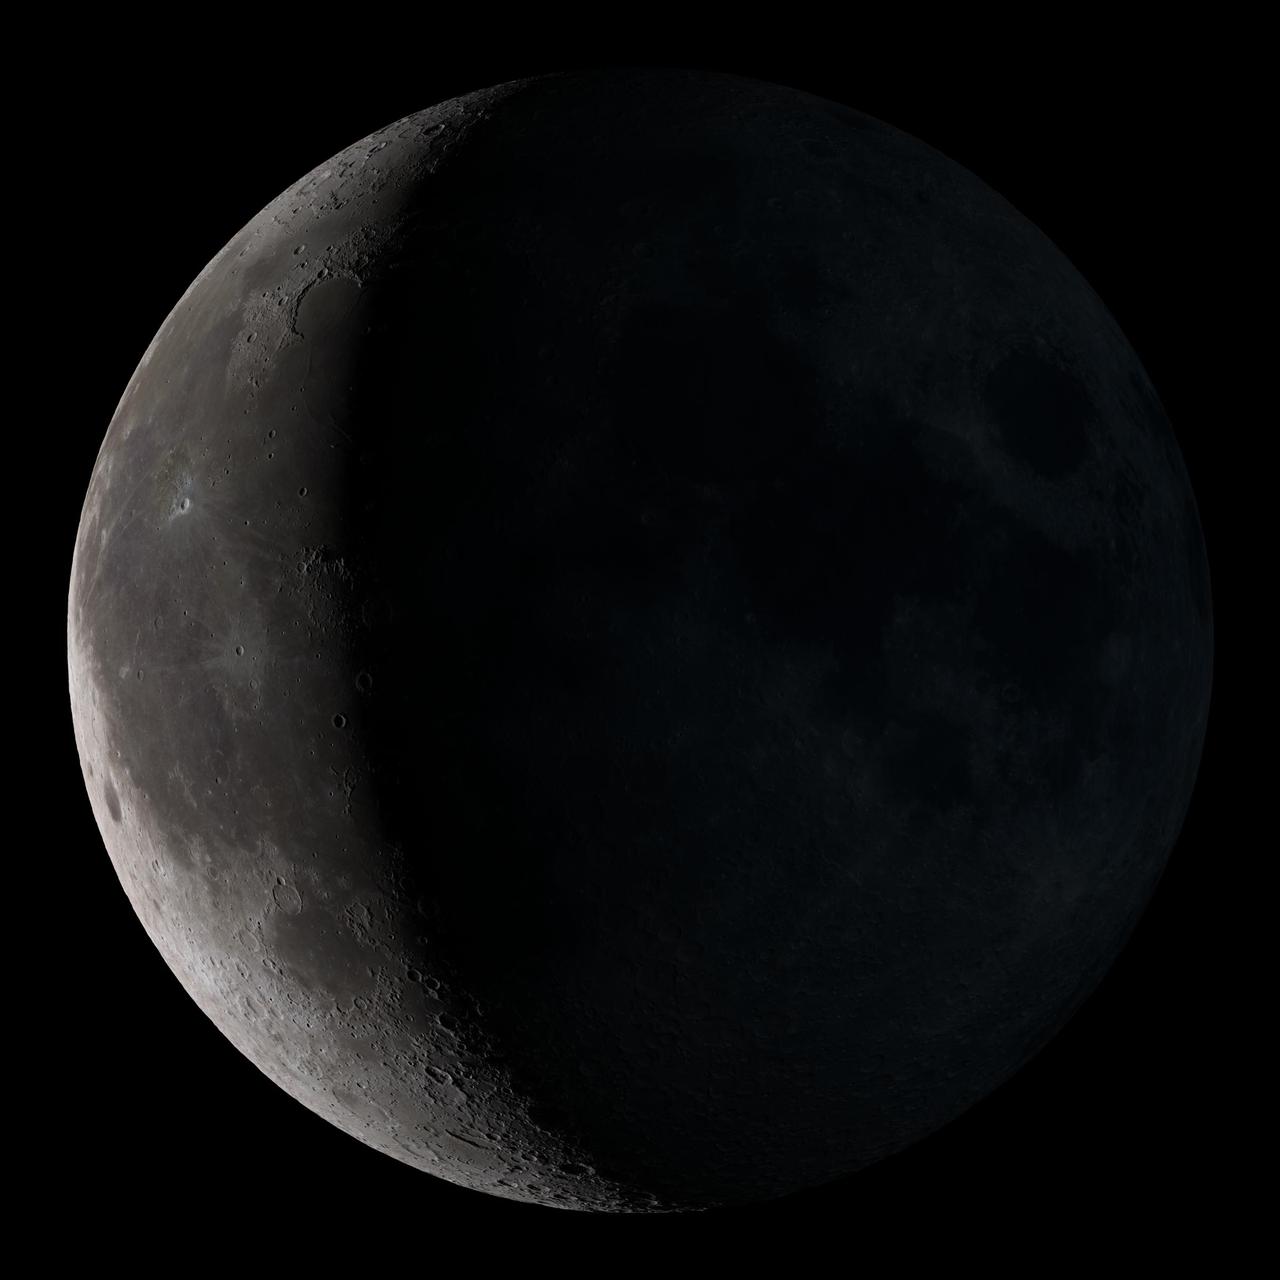
Waning crescent. Low to the east before sunrise. This marks the first time that accurate shadows at this level of detail are possible in such a computer simulation. The shadows are based on the global elevation map being developed from measurements by the Lunar Orbiter Laser Altimeter (LOLA) aboard the Lunar Reconnaissance Orbiter (LRO). LOLA has already taken more than 10 times as many elevation measurements as all previous missions combined. The Moon always keeps the same face to us, but not exactly the same face. Because of the tilt and shape of its orbit, we see the Moon from slightly different angles over the course of a month. When a month is compressed into 12 seconds, as it is in this animation, our changing view of the Moon makes it look like it's wobbling. This wobble is called libration. The word comes from the Latin for "balance scale" (as does the name of the zodiac constellation Libra) and refers to the way such a scale tips up and down on alternating sides. The sub-Earth point gives the amount of libration in longitude and latitude. The sub-Earth point is also the apparent center of the Moon's disk and the location on the Moon where the Earth is directly overhead. The Moon is subject to other motions as well. It appears to roll back and forth around the sub-Earth point. The roll angle is given by the position angle of the axis, which is the angle of the Moon's north pole relative to celestial north. The Moon also approaches and recedes from us, appearing to grow and shrink. The two extremes, called perigee (near) and apogee (far), differ by more than 10%. The most noticed monthly variation in the Moon's appearance is the cycle of phases, caused by the changing angle of the Sun as the Moon orbits the Earth. The cycle begins with the waxing (growing) crescent Moon visible in the west just after sunset. By first quarter, the Moon is high in the sky at sunset and sets around midnight. The full Moon rises at sunset and is high in the sky at midnight. The third quarter Moon is often surprisingly conspicuous in the daylit western sky long after sunrise. Celestial north is up in these images, corresponding to the view from the northern hemisphere. The descriptions of the print resolution stills also assume a northern hemisphere orientation. To adjust for southern hemisphere views, rotate the images 180 degrees, and substitute "north" for "south" in the descriptions. Credit: <a href="http://svs.gsfc.nasa.gov/index.html" rel="nofollow">NASA/Goddard Space Flight Center Scientific Visualization Studio</a> <b><a href="http://www.nasa.gov/centers/goddard/home/index.html" rel="nofollow">NASA Goddard Space Flight Center</a></b> enables NASA’s mission through four scientific endeavors: Earth Science, Heliophysics, Solar System Exploration, and Astrophysics. Goddard plays a leading role in NASA’s accomplishments by contributing compelling scientific knowledge to advance the Agency’s mission. <b>Follow us on <a href="http://twitter.com/NASA_GoddardPix" rel="nofollow">Twitter</a></b> <b>Join us on <a href="http://www.facebook.com/pages/Greenbelt-MD/NASA-Goddard/395013845897?ref=tsd" rel="nofollow">Facebook</a></b> <b>Find us on <a href="http://web.stagram.com/n/nasagoddard/?vm=grid" rel="nofollow">Instagram</a></b>
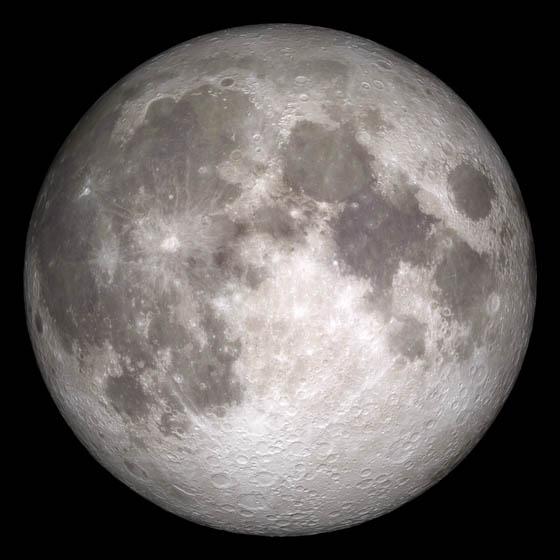
Current moon as viewed on Wednesday, June 15, 2011, 19:00 UT (Phase 100%) This marks the first time that accurate shadows at this level of detail are possible in such a computer simulation. The shadows are based on the global elevation map being developed from measurements by the Lunar Orbiter Laser Altimeter (LOLA) aboard the Lunar Reconnaissance Orbiter (LRO). LOLA has already taken more than 10 times as many elevation measurements as all previous missions combined. The Moon always keeps the same face to us, but not exactly the same face. Because of the tilt and shape of its orbit, we see the Moon from slightly different angles over the course of a month. When a month is compressed into 12 seconds, as it is in this animation, our changing view of the Moon makes it look like it's wobbling. This wobble is called libration. The word comes from the Latin for "balance scale" (as does the name of the zodiac constellation Libra) and refers to the way such a scale tips up and down on alternating sides. The sub-Earth point gives the amount of libration in longitude and latitude. The sub-Earth point is also the apparent center of the Moon's disk and the location on the Moon where the Earth is directly overhead. The Moon is subject to other motions as well. It appears to roll back and forth around the sub-Earth point. The roll angle is given by the position angle of the axis, which is the angle of the Moon's north pole relative to celestial north. The Moon also approaches and recedes from us, appearing to grow and shrink. The two extremes, called perigee (near) and apogee (far), differ by more than 10%. The most noticed monthly variation in the Moon's appearance is the cycle of phases, caused by the changing angle of the Sun as the Moon orbits the Earth. The cycle begins with the waxing (growing) crescent Moon visible in the west just after sunset. By first quarter, the Moon is high in the sky at sunset and sets around midnight. The full Moon rises at sunset and is high in the sky at midnight. The third quarter Moon is often surprisingly conspicuous in the daylit western sky long after sunrise. Celestial north is up in these images, corresponding to the view from the northern hemisphere. The descriptions of the print resolution stills also assume a northern hemisphere orientation. To adjust for southern hemisphere views, rotate the images 180 degrees, and substitute "north" for "south" in the descriptions. Credit: <a href="http://svs.gsfc.nasa.gov/index.html" rel="nofollow">NASA/Goddard Space Flight Center Scientific Visualization Studio</a> <b><a href="http://www.nasa.gov/centers/goddard/home/index.html" rel="nofollow">NASA Goddard Space Flight Center</a></b> enables NASA’s mission through four scientific endeavors: Earth Science, Heliophysics, Solar System Exploration, and Astrophysics. Goddard plays a leading role in NASA’s accomplishments by contributing compelling scientific knowledge to advance the Agency’s mission. <b>Follow us on <a href="http://twitter.com/NASA_GoddardPix" rel="nofollow">Twitter</a></b> <b>Join us on <a href="http://www.facebook.com/pages/Greenbelt-MD/NASA-Goddard/395013845897?ref=tsd" rel="nofollow">Facebook</a></b> <b>Find us on <a href="http://web.stagram.com/n/nasagoddard/?vm=grid" rel="nofollow">Instagram</a></b>

As it sped away from Venus, NASA's Mariner 10 spacecraft captured this seemingly peaceful view of a planet the size of Earth, wrapped in a dense, global cloud layer. But, contrary to its serene appearance, the clouded globe of Venus is a world of intense heat, crushing atmospheric pressure and clouds of corrosive acid. This newly processed image revisits the original data with modern image processing software. A contrast-enhanced version of this view, also provided here, makes features in the planet's thick cloud cover visible in greater detail. The clouds seen here are located about 40 miles (60 kilometers) above the planet's surface, at altitudes where Earth-like atmospheric pressures and temperatures exist. They are comprised of sulfuric acid particles, as opposed to water droplets or ice crystals, as on Earth. These cloud particles are mostly white in appearance; however, patches of red-tinted clouds also can be seen. This is due to the presence of a mysterious material that absorbs light at blue and ultraviolet wavelengths. Many chemicals have been suggested for this mystery component, from sulfur compounds to even biological materials, but a consensus has yet to be reached among researchers. The clouds of Venus whip around the planet at nearly over 200 miles per hour (100 meters per second), circling the globe in about four and a half days. That these hurricane-force winds cover nearly the entire planet is another unexplained mystery, especially given that the solid planet itself rotates at a very slow 4 mph (less than 2 meters per second) — much slower than Earth's rotation rate of about 1,000 mph (450 meters per second). The winds and clouds also blow to the west, not to the east as on the Earth. This is because the planet itself rotates to the west, backward compared to Earth and most of the other planets. As the clouds travel westward, they also typically progress toward the poles; this can be seen in the Mariner 10 view as a curved spiral pattern at mid latitudes. Near the equator, instead of long streaks, areas of more clumpy, discrete clouds can be seen, indicating enhanced upwelling and cloud formation in the equatorial region, spurred on by the enhanced power of sunlight there. This view is a false color composite created by combining images taken using orange and ultraviolet spectral filters on the spacecraft's imaging camera. These were used for the red and blue channels of the color image, respectively, with the green channel synthesized by combining the other two images. Flying past Venus en route to the first-ever flyby of Mercury, Mariner 10 became the first spacecraft to use a gravity assist to change its flight path in order to reach another planet. The images used to create this view were acquired by Mariner 10 on Feb. 7 and 8, 1974, a couple of days after the spacecraft's closest approach to Venus on Feb. 5. Despite their many differences, comparisons between Earth and Venus are valuable for helping to understand their distinct climate histories. Nearly 50 years after this view was obtained, many fundamental questions about Venus remain unanswered. Did Venus have oceans long ago? How has its atmosphere evolved over time, and when did its runaway greenhouse effect begin? How does Venus lose its heat? How volcanically and tectonically active has Venus been over the last billion years? This image was processed from archived Mariner 10 data by JPL engineer Kevin M. Gill. The Mariner 10 mission was managed by NASA's Jet Propulsion Laboratory. https://photojournal.jpl.nasa.gov/catalog/PIA23791

Peering deep into the core of the Crab Nebula, this close-up image reveals the beating heart of one of the most historic and intensively studied remnants of a supernova, an exploding star. The inner region sends out clock-like pulses of radiation and tsunamis of charged particles embedded in magnetic fields. The neutron star at the very center of the Crab Nebula has about the same mass as the sun but compressed into an incredibly dense sphere that is only a few miles across. Spinning 30 times a second, the neutron star shoots out detectable beams of energy that make it look like it's pulsating. The NASA Hubble Space Telescope snapshot is centered on the region around the neutron star (the rightmost of the two bright stars near the center of this image) and the expanding, tattered, filamentary debris surrounding it. Hubble's sharp view captures the intricate details of glowing gas, shown in red, that forms a swirling medley of cavities and filaments. Inside this shell is a ghostly blue glow that is radiation given off by electrons spiraling at nearly the speed of light in the powerful magnetic field around the crushed stellar core. The neutron star is a showcase for extreme physical processes and unimaginable cosmic violence. Bright wisps are moving outward from the neutron star at half the speed of light to form an expanding ring. It is thought that these wisps originate from a shock wave that turns the high-speed wind from the neutron star into extremely energetic particles. When this "heartbeat" radiation signature was first discovered in 1968, astronomers realized they had discovered a new type of astronomical object. Now astronomers know it's the archetype of a class of supernova remnants called pulsars - or rapidly spinning neutron stars. These interstellar "lighthouse beacons" are invaluable for doing observational experiments on a variety of astronomical phenomena, including measuring gravity waves. Observations of the Crab supernova were recorded by Chinese astronomers in 1054 A.D. The nebula, bright enough to be visible in amateur telescopes, is located 6,500 light-years away in the constellation Taurus. Credits: NASA and ESA, Acknowledgment: J. Hester (ASU) and M. Weisskopf (NASA/MSFC) <b><a href="http://www.nasa.gov/audience/formedia/features/MP_Photo_Guidelines.html" rel="nofollow">NASA image use policy.</a></b> <b><a href="http://www.nasa.gov/centers/goddard/home/index.html" rel="nofollow">NASA Goddard Space Flight Center</a></b> enables NASA’s mission through four scientific endeavors: Earth Science, Heliophysics, Solar System Exploration, and Astrophysics. Goddard plays a leading role in NASA’s accomplishments by contributing compelling scientific knowledge to advance the Agency’s mission. <b>Follow us on <a href="http://twitter.com/NASAGoddardPix" rel="nofollow">Twitter</a></b> <b>Like us on <a href="http://www.facebook.com/pages/Greenbelt-MD/NASA-Goddard/395013845897?ref=tsd" rel="nofollow">Facebook</a></b> <b>Find us on <a href="http://instagrid.me/nasagoddard/?vm=grid" rel="nofollow">Instagram</a></b>
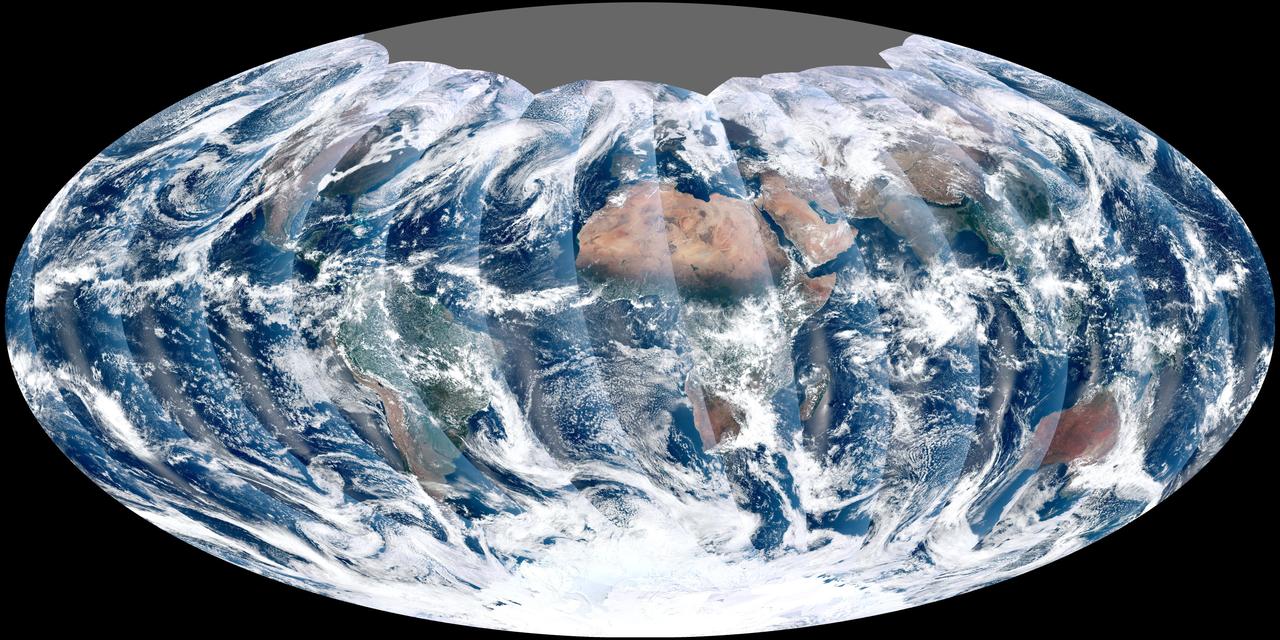
NASA acquired November 24, 2011 From its vantage 824 kilometers (512 miles) above Earth, the Visible Infrared Imager Radiometer Suite (VIIRS) on the NPOESS Preparatory Project (NPP) satellite gets a complete view of our planet every day. This image from November 24, 2011, is the first complete global image from VIIRS. The NPP satellite launched on October 28, 2011, and VIIRS acquired its first measurements on November 21. To date, the images are preliminary, used to gauge the health of the sensor as engineers continue to power it up for full operation. Rising from the south and setting in the north on the daylight side of Earth, VIIRS images the surface in long wedges measuring 3,000 kilometers (1,900 miles) across. The swaths from each successive orbit overlap one another, so that at the end of the day, the sensor has a complete view of the globe. The Arctic is missing because it is too dark to view in visible light during the winter. The NPP satellite was placed in a Sun-synchronous orbit, a unique path that takes the satellite over the equator at the same local (ground) time in every orbit. So, when NPP flies over Kenya, it is about 1:30 p.m. on the ground. When NPP reaches Gabon—about 3,000 kilometers to the west—on the next orbit, it is close to 1:30 p.m. on the ground. This orbit allows the satellite to maintain the same angle between the Earth and the Sun so that all images have similar lighting. The consistent lighting is evident in the daily global image. Stripes of sunlight (sunglint) reflect off the ocean in the same place on the left side of every swath. The consistent angle is important because it allows scientists to compare images from year to year without worrying about extreme changes in shadows and lighting. The image also shows a band of haze along the right side of every orbit swath. When light travels through the atmosphere, it bounces off particles or scatters, making the atmosphere look hazy. The scattering effect is most pronounced along the edge of the swath, where the sensor is looking at an angle through more of the atmosphere. Scientists can correct for this scattering effect, but need measurements from a range of wavelengths to do so. The degree to which light scatters depends partly on the wavelength of the light. Blue light scatters more than red light, for example, which is why the sky is blue. VIIRS measures 22 different wavelengths of light, but not all of the sensor’s detectors are operating at peak performance yet. Those measuring thermal infrared light are not yet cold enough to collect reliable measurements. Once VIIRS begins full operations, it will produce a range of measurements from ocean temperature to clouds to the locations of fires. These measurements will help extend the record from earlier sensors like the Moderate Resolution Imaging Spectroradiometer (MODIS). VIIRS is very similar to MODIS, but flies at a higher altitude to measure the whole planet without gaps. (MODIS daily measurements have gaps at the equator. See the MODIS image from November 24.) VIIRS also sees the Earth in less detail, 375 meters per pixel, compared to 250 meters per pixel for MODIS. Image by NASA’s NPP Land Product Evaluation and Testing Element. Caption by Holli Riebeek. Credit: <b><a href="http://www.earthobservatory.nasa.gov/" rel="nofollow"> NASA Earth Observatory</a></b> <b><a href="http://www.nasa.gov/audience/formedia/features/MP_Photo_Guidelines.html" rel="nofollow">NASA image use policy.</a></b> <b><a href="http://www.nasa.gov/centers/goddard/home/index.html" rel="nofollow">NASA Goddard Space Flight Center</a></b> enables NASA’s mission through four scientific endeavors: Earth Science, Heliophysics, Solar System Exploration, and Astrophysics. Goddard plays a leading role in NASA’s accomplishments by contributing compelling scientific knowledge to advance the Agency’s mission. <b>Follow us on <a href="http://twitter.com/NASA_GoddardPix" rel="nofollow">Twitter</a></b> <b>Like us on <a href="http://www.facebook.com/pages/Greenbelt-MD/NASA-Goddard/395013845897?ref=tsd" rel="nofollow">Facebook</a></b> <b>Find us on <a href="http://instagrid.me/nasagoddard/?vm=grid" rel="nofollow">Instagram</a></b>
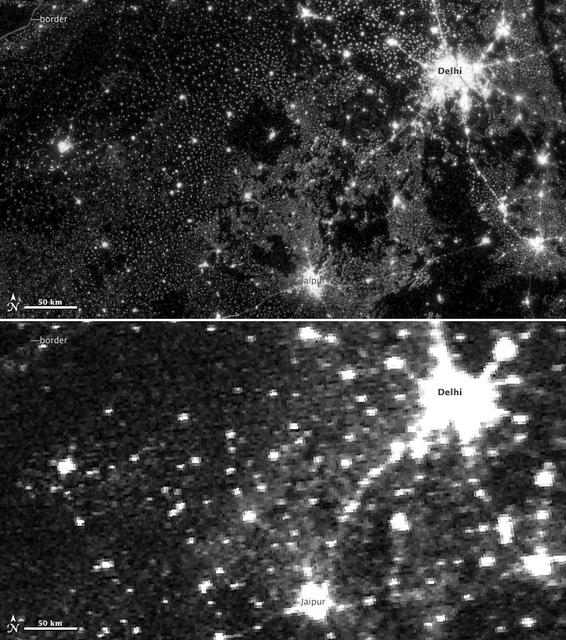
NASA image acquired November 11-12, 2012. On November 12, 2012, the Visible Infrared Imaging Radiometer Suite (VIIRS) on the Suomi NPP satellite captured the top nighttime image of city, village, and highway lights near Delhi, India. For comparison, the lower image shows the same area one night earlier, as observed by the Operational Line Scan (OLS) system on a Defense Meteorological Satellite Program (DMSP) spacecraft. Since the 1960s, the U.S. Air Force has operated DMSP in order to observe clouds and other weather variables in key wavelengths of infrared and visible light. Since 1972, the DMSP satellites have included the Operational Linescan System (OLS), which gives weather forecasters some ability to see in the dark. It has been a highly successful sensor, but it is dependent on older technology with lower resolution than most scientists would like. And for many years, DMSP data were classified. Through improved optics and “smart” sensing technology, the VIIRS “day-night band,” is ten to fifteen times better than the OLS system at resolving the relatively dim lights of human settlements and reflected moonlight. Each VIIRS pixel shows roughly 740 meters (0.46 miles) across, compared to the 3-kilometer footprint (1.86 miles) of DMSP. Beyond the resolution, the new sensor can detect dimmer light sources. And since the VIIRS measurements are fully calibrated (unlike DMSP), scientists now have the precision required to make quantitative measurements of clouds and other features. “In contrast to the Operational Line Scan system, the imagery from the new day-night band is almost like a nearsighted person putting on glasses for the first time and looking at the Earth anew,” says Steve Miller, an atmospheric scientist at Colorado State University. “VIIRS has allowed us to bring this coarse, blurry view of night lights into clearer focus. Now we can see things in such great detail and at such high precision that we’re really talking about a new kind of measurement.” Unlike a film camera that captures a photograph in one exposure, VIIRS produces an image by repeatedly scanning a scene and resolving it as millions of individual picture elements, or pixels. The day-night band goes a step further, determining on-the-fly whether to use its low, medium, or high-gain mode. If a pixel is very bright, a low-gain mode on the sensor prevents the pixel from over-saturating. If the pixel is dark, the signal will be amplified. “On a hand-held camera, there’s a nighttime setting where the shutter will stay open much longer than it would under daylight imaging conditions,” says Chris Elvidge, who leads the Earth Observation Group at NOAA’s National Geophysical Data Center. “The day-night band is similar. It increases the exposure time—the amount of time that it’s collecting photons for pixels.” NASA Earth Observatory image by Jesse Allen and Robert Simmon, using Suomi NPP VIIRS and DMSP OLS data provided courtesy of Chris Elvidge (NOAA National Geophysical Data Center). Suomi NPP is the result of a partnership between NASA, NOAA, and the Department of Defense. Caption by Mike Carlowicz. Instrument: Suomi NPP - VIIRS Credit: <b><a href="http://www.earthobservatory.nasa.gov/" rel="nofollow"> NASA Earth Observatory</a></b> <b>Click here to view all of the <a href="http://earthobservatory.nasa.gov/Features/NightLights/" rel="nofollow"> Earth at Night 2012 images </a></b> <b>Click here to <a href="http://earthobservatory.nasa.gov/NaturalHazards/view.php?id=79846" rel="nofollow"> read more </a> about this image </b> <b><a href="http://www.nasa.gov/audience/formedia/features/MP_Photo_Guidelines.html" rel="nofollow">NASA image use policy.</a></b> <b><a href="http://www.nasa.gov/centers/goddard/home/index.html" rel="nofollow">NASA Goddard Space Flight Center</a></b> enables NASA’s mission through four scientific endeavors: Earth Science, Heliophysics, Solar System Exploration, and Astrophysics. Goddard plays a leading role in NASA’s accomplishments by contributing compelling scientific
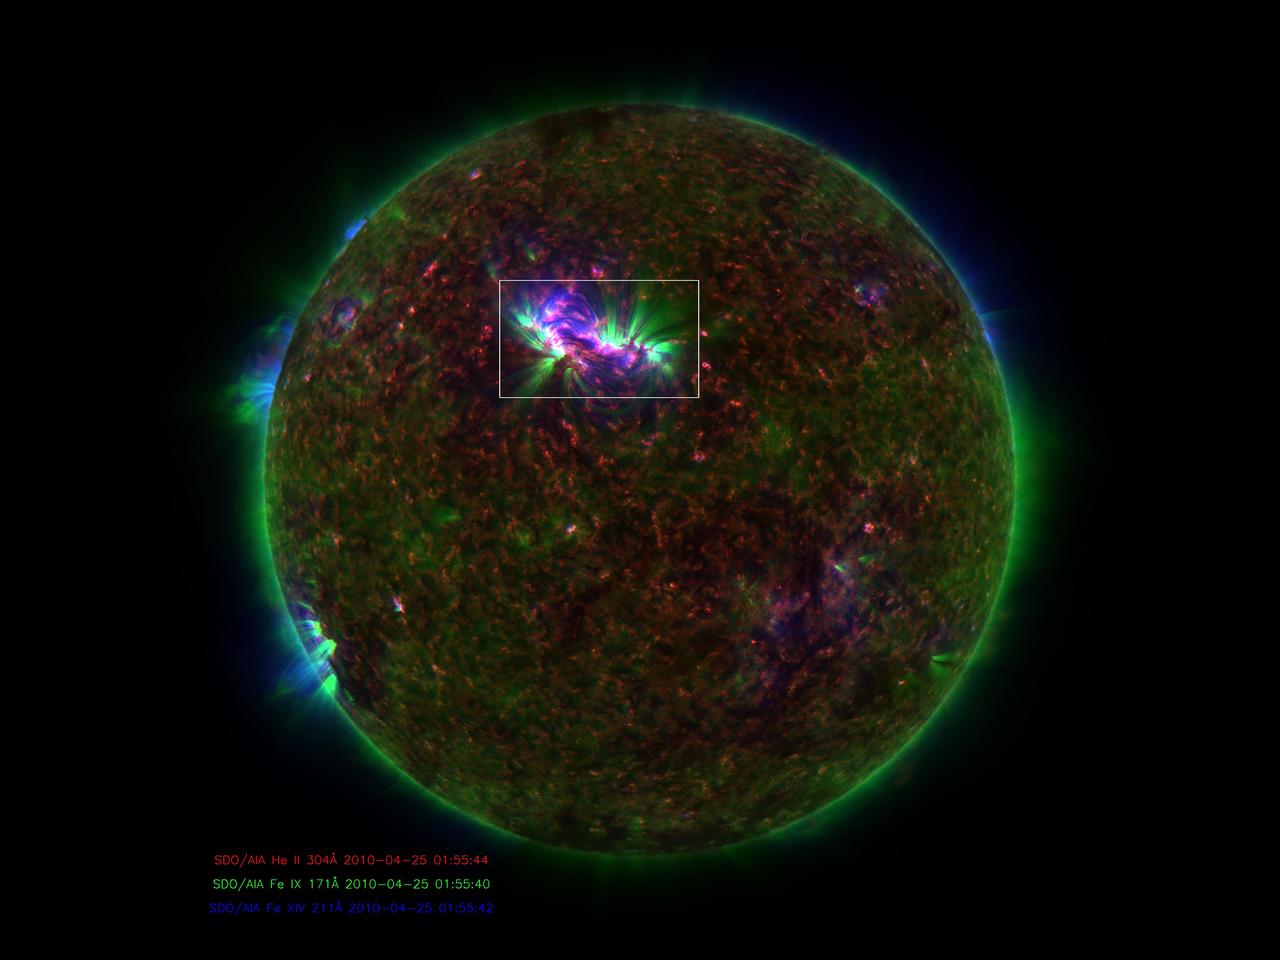
NASA image release January 6, 2010 Caption: Spicules on the sun, as observed by the Solar Dynamics Observatory. These bursts of gas jet off the surface of the sun at 150,000 miles per hour and contain gas that reaches temperatures over a million degrees. GREENBELT, Md. -- Observations from NASA's Solar Dynamics Observatory (SDO) and the Japanese satellite Hinode show that some gas in the giant, fountain-like jets in the sun's atmosphere known as spicules can reach temperatures of millions of degrees. The finding offers a possible new framework for how the sun's high atmosphere gets so much hotter than the surface of the sun. What makes the high atmosphere, or corona, so hot – over a million degrees, compared to the sun surface's 10,000 degrees Fahrenheit -- remains a poorly understood aspect of the sun's complicated space weather system. That weather system can reach Earth, causing auroral lights and, if strong enough, disrupting Earth's communications and power systems. Understanding such phenomena, therefore, is an important step towards better protecting our satellites and power grids. "The traditional view is that all the heating happens higher up in the corona," says Dean Pesnell, who is SDO's project scientist at NASA's Goddard Space Flight Center in Greenbelt, Md. "The suggestion in this paper is that cool gas is being ejected from the sun's surface in spicules and getting heated on its way to the corona." Spicules were first named in the 1940s, but were hard to study in detail until recently, says Bart De Pontieu of Lockheed Martin's Solar and Astrophysics Laboratory, Palo Alto, Calif. who is the lead author on a paper on this subject in the January 7, 2011 issue of Science magazine. In visible light, spicules can be seen to send large masses of so-called plasma – the electromagnetic gas that surrounds the sun – up through the lower solar atmosphere or photosphere. The amount of material sent up is stunning, some 100 times as much as streams away from the sun in the solar wind towards the edges of the solar system. But nobody knew if they contained hot gas. "Heating of spicules to the necessary hot temperatures has never been observed, so their role in coronal heating had been dismissed as unlikely," says De Pontieu. Now, De Pontieu's team -- which included researchers at Lockheed Martin, the High Altitude Observatory of the National Center for Atmospheric Research (NCAR) in Colorado and the University of Oslo, Norway -- was able to combine images from SDO and Hinode to produce a more complete picture of the gas inside these gigantic fountains. The scientists found that a large fraction of the gas is heated to a hundred thousand degrees, while a small fraction is heated to millions of degrees. Time-lapsed images show that this material spews up into the corona, with most falling back down towards the surface of the sun. However, the small fraction of the gas that is heated to millions of degrees does not immediately return to the surface. Given the large number of spicules on the Sun, and the amount of material in the spicules, the scientists believe that if even some of that super hot plasma stays aloft it would make a contribution to coronal heating. Astrophysicist Jonathan Cirtain, who is the U.S. project scientist for Hinode at NASA's Marshall Space Flight Center, Huntsville, Ala., says that incorporating such new information helps address an important question that reaches far beyond the sun. "This breakthrough in our understanding of the mechanisms which transfer energy from the solar photosphere to the corona addresses one of the most compelling questions in stellar astrophysics: How is the atmosphere of a star heated?" he says. "This is a fantastic discovery, and demonstrates the muscle of the NASA Heliophysics System Observatory, comprised of numerous instruments on multiple observatories." Hinode is the second mission in NASA's Solar Terrestrial Probes program, the goal of which is to improve understanding of fundamental solar and space physics processes. The mission is led by the Japan Aerospace Exploration Agency (JAXA) and the National Astronomical Observatory of Japan (NAOJ). The collaborative mission includes the U.S., the United Kingdom, Norway and Europe. NASA Marshall manages Hinode U.S. science operations and oversaw development of the scientific instrumentation provided for the mission by NASA, academia and industry. The Lockheed Martin Advanced Technology Center is the lead U.S. investigator for the Solar Optical Telescope on Hinode. SDO is the first mission in a NASA science program called Living With a Star, the goal of which is to develop the scientific understanding necessary to address those aspects of the sun-Earth system that directly affect our lives and society. NASA Goddard built, operates, and manages the SDO spacecraft for NASA's Science Mission Directorate in Washington. To learn more go to: <a href="http://www.nasa.gov/mission_pages/sdo/news/news20110106-spicules.html" rel="nofollow">www.nasa.gov/mission_pages/sdo/news/news20110106-spicules...</a> Credit: NASA Goddard/SDO/AIA <b><a href="http://www.nasa.gov/centers/goddard/home/index.html" rel="nofollow">NASA Goddard Space Flight Center</a></b> enables NASA’s mission through four scientific endeavors: Earth Science, Heliophysics, Solar System Exploration, and Astrophysics. Goddard plays a leading role in NASA’s accomplishments by contributing compelling scientific knowledge to advance the Agency’s mission. <b>Follow us on <a href="http://twitter.com/NASA_GoddardPix" rel="nofollow">Twitter</a></b> <b>Join us on <a href="http://www.facebook.com/pages/Greenbelt-MD/NASA-Goddard/395013845897?ref=tsd" rel="nofollow">Facebook</a></b>

A transmission spectrum made from a single observation using Webb’s Near-Infrared Imager and Slitless Spectrograph (NIRISS) reveals atmospheric characteristics of the hot gas giant exoplanet WASP-96 b. A transmission spectrum is made by comparing starlight filtered through a planet’s atmosphere as it moves across the star, to the unfiltered starlight detected when the planet is beside the star. Each of the 141 data points (white circles) on this graph represents the amount of a specific wavelength of light that is blocked by the planet and absorbed by its atmosphere. In this observation, the wavelengths detected by NIRISS range from 0.6 microns (red) to 2.8 microns (in the near-infrared). The amount of starlight blocked ranges from about 13,600 parts per million (1.36 percent) to 14,700 parts per million (1.47 percent). Researchers are able to detect and measure the abundances of key gases in a planet’s atmosphere based on the absorption pattern – the locations and heights of peaks on the graph: each gas has a characteristic set of wavelengths that it absorbs. The temperature of the atmosphere can be calculated based in part on the height of the peaks: a hotter planet has taller peaks. Other characteristics, like the presence of haze and clouds, can be inferred based on the overall shape of different portions of the spectrum. The gray lines extending above and below each data point are error bars that show the uncertainty of each measurement, or the reasonable range of actual possible values. For a single observation, the error on these measurements is remarkably small. The blue line is a best-fit model that takes into account the data, the known properties of WASP-96 b and its star (e.g., size, mass, temperature), and assumed characteristics of the atmosphere. Researchers can vary the parameters in the model – changing unknown characteristics like cloud height in the atmosphere and abundances of various gases – to get a better fit and further understand what the atmosphere is really like. The difference between the best-fit model shown here and the data simply reflects the additional work to be done in analyzing and interpreting the data and the planet. Although full analysis of the spectrum will take additional time, it is possible to draw a number of preliminary conclusions. The labeled peaks in the spectrum indicate the presence of water vapor. The height of the water peaks, which is less than expected based on previous observations, is evidence for the presence of clouds that suppress the water vapor features. The gradual downward slope of the left side of the spectrum (shorter wavelengths) is indicative of possible haze. The height of the peaks along with other characteristics of the spectrum is used to calculate an atmospheric temperature of about 1350°F (725°C). This is the most detailed infrared exoplanet transmission spectrum ever collected, the first transmission spectrum that includes wavelengths longer than 1.6 microns with such high resolution and accuracy, and the first to cover the entire wavelength range from 0.6 microns (visible red light) to 2.8 microns (near-infrared) in a single shot. The speed with which researchers have been able to make confident interpretations of the spectrum is further testament to the quality of the data. The observation was made using NIRISS’s Single-Object Slitless Spectroscopy (SOSS) mode, which involves capturing the spectrum of a single bright object, like the star WASP-96, in a field of view. WASP-96 b is a hot gas giant exoplanet that orbits a Sun-like star roughly 1,150 light-years away, in the constellation Phoenix. The planet orbits extremely close to its star (less than 1/20th the distance between Earth and the Sun) and completes one orbit in less than 3½ Earth-days. The planet’s discovery, based on ground-based observations, was announced in 2014. The star, WASP-96, is somewhat older than the Sun, but is about the same size, mass, temperature, and color. The background illustration of WASP-96 b and its star is based on current understanding of the planet from both NIRISS spectroscopy and previous ground- and space-based observations. Webb has not captured a direct image of the planet or its atmosphere. NIRISS was contributed by the Canadian Space Agency. The instrument was designed and built by Honeywell in collaboration with the Université de Montréal and the National Research Council Canada.

This image depicts a vast canyon of dust and gas in the Orion Nebula from a 3-D computer model based on observations by NASA's Hubble Space Telescope and created by science visualization specialists at the Space Telescope Science Institute (STScI) in Baltimore, Md. A 3-D visualization of this model takes viewers on an amazing four-minute voyage through the 15-light-year-wide canyon. Credit: NASA, G. Bacon, L. Frattare, Z. Levay, and F. Summers (STScI/AURA) Go here to learn more about Hubble 3D: <a href="http://www.nasa.gov/topics/universe/features/hubble_imax_premiere.html" rel="nofollow">www.nasa.gov/topics/universe/features/hubble_imax_premier...</a> or <a href="http://www.imax.com/hubble/" rel="nofollow">www.imax.com/hubble/</a> Take an exhilarating ride through the Orion Nebula, a vast star-making factory 1,500 light-years away. Swoop through Orion's giant canyon of gas and dust. Fly past behemoth stars whose brilliant light illuminates and energizes the entire cloudy region. Zoom by dusty tadpole-shaped objects that are fledgling solar systems. This virtual space journey isn't the latest video game but one of several groundbreaking astronomy visualizations created by specialists at the Space Telescope Science Institute (STScI) in Baltimore, the science operations center for NASA's Hubble Space Telescope. The cinematic space odysseys are part of the new Imax film "Hubble 3D," which opens today at select Imax theaters worldwide. The 43-minute movie chronicles the 20-year life of Hubble and includes highlights from the May 2009 servicing mission to the Earth-orbiting observatory, with footage taken by the astronauts. The giant-screen film showcases some of Hubble's breathtaking iconic pictures, such as the Eagle Nebula's "Pillars of Creation," as well as stunning views taken by the newly installed Wide Field Camera 3. While Hubble pictures of celestial objects are awe-inspiring, they are flat 2-D photographs. For this film, those 2-D images have been converted into 3-D environments, giving the audience the impression they are space travelers taking a tour of Hubble's most popular targets. "A large-format movie is a truly immersive experience," says Frank Summers, an STScI astronomer and science visualization specialist who led the team that developed the movie visualizations. The team labored for nine months, working on four visualization sequences that comprise about 12 minutes of the movie. "Seeing these Hubble images in 3-D, you feel like you are flying through space and not just looking at picture postcards," Summers continued. "The spacescapes are all based on Hubble images and data, though some artistic license is necessary to produce the full depth of field needed for 3-D." The most ambitious sequence is a four-minute voyage through the Orion Nebula's gas-and-dust canyon, about 15 light-years across. During the ride, viewers will see bright and dark, gaseous clouds; thousands of stars, including a grouping of bright, hefty stars called the Trapezium; and embryonic planetary systems. The tour ends with a detailed look at a young circumstellar disk, which is much like the structure from which our solar system formed 4.5 billion years ago. Based on a Hubble image of Orion released in 2006, the visualization was a collaborative effort between science visualization specialists at STScI, including Greg Bacon, who sculpted the Orion Nebula digital model, with input from STScI astronomer Massimo Roberto; the National Center for Supercomputing Applications at the University of Illinois at Urbana-Champaign; and the Spitzer Science Center at the California Institute of Technology in Pasadena. For some of the sequences, STScI imaging specialists developed new techniques for transforming the 2-D Hubble images into 3-D. STScI image processing specialists Lisa Frattare and Zolt Levay, for example, created methods of splitting a giant gaseous pillar in the Carina Nebula into multiple layers to produce a 3-D effect, giving the structure depth. The Carina Nebula is a nursery for baby stars. Frattare painstakingly removed the thousands of stars in the image so that Levay could separate the gaseous layers on the isolated Carina pillar. Frattare then replaced the stars into both foreground and background layers to complete the 3-D model. For added effect, the same separation was done for both visible and infrared Hubble images, allowing the film to cross-fade between wavelength views in 3-D. In another sequence viewers fly into a field of 170,000 stars in the giant star cluster Omega Centauri. STScI astronomer Jay Anderson used his stellar database to create a synthetic star field in 3-D that matches recent razor-sharp Hubble photos. The film's final four-minute sequence takes viewers on a voyage from our Milky Way Galaxy past many of Hubble's best galaxy shots and deep into space. Some 15,000 galaxies from Hubble's deepest surveys stretch billions of light-years across the universe in a 3-D sequence created by STScI astronomers and visualizers. The view dissolves into a cobweb that traces the universe's large-scale structure, the backbone from which galaxies were born. In addition to creating visualizations, STScI's education group also provided guidance on the "Hubble 3D" Educator Guide, which includes standards-based lesson plans and activities about Hubble and its mission. Students will use the guide before or after seeing the movie. "The guide will enhance the movie experience for students and extend the movie into classrooms," says Bonnie Eisenhamer, STScI's Hubble Formal Education manager. The Hubble Space Telescope is a project of international cooperation between NASA and the European Space Agency (ESA) and is managed by NASA’s Goddard Space Flight Center (GSFC) in Greenbelt, Md. The Space Telescope Science Institute (STScI) conducts Hubble science operations. The institute is operated for NASA by the Association of Universities for Research in Astronomy, Inc., Washington, D.C.