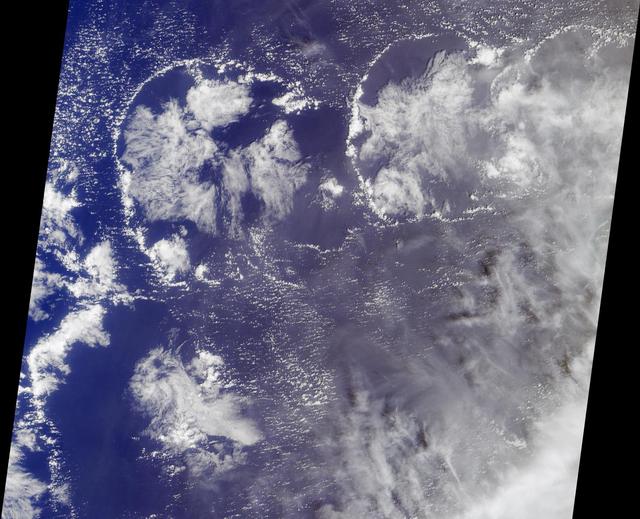
The image was acquired by NASA Terra satellite on March 11, 2002, and is centered west of the Marshall Islands. Enewetak Atoll is discernible through thin cloud as the turquoise band near the right-hand edge of the image.

The Titusville High School band parades ahead of space shuttle Atlantis as it makes its way to its new home at the Kennedy Space Center Visitor Complex, early Friday, Nov. 2, 2012, in Cape Canaveral, Fla. The spacecraft traveled 125,935,769 miles during 33 spaceflights, including 12 missions to the International Space Station. Its final flight, STS-135, closed out the Space Shuttle Program era with a landing on July 21, 2011. Photo Credit: (NASA/Bill Ingalls)
The NISAR mission is a collaboration between NASA and the Indian Space Research Organization (ISRO) that will use two kinds of synthetic aperture radar (SAR) to track subtle changes in Earth's surface: S-band SAR and L-band SAR. (The "S" and "L" denote the wavelength of their signal.) On March 19, 2021, the assembly, test, and launch team at NASA's Jet Propulsion Laboratory in Southern California received the S-band SAR from its partner in India. NISAR, short for NASA-ISRO SAR, will spot warning signs of imminent volcanic eruptions, help to monitor groundwater supplies, track the melt rate of ice sheets tied to sea level rise, and observe shifts in the distribution of vegetation around the world. Movie available at https://photojournal.jpl.nasa.gov/catalog/PIA24137
On March 20, 2021, members of the NISAR mission at NASA's Jet Propulsion Laboratory in Southern California received the S-band synthetic aperture radar (SAR) from their partner in India. Together with the L-band SAR provided by JPL, the two radars serve as the beating heart of the mission (the "S" and "L" denote the wavelength of the signal they transmit). A collaboration between NASA and the Indian Space Research Organization (ISRO), NISAR (short for NASA-ISRO SAR) will use SAR to track subtle changes in Earth's surface. In doing so, it will spot warning signs of imminent volcanic eruptions, help to monitor groundwater supplies, track the melt rate of ice sheets tied to sea level rise, and observe shifts in the distribution of vegetation around the world. https://photojournal.jpl.nasa.gov/catalog/PIA24138

The pattern on the right half of this image of the Bay of Bengal is the result of two opposing wave trains colliding. This ASTER sub-scene, acquired on March 29, 2000, covers an area 18 kilometers (13 miles) wide and 15 kilometers (9 miles) long in three bands of the reflected visible and infrared wavelength region. The visible and near-infrared bands highlight surface waves due to specular reflection of sunlight off of the wave faces. http://photojournal.jpl.nasa.gov/catalog/PIA02662
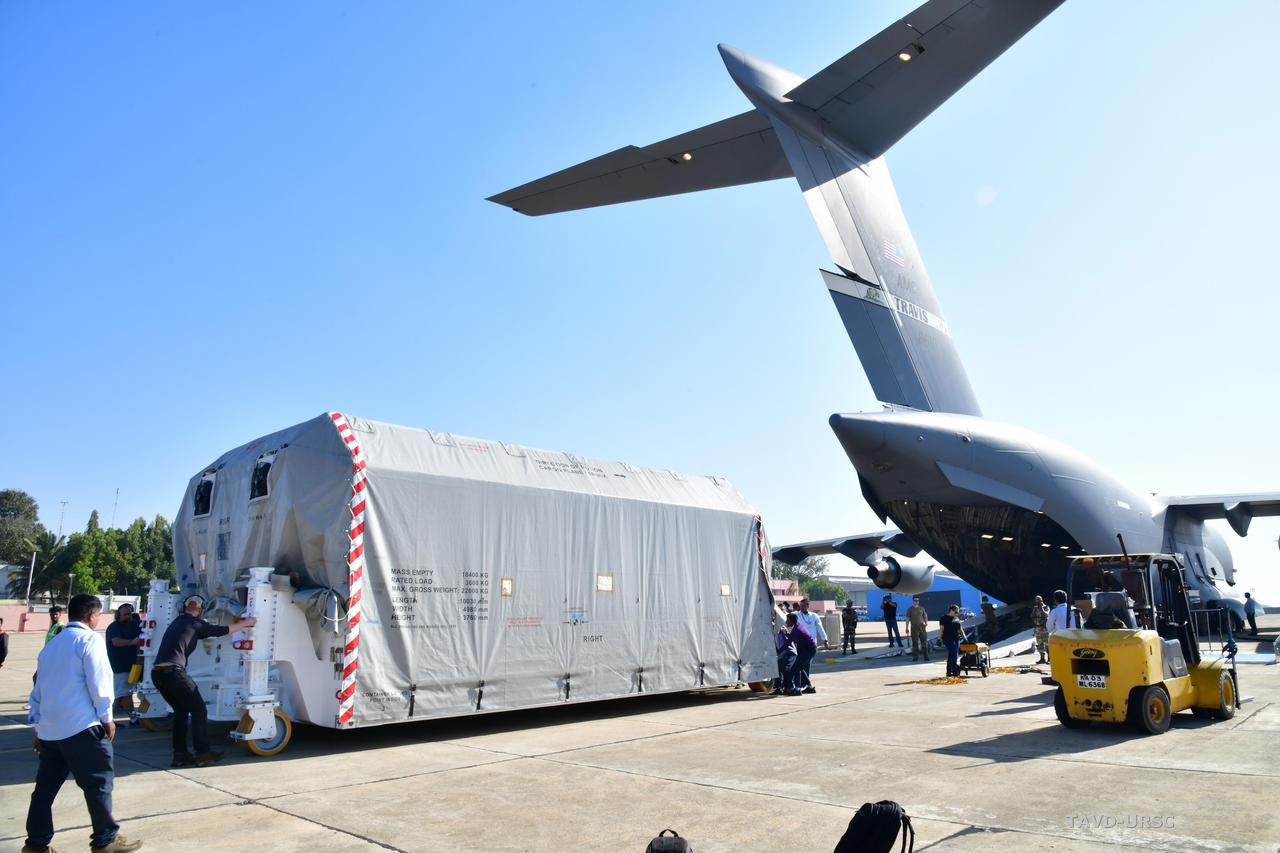
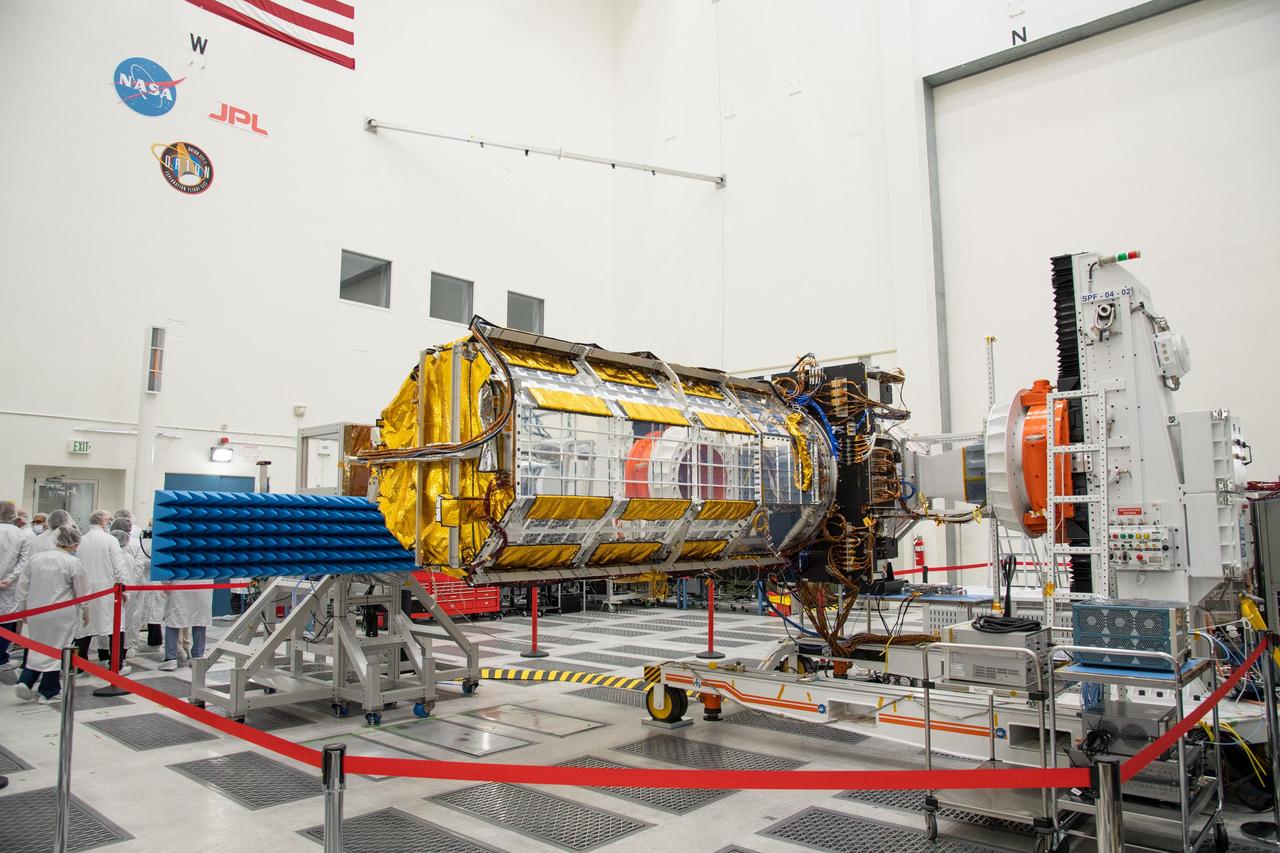
The NASA-ISRO Synthetic Aperture Radar (NISAR) science instrument payload, housed in a specially designed shipping container, sits at Hindustan Aeronautics Limited Airport in Bengaluru, India. The payload left NASA's Jet Propulsion Laboratory in Southern California on Feb. 28, and departed the United States on March 3 aboard a U.S. Air Force cargo plane, arriving in Bengaluru on March 6. From there it was transported to the Indian Space Research Organisation's U R Rao Satellite Centre, where it will be integrated with the satellite body, or bus, and undergo further testing leading up to launch in 2024. The NISAR mission – a joint effort between NASA and the Indian Space Research Organisation – will observe nearly all the planet's land and ice surfaces twice every 12 days, measuring movements in extremely fine detail. It will also survey forests and agricultural regions to understand carbon exchange between plants and the atmosphere. NISAR's science payload will be the most advanced radar system ever launched as part of a NASA mission, and it will feature the largest-ever radar antenna of its kind: a drum-shaped, wire mesh reflector nearly 40 feet (12 meters) in diameter that will extend from a 30-foot (9-meter) boom. The mission's science instruments consist of L- and S-band radar, so named to indicate the wavelengths of their signals. ISRO built the S-band radar, which it shipped to JPL in March 2021. Engineers spent much of the last two years integrating the instrument with the JPL-built L-band system, then conducting tests to verify they work well together. JPL, which is managed for NASA by Caltech in Pasadena, leads the U.S. component of NISAR. In addition to the L-band radar, NASA is also providing the radar reflector antenna, the deployable boom, a high-rate communication subsystem for science data, GPS receivers, a solid-state recorder, and payload data subsystem. In addition to the S-band radar, ISRO is providing the spacecraft bus, the launch vehicle, and associated launch services and satellite mission operations. https://photojournal.jpl.nasa.gov/catalog/PIA25570
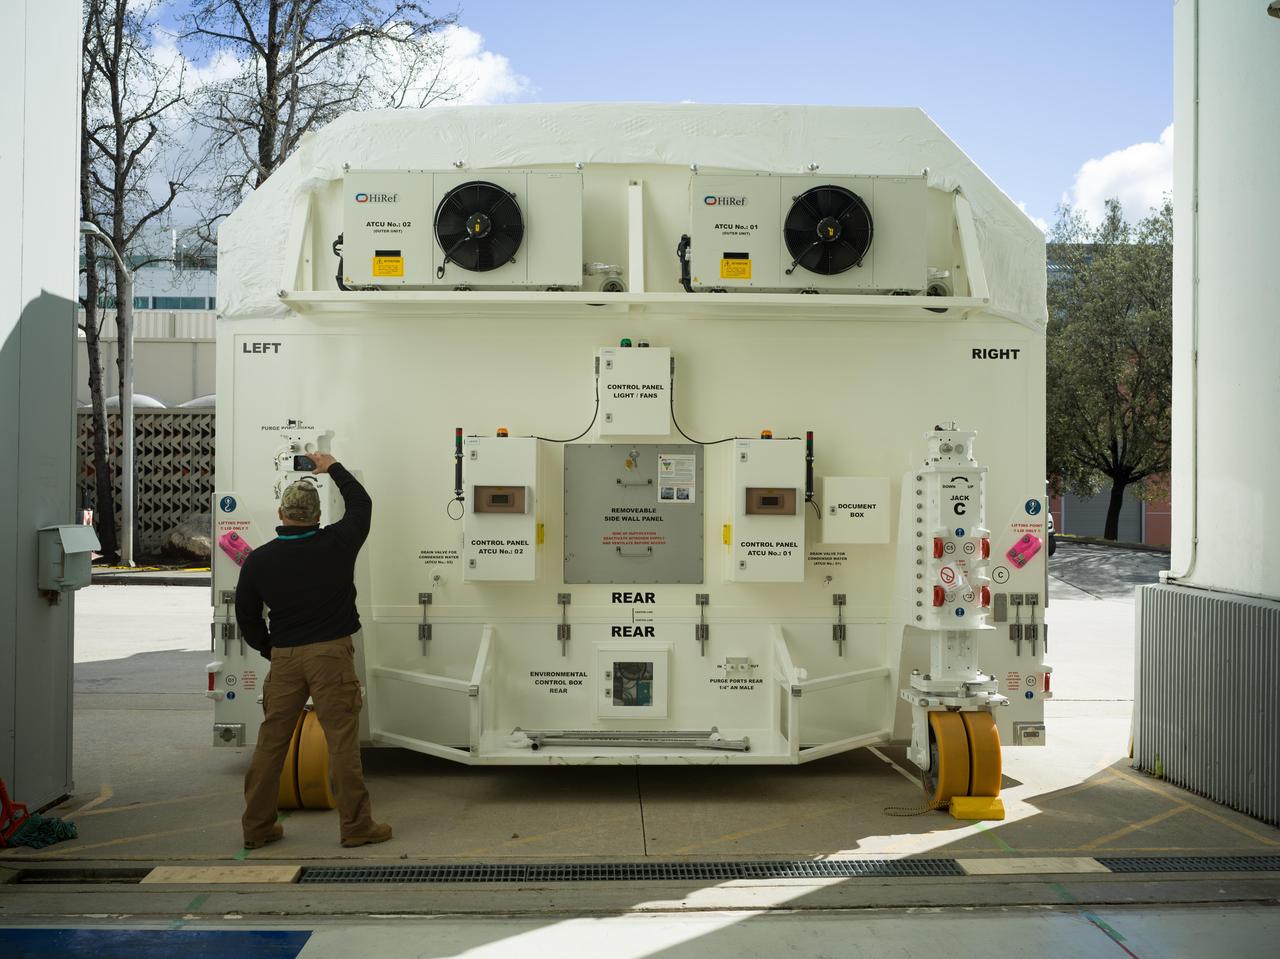
A specially designed, climate-controlled shipping container holding the NASA-ISRO Synthetic Aperture Radar (NISAR) science instrument payload sits outside an airlock at the Spacecraft Assembly Facility at NASA's Jet Propulsion Laboratory on Feb. 26, 2023. The payload was shipped to Bengaluru, India, on March 3, arriving on March 6. There it will be integrated with the satellite body, or bus, and undergo further testing leading up to launch in 2024. The NISAR mission – a joint effort between NASA and the Indian Space Research Organisation – will observe nearly all the planet's land and ice surfaces twice every 12 days, measuring movements in extremely fine detail. It will also survey forests and agricultural regions to understand carbon exchange between plants and the atmosphere. NISAR's science payload will be the most advanced radar system ever launched as part of a NASA mission, and it will feature the largest-ever radar antenna of its kind: a drum-shaped, wire mesh reflector nearly 40 feet (12 meters) in diameter that will extend from a 30-foot (9-meter) boom. The mission's science instruments consist of L- and S-band radar, so named to indicate the wavelengths of their signals. ISRO built the S-band radar, which it shipped to JPL in March 2021. Engineers spent much of the last two years integrating the instrument with the JPL-built L-band system, then conducting tests to verify they work well together. JPL, which is managed for NASA by Caltech in Pasadena, leads the U.S. component of NISAR. In addition to the L-band radar, NASA is also providing the radar reflector antenna, the deployable boom, a high-rate communication subsystem for science data, GPS receivers, a solid-state recorder, and payload data subsystem. In addition to the S-band radar, ISRO is providing the spacecraft bus, the launch vehicle, and associated launch services and satellite mission operations. https://photojournal.jpl.nasa.gov/catalog/PIA25568
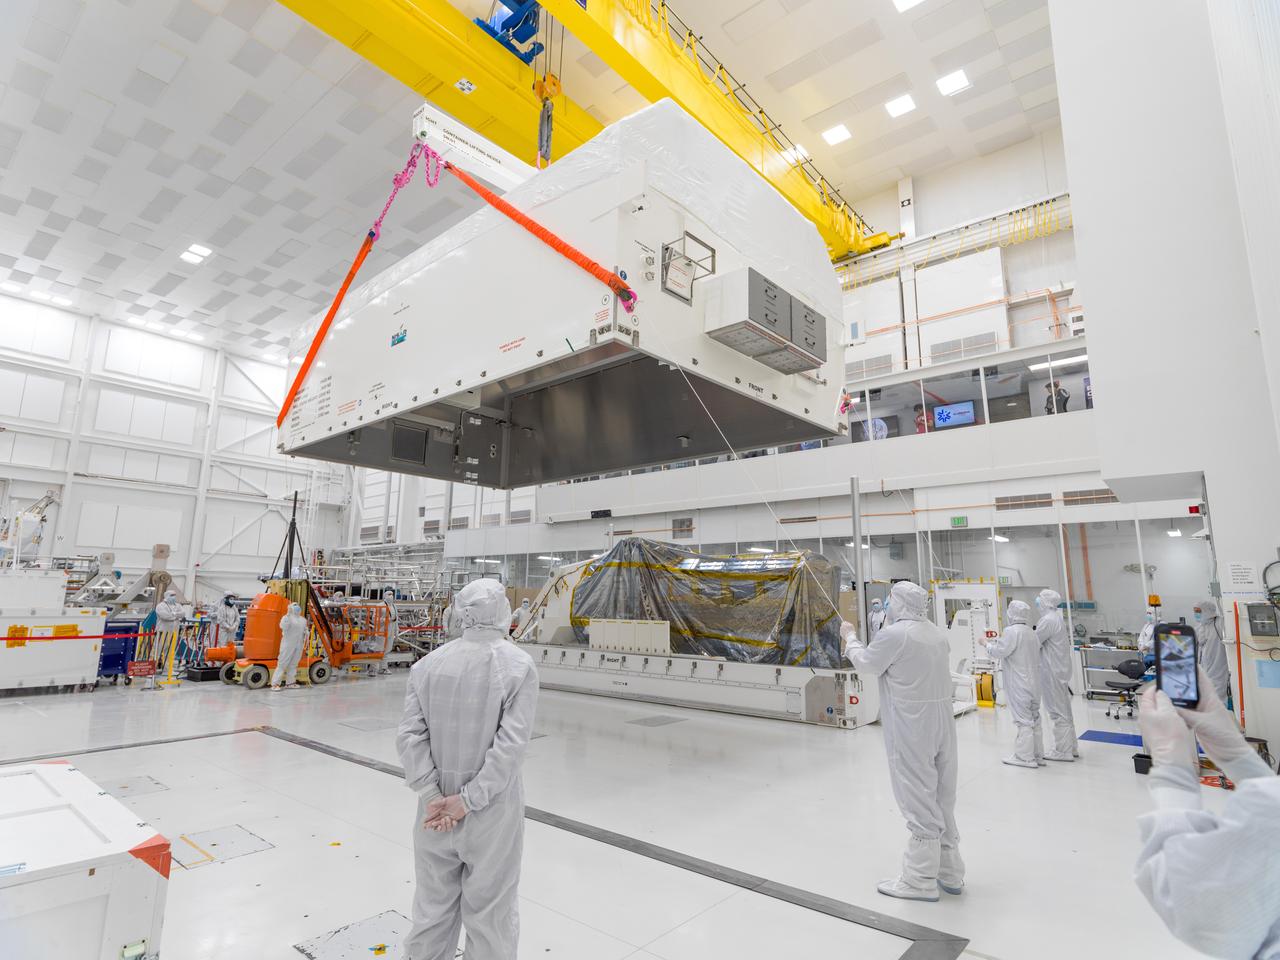
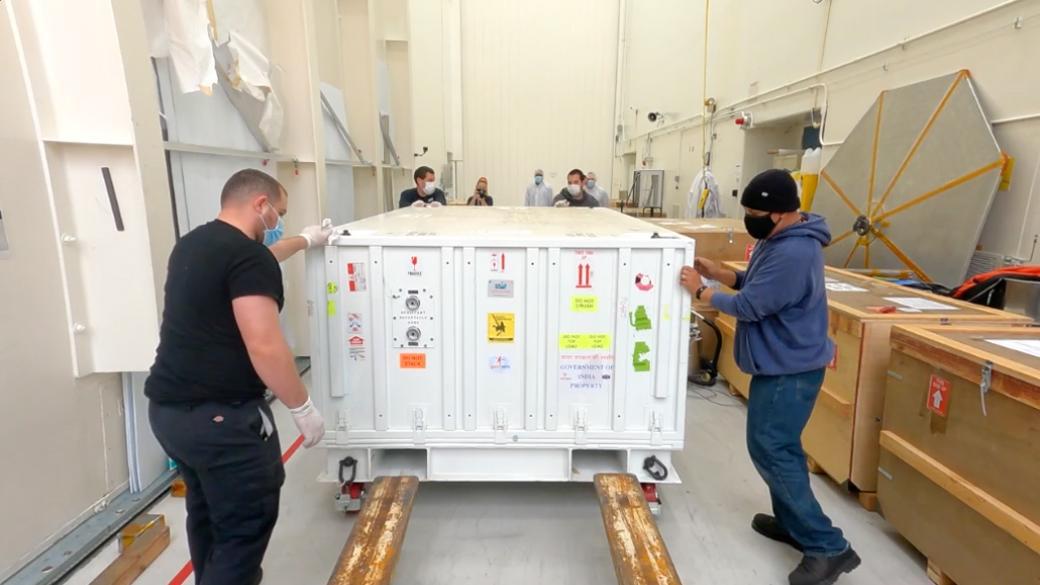
In a clean room at NASA's Jet Propulsion Laboratory on Feb. 23, 2023, engineers and technicians use a crane to prepare to seal a specially designed, climate-controlled shipping container holding the NASA-ISRO Synthetic Aperture Radar (NISAR) science instrument payload. The payload was then shipped to Bengaluru, India, on March 3, arriving on March 6. There it will be integrated with the satellite body, or bus, and undergo further testing leading up to launch in 2024. The NISAR mission – a joint effort between NASA and the Indian Space Research Organisation – will observe nearly all the planet's land and ice surfaces twice every 12 days, measuring movements in extremely fine detail. It will also survey forests and agricultural regions to understand carbon exchange between plants and the atmosphere. NISAR's science payload will be the most advanced radar system ever launched as part of a NASA mission, and it will feature the largest-ever radar antenna of its kind: a drum-shaped, wire mesh reflector nearly 40 feet (12 meters) in diameter that will extend from a 30-foot (9-meter) boom. The mission's science instruments consist of L- and S-band radar, so named to indicate the wavelengths of their signals. ISRO built the S-band radar, which it shipped to JPL in March 2021. Engineers spent much of the last two years integrating the instrument with the JPL-built L-band system, then conducting tests to verify they work well together. JPL, which is managed for NASA by Caltech in Pasadena, leads the U.S. component of NISAR. In addition to the L-band radar, NASA is also providing the radar reflector antenna, the deployable boom, a high-rate communication subsystem for science data, GPS receivers, a solid-state recorder, and payload data subsystem. In addition to the S-band radar, ISRO is providing the spacecraft bus, the launch vehicle, and associated launch services and satellite mission operations. https://photojournal.jpl.nasa.gov/catalog/PIA25567
The NASA-ISRO Synthetic Aperture Radar (NISAR) science instrument payload sits in its specially designed, climate-controlled shipping container in a clean room at NASA's Jet Propulsion Laboratory on Feb. 23, 2023. Engineers and technicians used a crane to lift the payload and mount it vertically onto a stage at the far end of the container before tilting it horizontally. The payload was then shipped to Bengaluru, India, on March 3, arriving on March 6. There it will be integrated with the satellite body, or bus, and undergo further testing leading up to launch in 2024. The NISAR mission – a joint effort between NASA and the Indian Space Research Organisation – will observe nearly all the planet's land and ice surfaces twice every 12 days, measuring movements in extremely fine detail. It will also survey forests and agricultural regions to understand carbon exchange between plants and the atmosphere. NISAR's science payload will be the most advanced radar system ever launched as part of a NASA mission, and it will feature the largest-ever radar antenna of its kind: a drum-shaped, wire mesh reflector nearly 40 feet (12 meters) in diameter that will extend from a 30-foot (9-meter) boom. The mission's science instruments consist of L- and S-band radar, so named to indicate the wavelengths of their signals. ISRO built the S-band radar, which it shipped to JPL in March 2021. Engineers spent much of the last two years integrating the instrument with the JPL-built L-band system, then conducting tests to verify they work well together. JPL, which is managed for NASA by Caltech in Pasadena, leads the U.S. component of NISAR. In addition to the L-band radar, NASA is also providing the radar reflector antenna, the deployable boom, a high-rate communication subsystem for science data, GPS receivers, a solid-state recorder, and payload data subsystem. In addition to the S-band radar, ISRO is providing the spacecraft bus, the launch vehicle, and associated launch services and satellite mission operations. https://photojournal.jpl.nasa.gov/catalog/PIA25566
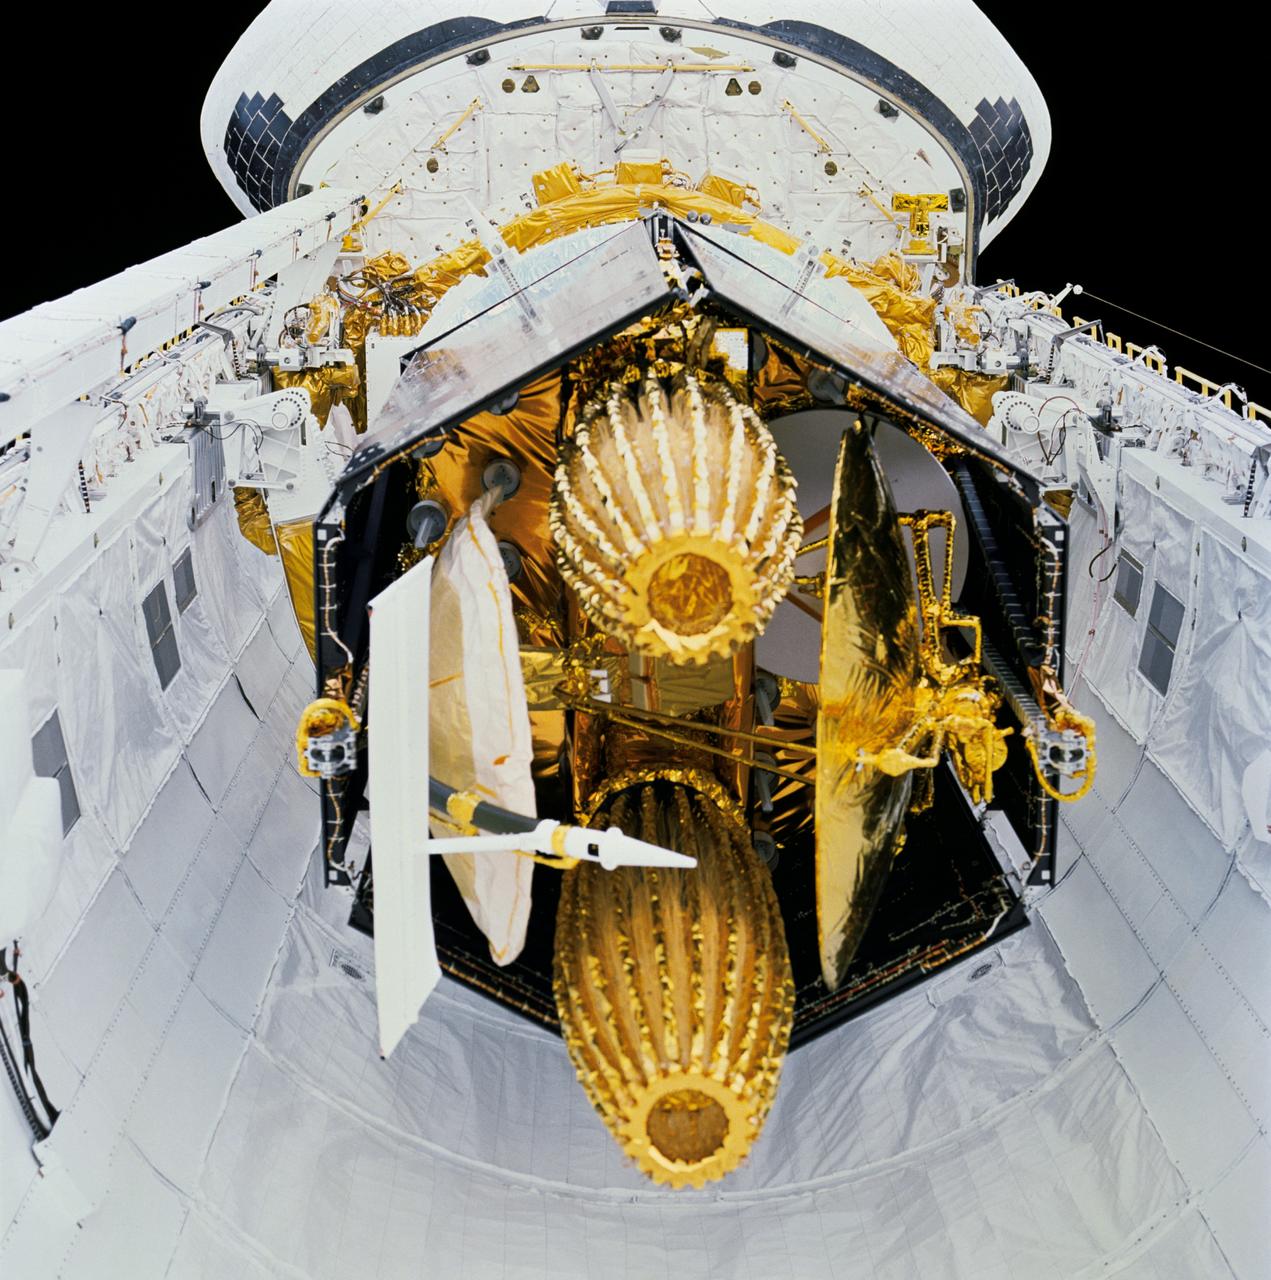
STS029-71-000AE (13-18 March 1989) --- STS-29 onboard view shows Space Shuttle Discovery's payload bay with tracking and data relay satellite D (TDRS-D) in stowed, pre-deployment position. In this head-on view, TDRS-D stowed components including single access #1 and #2, solar cell panels, SGL, S-Band omni antenna, and C-Band antenna are visible. TDRS-D rests in airborne support equipment (ASE) forward cradle and aft frame tilt actuator (AFTA). Discovery's aft bulkhead and orbital maneuvering system (OMS) pods are visible in the background.
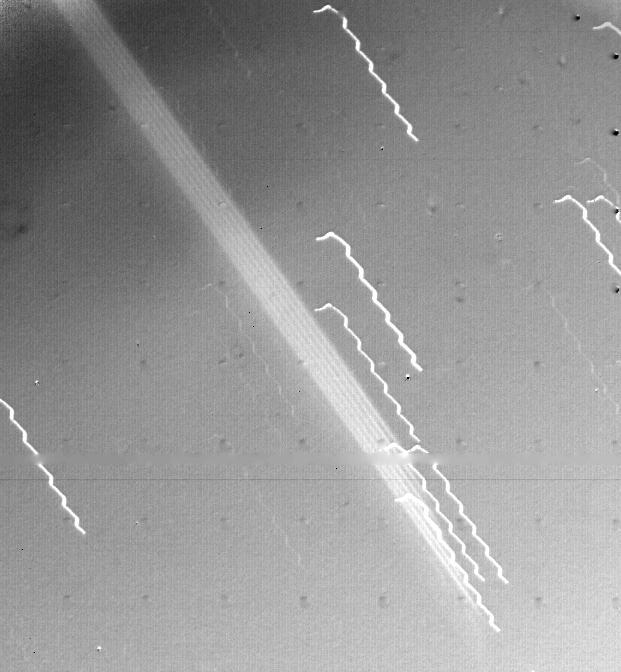
First evidence of a ring around the planet Jupiter is seen in this photograph taken by Voyager 1 on March 4, 1979. The multiple exposure of the extremely thin faint ring appears as a broad light band crossing the center of the picture. The edge of the ring is 1,212,000 km from the spacecraft and 57,000 km from the visible cloud deck of Jupiter. The background stars look like broken hair pins because of spacecraft motion during the 11 minute 12 second exposure. The wavy motion of the star trails is due to the ultra-slow natural oscillation of the spacecraft (with a period of 78 seconds). The black dots are geometric calibration points in the camera. The ring thickness is estimated to be 30 km or less. The photograph was part of a sequence planned to search for such rings in Jupiter's equatorial plane. The ring has been invisible from Earth because of its thinness and its transparency when viewed at any angle except straight on. JPL manages and controls the Voyager Project for NASA's Office of Space Science. http://photojournal.jpl.nasa.gov/catalog/PIA02251

STS109-E-6003 (10 March 2002) --- The astronauts on board the Space Shuttle Columbia took this digital picture featuring a well-defined subtropical cyclone. The view looks southwestward over the Tasman Sea (between Australia and New Zealand). According to meteorologists studying the STS-109 photo collection, such circulations are recognized as hybrids, lacking the tight banding and convection of tropical cyclones, and the strong temperature contrast and frontal boundaries of polar storms. The image was recorded with a digital still camera.

CAPE CANAVERAL, Fla. – In the Shuttle Plaza area at the Kennedy Space Center Visitor Complex in Florida, members of the Titusville High School marching band play music before the start of a Ground Breaking Ceremony for the future home of space shuttle Atlantis. Delaware North Parks & Resorts, in partnership with NASA’s Kennedy Space Center, broke ground for the 65,000 square-foot exhibit that will house Atlantis at the visitor complex. For more information, visit www.KennedySpaceCenter.com. Photo credit: NASA/Jim Grossmann
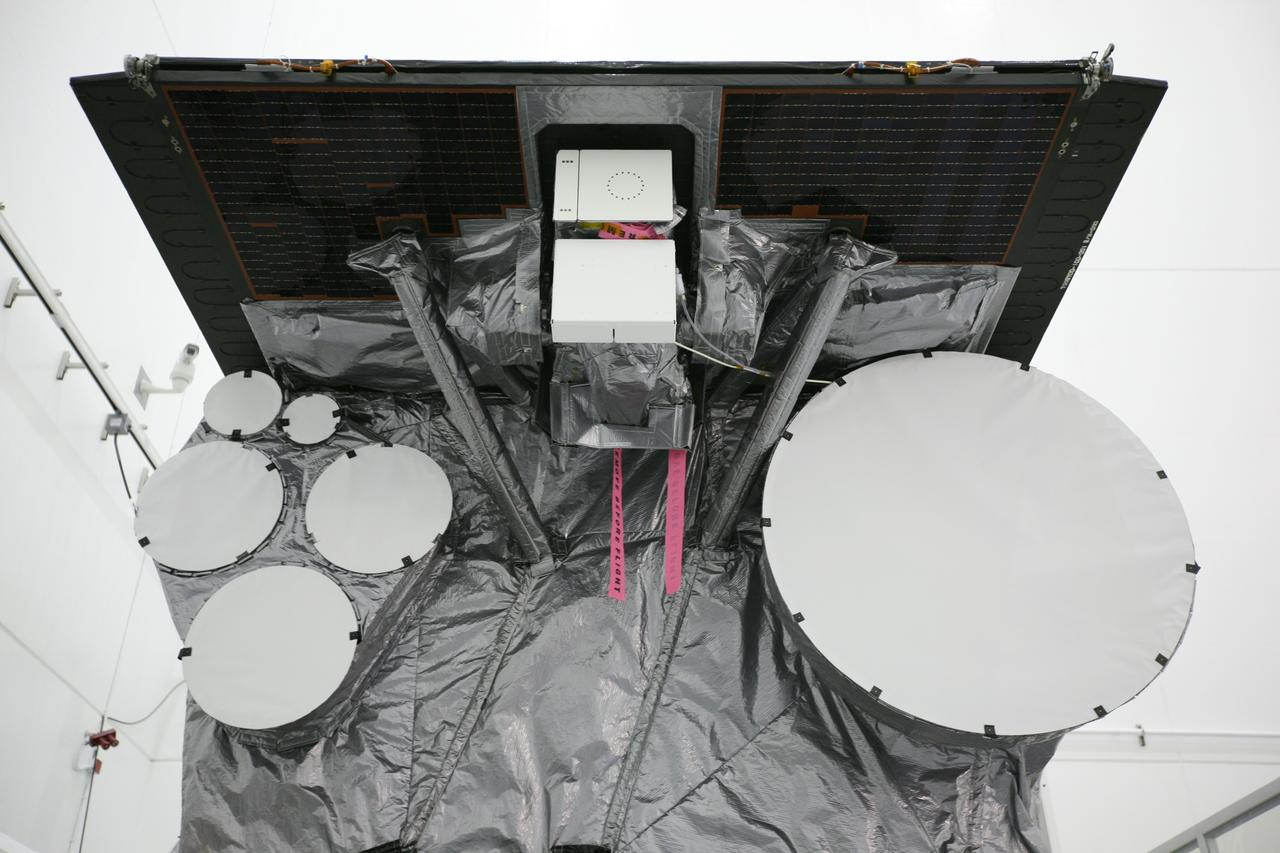
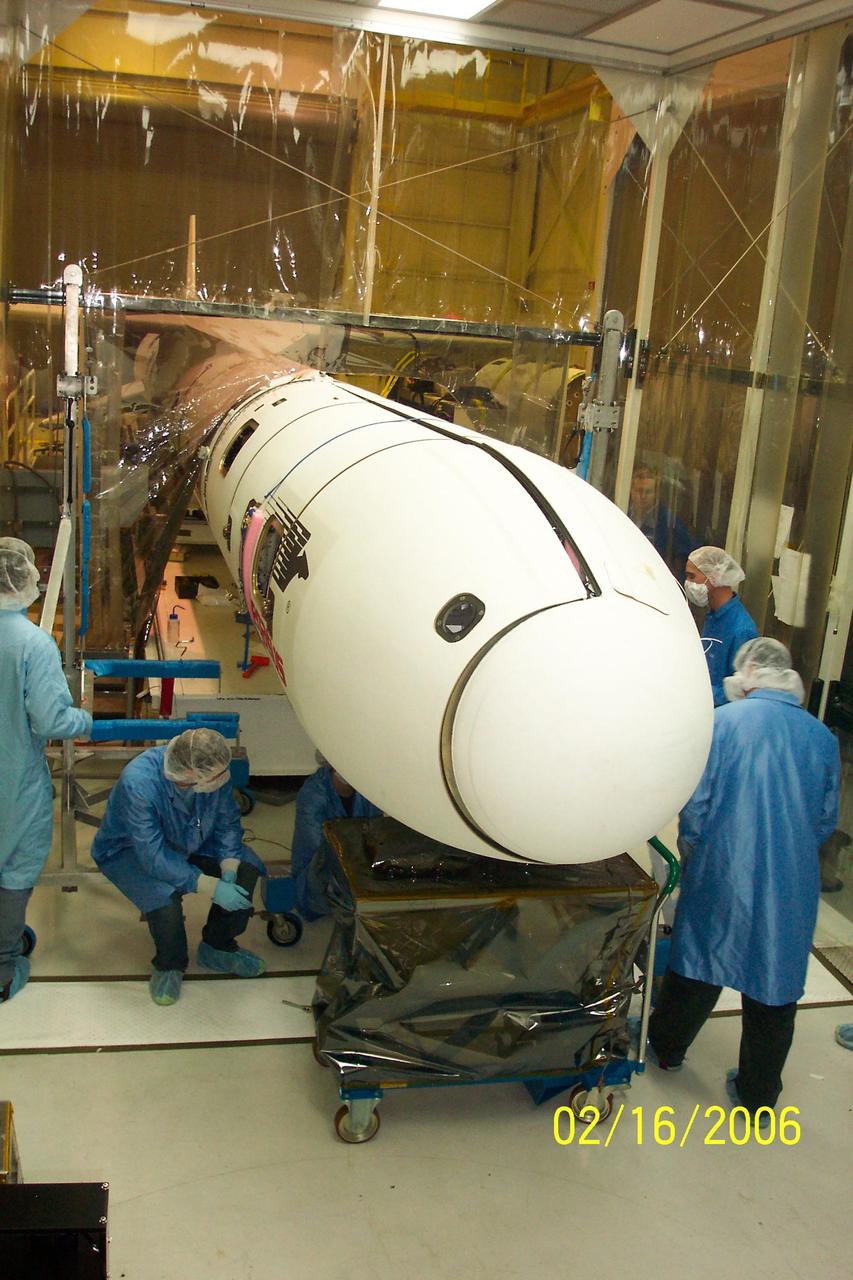
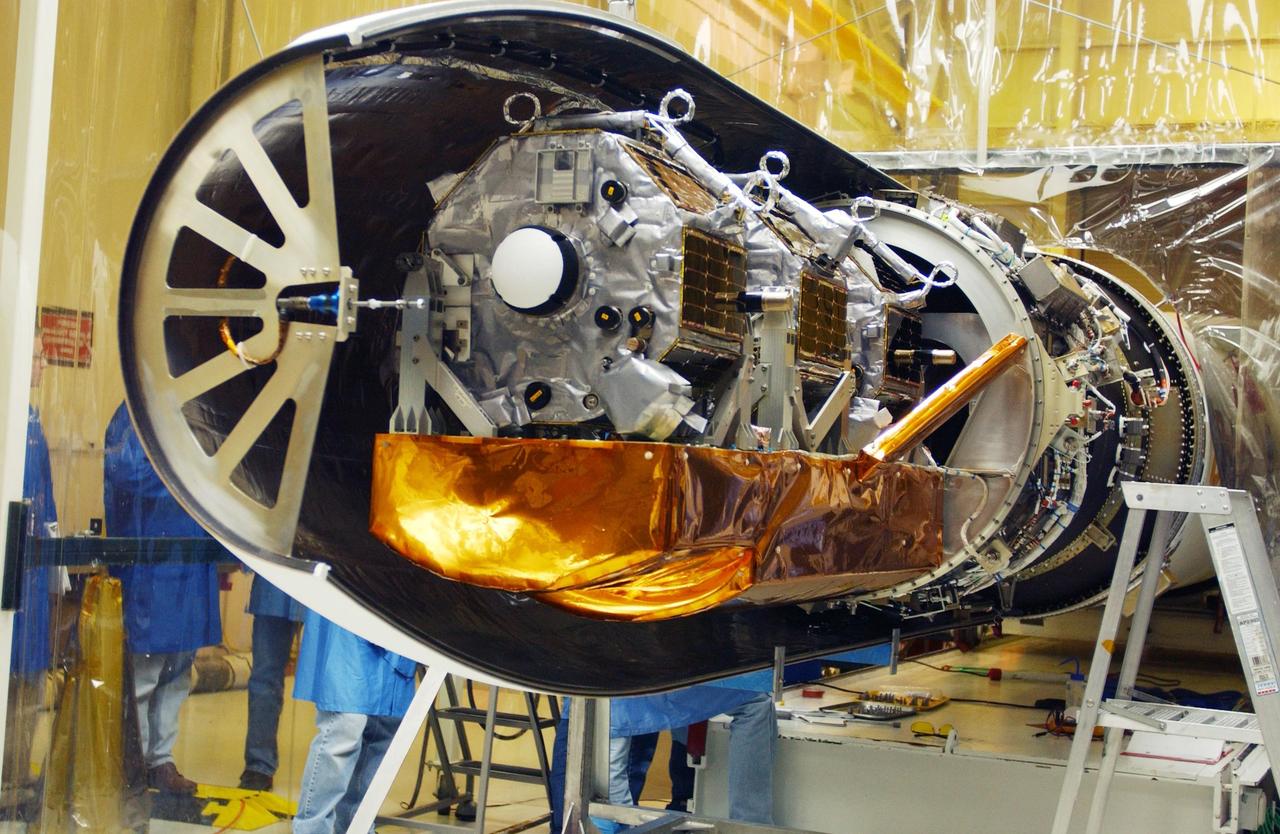
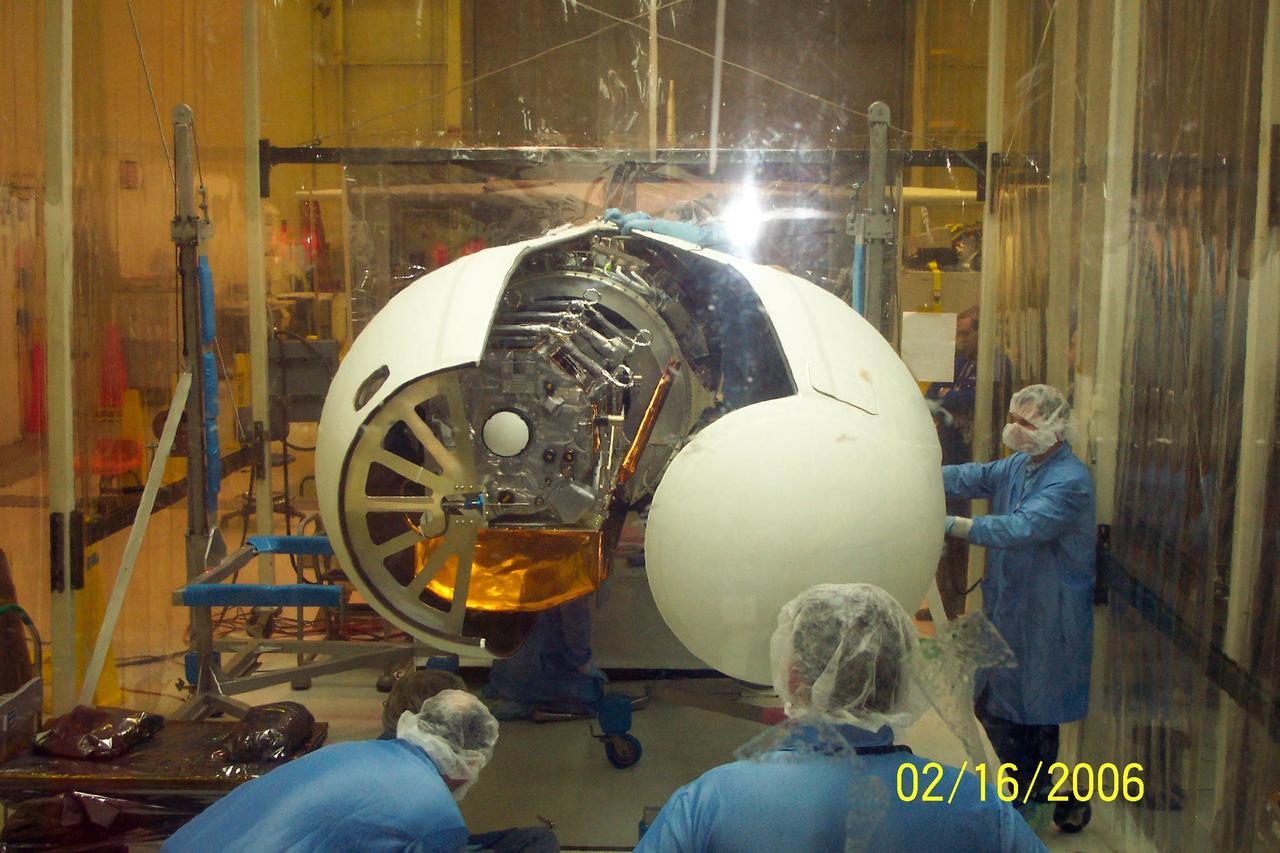
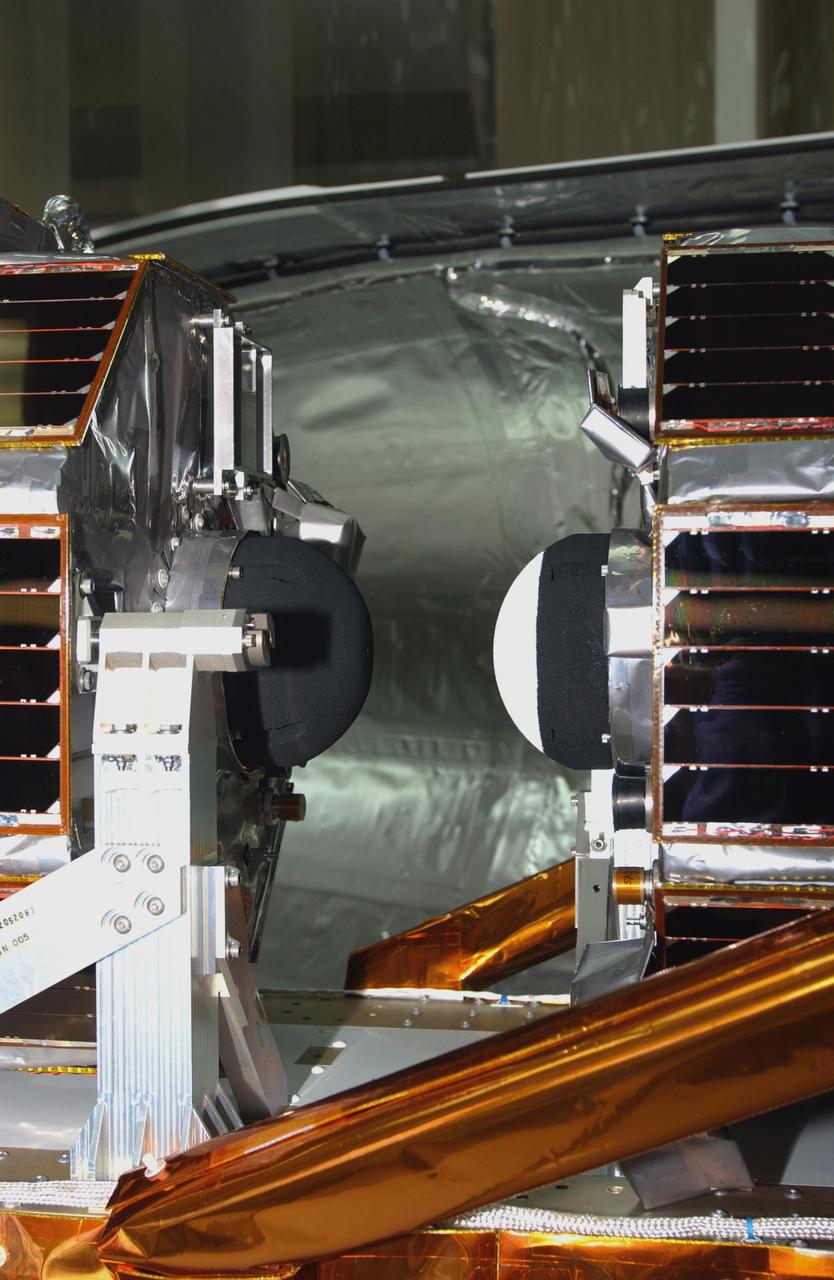
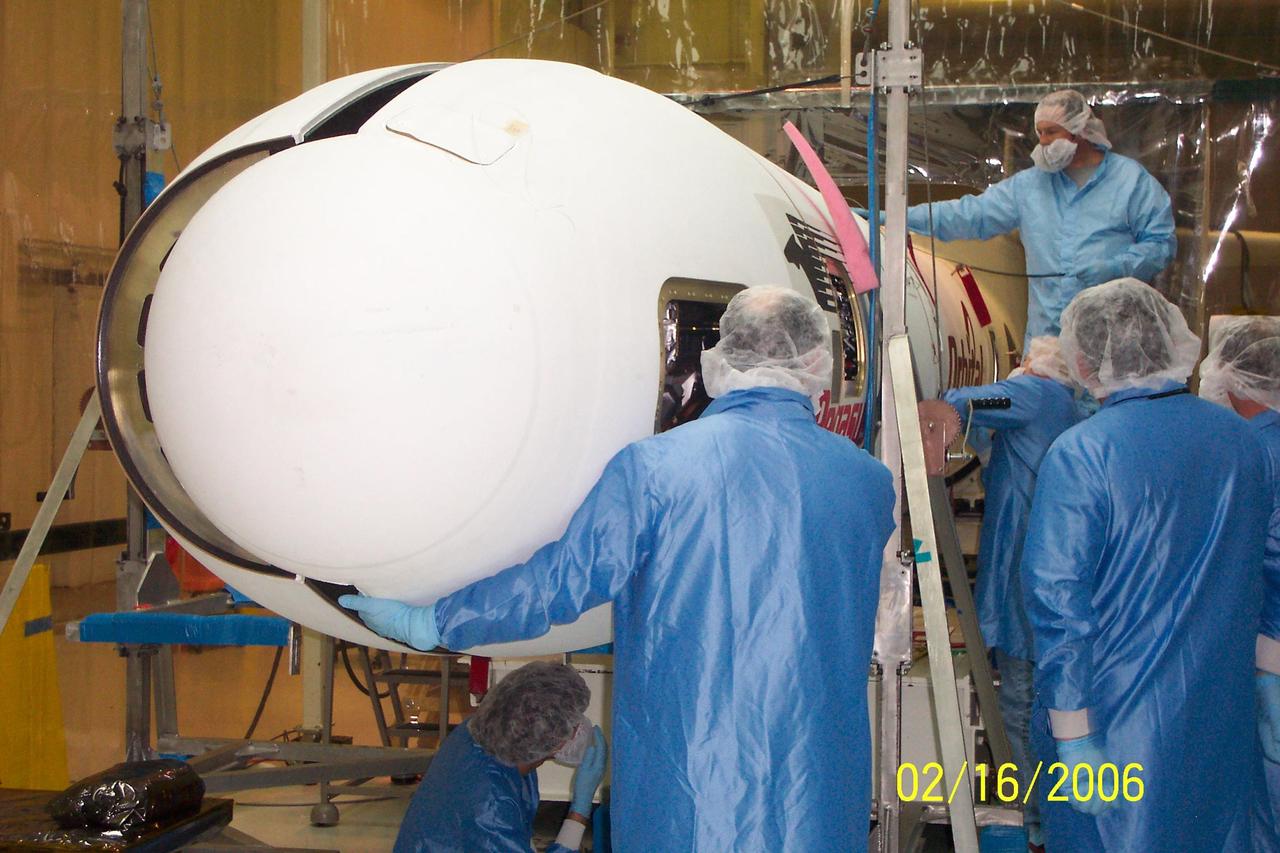
CAPE CANAVERAL, Fla. – At the Astrotech Space Operations facility in Titusville, Fla., the components of NASA's GOES-P meteorological satellite are in view following the spacecraft's unbagging. The cup-shaped objects on the left side of the spacecraft include the S-band and L-band antennas. The large cup-shaped object at right is the ultrahigh frequency, or UHF, antenna. GOES-P, the latest Geostationary Operational Environmental Satellite, was developed by NASA for the National Oceanic and Atmospheric Administration, or NOAA. GOES-P is designed to watch for storm development and observed current weather conditions on Earth. Launch of GOES-P is targeted for no earlier than March 1 from Launch Complex 37 aboard a United Launch Alliance Delta IV rocket. For information on GOES-P, visit http://goespoes.gsfc.nasa.gov/goes/spacecraft/n_p_spacecraft.html. Photo credit: NASA/Amanda Diller

This image of the city of Tokyo was acquired on March 22, 2000 by the Advanced Spaceborne Thermal Emission and Reflection Radiometer (ASTER) on NASA's Terra satellite. With its 14 spectral bands from the visible to the thermal infrared wavelength region, and its high spatial resolution of 15 to 90 meters (about 50 to 300 feet), ASTER will image the Earth for the next 6 years to map and monitor the changing surface of our planet. This false color infrared image covers an area 60 km wide and 75 km long in three bands of the short wavelength infrared region, with a spatial resolution of 15 m. It shows part of the Tokyo metropolitan area extending south to Yokohama; included are the Ginza District, Haneda airport and the Imperial Palace. To the west, Tokyo is hemmed in by mountains, covered with forests (displayed in red); on the southeast, Tokyo Bay is one of the world's great harbors. http://photojournal.jpl.nasa.gov/catalog/PIA02607
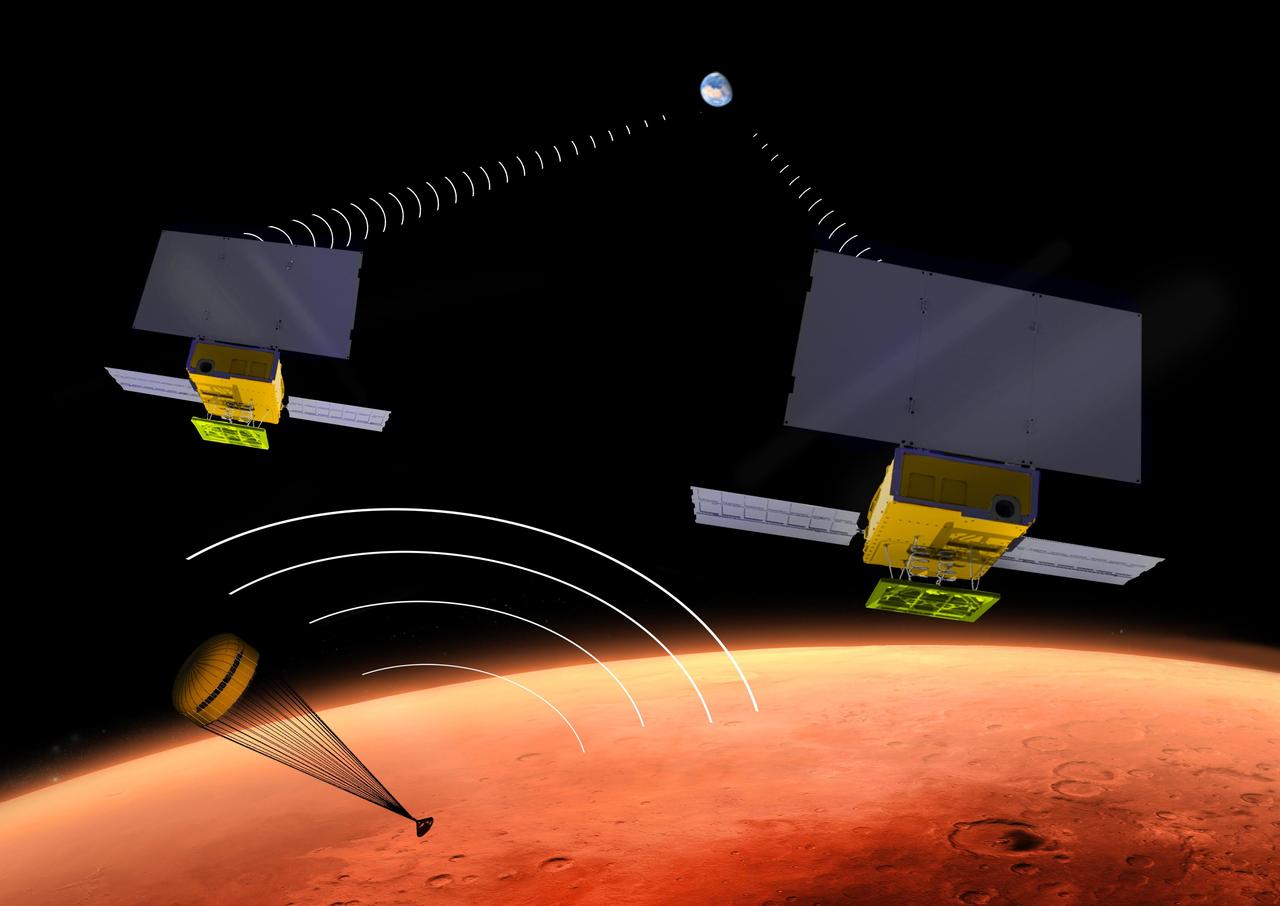
NASA's two MarCO CubeSats will be flying past Mars in September 2016 just as NASA's next Mars lander, InSight, is descending through the Martian atmosphere and landing on the surface. MarCO, for Mars Cube One, will provide an experimental communications relay to inform Earth quickly about the landing. This illustration depicts a moment during the lander's descent when it is transmitting data in the UHF radio band, and the twin MarCO craft are receiving those transmissions while simultaneously relaying the data to Earth in a different radio band. Each of the MarCO twins carries two solar panels for power, and both UHF-band and X-band radio antennas. As a technology demonstration, MarCO could lead to other "bring-your-own-relay" mission designs and also to use of miniature spacecraft for a wide diversity of interplanetary missions. MarCO is the first interplanetary use of CubeSat technologies for small spacecraft. CubeSats are a class of spacecraft based on a standardized small size and modular use of off-the-shelf technologies to streamline development. Many have been made by university students, and dozens have been launched into Earth orbit using extra payload mass available on launches of larger spacecraft. The two briefcase-size MarCO CubeSats will ride along with InSight on an Atlas V launch vehicle lifting off in March 2016 from Vandenberg Air Force Base, California. MarCO is a technology demonstration aspect of the InSight mission and not needed for that mission's success. InSight, an acronym for Interior Exploration using Seismic Investigations, Geodesy and Heat Transport, will investigate the deep interior of Mars to advance understanding of how rocky planets, including Earth, formed and evolved. After launch, the MarCO twins and InSight will be navigated separately to Mars. Note: After thorough examination, NASA managers have decided to suspend the planned March 2016 launch of the Interior Exploration using Seismic Investigations Geodesy and Heat Transport (InSight) mission. The decision follows unsuccessful attempts to repair a leak in a section of the prime instrument in the science payload. http://photojournal.jpl.nasa.gov/catalog/PIA19388
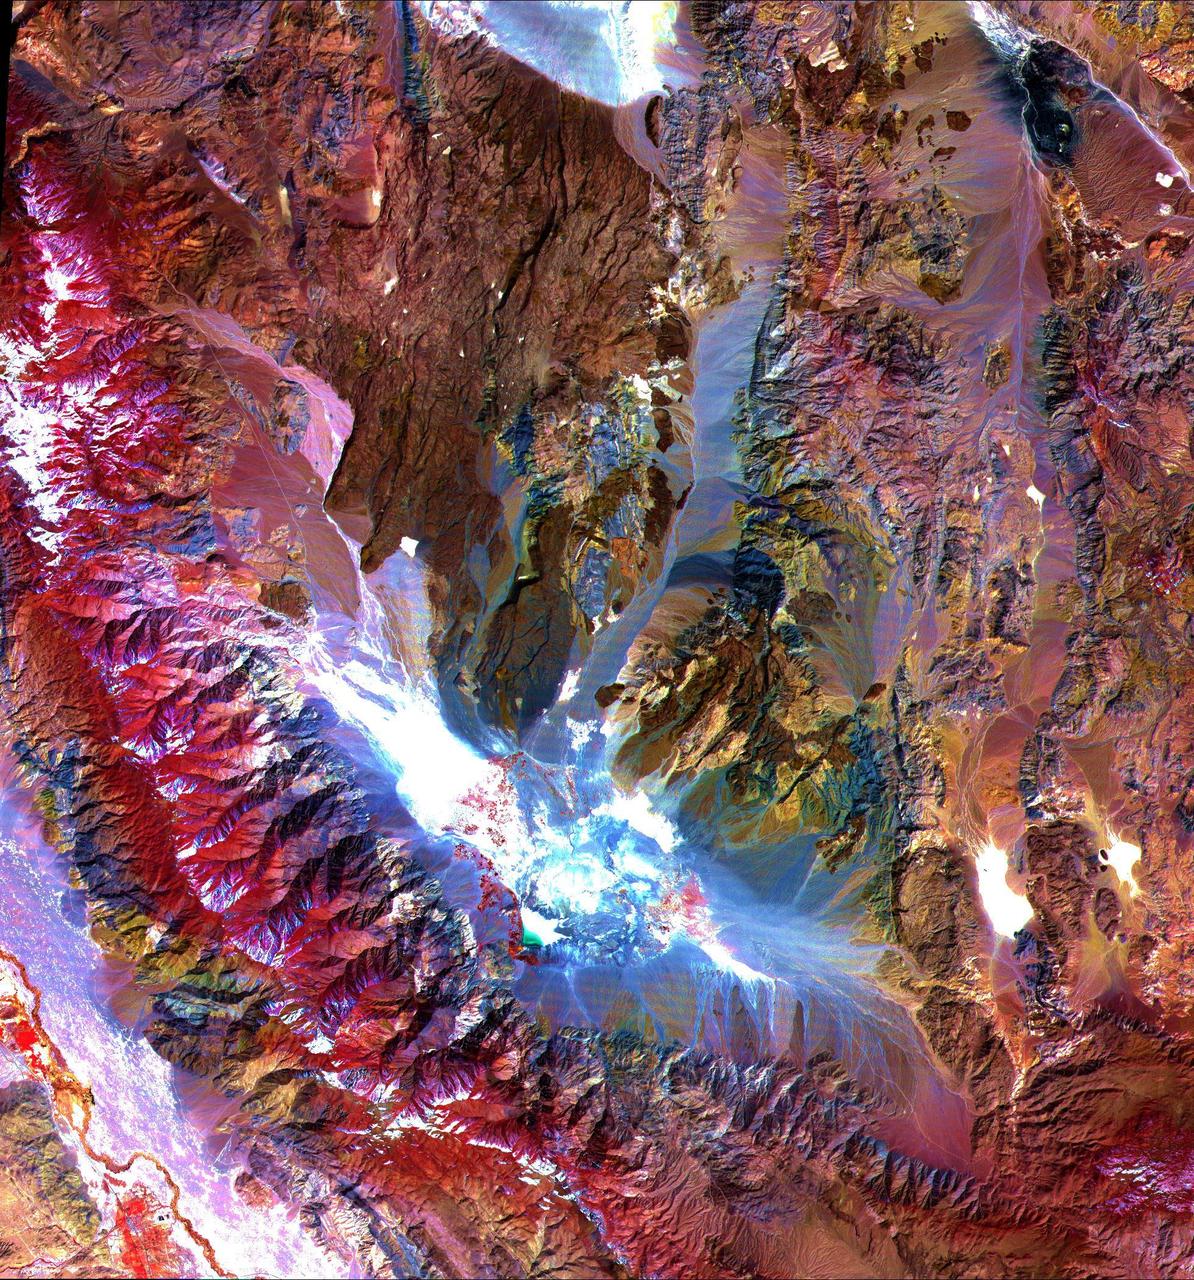
These images of the Saline Valley area, California, were acquired March 30, 2000 and cover a full ASTER scene (60 by 60 km). Each image displays data from a different spectral region, and illustrates the complementary nature of surface compositional information available as a function of wavelength. This image displays visible and near infrared bands 3, 2, and 1 in red, green, and blue (RGB). Vegetation appears red, snow and dry salt lakes are white, and exposed rocks are brown, gray, yellow and blue. Rock colors mainly reflect the presence of iron minerals, and variations in albedo. Figure 1 displays short wavelength infrared bands 4, 6, and 8 as RGB. In this wavelength region, clay, carbonate, and sulfate minerals have diagnostic absorption features, resulting in distinct colors on the image. For example, limestones are yellow-green, and purple areas are kaolinite-rich. Figure 2 displays thermal infrared bands 13, 12 and 10 as RGB. In this wavelength region, variations in quartz content appear as more or less red; carbonate rocks are green, and mafic volcanic rocks are purple. The image is located at 36.8 degrees north latitude and 117.7 degrees west longitude. http://photojournal.jpl.nasa.gov/catalog/PIA11164

These images of the San Francisco Bay region were acquired on March 3, 2000 by the Advanced Spaceborne Thermal Emission and Reflection Radiometer (ASTER) on NASA's Terra satellite. Each covers an area 60 kilometers (37 miles) wide and 75 kilometers (47 miles) long. With its 14 spectral bands from the visible to the thermal infrared wavelength region, and its high spatial resolution of 15 to 90 meters (about 50 to 300 feet), ASTER will image the Earth for the next 6 years to map and monitor the changing surface of our planet. Upper Left: The color infrared composite uses bands in the visible and reflected infrared. Vegetation is red, urban areas are gray; sediment in the bays shows up as lighter shades of blue. Thanks to the 15 meter (50-foot) spatial resolution, shadows of the towers along the Bay Bridge can be seen. Upper right: A composite of bands in the short wave infrared displays differences in soils and rocks in the mountainous areas. Even though these regions appear entirely vegetated in the visible, enough surface shows through openings in the vegetation to allow the ground to be imaged. Lower left: This composite of multispectral thermal bands shows differences in urban materials in varying colors. Separation of materials is due to differences in thermal emission properties, analogous to colors in the visible. Lower right: This is a color coded temperature image of water temperature, derived from the thermal bands. Warm waters are in white and yellow, colder waters are blue. Suisun Bay in the upper right is fed directly from the cold Sacramento River. As the water flows through San Pablo and San Francisco Bays on the way to the Pacific, the waters warm up. http://photojournal.jpl.nasa.gov/catalog/PIA02605

These images show dramatic change in the water at Dongting Lake in Hunan province, China. A flood crest surged down the Yangtze River in late August of this year, but the embankments made by residents there held. The left image was acquired on September 2, 2002 and shows the extent of the lake. The right image was obtained March 19, 2002 before the flooding began. These images were acquired on September 2, 2002 and March 19, 2002 by the Advanced Spaceborne Thermal Emission and Reflection Radiometer (ASTER) on NASA's Terra satellite. With its 14 spectral bands from the visible to the thermal infrared wavelength region, and its high spatial resolution of 15 to 90 meters (about 50 to 300 feet), ASTER will image Earth for the next 6 years to map and monitor the changing surface of our planet. http://photojournal.jpl.nasa.gov/catalog/PIA03858

ISS030-E-126655 (7 March, 2012) --- This photograph, taken by one of the Expedition 30 crew members aboard the International Space Station from approximately 240 miles above the southeastern Tasman Sea, is believed to be the one millionth still image recorded by space station crews. The view, from over a point centered at 46.56 degrees south latitude and 164.33 degrees east longitude, focuses on an area just west of the south end of South Island, New Zealand and was taken about 3:19 a.m. New Zealand time, March 7, 2012. Illumination and the relative motion of features in the overall series of photos suggest that the view is towards the south to southeast with the approaching dawn to the left and a strong band of Aurora Australis, from left to right. A Russian Soyuz and a Russian Progress vehicle are seen center and right in the foreground, respectively.

AS09-26A-3781A (11 March 1969) --- Colored infrared photograph of the mouth of the Colorado River in northern Baja California and Sonora, Mexico, as seen from Apollo 9 spacecraft during its 121st revolution of Earth. Photographed from an altitude of 130 nautical miles, at 16:14 GMT, on March 11, 1969. Color infrared film is designed to render healthy green foliage as tones of red, such as the red checker-board patterns in the irrigated farm lands along the Colorado River. Red hues of vegetation can be seen in the valleys and on the slopes of the San Pedro Martia and Juarez Mountains, at left. White ribbon-like salt lakes near the river mouth and the wide expanse of sand dunes in the Great Desert, at right, are evidence of the arid climate. Light colors of silt bands in the waters of the Gulf of California reflect currents and water depths. The town of San Felipe is on the Gulf coast at lower left.

This is a wide angle view of the martian north polar cap as it appeared to the Mars Global Surveyor (MGS) Mars Orbiter Camera (MOC) in early northern summer. The picture was acquired on March 13, 1999, near the start of the Mapping Phase of the MGS mission. The light-toned surfaces are residual water ice that remains through the summer season. The nearly circular band of dark material surrounding the cap consists mainly of sand dunes formed and shaped by wind. The north polar cap is roughly 1100 kilometers (680 miles) across. http://photojournal.jpl.nasa.gov/catalog/PIA02800

NASA's Cassini spacecraft peers toward a sliver of Saturn's sunlit atmosphere while the icy rings stretch across the foreground as a dark band. This view looks toward the unilluminated side of the rings from about 7 degrees below the ring plane. The image was taken in green light with the Cassini spacecraft wide-angle camera on March 31, 2017. The view was obtained at a distance of approximately 620,000 miles (1 million kilometers) from Saturn. Image scale is 38 miles (61 kilometers) per pixel. https://photojournal.jpl.nasa.gov/catalog/PIA21334

Expedition 26 Commander Scott Kelly wears a blue wrist band that has a peace symbol, a heart and the word "Gabby" to show his love of his sister-in-law U.S. Rep. Gabrielle Giffords as he rest onboard a Russian Search and Rescue helicopter shortly after he and fellow crew members Oleg Skripochka and Alexander Kaleri landed in their Soyuz TMA-01M capsule near the town of Arkalyk, Kazakhstan on Wednesday, March 16, 2011. NASA Astronaut Kelly, Russian Cosmonauts Skripochka and Kaleri are returning from almost six months onboard the International Space Station where they served as members of the Expedition 25 and 26 crews. Photo Credit: (NASA/Bill Ingalls)
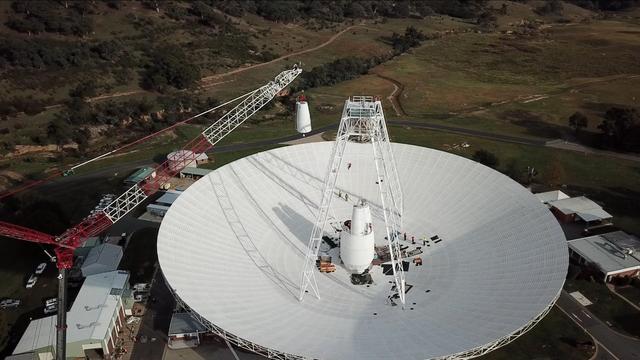
In a delicate operation, a 400-ton crane lifts the new X-band cone into the 70-meter (230-foot) Deep Space Network's Deep Space Station 43 (DSS-43) dish in Canberra, Australia. The new cone houses upgraded receiver and transmitter equipment for the 48-year-old antenna. One of several antennas located at the Canberra site, DSS-43 is the largest and responsible for transmitting commands to NASA's Voyager spacecraft. Since early March 2020, DSS43 has been offline for upgrades, which are expected to continue until January 2021. https://photojournal.jpl.nasa.gov/catalog/PIA23796
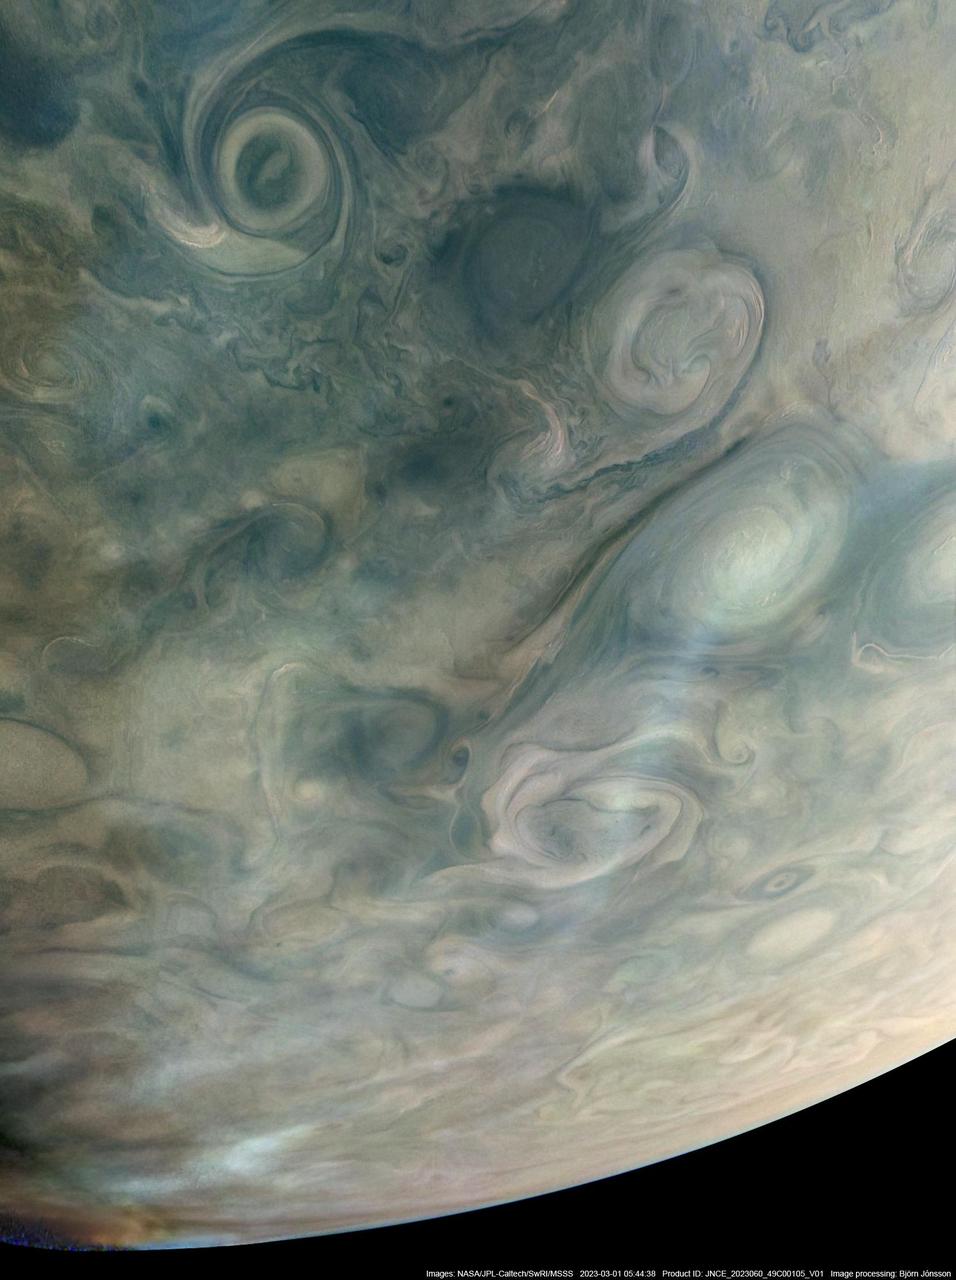
On March 1, 2023, NASA's Juno mission completed its 49th close flyby of Jupiter. As the spacecraft flew low over the giant planet's cloud tops, its JunoCam instrument captured this look at bands of high-altitude haze forming above cyclones in an area known at Jet N7. Citizen scientist Björn Jónsson processed a raw image from the JunoCam instrument, enhancing the contrast and sharpness. At the time the image was taken, Juno was about 5,095 miles (8,200 kilometers) above Jupiter's cloud tops, at a latitude of about 66 degrees. https://photojournal.jpl.nasa.gov/catalog/PIA25725
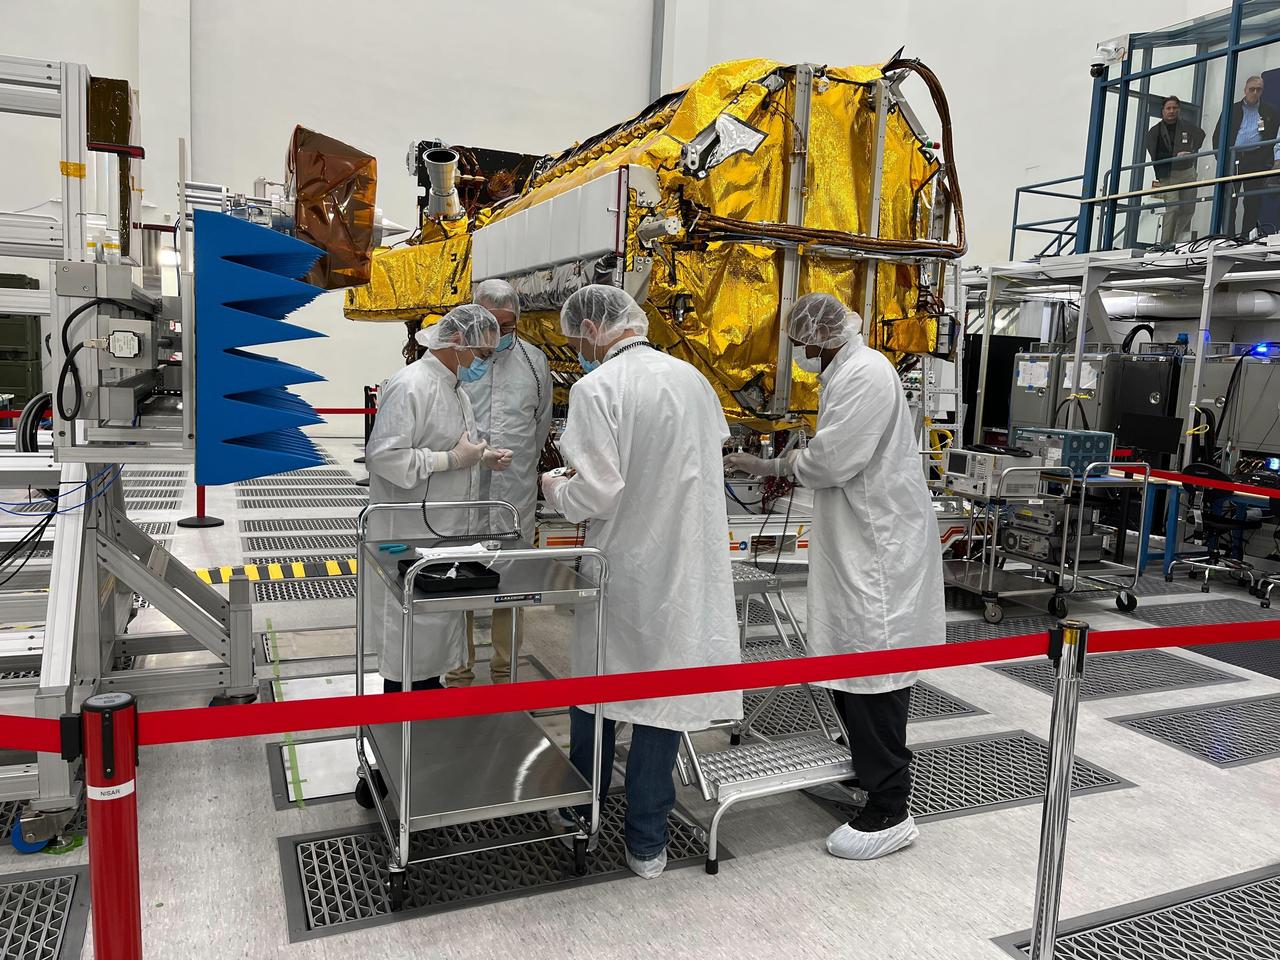
Engineers and technicians from NASA's Jet Propulsion Laboratory work on the NASA-ISRO Synthetic Aperture Radar (NISAR) science instrument payload in a clean room at JPL on Feb. 3, 2023. The payload is scheduled to ship to India in March 2023. The NISAR mission – a joint effort between NASA and ISRO – will measure changes to Earth's land ice surfaces down to fractions of an inch. Data collected by this satellite will help researchers monitor a wide range of changes critical to life on Earth in unprecedented detail. This includes spotting warning signs of imminent volcanic eruptions, helping to monitor groundwater supplies, tracking the melt rate of ice sheets tied to sea level rise, and observing shifts in the distribution of vegetation around the world. The data will inform humanity's responses to urgent challenges posed by natural disasters and climate change, and help communities prepare for and manage hazards. There are two instruments on the satellite that will send and receive radar signals to and from Earth's surface to make the mission's measurements. An L-band synthetic aperture radar (SAR), which uses a signal wavelength of around 9 inches (24 centimeters), and an S-band SAR with a signal wavelength of nearly 5 inches (12 centimeters). Both will bounce their microwave signal off of the planet's surface and record how long it takes the signal to make one roundtrip, as well as the strength of that return signal. This enables the researchers to calculate the distance from the spacecraft to Earth's surface and thereby determine how the land or ice is changing. An antenna reflector nearly 40 feet (12 meters) in diameter, supported by a deployable boom, will focus the microwave signals sent and received by the SARs. JPL, which is managed for NASA by Caltech in Pasadena, leads the U.S. component of NISAR and is providing the mission's L-band SAR instrument. NASA is also providing the radar reflector antenna, the deployable boom, a high-rate communication subsystem for science data, GPS receivers, a solid-state recorder, and payload data subsystem. ISRO is providing the spacecraft bus, the S-band SAR, the launch vehicle, and associated launch services and satellite mission operations. https://photojournal.jpl.nasa.gov/catalog/PIA25771
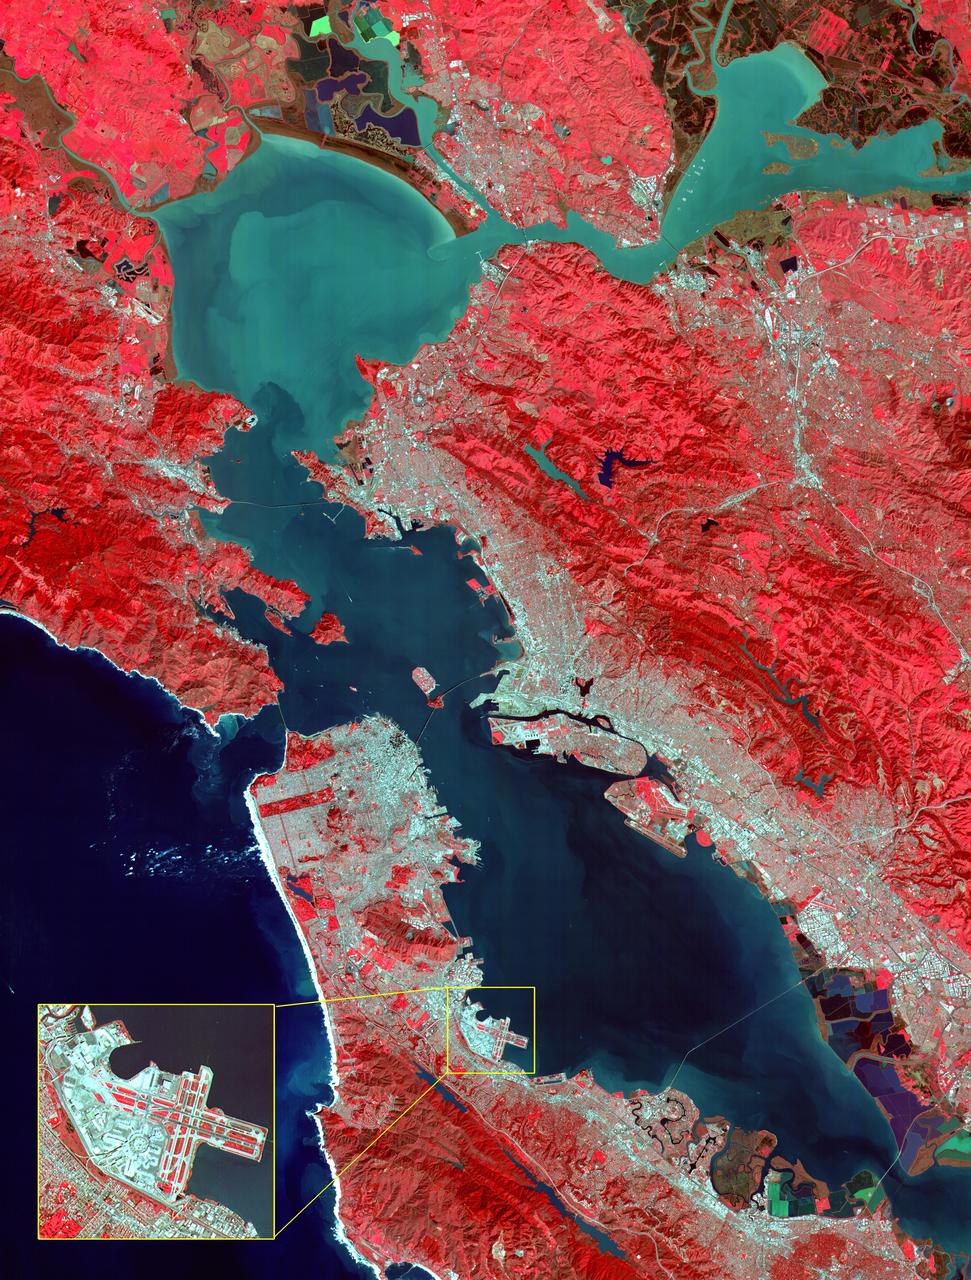
This image of the San Francisco Bay region was acquired on March 3, 2000 by the Advanced Spaceborne Thermal Emission and Reflection Radiometer (ASTER) on NASA's Terra satellite. With its 14 spectral bands from the visible to the thermal infrared wavelength region, and its high spatial resolution of 15 to 90 meters about 50 to 300 feet ), ASTER will image Earth for the next 6 years to map and monitor the changing surface of our planet. Image: This image covers an area 60 kilometers (37 miles) wide and 75 kilometers (47 miles) long in three bands of the reflected visible and infrared wavelength region. The combination of bands portrays vegetation in red, and urban areas in gray. Sediment in the Suisun Bay, San Pablo Bay, San Francisco Bay, and the Pacific Ocean shows up as lighter shades of blue. Along the west coast of the San Francisco Peninsula, strong surf can be seen as a white fringe along the shoreline. A powerful rip tide is visible extending westward from Daly City into the Pacific Ocean. In the lower right corner, the wetlands of the South San Francisco Bay National Wildlife Refuge appear as large dark blue and brown polygons. The high spatial resolution of ASTER allows fine detail to be observed in the scene. The main bridges of the area (San Mateo, San Francisco-Oakland Bay, Golden Gate, Richmond-San Rafael, Benicia-Martinez, and Carquinez) are easily picked out, connecting the different communities in the Bay area. Shadows of the towers along the Bay Bridge can be seen over the adjacent bay water. With enlargement the entire road network can be easily mapped; individual buildings are visible, including the shadows of the high-rises in downtown San Francisco. Inset: This enlargement of the San Francisco Airport highlights the high spatial resolution of ASTER. With further enlargement and careful examination, airplanes can be seen at the terminals. http://photojournal.jpl.nasa.gov/catalog/PIA02606
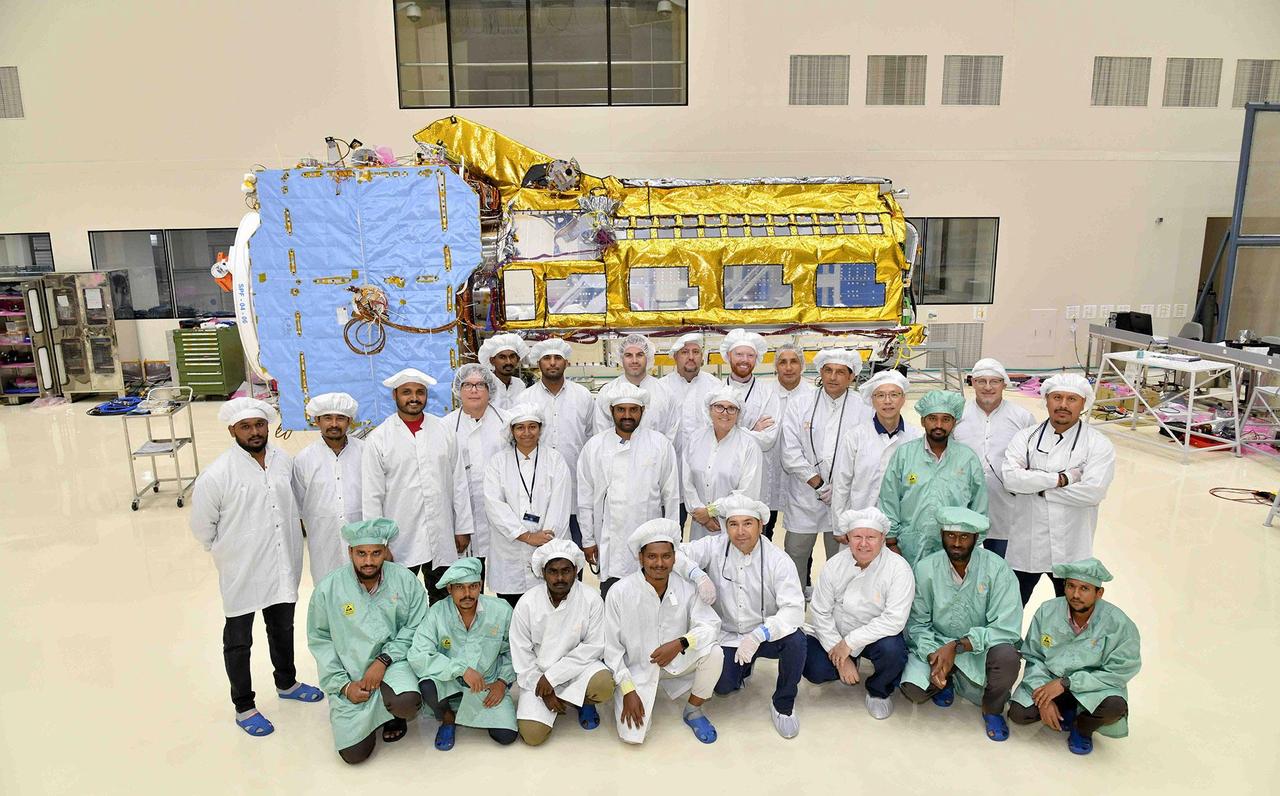
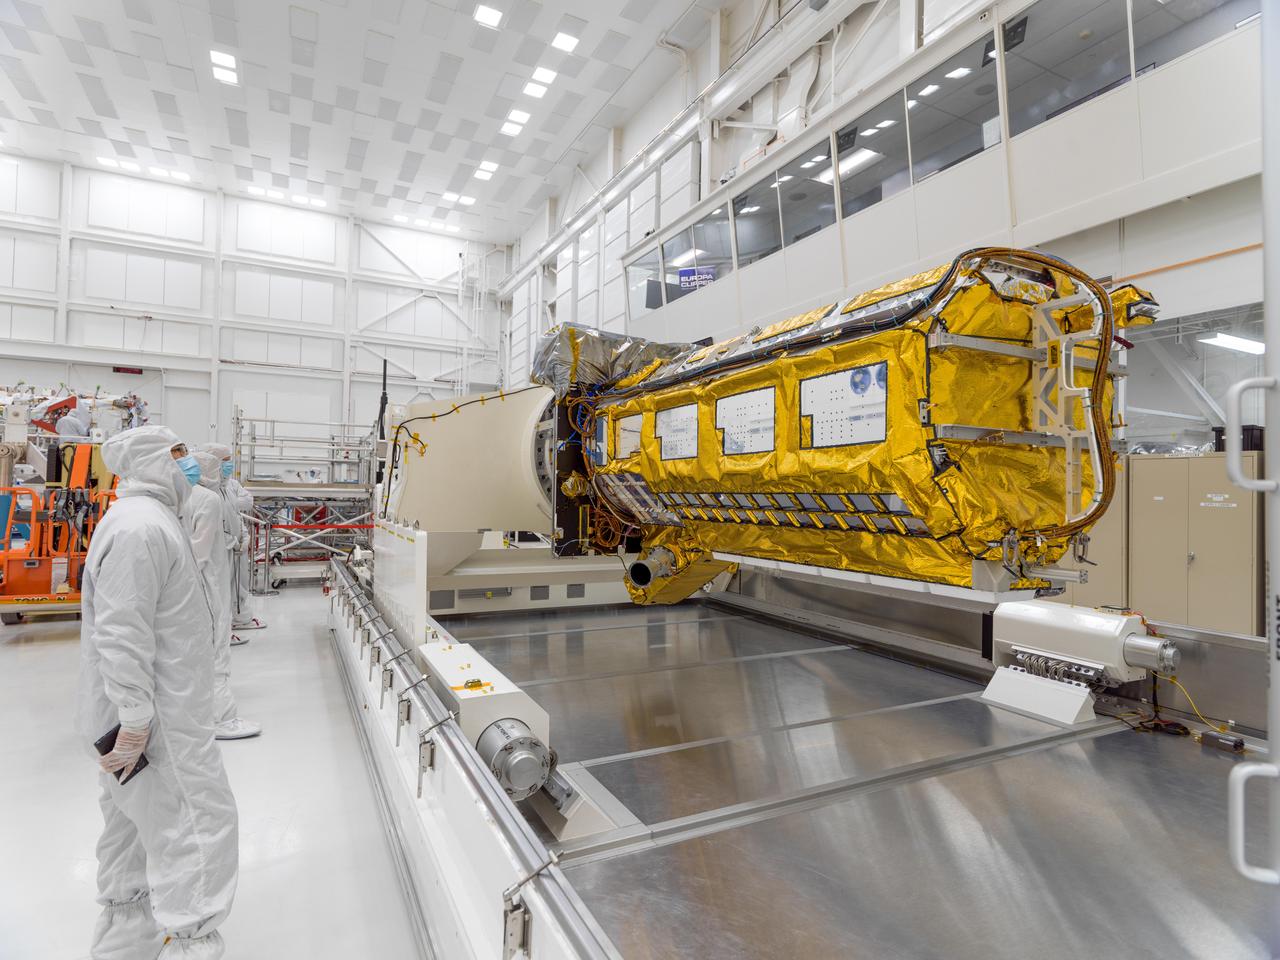
A team of engineers and technicians from the Indian Space Research Organisation and NASA's Jet Propulsion Laboratory in Southern California pose in June at ISRO's U R Rao Satellite Centre (URSC) in Bengaluru, India, after working together to combine the two main components of the NISAR (NASA-ISRO Synthetic Aperture Radar) satellite. Set to launch in early 2024 from the Satish Dhawan Space Centre in Sriharikota, India, NISAR is being jointly developed by NASA and ISRO to observe movements of Earth's land and ice surfaces in extremely fine detail. As NISAR observes nearly every part of Earth at least once every 12 days, the satellite will help scientists understand, among other observables, the dynamics of forests, wetlands, and agricultural lands. The radar instrument payload, partially wrapped in gold-colored thermal blanketing, arrived from JPL in March and consists of L- and S-band radar systems, so named to indicate the wavelengths of their signals. Both sensors can see through clouds and collect data day and night. The bus, which is shown in blue blanketing and includes components and systems developed by both ISRO and JPL, was built at URSC and will provide power, navigation, pointing control, and communications for the mission. The team combined the payload and the bus with the help of a crane. NISAR is an equal collaboration between NASA and ISRO and marks the first time the two agencies have cooperated on hardware development for an Earth-observing mission. JPL, which is managed for NASA by Caltech in Pasadena, leads the U.S. component of the project and is providing the mission's L-band SAR. NASA is also providing the radar reflector antenna, the deployable boom, a high-rate communication subsystem for science data, GPS receivers, a solid-state recorder, and payload data subsystem. URSC, which is leading the ISRO component of the mission, is providing the spacecraft bus, the S-band SAR electronics, the launch vehicle, and associated launch services and satellite mission operations. https://photojournal.jpl.nasa.gov/catalog/PIA25867
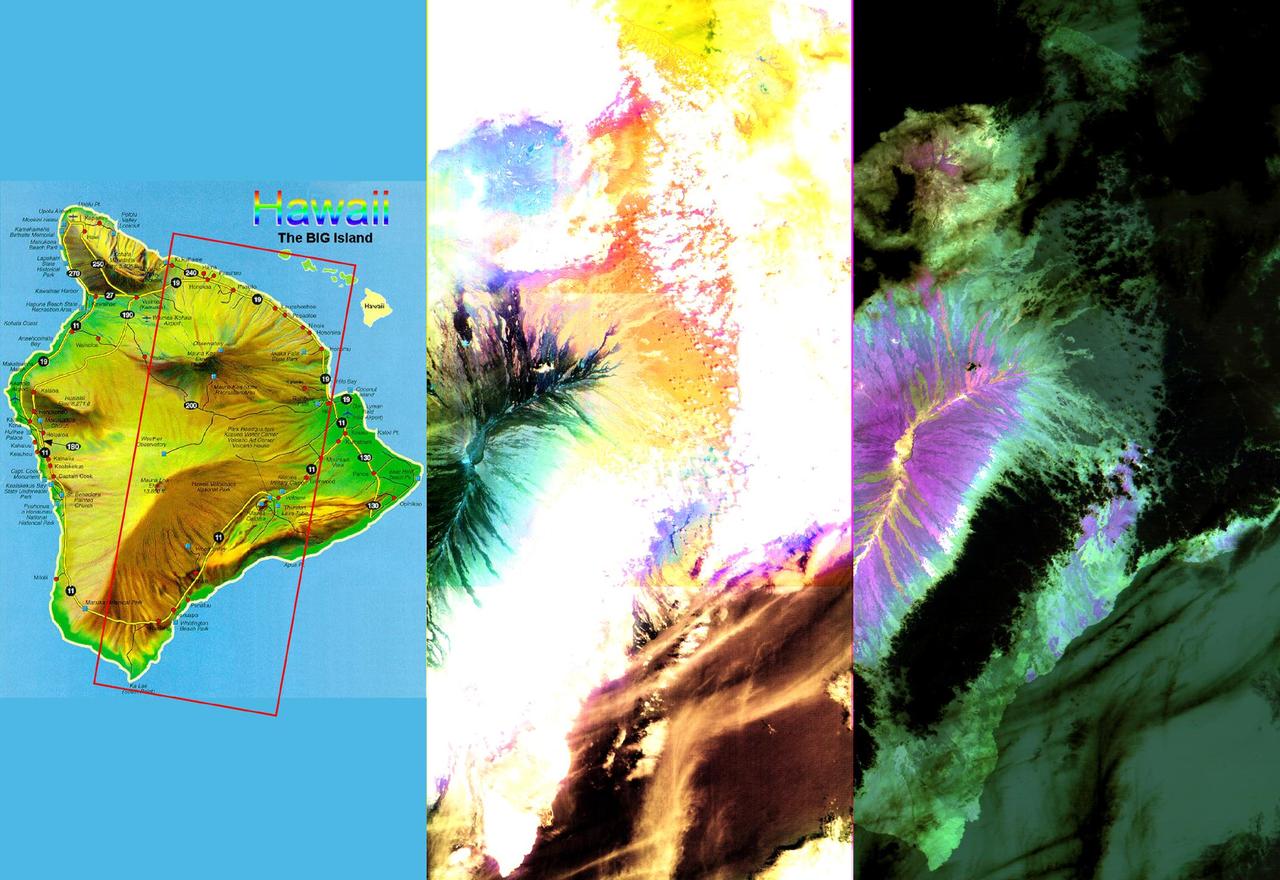
These images of the Island of Hawaii were acquired on March 19, 2000 by the Advanced Spaceborne Thermal Emission and Reflection Radiometer (ASTER) on NASA's Terra satellite. With its 14 spectral bands from the visible to the thermal infrared wavelength region, and its high spatial resolution of 15 to 90 meters (about 50 to 300 feet), ASTER will image Earth for the next 6 years to map and monitor the changing surface of our planet. Data are shown from the short wavelength and thermal infrared spectral regions, illustrating how different and complementary information is contained in different parts of the spectrum. Left image: This false-color image covers an area 60 kilometers (37 miles) wide and 120 kilometers (75 miles) long in three bands of the short wavelength infrared region. While, much of the island was covered in clouds, the dominant central Mauna Loa volcano, rising to an altitude of 4115 meters (13,500 feet), is cloud-free. Lava flows can be seen radiating from the central crater in green and black tones. As they reach lower elevations, the flows become covered with vegetation, and their image color changes to yellow and orange. Mauna Kea volcano to the north of Mauna Loa has a thin cloud-cover, producing a bluish tone on the image. The ocean in the lower right appears brown due to the color processing. Right image: This image is a false-color composite of three thermal infrared bands. The brightness of the colors is proportional to the temperature, and the hues display differences in rock composition. Clouds are black, because they are the coldest objects in the scene. The ocean and thick vegetation appear dark green because they are colder than bare rock surfaces, and have no thermal spectral features. Lava flows are shades of magenta, green, pink and yellow, reflecting chemical changes due to weathering and relative age differences. http://photojournal.jpl.nasa.gov/catalog/PIA02604
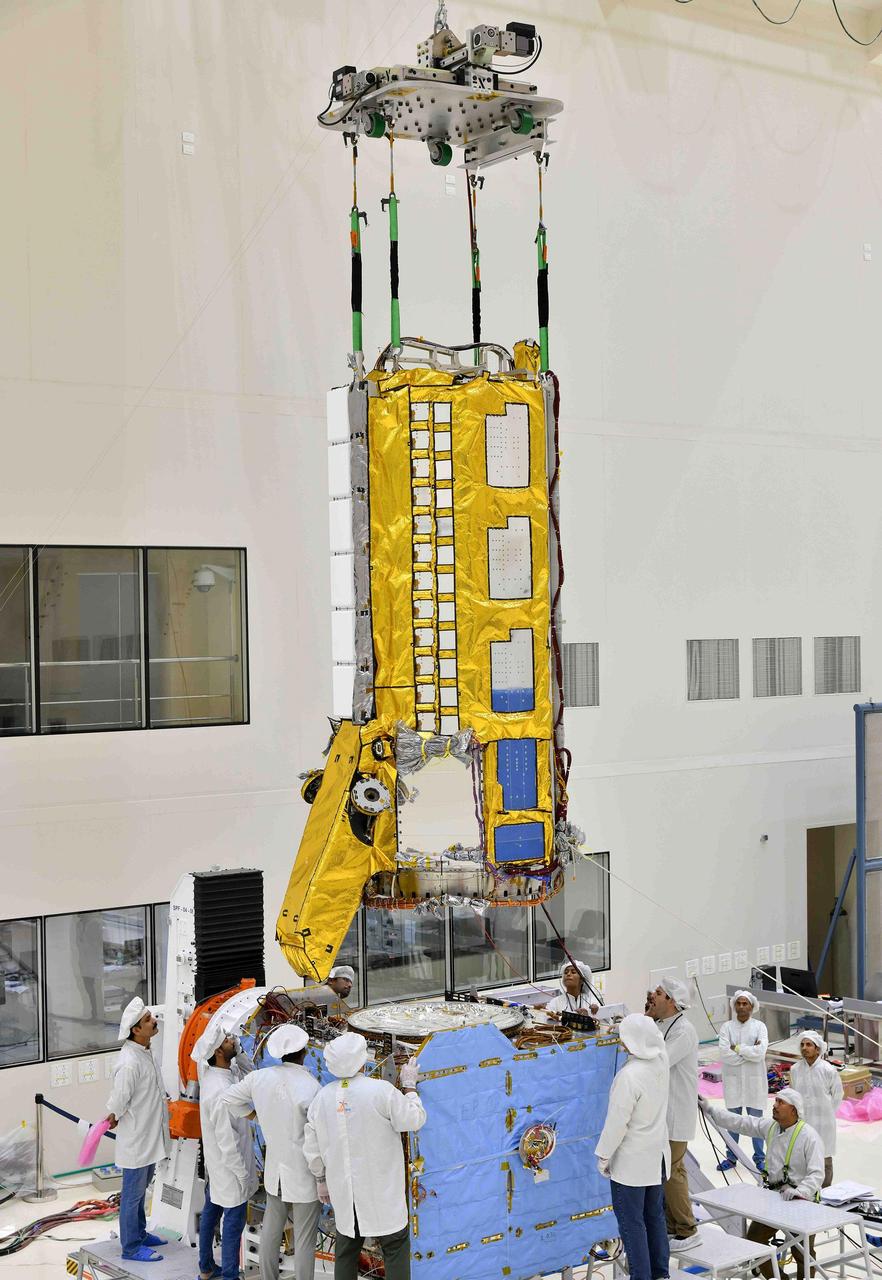
Engineers from NASA's Jet Propulsion Laboratory in Southern California and the Indian Space Research Organisation (ISRO), working in a clean room facility at ISRO's U R Rao Satellite Centre (URSC) in Bengaluru, India, in mid-June 2023, use a crane to align the radar instrument payload for the NISAR (NASA-ISRO Synthetic Aperture Radar) mission above the satellite's spacecraft bus so that the two components can be combined. Set to launch in early 2024 from the Satish Dhawan Space Centre in Sriharikota, India, NISAR is being jointly developed by NASA and ISRO to observe movements of Earth's land and ice surfaces in extremely fine detail. As NISAR observes nearly every part of Earth at least once every 12 days, the satellite will help scientists understand, among other observables, the dynamics of forests, wetlands, and agricultural lands. The radar instrument payload, partially wrapped in gold-colored thermal blanketing, arrived from JPL in March and consists of L- and S-band radar systems, so named to indicate the wavelengths of their signals. Both sensors can see through clouds and collect data day and night. The bus, which is shown in blue blanketing and includes components and systems developed by both ISRO and JPL, was built at URSC and will provide power, navigation, pointing control, and communications for the mission. NISAR is an equal collaboration between NASA and ISRO and marks the first time the two agencies have cooperated on hardware development for an Earth-observing mission. JPL, which is managed for NASA by Caltech in Pasadena, leads the U.S. component of the project and is providing the mission's L-band SAR. NASA is also providing the radar reflector antenna, the deployable boom, a high-rate communication subsystem for science data, GPS receivers, a solid-state recorder, and payload data subsystem. URSC, which is leading the ISRO component of the mission, is providing the spacecraft bus, the S-band SAR electronics, the launch vehicle, and associated launch services and satellite mission operations. https://photojournal.jpl.nasa.gov/catalog/PIA25866
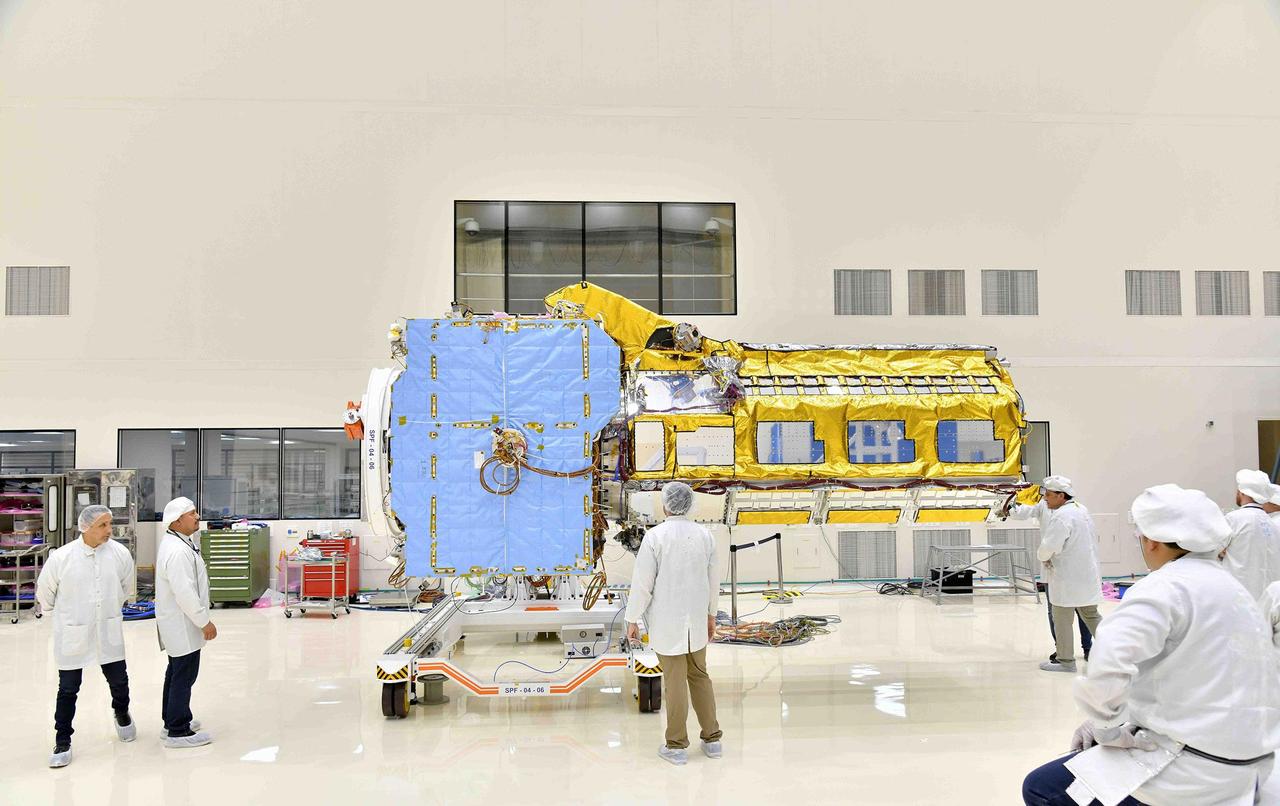
The NISAR (NASA-ISRO Synthetic Aperture Radar) satellite sits in a clean room facility at U R Rao Satellite Centre (URSC) in Bengaluru, India, in mid-June 2023, shortly after engineers from NASA's Jet Propulsion Laboratory in Southern California and the Indian Space Research Organisation joined its two main components, the radar instrument payload and the spacecraft bus. Set to launch in early 2024 from the Satish Dhawan Space Centre in Sriharikota, India, NISAR is being jointly developed by NASA and ISRO to observe movements of Earth's land and ice surfaces in extremely fine detail. As NISAR observes nearly every part of Earth at least once every 12 days, the satellite will help scientists understand, among other observables, the dynamics of forests, wetlands, and agricultural lands. The radar instrument payload, partially wrapped in gold-colored thermal blanketing, arrived from JPL in March and consists of L- and S-band radar systems, so named to indicate the wavelengths of their signals. Both sensors can see through clouds and collect data day and night. The bus, which is shown in blue blanketing and includes components and systems developed by both ISRO and JPL, was built at URSC and will provide power, navigation, pointing control, and communications for the mission. NISAR is an equal collaboration between NASA and ISRO and marks the first time the two agencies have cooperated on hardware development for an Earth-observing mission. JPL, which is managed for NASA by Caltech in Pasadena, leads the U.S. component of the project and is providing the mission's L-band SAR. NASA is also providing the radar reflector antenna, the deployable boom, a high-rate communication subsystem for science data, GPS receivers, a solid-state recorder, and payload data subsystem. URSC, which is leading the ISRO component of the mission, is providing the spacecraft bus, the S-band SAR electronics, the launch vehicle, and associated launch services and satellite mission operations. https://photojournal.jpl.nasa.gov/catalog/PIA25865
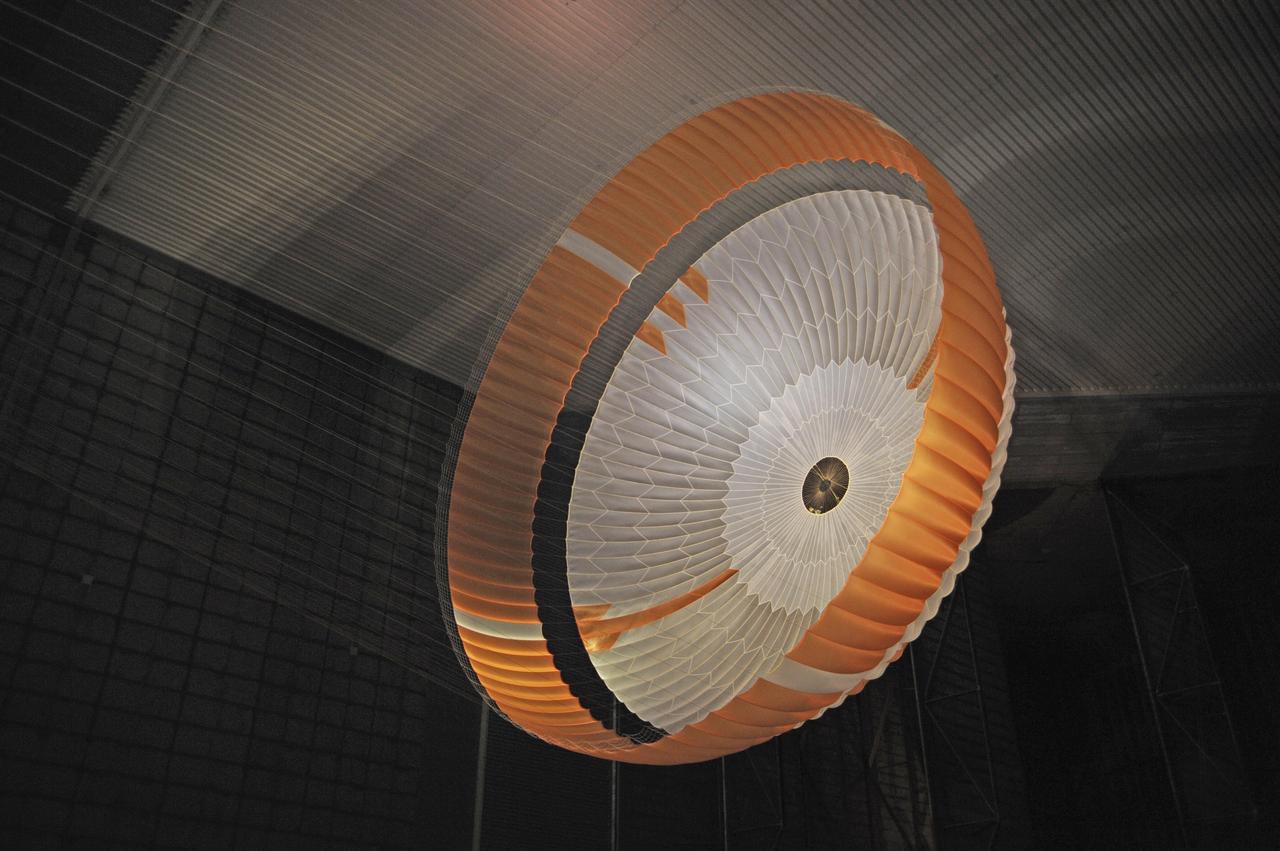
Testing during March and April 2009 inside the world largest wind tunnel, at NASA Ames Research Center, Moffett Field, Calif., qualified the parachute for NASA next Mars rover. The parachute for NASA's Mars Science Laboratory mission, to be launched in 2011 and land on Mars in 2012, is the largest ever built to fly on an extraterrestrial mission. This image shows the qualification-test parachute beginning to open a few seconds after it was launched from a mortar into an 80-mile-per-hour (36-meter-per-second) wind. The parachute uses a configuration called disk-gap-band. It has 80 suspension lines, measures more than 50 meters (165 feet) in length, and opens to a diameter of nearly 16 meters (51 feet). Most of the orange and white fabric is nylon, though a small disk of heavier polyester is used near the vent in the apex of the canopy due to higher stresses there. http://photojournal.jpl.nasa.gov/catalog/PIA11993
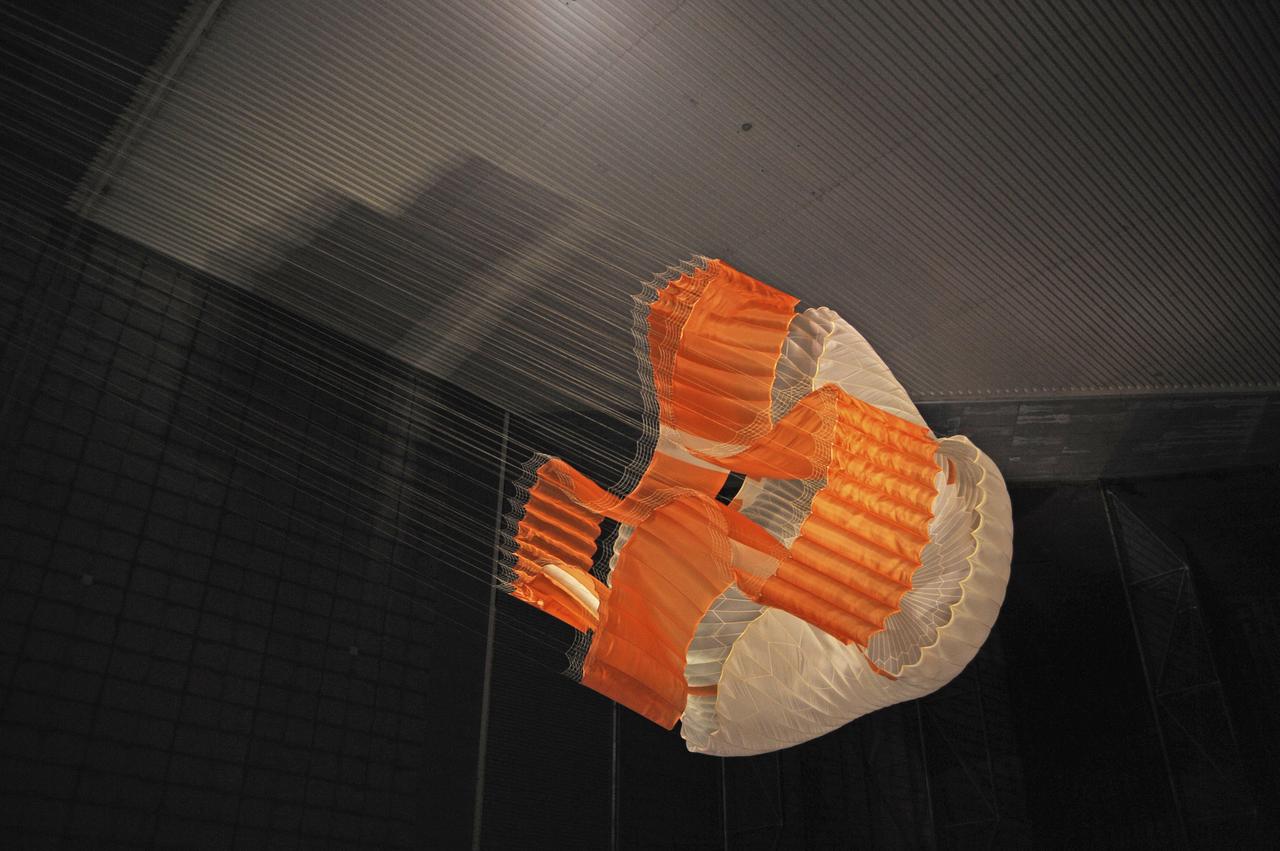
Testing during March and April 2009 inside the world largest wind tunnel, at NASA Ames Research Center, Moffett Field, Calif., qualified the parachute for NASA next Mars rover. The parachute for NASA's Mars Science Laboratory mission, to be launched in 2011 and land on Mars in 2012, is the largest ever built to fly on an extraterrestrial mission. This image shows the qualification-test parachute beginning to open a few seconds after it was launched from a mortar into an 80-mile-per-hour (36-meter-per-second) wind. The parachute uses a configuration called disk-gap-band. It has 80 suspension lines, measures more than 50 meters (165 feet) in length, and opens to a diameter of nearly 16 meters (51 feet). Most of the orange and white fabric is nylon, though a small disk of heavier polyester is used near the vent in the apex of the canopy due to higher stresses there. http://photojournal.jpl.nasa.gov/catalog/PIA11992
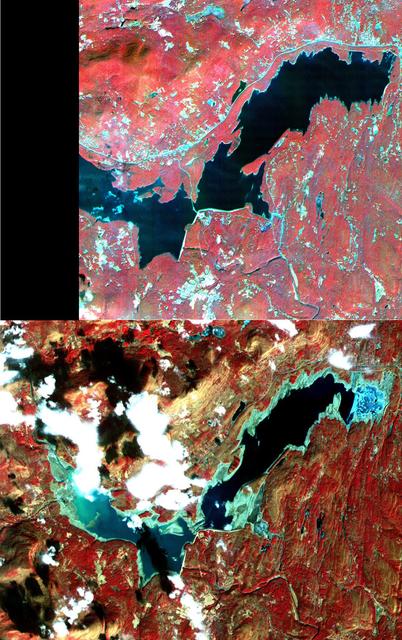
On March 26, New York Mayor Michael Bloomberg declared a drought emergency for the city and four upstate counties in response to the worst drought to hit the eastern United States in nearly 70 years. Restrictions on water use will affect more than 8 million residents of New York. The city's reservoirs, located in the Catskill Mountains, are at 52 percent capacity. One of these, Ashokan Reservoir, is seen in this pair of ASTER images acquired on September 18, 2000 and February 3, 2002. These images were acquired by the Advanced Spaceborne Thermal Emission and Reflection Radiometer (ASTER) on NASA's Terra satellite. With its 14spectral bands from the visible to the thermal infrared wavelength region, and its high spatial resolution of 15 to 90 meters (about 50 to 300 feet), ASTER will image Earth for the next 6 years to map and monitor the changing surface of our planet. http://photojournal.jpl.nasa.gov/catalog/PIA03491
Officials from NASA, the Indian Space Research Organisation, and the Indian Embassy, grouped at left, visit a clean room at NASA's Jet Propulsion Laboratory in Southern California on Feb. 3, 2023, to view the scientific instrument payload for the NASA-ISRO Synthetic Aperture Radar (NISAR) mission. The payload is scheduled to be shipped to India in March 2023. The NISAR mission – a joint effort between NASA and ISRO – will measure changes to Earth's land ice surfaces down to fractions of an inch. Data collected by this satellite will help researchers monitor a wide range of changes critical to life on Earth in unprecedented detail. This includes spotting warning signs of imminent volcanic eruptions, helping to monitor groundwater supplies, tracking the melt rate of ice sheets tied to sea level rise, and observing shifts in the distribution of vegetation around the world. The data will inform humanity's responses to urgent challenges posed by natural disasters and climate change, and help communities prepare for and manage hazards. There are two instruments on the satellite that will send and receive radar signals to and from Earth's surface to make the mission's measurements. An L-band synthetic aperture radar (SAR), which uses a signal wavelength of around 9 inches (24 centimeters), and an S-band SAR with a signal wavelength of nearly 5 inches (12 centimeters). Both will bounce their microwave signal off of the planet's surface and record how long it takes the signal to make one roundtrip, as well as the strength of that return signal. This enables the researchers to calculate the distance from the spacecraft to Earth's surface and thereby determine how the land or ice is changing. An antenna reflector nearly 40 feet (12 meters) in diameter, supported by a deployable boom, will focus the microwave signals sent and received by the SARs. JPL, which is managed for NASA by Caltech in Pasadena, leads the U.S. component of NISAR and is providing the mission's L-band SAR instrument. NASA is also providing the radar reflector antenna, the deployable boom, a high-rate communication subsystem for science data, GPS receivers, a solid-state recorder, and payload data subsystem. ISRO is providing the spacecraft bus, the S-band SAR, the launch vehicle, and associated launch services and satellite mission operations. https://photojournal.jpl.nasa.gov/catalog/PIA25599

ISS008-E-19646 (27 March 2004) --- This image featuring Hurricane Catarina was taken by an Expedition 8 crewmember on the International Space Station (ISS). Until this past week only two tropical cyclones had ever been noted in the South Atlantic Basin, and no hurricanes. However, late last week, a circulation center well off the coast of southern Brazil developed tropical cyclone characteristics and continued to intensify as it moved westward. The system developed an eye and apparently reached hurricane strength on Friday, March 28, before eventually making landfall late on Saturday. The crew of the ISS was notified of the cyclone and acquired this excellent oblique photo of the storm just as it made landfall on the southern Brazilian state of Catarina (the storm has been unofficially dubbed “Hurricane Catarina”). Note the clockwise circulation of Southern Hemisphere cyclones, the well-defined banding features, and the eyewall of at least a Category 1 system. The coastline is visible under the clouds in the upper right corner of the image.

ISS008-E-19643 (27 March 2004) --- This image featuring Hurricane Catarina was taken by an Expedition 8 crewmember on the International Space Station (ISS). Until this past week only two tropical cyclones had ever been noted in the South Atlantic Basin, and no hurricanes. However, late last week, a circulation center well off the coast of southern Brazil developed tropical cyclone characteristics and continued to intensify as it moved westward. The system developed an eye and apparently reached hurricane strength on Friday, March 28, before eventually making landfall late on Saturday. The crew of the ISS was notified of the cyclone and acquired this excellent oblique photo of the storm just as it made landfall on the southern Brazilian state of Catarina (the storm has been unofficially dubbed “Hurricane Catarina”). Note the clockwise circulation of Southern Hemisphere cyclones, the well-defined banding features, and the eyewall of at least a Category 1 system. The coastline is visible under the clouds in the upper right corner of the image.

On March 26, 1976, the NASA Flight Research Center opened its doors to hundreds of guests for the dedication of the center in honor of Hugh Latimer Dryden. The dedication was very much a local event; following Center Director David Scott’s opening remarks, the Antelope Valley High School’s symphonic band played the national anthem. Invocation was given followed by recognition of the invited guests. Dr. Hugh Dryden, a man of total humility, received praise from all those present. Dryden, who died in 1965, had been a pioneering aeronautical scientist who became director of the National Advisory Committee for Aeronautics (NACA) in 1949 and then deputy administrator of the NACA’s successor, NASA, in 1958. Very much interested in flight research, he had been responsible for establishing a permanent facility at the location later named in his honor. As Center Director David Scott looks on, Mrs. Hugh L. Dryden (Mary Libbie Travers) unveils the memorial to her husband at the dedication ceremony.On March 26, 1976, the NASA Flight Research Center opened its doors to hundreds of guests for the dedication of the center in honor of Hugh Latimer Dryden.
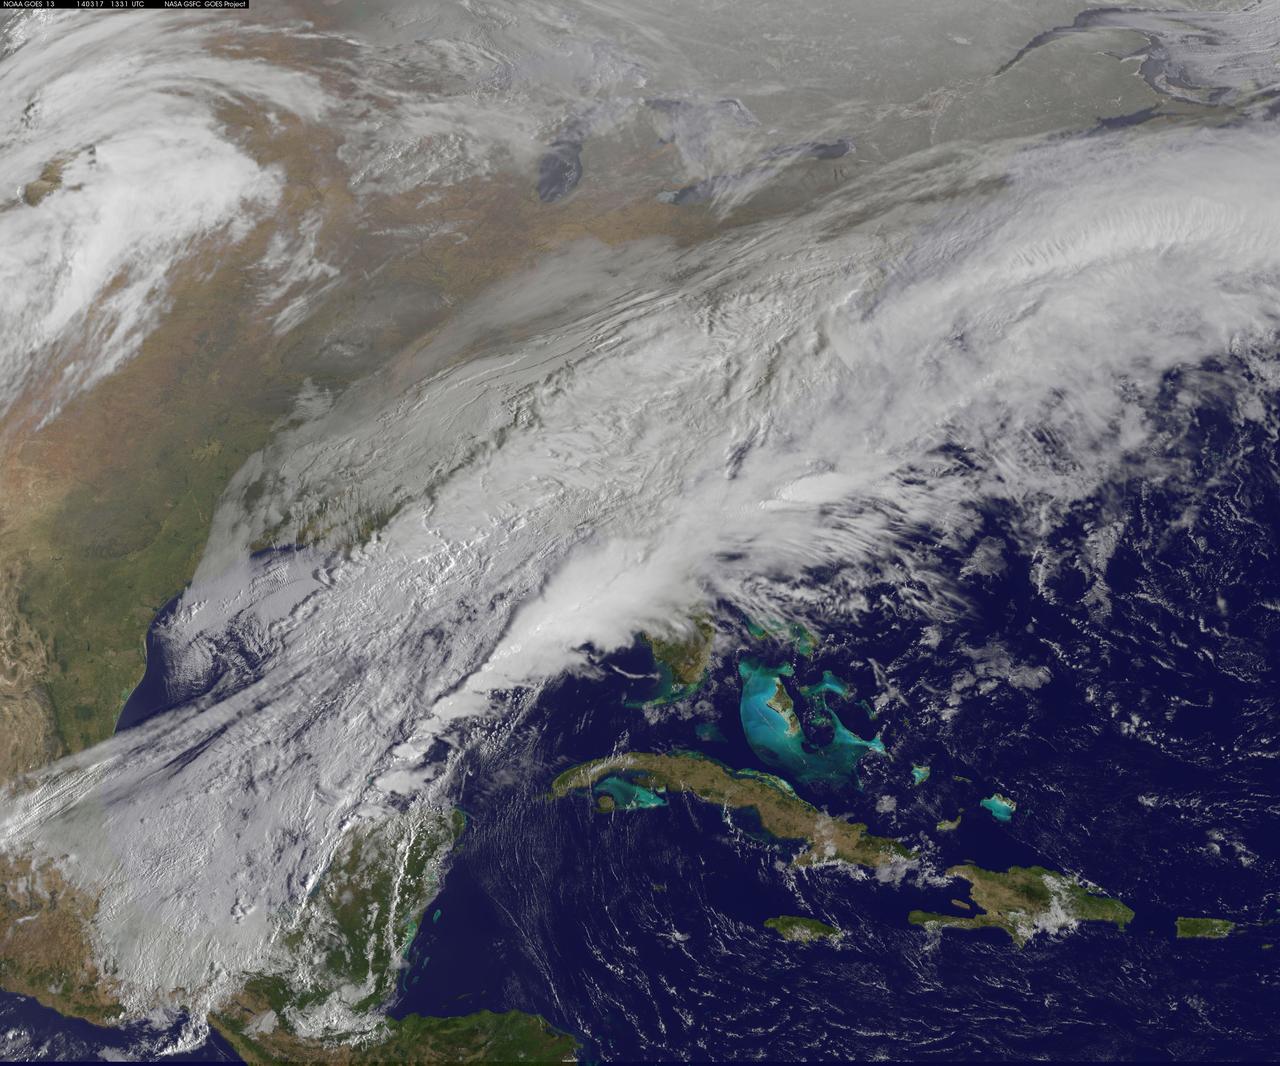
The green of St. Patrick's Day in the Mid-Atlantic was covered by white snow as a result of a late winter snow storm. The covering of the green was captured in a movie made at NASA using NOAA's GOES satellite data. The winter storm dropped snow totals from 6" to 12" of snow from Baltimore, Md. to Richmond, Va. The storm arrived during the evening of March 16 and continued through March 17. As of 1 p.m. EDT, light bands of snow continued to fall throughout the Washington, D.C. area. NOAA's GOES-East satellite captured the path the storm took through the Mid-Atlantic as it moved in from the west on March 15 and dropped snow March 16 and 17. NOAA's GOES-East satellite sits in a fixed orbit in space and captures visible and infrared imagery of all weather over the eastern U.S. and Atlantic Ocean. As of 1 p.m. EDT on March 17, the National Weather Service still maintained a Winter Storm Warning from Cecil County in northeastern Maryland that stretched west to Frederick County. The warning continued in Virginia counties including Clarke, Warren, Rappahannock, Madison and stretched to Albemarle and southwest. Southeastern counties in Virginia south of the city of Fredericksburg remained under a Winter Weather Advisory. GOES satellites provide the kind of continuous monitoring necessary for intensive data analysis. Geostationary describes an orbit in which a satellite is always in the same position with respect to the rotating Earth. This allows GOES to hover continuously over one position on Earth's surface, appearing stationary. As a result, GOES provide a constant vigil for the atmospheric "triggers" for severe weather conditions such as tornadoes, flash floods, hail storms and hurricanes. For updated information about the storm system, visit NOAA's NWS website: <a href="http://www.weather.gov" rel="nofollow">www.weather.gov</a> For more information about GOES satellites, visit: <a href="http://www.goes.noaa.gov/" rel="nofollow">www.goes.noaa.gov/</a> or goes.gsfc.nasa.gov/ Rob Gutro NASA's Goddard Space Flight Center <b><a href="http://www.nasa.gov/audience/formedia/features/MP_Photo_Guidelines.html" rel="nofollow">NASA image use policy.</a></b> <b><a href="http://www.nasa.gov/centers/goddard/home/index.html" rel="nofollow">NASA Goddard Space Flight Center</a></b> enables NASA’s mission through four scientific endeavors: Earth Science, Heliophysics, Solar System Exploration, and Astrophysics. Goddard plays a leading role in NASA’s accomplishments by contributing compelling scientific knowledge to advance the Agency’s mission. <b>Follow us on <a href="http://twitter.com/NASAGoddardPix" rel="nofollow">Twitter</a></b> <b>Like us on <a href="http://www.facebook.com/pages/Greenbelt-MD/NASA-Goddard/395013845897?ref=tsd" rel="nofollow">Facebook</a></b> <b>Find us on <a href="http://instagram.com/nasagoddard?vm=grid" rel="nofollow">Instagram</a></b>

This photograph was taken during the integration of the Astro-1 mission payloads at the Kennedy Space Center on March 20, 1990, showing the Broad Band X-Ray Telescope (BBXRT) at the left, as three telescopes for the Astro-1 Observatory are settled into the Orbiter Columbia payload bay. Above Earth's atmospheric interference, Astro-1 would make precise measurements of objects such as planets, stars, and galaxies in relatively small fields of view and would observe and measure ultraviolet radiation from celestial objects. The Astro-1 used a Spacelab pallet system with an instrument pointing system and a cruciform structure for bearing the three ultraviolet instruments mounted in a parallel configuration. The three instruments were: The Hopkins Ultraviolet Telescope (HUT), which was designed to obtain far-ultraviolet spectroscopic data from white dwarfs, emission nebulae, active galaxies, and quasars; the Wisconsin Ultraviolet Photo-Polarimeter Experiment (WUPPE) which was to study polarized ultraviolet light from magnetic white dwarfs, binary stars, reflection nebulae, and active galaxies; and the Ultraviolet Imaging Telescope (UIT), which was to record photographic images in ultraviolet light of galaxies, star clusters, and nebulae. The star trackers that supported the instrument pointing system, were also mounted on the cruciform. Also in the payload bay was the Broad Band X-Ray Telescope (BBXRT), which was designed to obtain high-resolution x-ray spectra from stellar corona, x-ray binary stars, active galactic nuclei, and galaxy clusters. Managed by the Marshall Space Flight Center, the Astro-1 observatory was launched aboard the Space Shuttle Orbiter Columbia (STS-35) on December 2, 1990.
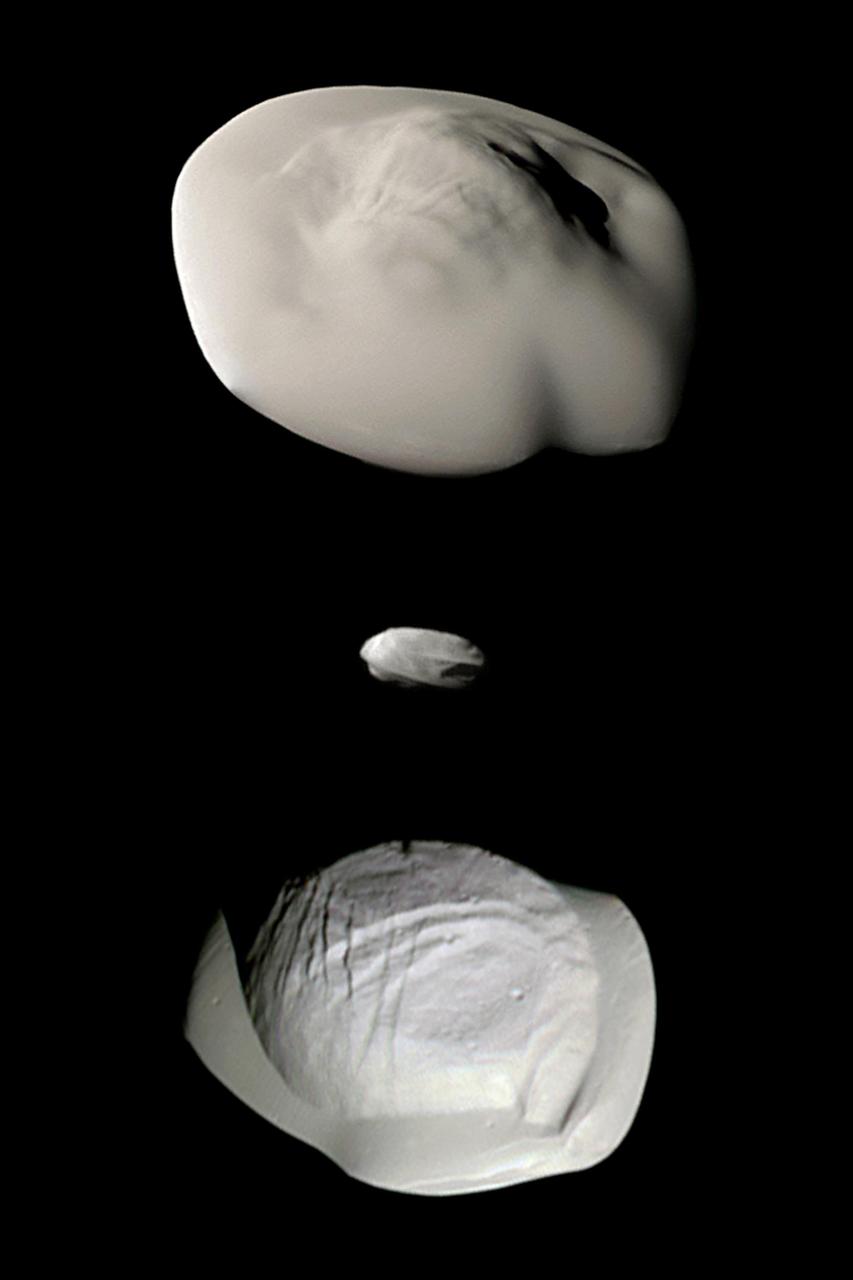
This montage of views from NASA's Cassini spacecraft shows three of Saturn's small ring moons: Atlas, Daphnis and Pan at the same scale for ease of comparison. Two differences between Atlas and Pan are obvious in this montage. Pan's equatorial band is much thinner and more sharply defined, and the central mass of Atlas (the part underneath the smooth equatorial band) appears to be smaller than that of Pan. Images of Atlas and Pan taken using infrared, green and ultraviolet spectral filters were combined to create enhanced-color views, which highlight subtle color differences across the moons' surfaces at wavelengths not visible to human eyes. (The Daphnis image was colored using the same green filter image for all three color channels, adjusted to have a realistic appearance next to the other two moons.) All of these images were taken using the Cassini spacecraft narrow-angle camera. The images of Atlas were acquired on April 12, 2017, at a distance of 10,000 miles (16,000 kilometers) and at a sun-moon-spacecraft angle (or phase angle) of 37 degrees. The images of Pan were taken on March 7, 2017, at a distance of 16,000 miles (26,000 kilometers) and a phase angle of 21 degrees. The Daphnis image was obtained on Jan. 16, 2017, at a distance of 17,000 miles (28,000 kilometers) and at a phase angle of 71 degrees. All images are oriented so that north is up. A monochrome version is available at https://photojournal.jpl.nasa.gov/catalog/PIA21449

STS068-S-001 (March 1994) --- Exploration of Earth from space is the focus of the design of the STS-68 insignia, the second flight of the Space Radar Laboratory (SRL-2). SRL-2 is part of NASA's Mission to Planet Earth (MTPE) *project. The world's land masses and oceans dominate the center field, with the space shuttle Endeavour circling the globe. The SRL-2 letters span the width and breadth of planet Earth, symbolizing worldwide coverage of the two prime experiments of STS-68 - The Shuttle Imaging Radar-C and X-Band Synthetic Aperture Radar (SIR-C/X-SAR) instruments, and the Measurement of Air Pollution from Satellites (MAPS) sensor. The red, blue and black colors of the insignia represent the three operating wavelengths of SIR-C/X-SAR, and the gold band surrounding the globe symbolizes the atmospheric envelope examined by MAPS. The flags of international partners Germany and Italy are shown opposite Endeavour. The relationship of the orbiter to Earth highlights the usefulness of human spaceflights in understanding Earth's environment, and the monitoring its changing surface and atmosphere. In the words of the crew members, "the soaring orbiter also typifies the excellence of the NASA team in exploring our own world, using the tools which the Space Program developed to explore the other planets in the solar system". This STS-68 patch was designed by artist Sean Collins. The NASA insignia design for space shuttle flights is reserved for use by the astronauts and for other official use as the NASA Administrator may authorize. Public availability has been approved only in the forms of illustrations by the various news media. When and if there is any change in this policy, which is not anticipated, the change will be publicly announced. Photo credit: NASA
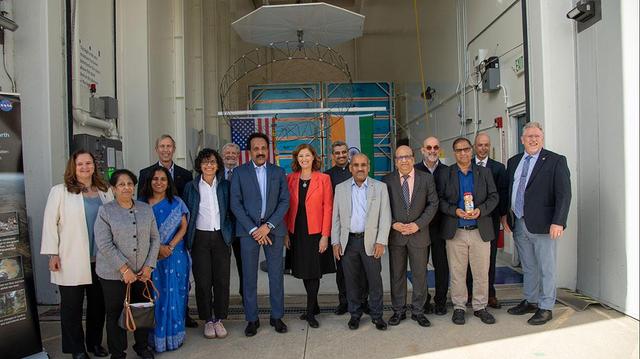
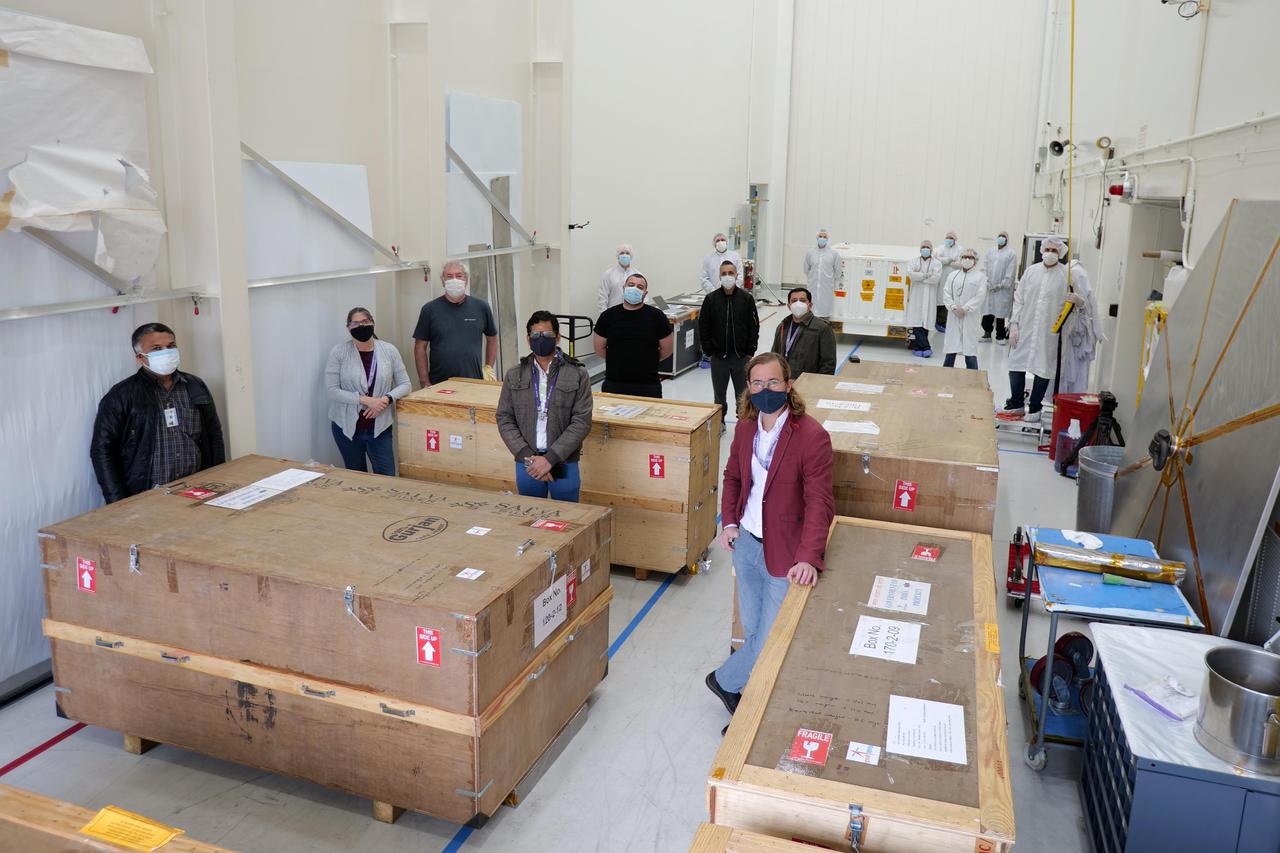
Officials from NASA, the Indian Space Research Organization (ISRO), and the Embassy of India hold a send-off ceremony for the NASA-ISRO Synthetic Aperture Radar (NISAR) science instrument payload on Feb. 3, 2023, outside a clean room at NASA's Jet Propulsion Laboratory in Southern California. The payload is scheduled to be shipped to India in March. Pictured left to right: Karen St. Germain, director, Earth Science Division, NASA; Mitra Dutta, NISAR program executive, NASA; Sripriya Ranganathan, ambassador and deputy chief of mission, Indian Embassy; Larry James, deputy director, JPL; Bhavya Lal, associate administrator for technology, policy, and strategy, NASA; Jim Graf, director, Earth Science and Technology Directorate, JPL; S. Somanath, chairman, ISRO; Laurie Leshin, director, JPL; Krunal Joshi, counselor, space and ISRO technical liaison officer, Indian Embassy; M. Sankaran, director, U R Rao Satellite Centre, ISRO; Shantanu Bhatawdekar, scientific secretary, ISRO; Paul Rosen, NISAR project scientist, JPL; CV Shrikant, NISAR project director, ISRO; Phil Barela, NISAR project manager, JPL; and Gerald Bawden, NISAR program scientist, NASA. NISAR – a joint effort between NASA and ISRO – will measure changes to Earth's land ice surfaces down to fractions of an inch. Data collected by this satellite will help researchers monitor a wide range of changes critical to life on Earth in unprecedented detail. This includes spotting warning signs of imminent volcanic eruptions, helping to monitor groundwater supplies, tracking the melt rate of ice sheets tied to sea level rise, and observing shifts in the distribution of vegetation around the world. The data will inform humanity's responses to urgent challenges posed by natural disasters and climate change, and help communities prepare for and manage hazards. There are two instruments on the satellite that will send and receive radar signals to and from Earth's surface to make the mission's measurements. An L-band synthetic aperture radar (SAR), which uses a signal wavelength of around 9 inches (24 centimeters), and an S-band SAR with a signal wavelength of nearly 5 inches (12 centimeters). Both will bounce their microwave signal off of the planet's surface and record how long it takes the signal to make one roundtrip, as well as the strength of that return signal. This enables the researchers to calculate the distance from the spacecraft to Earth's surface and thereby determine how the land or ice is changing. An antenna reflector nearly 40 feet (12 meters) in diameter, supported by a deployable boom, will focus the microwave signals sent and received by the SARs. JPL, which is managed for NASA by Caltech in Pasadena, leads the U.S. component of NISAR and is providing the mission's L-band SAR instrument. NASA is also providing the radar reflector antenna, the deployable boom, a high-rate communication subsystem for science data, GPS receivers, a solid-state recorder, and payload data subsystem. ISRO is providing the spacecraft bus, the S-band SAR, the launch vehicle, and associated launch services and satellite mission operations. https://photojournal.jpl.nasa.gov/catalog/PIA25600
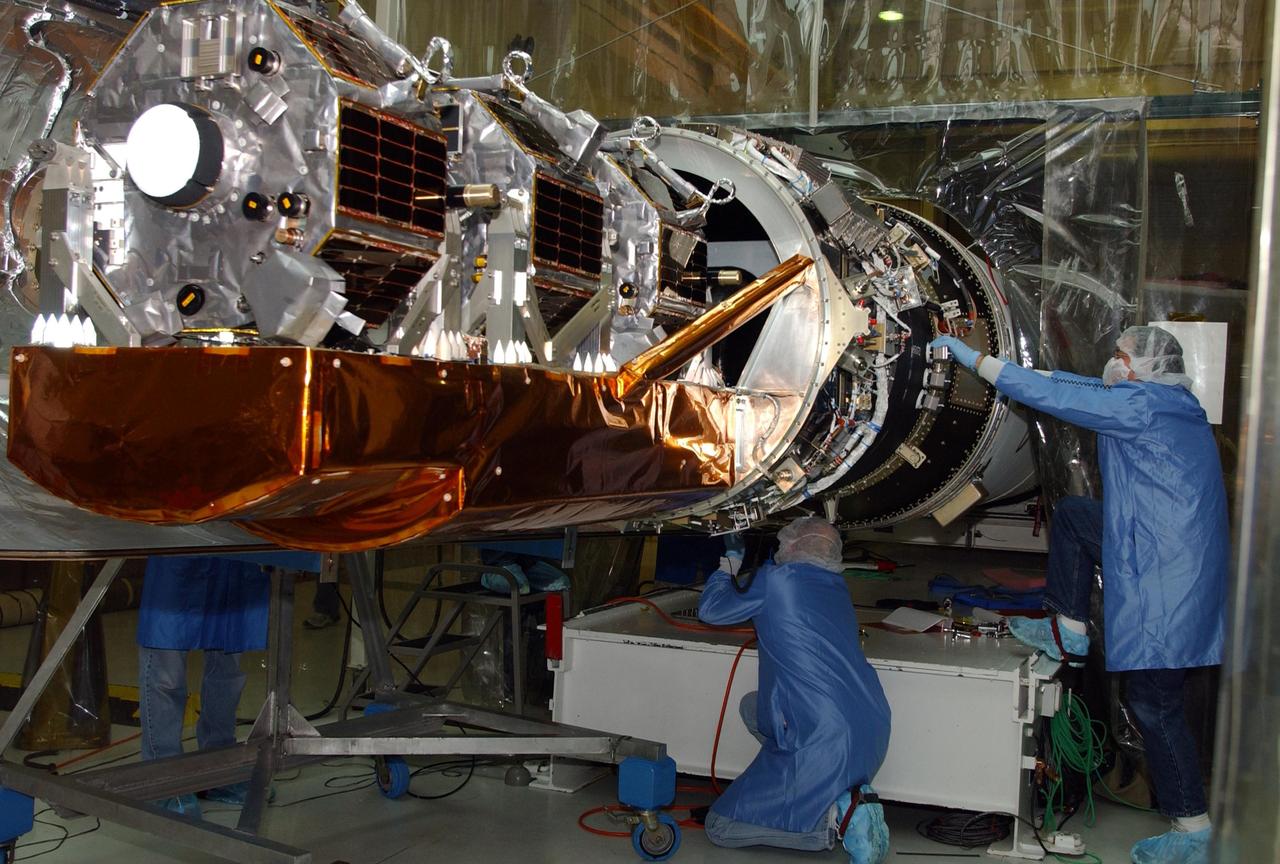
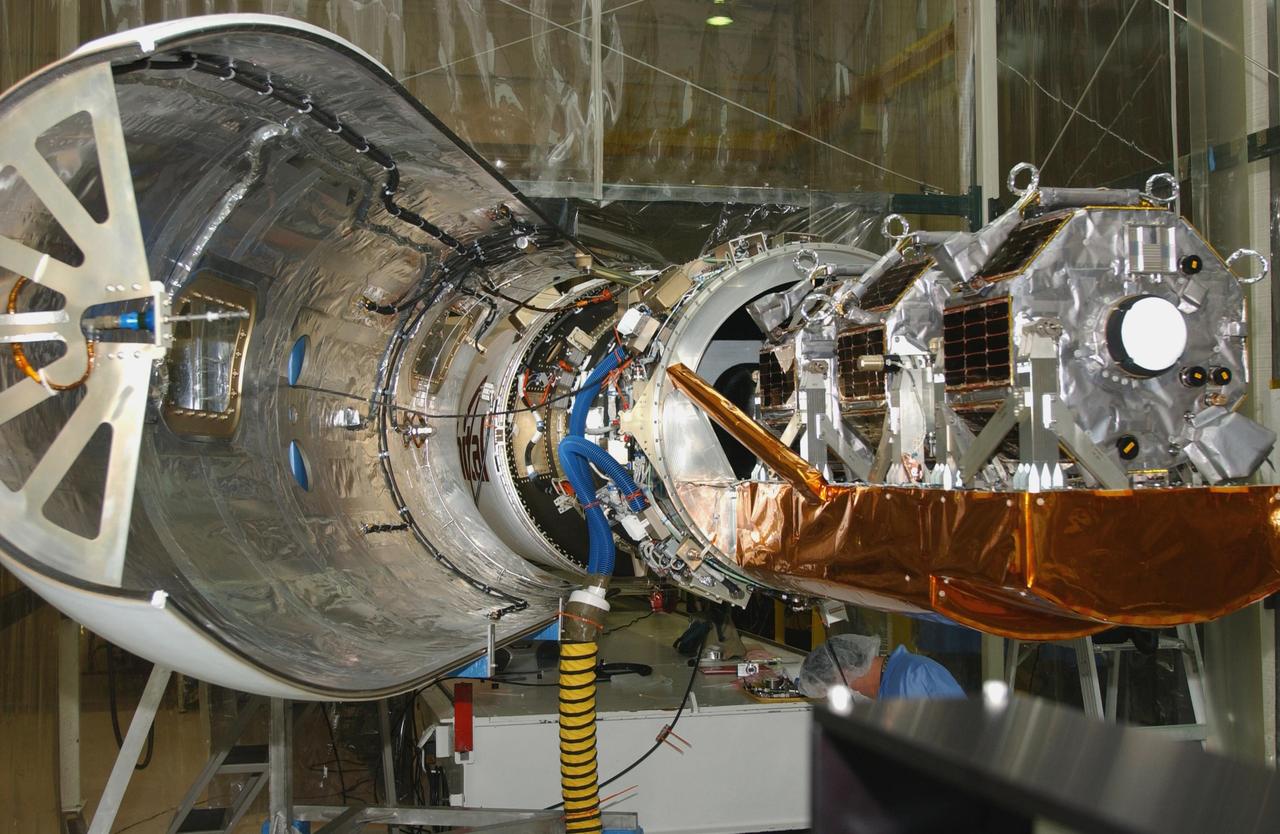
VANDENBERG AIR FORCE BASE, CALIF. - Inside Orbital Sciences’ Building 1555 at Vandenberg Air Force Base in California, workers continue the installation of the second half of the fairing around the Space Technology 5 (ST5) spacecraft. The ST5, which contains three microsatellites with miniaturized redundant components and technologies, is mated to its launch vehicle, Orbital Sciences' Pegasus XL. Each of the ST5 microsatellites will validate New Millennium Program selected technologies, such as the Cold Gas Micro-Thruster and X-Band Transponder Communication System. After deployment from the Pegasus, the micro-satellites will be positioned in a “string of pearls” constellation that demonstrates the ability to position them to perform simultaneous multi-point measurements of the magnetic field using highly sensitive magnetometers. The data will help scientists understand and map the intensity and direction of the Earth’s magnetic field, its relation to space weather events, and affects on our planet. Launch of ST5 and the Pegasus XL will be from underneath the belly of an L-1011 carrier aircraft on March 14 from Vandenberg Air Force Base.

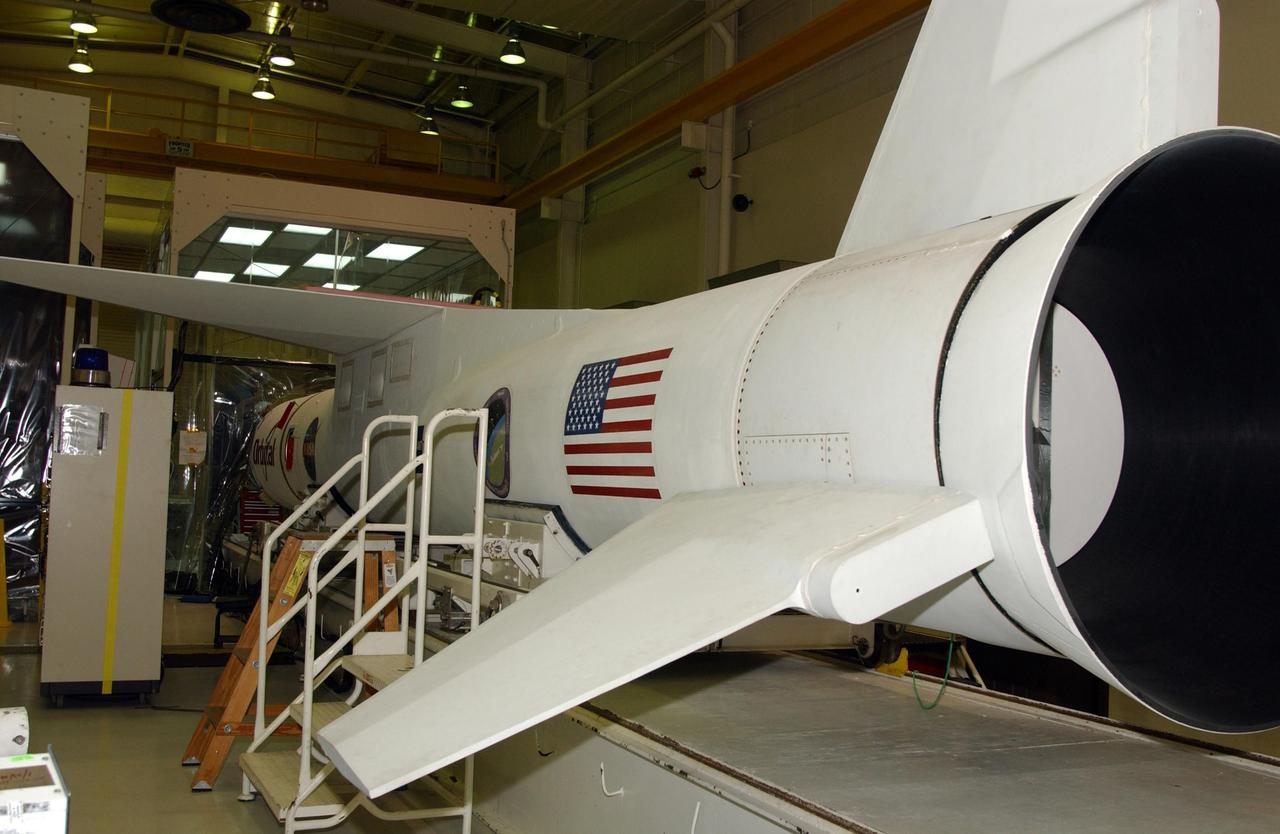
KENNEDY SPACE CENTER, FLA. - Inside Orbital Sciences’ Building 1555 at Vandenberg Air Force Base in California, the Pegasus XL launch vehicle is complete after mating with the Space Technology 5 (ST5). The ST5 contains three microsatellites, with miniaturized redundant components and technologies. Each will validate New Millennium Program selected technologies, such as the Cold Gas Micro-Thruster and X-Band Transponder Communication System. After deployment from the Pegasus, the micro-satellites will be positioned in a “string of pearls” constellation that demonstrates the ability to position them to perform simultaneous multi-point measurements of the magnetic field using highly sensitive magnetometers. The data will help scientists understand and map the intensity and direction of the Earth’s magnetic field, its relation to space weather events, and affects on our planet. With such missions, NASA hopes to improve scientists’ ability to accurately forecast space weather and minimize its harmful effects on space- and ground-based systems. Launch of ST5 is scheduled no earlier than March 6 from Vandenberg Air Force Base.
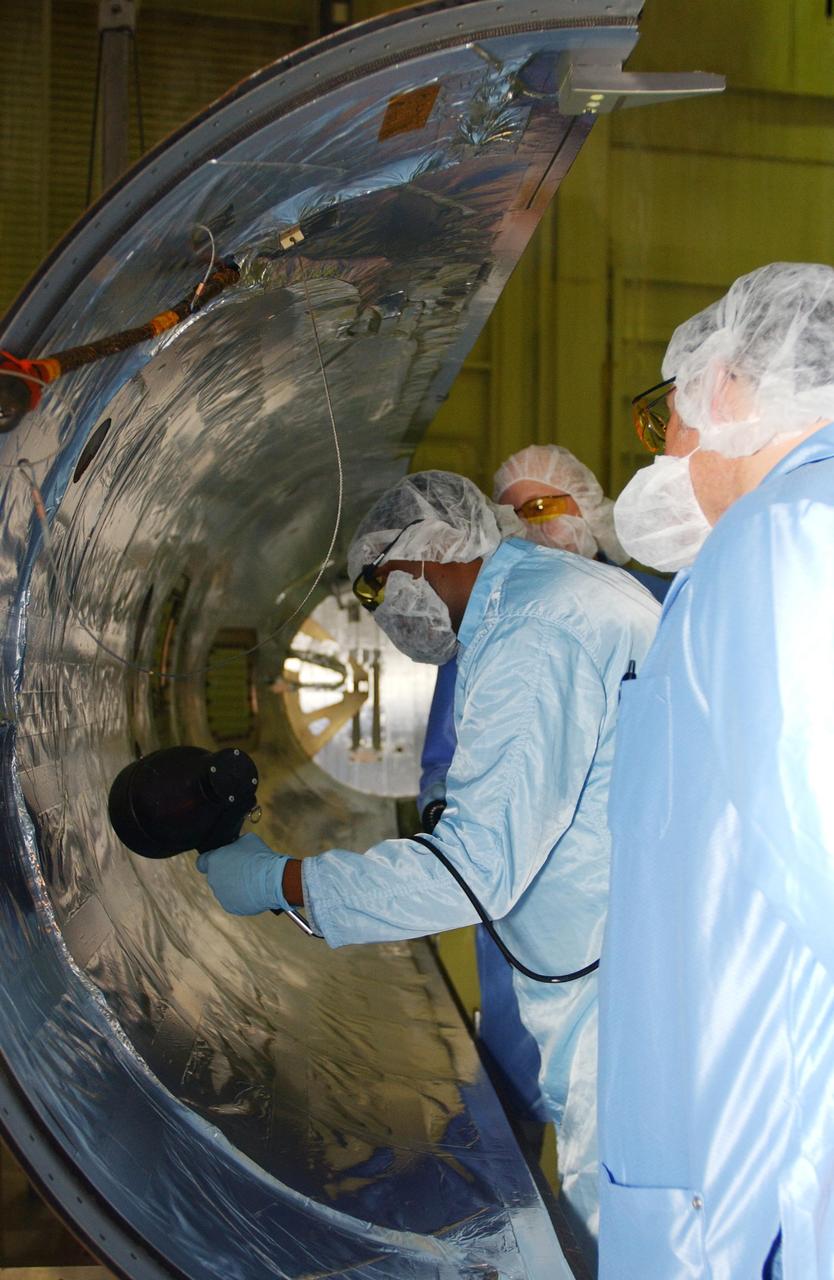
VANDENBERG AIR FORCE BASE, CALIF. - Inside Orbital Sciences’ Building 1555 at Vandenberg Air Force Base in California, workers clean and prepare the fairing to be installed around the Space Technology 5 (ST5) spacecraft. The ST5 contains three microsatellites with miniaturized redundant components and technologies. Each will validate New Millennium Program selected technologies, such as the Cold Gas Micro-Thruster and X-Band Transponder Communication System. After deployment from the Pegasus, the micro-satellites will be positioned in a “string of pearls” constellation that demonstrates the ability to position them to perform simultaneous multi-point measurements of the magnetic field using highly sensitive magnetometers. The data will help scientists understand and map the intensity and direction of the Earth’s magnetic field, its relation to space weather events, and affects on our planet. With such missions, NASA hopes to improve scientists’ ability to accurately forecast space weather and minimize its harmful effects on space- and ground-based systems. Launch of ST5 is scheduled from the belly of an L-1011 carrier aircraft no earlier than March 14 from Vandenberg Air Force Base.
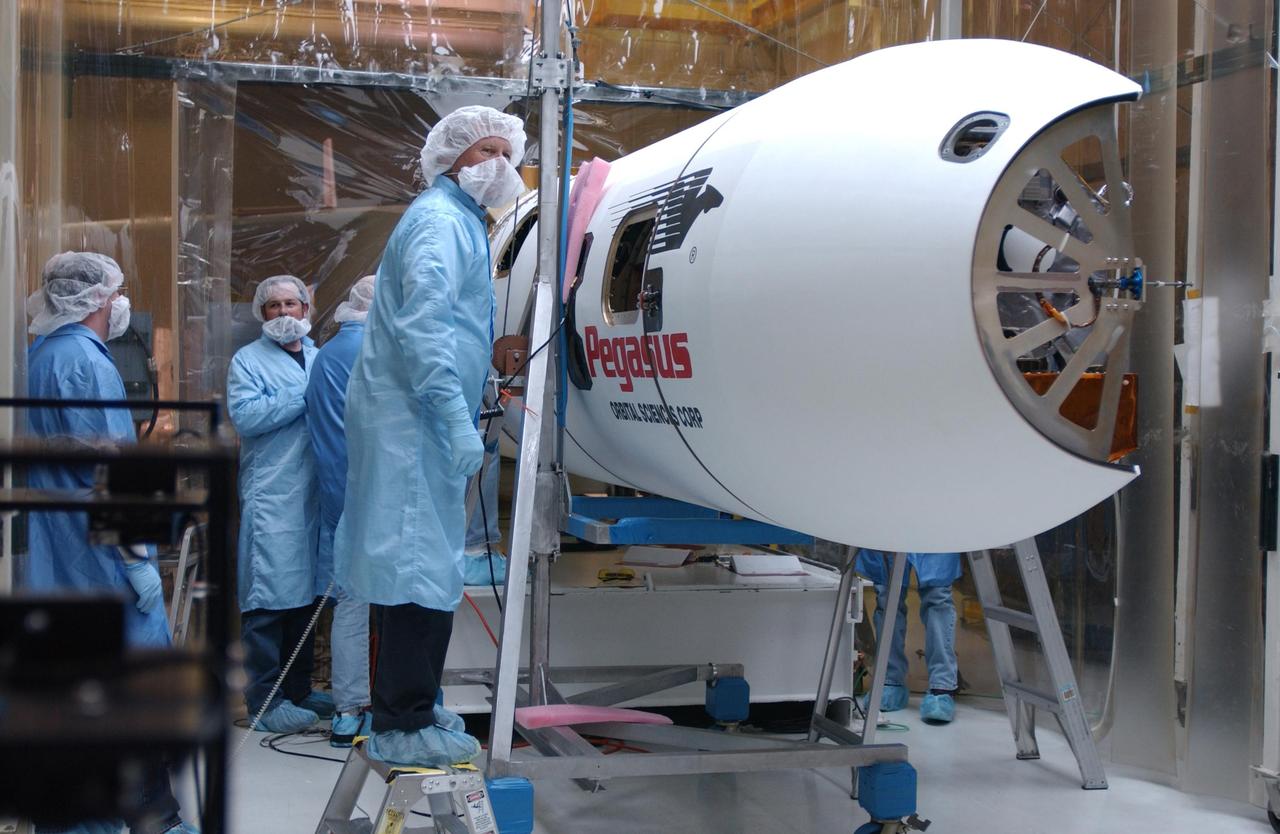
VANDENBERG AIR FORCE BASE, CALIF. -Inside Orbital Sciences’ Building 1555 at Vandenberg Air Force Base in California is the Pegasus XL launch vehicle and the Space Technology 5 (ST5) spacecraft being prepared for encapsulation before launch. The ST5, mated to Orbital Sciences' Pegasus XL launch vehicle, contains three microsatellites with miniaturized redundant components and technologies. Each will validate New Millennium Program selected technologies, such as the Cold Gas Micro-Thruster and X-Band Transponder Communication System. After deployment from the Pegasus, the micro-satellites will be positioned in a “string of pearls” constellation that demonstrates the ability to position them to perform simultaneous multi-point measurements of the magnetic field using highly sensitive magnetometers. The data will help scientists understand and map the intensity and direction of the Earth’s magnetic field, its relation to space weather events, and affects on our planet. With such missions, NASA hopes to improve scientists’ ability to accurately forecast space weather and minimize its harmful effects on space- and ground-based systems. Launch of ST5 is scheduled from the belly of an L-1011 carrier aircraft no earlier than March 14 from Vandenberg Air Force Base.
VANDENBERG AIR FORCE BASE, CALIF. - Inside Orbital Sciences’ Building 1555 at Vandenberg Air Force Base in California, workers check the Orbital Sciences' Pegasus XL launch vehicle before encapsulation of the Space Technology 5 (ST5) spacecraft. The ST5 contains three microsatellites with miniaturized redundant components and technologies. Each will validate New Millennium Program selected technologies, such as the Cold Gas Micro-Thruster and X-Band Transponder Communication System. After deployment from the Pegasus, the micro-satellites will be positioned in a “string of pearls” constellation that demonstrates the ability to position them to perform simultaneous multi-point measurements of the magnetic field using highly sensitive magnetometers. The data will help scientists understand and map the intensity and direction of the Earth’s magnetic field, its relation to space weather events, and affects on our planet. With such missions, NASA hopes to improve scientists’ ability to accurately forecast space weather and minimize its harmful effects on space- and ground-based systems. Launch of ST5 is scheduled from the belly of an L-1011 carrier aircraft no earlier than March 14 from Vandenberg Air Force Base.
VANDENBERG AIR FORCE BASE, CALIF. - Inside Orbital Sciences’ Building 1555 at Vandenberg Air Force Base in California, workers adjust the first half of the fairing being installed around the Space Technology 5 (ST5) spacecraft. The ST5 contains three microsatellites with miniaturized redundant components and technologies. Each will validate New Millennium Program selected technologies, such as the Cold Gas Micro-Thruster and X-Band Transponder Communication System. After deployment from the Pegasus, the micro-satellites will be positioned in a “string of pearls” constellation that demonstrates the ability to position them to perform simultaneous multi-point measurements of the magnetic field using highly sensitive magnetometers. The data will help scientists understand and map the intensity and direction of the Earth’s magnetic field, its relation to space weather events, and affects on our planet. With such missions, NASA hopes to improve scientists’ ability to accurately forecast space weather and minimize its harmful effects on space- and ground-based systems. Launch of ST5 is scheduled from the belly of an L-1011 carrier aircraft no earlier than March 14 from Vandenberg Air Force Base.
VANDENBERG AIR FORCE BASE, CALIF. - Inside Orbital Sciences’ Building 1555 at Vandenberg Air Force Base in California, one half of the fairing is being installed around the Space Technology 5 (ST5) spacecraft. The ST5 contains three microsatellites with miniaturized redundant components and technologies. Each will validate New Millennium Program selected technologies, such as the Cold Gas Micro-Thruster and X-Band Transponder Communication System. After deployment from the Pegasus, the micro-satellites will be positioned in a “string of pearls” constellation that demonstrates the ability to position them to perform simultaneous multi-point measurements of the magnetic field using highly sensitive magnetometers. The data will help scientists understand and map the intensity and direction of the Earth’s magnetic field, its relation to space weather events, and affects on our planet. With such missions, NASA hopes to improve scientists’ ability to accurately forecast space weather and minimize its harmful effects on space- and ground-based systems. Launch of ST5 is scheduled from the belly of an L-1011 carrier aircraft no earlier than March 14 from Vandenberg Air Force Base.
VANDENBERG AIR FORCE BASE, CALIF. - Inside Orbital Sciences’ Building 1555 at Vandenberg Air Force Base in California, workers move the second half of the fairing into position around the Space Technology 5 (ST5) spacecraft. The ST5, which contains three microsatellites with miniaturized redundant components and technologies, is mated to its launch vehicle, Orbital Sciences' Pegasus XL. Each of the ST5 microsatellites will validate New Millennium Program selected technologies, such as the Cold Gas Micro-Thruster and X-Band Transponder Communication System. After deployment from the Pegasus, the micro-satellites will be positioned in a “string of pearls” constellation that demonstrates the ability to position them to perform simultaneous multi-point measurements of the magnetic field using highly sensitive magnetometers. The data will help scientists understand and map the intensity and direction of the Earth’s magnetic field, its relation to space weather events, and affects on our planet. Launch of ST5 and the Pegasus XL will be from underneath the belly of an L-1011 carrier aircraft on March 14 from Vandenberg Air Force Base.
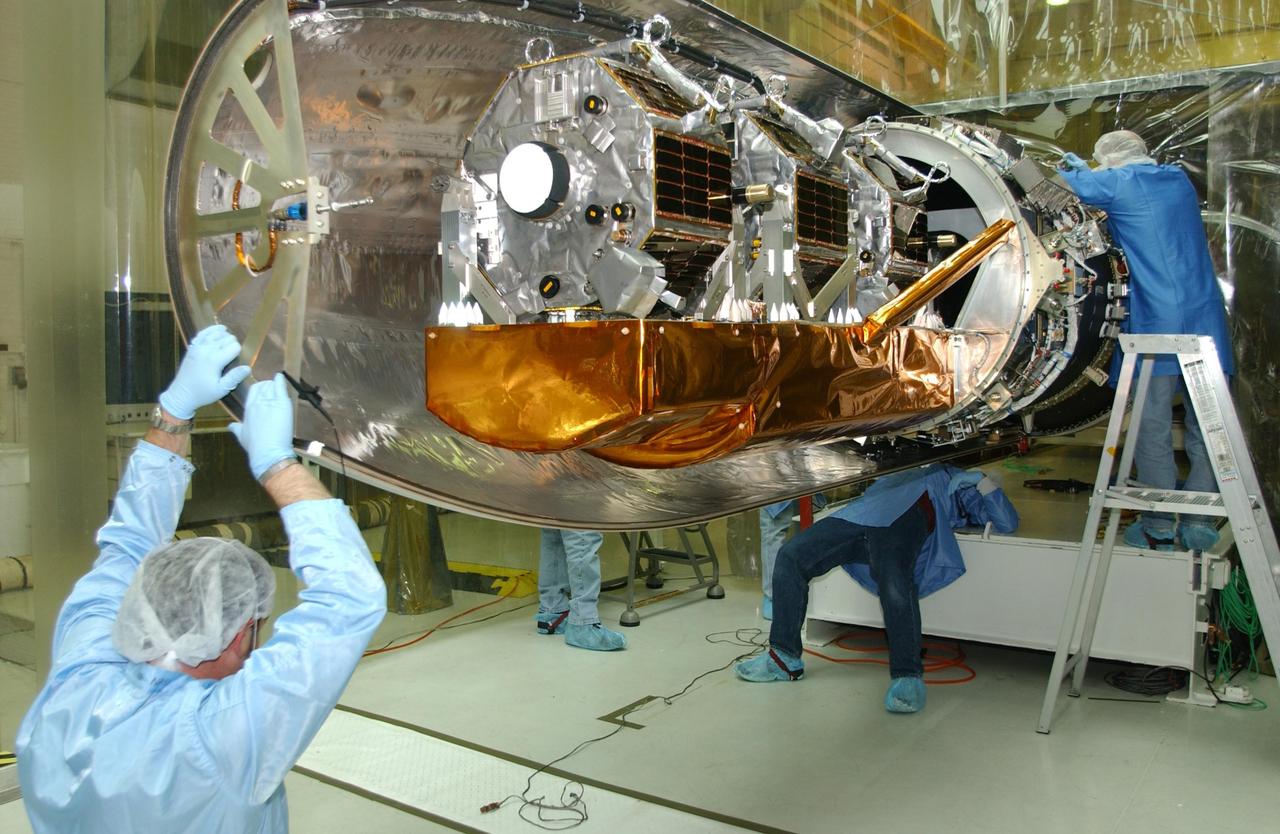
VANDENBERG AIR FORCE BASE, CALIF. - Inside Orbital Sciences’ Building 1555 at Vandenberg Air Force Base in California, this closeup shows two of the Space Technology 5 (ST5) spacecraft's microsatellites mounted on the payload structure that is mated to the Orbital Sciences' Pegasus XL launch vehicle. In the background is the fairing that will enclose the ST5 for launch. The ST5 contains three microsatellites with miniaturized redundant components and technologies. Each will validate New Millennium Program selected technologies, such as the Cold Gas Micro-Thruster and X-Band Transponder Communication System. After deployment from the Pegasus, the micro-satellites will be positioned in a “string of pearls” constellation that demonstrates the ability to position them to perform simultaneous multi-point measurements of the magnetic field using highly sensitive magnetometers. The data will help scientists understand and map the intensity and direction of the Earth’s magnetic field, its relation to space weather events, and affects on our planet. With such missions, NASA hopes to improve scientists’ ability to accurately forecast space weather and minimize its harmful effects on space- and ground-based systems. Launch of ST5 is scheduled from the belly of an L-1011 carrier aircraft no earlier than March 14 from Vandenberg Air Force Base.
VANDENBERG AIR FORCE BASE, CALIF. - Inside Orbital Sciences’ Building 1555 at Vandenberg Air Force Base in California, workers position the second half of the fairing into place around the Space Technology 5 (ST5) spacecraft. The ST5, which contains three microsatellites with miniaturized redundant components and technologies, is mated to its launch vehicle, Orbital Sciences' Pegasus XL. Each of the ST5 microsatellites will validate New Millennium Program selected technologies, such as the Cold Gas Micro-Thruster and X-Band Transponder Communication System. After deployment from the Pegasus, the micro-satellites will be positioned in a “string of pearls” constellation that demonstrates the ability to position them to perform simultaneous multi-point measurements of the magnetic field using highly sensitive magnetometers. The data will help scientists understand and map the intensity and direction of the Earth’s magnetic field, its relation to space weather events, and affects on our planet. Launch of ST5 and the Pegasus XL will be from underneath the belly of an L-1011 carrier aircraft on March 14 from Vandenberg Air Force Base.
VANDENBERG AIR FORCE BASE, CALIF. -Inside Orbital Sciences’ Building 1555 at Vandenberg Air Force Base in California, a worker checks connections on the Space Technology 5 (ST5) spacecraft before encapsulation with the fairing. The ST5, mated to Orbital Sciences' Pegasus XL launch vehicle, contains three microsatellites with miniaturized redundant components and technologies. Each will validate New Millennium Program selected technologies, such as the Cold Gas Micro-Thruster and X-Band Transponder Communication System. After deployment from the Pegasus, the micro-satellites will be positioned in a “string of pearls” constellation that demonstrates the ability to position them to perform simultaneous multi-point measurements of the magnetic field using highly sensitive magnetometers. The data will help scientists understand and map the intensity and direction of the Earth’s magnetic field, its relation to space weather events, and affects on our planet. With such missions, NASA hopes to improve scientists’ ability to accurately forecast space weather and minimize its harmful effects on space- and ground-based systems. Launch of ST5 is scheduled from the belly of an L-1011 carrier aircraft no earlier than March 14 from Vandenberg Air Force Base.

This enhanced color Jupiter image, taken by the JunoCam imager on NASA's Juno spacecraft, showcases several interesting features on the apparent edge (limb) of the planet. Prior to Juno's fifth flyby over Jupiter's mysterious cloud tops, members of the public voted on which targets JunoCam should image. This picture captures not only a fascinating variety of textures in Jupiter's atmosphere, it also features three specific points of interest: "String of Pearls," "Between the Pearls," and "An Interesting Band Point." Also visible is what's known as the STB Spectre, a feature in Jupiter's South Temperate Belt where multiple atmospheric conditions appear to collide. JunoCam images of Jupiter sometimes appear to have an odd shape. This is because the Juno spacecraft is so close to Jupiter that it cannot capture the entire illuminated area in one image -- the sides get cut off. Juno acquired this image on March 27, 2017, at 2:12 a.m. PDT (5:12 a.m. EDT), as the spacecraft performed a close flyby of Jupiter. When the image was taken, the spacecraft was about 12,400 miles (20,000 kilometers) from the planet. https://photojournal.jpl.nasa.gov/catalog/PIA21389. - Enhanced image by Björn Jónsson (CC-NC-SA) based on images provided courtesy of NASA/JPL-Caltech/SwRI/MSSS

KENNEDY SPACE CENTER, FLA. - Inside Orbital Sciences’ Building 1555 at Vandenberg Air Force Base in California, the Pegasus XL launch vehicle is ready for mating with the Space Technology 5 (ST5) spacecraft. The ST5 contains three microsatellites with miniaturized redundant components and technologies. Each will validate New Millennium Program selected technologies, such as the Cold Gas Micro-Thruster and X-Band Transponder Communication System. After deployment from the Pegasus, the micro-satellites will be positioned in a “string of pearls” constellation that demonstrates the ability to position them to perform simultaneous multi-point measurements of the magnetic field using highly sensitive magnetometers. The data will help scientists understand and map the intensity and direction of the Earth’s magnetic field, its relation to space weather events, and affects on our planet. With such missions, NASA hopes to improve scientists’ ability to accurately forecast space weather and minimize its harmful effects on space- and ground-based systems. Launch of ST5 is scheduled no earlier than March 6 from Vandenberg Air Force Base.
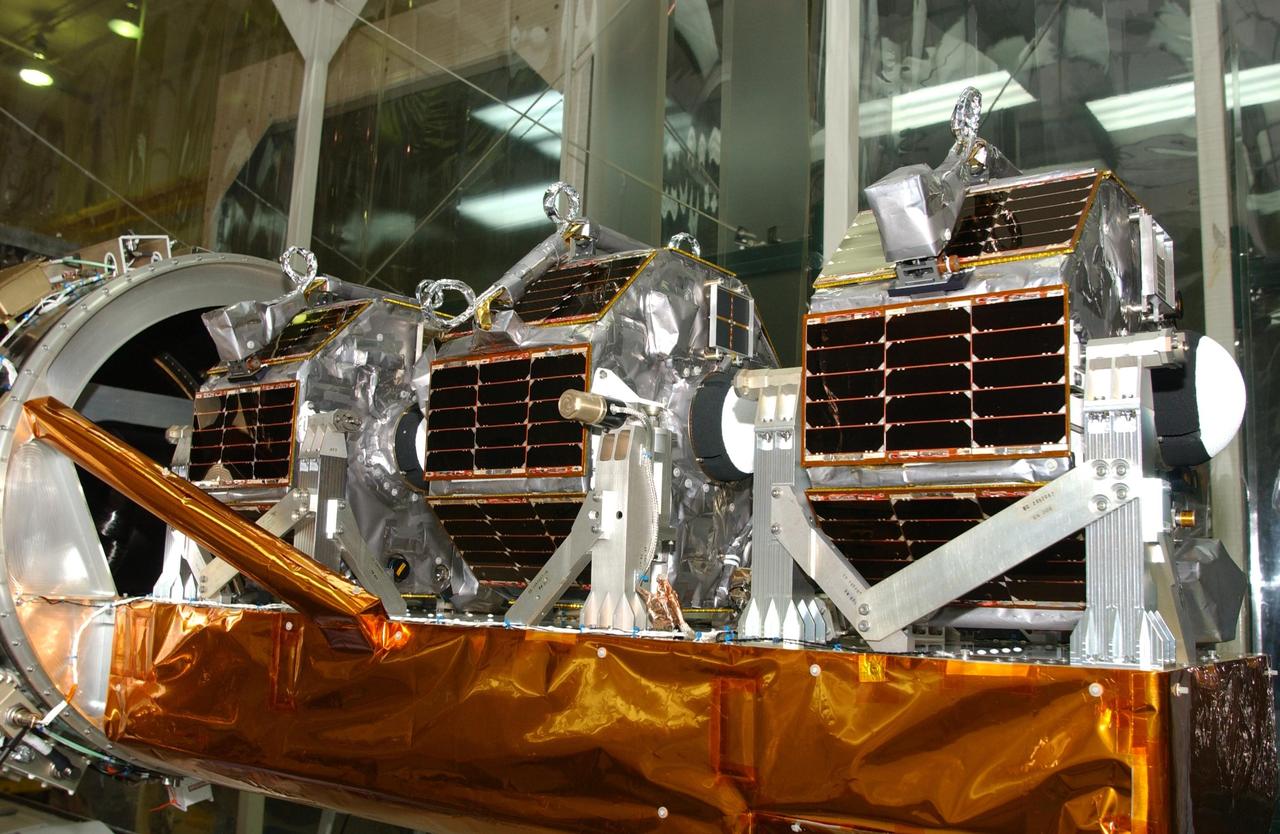
VANDENBERG AIR FORCE BASE, CALIF. - Inside Orbital Sciences’ Building 1555 at Vandenberg Air Force Base in California, this closeup shows the Space Technology 5 (ST5) spacecraft's microsatellites mounted on the payload structure. The spacecraft will be enclosed for launch. The ST5 contains three microsatellites with miniaturized redundant components and technologies. Each will validate New Millennium Program selected technologies, such as the Cold Gas Micro-Thruster and X-Band Transponder Communication System. After deployment from the Pegasus, the micro-satellites will be positioned in a “string of pearls” constellation that demonstrates the ability to position them to perform simultaneous multi-point measurements of the magnetic field using highly sensitive magnetometers. The data will help scientists understand and map the intensity and direction of the Earth’s magnetic field, its relation to space weather events, and affects on our planet. With such missions, NASA hopes to improve scientists’ ability to accurately forecast space weather and minimize its harmful effects on space- and ground-based systems. Launch of ST5 is scheduled from the belly of an L-1011 carrier aircraft no earlier than March 14 from Vandenberg Air Force Base.

VANDENBERG AIR FORCE BASE, CALIF. - Inside Orbital Sciences’ Building 1555 at Vandenberg Air Force Base in California, workers clean and prepare the fairing to be installed around the Space Technology 5 (ST5) spacecraft. The ST5 contains three microsatellites with miniaturized redundant components and technologies. Each will validate New Millennium Program selected technologies, such as the Cold Gas Micro-Thruster and X-Band Transponder Communication System. After deployment from the Pegasus, the micro-satellites will be positioned in a “string of pearls” constellation that demonstrates the ability to position them to perform simultaneous multi-point measurements of the magnetic field using highly sensitive magnetometers. The data will help scientists understand and map the intensity and direction of the Earth’s magnetic field, its relation to space weather events, and affects on our planet. With such missions, NASA hopes to improve scientists’ ability to accurately forecast space weather and minimize its harmful effects on space- and ground-based systems. Launch of ST5 is scheduled from the belly of an L-1011 carrier aircraft no earlier than March 14 from Vandenberg Air Force Base.
VANDENBERG AIR FORCE BASE, CALIF. - Inside Orbital Sciences’ Building 1555 at Vandenberg Air Force Base in California, the Space Technology 5 (ST5) spacecraft waits for encapsulation after mating with the Orbital Sciences' Pegasus XL launch vehicle. The ST5 contains three microsatellites with miniaturized redundant components and technologies. Each will validate New Millennium Program selected technologies, such as the Cold Gas Micro-Thruster and X-Band Transponder Communication System. After deployment from the Pegasus, the micro-satellites will be positioned in a “string of pearls” constellation that demonstrates the ability to position them to perform simultaneous multi-point measurements of the magnetic field using highly sensitive magnetometers. The data will help scientists understand and map the intensity and direction of the Earth’s magnetic field, its relation to space weather events, and affects on our planet. With such missions, NASA hopes to improve scientists’ ability to accurately forecast space weather and minimize its harmful effects on space- and ground-based systems. Launch of ST5 is scheduled from the belly of an L-1011 carrier aircraft no earlier than March 14 from Vandenberg Air Force Base.
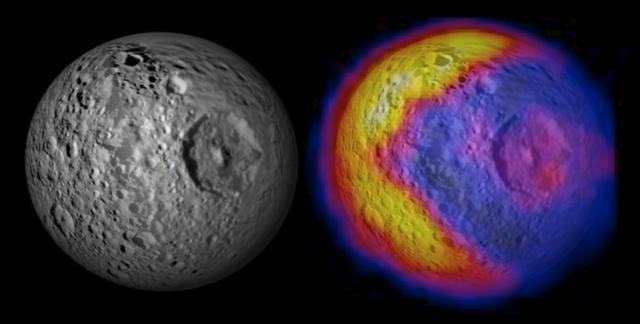
NASA release date March 29, 2010 The highest-resolution-yet temperature map and images of Saturn’s icy moon Mimas obtained by NASA’s Cassini spacecraft reveal surprising patterns on the surface of the small moon, including unexpected hot regions that resemble “Pac-Man” eating a dot, and striking bands of light and dark in crater walls. The left portion of this image shows Mimas in visible light, an image that has drawn comparisons to the "Star Wars" Death Star. The right portion shows the new temperature map, which resembles 1980s video game icon "Pac Man." To learn more about this image go to: <a href="http://www.nasa.gov/centers/goddard/news/features/2010/pac-man-mimas.html" rel="nofollow">www.nasa.gov/centers/goddard/news/features/2010/pac-man-m...</a> Credit: NASA/JPL/Goddard/SWRI/SSI <b><a href="http://www.nasa.gov/centers/goddard/home/index.html" rel="nofollow">NASA Goddard Space Flight Center</a></b> is home to the nation's largest organization of combined scientists, engineers and technologists that build spacecraft, instruments and new technology to study the Earth, the sun, our solar system, and the universe.

VANDENBERG AIR FORCE BASE, CALIF. - Inside Orbital Sciences’ Building 1555 at Vandenberg Air Force Base in California, workers check the placement of the second half of the fairing around the Space Technology 5 (ST5) spacecraft. The ST5, which contains three microsatellites with miniaturized redundant components and technologies, is mated to its launch vehicle, Orbital Sciences' Pegasus XL. Each of the ST5 microsatellites will validate New Millennium Program selected technologies, such as the Cold Gas Micro-Thruster and X-Band Transponder Communication System. After deployment from the Pegasus, the micro-satellites will be positioned in a “string of pearls” constellation that demonstrates the ability to position them to perform simultaneous multi-point measurements of the magnetic field using highly sensitive magnetometers. The data will help scientists understand and map the intensity and direction of the Earth’s magnetic field, its relation to space weather events, and affects on our planet. Launch of ST5 and the Pegasus XL will be from underneath the belly of an L-1011 carrier aircraft on March 14 from Vandenberg Air Force Base.

NASA's 2001 Mars Odyssey orbiter captured this single image of Olympus Mons, the tallest volcano in the solar system, on March 11, 2024. Besides providing an unprecedented view of the volcano, the image helps scientists study different layers of material in the Martian atmosphere, including clouds and dust. The panorama was created by rotating Odyssey so that its camera, the Thermal Emission Imaging System (THEMIS), faced the horizon of Mars as the orbiter soared past. This shot was among several taken in the latest effort by Odyssey using this technique; capturing this sort of horizon imagery at different times of year allows scientists to study how the atmosphere changes over seasons. The bluish-white band at the bottom of the atmosphere hints at how much dust was present when the image was captured during Mars' dust season. A purplish layer follows, likely due to a mixture of Mars' red dust with some bluish water-ice clouds. Finally, a blue-green layer can be seen where water-ice clouds reach up about 31 miles (50 kilometers) into the sky. https://photojournal.jpl.nasa.gov/catalog/PIA26305
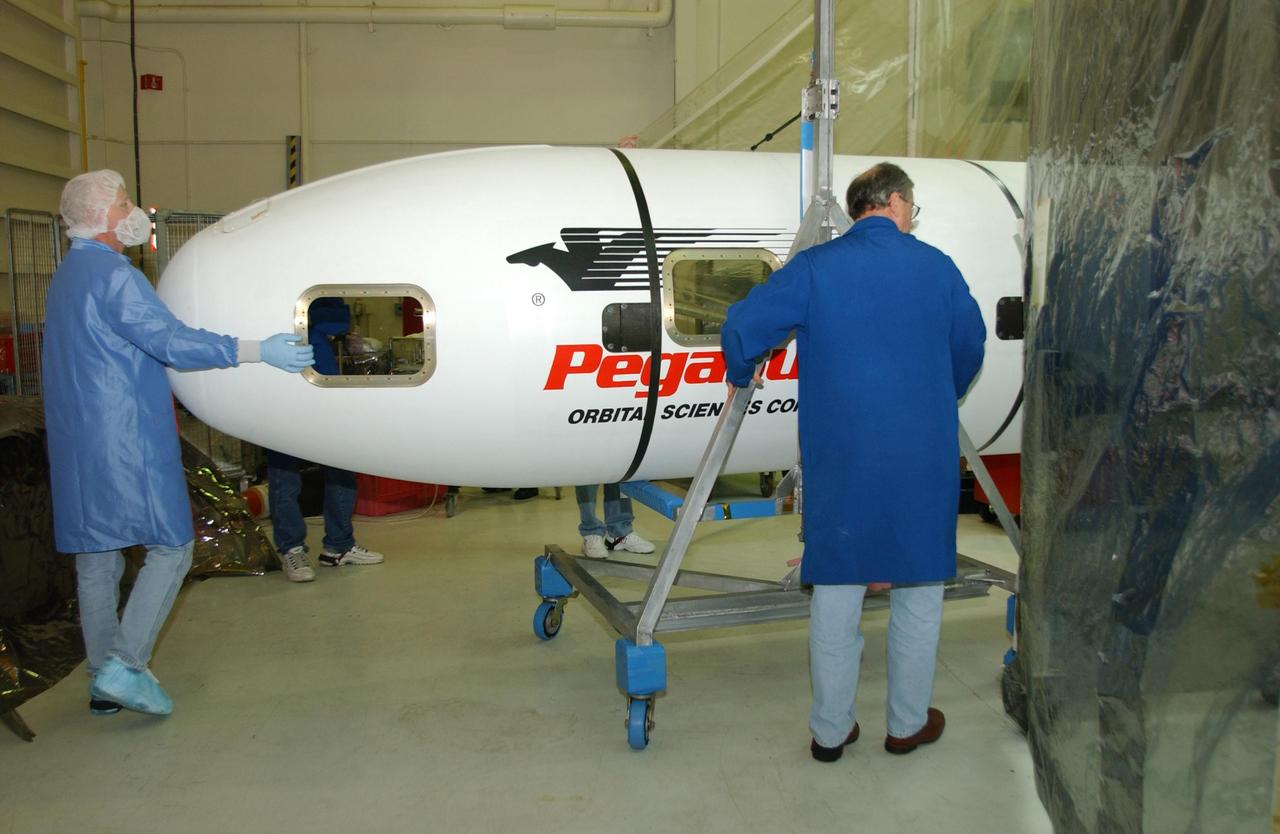
VANDENBERG AIR FORCE BASE, CALIF. - Inside Orbital Sciences’ Building 1555 at Vandenberg Air Force Base in California, workers prepare the fairing to be installed around the Space Technology 5 (ST5) spacecraft. The ST5 contains three microsatellites with miniaturized redundant components and technologies. Each will validate New Millennium Program selected technologies, such as the Cold Gas Micro-Thruster and X-Band Transponder Communication System. After deployment from the Pegasus, the micro-satellites will be positioned in a “string of pearls” constellation that demonstrates the ability to position them to perform simultaneous multi-point measurements of the magnetic field using highly sensitive magnetometers. The data will help scientists understand and map the intensity and direction of the Earth’s magnetic field, its relation to space weather events, and affects on our planet. With such missions, NASA hopes to improve scientists’ ability to accurately forecast space weather and minimize its harmful effects on space- and ground-based systems. Launch of ST5 is scheduled from the belly of an L-1011 carrier aircraft no earlier than March 14 from Vandenberg Air Force Base.
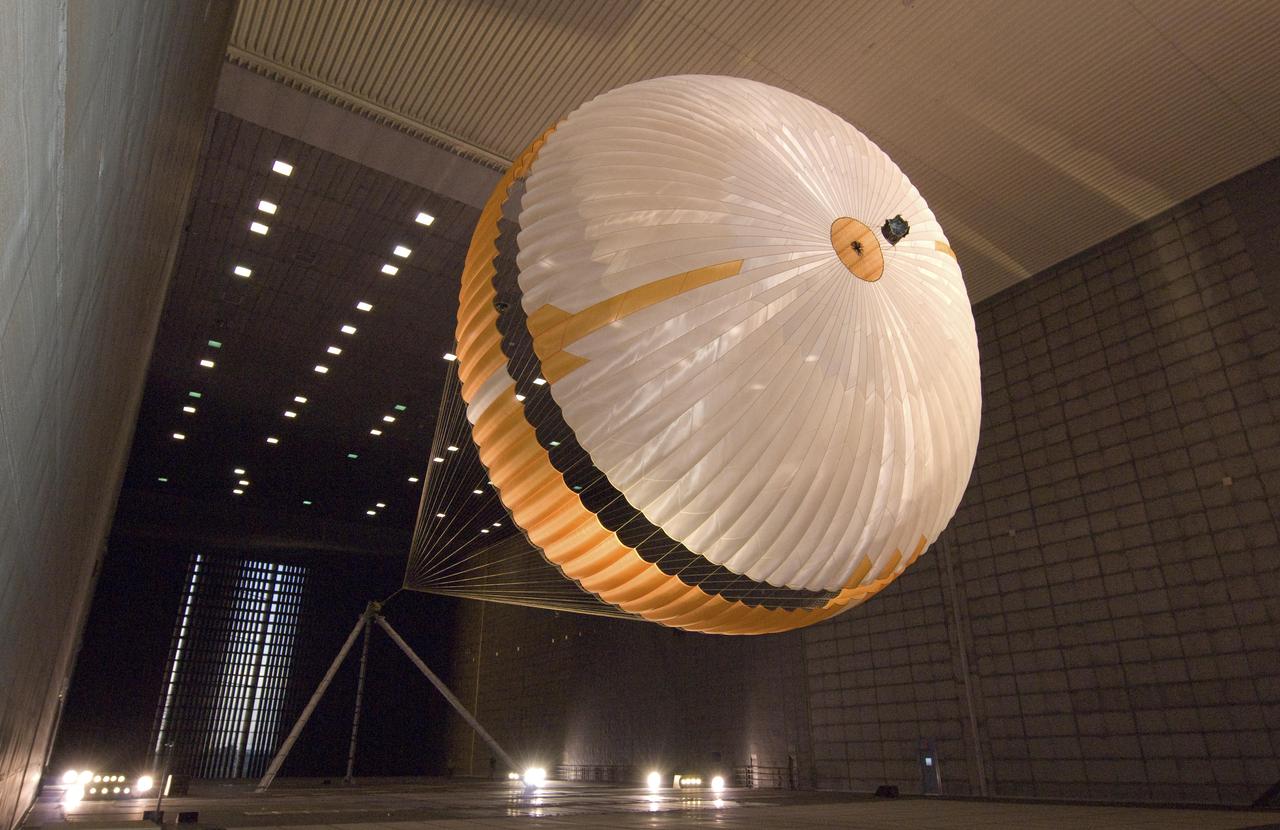
The parachute for NASA next mission to Mars passed flight-qualification testing in March and April 2009 inside the world largest wind tunnel, at NASA Ames Research Center, Moffett Field, Calif. NASA's Mars Science Laboratory mission, to be launched in 2011 and land on Mars in 2012, will use the largest parachute ever built to fly on an extraterrestrial mission. This image shows a duplicate qualification-test parachute inflated in an 80-mile-per-hour (36-meter-per-second) wind inside the test facility. The parachute uses a configuration called disk-gap-band. It has 80 suspension lines, measures more than 50 meters (165 feet) in length, and opens to a diameter of nearly 16 meters (51 feet). Most of the orange and white fabric is nylon, though a small disk of heavier polyester is used near the vent in the apex of the canopy due to higher stresses there. It is designed to survive deployment at Mach 2.2 in the Martian atmosphere, where it will generate up to 65,000 pounds of drag force. The wind tunnel is 24 meters (80 feet) tall and 37 meters (120 feet) wide, big enough to house a Boeing 737. It is part of the National Full-Scale Aerodynamics Complex, operated by the Arnold Engineering Development Center of the U.S. Air Force. http://photojournal.jpl.nasa.gov/catalog/PIA11995
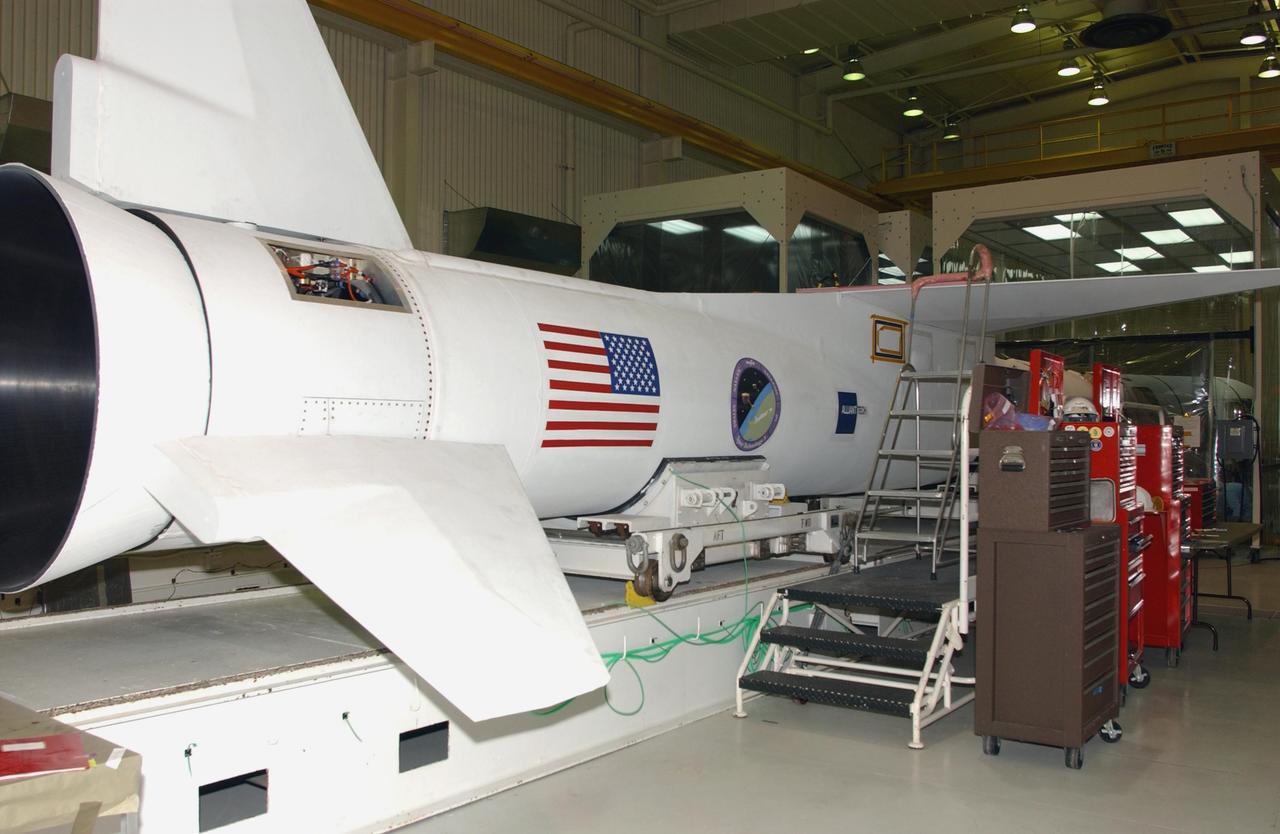
VANDENBERG AIR FORCE BASE, CALIF. - Inside Orbital Sciences’ Building 1555 at Vandenberg Air Force Base in California, the Pegasus XL launch vehicle stands ready for mating with the Space Technology 5 (ST5) spacecraft. The ST5 contains three microsatellites with miniaturized redundant components and technologies. Each will validate New Millennium Program selected technologies, such as the Cold Gas Micro-Thruster and X-Band Transponder Communication System. After deployment from the Pegasus, the micro-satellites will be positioned in a “string of pearls” constellation that demonstrates the ability to position them to perform simultaneous multi-point measurements of the magnetic field using highly sensitive magnetometers. The data will help scientists understand and map the intensity and direction of the Earth’s magnetic field, its relation to space weather events, and affects on our planet. With such missions, NASA hopes to improve scientists’ ability to accurately forecast space weather and minimize its harmful effects on space- and ground-based systems. Launch of ST5 is scheduled from the belly of an L-1011 carrier aircraft no earlier than March 14 from Vandenberg Air Force Base.

VANDENBERG AIR FORCE BASE, CALIF. - Inside Orbital Sciences’ Building 1555 at Vandenberg Air Force Base in California, the Pegasus XL launch vehicle stands ready for mating with the Space Technology 5 (ST5) spacecraft. The ST5 contains three microsatellites with miniaturized redundant components and technologies. Each will validate New Millennium Program selected technologies, such as the Cold Gas Micro-Thruster and X-Band Transponder Communication System. After deployment from the Pegasus, the micro-satellites will be positioned in a “string of pearls” constellation that demonstrates the ability to position them to perform simultaneous multi-point measurements of the magnetic field using highly sensitive magnetometers. The data will help scientists understand and map the intensity and direction of the Earth’s magnetic field, its relation to space weather events, and affects on our planet. With such missions, NASA hopes to improve scientists’ ability to accurately forecast space weather and minimize its harmful effects on space- and ground-based systems. Launch of ST5 is scheduled from the belly of an L-1011 carrier aircraft no earlier than March 14 from Vandenberg Air Force Base.
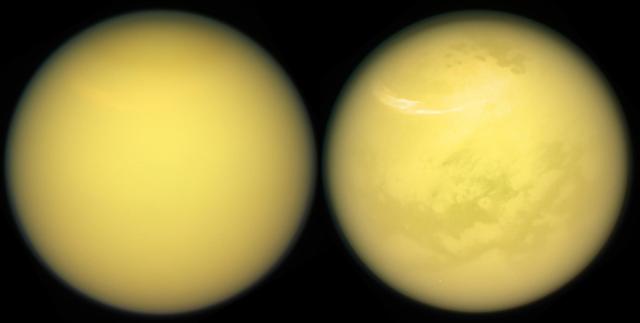
These two views of Saturn's moon Titan exemplify how NASA's Cassini spacecraft has revealed the surface of this fascinating world. Cassini carried several instruments to pierce the veil of hydrocarbon haze that enshrouds Titan. The mission's imaging cameras also have several spectral filters sensitive to specific wavelengths of infrared light that are able to make it through the haze to the surface and back into space. These "spectral windows" have enable the imaging cameras to map nearly the entire surface of Titan. In addition to Titan's surface, images from both the imaging cameras and VIMS have provided windows into the moon's ever-changing atmosphere, chronicling the appearance and movement of hazes and clouds over the years. A large, bright and feathery band of summer clouds can be seen arcing across high northern latitudes in the view at right. These views were obtained with the Cassini spacecraft narrow-angle camera on March 21, 2017. Images taken using red, green and blue spectral filters were combined to create the natural-color view at left. The false-color view at right was made by substituting an infrared image (centered at 938 nanometers) for the red color channel. The views were acquired at a distance of approximately 613,000 miles (986,000 kilometers) from Titan. Image scale is about 4 miles (6 kilometers) per pixel. https://photojournal.jpl.nasa.gov/catalog/PIA21624
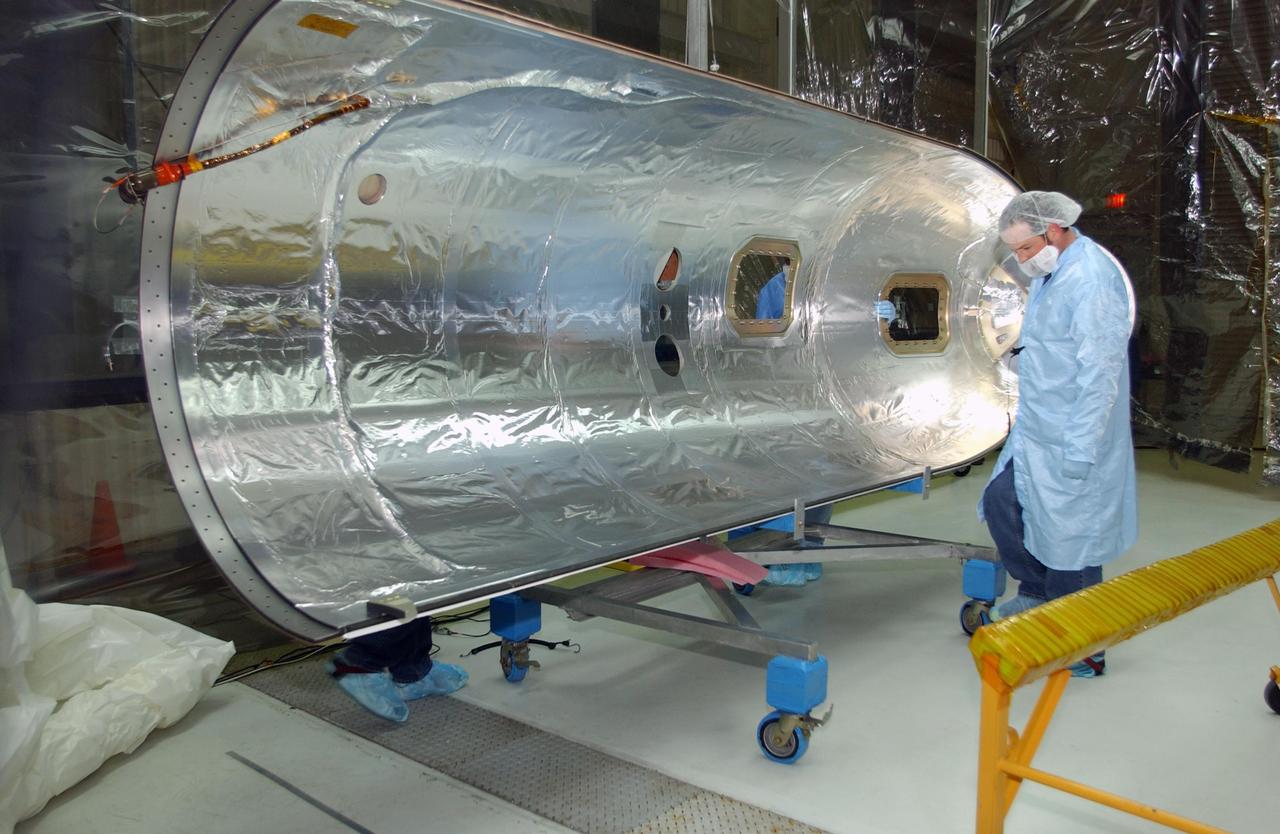
VANDENBERG AIR FORCE BASE, CALIF. - Inside Orbital Sciences’ Building 1555 at Vandenberg Air Force Base in California, workers clean and prepare the fairing to be installed around the Space Technology 5 (ST5) spacecraft. The ST5 contains three microsatellites with miniaturized redundant components and technologies. Each will validate New Millennium Program selected technologies, such as the Cold Gas Micro-Thruster and X-Band Transponder Communication System. After deployment from the Pegasus, the micro-satellites will be positioned in a “string of pearls” constellation that demonstrates the ability to position them to perform simultaneous multi-point measurements of the magnetic field using highly sensitive magnetometers. The data will help scientists understand and map the intensity and direction of the Earth’s magnetic field, its relation to space weather events, and affects on our planet. With such missions, NASA hopes to improve scientists’ ability to accurately forecast space weather and minimize its harmful effects on space- and ground-based systems. Launch of ST5 is scheduled from the belly of an L-1011 carrier aircraft no earlier than March 14 from Vandenberg Air Force Base.
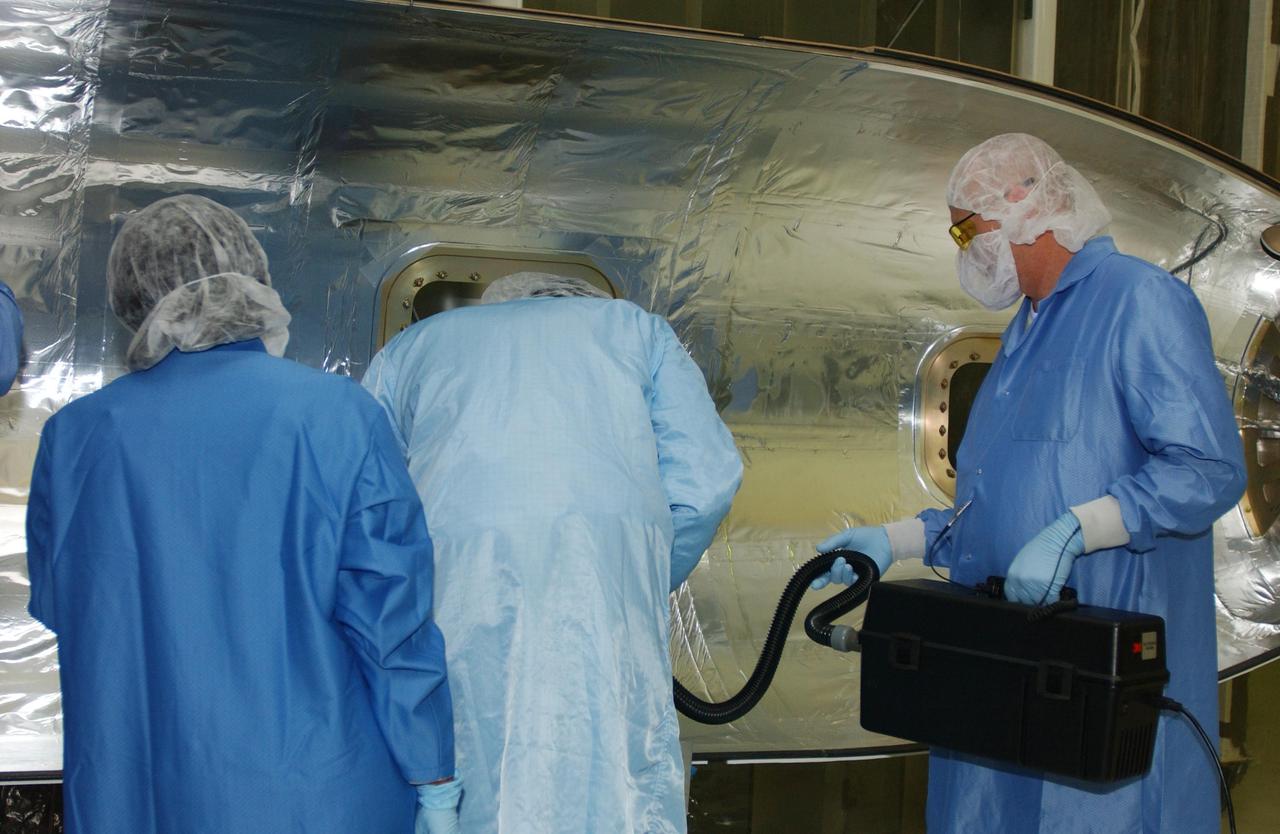
VANDENBERG AIR FORCE BASE, CALIF. - Inside Orbital Sciences’ Building 1555 at Vandenberg Air Force Base in California, workers clean and prepare the fairing to be installed around the Space Technology 5 (ST5) spacecraft. The ST5 contains three microsatellites with miniaturized redundant components and technologies. Each will validate New Millennium Program selected technologies, such as the Cold Gas Micro-Thruster and X-Band Transponder Communication System. After deployment from the Pegasus, the micro-satellites will be positioned in a “string of pearls” constellation that demonstrates the ability to position them to perform simultaneous multi-point measurements of the magnetic field using highly sensitive magnetometers. The data will help scientists understand and map the intensity and direction of the Earth’s magnetic field, its relation to space weather events, and affects on our planet. With such missions, NASA hopes to improve scientists’ ability to accurately forecast space weather and minimize its harmful effects on space- and ground-based systems. Launch of ST5 is scheduled from the belly of an L-1011 carrier aircraft no earlier than March 14 from Vandenberg Air Force Base.
NASA's Curiosity Mars rover used its Mast Camera, or Mastcam, to capture this panorama in morning light on March 9, 2025, the 4,476th Martian day, or sol, of the mission. Steep hills on the left side of the panorama enclose wind-carved valleys on Mount Sharp, the mountain that Curiosity has been climbing for over a decade. Broken-up, rounded rocks throughout the foreground are part of the mountain's sulfate-bearing unit. The butte in the distance at right is nicknamed "Gould Mesa." A band of cliffs and dark ridges near the top of the butte may be the first glimpses of boxwork formations, a kind of feature created by groundwater flowing through large bedrock fractures in the ancient past. Assuming that is how they formed, these could represent the last gasps of water found on this region of Mars before the planet dried out completely. Before now, these features had only been viewed from orbiting spacecraft, to which they appeared as spiderweb-like fractures. This pattern of fractures stretches as long as 6 to 12 miles (10 to 20 kilometers) across the side of Mount Sharp. The rover's team expects to study these formations up close throughout the rest of 2025. The color in this image has been adjusted to match lighting conditions as the human eye would see them on Earth. https://photojournal.jpl.nasa.gov/catalog/PIA26552
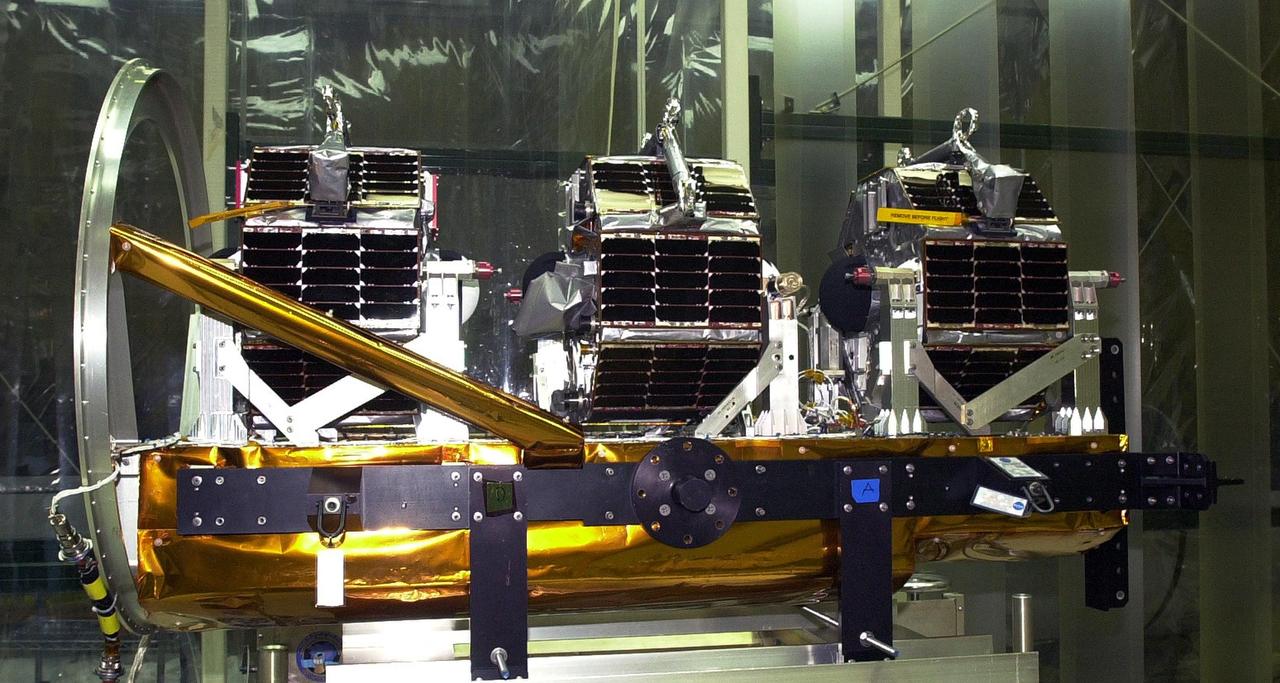
KENNEDY SPACE CENTER, FLA. - Inside Orbital Sciences’ Building 1555 at Vandenberg Air Force Base in California, the Space Technology 5 (ST5) spacecraft is ready for mating to the Pegasus XL launch vehicle. Seen in the photo are the three satellites that make up the ST5, containing miniaturized redundant components and technologies. Each will validate New Millennium Program selected technologies, such as the Cold Gas Micro-Thruster and X-Band Transponder Communication System. After deployment from the Pegasus, the micro-satellites will be positioned in a “string of pearls” constellation that demonstrates the ability to position them to perform simultaneous multi-point measurements of the magnetic field using highly sensitive magnetometers. The data will help scientists understand and map the intensity and direction of the Earth’s magnetic field, its relation to space weather events, and affects on our planet. With such missions, NASA hopes to improve scientists’ ability to accurately forecast space weather and minimize its harmful effects on space- and ground-based systems. Launch of ST5 is scheduled no earlier than March 6 from Vandenberg Air Force Base.
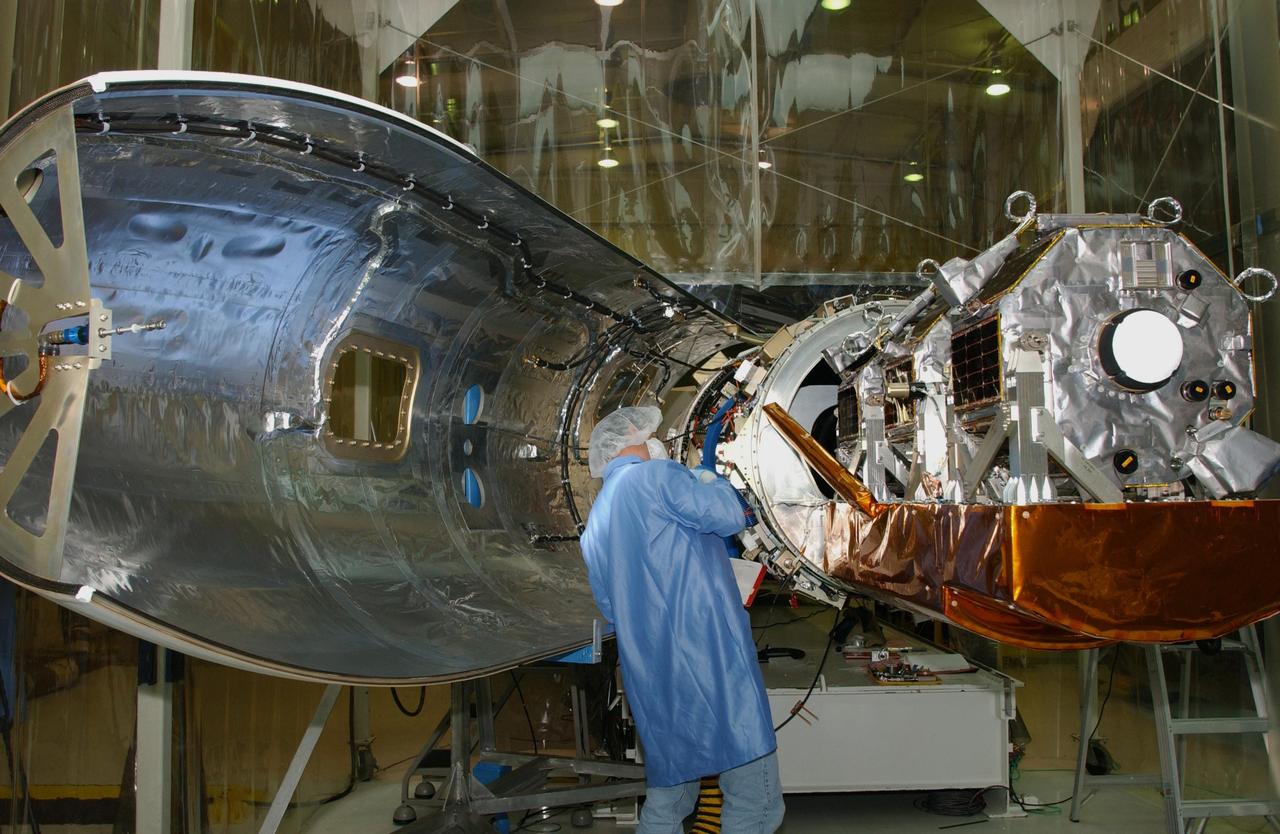
VANDENBERG AIR FORCE BASE, CALIF. - Inside Orbital Sciences’ Building 1555 at Vandenberg Air Force Base in California, a worker completes connections on the Space Technology 5 (ST5) spacecraft before enclosure. The ST5, mated to Orbital Sciences' Pegasus XL launch vehicle, contains three microsatellites with miniaturized redundant components and technologies. Each will validate New Millennium Program selected technologies, such as the Cold Gas Micro-Thruster and X-Band Transponder Communication System. After deployment from the Pegasus, the micro-satellites will be positioned in a “string of pearls” constellation that demonstrates the ability to position them to perform simultaneous multi-point measurements of the magnetic field using highly sensitive magnetometers. The data will help scientists understand and map the intensity and direction of the Earth’s magnetic field, its relation to space weather events, and affects on our planet. With such missions, NASA hopes to improve scientists’ ability to accurately forecast space weather and minimize its harmful effects on space- and ground-based systems. Launch of ST5 is scheduled from the belly of an L-1011 carrier aircraft no earlier than March 14 from Vandenberg Air Force Base.
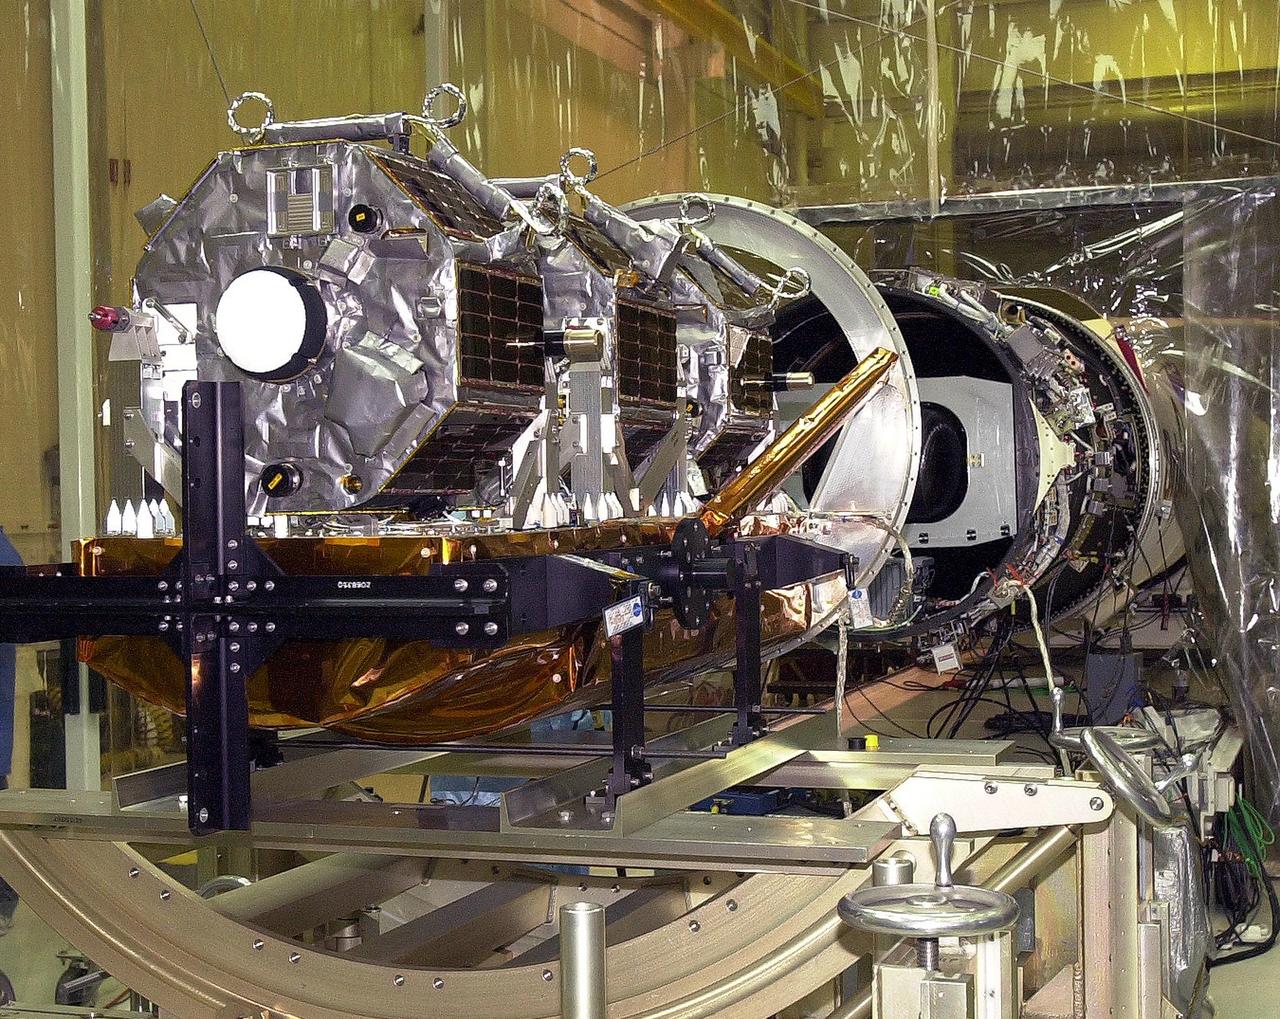
KENNEDY SPACE CENTER, FLA. - Inside Orbital Sciences’ Building 1555 at Vandenberg Air Force Base in California, the Space Technology 5 (ST5) spacecraft is ready for mating to the Pegasus XL launch vehicle. Seen in the photo are the three satellites that make up the ST5, containing miniaturized redundant components and technologies. Each will validate New Millennium Program selected technologies, such as the Cold Gas Micro-Thruster and X-Band Transponder Communication System. After deployment from the Pegasus, the micro-satellites will be positioned in a “string of pearls” constellation that demonstrates the ability to position them to perform simultaneous multi-point measurements of the magnetic field using highly sensitive magnetometers. The data will help scientists understand and map the intensity and direction of the Earth’s magnetic field, its relation to space weather events, and affects on our planet. With such missions, NASA hopes to improve scientists’ ability to accurately forecast space weather and minimize its harmful effects on space- and ground-based systems. Launch of ST5 is scheduled no earlier than March 6 from Vandenberg Air Force Base.

KENNEDY SPACE CENTER, FLA. - Inside Orbital Sciences’ Building 1555 at Vandenberg Air Force Base in California, a worker examines the end of the Pegasus XL launch vehicle that will be mated with the Space Technology 5 (ST5) spacecraft. The ST5 contains three microsatellites with miniaturized redundant components and technologies. Each will validate New Millennium Program selected technologies, such as the Cold Gas Micro-Thruster and X-Band Transponder Communication System. After deployment from the Pegasus, the micro-satellites will be positioned in a “string of pearls” constellation that demonstrates the ability to position them to perform simultaneous multi-point measurements of the magnetic field using highly sensitive magnetometers. The data will help scientists understand and map the intensity and direction of the Earth’s magnetic field, its relation to space weather events, and affects on our planet. With such missions, NASA hopes to improve scientists’ ability to accurately forecast space weather and minimize its harmful effects on space- and ground-based systems. Launch of ST5 is scheduled no earlier than March 6 from Vandenberg Air Force Base.
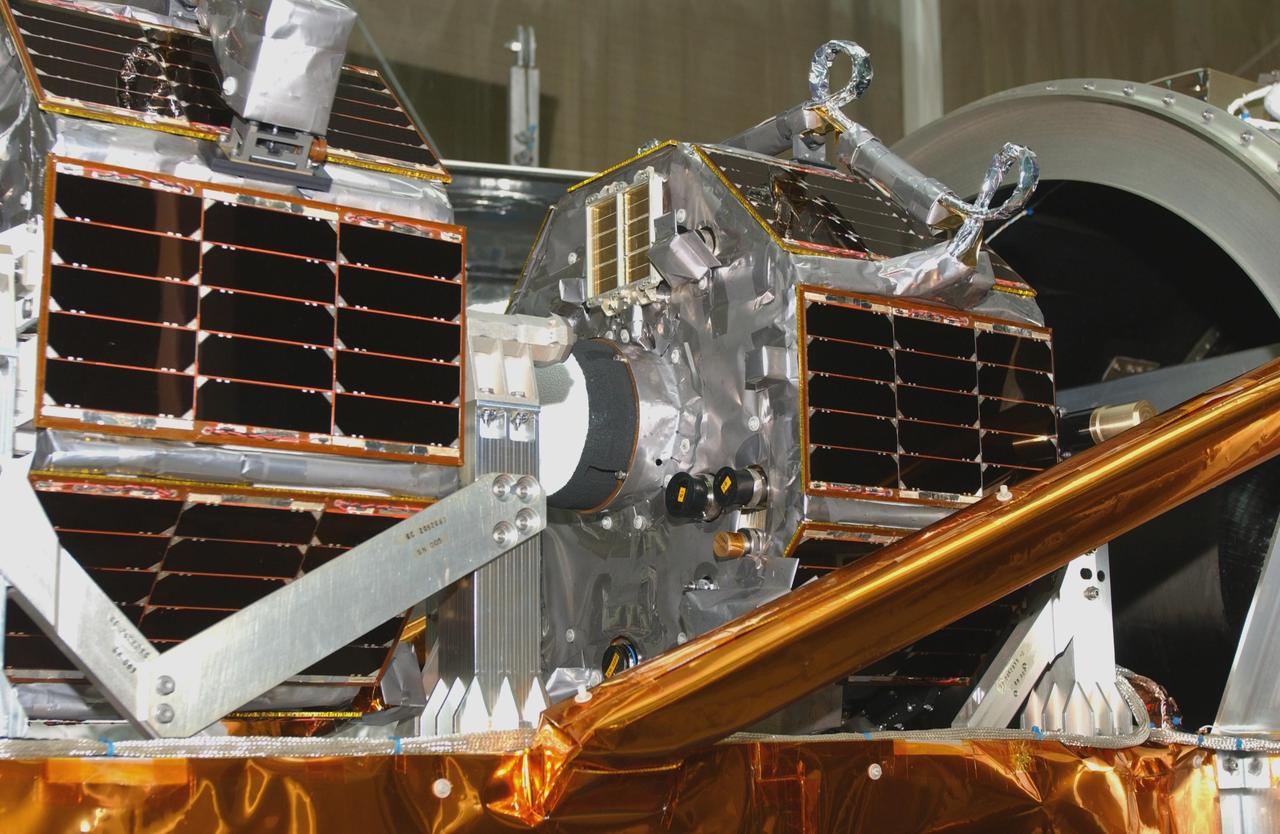
VANDENBERG AIR FORCE BASE, CALIF. - Inside Orbital Sciences’ Building 1555 at Vandenberg Air Force Base in California, this photo shows two of the Space Technology 5 (ST5) spacecraft's microsatellites mounted on the payload structure that is mated to the Orbital Sciences' Pegasus XL launch vehicle. The ST5 contains three microsatellites with miniaturized redundant components and technologies. Each will validate New Millennium Program selected technologies, such as the Cold Gas Micro-Thruster and X-Band Transponder Communication System. After deployment from the Pegasus, the micro-satellites will be positioned in a “string of pearls” constellation that demonstrates the ability to position them to perform simultaneous multi-point measurements of the magnetic field using highly sensitive magnetometers. The data will help scientists understand and map the intensity and direction of the Earth’s magnetic field, its relation to space weather events, and affects on our planet. With such missions, NASA hopes to improve scientists’ ability to accurately forecast space weather and minimize its harmful effects on space- and ground-based systems. Launch of ST5 is scheduled from the belly of an L-1011 carrier aircraft no earlier than March 14 from Vandenberg Air Force Base.
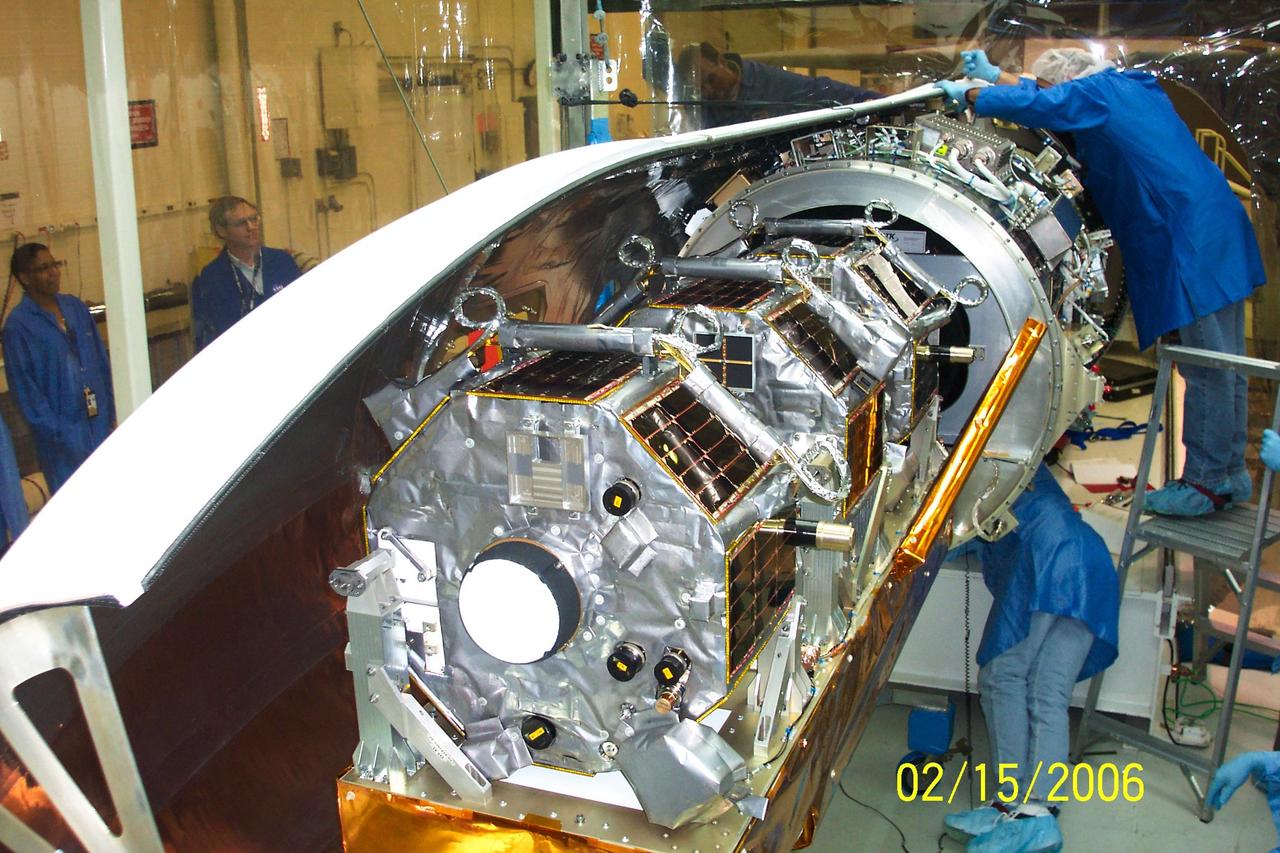
VANDENBERG AIR FORCE BASE, CALIF. - Inside Orbital Sciences’ Building 1555 at Vandenberg Air Force Base in California, workers adjust the first half of the fairing around the Space Technology 5 (ST5) spacecraft. The ST5, which contains three microsatellites with miniaturized redundant components and technologies, is mated to its launch vehicle, Orbital Sciences' Pegasus XL. Each of the ST5 microsatellites will validate New Millennium Program selected technologies, such as the Cold Gas Micro-Thruster and X-Band Transponder Communication System. After deployment from the Pegasus, the micro-satellites will be positioned in a “string of pearls” constellation that demonstrates the ability to position them to perform simultaneous multi-point measurements of the magnetic field using highly sensitive magnetometers. The data will help scientists understand and map the intensity and direction of the Earth’s magnetic field, its relation to space weather events, and affects on our planet. Launch of ST5 and the Pegasus XL will be from underneath the belly of an L-1011 carrier aircraft on March 14 from Vandenberg Air Force Base.

KENNEDY SPACE CENTER, FLA. - Inside Orbital Sciences’ Building 1555 at Vandenberg Air Force Base in California, workers begin the mating process of the Space Technology 5 (ST5), at right, with the Pegasus XL launch vehicle, at left. The ST5 contains three microsatellites, with miniaturized redundant components and technologies. Each will validate New Millennium Program selected technologies, such as the Cold Gas Micro-Thruster and X-Band Transponder Communication System. After deployment from the Pegasus, the micro-satellites will be positioned in a “string of pearls” constellation that demonstrates the ability to position them to perform simultaneous multi-point measurements of the magnetic field using highly sensitive magnetometers. The data will help scientists understand and map the intensity and direction of the Earth’s magnetic field, its relation to space weather events, and affects on our planet. With such missions, NASA hopes to improve scientists’ ability to accurately forecast space weather and minimize its harmful effects on space- and ground-based systems. Launch of ST5 is scheduled no earlier than March 6 from Vandenberg Air Force Base.
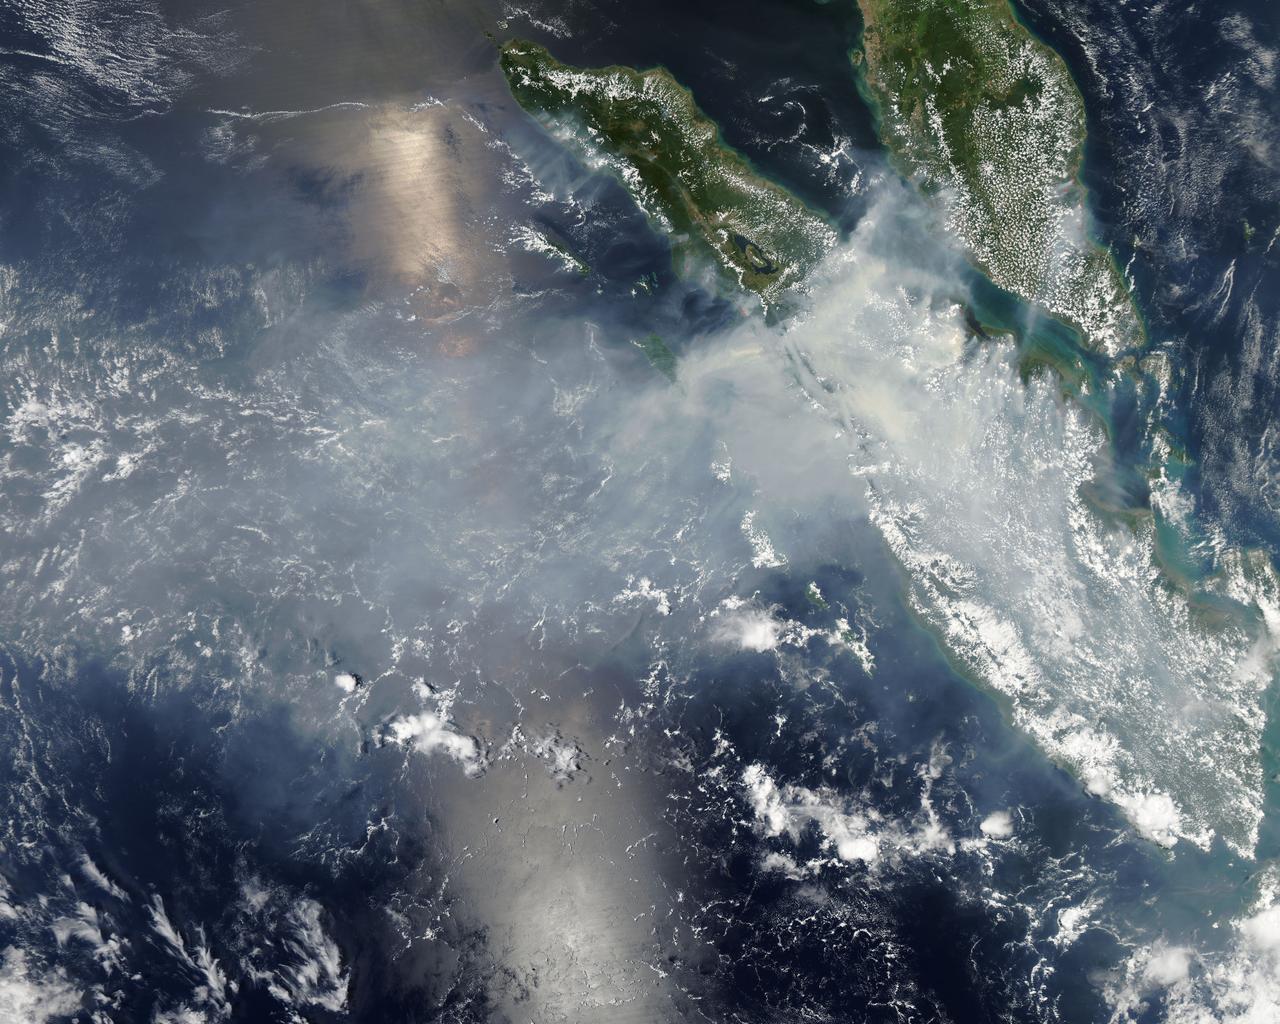
Fires burning in Sumatra continued to pour smoke over the region in mid-March, 2014, bringing air quality to dangerous levels. The Moderate Resolution Imaging Spectroradiometer (MODIS) aboard NASA’s Aqua satellite captured this true-color image of the smoke and haze across the region on March 12. According to the Jakarta Post, on March 12 the Sumatra Environmental Laboratory reported that 10 of 12 spots in Riau had an air quality of index above 300 on the Pollutant Standards Index (PSI), which is considered hazardous. Hazardous air quality had been recorded in some of the locations for 11 consecutive days. The province of Riau is located in the central eastern coast of Sumatra and, in this image, is hidden under thick bands of light gray smoke. Intense fires, reported as deliberately set to clear land, were burning in the Giam Siak Kecil-Bukit Batu biosphere reserve. This reserve contains over 700,000 hectares of sensitive peat forest that sustains a wide range of plant and animal species, including the Sumatra tiger, elephant, tapir and sun bear. With visibility as low as 500 m (1640 ft), 58 flights were cancelled in Pekanbaru, the capital of Riau province, on March 11. Schools were closed across the region, with 43,000 students affected in Payakumbuh, West Sumatra. On March 14, Selangor, Malaysia closed 203 schools, affecting 211,700 pupils, until the air quality improved. On that same day, according to Riau Health Agency, more than 55,000 residents in the province were suffering from haze-related illnesses, including acute respiratory infections, pneumonia and skin and eye irritation. Poor air quality not only affected transportation, human health and the ecosystem, but has had significant economic impacts. On March 17, Reuters reported that the poor air quality had forced Chevron, the country’s biggest oil producer, to close hundreds of its wells. As a result, Indonesia’s crude oil output dropped to 790,000 barrels per day (bpd) – significantly lower than the 870,000 bpd target. Although slash-and-burn techniques, which use fire to clear land, is illegal in Indonesia, the practice is still widespread, with approximately 99% of fires in Sumatra considered to be intentionally set. This year’s early agricultural fires began in February in Riau Province, home to palm-oil and pulpwood plantations. The emergency has prompted strong government response, including a shoot-on-sight order for any suspects involved in land burning activities that resisted arrest. According to the Jakarta Post, police have named as many as 60 suspected-fire starters in Riau. Credit: NASA/GSFC/Jeff Schmaltz/MODIS Land Rapid Response Team <b><a href="http://www.nasa.gov/audience/formedia/features/MP_Photo_Guidelines.html" rel="nofollow">NASA image use policy.</a></b> <b><a href="http://www.nasa.gov/centers/goddard/home/index.html" rel="nofollow">NASA Goddard Space Flight Center</a></b> enables NASA’s mission through four scientific endeavors: Earth Science, Heliophysics, Solar System Exploration, and Astrophysics. Goddard plays a leading role in NASA’s accomplishments by contributing compelling scientific knowledge to advance the Agency’s mission. <b>Follow us on <a href="http://twitter.com/NASAGoddardPix" rel="nofollow">Twitter</a></b> <b>Like us on <a href="http://www.facebook.com/pages/Greenbelt-MD/NASA-Goddard/395013845897?ref=tsd" rel="nofollow">Facebook</a></b> <b>Find us on <a href="http://instagram.com/nasagoddard?vm=grid" rel="nofollow">Instagram</a></b>
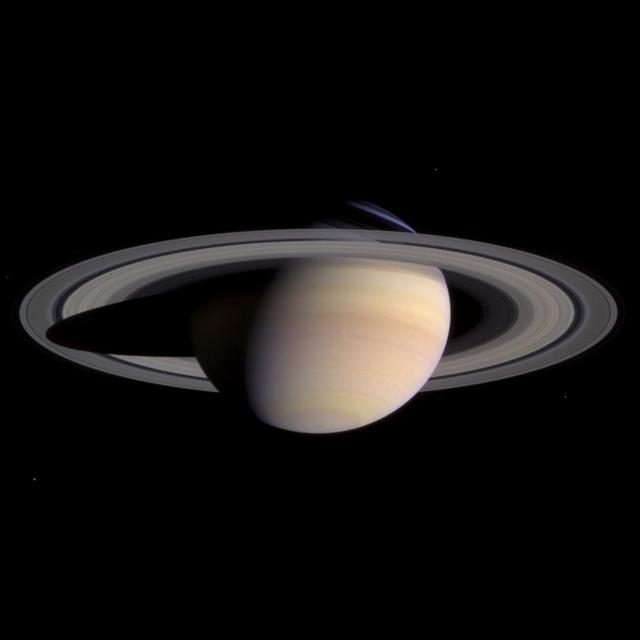
Saturn and its rings completely fill the field of view of Cassini's narrow angle camera in this natural color image taken on March 27, 2004. This is the last single 'eyeful' of Saturn and its rings achievable with the narrow angle camera on approach to the planet. From now until orbit insertion, Saturn and its rings will be larger than the field of view of the narrow angle camera. Color variations between atmospheric bands and features in the southern hemisphere of Saturn, as well as subtle color differences across the planet's middle B ring, are now more distinct than ever. Color variations generally imply different compositions. The nature and causes of any compositional differences in both the atmosphere and the rings are major questions to be investigated by Cassini scientists as the mission progresses. The bright blue sliver of light in the northern hemisphere is sunlight passing through the Cassini Division in Saturn's rings and being scattered by the cloud-free upper atmosphere. Two faint dark spots are visible in the southern hemisphere. These spots are close to the latitude where Cassini saw two storms merging in mid-March. The fate of the storms visible here is unclear. They are getting close and will eventually merge or squeeze past each other. Further analysis of such dynamic systems in Saturn's atmosphere will help scientists understand their origins and complex interactions. Moons visible in this image are (clockwise from top right): Enceladus (499 kilometers or 310 miles across), Mimas (398 kilometers or 247 miles across), Tethys (1060 kilometers or 659 miles across) and Epimetheus (116 kilometers or 72 miles across). Epimetheus is dim and appears just above the left edge of the rings. Brightnesses have been exaggerated to aid visibility. The image is a composite of three exposures, in red, green and blue, taken when the spacecraft was 47.7 million kilometers (29.7 million miles) from the planet. The image scale is 286 kilometers (178 miles) per pixel. http://photojournal.jpl.nasa.gov/catalog/PIA05389

This is an image of equatorial Africa, centered on the equator at longitude 15degrees east. This image is a mosaic of almost 4,000 separate images obtained in 1996 by the L-band imaging radar onboard the Japanese Earth Resources Satellite. Using radar to penetrate the persistent clouds prevalent in tropical forests, the Japanese Earth Resources Satellite was able for the first time to image at high resolution this continental scale region during single flooding seasons. The area shown covers about 7.4 million square kilometers (2.8 million square miles) of land surface, spans more than 5,000 kilometers(3,100 miles) east and west and some 2,000 kilometers (1,240 miles) north and south. North is up in this image. At the full resolution of the mosaic (100 meters or 330 feet), this image is more than 500 megabytes in size, and was processed from imagery totaling more than 60 gigabytes. Central Africa was imaged twice in 1996, once between January and March, which is the major low-flood season in the Congo Basin, and once between October and November, which is the major high-flood season in the Congo Basin. The red color corresponds to the data from the low-flood season, the green to the high-flood season, and the blue to the "texture" of the low-flood data. The forests appear green as a result, the flooded and palm forests, as well as urban areas, appear yellow, the ocean and lakes appear black, and savanna areas appear blue, black or green, depending on the savanna type, surface topography and other factors. The areas of the image that are black and white were mapped only between January and March 1996. In these areas, the black areas are savanna or open water, the gray are forests, and the white areas are flooded forests or urban areas. The Congo River dominates the middle of the image, where the nearby forests that are periodically flooded by the Congo and its tributaries stand out as yellow. The Nile River flows north from Lake Victoria in the middle right of the color portion of the mosaic. http://photojournal.jpl.nasa.gov/catalog/PIA01348
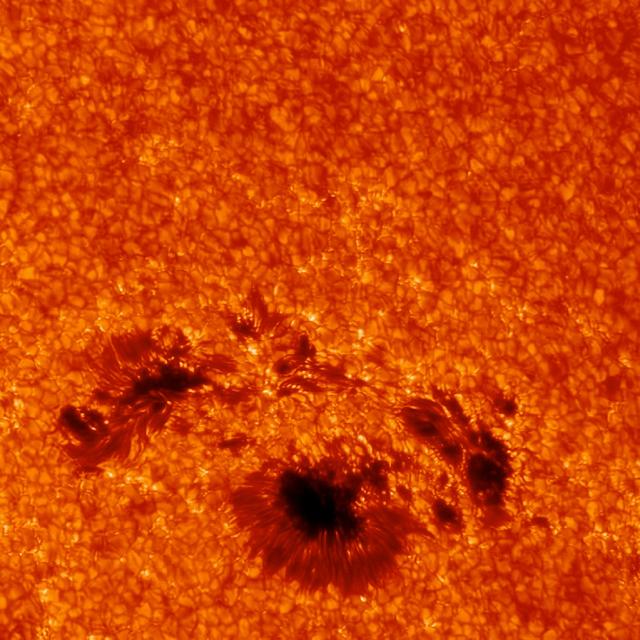
This close-up of the sunspot underneath the March 29, 2014, flare shows incredible detail. The image was captured by the G-band camera at Sacramento Peak in New Mexico. This instrument can focus on only a small area at once, but provide very high resolution. Ground-based telescope data can be hindered by Earth's atmosphere, which blocks much of the sun's ultraviolet and X-ray light, and causes twinkling even in the light it does allow through. As it happens, the March 29 flare occurred at a time of day in New Mexico that often results in the best viewing times from the ground. Credit: Kevin Reardon (National Solar Observatory), Lucia Kleint (BAER Institute) -- On March 29, 2014 the sun released an X-class flare. It was observed by NASA's Interface Region Imaging Spectrograph, or IRIS; NASA's Solar Dynamics Observatory, or SDO; NASA's Reuven Ramaty High Energy Solar Spectroscopic Imager, or RHESSI; the Japanese Aerospace Exploration Agency's Hinode; and the National Solar Observatory's Dunn Solar Telescope located at Sacramento Peak in New Mexico. To have a record of such an intense flare from so many observatories is unprecedented. Such research can help scientists better understand what catalyst sets off these large explosions on the sun. Perhaps we may even some day be able to predict their onset and forewarn of the radio blackouts solar flares can cause near Earth - blackouts that can interfere with airplane, ship and military communications. Read more: <a href="http://1.usa.gov/1kMDQbO" rel="nofollow">1.usa.gov/1kMDQbO</a> Join our Google+ Hangout on May 8 at 2:30pm EST: <a href="http://go.nasa.gov/1mwbBEZ" rel="nofollow">go.nasa.gov/1mwbBEZ</a> Credit: NASA Goddard <b><a href="http://www.nasa.gov/audience/formedia/features/MP_Photo_Guidelines.html" rel="nofollow">NASA image use policy.</a></b> <b><a href="http://www.nasa.gov/centers/goddard/home/index.html" rel="nofollow">NASA Goddard Space Flight Center</a></b> enables NASA’s mission through four scientific endeavors: Earth Science, Heliophysics, Solar System Exploration, and Astrophysics. Goddard plays a leading role in NASA’s accomplishments by contributing compelling scientific knowledge to advance the Agency’s mission. <b>Follow us on <a href="http://twitter.com/NASAGoddardPix" rel="nofollow">Twitter</a></b> <b>Like us on <a href="http://www.facebook.com/pages/Greenbelt-MD/NASA-Goddard/395013845897?ref=tsd" rel="nofollow">Facebook</a></b> <b>Find us on <a href="http://instagram.com/nasagoddard?vm=grid" rel="nofollow">Instagram</a></b>
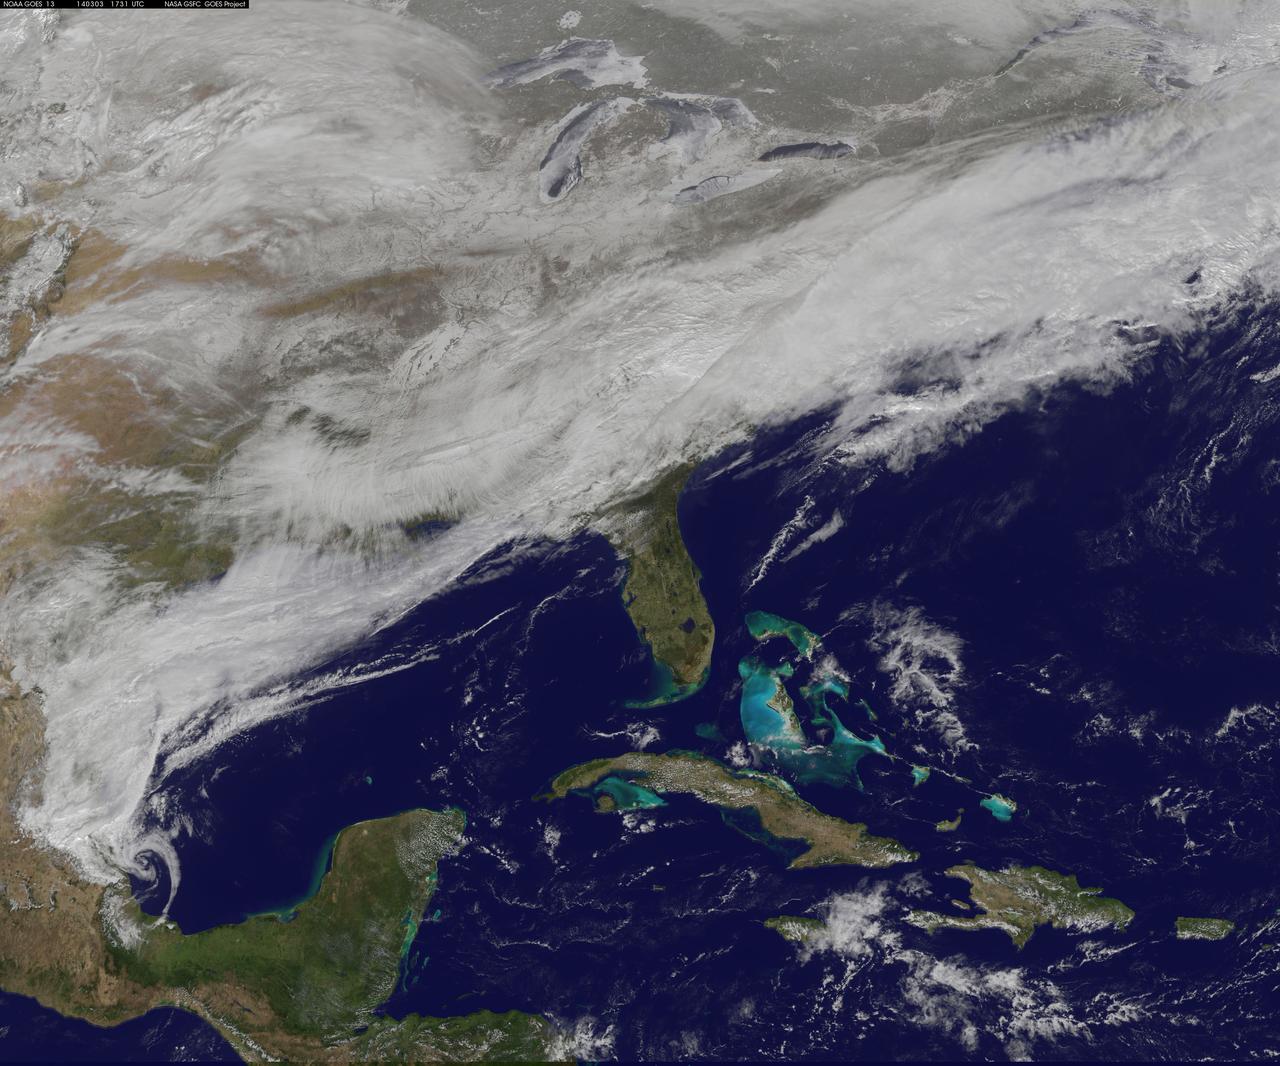
On March 3, a major winter storm brought snow to the mid-Atlantic, freezing rain to the Carolinas and rain and some freezing rain to the Gulf Coast states. NOAA's GOES-East satellite captured an image of the clouds associated with the winter storm on March 3 at 12:45 p.m. EST (1745 UTC)/ as it continued on its march over the mid-Atlantic. Bands of snow and sometimes heavy snow affected the Washington, D.C., region, Delaware and central Virginia, stretching west into West Virginia and eastern Kentucky. Snow also stretched back into the Ohio and Tennessee valleys while rain and freezing rain affected the Carolinas, and while the Gulf Coast states received rain. National Weather Service Winter Storm Warnings remained in effect until 6 p.m. EST on March 3 for Washington, D.C., and Baltimore, Md. In Richmond and Norfolk, Va., the Winter Storm warnings were in effect for six additional hours ending at midnight. On March 3, NOAA's National Weather Prediction Center in College Park, Md., noted the late-season winter storm will continue to shift eastward through the Tennessee Valley and the mid-Atlantic today, making for hazardous travel conditions. NOAA noted that unseasonably cold temperatures more typical of January will prevail east of the Rocky Mountains for the next few days keeping winter around for a while longer. The clouds are associated with a cold front that stretched from eastern Maine through Maryland and west into the Tennessee Valley. At NASA/NOAA's GOES Project at NASA's Goddard Space Flight Center in Greenbelt, Md., the cloud data from NOAA's GOES-East satellite were overlaid on a true-color image of land and ocean created by data from the Moderate Resolution Imaging Spectroradiometer, or MODIS, instrument that flies aboard NASA's Aqua and Terra satellites. Together, those data created the entire picture of the position of this major winter storm. GOES satellites provide the kind of continuous monitoring necessary for intensive data analysis. Geostationary describes an orbit in which a satellite is always in the same position with respect to the rotating Earth. This allows GOES to hover continuously over one position on Earth's surface, appearing stationary. As a result, GOES provide a constant vigil for the atmospheric "triggers" for severe weather conditions such as tornadoes, flash floods, hail storms and hurricanes. For updated information about the storm system, visit NOAA's NWS website: <a href="http://www.weather.gov" rel="nofollow">www.weather.gov</a> For more information about GOES satellites, visit: <a href="http://www.goes.noaa.gov/" rel="nofollow">www.goes.noaa.gov/</a> or goes.gsfc.nasa.gov/ Rob Gutro NASA's Goddard Space Flight Center, Greenbelt, Md. <b><a href="http://www.nasa.gov/audience/formedia/features/MP_Photo_Guidelines.html" rel="nofollow">NASA image use policy.</a></b> <b><a href="http://www.nasa.gov/centers/goddard/home/index.html" rel="nofollow">NASA Goddard Space Flight Center</a></b> enables NASA’s mission through four scientific endeavors: Earth Science, Heliophysics, Solar System Exploration, and Astrophysics. Goddard plays a leading role in NASA’s accomplishments by contributing compelling scientific knowledge to advance the Agency’s mission. <b>Follow us on <a href="http://twitter.com/NASAGoddardPix" rel="nofollow">Twitter</a></b> <b>Like us on <a href="http://www.facebook.com/pages/Greenbelt-MD/NASA-Goddard/395013845897?ref=tsd" rel="nofollow">Facebook</a></b> <b>Find us on <a href="http://instagram.com/nasagoddard?vm=grid" rel="nofollow">Instagram</a></b>

Using the “day-night band” (DNB) of the Visible Infrared Imaging Radiometer Suite (VIIRS), the Suomi National Polar-orbiting Partnership (Suomi NPP) satellite acquired this view of the aurora borealis on March 18, 2015. The northern lights stretch across Canada’s Quebec, Ontario, Manitoba, Nunavut, and Newfoundland provinces in the image, and are part of the auroral oval that expanded to middle latitudes because of a geomagnetic storm on March 17, 2015. The DNB sensor detects dim light signals such as auroras, airglow, gas flares, city lights, and reflected moonlight. In the case of the image above, the sensor detected the visible light emissions as energetic particles rained down from Earth’s magnetosphere and into the gases of the upper atmosphere. The images are similar to those collected by the Operational Linescan System flown on U.S. Defense Meteorological Satellite Program (DMSP) satellites for the past three decades. Auroras typically occur when solar flares and coronal mass ejections—or even an active solar wind stream—disturb and distort the magnetosphere, the cocoon of space protected by Earth’s magnetic field. The collision of solar particles and pressure into our planet’s magnetosphere accelerates particles trapped in the space around Earth (such as in the radiation belts). Those particles are sent crashing down into Earth’s upper atmosphere—at altitudes of 100 to 400 kilometers (60 to 250 miles)—where they excite oxygen and nitrogen molecules and release photons of light. The results are rays, sheets, and curtains of dancing light in the sky. Read more: <a href="http://earthobservatory.nasa.gov/NaturalHazards/view.php?id=85556&eocn=home&eoci=nh" rel="nofollow">earthobservatory.nasa.gov/NaturalHazards/view.php?id=8555...</a> NASA Earth Observatory image by Jesse Allen, using VIIRS day-night band data from the Suomi National Polar-orbiting Partnership. Suomi NPP is the result of a partnership between NASA, the National Oceanic and Atmospheric Administration, and the Department of Defense. Caption by Mike Carlowicz and Adam Voiland. Credit: <b><a href="http://www.earthobservatory.nasa.gov/" rel="nofollow"> NASA Earth Observatory</a></b> <b><a href="http://www.nasa.gov/audience/formedia/features/MP_Photo_Guidelines.html" rel="nofollow">NASA image use policy.</a></b> <b><a href="http://www.nasa.gov/centers/goddard/home/index.html" rel="nofollow">NASA Goddard Space Flight Center</a></b> enables NASA’s mission through four scientific endeavors: Earth Science, Heliophysics, Solar System Exploration, and Astrophysics. Goddard plays a leading role in NASA’s accomplishments by contributing compelling scientific knowledge to advance the Agency’s mission. <b>Follow us on <a href="http://twitter.com/NASAGoddardPix" rel="nofollow">Twitter</a></b> <b>Like us on <a href="http://www.facebook.com/pages/Greenbelt-MD/NASA-Goddard/395013845897?ref=tsd" rel="nofollow">Facebook</a></b> <b>Find us on <a href="http://instagrid.me/nasagoddard/?vm=grid" rel="nofollow">Instagram</a></b>

In this illustration showing NEO Surveyor, NASA's next-generation near-Earth object hunter, the spacecraft floats in an infrared starfield containing stars, star clusters, gas, and dust. More than 100 asteroids can be seen as red dots, with some of them visible in a track that shows how they were captured at different times as they marched across the sky. This starfield was observed by NASA's Wide-field Infrared Survey Explorer, or WISE, during its primary all-sky survey in March 2010 before it was put into hibernation a year later. In December 2013, the space telescope was reactivated to search for more asteroids as the NEOWISE mission. NASA's NEO Surveyor will build upon the successes of NEOWISE as the first space mission built specifically to find large numbers of hazardous asteroids and comets. The space telescope will launch to a region of gravitational stability between the Earth and the Sun called the L1 Lagrange point, where the spacecraft will orbit during its five-year primary mission. From this location, the space telescope will view the solar system in infrared wavelengths &ndash light that is invisible to the human eye. Because those wavelengths are mostly blocked by Earth's atmosphere, larger ground-based observatories may miss near-Earth objects that NEO Surveyor will be able to spot from space by using its modest light-collecting aperture of nearly 20 inches (50 centimeters). NEO Surveyor's cutting-edge detectors are designed to observe two heat-sensitive infrared bands that were chosen specifically so the spacecraft can track the most challenging-to-find near-Earth objects, such as dark asteroids and comets that don't reflect much visible light. In the infrared wavelengths to which NEO Surveyor is sensitive, these objects glow as they are heated by sunlight. In addition, NEO Surveyor will be able to find asteroids that approach Earth from the direction of the Sun, as well as those that lead and trail our planet's orbit, where they are typically obscured by the glare of sunlight – objects known as Earth Trojans. The mission is tasked by NASA's Planetary Science Division within the Science Mission Directorate; program oversight is provided by the PDCO, which was established in 2016 to manage the agency's ongoing efforts in planetary defense. NASA's Planetary Missions Program Office at Marshall Space Flight Center provides program management for NEO Surveyor. The project is being developed by JPL and is led by survey director Amy Mainzer at the University of Arizona. Established aerospace and engineering companies have been contracted to build the spacecraft and its instrumentation, including Ball Aerospace , Space Dynamics Laboratory, and Teledyne. The Laboratory for Atmospheric and Space Physics at the University of Colorado, Boulder will support operations, and IPAC-Caltech in Pasadena, California, is responsible for processing survey data and producing the mission's data products. Caltech manages JPL for NASA. https://photojournal.jpl.nasa.gov/catalog/PIA25253

On April 3, the Advanced Spaceborne Thermal Emission and Reflection Radiometer (ASTER) on NASA's Terra Satellite captured this image of the erupting Mt. Usu volcano in Hokkaido, Japan. With its 14 spectral bands from the visible to the thermal infrared wavelength region, and its high spatial resolution of 15 to 90 meters (about 50 to 300 feet), ASTER will image the Earth for the next 6 years to map and monitor the changing surface of our planet. This false color infrared image of Mt Usu volcano is dominated by Lake Toya, an ancient volcanic caldera. On the south shore is the active Usu volcano. On Friday, March 31, more than 11,000 people were evacuated by helicopter, truck and boat from the foot of Usu, that began erupting from the northwest flank, shooting debris and plumes of smoke streaked with blue lightning thousands of feet in the air. Although no lava gushed from the mountain, rocks and ash continued to fall after the eruption. The region was shaken by thousands of tremors before the eruption. People said they could taste grit from the ash that was spewed as high as 2,700 meters (8,850 ft) into the sky and fell to coat surrounding towns with ash. "Mount Usu has had seven significant eruptions that we know of, and at no time has it ended quickly with only a small scale eruption," said Yoshio Katsui, a professor at Hokkaido University. This was the seventh major eruption of Mount Usu in the past 300 years. Fifty people died when the volcano erupted in 1822, its worst known eruption. In the image, most of the land is covered by snow. Vegetation, appearing red in the false color composite, can be seen in the agricultural fields, and forests in the mountains. Mt. Usu is crossed by three dark streaks. These are the paths of ash deposits that rained out from eruption plumes two days earlier. The prevailing wind was from the northwest, carrying the ash away from the main city of Date. Ash deposited can be traced on the image as far away as 10 kilometers (16 miles) from the volcano. http://photojournal.jpl.nasa.gov/catalog/PIA02608
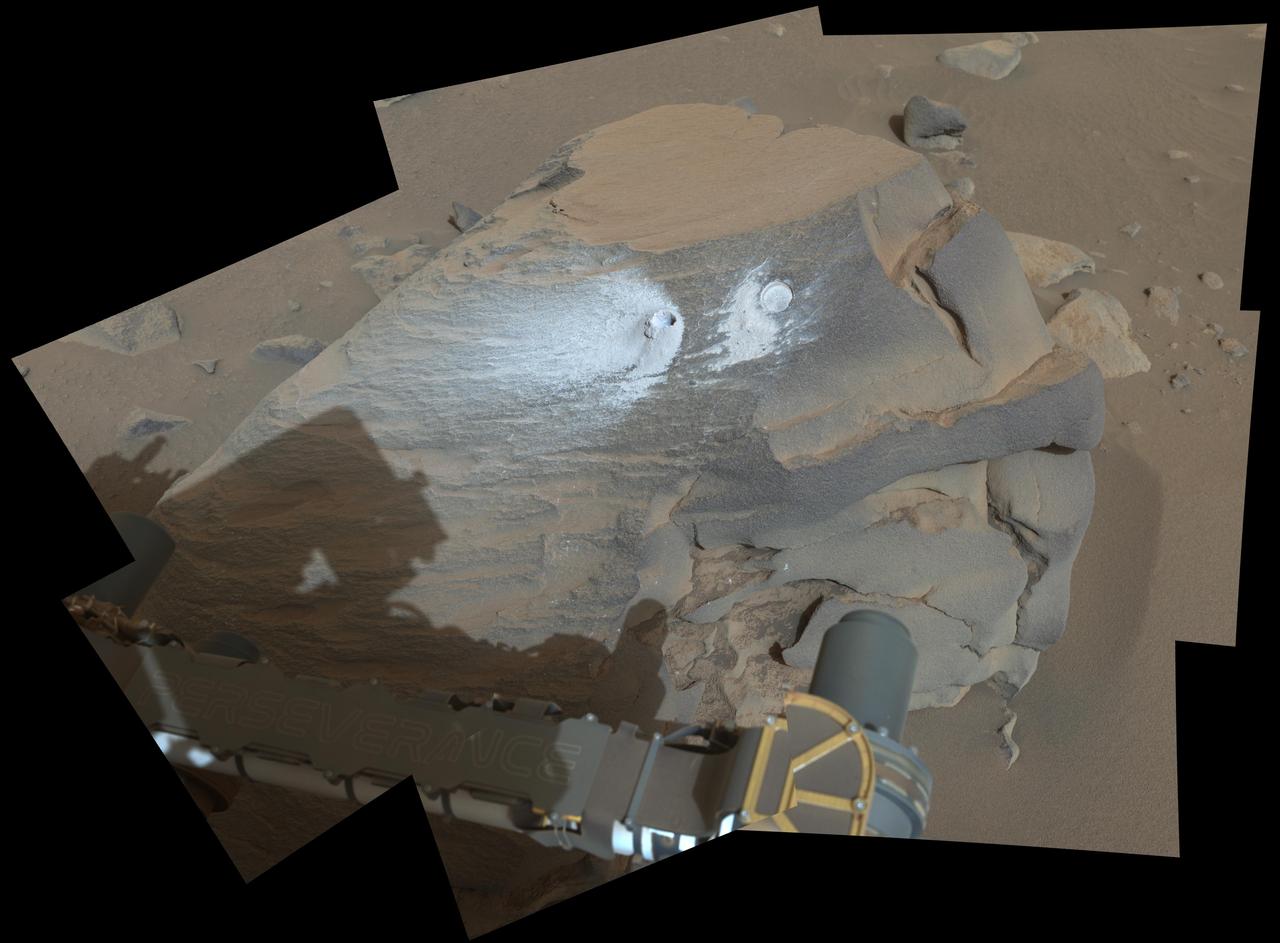
This view shows a rock nicknamed "Bunsen Peak" where NASA's Perseverance Mars rover extracted its 21st rock core (left) and abraded a circular patch (right) to investigate the rock's composition. Perseverance's Mastcam-Z camera system took the eight images that make up this mosaic on March 12, 2024, the 1,088th Martian day, or sol, of the rover's mission to Mars. For scale, the abrasion patch is approximately 2 inches (5 centimeters) in diameter. In this enhanced-color view, the color bands of the image have been processed to improve visual contrast and accentuate color differences. Arizona State University leads the operations of the Mastcam-Z instrument, working in collaboration with Malin Space Science Systems in San Diego, on the design, fabrication, testing, and operation of the cameras, and in collaboration with the Niels Bohr Institute of the University of Copenhagen on the design, fabrication, and testing of the calibration targets. A key objective for Perseverance's mission on Mars is astrobiology, including the search for signs of ancient microbial life. The rover will characterize the planet's geology and past climate, pave the way for human exploration of the Red Planet, and be the first mission to collect and cache Martian rock and regolith. Subsequent NASA missions, in cooperation with ESA (European Space Agency), would send spacecraft to Mars to collect these sealed samples from the surface and return them to Earth for in-depth analysis. The Mars 2020 Perseverance mission is part of NASA's Moon to Mars exploration approach, which includes Artemis missions to the Moon that will help prepare for human exploration of the Red Planet. https://photojournal.jpl.nasa.gov/catalog/PIA26312
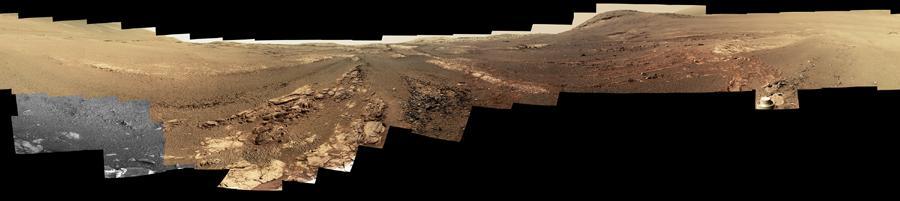
This 360-degree panorama is composed of 354 images taken by the Opportunity rover's Panoramic Camera (Pancam) from May 13 through June 10, 2018, or sols (Martian days) 5,084 through 5,111. This is the last panorama Opportunity acquired before the solar-powered rover succumbed to a global Martian dust storm on the same June 10. This version of the scene is presented in approximate true color. To the right of center and near the top of the frame, the rim of Endeavour Crater rises in the distance. Just to the left of that, rover tracks begin their descent from over the horizon towards the location that would become Opportunity's final resting spot in Perseverance Valley, where the panorama was taken. At the bottom, just left of center, is the rocky outcrop Opportunity was investigating with the instruments on its robotic arm. To the right of center and halfway down the frame is another rocky outcrop - about 23 feet (7 meters) distant from the camera - called "Ysleta del Sur," which Opportunity investigated from March 3 through 29, 2018, or sols 5,015 through 5,038. In the far right and left of the frame are the bottom of Perseverance Valley and the floor of Endeavour Crater. Located on the inner slope of the western rim of Endeavour Crater, Perseverance Valley is a system of shallow troughs descending eastward about the length of two football fields from the crest of Endeavour's rim to its floor. This true-color version combines images collected through three Pancam filters. The filters admit light centered on wavelengths of 753 nanometers (near-infrared), 535 nanometers (green) and 432 nanometers (blue). The three-color bands are combined. A few frames (bottom left) remain black and white, as the solar-powered rover did not have the time to photograph those locations using the green and violet filters before a severe Mars-wide dust storm swept in on June 2018. https://photojournal.jpl.nasa.gov/catalog/PIA22909
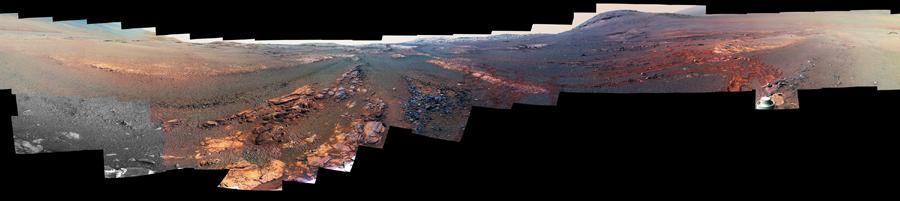
This 360-degree panorama is composed of 354 images taken by the Opportunity rover's Panoramic Camera (Pancam) from May 13 through June 10, 2018, or sols (Martian days) 5,084 through 5,111. This is the last panorama Opportunity acquired before the solar-powered rover succumbed to a global Martian dust storm on the same June 10. The view is presented in false color to make some differences between materials easier to see. To the right of center and near the top of the frame, the rim of Endeavour Crater rises in the distance. Just to the left of that, rover tracks begin their descent from over the horizon towards the location that would become Opportunity's final resting spot in Perseverance Valley, where the panorama was taken. At the bottom, just left of center, is the rocky outcrop Opportunity was investigating with the instruments on its robotic arm. To the right of center and halfway down the frame is another rocky outcrop - about 23 feet (7 meters) distant from the camera - called "Ysleta del Sur," which Opportunity investigated from March 3 through 29, 2018, or sols 5,015 through 5,038. In the far right and left of the frame are the bottom of Perseverance Valley and the floor of Endeavour Crater. Located on the inner slope of the western rim of Endeavour Crater, Perseverance Valley is a system of shallow troughs descending eastward about the length of two football fields from the crest of Endeavour's rim to its floor. This view combines images collected through three Pancam filters. The filters admit light centered on wavelengths of 753 nanometers (near-infrared), 535 nanometers (green) and 432 nanometers (blue). The three-color bands are combined. A few frames (bottom left) remain black and white, as the solar-powered rover did not have the time to photograph those locations using the green and violet filters before a severe Mars-wide dust storm swept in on June 2018. https://photojournal.jpl.nasa.gov/catalog/PIA22908

ISS012-E-21250 (2 March 2006) --- Dust and smog in northeast China are featured in this image photographed by an Expedition 12 crewmember on the International Space Station. Much of the land surface is obscured in this oblique image of the North China Plain and parts of Inner Mongolia. In the center of the view a mass of gray smog—mainly industrial pollution and smoke from domestic burning—obscures Beijing and surrounding cities. Numerous plumes with their source points appear within the mass. Beijing suffers some of the worst air pollution in the world from these chronic sources, and the characteristic colors and textures of the smog can be easily seen through windows of the International Space Station. The coastline of Bo Hai Bay, 300 kilometers east of Beijing, is visible at left. The light brown material in Bo Hai Bay is sediment from the Yellow and other rivers. Separated from the smog mass by a band of puffy, white cumulus clouds is a light brown plume of dust. The line of white cloud has developed along the escarpment that separates the heavily populated North China Plain – location of the largest population agglomeration on Earth – and the sparsely populated semi-desert plains of Inner Mongolia. Observers saw a number of dust events in most Northern Hemisphere deserts in the spring of 2006, and the Gobi and the Takla Makan deserts of western China were no exception. Dust plumes originating in these deserts typically extend eastward hundreds of kilometers, regularly depositing dust on Beijing, the Korean peninsula and Japan. Some plumes even extend over the Pacific Ocean. In extreme cases, visible masses of Gobi-derived dust have reached North America.
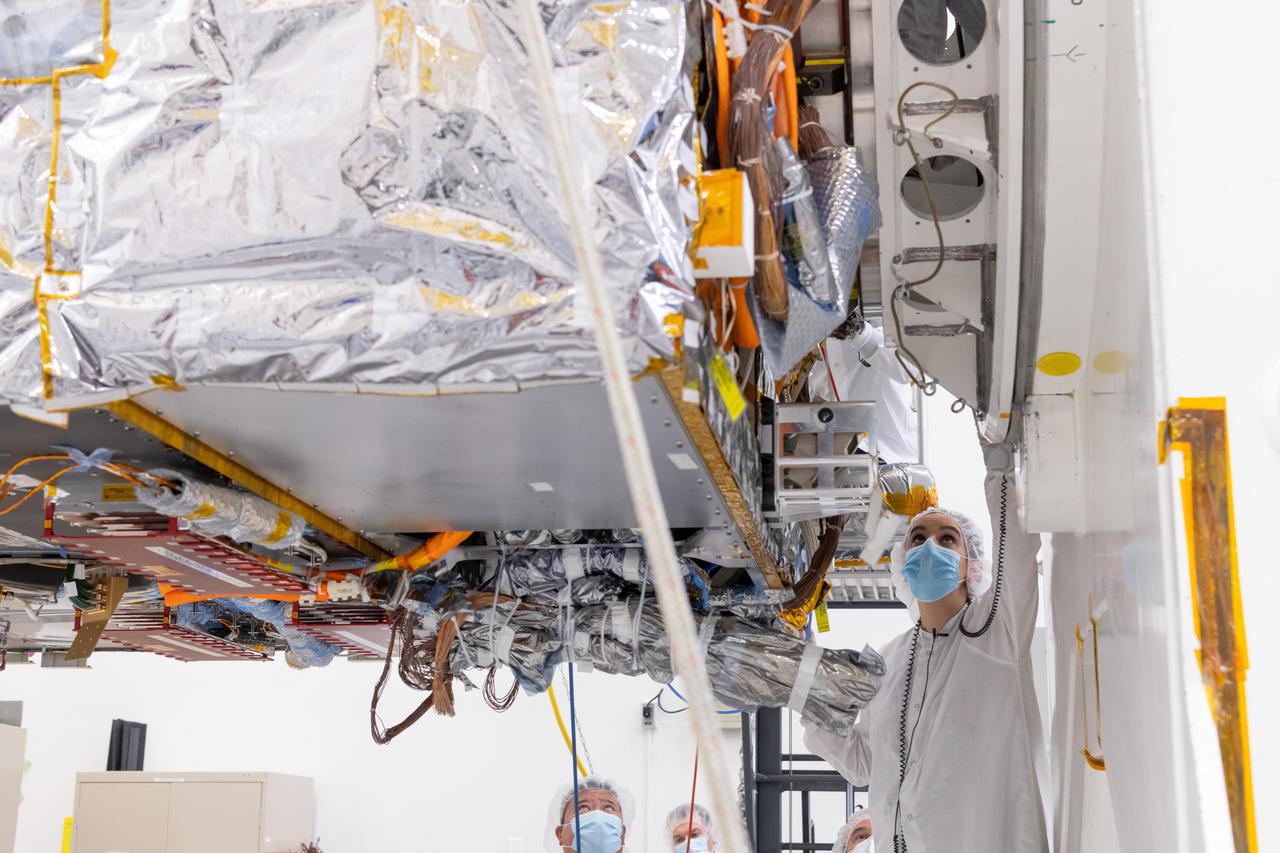
The Solar Electric Propulsion (SEP) Chassis of NASA's Psyche spacecraft is mounted onto a rotation fixture in High Bay 1 of the Spacecraft Assembly Facility at NASA's Jet Propulsion Laboratory in Southern California. This photo was taken March 28, 2021, just after the chassis — a major component of the Psyche spacecraft — was delivered to JPL by Maxar Technologies. Maxar's team in Palo Alto, California, designed and built the chassis, which includes all the primary and secondary structure and the hardware components needed for the high-power electrical system, the propulsion system, the thermal system, guidance and navigation sensors and actuators, and the high-gain antenna. The phase known as assembly test, and launch operations (ATLO) for Psyche is now underway at JPL. In this photo, ATLO Mechanical Lead Michelle Colizzi of JPL oversees the docking of the chassis to the dolly. Over the next year additional hardware will be added to the spacecraft including the command and data handling system, a power distribution assembly, the X-band telecommunications hardware suite, three science instruments (two imagers, two magnetometers, and a Gamma Ray Neutron Spectrometer), and a deep space optical communications technology demonstrator. The spacecraft will finish assembly and then undergo rigorous checkout and testing, before it's shipped to NASA's Kennedy Space Center in Cape Canaveral, Florida, for an August 2022 launch to the main asteroid belt. Psyche will arrive at the metal-rich asteroid of the same name in 2026, orbiting for 21 months to investigate its composition. Scientists think that Psyche is made up of mostly iron and nickel — similar to Earth's core. Exploring the asteroid could give valuable insight into how our own planet and others formed. https://photojournal.jpl.nasa.gov/catalog/PIA24476
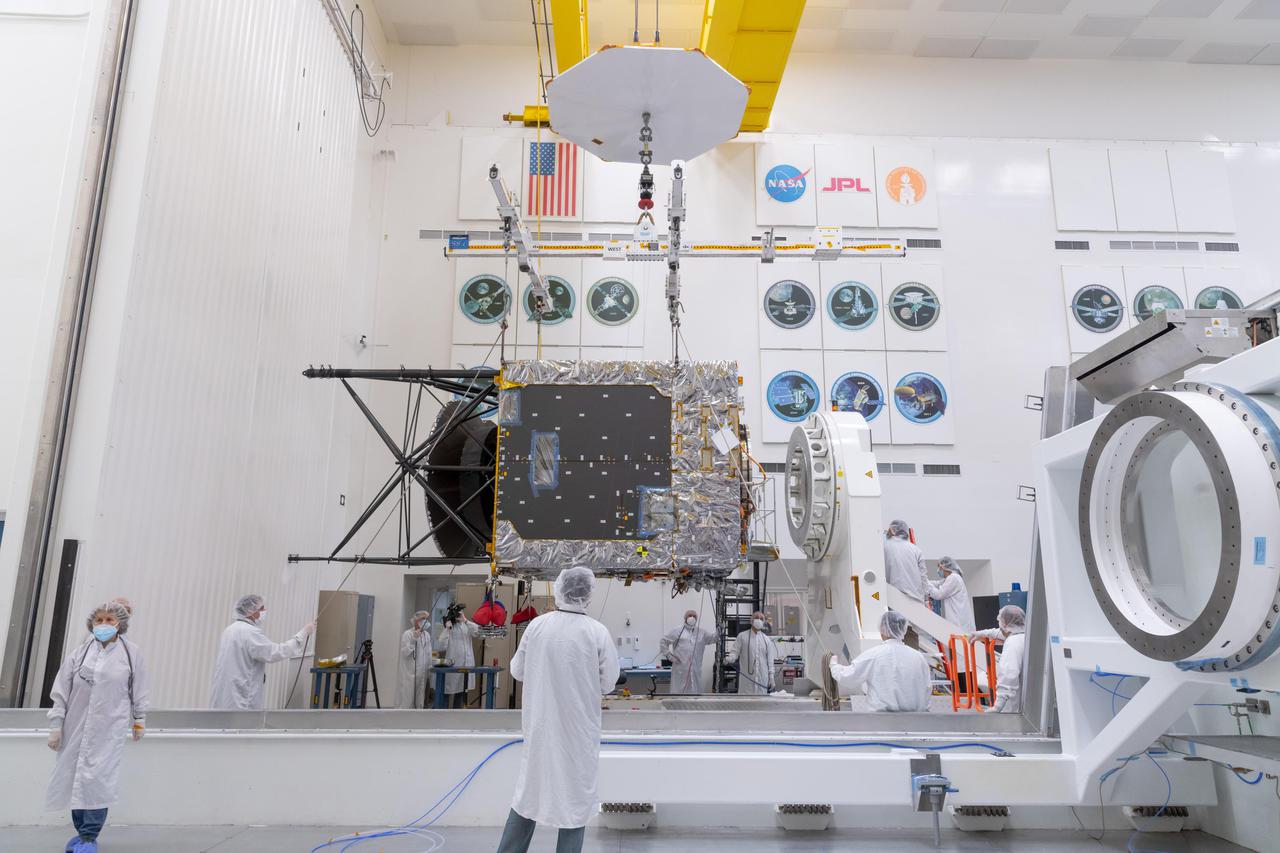
A major component of NASA's Psyche spacecraft has been delivered to the agency's Jet Propulsion Laboratory in Southern California, where the phase known as assembly, test, and launch operations (ATLO) is now underway. Taken on March 28, 2021, this photo shows the Solar Electric Propulsion (SEP) Chassis just after it was delivered to JPL by Maxar Technologies. Here, the chassis is about to be attached to the dolly in High Bay 1 of JPL's Spacecraft Assembly Facility. Maxar's team in Palo Alto, California, designed and built the SEP Chassis, which includes all the primary and secondary structure and the hardware components needed for the high-power electrical system, the propulsion system, the thermal system, guidance and navigation sensors and actuators, and the high-gain antenna. Over the next year additional hardware will be added to the spacecraft, including the command and data handling system, a power distribution assembly, the X-band telecommunications hardware suite, three science instruments (two imagers, two magnetometers, and a Gamma Ray Neutron Spectrometer), and a deep space optical communications technology demonstrator. The spacecraft will finish assembly and then undergo rigorous checkout and testing before being shipped to NASA's Kennedy Space Center in Cape Canaveral, Florida, for an August 2022 launch to the main asteroid belt. Psyche will arrive at the metal-rich asteroid of the same name in 2026, orbiting for 21 months to investigate its composition. Scientists think that Psyche is made up of mostly iron and nickel — similar to Earth's core. Exploring the asteroid could give valuable insight into how our own planet and others formed. https://photojournal.jpl.nasa.gov/catalog/PIA24474
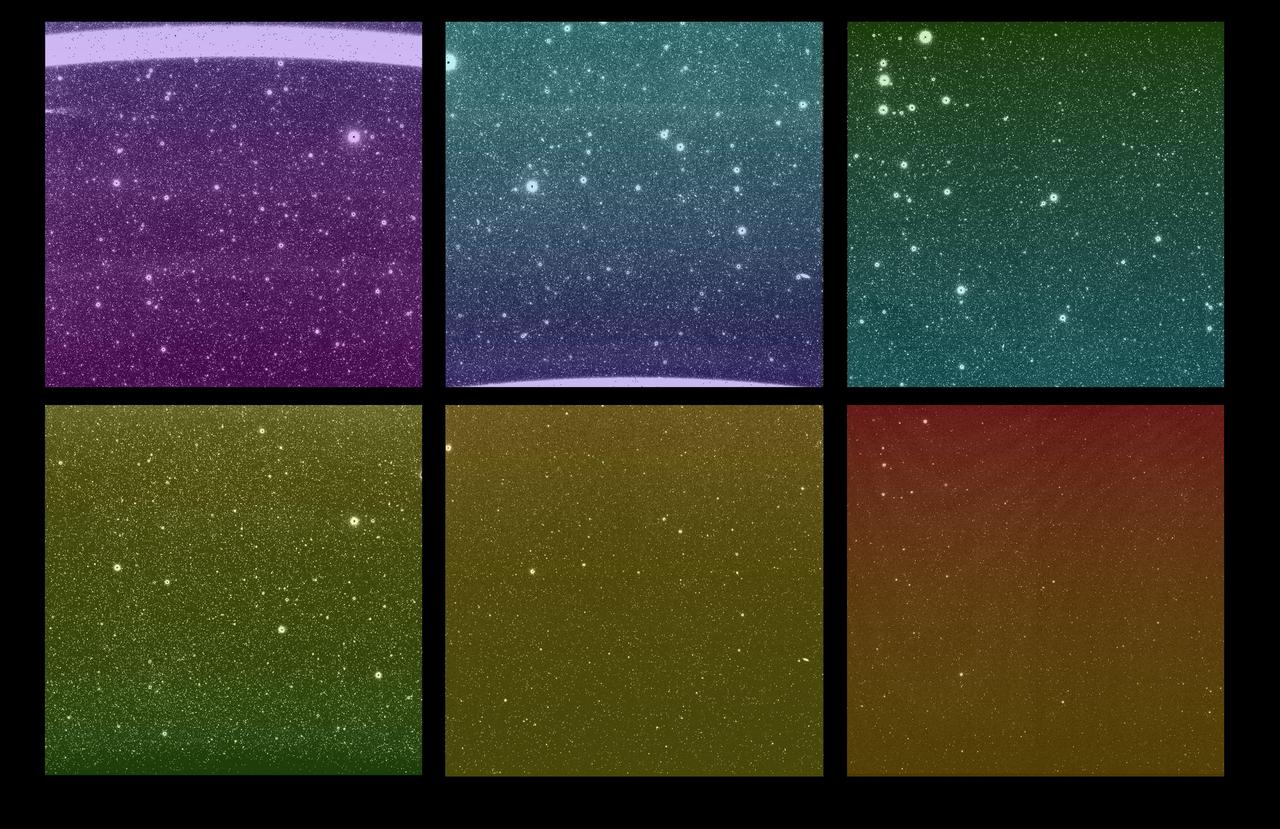
Some of the first images from NASA's SPHEREx (Spectro-Photometer for the History of the Universe, Epoch of Reionization and Ices Explorer) mission were captured March 27, 2025. Although the new images are uncalibrated and not yet ready to use for science, they give a tantalizing look at SPHEREx's wide view of the sky. Each bright spot is a source of light, like a star or galaxy, and each image is expected to contain more than 100,000 detected sources. There are six images in every SPHEREx exposure – one for each detector. The top three images show the same area of sky as the bottom three images; this is the observatory's full field of view, a rectangular area about 20 times wider than the full Moon. When the SPHEREx observatory begins routine science operations in April, it will take approximately 600 exposures every day. SPHEREx detects infrared light, which is invisible to the human eye. To make the images shown here, science team members assigned a visible color to each infrared wavelength captured by the observatory. With each detector capturing 17 unique infrared wavelength bands, there are 102 hues in this image. To detect so many infrared colors, SPHEREx uses color filters set on top of the detectors. (If the detectors are like SPHEREx's eyes, the filters are like color-tinted glasses). A standard color filter blocks all wavelengths but one, but the SPHEREx filters are more like rainbow-tinted glasses, in that the wavelengths they block change gradually from the top of the filter to the bottom. The legend at the top shows that the detectors are placed to observe infrared wavelengths from shortest to longest. Certain chemical elements are visible at specific wavelengths, as is the case with helium from Earth's atmosphere, which creates a bright line in the wavelength at the top of the top-left image. Breaking down color this way can reveal the composition of an object or the distance to a galaxy. With that data, scientists can study topics ranging from the physics that governed the universe less than a second after its birth to the origins of water in our galaxy. https://photojournal.jpl.nasa.gov/catalog/PIA26280

This animation, created in 2012, shows the increasing clarity and detail of measurements of sea height made by successive satellite altimeters launched by NASA and other agencies over the past four decades, concluding with data at the resolution possible with the Surface Water and Ocean Topography (SWOT) satellite, expected to launch in December 2022. Each new spacecraft has been able to obtain higher-resolution observations than its predecessors. Sea height is key to understanding how much, and how fast, the oceans are rising in a warming climate. The animation starts with Seasat, launched in 1978 as one of the NASA's earliest Earth-observing satellites, then moves to Geosat, a U.S. Navy spacecraft launched in 1985, and on to ERS-1, TOPEX/Poseidon, ERS-2, Jason-1, Envisat, and Jason-2. Since the end of the time period shown in the animation, subsequent satellites have continued measuring sea height, creating an ongoing, decadeslong record. In March 2022, Sentinel-6 Michael Freilich, a joint U.S.-European mission, became the official reference satellite for global sea level measurements. SWOT will be latest spacecraft to observe ocean heights from Earth orbit. Its measurements will provide unprecedented insights into the activity of small-scale currents and their impact on climate change. Researchers believe small-scale currents, which are less than 60 miles (100 kilometers) in size, have a significant influence on the ocean's ability to absorb atmospheric heat and carbon and thereby moderate global temperature change. To measure these currents, SWOT will employ the Ka-band Radar Interferometer (KaRIn), a new technology developed at NASA's Jet Propulsion Laboratory in Southern California that will offer even greater spatial resolution than previous instruments that studied the ocean. SWOT will survey the water in Earth's lakes, rivers, reservoirs, and the ocean. The satellite will cover the planet's surface twice every 21 days and has a prime mission of three years. It was jointly developed by NASA and France's Centre National d'Études Spatiales (CNES), with contributions from the Canadian Space Agency (CSA) and the UK Space Agency. JPL, a division of Caltech in Southern California, manages the U.S. portion of the mission for NASA. Animation available at https://photojournal.jpl.nasa.gov/catalog/PIA25561

A major component of NASA's Psyche spacecraft has been delivered to NASA's Jet Propulsion Laboratory in Southern California, where the phase known as assembly, test, and launch operations (ATLO) is now underway. This photo, shot March 28, 2021 shows engineers and technicians preparing to move the Solar Electric Propulsion (SEP) Chassis from its shipping container to a dolly in High Bay 1 of JPL's Spacecraft Assembly Facility. The photo was captured just after the chassis was delivered to JPL by Maxar Technologies. Maxar's team in Palo Alto, California, designed and built the SEP Chassis, which includes all the primary and secondary structure and the hardware components needed for the high-power electrical system, the propulsion system, the thermal system, guidance and navigation sensors and actuators, and the high-gain antenna. Over the next year, additional hardware will be added to the spacecraft including the command and data handling system, a power distribution assembly, the X-band telecommunications hardware suite, three science instruments (two imagers, two magnetometers, and a gamma ray neutron Spectrometer), and a deep space optical communications technology demonstrator. The spacecraft will finish assembly and then undergo rigorous checkout and testing before being shipped to NASA's Kennedy Space Center in Cape Canaveral, Florida, for an August 2022 launch to the main asteroid belt. Psyche will arrive at the metal-rich asteroid of the same name in 2026, orbiting for 21 months to investigate its composition. Scientists think that Psyche is made up of mostly iron and nickel — similar to Earth's core. Exploring the asteroid could give valuable insight into how our own planet and others formed. https://photojournal.jpl.nasa.gov/catalog/PIA24475
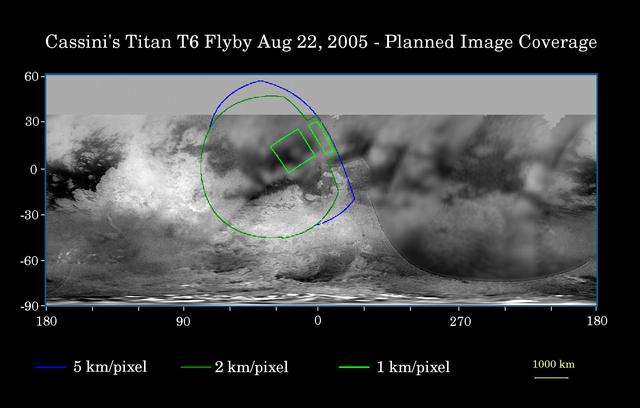
This map of Titan's surface illustrates the regions that will be imaged by Cassini during the spacecraft's close flyby of Titan on Aug. 22, 2005. At closest approach, the spacecraft is expected to pass approximately 3,800 kilometers (2,360 miles) above the moon's surface. At 5,150 kilometers (3,200 miles) across, Titan is one of the solar system's largest moons. The colored lines delineate the regions that will be imaged at differing resolutions. As Cassini continues its reconnaissance of Titan, maps of this haze-enshrouded world continue to improve. Images from this flyby will sharpen the moderate resolution coverage of terrain on the side of Titan that always faces Saturn. The highest resolution image planned for this encounter will cover a 215-kilometer-wide (134-mile) bright feature provisionally named "Bazaruto Facula." (A facula is the name chosen to denote a bright spot on Titan.) At the center of the facula is an 80-kilometer-wide (50-mile) crater (not yet named), seen by Cassini's radar experiment during a Titan flyby in February 2005 (see PIA07368). The imaging cameras and visual and infrared mapping spectrometer images taken in March and April 2005 also show this crater (see PIA06234). The southernmost corner of the highest resolution (1 kilometer per pixel) frame should also cover the northern portion of a large bright feature provisionally known as "Quivira." Wide-angle images obtained during this flyby should cover much of the Tsegihi-Aztlan-Quivira region (also known as the "H" region) at lower resolution. The map shows only brightness variations on Titan's surface (the illumination is such that there are no shadows and no shading from topographic variations). Previous observations indicate that, due to Titan's thick, hazy atmosphere, the sizes of surface features that can be resolved are up to five times larger than the actual pixel scale labeled on the map. The images for this global map were obtained using a narrow-band filter centered at 938 nanometers -- a near-infrared wavelength (invisible to the human eye) at which light can penetrate Titan's atmosphere. The images have been processed to enhance surface details. http://photojournal.jpl.nasa.gov/catalog/PIA07711
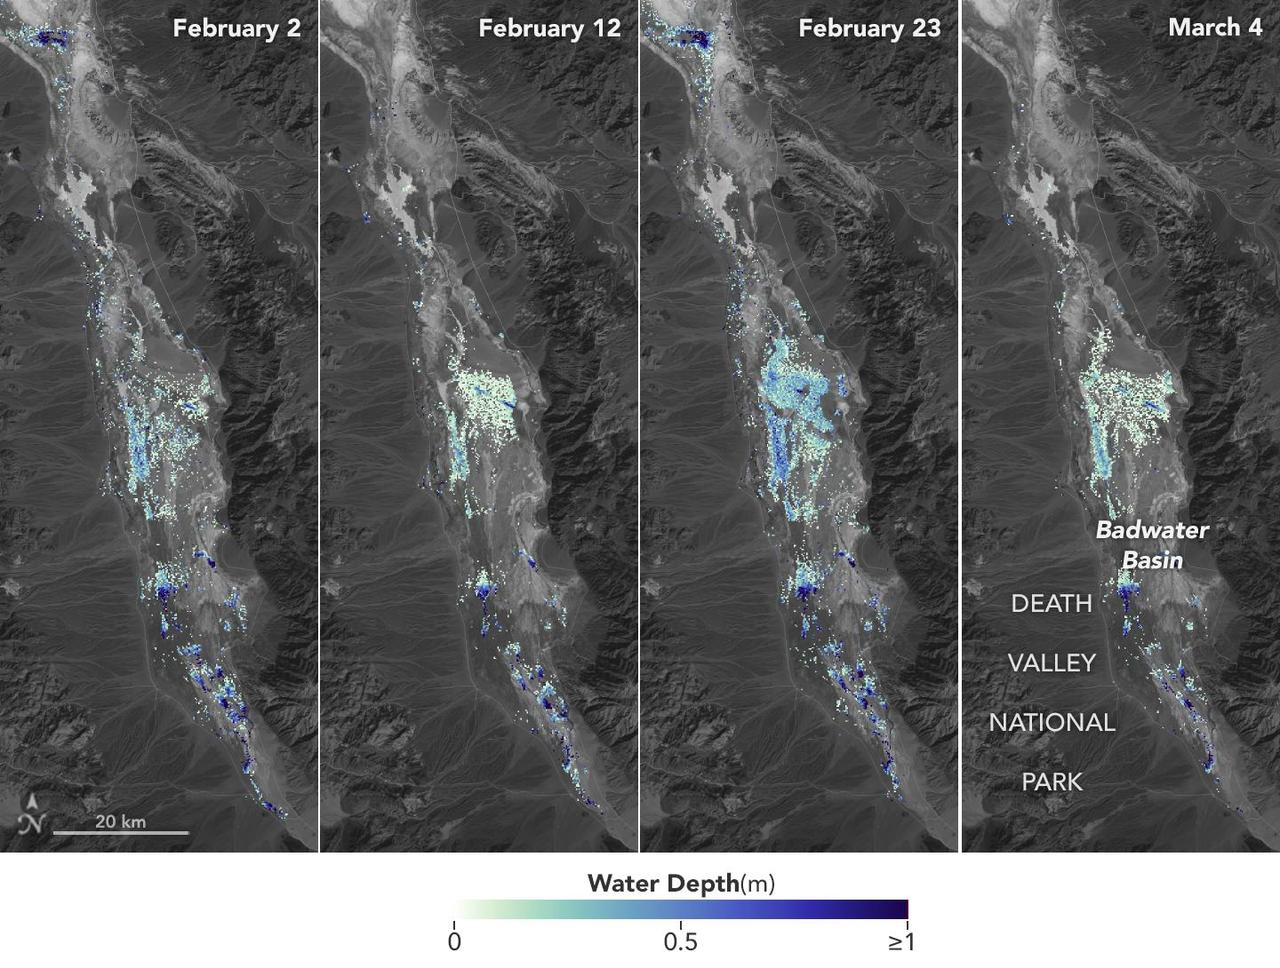
California's Death Valley, the driest place in North America, has hosted an ephemeral lake since late 2023. In March 2024, a NASA-led analysis calculated water depths in the temporary lake over several weeks in February and March 2024, demonstrating the possibilities of the latest water-observing mission, the U.S.-French Surface Water and Ocean Topography (SWOT) satellite. The analysis found that water depths in the lake ranged between about 3 feet (1 meter) to less than 1.5 feet (0.5 meters) over the course of several weeks. This period included a series of storms that swept across California, bringing record amounts of rainfall. To estimate the depth of the lake, known informally as Lake Manly, researchers used water level data collected by SWOT and subtracted corresponding U.S. Geological Survey land elevation information for Badwater Basin. The researchers found that the water levels varied across space and time in the roughly 10-day period between SWOT observations. In the visualization above, water depths of about 3 feet (1 meter) appear dark blue; those of less than 1.5 feet (0.5 meters) appear light yellow. Right after a series of storms in early February, the temporary lake was about 6 miles (10 kilometers) long and 3 miles (5 kilometers) wide. Each pixel in the image represents an area that is about 330 feet by 330 feet (100 meters by 100 meters). Unlike many lakes around the world, Death Valley's lake is temporary, relatively shallow, and strong winds are enough to move the freshwater body a couple of miles, as happened from Feb. 29 to March 2. Since there isn't typically water in Badwater Basin, researchers don't have permanent instruments in place for studying water in this area. SWOT can fill the data gap for when places like this, and others around the world, become inundated. Since shortly after launch in December 2022, SWOT has been measuring the height of nearly all water on Earth's surface, developing one of the most detailed and comprehensive views of the planet's oceans and freshwater lakes and rivers. Not only can the satellite detect the extent of water, as other satellites can, but SWOT can also measure water surface levels. Combined with other types of information, SWOT measurements can yield water depth data for inland features like lakes and rivers. The SWOT science team makes its measurements using the Ka-band Radar Interferometer (KaRIn) instrument. With two antennas spread 33 feet (10 meters) apart on a boom, KaRIn produces a pair of data swaths as it circles the globe, bouncing radar pulses off water surfaces to collect surface-height information. Launched from Vandenberg Space Force Base in central California, SWOT is now in its operations phase, collecting data that will be used for research and other purposes. Animation available at https://photojournal.jpl.nasa.gov/catalog/PIA26184
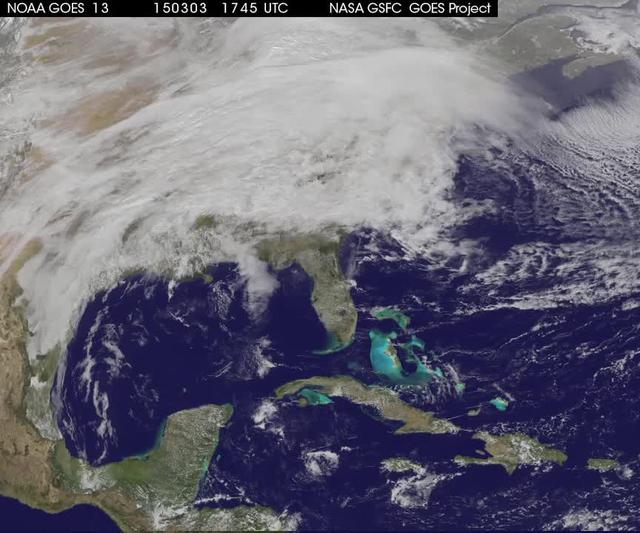
A winter storm was bringing snow, sleet and freezing rain from lower Mississippi Valley to Northeastern U.S. on Thursday, March 5, 2015. A new NASA animation of NOAA's GOES-East satellite imagery showed the progression of the clouds associated with the storm system that triggered winter storm warnings and winter weather advisories from the southern Plains eastward through the Mid-Atlantic and southern New England coast. The system also triggered flood warnings along and to the west of the central Appalachians. An animation of GOES satellite visible and infrared imagery from March 3 through March 5 showed clouds associated with a cold front push over U.S. East coast. Behind the front, Arctic air is expected to drop low temperatures into the single numbers from Washington, D.C. to Minnesota overnight. Temperatures in the Carolinas and Tennessee are expected to drop to the low 20s. NOAA's National Weather Service Weather Prediction Center (NWS NPC) in College Park, Maryland noted "a strong cold front moving across the eastern U.S. will bring heavy snow from parts of the Ohio Valley to the Northeast today (March 5) with rain, freezing rain and sleet possible from parts of the lower Mississippi Valley across the Southeast to the southern Mid-Atlantic. Snowfall totals of 5 to 10 inches are possible for some areas. Winter Storm Warnings remain in effect from Texas to Nantucket." The animation ends at 17:45 UTC (12:45 p.m. EST). Before the end of the animation, the low pressure center along an arctic frontal boundary was nearly stationary over western North Carolina at 9 a.m. EST on March 5, according to the NWS NPC. NWS radar and surface observations indicated an extended swath of precipitation from near the Texas Gulf Coast through the interior eastern U.S. into southern New England. NPC's storm summary noted at that time "rain was changing to sleet/freezing rain and to all snow along a band within this swath as colder air continues to filter in from the north. Some areas in Tennessee, the northern mid-Atlantic and southern New England were reporting moderate to heavy snow." To create the video and imagery, NASA/NOAA's GOES Project takes the cloud data from NOAA's GOES-East satellite and overlays it on a true-color image of land and ocean created by data from the Moderate Resolution Imaging Spectroradiometer, or MODIS, instrument that flies aboard NASA's Aqua and Terra satellites. Together, those data created the entire picture of the storm and show its movement. After the storm system passes, the snow on the ground becomes visible. GOES satellites provide the kind of continuous monitoring necessary for intensive data analysis. Geostationary describes an orbit in which a satellite is always in the same position with respect to the rotating Earth. This allows GOES to hover continuously over one position on Earth's surface, appearing stationary. For updated information about the storm system, visit NOAA's NWS website: <a href="http://www.weather.gov" rel="nofollow">www.weather.gov</a> For more information about GOES satellites, visit: <a href="http://www.goes.noaa.gov/" rel="nofollow">www.goes.noaa.gov/</a> or goes.gsfc.nasa.gov/ Rob Gutro NASA's Goddard Space Flight Center <b><a href="http://www.nasa.gov/audience/formedia/features/MP_Photo_Guidelines.html" rel="nofollow">NASA image use policy.</a></b> <b><a href="http://www.nasa.gov/centers/goddard/home/index.html" rel="nofollow">NASA Goddard Space Flight Center</a></b> enables NASA’s mission through four scientific endeavors: Earth Science, Heliophysics, Solar System Exploration, and Astrophysics. Goddard plays a leading role in NASA’s accomplishments by contributing compelling scientific knowledge to advance the Agency’s mission. <b>Follow us on <a href="http://twitter.com/NASAGoddardPix" rel="nofollow">Twitter</a></b> <b>Like us on <a href="http://www.facebook.com/pages/Greenbelt-MD/NASA-Goddard/395013845897?ref=tsd" rel="nofollow">Facebook</a></b> <b>Find us on <a href="http://instagrid.me/nasagoddard/?vm=grid" rel="nofollow">Instagram</a></b>

This image shows a portion of an enigmatic formation called banded terrain, which is only observed in the northwest of the Hellas basin. This basin was formed by a giant impact around 4 billion years ago. It is the deepest impact basin on the planet, and banded terrain is in the deepest part of the basin (at elevations around 7 kilometers). This terrain is characterized by smooth bands of material separated by ridges or troughs, with circular and lobe shapes that are typically several kilometers long and a few hundred meters wide. A closeup shows banded terrain deforming around a mesa (bottom) and the transition of smooth banded terrain into surrounding rough terrain (top). Other banded terrain appears to have undergone deformation, like by a glacier, though it is not quite like terrestrial landforms. There are several ideas for what it could be, including a thin, flowing, ice-rich layer or sediment that was deformed beneath a former ice sheet. https://photojournal.jpl.nasa.gov/catalog/PIA24947
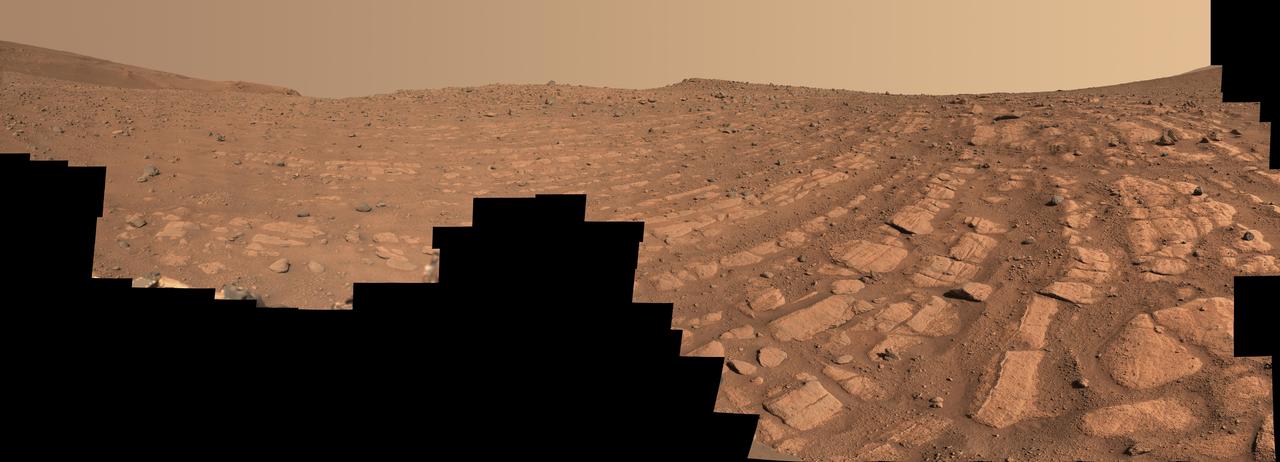
Scientists think that the bands of rocks seen in this image may have been formed by a very fast, deep river – the first of its kind evidence has been found for on Mars. NASA's Perseverance Mars rover captured this mosaic at a location nicknamed "Skrinkle Haven" using its Mastcam-Z camera between Feb. 28 and March 9, 2023 (between the 721st and 729th Martian days, or sols, of the mission). The mosaic is made up of 203 individual images that were stitched together after being sent back from Mars. This natural color view is approximately how the scene would appear to an average person if they were on Mars. "Skrinkle Haven" offers the clearest example of these curved rock layers – called "the curvilinear unit" – that had previously only been seen from space. Scientists are now debating what kind of powerfully flowing water formed those curves: a river like the Mississippi, which winds snakelike across the landscape, or a braided river like Nebraska's Platte, which forms small islands of sediment called sandbars. When viewed from the ground, the curved layers are arranged in rows, and appear to ripple out across the landscape. They could be the remnants of a river's banks that shifted over time – or the remnants of sandbars that formed in the river. The layers were likely much taller in the past; scientists suspect that after these piles of sediment turned to rock, they were sand-blasted by wind over the course of eons and carved down to their present size. Arizona State University leads the operations of the Mastcam-Z instrument, working in collaboration with Malin Space Science Systems in San Diego, on the design, fabrication, testing, and operation of the cameras, and in collaboration with the Niels Bohr Institute of the University of Copenhagen on the design, fabrication, and testing of the calibration targets. A key objective for Perseverance's mission on Mars is astrobiology, including the search for signs of ancient microbial life. The rover will characterize the planet's geology and past climate, pave the way for human exploration of the Red Planet, and be the first mission to collect and cache Martian rock and regolith (broken rock and dust). Subsequent NASA missions, in cooperation with ESA (European Space Agency), would send spacecraft to Mars to collect these sealed samples from the surface and return them to Earth for in-depth analysis. The Mars 2020 Perseverance mission is part of NASA's Moon to Mars exploration approach, which includes Artemis missions to the Moon that will help prepare for human exploration of the Red Planet. https://photojournal.jpl.nasa.gov/catalog/PIA25829