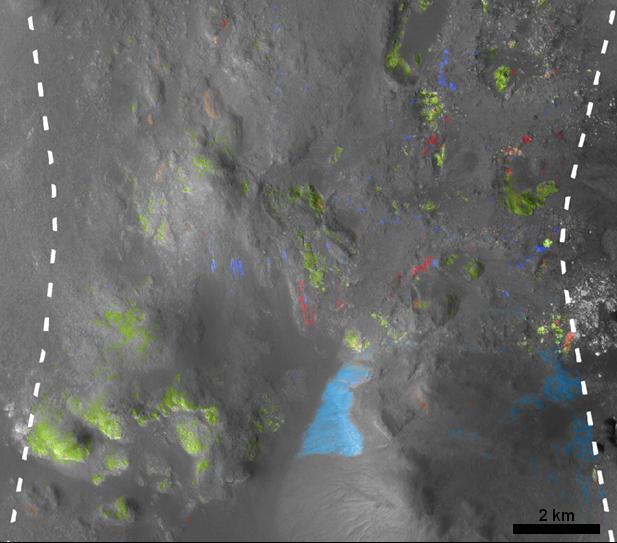
This view of Stokes Crater is a mosaic of images taken by NASA Mars Reconnaissance Orbiter and ESA Mars Express showing at least one of the nine craters in the northern lowlands of Mars with exposures of hydrated minerals detected from orbit.
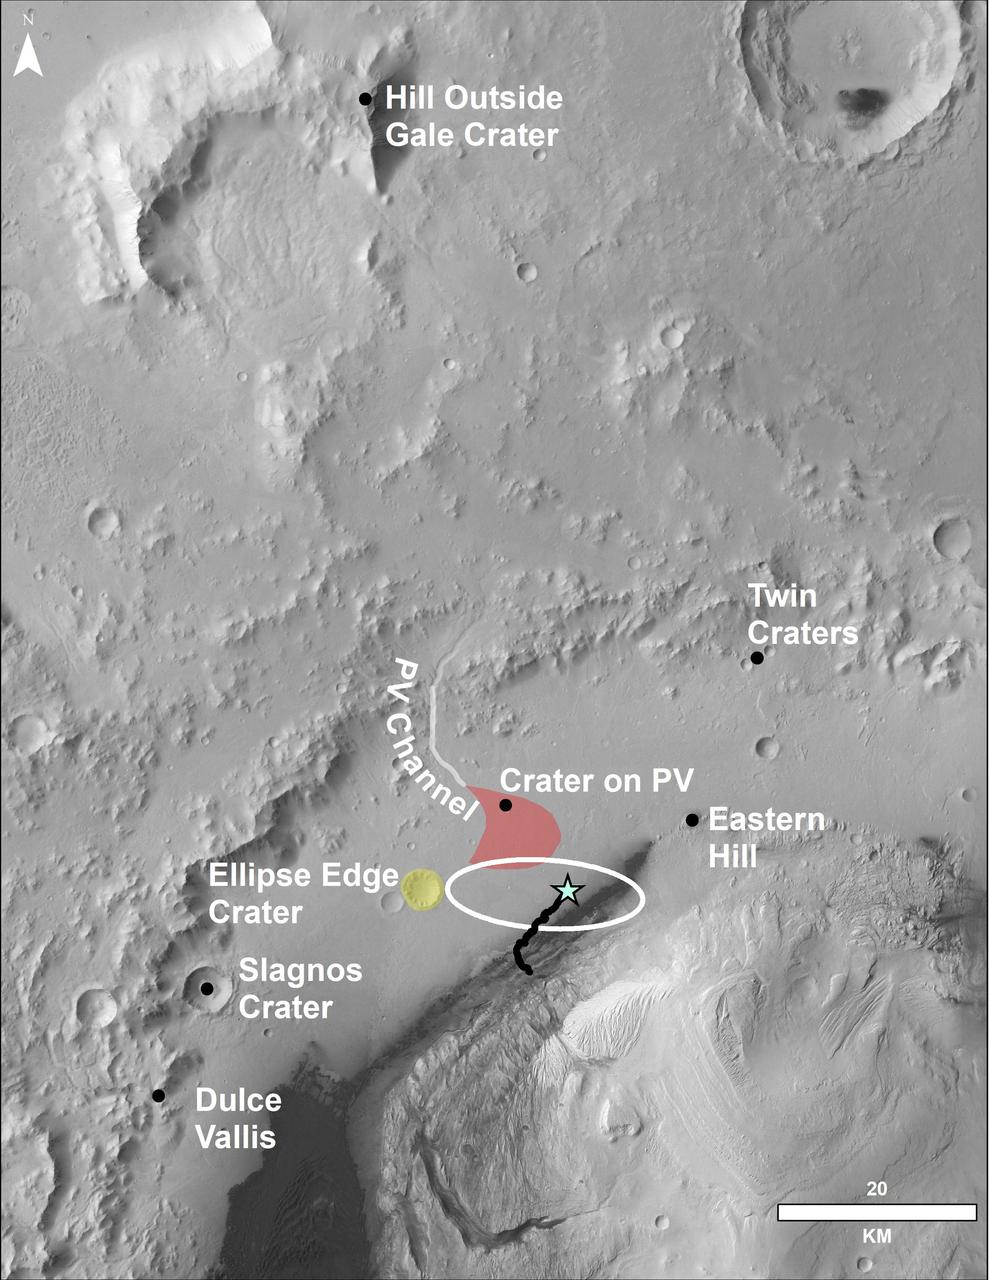
This image of the northwestern portion of Mars' Gale Crater and terrain north of it, from the European Space Agency's Mars Express orbiter, provides a locator map for some features visible in an October 2017 panorama from NASA's Curiosity Mars rover (see PIA22210, Fig. 1). A blue star marks the rover's landing site, on the floor of Gale Crater near the base of Mount Sharp. That layered mountain occupies the middle of the crater. The black line indicates the path of the rover's traverse from its August 2012 landing to about the location on lower Mount Sharp, where the panorama was acquired. North is toward the top. At lower right is a 20-kilometer (12.4-mile) scale bar. The base-map image was taken by the High Resolution Stereo Camera on Mars Express. https://photojournal.jpl.nasa.gov/catalog/PIA22208
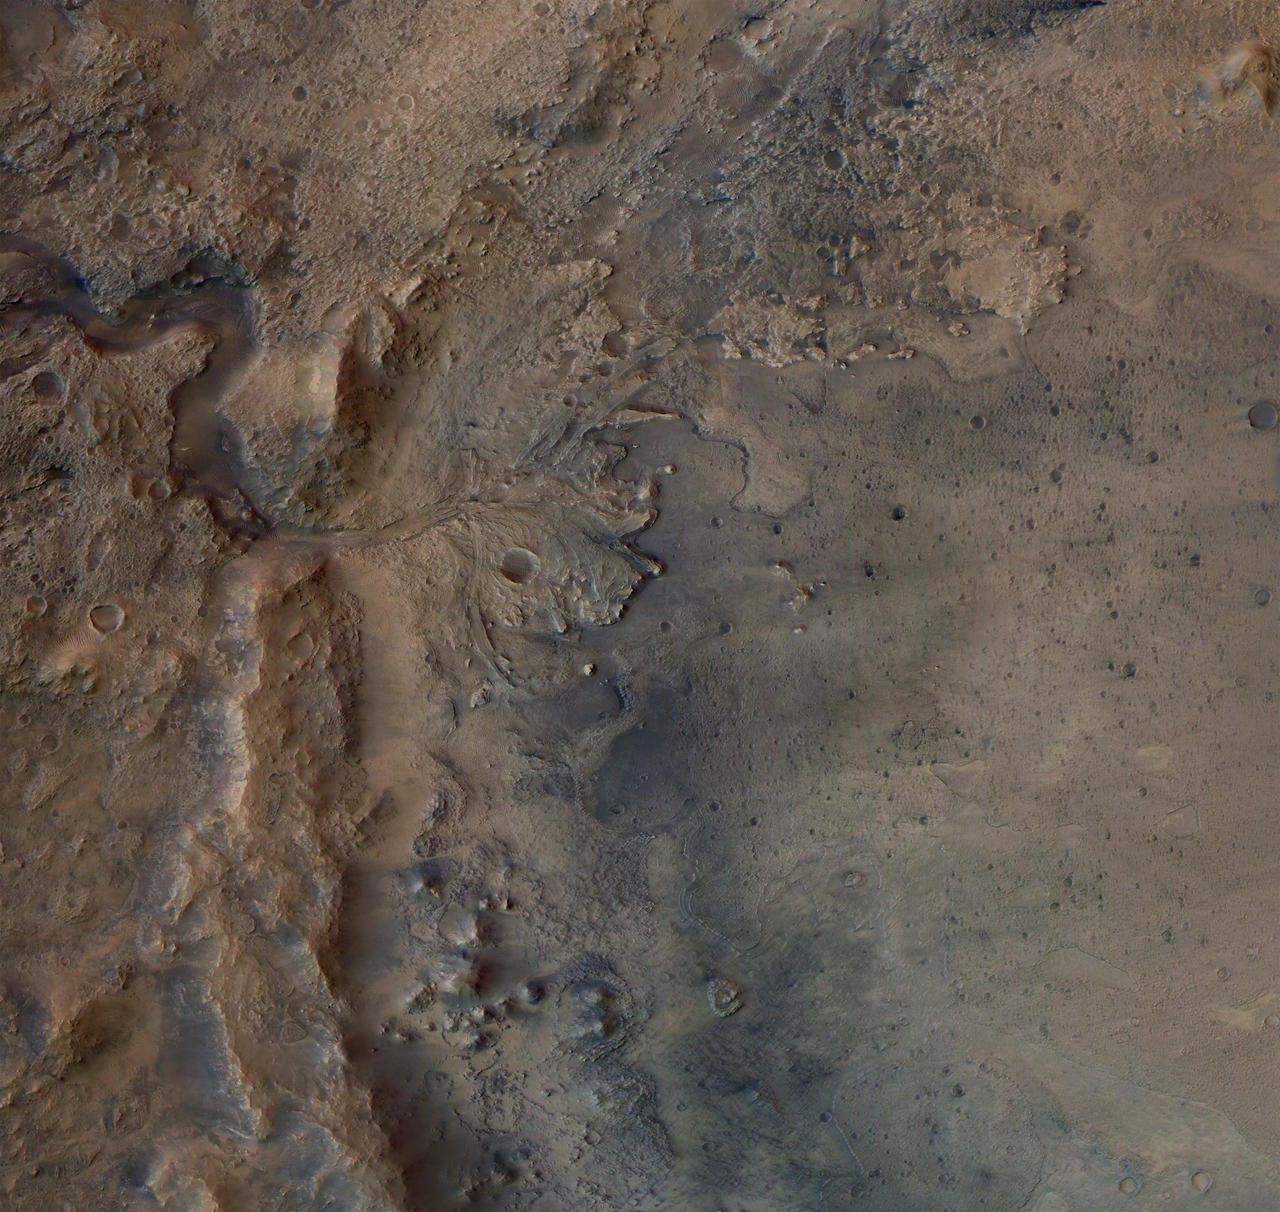
This image shows the remains of an ancient delta in Mars' Jezero Crater, which NASA's Perseverance Mars rover will explore for signs of fossilized microbial life. The image was taken by the High Resolution Stereo Camera aboard the ESA (European Space Agency) Mars Express orbiter. The European Space Operations Centre in Darmstadt, Germany, operates the ESA mission. The High Resolution Stereo Camera was developed by a group with leadership at the Freie Universitat Berlin. https://photojournal.jpl.nasa.gov/catalog/PIA24096
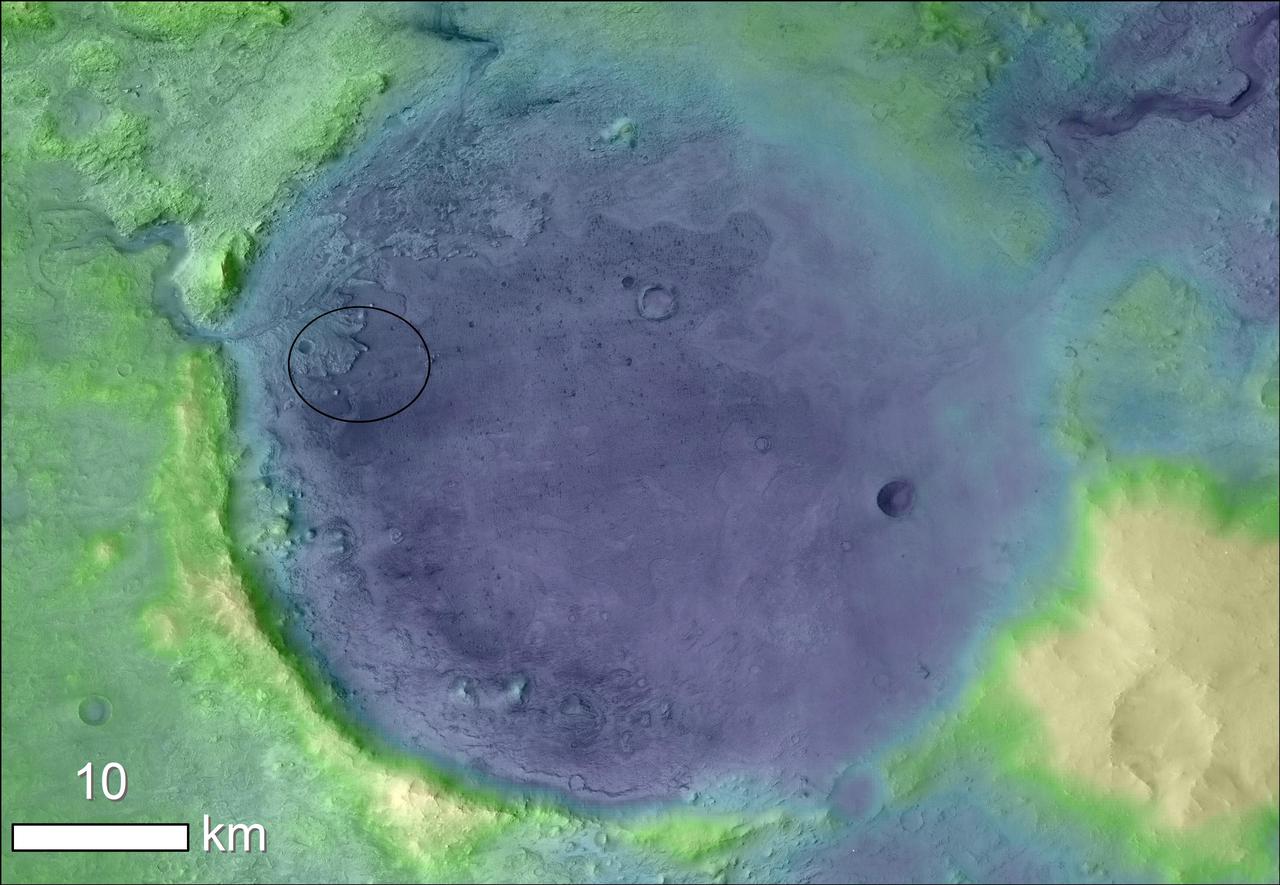
Lighter colors represent higher elevation in this image of Jezero Crater on Mars, the landing site for NASA's Mars 2020 mission. The oval indicates the landing ellipse, where the rover will be touching down on Mars. The color added to this image helps the crater rim stand out clearly, and makes it easier to spot the shoreline of a lake that dried up billions of years ago. Scientists want to visit this shoreline because it may have preserved fossilized microbial life, if any ever formed on Mars. The image was created using data from a combination of instruments and spacecraft: NASA's Mars Global Surveyor and its Mars Orbiter Laser Altimeter (MOLA); NASA's Mars Reconnaissance Orbiter and its Compact Reconnaissance Imaging Spectrometer for Mars (CRISM) and Context Camera (CTX); and the European Space Agency's Mars Express and its High Resolution Stereo Camera (HRSC). https://photojournal.jpl.nasa.gov/catalog/PIA23511

This picture of the European Space Agency Mars Express spacecraft by the Mars Orbiter Camera on NASA Mars Global Surveyor is from the first successful imaging of any spacecraft orbiting Mars taken by another spacecraft orbiting Mars.
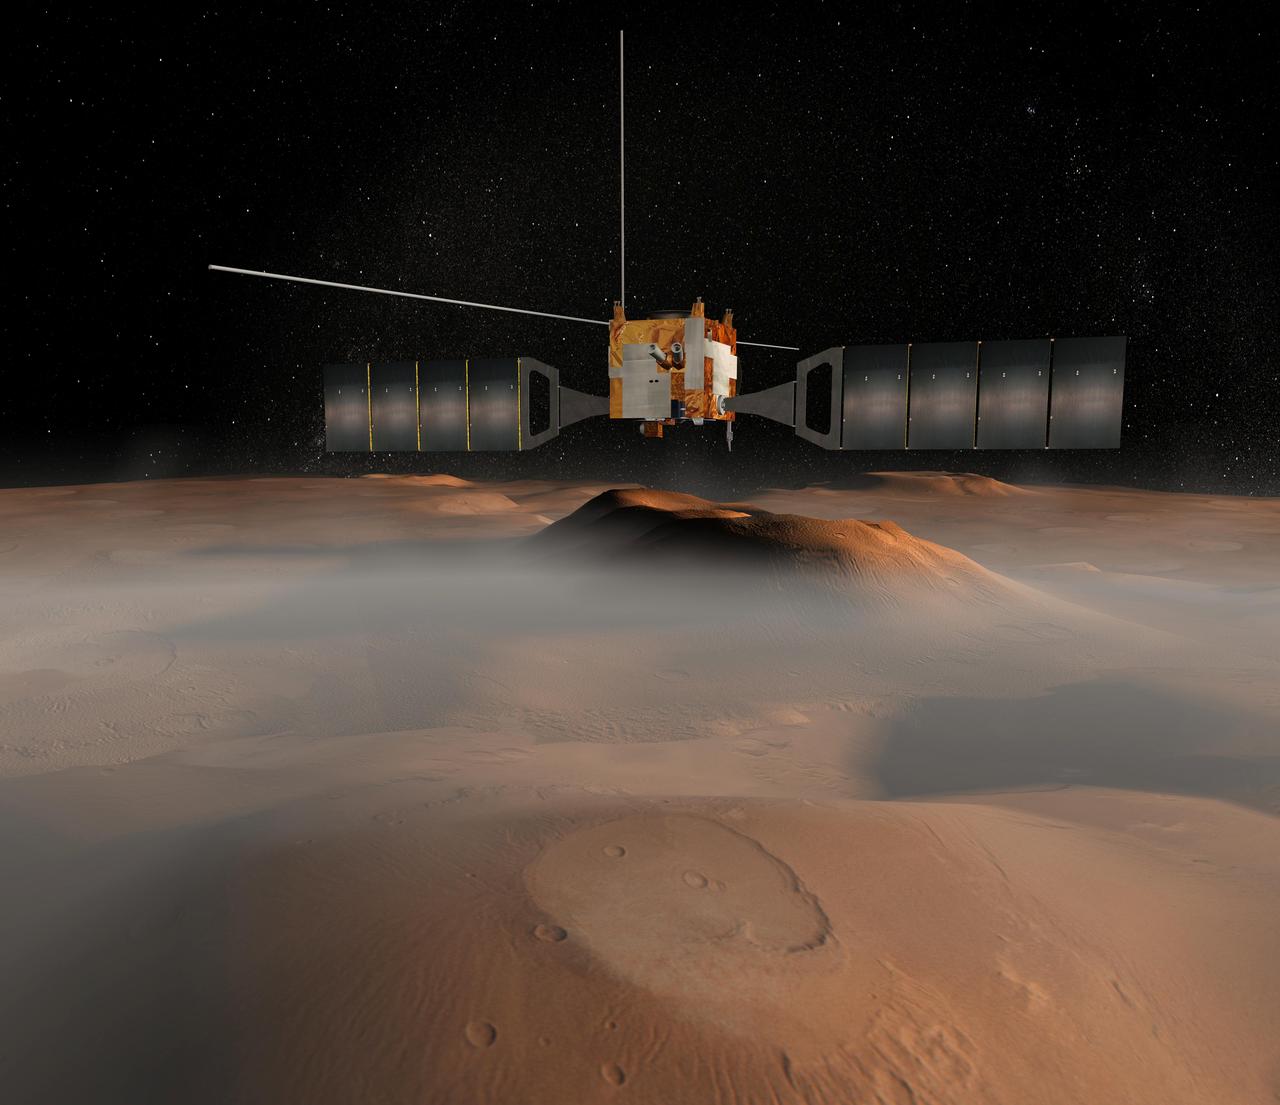
The European Space Agency Mars Express spacecraft is depicted in orbit around Mars in this artist concept illustration. The spacecraft was launched June 2, 2003, from Baikonur, Kazakhstan, on a journey to arrive at Mars in December 2003. http://photojournal.jpl.nasa.gov/catalog/PIA04802
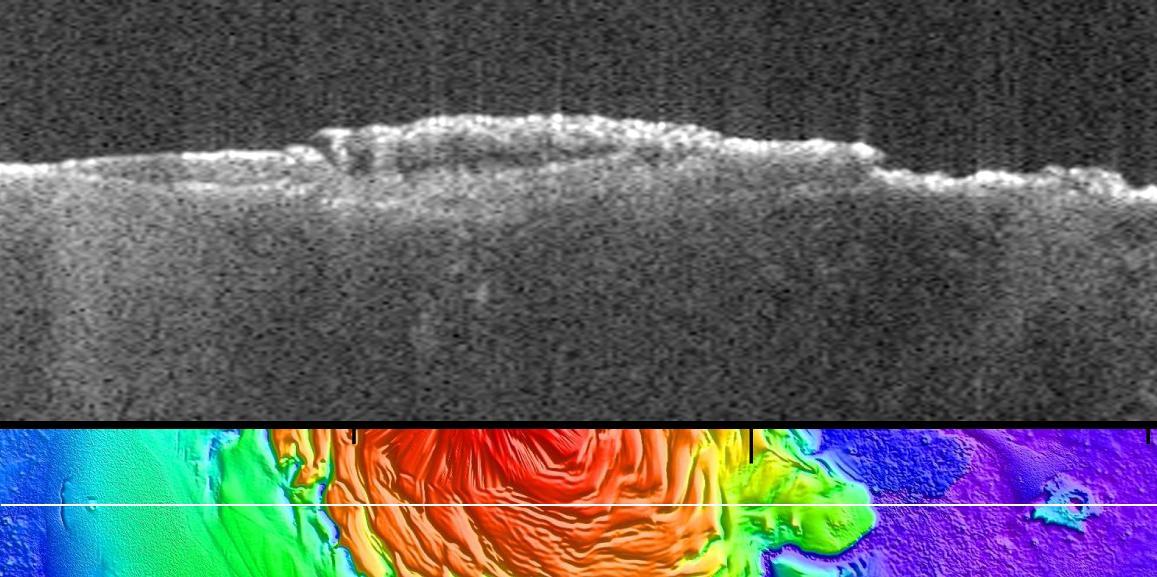
This radargram profile from ESA Mars Express and NASA Mars Global Surveyor orbiter shows data from the subsurface of Mars in the ice-rich north polar plateau of Mars.
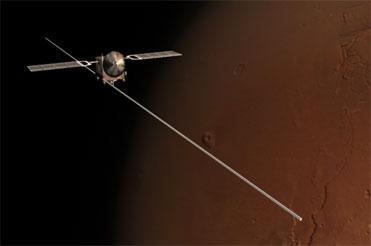
This frame from an animation portrays the unfolding of all three booms making up the antenna for the radar instrument on the European Space Agency Mars Express orbiter.

These plots portray data from radar sounding of Mars mid-latitude ionosphere at three times on Oct. 19 and 20, 2014. The data are from the MARSIS instrument on the European Space Agency Mars Express orbiter.

These spectrograms from the MARSIS instrument on the European Space Agency Mars Express orbiter show the intensity of radar echo in Mars far-northern ionosphere at three times on Oct. 19 and 20, 2014.
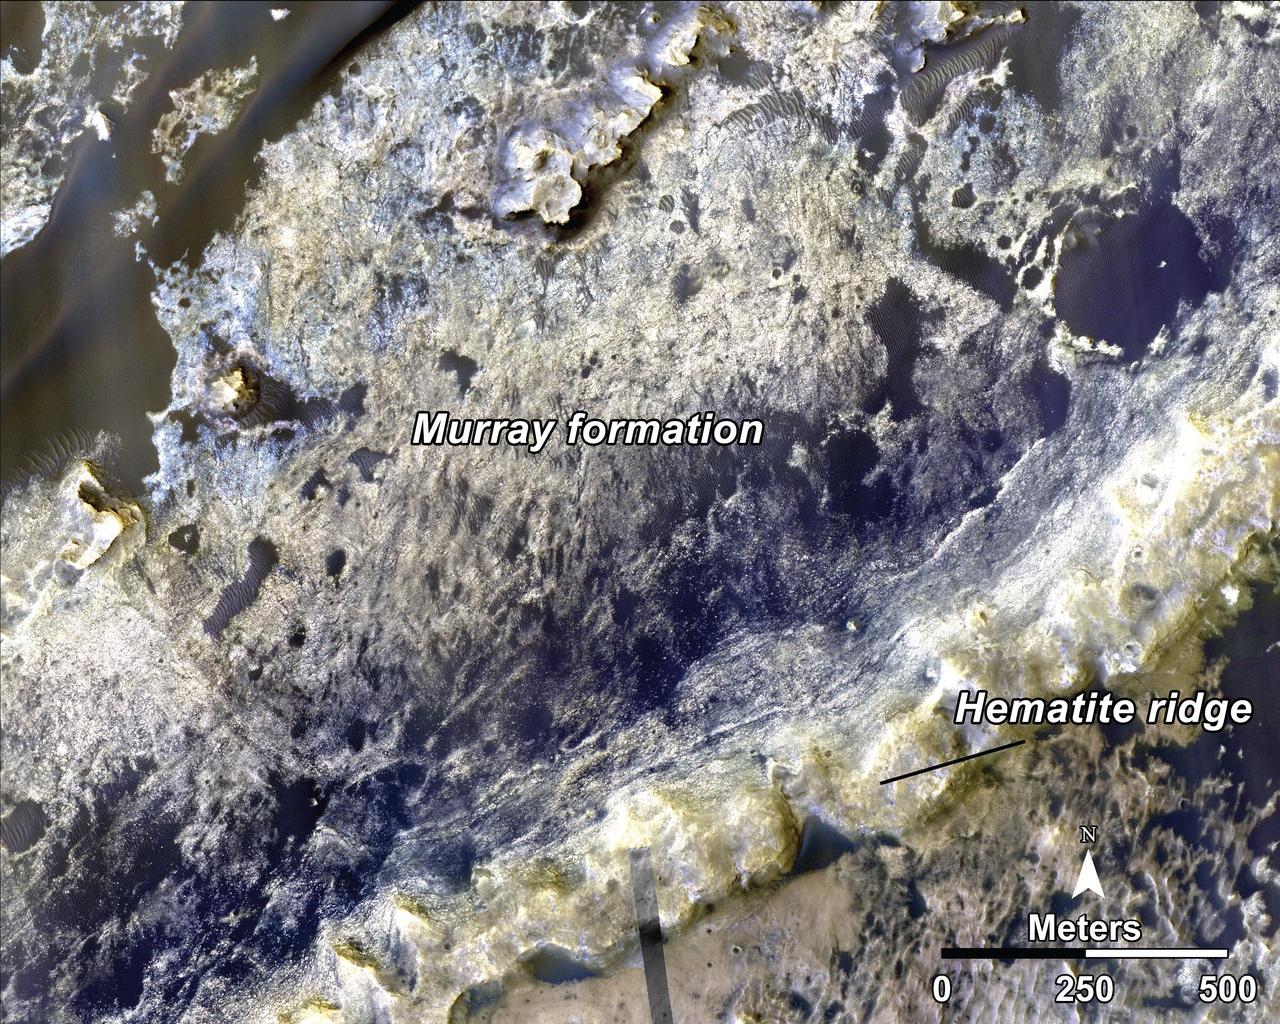
This image, taken by NASA Mars Reconnaissance Orbiter, shows the transition between the Murray Formation, in which layers are poorly expressed and difficult to trace from orbit, and the hematite ridge, which is made up of continuous layers.
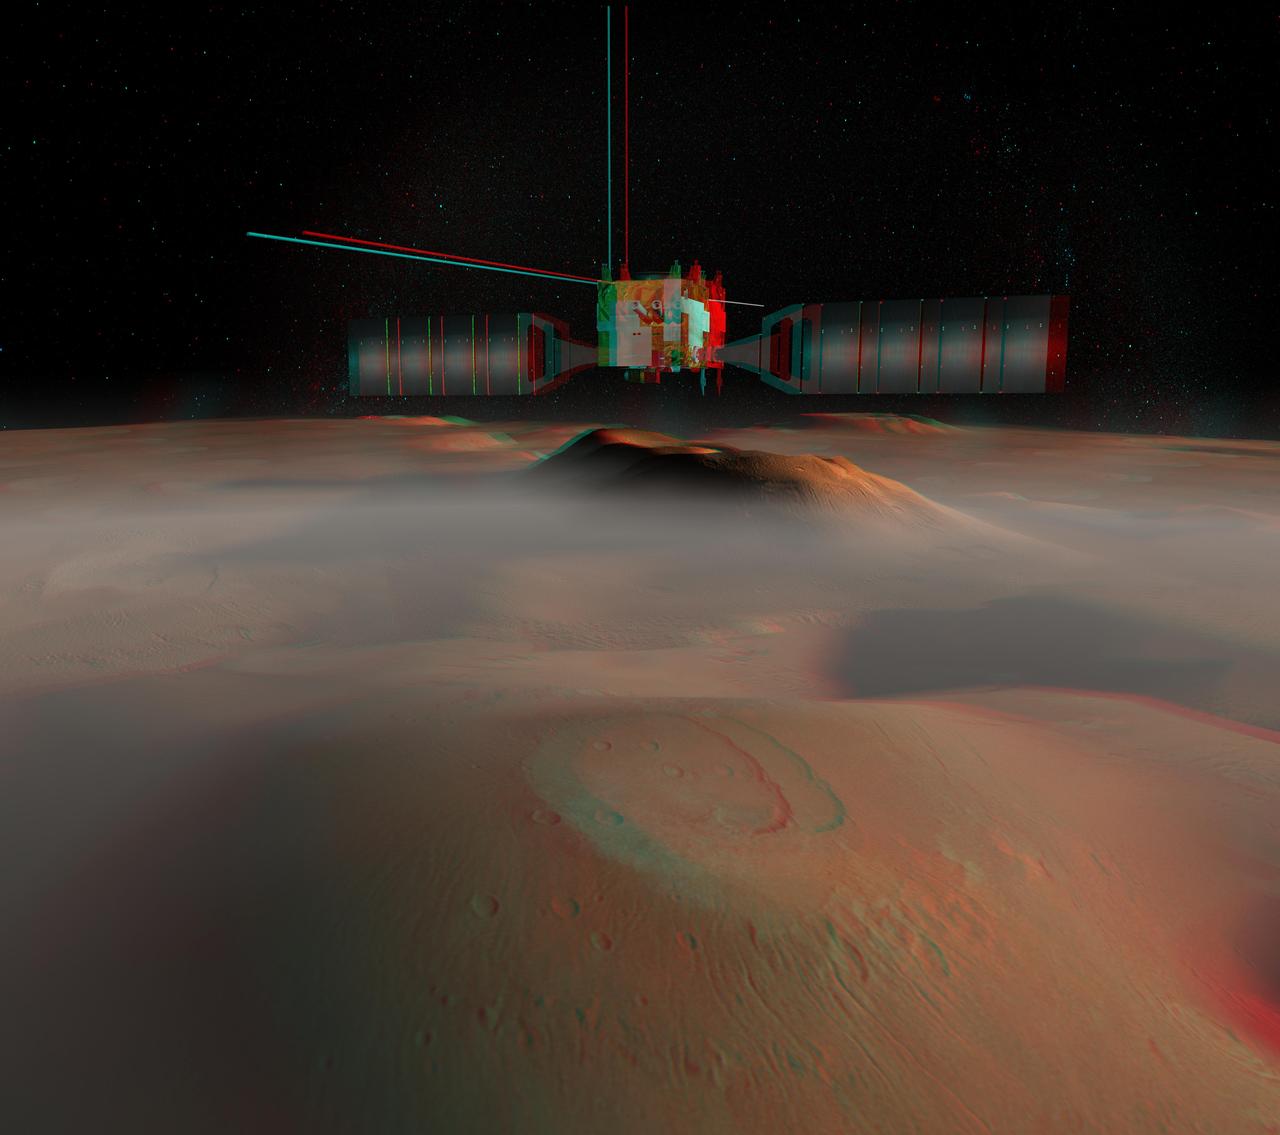
The European Space Agency's Mars Express spacecraft is depicted in orbit around Mars in this artist's concept stereo illustration. The spacecraft was launched June 2, 2003, from Baikonur, Kazakhstan, on a journey to arrive at Mars in December 2003. This red-blue anaglyph artwork can be viewed in 3-D on your computer monitor or in color print form by wearing red-blue (cyan) 3-D glasses. http://photojournal.jpl.nasa.gov/catalog/PIA04803

Mars Radar Opens a Planet Third Dimension
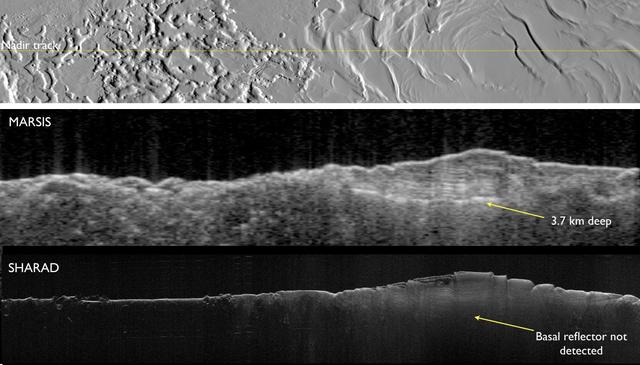
Two Radar Sounders Examine South Polar Layered Deposits on Mars

This chart illustrates how NASA Curiosity rover talks to Earth. While the rover can send direct messages, it communicates more efficiently with the help of spacecraft in orbit, including NASA Odyssey and MRO, and European Space Agency Mars Express.
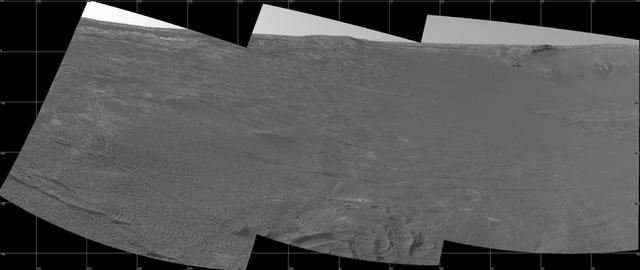
his view of the interior slope and rim of "Endurance Crater" comes from the navigation camera on NASA's Mars Exploration Rover Opportunity with an assist from the European Space Agency's Mars Express orbiter. Opportunity took the three frames that make up this image on the rover's 188th martian day (Aug. 4, 2004), before transmitting this and other data to Mars Express. The orbiter then relayed the data to Earth. Rover wheel tracks are visible in the foreground. http://photojournal.jpl.nasa.gov/catalog/PIA06758
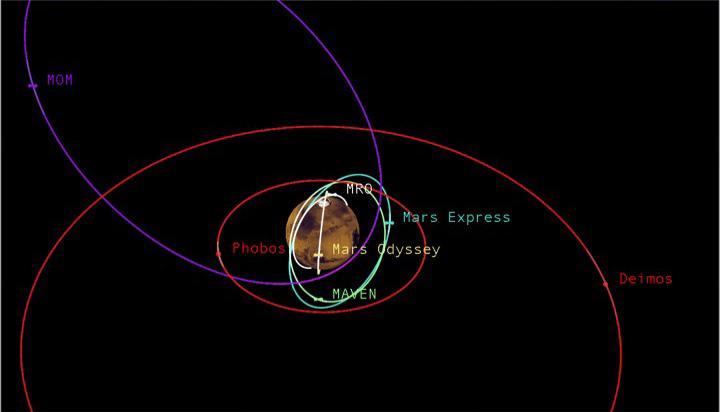
This graphic depicts the relative shapes and distances from Mars for five active orbiter missions plus the planet's two natural satellites. It illustrates the potential for intersections of the spacecraft orbits. The number of active orbiter missions at Mars increased from three to five in 2014. With the increased traffic, NASA has augmented a process for anticipating orbit intersections and avoiding collisions. NASA's Mars Odyssey and MRO (Mars Reconnaissance Orbiter) travel near-circular orbits. The European Space Agency's Mars Express, NASA's MAVEN (Mars Atmosphere and Volatile Evolution) and India's MOM (Mars Orbiter Mission), travel more elliptical orbits. Phobos and Deimos are the two natural moons of Mars. http://photojournal.jpl.nasa.gov/catalog/PIA19396
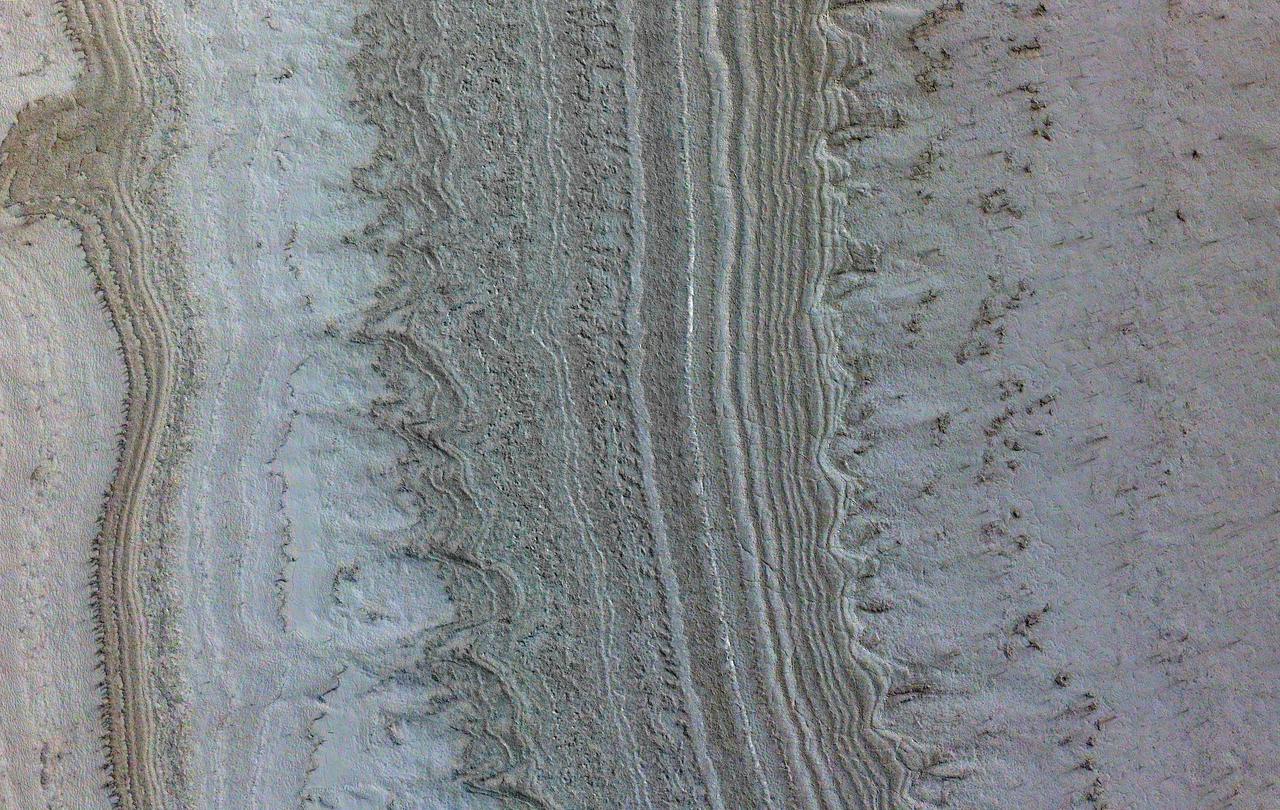
This image taken by NASA's Mars Reconnaissance Orbiter (MRO) shows ice sheets at Mars' south pole. The spacecraft detected clays near this ice; scientists have proposed such clays are the source of radar reflections that have been previously interpreted as liquid water using data from the ESA (European Space Agency) Mars Express orbiter. Flying 186 miles (300 kilometers) above the Martian surface, MRO used its High-Resolution Imaging Science Experiment (HiRISE) camera to study the ice sheets while using its Compact Reconnaissance Imaging Spectrometer (CRISM) to map out clay minerals near the ice. https://photojournal.jpl.nasa.gov/catalog/PIA24763
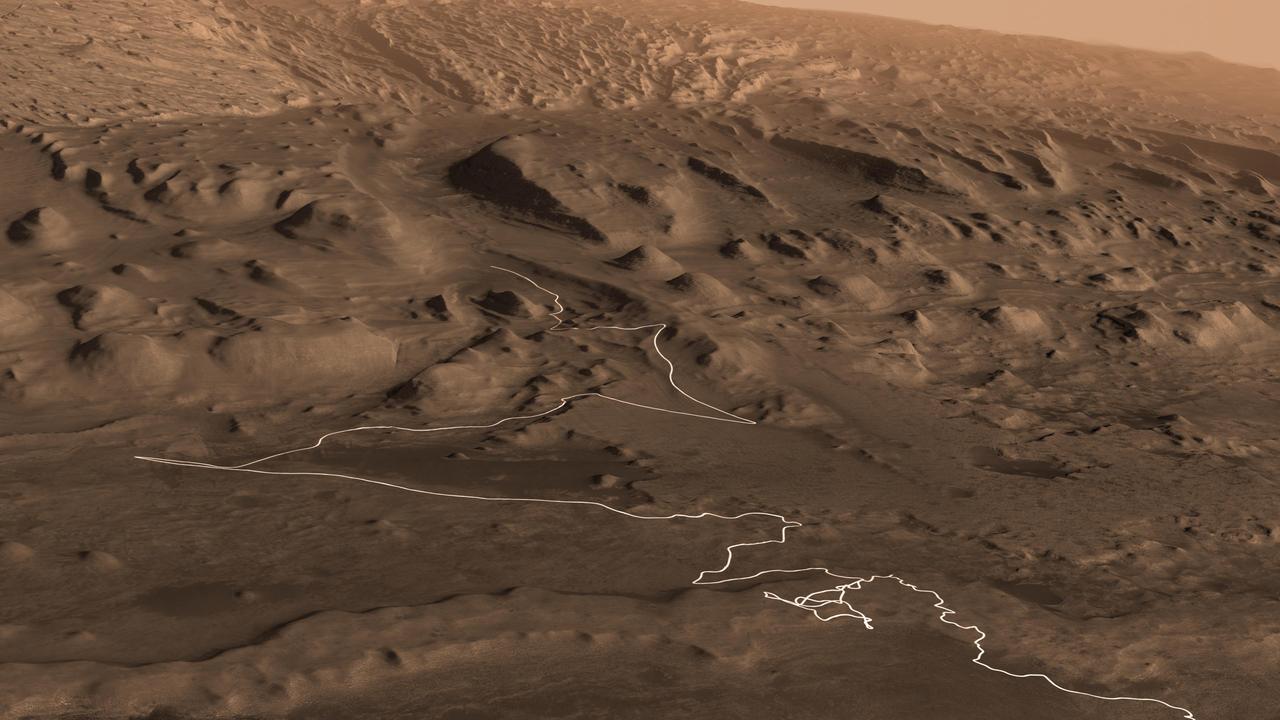
This animation shows a proposed route for NASA's Curiosity rover, which is climbing lower Mount Sharp on Mars. The annotated version of the map labels different regions that scientists working with the rover would like to explore in coming years. A flyover video explains them in more detail. Data used in creating this map came from several instruments on NASA's Mars Reconnaissance Orbiter (MRO), including the High Resolution Imaging Science Experiment (HiRISE), Compact Reconnaissance Imaging Spectrometer for Mars (CRISM) and the Context Camera (CTX). The High Resolution Stereo Camera (HRSC) instrument on the European Space Agency's Mars Express also contributed data. Animation available at https://photojournal.jpl.nasa.gov/catalog/PIA23179
![The combination of morphological and topographic information from stereo images from NASA's Mars Reconnaissance Orbiter, as well as compositional data from near-infrared spectroscopy has been proven to be a powerful tool for understanding the geology of Mars. Beginning with the OMEGA instrument on the European Space Agency's Mars Express orbiter in 2003, the surface of Mars has been examined at near-infrared wavelengths by imaging spectrometers that are capable of detecting specific minerals and mapping their spatial extent. The CRISM (Compact Reconnaissance Imaging Spectrometer for Mars) instrument on our orbiter is a visible/near-infrared imaging spectrometer, and the HiRISE camera works together with it to document the appearance of mineral deposits detected by this orbital prospecting. Mawrth Vallis is one of the regions on Mars that has attracted much attention because of the nature and diversity of the minerals identified by these spectrometers. It is a large, ancient outflow channel on the margin of the Southern highlands and Northern lowlands. Both the OMEGA and CRISM instruments have detected clay minerals here that must have been deposited in a water-rich environment, probably more than 4 billion years ago. For this reason, Mawrth Vallis is one of the two candidate landing sites for the future Mars Express Rover Mission planned by the European Space Agency. This image was targeted on a location where the CRISM instrument detected a specific mineral called alunite, KAl3(SO4)2(OH)6. Alunite is a hydrated aluminum potassium sulfate, a mineral that is notable because it must have been deposited in a wet acidic environment, rich in sulfuric acid. Our image shows that the deposit is bright and colorful, and extensively fractured. The width of the cutout is 1.2 kilometers. The map is projected here at a scale of 50 centimeters (19.7 inches) per pixel. [The original image scale is 60.1 centimeters (23.7 inches) per pixel (with 2 x 2 binning); objects on the order of 180 centimeters (70.9 inches) across are resolved.] North is up. https://photojournal.jpl.nasa.gov/catalog/PIA21936](https://images-assets.nasa.gov/image/PIA21936/PIA21936~medium.jpg)
The combination of morphological and topographic information from stereo images from NASA's Mars Reconnaissance Orbiter, as well as compositional data from near-infrared spectroscopy has been proven to be a powerful tool for understanding the geology of Mars. Beginning with the OMEGA instrument on the European Space Agency's Mars Express orbiter in 2003, the surface of Mars has been examined at near-infrared wavelengths by imaging spectrometers that are capable of detecting specific minerals and mapping their spatial extent. The CRISM (Compact Reconnaissance Imaging Spectrometer for Mars) instrument on our orbiter is a visible/near-infrared imaging spectrometer, and the HiRISE camera works together with it to document the appearance of mineral deposits detected by this orbital prospecting. Mawrth Vallis is one of the regions on Mars that has attracted much attention because of the nature and diversity of the minerals identified by these spectrometers. It is a large, ancient outflow channel on the margin of the Southern highlands and Northern lowlands. Both the OMEGA and CRISM instruments have detected clay minerals here that must have been deposited in a water-rich environment, probably more than 4 billion years ago. For this reason, Mawrth Vallis is one of the two candidate landing sites for the future Mars Express Rover Mission planned by the European Space Agency. This image was targeted on a location where the CRISM instrument detected a specific mineral called alunite, KAl3(SO4)2(OH)6. Alunite is a hydrated aluminum potassium sulfate, a mineral that is notable because it must have been deposited in a wet acidic environment, rich in sulfuric acid. Our image shows that the deposit is bright and colorful, and extensively fractured. The width of the cutout is 1.2 kilometers. The map is projected here at a scale of 50 centimeters (19.7 inches) per pixel. [The original image scale is 60.1 centimeters (23.7 inches) per pixel (with 2 x 2 binning); objects on the order of 180 centimeters (70.9 inches) across are resolved.] North is up. https://photojournal.jpl.nasa.gov/catalog/PIA21936
![This image from NASA's Mars Reconnaissance Orbiter (MRO) shows Mars' surface in detail. Mars has captured the imagination of astronomers for thousands of years, but it wasn't until the last half a century that we were able to capture images of its surface in detail. This particular site on Mars was first imaged in 1965 by the Mariner 4 spacecraft during the first successful fly-by mission to Mars. From an altitude of around 10,000 kilometers, this image (the ninth frame taken) achieved a resolution of approximately 1.25 kilometers per pixel. Since then, this location has been observed by six other visible cameras producing images with varying resolutions and sizes. This includes HiRISE (highlighted in yellow), which is the highest-resolution and has the smallest "footprint." This compilation, spanning Mariner 4 to HiRISE, shows each image at full-resolution. Beginning with Viking 1 and ending with our HiRISE image, this animation documents the historic imaging of a particular site on another world. In 1976, the Viking 1 orbiter began imaging Mars in unprecedented detail, and by 1980 had successfully mosaicked the planet at approximately 230 meters per pixel. In 1999, the Mars Orbiter Camera onboard the Mars Global Surveyor (1996) also imaged this site with its Wide Angle lens, at around 236 meters per pixel. This was followed by the Thermal Emission Imaging System on Mars Odyssey (2001), which also provided a visible camera producing the image we see here at 17 meters per pixel. Later in 2012, the High-Resolution Stereo Camera on the Mars Express orbiter (2003) captured this image of the surface at 25 meters per pixel. In 2010, the Context Camera on the Mars Reconnaissance Orbiter (2005) imaged this site at about 5 meters per pixel. Finally, in 2017, HiRISE acquired the highest resolution image of this location to date at 50 centimeters per pixel. When seen at this unprecedented scale, we can discern a crater floor strewn with small rocky deposits, boulders several meters across, and wind-blown deposits in the floors of small craters and depressions. This compilation of Mars images spanning over 50 years gives us a visual appreciation of the evolution of orbital Mars imaging over a single site. The map is projected here at a scale of 50 centimeters (19.7 inches) per pixel. [The original image scale is 52.2 centimeters (20.6 inches) per pixel (with 2 x 2 binning); objects on the order of 156 centimeters (61.4 inches) across are resolved.] North is up. https://photojournal.jpl.nasa.gov/catalog/PIA22115](https://images-assets.nasa.gov/image/PIA22115/PIA22115~medium.jpg)
This image from NASA's Mars Reconnaissance Orbiter (MRO) shows Mars' surface in detail. Mars has captured the imagination of astronomers for thousands of years, but it wasn't until the last half a century that we were able to capture images of its surface in detail. This particular site on Mars was first imaged in 1965 by the Mariner 4 spacecraft during the first successful fly-by mission to Mars. From an altitude of around 10,000 kilometers, this image (the ninth frame taken) achieved a resolution of approximately 1.25 kilometers per pixel. Since then, this location has been observed by six other visible cameras producing images with varying resolutions and sizes. This includes HiRISE (highlighted in yellow), which is the highest-resolution and has the smallest "footprint." This compilation, spanning Mariner 4 to HiRISE, shows each image at full-resolution. Beginning with Viking 1 and ending with our HiRISE image, this animation documents the historic imaging of a particular site on another world. In 1976, the Viking 1 orbiter began imaging Mars in unprecedented detail, and by 1980 had successfully mosaicked the planet at approximately 230 meters per pixel. In 1999, the Mars Orbiter Camera onboard the Mars Global Surveyor (1996) also imaged this site with its Wide Angle lens, at around 236 meters per pixel. This was followed by the Thermal Emission Imaging System on Mars Odyssey (2001), which also provided a visible camera producing the image we see here at 17 meters per pixel. Later in 2012, the High-Resolution Stereo Camera on the Mars Express orbiter (2003) captured this image of the surface at 25 meters per pixel. In 2010, the Context Camera on the Mars Reconnaissance Orbiter (2005) imaged this site at about 5 meters per pixel. Finally, in 2017, HiRISE acquired the highest resolution image of this location to date at 50 centimeters per pixel. When seen at this unprecedented scale, we can discern a crater floor strewn with small rocky deposits, boulders several meters across, and wind-blown deposits in the floors of small craters and depressions. This compilation of Mars images spanning over 50 years gives us a visual appreciation of the evolution of orbital Mars imaging over a single site. The map is projected here at a scale of 50 centimeters (19.7 inches) per pixel. [The original image scale is 52.2 centimeters (20.6 inches) per pixel (with 2 x 2 binning); objects on the order of 156 centimeters (61.4 inches) across are resolved.] North is up. https://photojournal.jpl.nasa.gov/catalog/PIA22115
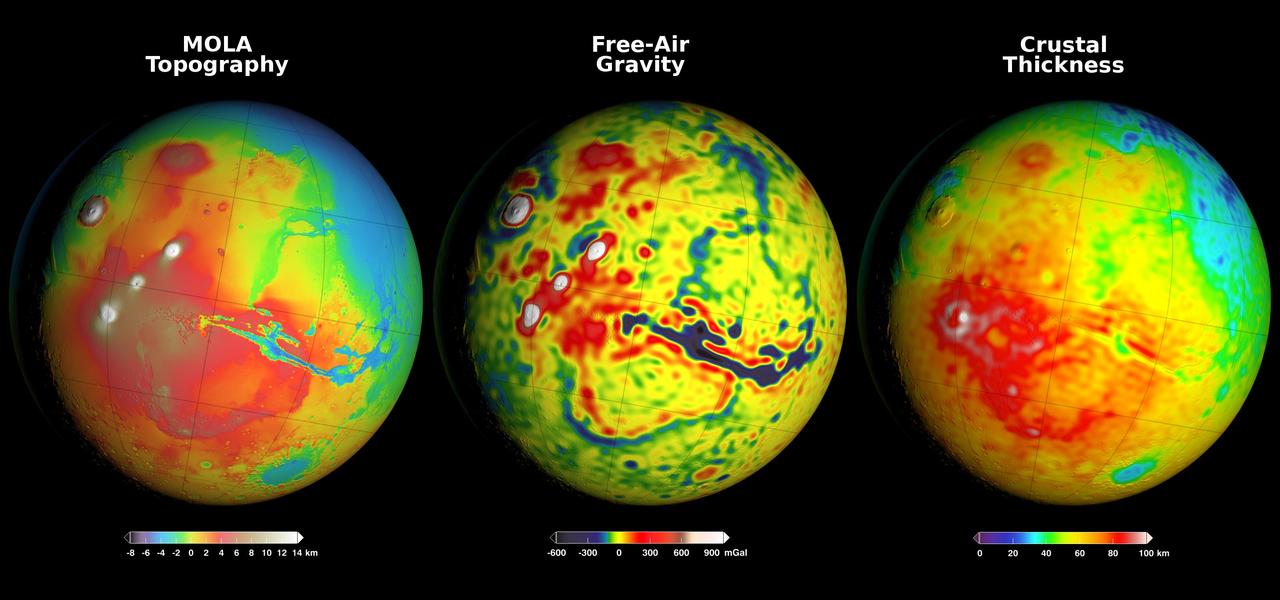
Newly detailed mapping of local variations in Mars' gravitational pull on orbiters (center), combined with topographical mapping of the planet's mountains and valleys (left) yields the best-yet mapping of Mars' crustal thickness (right). These three views of global mapping are centered at 90 degrees west longitude, showing portions of the planet that include tall volcanoes on the left and the deep Valles Marineris canyon system just right of center. Additional views of these global maps are available at http://svs.gsfc.nasa.gov/goto?4436. The new map of Mars' gravity (center) results from analysis of the planet's gravitational effects on orbiters passing over each location on the globe. The data come from many years of using NASA's Deep Space Network to track positions and velocities of NASA's Mars Global Surveyor, Mars Odyssey and Mars Reconnaissance Orbiter. If Mars were a perfectly smooth sphere of uniform density, the gravity experienced by the spacecraft would be exactly the same everywhere. But like other rocky bodies in the solar system, including Earth, Mars has both a bumpy surface and a lumpy interior. As the spacecraft fly in their orbits, they experience slight variations in gravity caused by both of these irregularities, variations which show up as small changes in the velocity and altitude of the three spacecraft. The "free-air" gravity map presents the results without any adjustment for the known bumpiness of Mars' surface. Local gravitational variations in acceleration are expressed in units called gals or galileos. The color-coding key beneath the center map indicates how colors on the map correspond to mGal (milligal) values. The map on the left shows the known bumpiness, or topography, of the Martian surface, using data from the Mars Orbiter Laser Altimeter (MOLA) instrument on Mars Global Surveyor. Mars has no actual "sea level," but does have a defined zero elevation level. The color-coding key beneath this map indicates how the colors correspond to elevations above or below zero, in kilometers. Analysis that subtracts effects of the surface topography from the free-air gravity mapping, combined with an assumption that crust material has a uniform density, leads to the derived mapping of crustal thickness -- or subsurface "lumpiness" -- on the right. Highs in gravity indicate places where the denser mantle material beneath the crust is closer to the surface, and hence where the crust is thinner. The color-coding key for this map indicates how the colors on the map correspond to the thickness of the crust, in kilometers. http://photojournal.jpl.nasa.gov/catalog/PIA20277

Taking advantage of extra solar energy collected during the day, NASA's Mars Exploration Rover Spirit settled in for an evening of stargazing, photographing the two moons of Mars as they crossed the night sky. The first two images in this sequence show gradual enhancements in the surface detail of Mars' largest moon, Phobos, made possible through a combination technique known as "stacking." In "stacking," scientists use a mathematical process known as Laplacian sharpening to reinforce features that appear consistently in repetitive images and minimize features that show up only intermittently. In this view of Phobos, the large crater named Stickney is just out of sight on the moon's upper right limb. Spirit acquired the first two images with the panoramic camera on the night of sol 585 (Aug. 26,2005). The far right image of Phobos, for comparison, was taken by the High Resolution Stereo Camera on Mars Express, a European Space Agency orbiter. The third image in this sequence was derived from the far right image by making it blurrier for comparison with the panoramic camera images to the left http://photojournal.jpl.nasa.gov/catalog/PIA06335
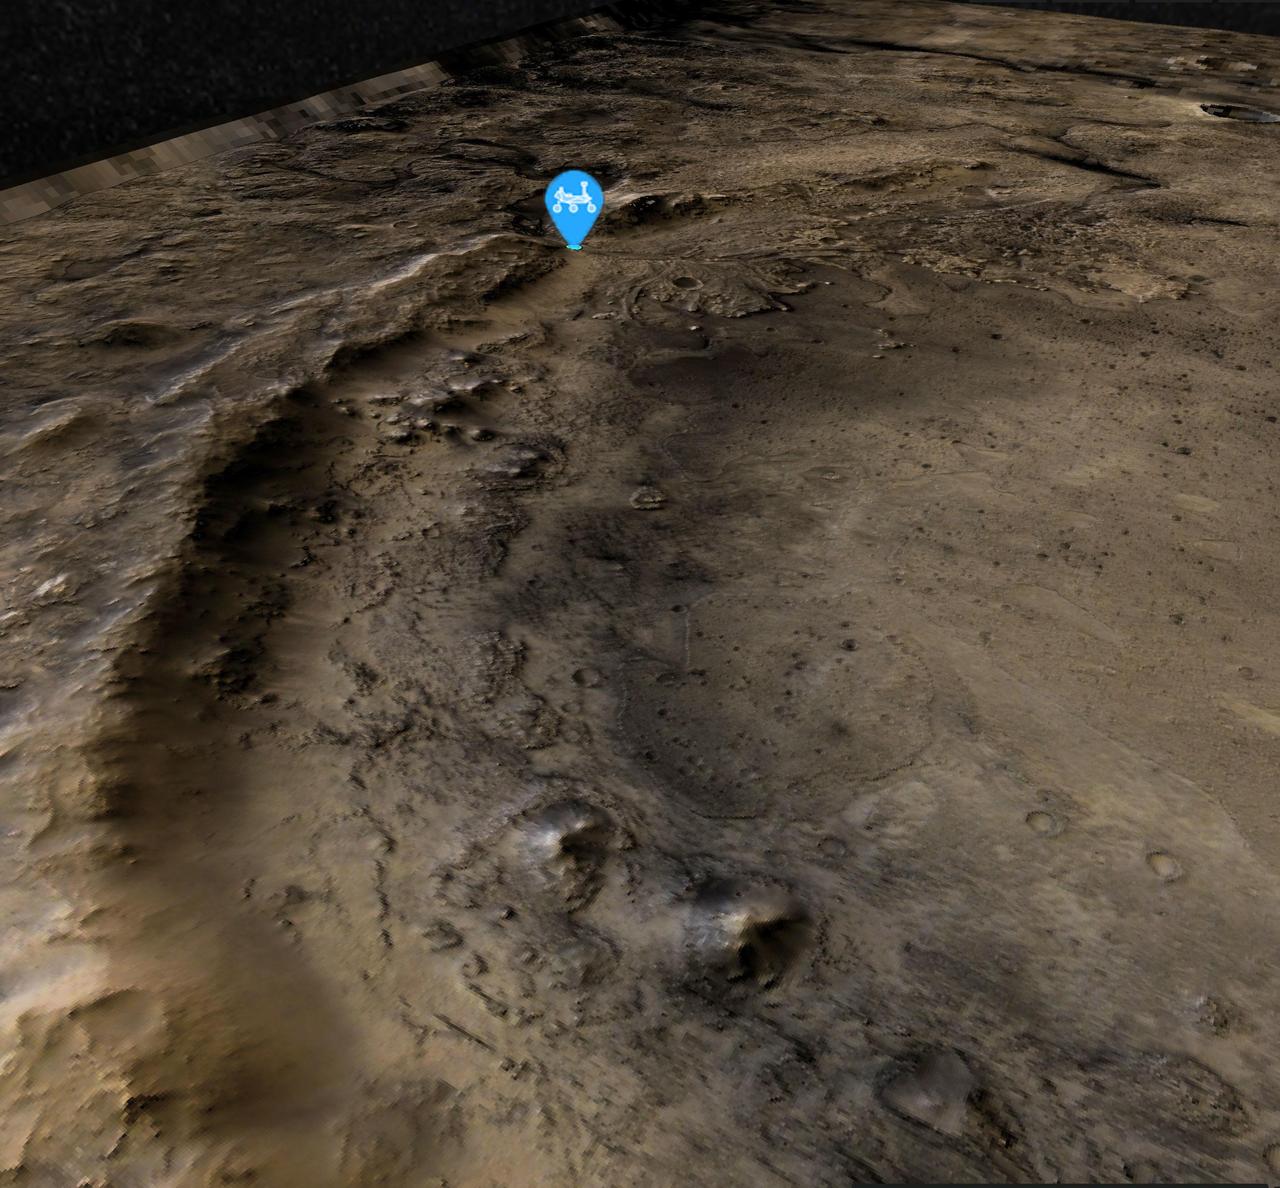
This view of the western edge of Mars' Jezero Crater shows the steep crater rim, which stands roughly 1,000 feet (300 meters) tall. The view looks northwest from the southern edge of the crater. A blue icon shows Perseverance's general location as of Aug. 14, 2024, the 1,238th Martian day, or sol, of the mission. The rover began its ascent of the crater rim on Aug. 27, 2024. Perseverance will encounter slopes of up to 23 degrees (rover drivers plan routes to avoid slopes that would tilt the rover more than 30 degrees) on its way to summit at a place nicknamed "Aurora Park." The high-resolution base map was created with images from the HiRISE (High-Resolution Imaging Science Experiment) camera on NASA's Mars Reconnaissance Orbiter, while the broader color base map is from the High-Resolution Stereo camera on ESA's (the European Space Agency's) Mars Express. Color processing has been applied to both maps to highlight surface features. https://photojournal.jpl.nasa.gov/catalog/PIA26402
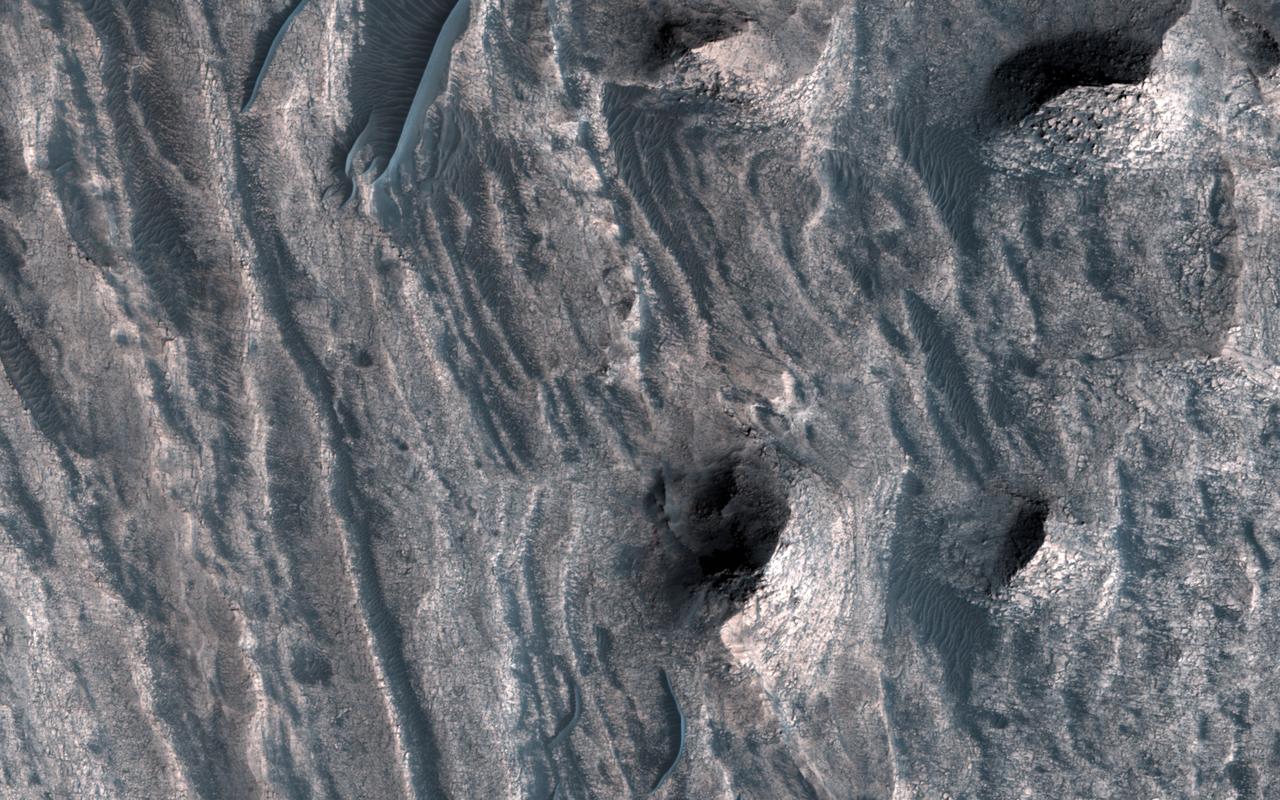
The layered sedimentary deposits inside the giant canyons of Mars have puzzled scientists for decades. These light toned deposits have fine, horizontal laminations that are unlike the rugged rim rock of the Valles Marineris as seen by NASA's Mars Reconnaisance Orbiter (MRO). Various ideas for the origin of the layered sediments have suggested lake deposits, wind blown dust and sand, or volcanic materials that erupted after the canyon was formed, and possibly filled with water. One particular layered deposit, called Ceti Mensa, attracted attention because its deep red color in images collected by the Viking Orbiter mission during the 1970s. Located in west Candor Chasma in the north of the Valles Marineris, Ceti Mensa is an undulating plateau that rises 3 kilometers above the canyon floor and is bounded by steep scarps up to 1.5 kilometers in height. Deep red hues are on the west-facing scarp in particular. The red tint may be due to the presence of crystalline ferric oxide, suggesting that the material may have been exposed to heat or water, or both. Spectral measurements by the Mars Express OMEGA and MRO CRISM instruments confirm the presence of hydrated sulfate salts, such as gypsum and kieserite . These minerals are important for two reasons. On Earth, they typically form in wet environments, suggesting that the deposits in Ceti Mensa may have formed under water. On Mars, these deposits could be valuable to future Martian colonists as fertilizer for growing crops. In a view of the colorful west-facing scarp of Ceti Mensa, we see the interior layers of the deposit, giving us a window into the past history of the sediments as they accumulated over time. We also see layers that were previously too small to view, and a surface that is thoroughly fractured, eroded into knobs, and partially covered by young dark sand dunes. https://photojournal.jpl.nasa.gov/catalog/PIA22051
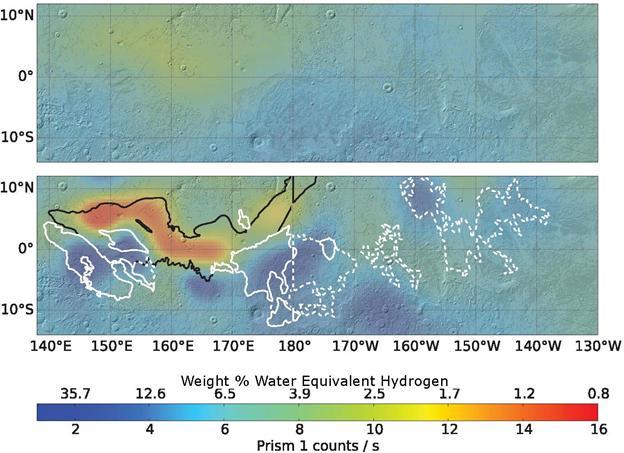
Re-analysis of 2002-2009 data from a hydrogen-finding instrument on NASA's Mars Odyssey orbiter increased the resolution of maps of hydrogen abundance. The reprocessed data (lower map) shows more "water-equivalent hydrogen" (darker blue) in some parts of this equatorial region of Mars. Puzzingly, this suggests the possible presence of water ice just beneath the surface near the equator, though it would not be thermodynamically stable there. The upper map uses raw data from Odyssey's neutron spectrometer instrument, which senses the energy state of neutrons coming from Mars, providing an indication of how much hydrogen is present in the top 3 feet (1 meter) of the surface. Hydrogen detected by Odyssey at high latitudes of Mars in 2002 was confirmed to be in the form of water ice by the follow-up NASA Phoenix Mars Lander mission in 2008. A 2017 reprocessing of the older data applied image-reconstruction techniques often used to reduce blurring from medical imaging data. The results are shown here for an area straddling the equator for about one-fourth the circumference of the planet, centered at 175 degrees west longitude. The white contours outline lobes of a formation called Medusae Fossae, coinciding with some areas of higher hydrogen abundance in the enhanced-resolution analysis. The black line indicates the limit of a relatively young lava plain, coinciding with areas of lower hydrogen abundance in the enhanced-resolution analysis. The color-coding key for hydrogen abundance in both maps is indicated by the horizontal bar, in units expressed as how much water would be present in the ground if the hydrogen is all in the form of water. Units of the equivalent water weight, as a percentage of the material in the ground, are correlated with counts recorded by the spectrometer, ranging from less than 1 weight-percent water equivalent (red) to more than 30 percent (dark blue). https://photojournal.jpl.nasa.gov/catalog/PIA21848

iss071-s-001 (Aug. 31, 2023) --- For nearly a quarter of a century the International Space Station (ISS) has hosted crews and accommodated science experiments even as it has continued to evolve into the highly capable orbiting laboratory of today. With its unique vantage point, the ISS serves as an intersection for discoveries ranging from the vast, such as the search for dark matter and cosmological origins, to the near, such as detailed observation of our home planet and its atmosphere, to the microscopic, including behavior of microbial life, DNA sequencing, and molecular biology in the microgravity environment. The Expedition 71 patch celebrates this science as well as the thousands of multinational scientists and technicians that have contributed to numerous groundbreaking experiments. The ISS is the ultimate destination for the scientifically curious. The symbology represents onboard research into quantum behavior of novel states of matter, antibodies and immune function, the search for dark matter, flame and combustion physics, DNA expression, plant growth and root behavior, and direct earth observation. The human eye and microscope objectives at upper left form the apex of a cone of vision culminating in the Expedition number 71, and represents the deliberate and disciplined practice of scientific observation. Earth’s moon and Mars are also depicted as next steps for exploration, with an anticipation of further rich scientific discovery using many techniques and skills honed aboard the ISS.

This HiRISE image shows the central pit feature of an approximately 20-kilometer diameter complex crater in located at 304.480 degrees east, -11.860 degrees south, just north of the Valles Marineris. Here we can observe a partial ring of light-toned, massive and fractured bedrock, which has been exposed by the impact-forming event, and via subsequent erosion that typically obscure the bedrock of complex central features. Features such as this one are of particular interest as they provide scientists with numerous exposures of bedrock that can be readily observed from orbit and originate from the deep Martian subsurface. Unlike on Earth, plate tectonics do not appear to be active on Mars. Thus, much of the Martian subsurface is not directly observable through uplift, erosion and exposure of mountain chains, which provide the majority of bedrock exposures on Earth. Exposures of subsurface materials generated by these features provides us with some of the only "windows" into the subsurface geology. This makes the study of impact craters an invaluable source of information when trying to understand, not only the impact process, but also the composition and history of Mars. Although much of what we see here is composed of massive and fractured bedrock, there are zones of rock fragmentation, called "brecciation." These fragmented rocks (a.k.a., breccias) are best viewed in the eastern portion of the central pit, which was captured in a previous HiRISE image. Additionally, we see some occurrences of impact melt-bearing deposits that surround and coat the bedrock exposed within the central pit. Several dunes are on the surface throughout the central pit and surrounding crater floor. The mechanisms behind the formation of central features, particularly central pits, are not completely understood. Geologic mapping of these circumferential "mega" blocks of bedrock indicate radial and concentric fracturing that is consistent with deformation through uplift. The exposed bedrock shows well-expressed lineament features that are likely fractures and faults formed during the uplift process. Studies of the bedrock, and such structures in this image, allows us better to understand the formative events and physical processes responsible for their formation. Current research suggests that their formation is the result of some component of uplift followed by collapse. http://photojournal.jpl.nasa.gov/catalog/PIA21205
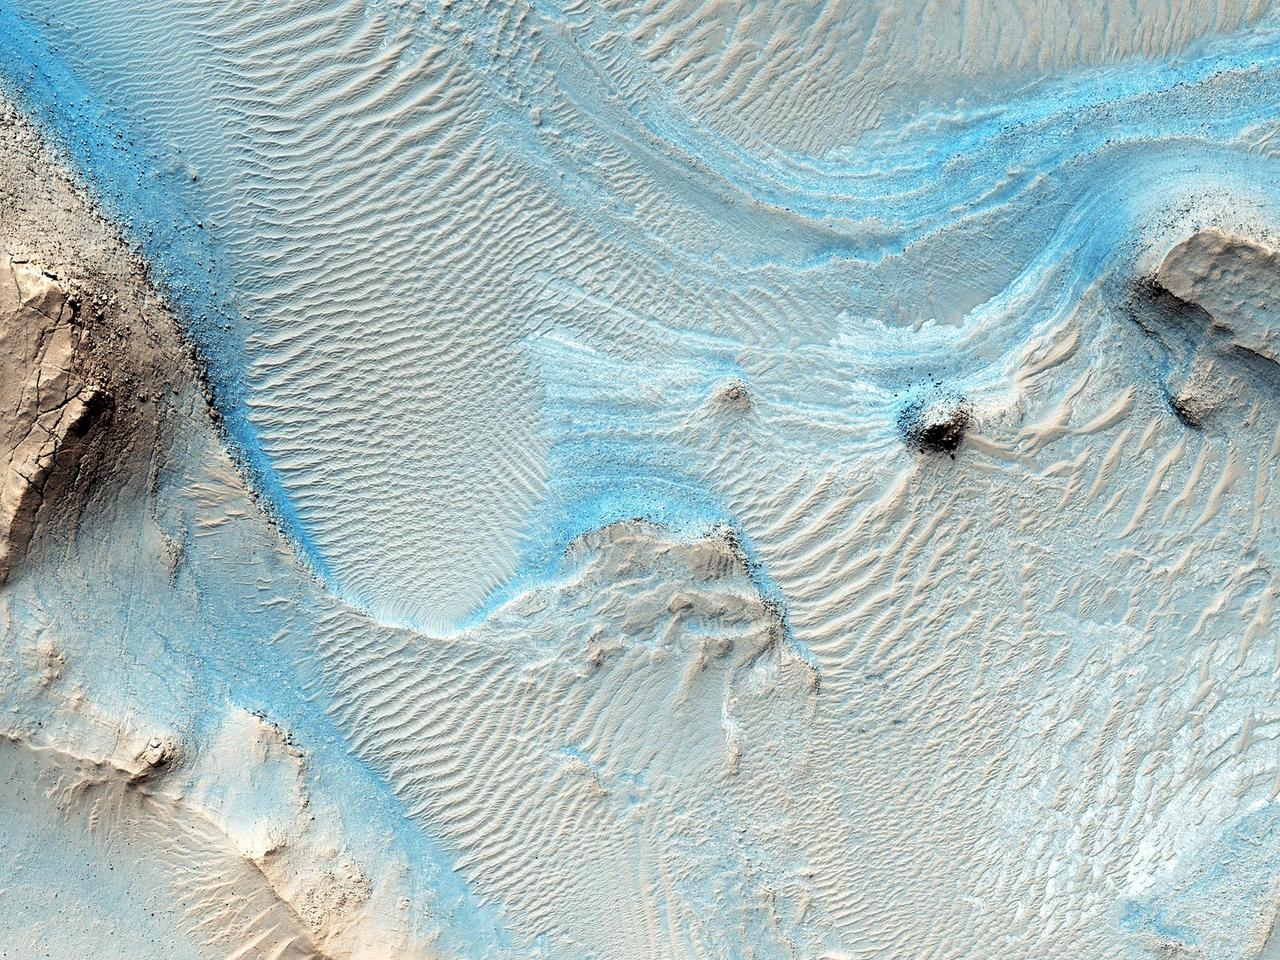
Nothing gets a geologist more excited than layered bedrock, except perhaps finding a fossil or holding a meteorite in your hand. All of these things create a profound feeling of history, the sense of a story that took place ages ago, long before we came appeared. Layered bedrock in particular tells a story that was set out chapter by chapter as each new layer was deposited on top of older, previously deposited layers. Here in Nili Fossae, we see layered bedrock as horizontal striations in the light toned sediments in the floor of a canyon near Syrtis Major. (Note: illumination is from the top of the picture) The ancient layered rocks appear in pale whitish and bluish tones. They are partially covered by much younger ripples made up of dust and other wind blown sediments. The rock of the nearby canyon wall is severely fractured and appears to have shed sand and rocks and boulders onto the floor. This canyon did not form by fluvial erosion: it is part of a system of faults that formed a series of graben like this one, but water probably flowed through Nili Fossae in the distant past. Orbital spectral measurements by the OMEGA instrument on Mars Express and CRISM on MRO detected an abundance of clay minerals of different types in the layered sediments inside Nili Fossae, along with other minerals that are typical of sediments that were deposited by water. The various colors and tones of the layered rocks record changes in the composition of the sediments, details that can tell us about changes in the Martian environment eons ago. Nili Fossae is a candidate site for a future landed robotic mission that could traverse across these layers and make measurements that could be used to unravel a part of the early history of Mars. Nili Fossae is a history book that is waiting to be read. http://photojournal.jpl.nasa.gov/catalog/PIA21206

JOHNSON SPACE CENTER, Houston - STS129-S-001 -- For STS-129 the sun shines brightly on the International Space Station (ISS) above and the United States below representing the bright future of U.S. human spaceflight. The contiguous U.S., Rocky Mountains, and Great Desert Southwest are clearly visible on the earth below encompassing all the NASA centers and the homes of the many dedicated people that work to make our Space Program possible. The integrated shapes of the patch signifying the two Express Logistics Carriers that will be delivered by STS-129 providing valuable equipment ensuring the longevity of the ISS. The Space Shuttle is vividly silhouetted by the sun highlighting how brightly the Orbiters have performed as a workhorse for the U.S. Space Program over the past 3 decades. The Space Shuttle ascends on the Astronaut symbol portrayed by the Red, White and Blue swoosh bounded by the gold halo. This symbol is worn with pride by this U.S. crew representing their country on STS-129. The names of the crew members are denoted on the outer band of the patch. As STS-129 launches, the Space Shuttle is in its twilight years. This fact is juxtaposed by the 13 stars on the patch which are symbolic of our children who are the future. The Moon and Mars feature predominantly to represent just how close humankind is to reaching further exploration of those heavenly bodies and how the current Space Shuttle and ISS missions are laying the essential ground work for those future endeavors. The NASA insignia for design for Shuttle flights is reserved for use by the astronauts and for other official use as the NASA Administrator may authorize. Public availability has been approved only in the form of illustrations by the various news media. When and if there is any change in this policy which is not anticipated, it will be publicly announced. (Note: the description is provided by the crew members).