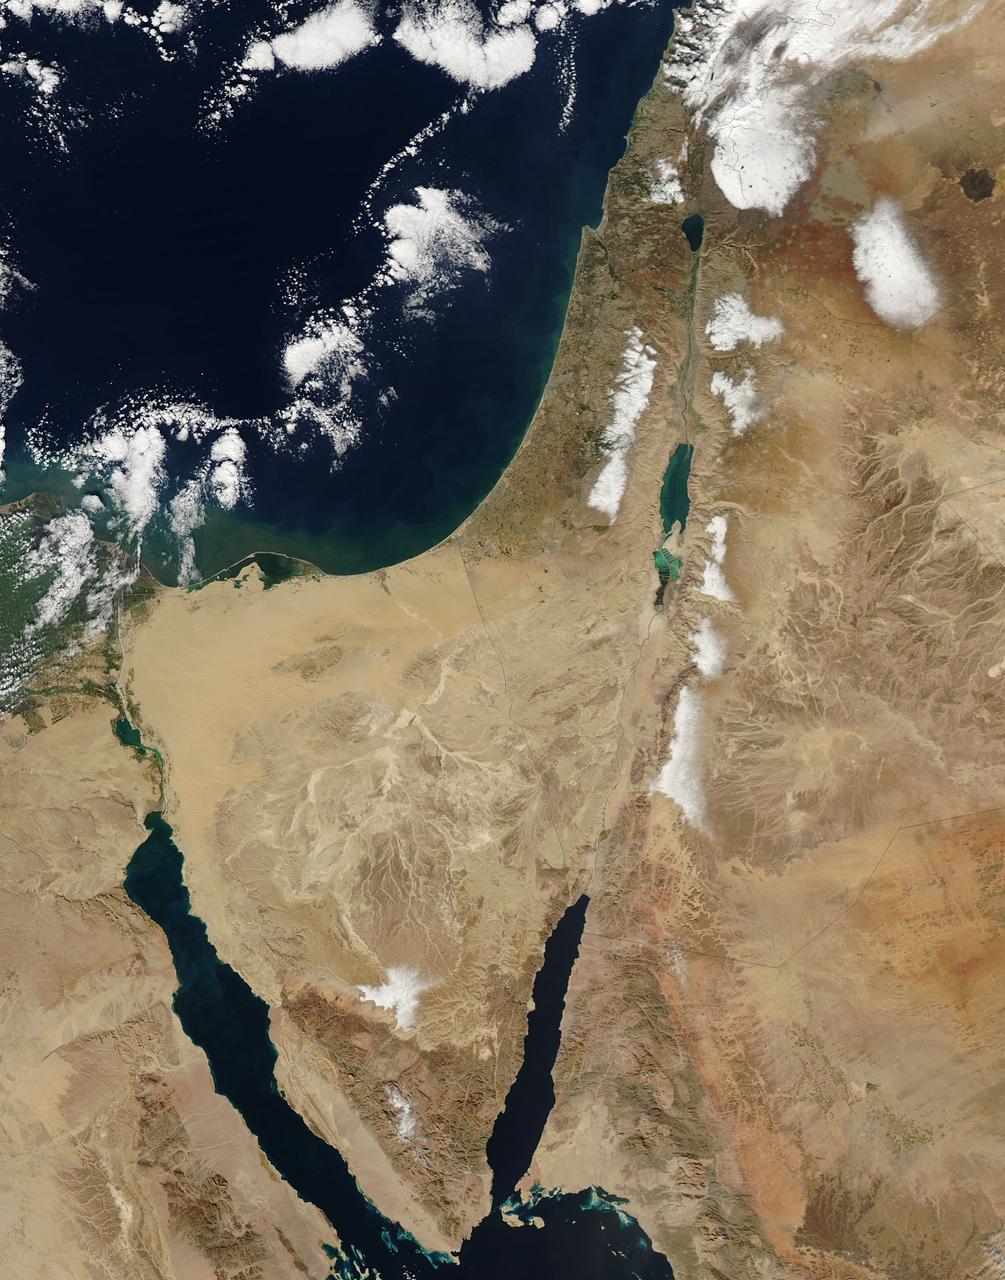
This image from the Aqua satellite's MODIS instrument taken at 11:10 UTC on December 16, 2013 shows areas of snow in Syria, Jordan, Israel and the Palestinian Territory. Snow storms in the Middle East are not frequent but not uncommon either. However, this one was unusually early in the winter and more intense than normal. The storm paralyzed Jerusalem with 30 to 50 centimeters (12 to 20 inches) of snow, knocking out power for roughly 15,000 households. The snow closed mountain roads leading into the city, effectively cutting Jerusalem off. Amman, Jordan, received about 45 cm (18 inches) of snow, and Lebanon and Syria also were unusually cold and snowy. Lower elevations near the coast received torrential rain during the storm, resulting in flooding. Some 40,000 people were forced to evacuate flooded areas in Gaza, according to the Associated Press. The floods are not visible at this scale, but tan and green plumes of sediment are visible along the Mediterranean Sea coast. Such plumes can be caused by floods and run off, though stormy, turbid waters may also bring sediment to the surface. <b><a href="http://www.nasa.gov/audience/formedia/features/MP_Photo_Guidelines.html" rel="nofollow">NASA image use policy.</a></b> <b><a href="http://www.nasa.gov/centers/goddard/home/index.html" rel="nofollow">NASA Goddard Space Flight Center</a></b> enables NASA’s mission through four scientific endeavors: Earth Science, Heliophysics, Solar System Exploration, and Astrophysics. Goddard plays a leading role in NASA’s accomplishments by contributing compelling scientific knowledge to advance the Agency’s mission. <b>Follow us on <a href="http://twitter.com/NASA_GoddardPix" rel="nofollow">Twitter</a></b> <b>Like us on <a href="http://www.facebook.com/pages/Greenbelt-MD/NASA-Goddard/395013845897?ref=tsd" rel="nofollow">Facebook</a></b> <b>Find us on <a href="http://instagram.com/nasagoddard?vm=grid" rel="nofollow">Instagram</a></b>

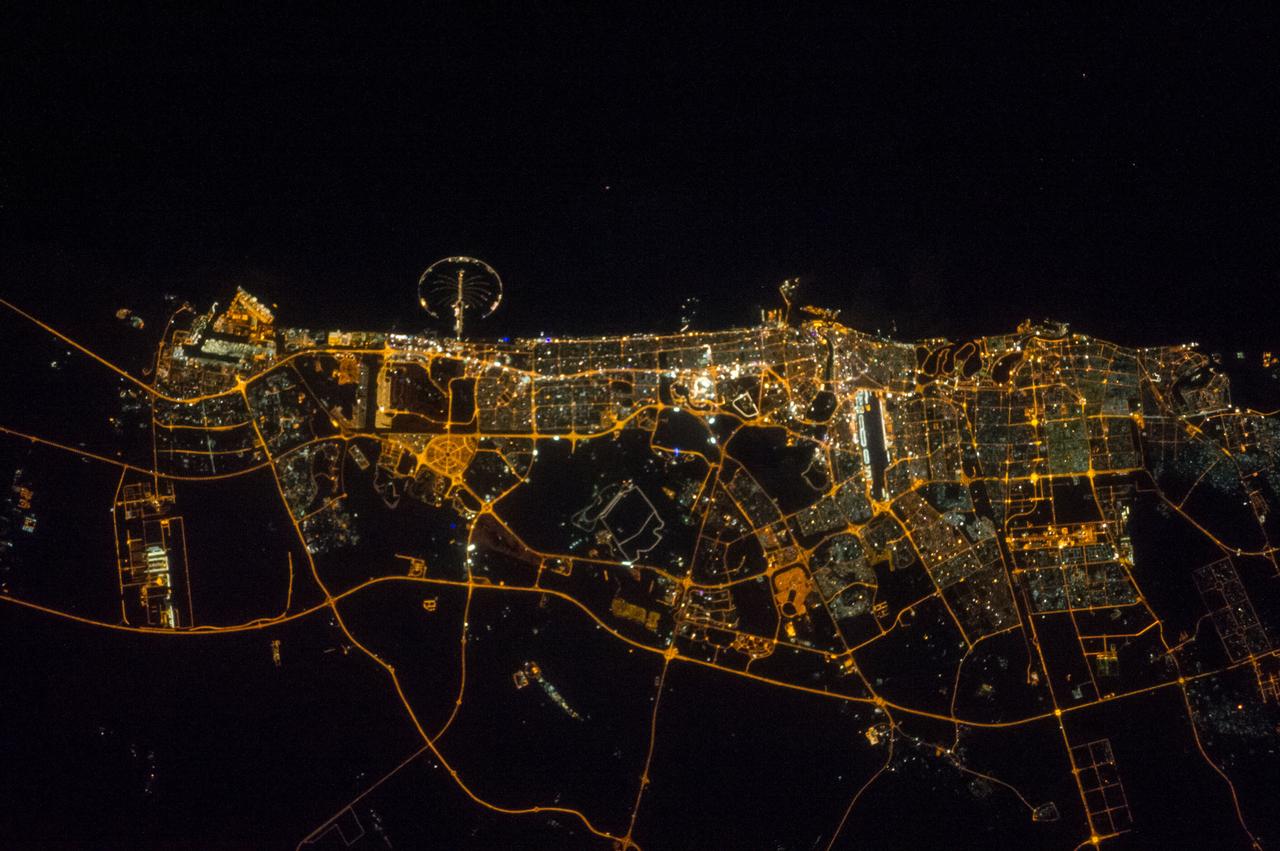
Abu Dhabi, the capital of the United Arab Emirates on the Persian Gulf coast, is pictured from the International Space Station as it soared 257 miles above the Middle East.

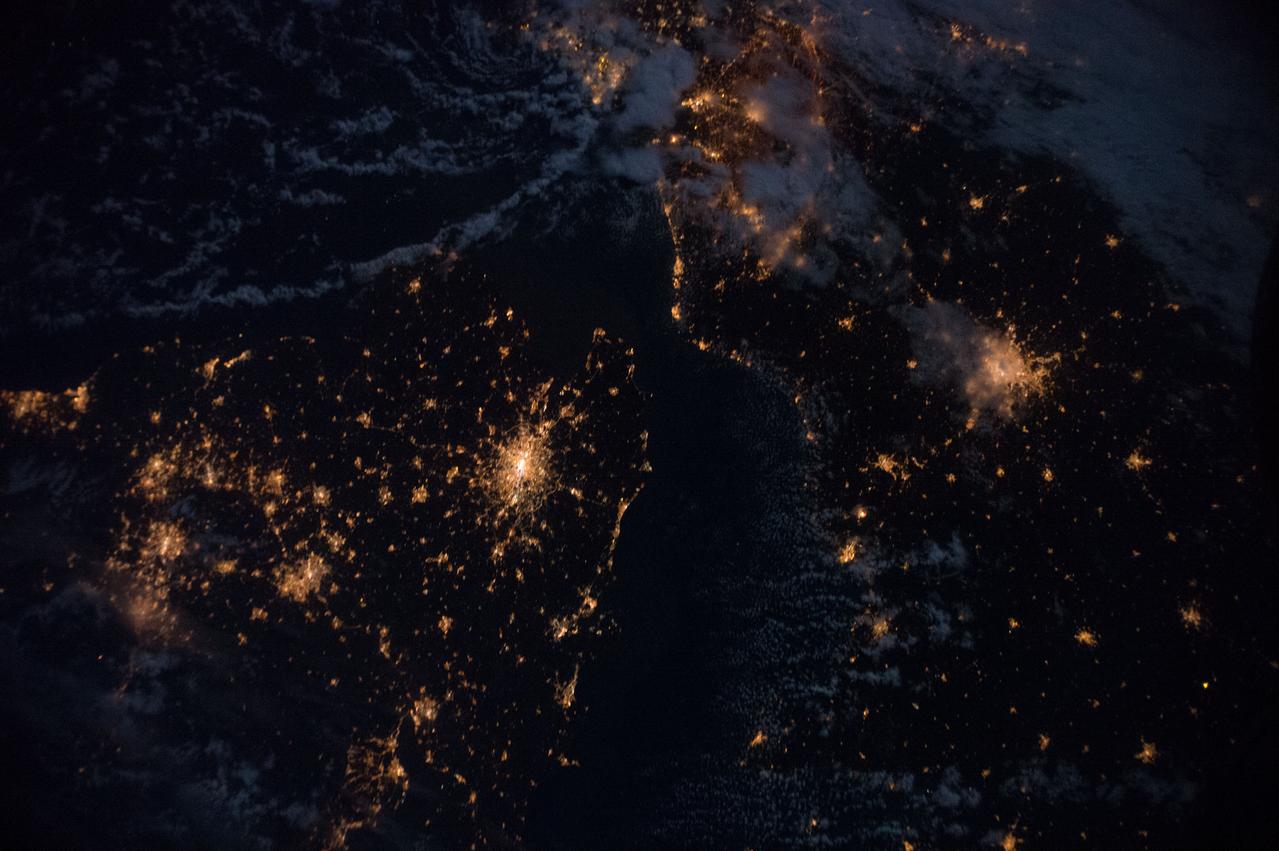
NASA image acquired April 18 - October 23, 2012 This new image of Europe, Africa, and the Middle East at night is a composite assembled from data acquired by the Suomi NPP satellite in April and October 2012. The new data was mapped over existing Blue Marble imagery of Earth to provide a realistic view of the planet. The nighttime view was made possible by the new satellite’s “day-night band” of the Visible Infrared Imaging Radiometer Suite. VIIRS detects light in a range of wavelengths from green to near-infrared and uses filtering techniques to observe dim signals such as gas flares, auroras, wildfires, city lights, and reflected moonlight. In this case, auroras, fires, and other stray light have been removed to emphasize the city lights. “Night time imagery provides an intuitively graspable view of our planet,” says William Stefanov, senior remote sensing scientist for the International Space Station program office. “They provide a fairly straightforward means to map urban versus rural areas, and to show where the major population centers are and where they are not.” Named for satellite meteorology pioneer Verner Suomi, NPP flies over any given point on Earth's surface twice each day at roughly 1:30 a.m. and p.m. The polar-orbiting satellite flies 824 kilometers (512 miles) above the surface, sending its data once per orbit to a ground station in Svalbard, Norway, and continuously to local direct broadcast users distributed around the world. The mission is managed by NASA with operational support from NOAA and its Joint Polar Satellite System, which manages the satellite's ground system. NASA Earth Observatory image by Robert Simmon, using Suomi NPP VIIRS data provided courtesy of Chris Elvidge (NOAA National Geophysical Data Center). Suomi NPP is the result of a partnership between NASA, NOAA, and the Department of Defense. Caption by Mike Carlowicz. Instrument: Suomi NPP - VIIRS Credit: <b><a href="http://www.earthobservatory.nasa.gov/" rel="nofollow"> NASA Earth Observatory</a></b> <b>Click here to view all of the <a href="http://earthobservatory.nasa.gov/Features/NightLights/" rel="nofollow"> Earth at Night 2012 images </a></b> <b>Click here to <a href="http://earthobservatory.nasa.gov/NaturalHazards/view.php?id=79793" rel="nofollow"> read more </a> about this image </b> <b><a href="http://www.nasa.gov/audience/formedia/features/MP_Photo_Guidelines.html" rel="nofollow">NASA image use policy.</a></b> <b><a href="http://www.nasa.gov/centers/goddard/home/index.html" rel="nofollow">NASA Goddard Space Flight Center</a></b> enables NASA’s mission through four scientific endeavors: Earth Science, Heliophysics, Solar System Exploration, and Astrophysics. Goddard plays a leading role in NASA’s accomplishments by contributing compelling scientific knowledge to advance the Agency’s mission. <b>Follow us on <a href="http://twitter.com/NASA_GoddardPix" rel="nofollow">Twitter</a></b> <b>Like us on <a href="http://www.facebook.com/pages/Greenbelt-MD/NASA-Goddard/395013845897?ref=tsd" rel="nofollow">Facebook</a></b> <b>Find us on <a href="http://instagram.com/nasagoddard?vm=grid" rel="nofollow">Instagram</a></b>
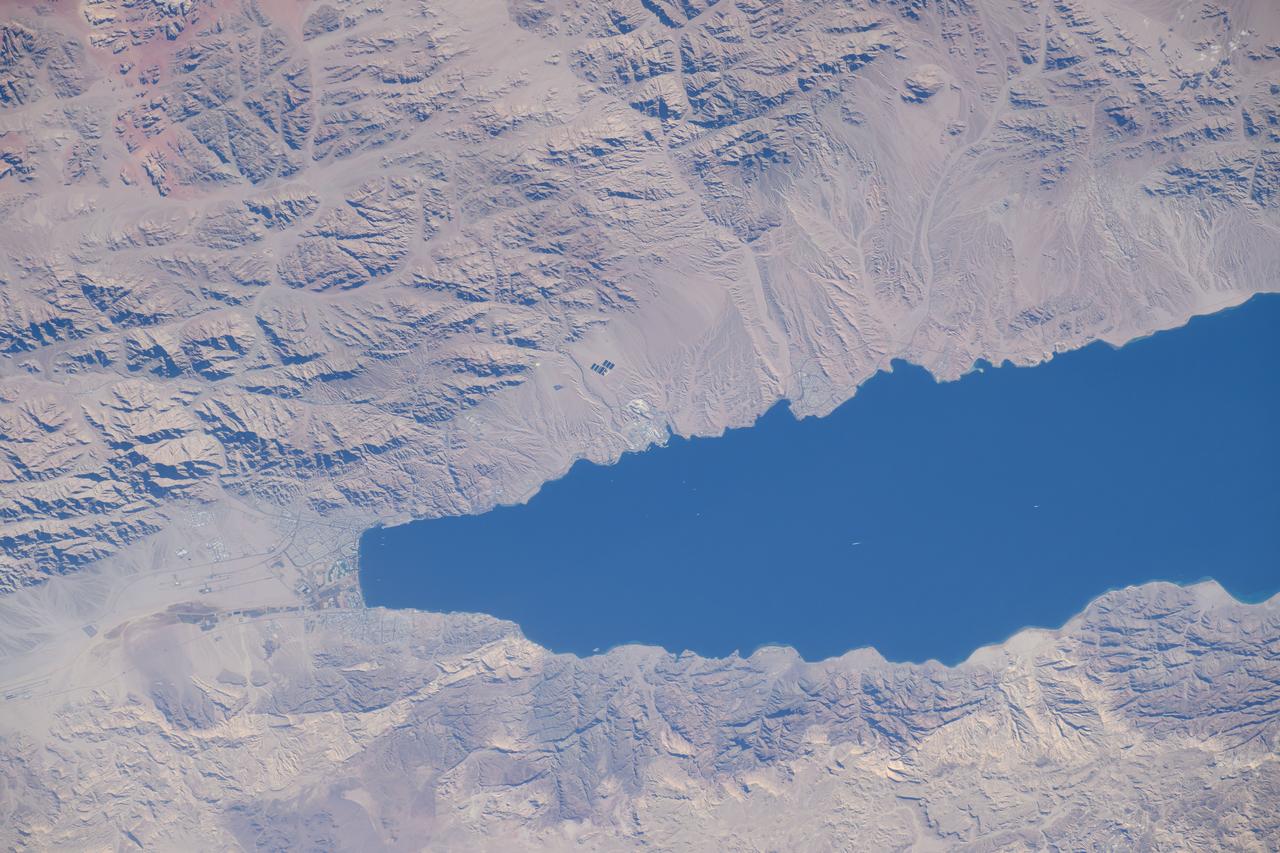
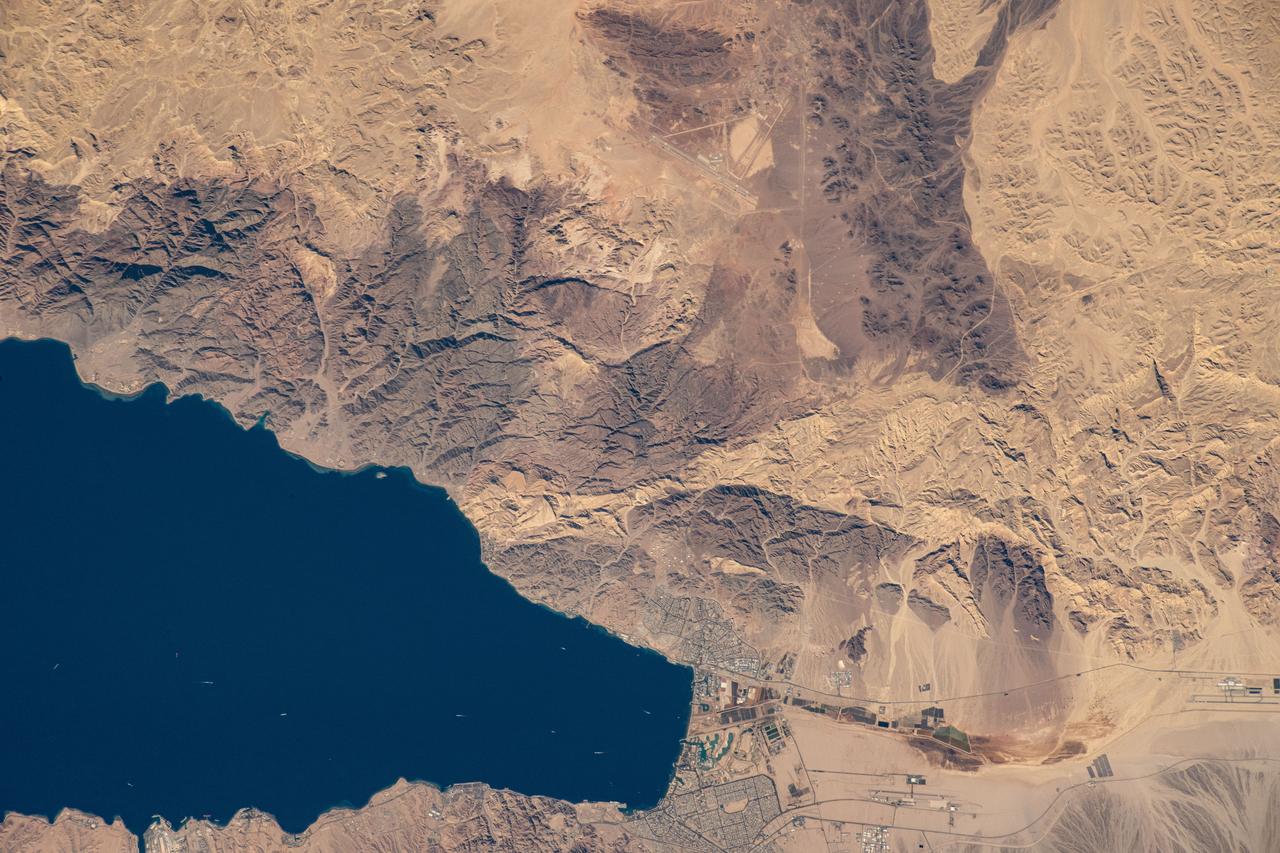
iss072e404443 (Dec. 26, 2024) --- The northern tip of the Gulf of Aqaba is surrounded by the borders of four Middle East nations, including Egypt, Israel, Jordan, and Saudi Arabia, in this photograph from the International Space Station as it orbited 261 miles above.
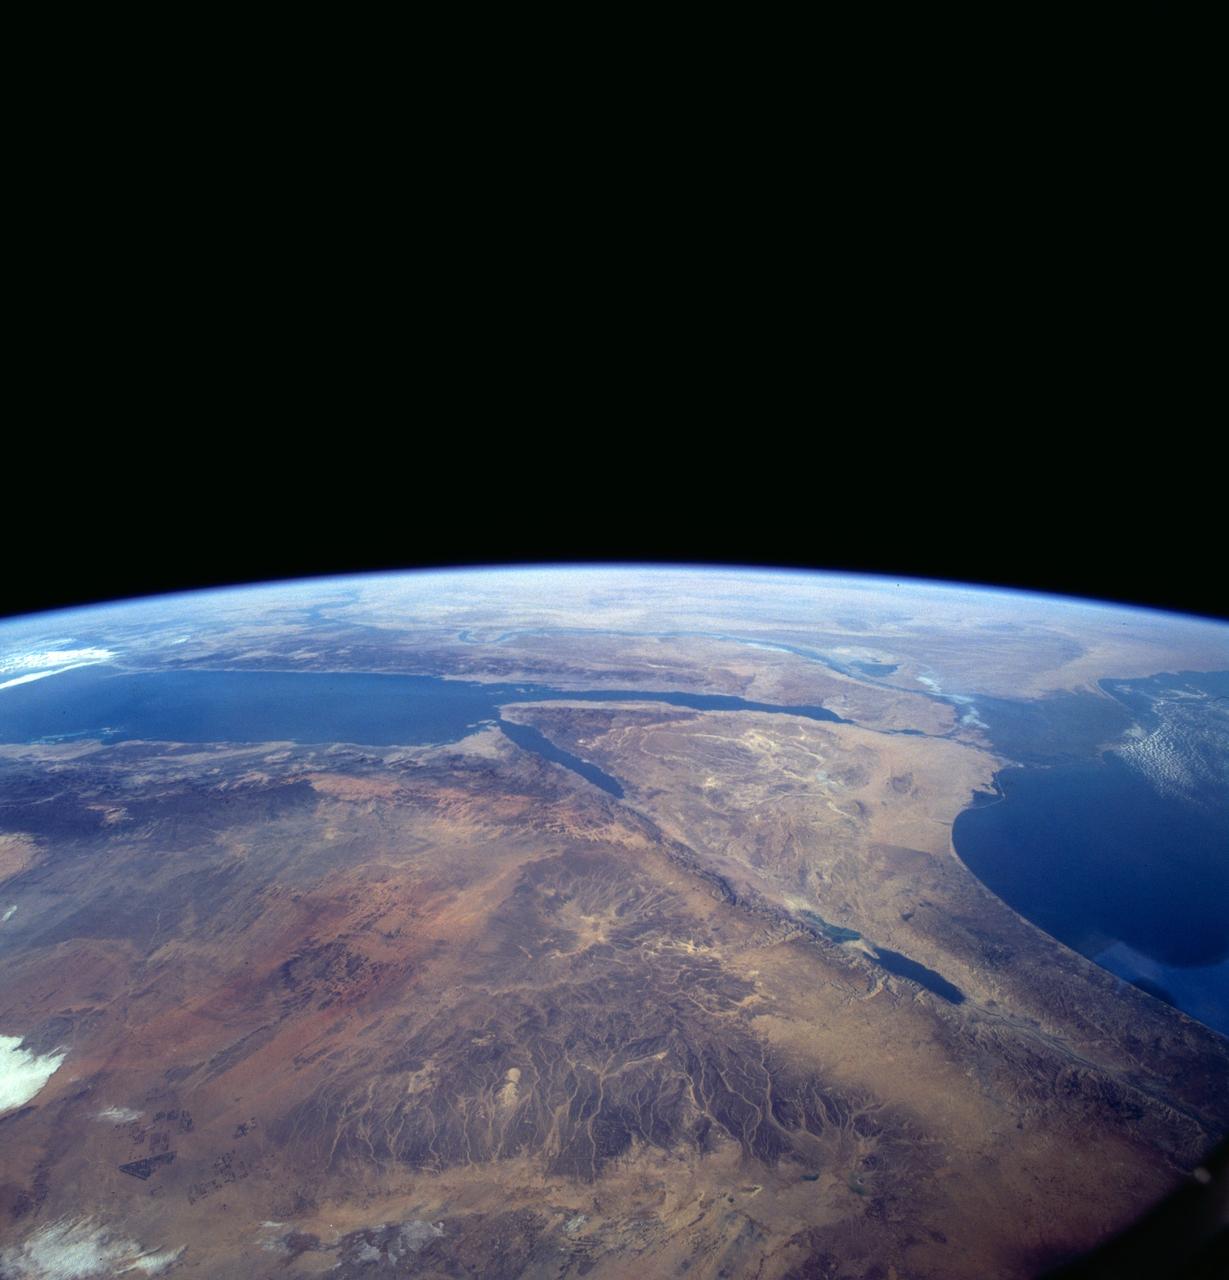
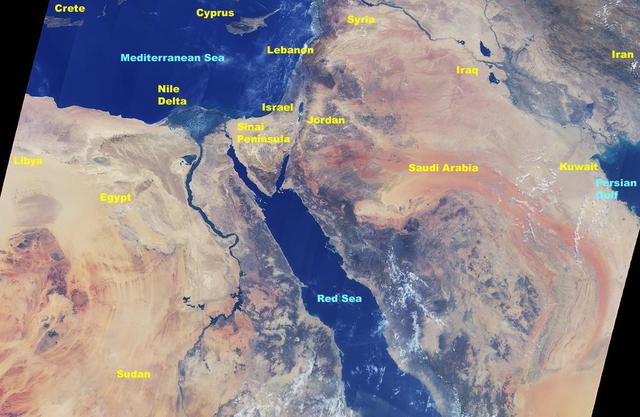
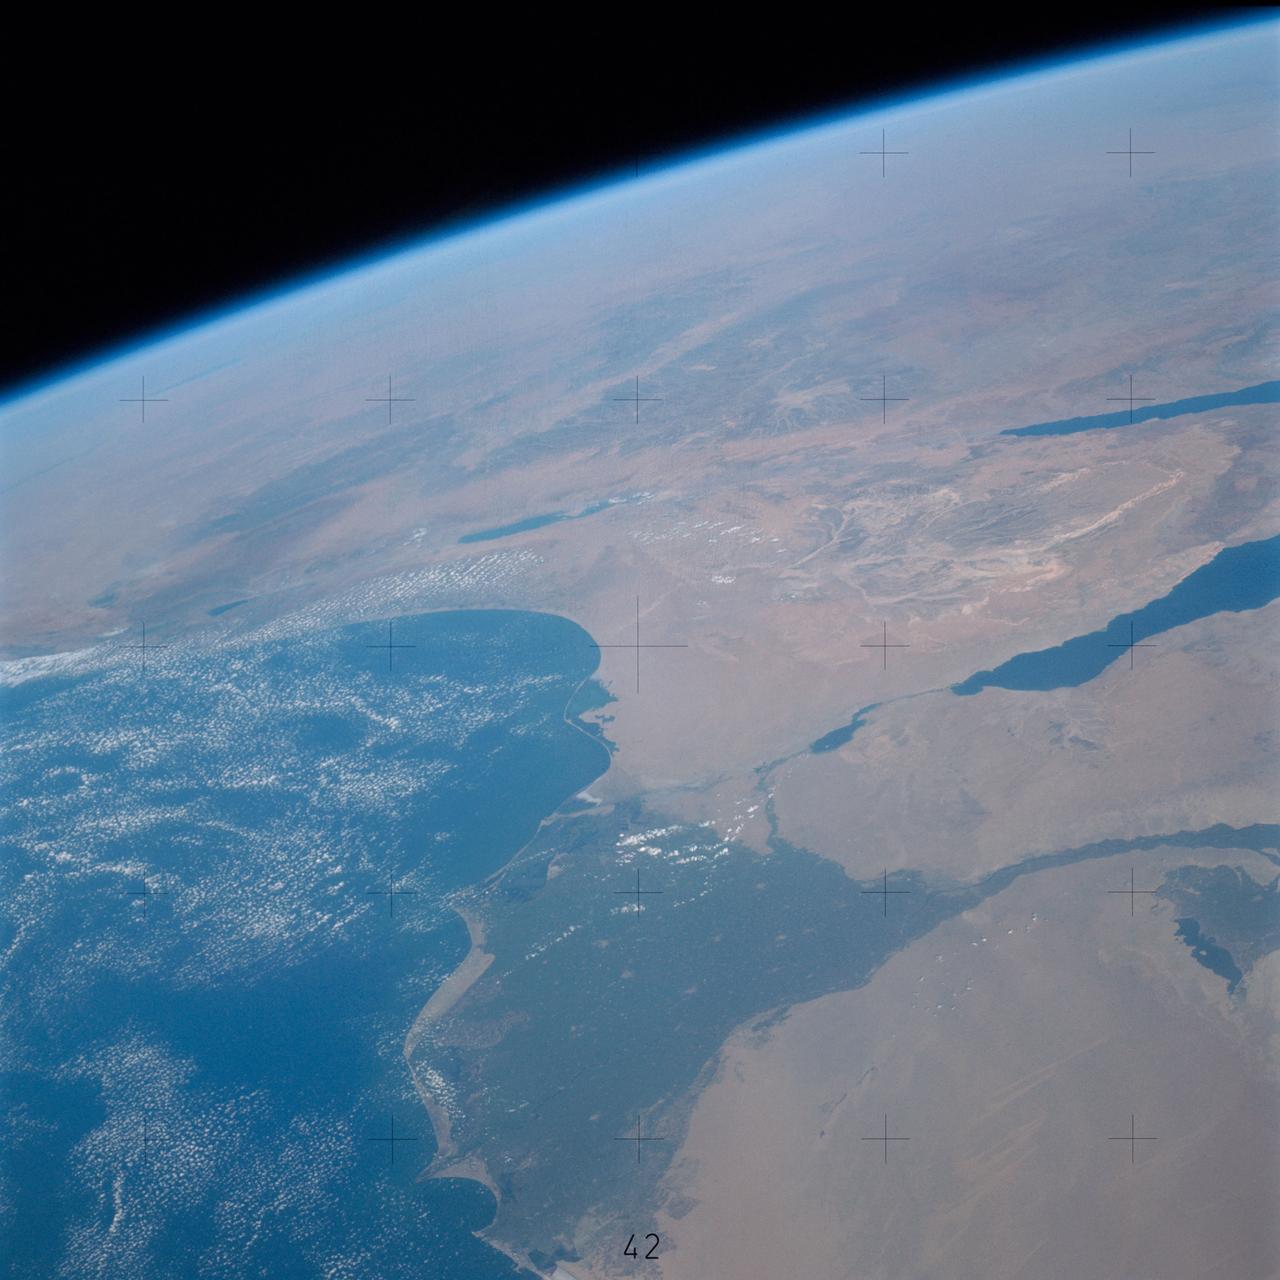
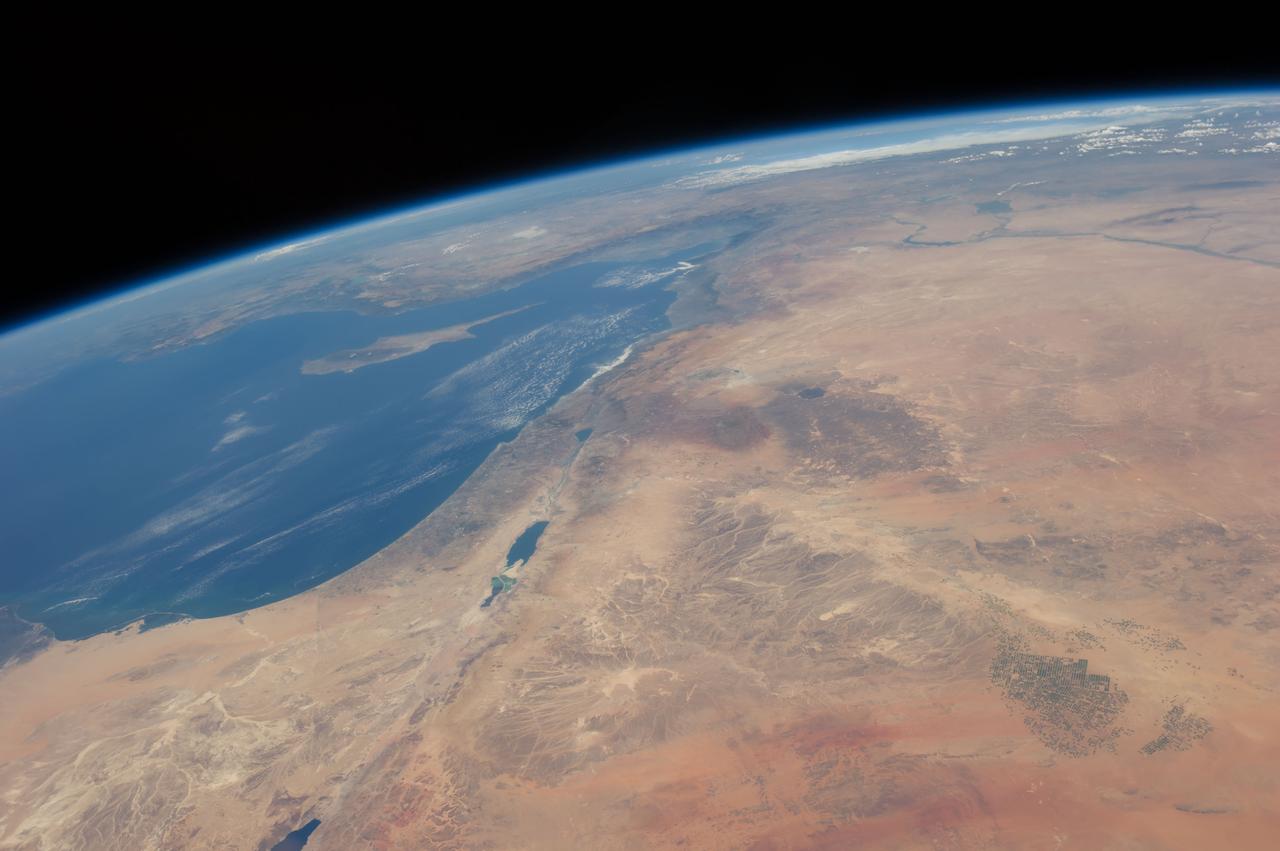
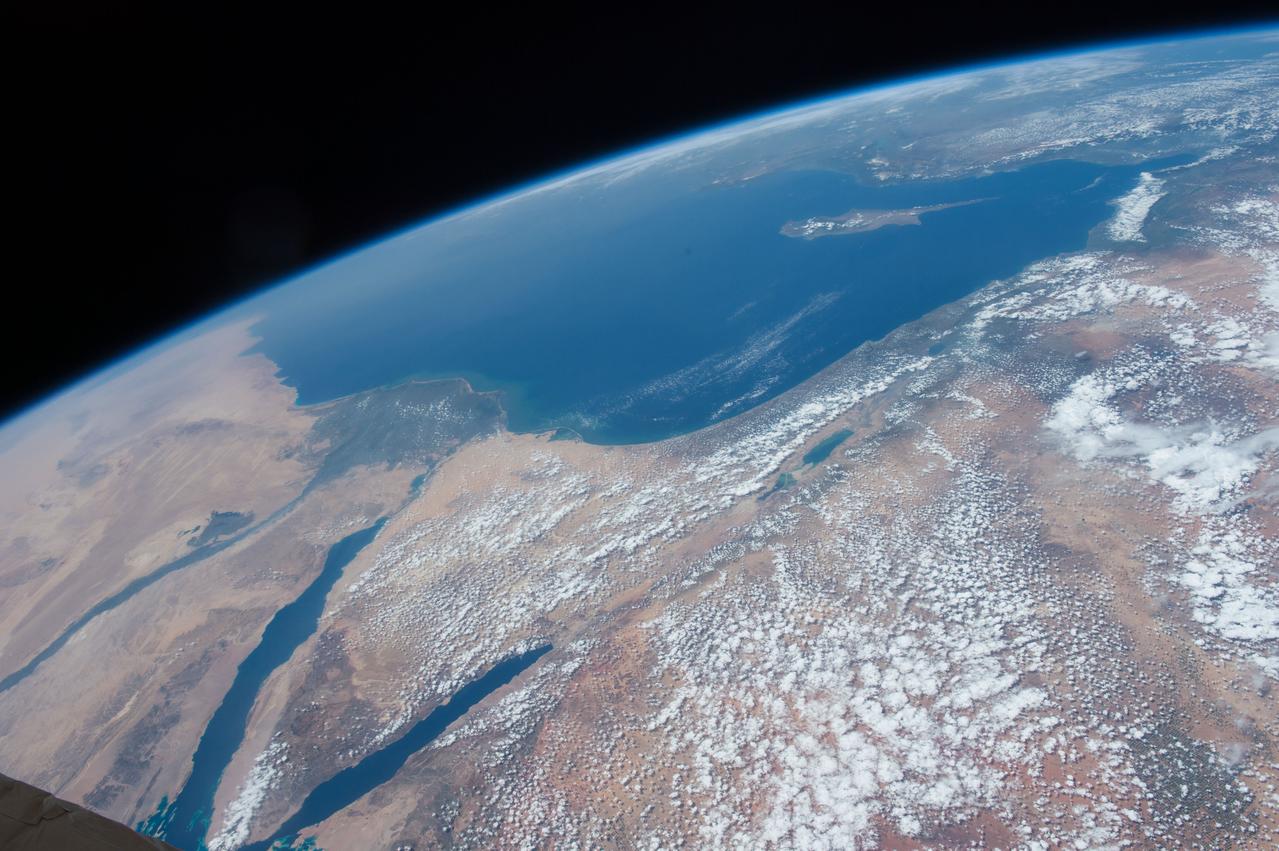
A high oblique view of the Middle East centered at approximately 28.0 degrees north and 34.0 degrees east. Portions of the countries of Egypt, Israel, Jordan and Saudi Arabia are visible. The Dead Sea Rift Valley continuing into the Gulf of Aqaba marks the boundary between Israel and Jordan. The vegetation change in the Sinai Peninsula is the border between the Gaza Strip and Egypt. In Egypt, the Suez Canal connects the Gulf of Suez with the Mediterranean Sea and forms the western boundary of the Sinai Peninsula. The green ribbon of the Nile River is in marked contrast to this arid region. Even the Jordan River does not support large scale agriculture.
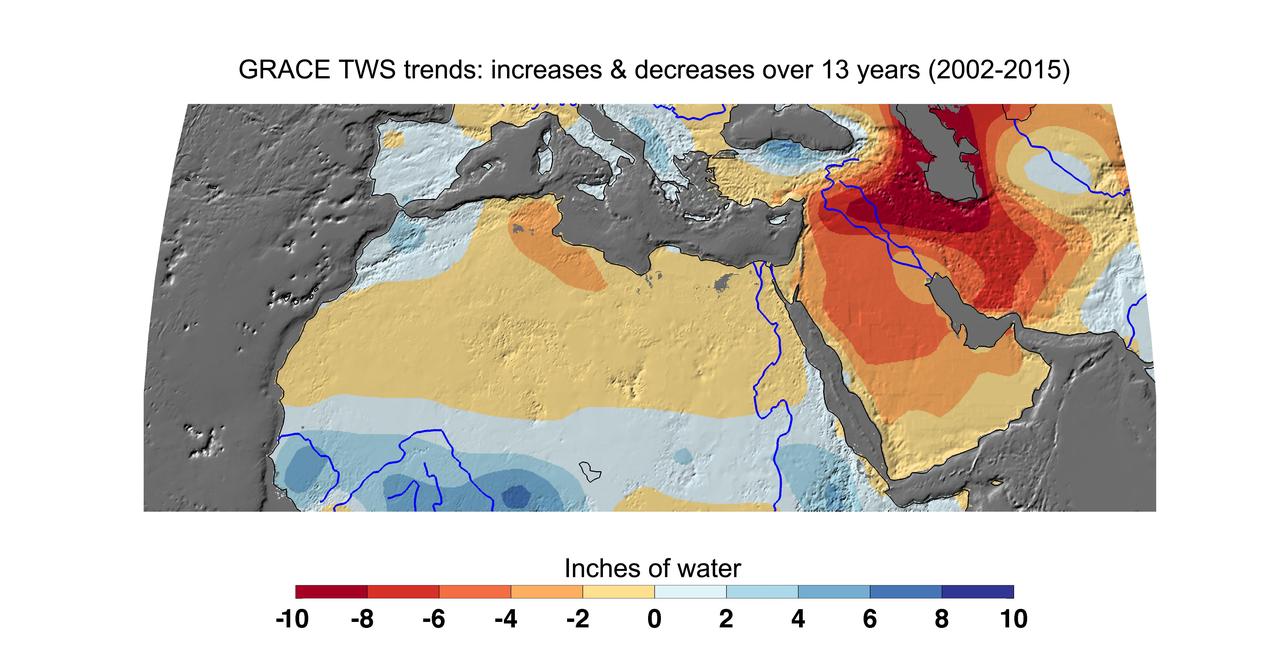
Cumulative total freshwater losses in North Africa and the Middle East from 2002 to 2015 (in inches) observed by NASA's Gravity Recovery and Climate Experiment (GRACE) mission. Total water refers to all of the snow, surface water, soil water and groundwater combined. Groundwater depletion in Turkey, Syria, Iraq and Iran, and along the Arabian Peninsula, are leading to large changes in total water storage in the region. Likewise, drought and groundwater pumping is contributing to the drying of the Caspian Sea Region. The Northwest Sahara Aquifer System, which underlies Tunisia and Libya, is also experiencing increasing water stress as shown in the map. Image updated from Voss et al., 2013. Citation of Record: Voss, K. A., J. S. Famiglietti, M. Lo, C. R. de Linage, M. Rodell and S. C. Swenson, Groundwater depletion in the Middle East from GRACE with Implications for Transboundary Water Management in the Tigris-Euphrates-Western Iran Region, Wat. Resour. Res., 49(2), 904-914, DOI: 10.1002/wrcr.20078. http://photojournal.jpl.nasa.gov/catalog/PIA20207
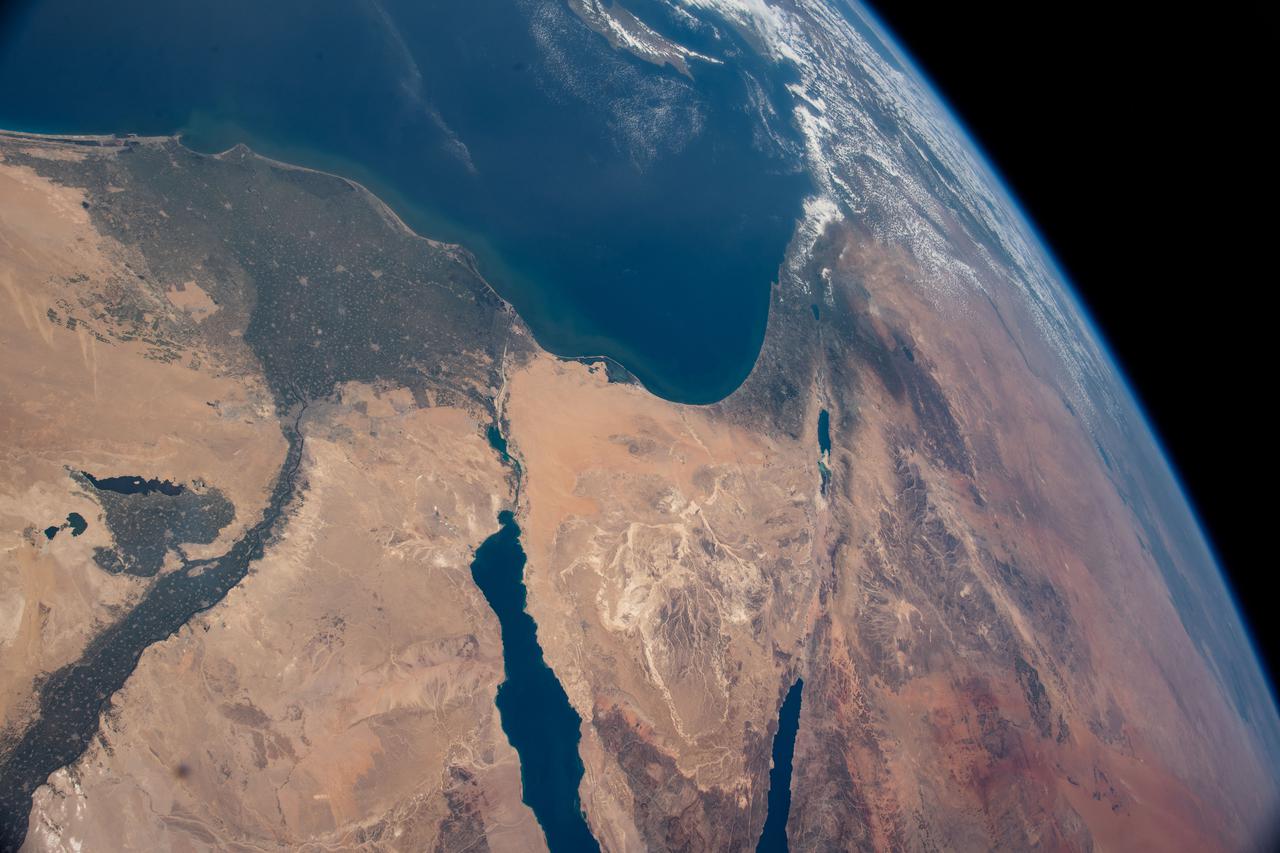
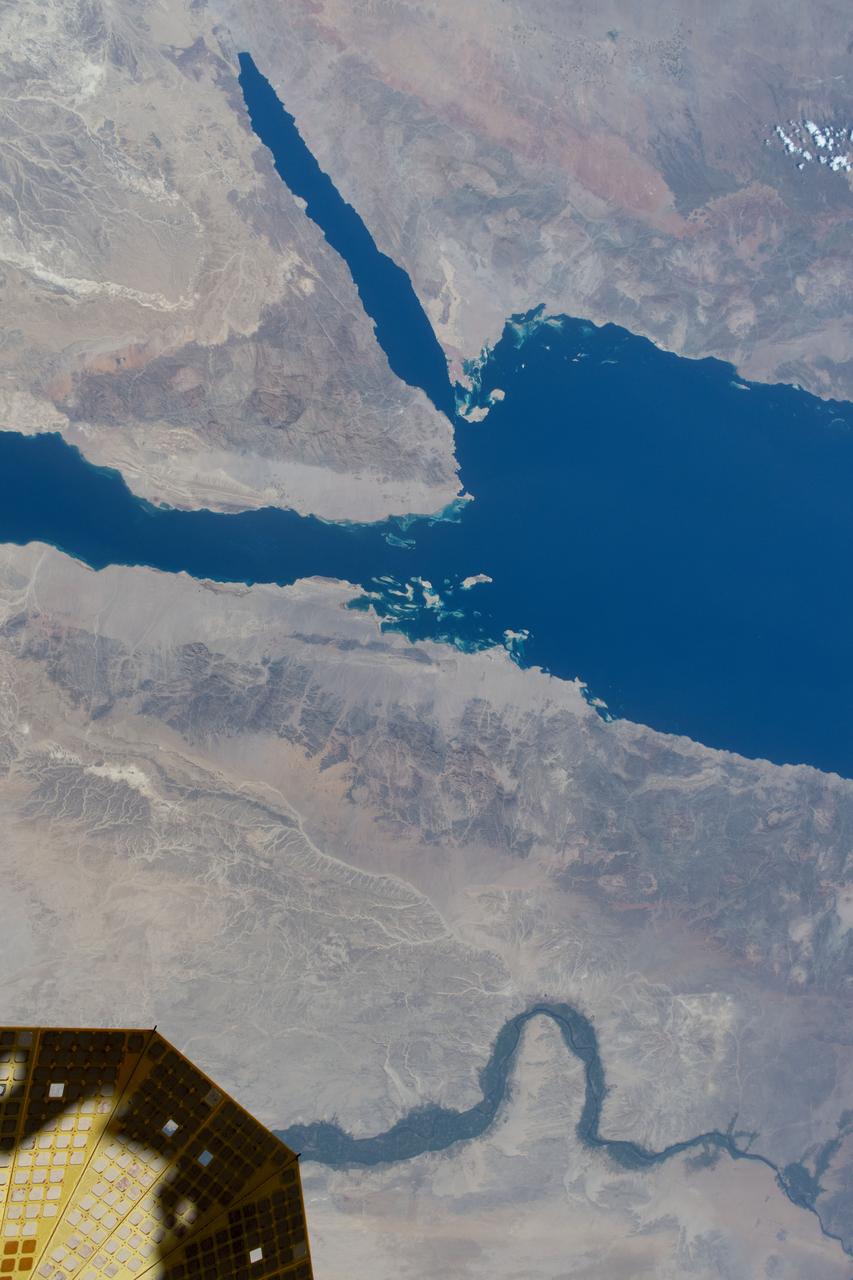
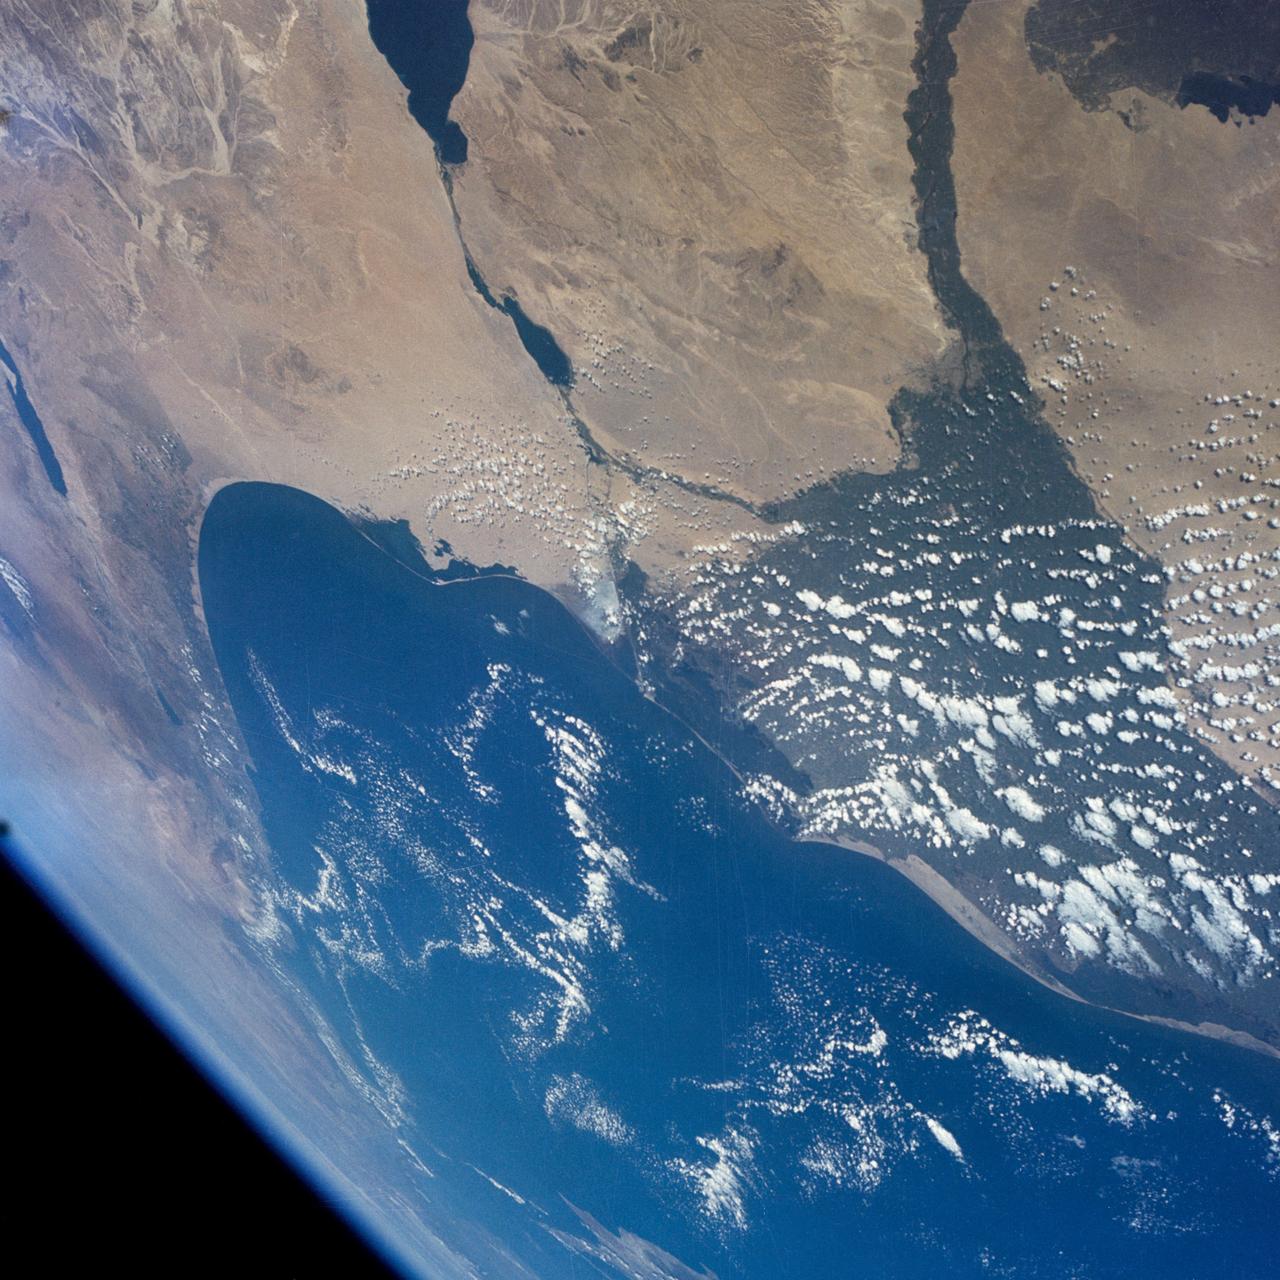
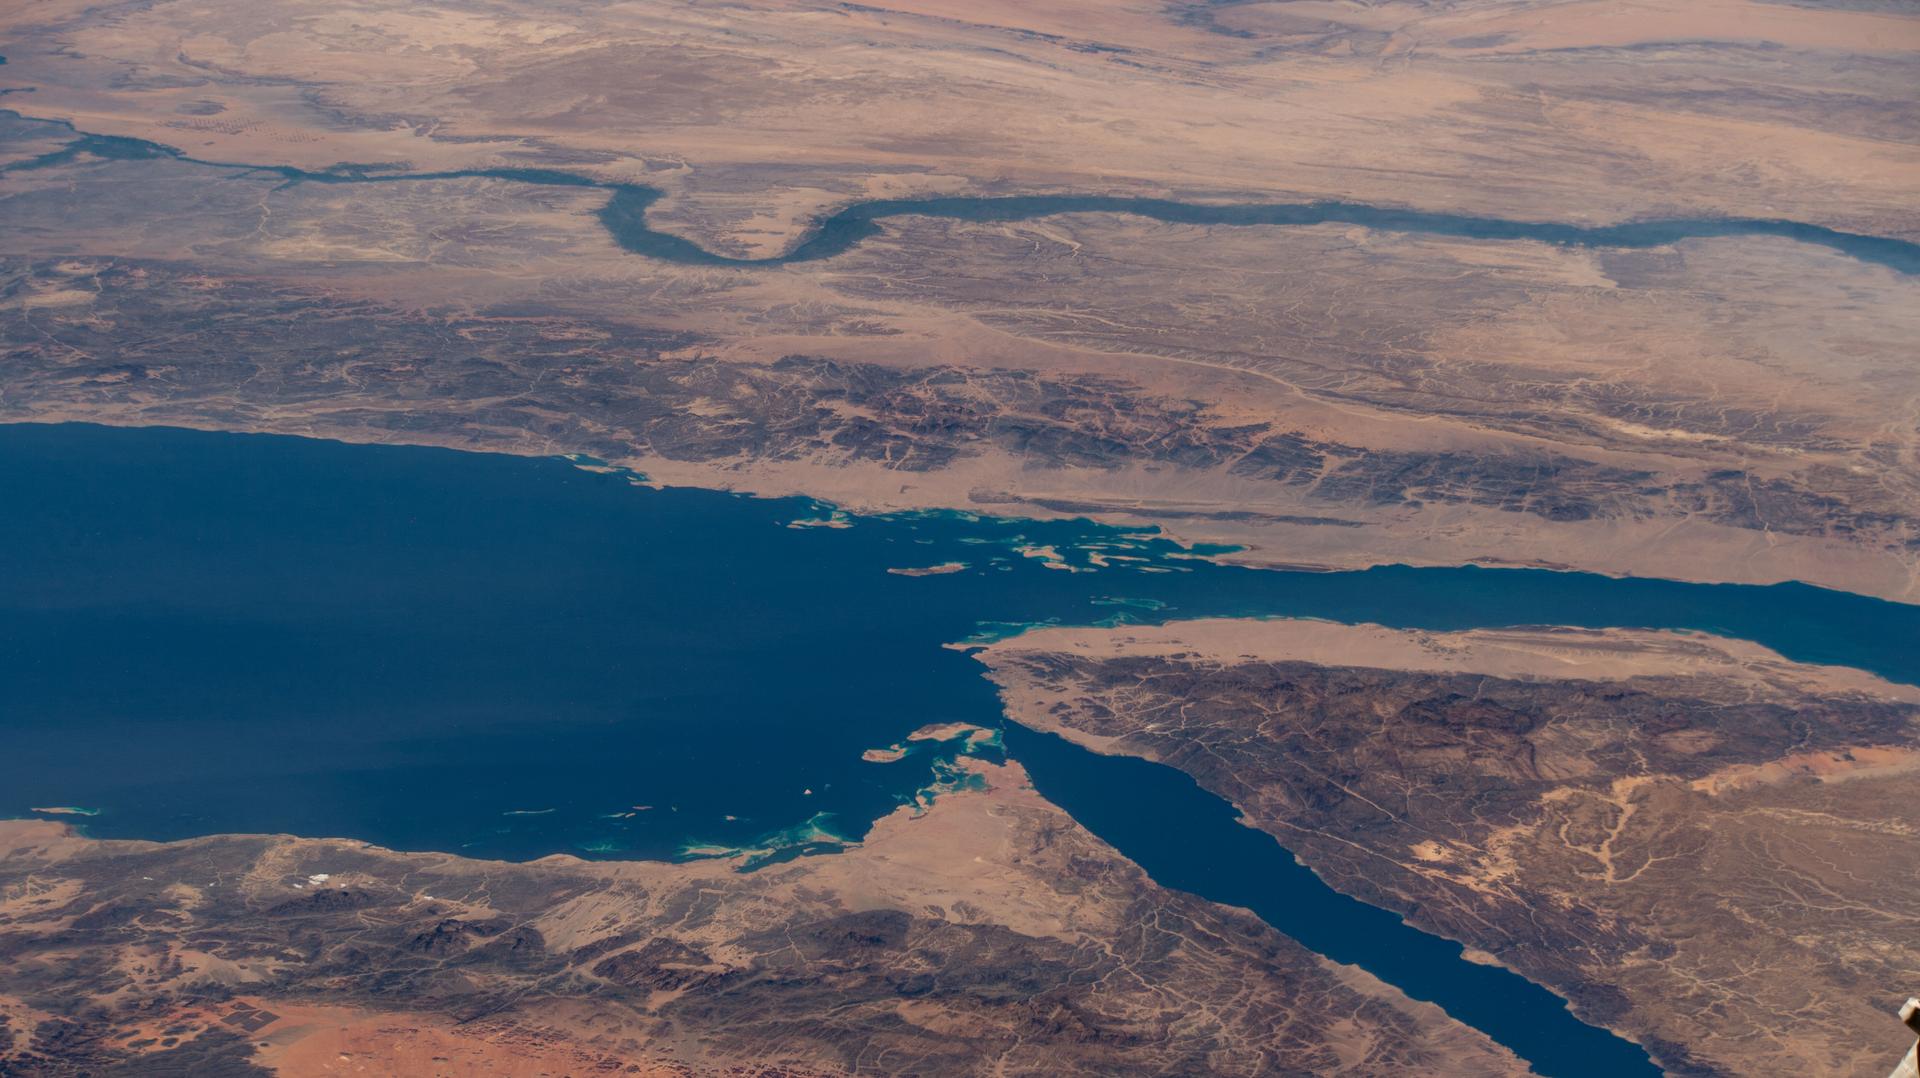
This image from NASA Terra satellite in August, 2000, shows the northern tip of the Red Sea, the Gulf of Suez and the Gulf of Aqaba frame the sandy deserts and spectacular mountains of the Sinai Peninsula.
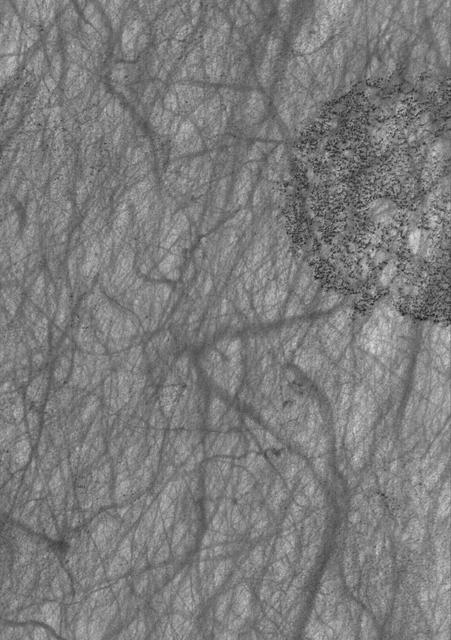
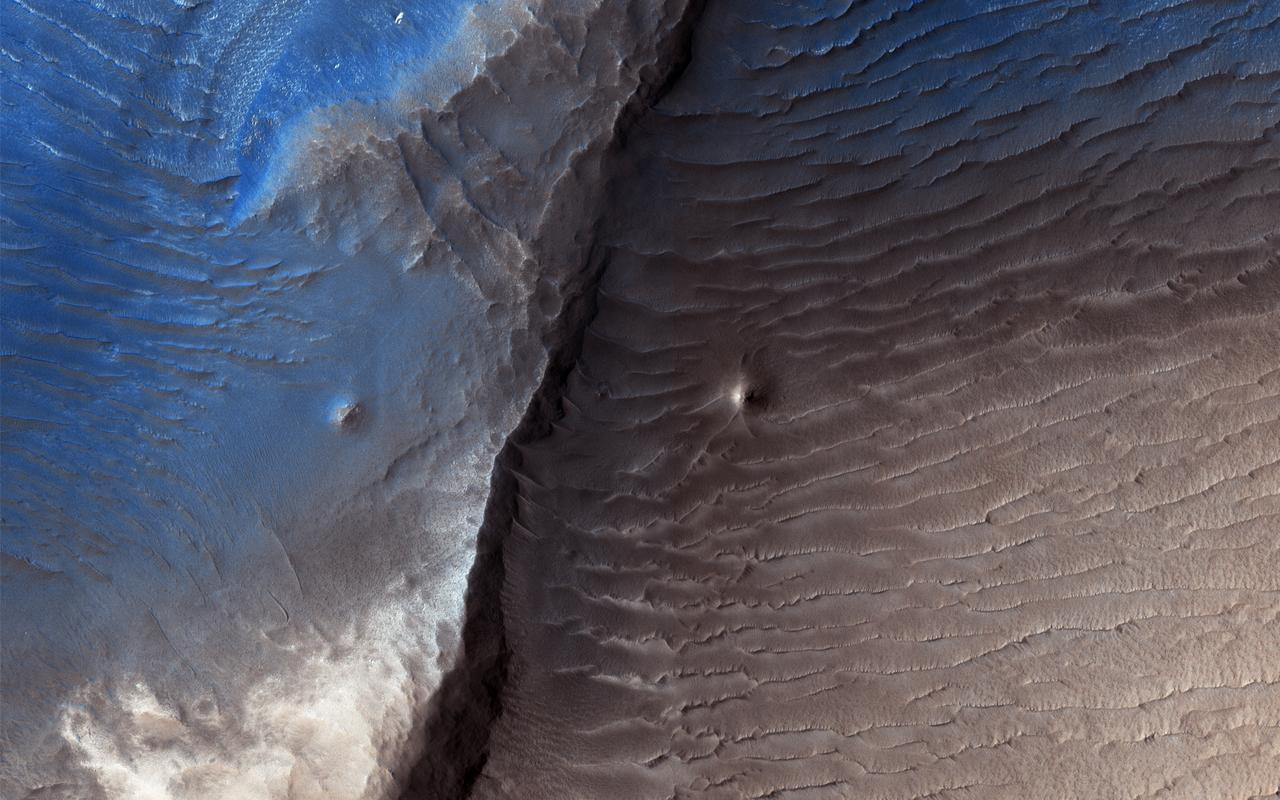
This image shows a variety of textures observed on a south middle-latitude plain east-southeast of Hellas Planitia. Dark streaks left by passing dust devils are practically ubiquitous across the scene

Echus Chasma forms the boundary between the Tharsis volcanoes to the west and Lunae Planum to the east. This region is both tectonically fractured rocks top and volcanic flows middle and bottom. This image is from NASA 2001 Mars Odyssey spacecraft.
image shows a variety of textures observed on a south middle-latitude plain east-southeast of Hellas Planitia. Dark streaks left by passing dust devils are practically ubiquitous across the scene
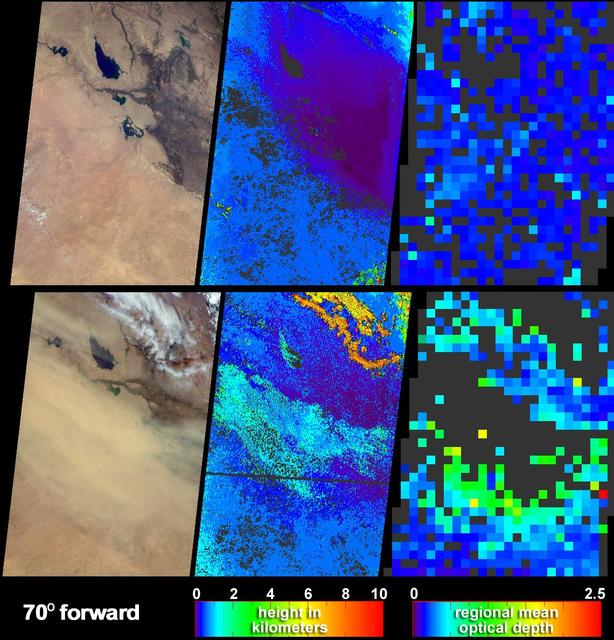
Clear skies on April 11, 2004 top panels contrast strongly with the dust storm that swept across Iraq and Saudi Arabia on May 13 bottom panels as seen by NASA Terra spacecraft.
GMT342_23_09_Terry Virts_aurora london paris middle east night_CB_123
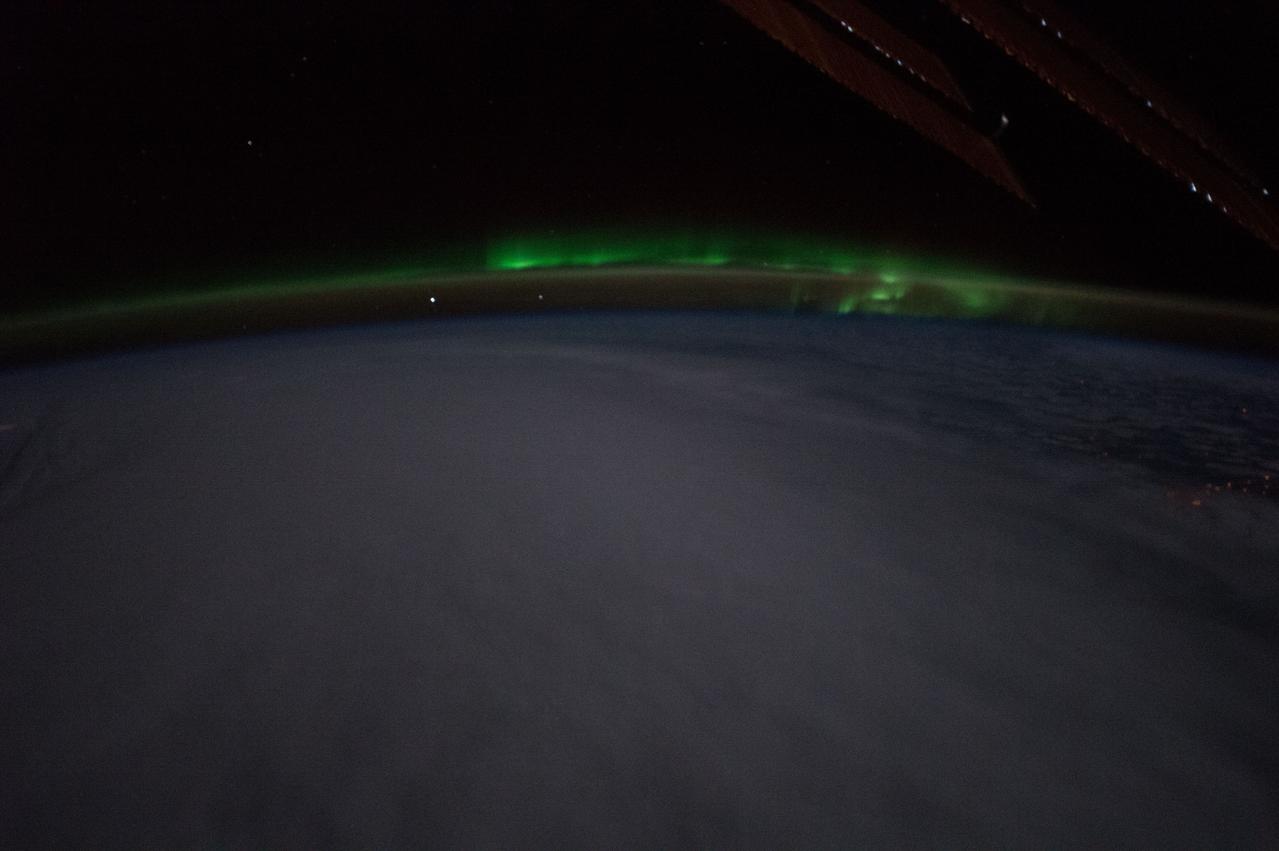
GMT342_23_09_Terry Virts_aurora london paris middle east night_CB_123
GMT342_23_09_Terry Virts_aurora london paris middle east night_CB_123
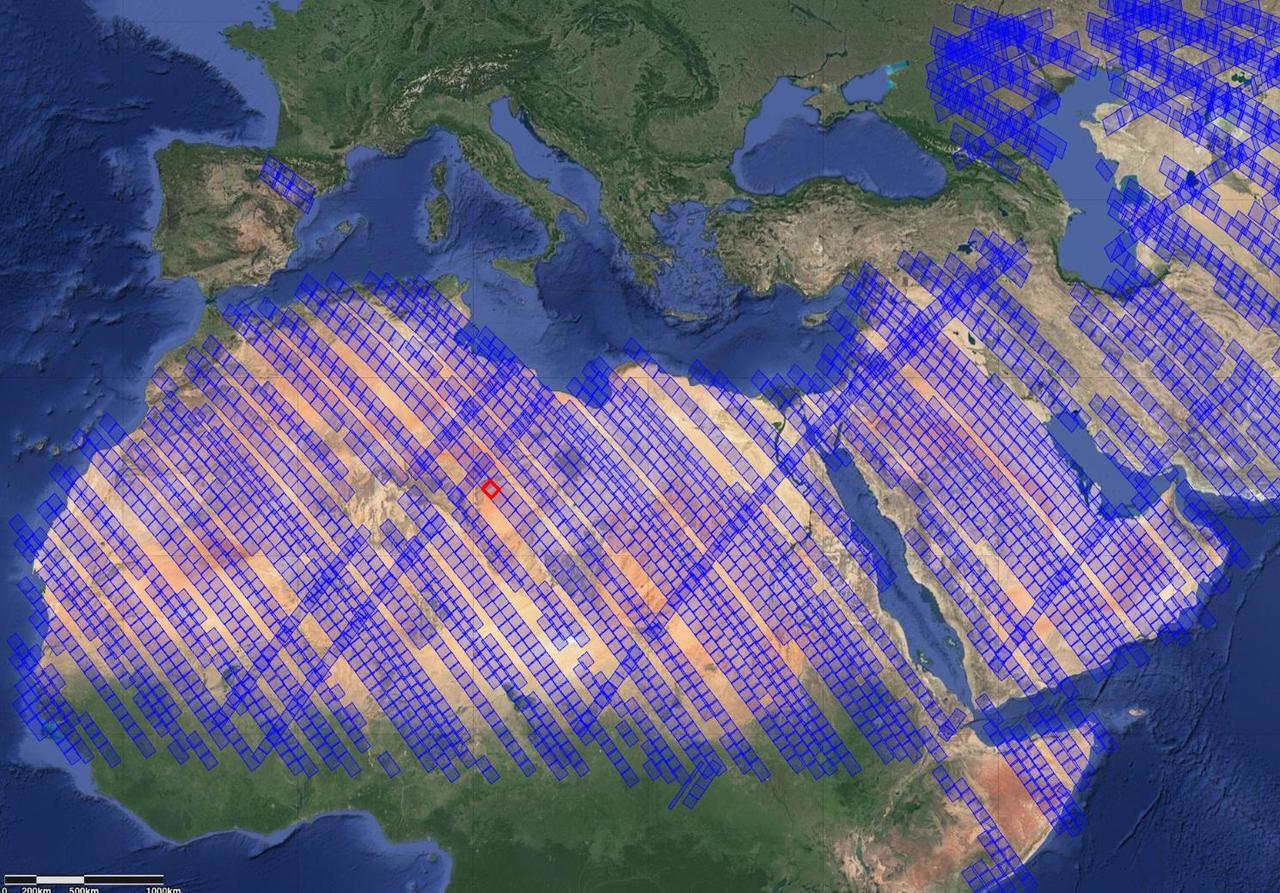
This image shows locations in parts of North Africa, Europe, the Middle East, and Central Asia observed by NASA's Earth Surface Mineral Dust Source Investigation (EMIT). Each blue box is a "scene" the instrument, which is aboard the International Space Station, has captured. The red box indicates where the instrument recently gathered data on three minerals in a location in southwest Libya, in the Sahara Desert. Installed on the space station in July 2022, EMIT orbits Earth about once every 90 minutes to map the world's mineral-dust sources, gathering information about surface composition as the instrument completes about 16 orbits per day. Over the course of its 12-month mission, EMIT will collect measurements of 10 important surface minerals – kaolinite, hematite, goethite, illite, vermiculite, calcite, dolomite, montmorillonite, chlorite, and gypsum – in arid regions between 50-degree south and north latitudes in Africa, Asia, North and South America, and Australia. The data EMIT collects will help scientists better understand the role of airborne dust particles in heating and cooling Earth's atmosphere on global and regional scales. https://photojournal.jpl.nasa.gov/catalog/PIA25429
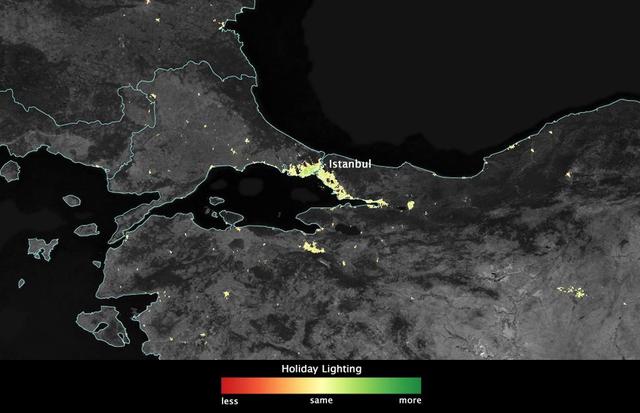
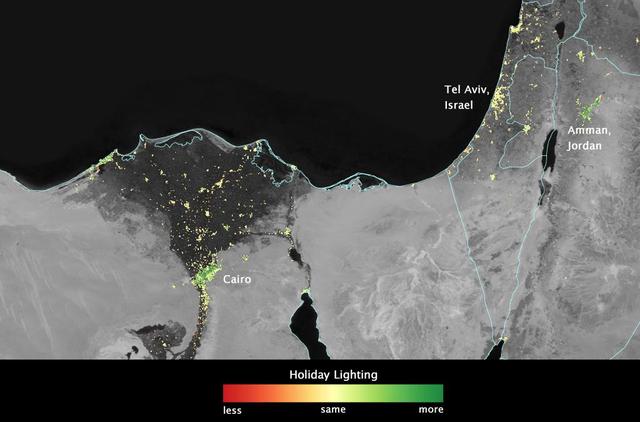
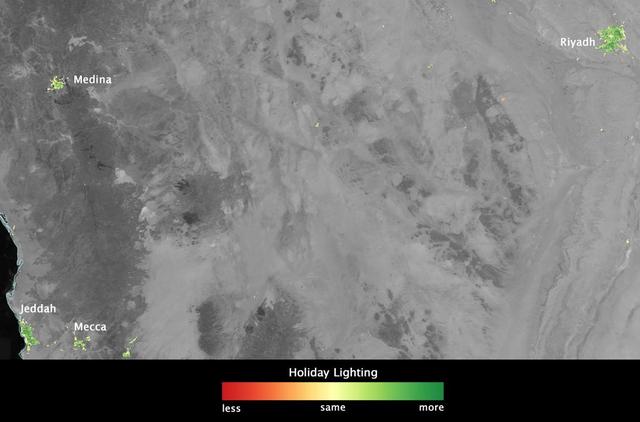
In several cities in the Middle East, city lights brighten during the Muslim holy month of Ramadan, as seen using a new analysis of daily data from the NASA-NOAA Suomi NPP satellite. Dark green pixels are areas where the lights are 50 percent brighter, or more, during Ramadan. Credit: Jesse Allen, NASA’s Earth Observatory Read more: <a href="http://www.nasa.gov/content/goddard/satellite-sees-holiday-lights-brighten-cities" rel="nofollow">www.nasa.gov/content/goddard/satellite-sees-holiday-light...</a> <b><a href="http://www.nasa.gov/audience/formedia/features/MP_Photo_Guidelines.html" rel="nofollow">NASA image use policy.</a></b> <b><a href="http://www.nasa.gov/centers/goddard/home/index.html" rel="nofollow">NASA Goddard Space Flight Center</a></b> enables NASA’s mission through four scientific endeavors: Earth Science, Heliophysics, Solar System Exploration, and Astrophysics. Goddard plays a leading role in NASA’s accomplishments by contributing compelling scientific knowledge to advance the Agency’s mission. <b>Follow us on <a href="http://twitter.com/NASAGoddardPix" rel="nofollow">Twitter</a></b> <b>Like us on <a href="http://www.facebook.com/pages/Greenbelt-MD/NASA-Goddard/395013845897?ref=tsd" rel="nofollow">Facebook</a></b> <b>Find us on <a href="http://instagram.com/nasagoddard?vm=grid" rel="nofollow">Instagram</a></b>
In several cities in the Middle East, city lights brighten during the Muslim holy month of Ramadan, as seen using a new analysis of daily data from the NASA-NOAA Suomi NPP satellite. Dark green pixels are areas where the lights are 50 percent brighter, or more, during Ramadan. Credit: Jesse Allen, NASA’s Earth Observatory Read more: <a href="http://www.nasa.gov/content/goddard/satellite-sees-holiday-lights-brighten-cities" rel="nofollow">www.nasa.gov/content/goddard/satellite-sees-holiday-light...</a> <b><a href="http://www.nasa.gov/audience/formedia/features/MP_Photo_Guidelines.html" rel="nofollow">NASA image use policy.</a></b> <b><a href="http://www.nasa.gov/centers/goddard/home/index.html" rel="nofollow">NASA Goddard Space Flight Center</a></b> enables NASA’s mission through four scientific endeavors: Earth Science, Heliophysics, Solar System Exploration, and Astrophysics. Goddard plays a leading role in NASA’s accomplishments by contributing compelling scientific knowledge to advance the Agency’s mission. <b>Follow us on <a href="http://twitter.com/NASAGoddardPix" rel="nofollow">Twitter</a></b> <b>Like us on <a href="http://www.facebook.com/pages/Greenbelt-MD/NASA-Goddard/395013845897?ref=tsd" rel="nofollow">Facebook</a></b> <b>Find us on <a href="http://instagram.com/nasagoddard?vm=grid" rel="nofollow">Instagram</a></b>
In several cities in the Middle East, city lights brighten during the Muslim holy month of Ramadan, as seen using a new analysis of daily data from the NASA-NOAA Suomi NPP satellite. Dark green pixels are areas where the lights are 50 percent brighter, or more, during Ramadan. Credit: Jesse Allen, NASA’s Earth Observatory Read more: <a href="http://www.nasa.gov/content/goddard/satellite-sees-holiday-lights-brighten-cities" rel="nofollow">www.nasa.gov/content/goddard/satellite-sees-holiday-light...</a> <b><a href="http://www.nasa.gov/audience/formedia/features/MP_Photo_Guidelines.html" rel="nofollow">NASA image use policy.</a></b> <b><a href="http://www.nasa.gov/centers/goddard/home/index.html" rel="nofollow">NASA Goddard Space Flight Center</a></b> enables NASA’s mission through four scientific endeavors: Earth Science, Heliophysics, Solar System Exploration, and Astrophysics. Goddard plays a leading role in NASA’s accomplishments by contributing compelling scientific knowledge to advance the Agency’s mission. <b>Follow us on <a href="http://twitter.com/NASAGoddardPix" rel="nofollow">Twitter</a></b> <b>Like us on <a href="http://www.facebook.com/pages/Greenbelt-MD/NASA-Goddard/395013845897?ref=tsd" rel="nofollow">Facebook</a></b> <b>Find us on <a href="http://instagram.com/nasagoddard?vm=grid" rel="nofollow">Instagram</a></b>
SL3-115-1917 (July-September 1973) --- Skylab 3 Earth view of the United Arab Republic (UAR), Nile Delta, Cairo, Suez Canal, Sinai and Dead Sea. Photo credit: NASA

Earth Observation taken during a day pass by the Expedition 40 crew aboard the International Space Station (ISS). File lists this as: Africa, Middle East.
Earth Observation taken during a day pass by the Expedition 40 crew aboard the International Space Station (ISS). Folder lists this as: general Middle East photos.
Earth Observation taken during a day pass by the Expedition 40 crew aboard the International Space Station (ISS). Folder lists this as: the Middle East, Israel.
Earth Observation taken during a day pass by the Expedition 40 crew aboard the International Space Station (ISS). Folder lists this as: Middle East.
Earth Observation taken during a day pass by the Expedition 40 crew aboard the International Space Station (ISS). Folder lists this as: the Middle East, Israel.
Earth Observation taken during a night pass by the Expedition 40 crew aboard the International Space Station (ISS). Folder lists this as: Middle East cities.
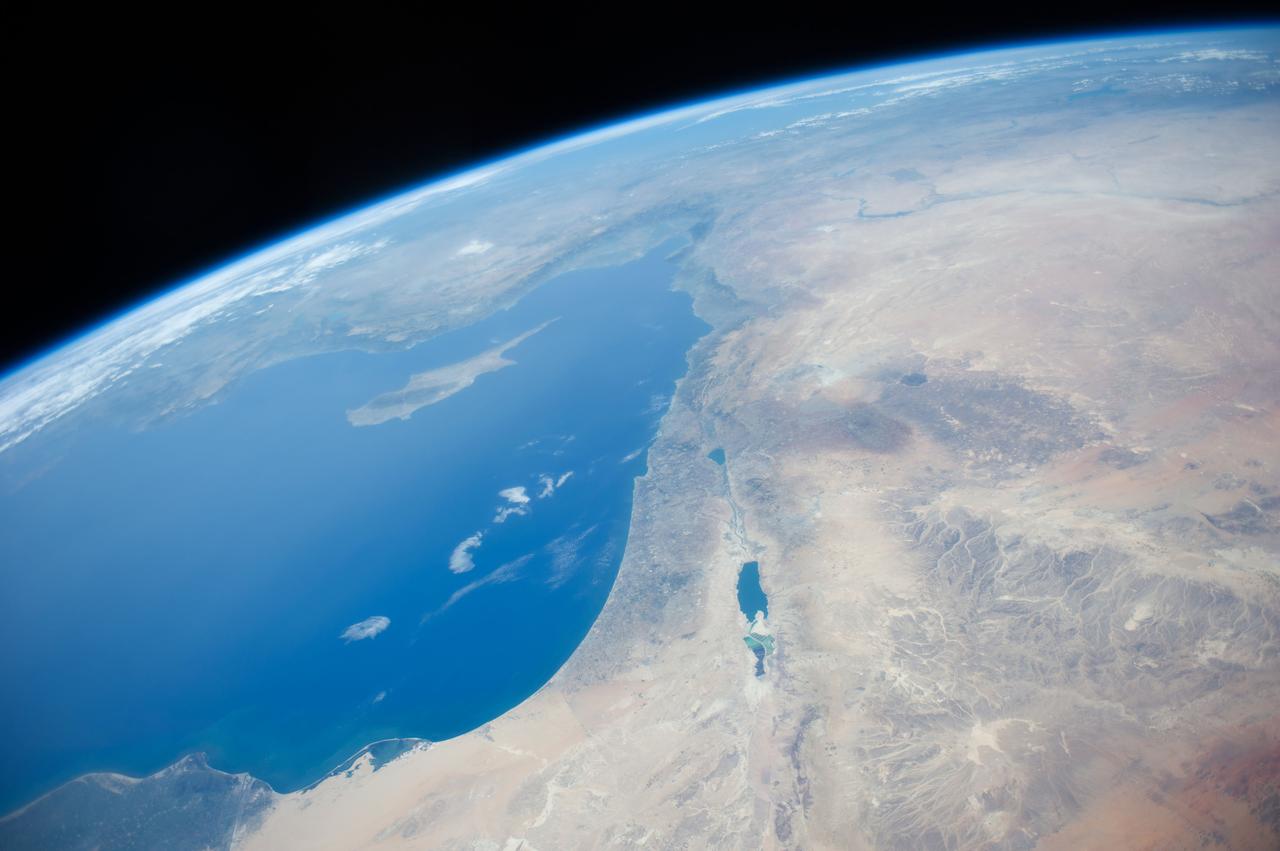
Earth Observation taken during a day pass by the Expedition 40 crew aboard the International Space Station (ISS). Folder lists this as: the Middle East, Israel.

iss062e078990 (March 4, 2020) --- The Dead Sea was pictured from the International Space Station as it orbited 263 miles above the Middle East.
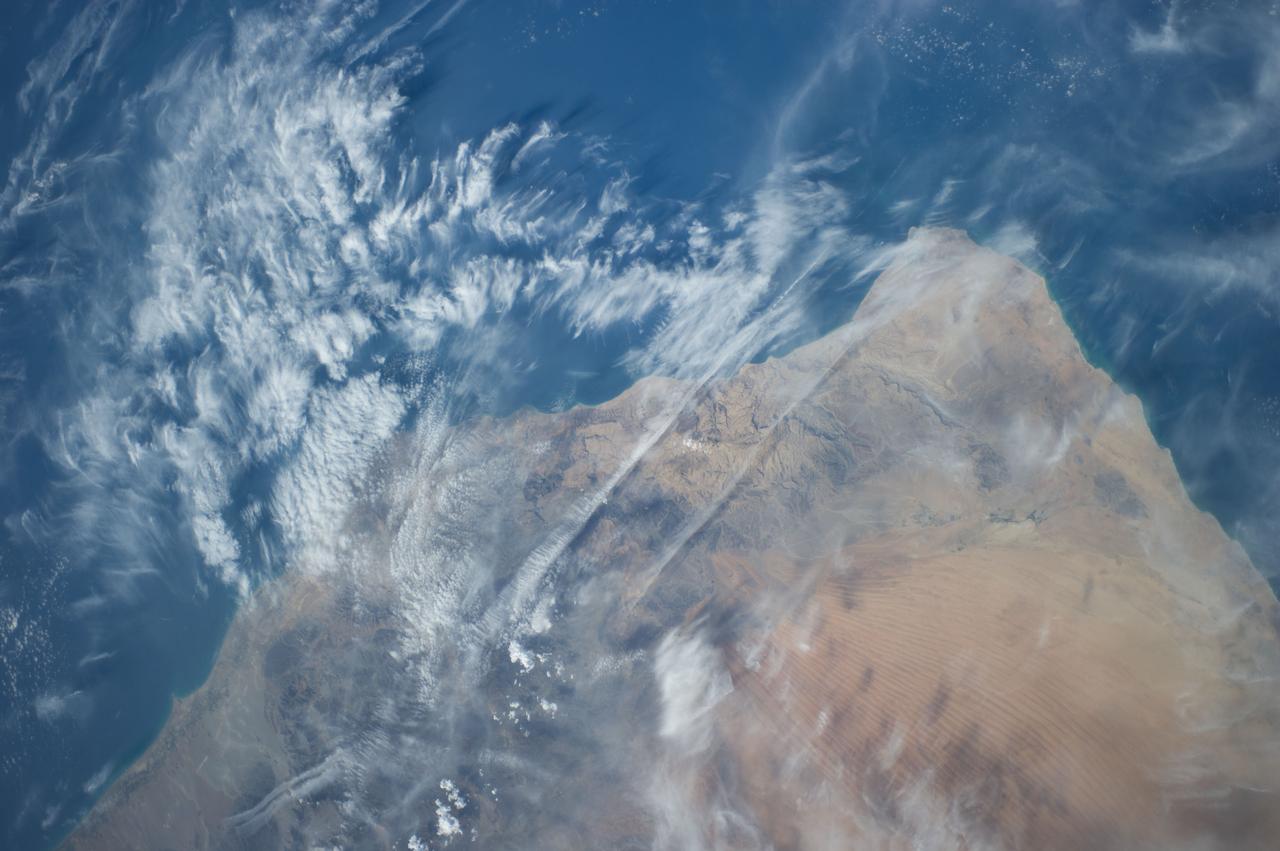
Earth Observation taken during a day pass by the Expedition 40 crew aboard the International Space Station (ISS). File lists this as: Africa, Middle East
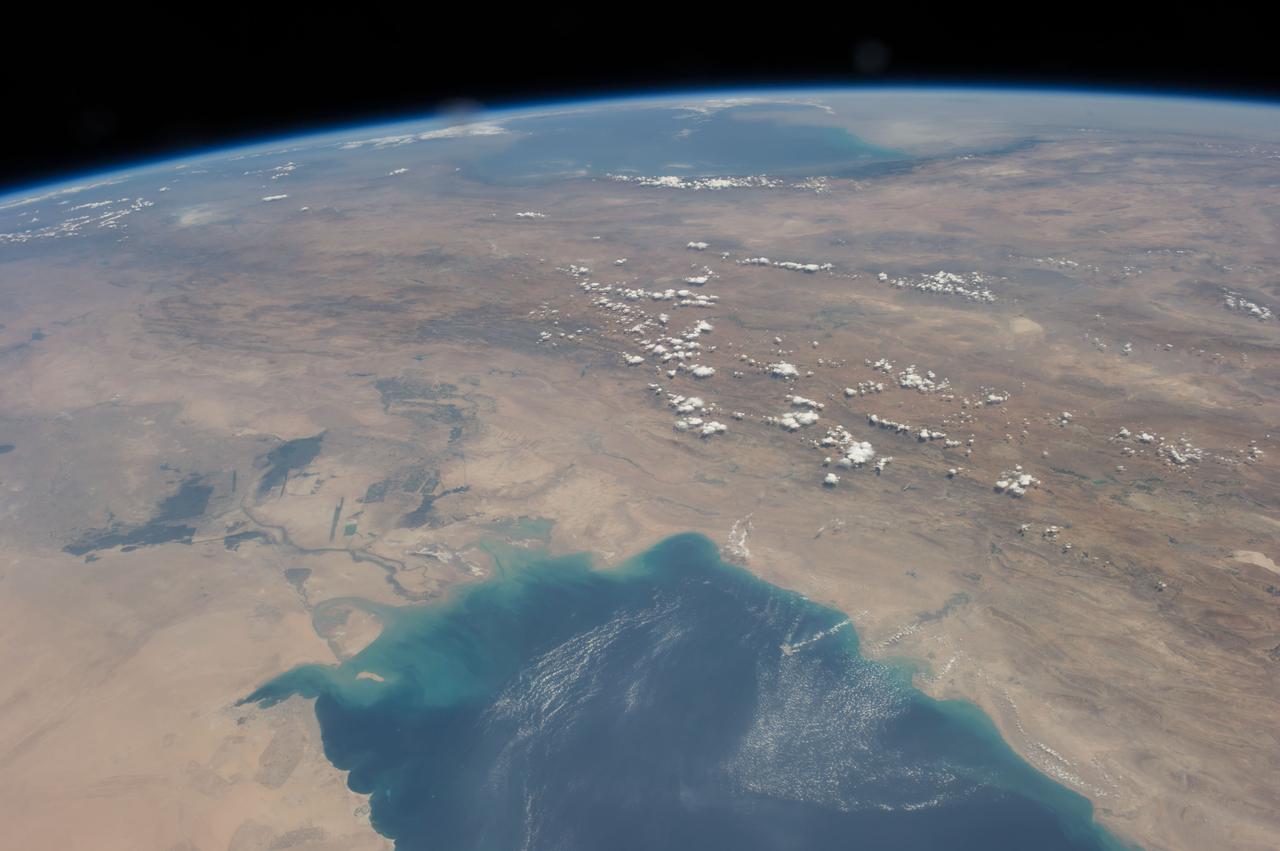
Earth Observation taken during a day pass by the Expedition 40 crew aboard the International Space Station (ISS). Folder lists this as: Middle East.
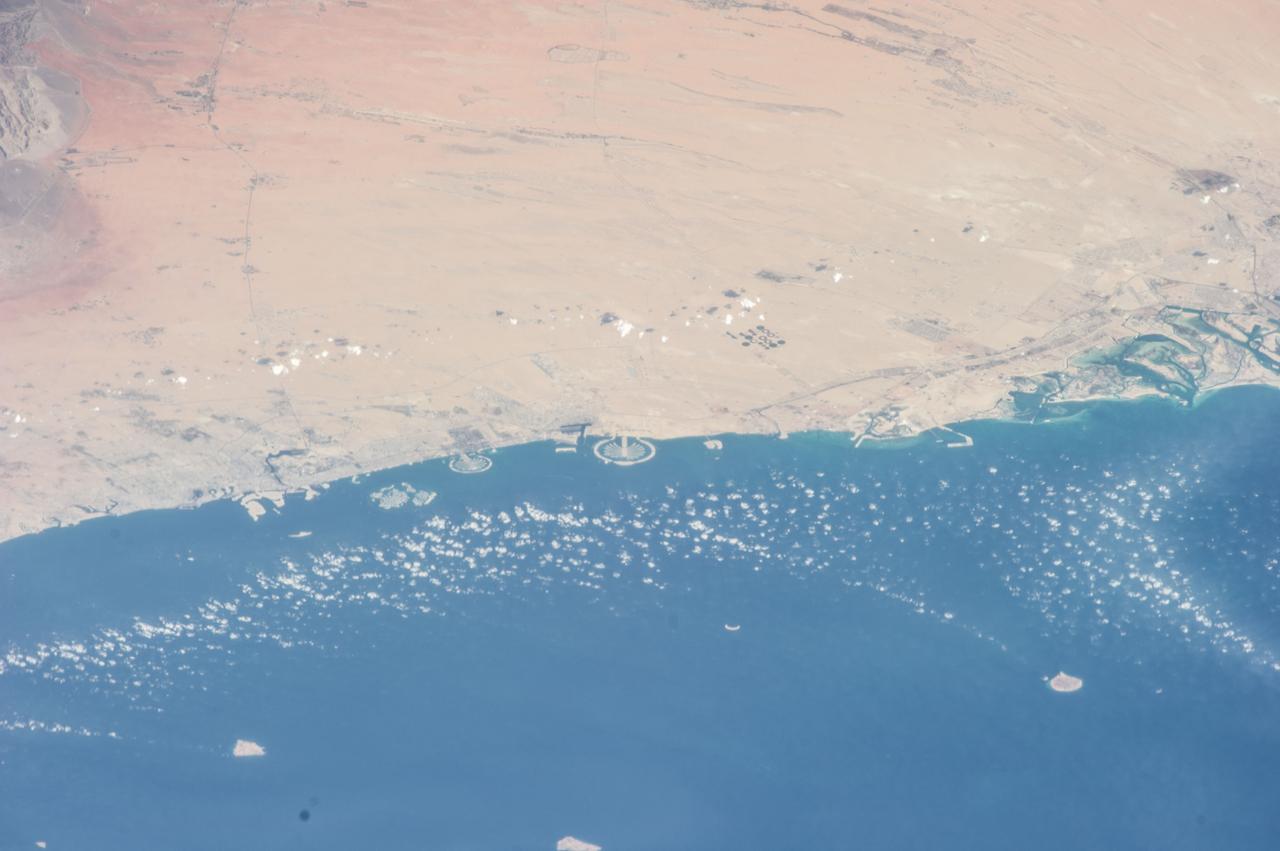
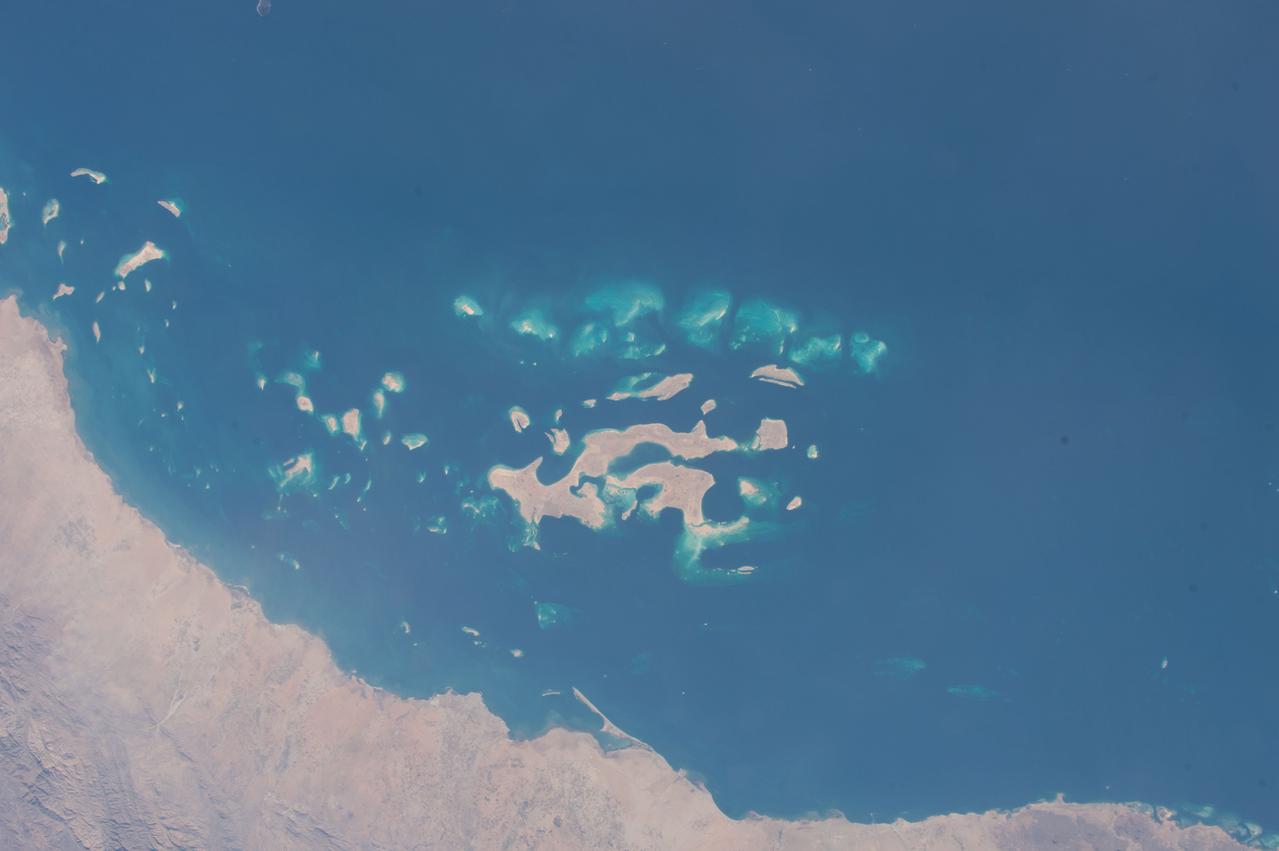
Earth Observations taken by Expedition 38 crewmember. Crewmember indicates Middle East man-made Islands. Image was released by astronaut on Twitter.
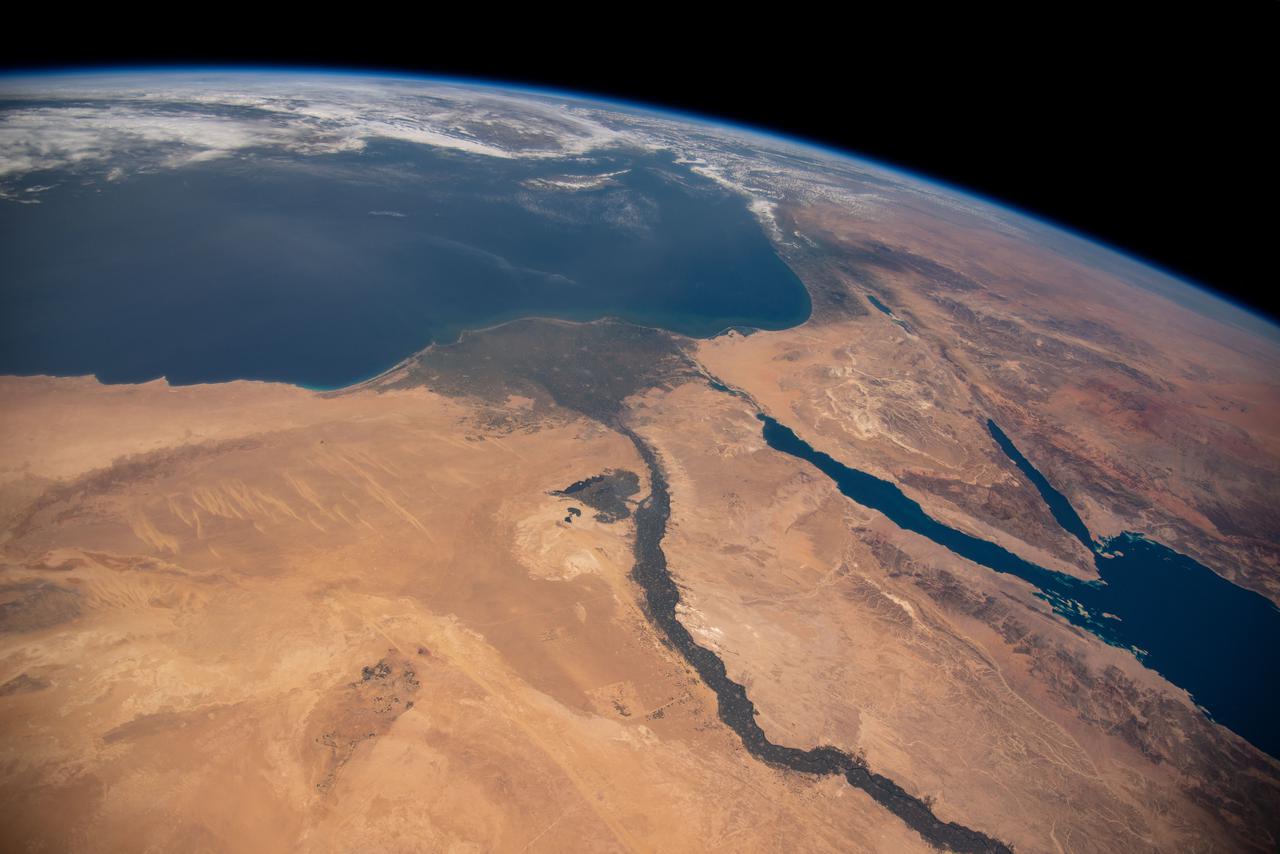
iss064e053173 (April 4, 2021) --- The Nile River, The Red Sea, The Gulf of Oman, The Gulf of Aqaba, and The Mediterranean Sea are pictured in the Middle East from the International Space Station as it orbited 263 miles above Egypt.
iss064e052447 (April 4, 2021) --- The Nile Delta, The Sinai Peninsula, and The Mediterranean Sea are pictured in the Middle East from the International Space Station as it orbited 263 miles above Egypt.

Earth Observation taken during a night pass by the Expedition 40 crew aboard the International Space Station (ISS). Folder lists this as: Middle East night shots. Israel I think and Mecca.
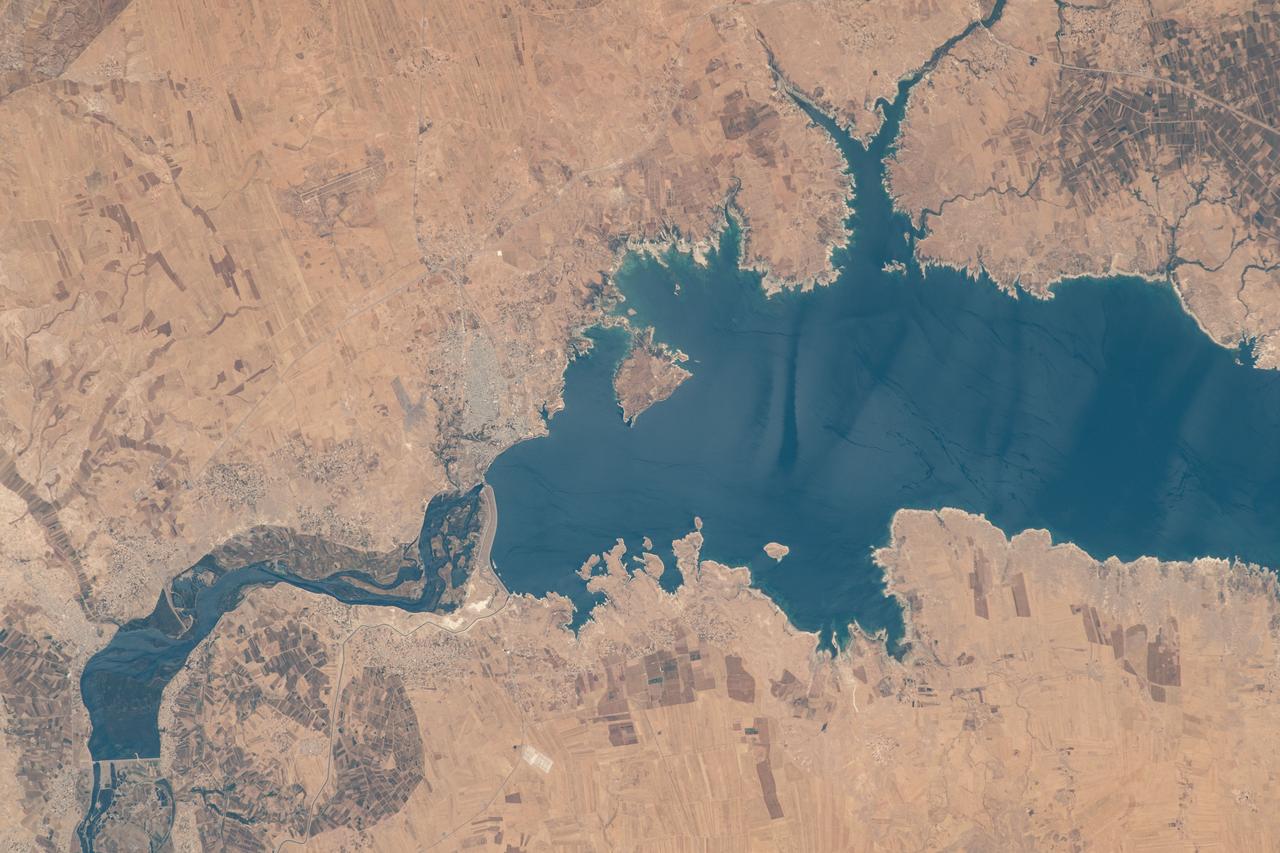
iss069e015083 (May 31, 2023) --- Lake Assad in Syria, a reservoir on the Euphrates River, is pictured from the International Space Station as it orbited 258 miles above the Middle East nation.
iss072e660964 (Feb. 24, 2025) --- The northernmost tip of the Gulf of Aqaba, which Egypt, Israel, and Jordan border along in this photograph, is pictured from the International Space Station as it orbited 263 miles above the Middle East.

Earth Observation taken during a day pass by the Expedition 40 crew aboard the International Space Station (ISS). Part of Space Station Remote Manipulator System (SSRMS) is visible. Folder lists this as: the Middle East, Israel.
iss061e066550 (Dec. 3, 2019) --- Beirut, the capital city of Lebanon, and its metropolitan area with a population of 2.2 million, is pictured on the coast of the Mediterranean Sea as the International Space Station orbited 252 miles above the Middle East.

Earth Observation taken during a night pass by the Expedition 40 crew aboard the International Space Station (ISS). Folder lists this as: Middle East. Docked Soyuz and Progress spacecraft also visible.

Earth Observation taken during a night pass by the Expedition 40 crew aboard the International Space Station (ISS). Folder lists this as: Middle East. The Space Station Remote Manipulator System (SSRMS) arm is also visible.
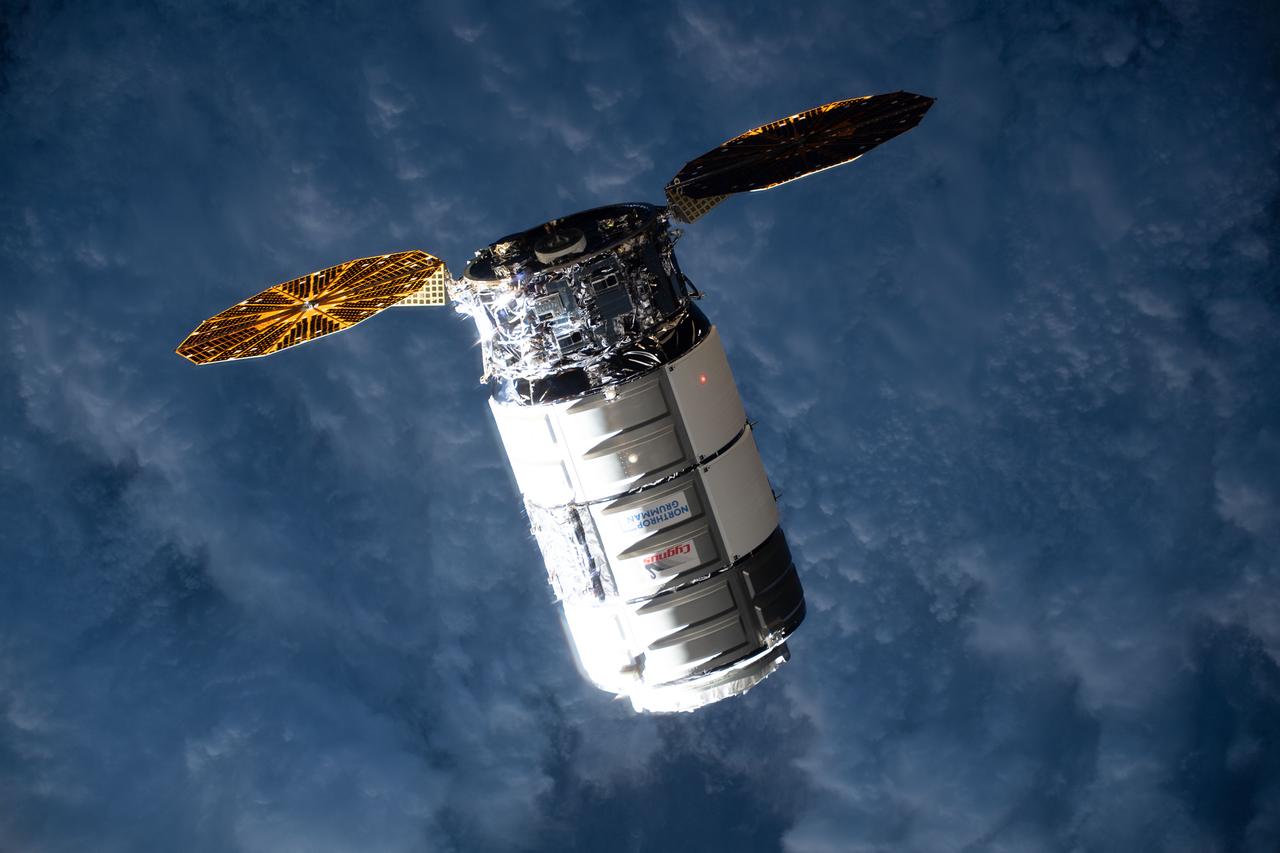
iss070e085709 (Feb. 1, 2024) --- Northrop Grumman's Cygnus space freighter approaches the International Space Station to deliver more than 8,200 pounds of science experiments, crew supplies, and station hardware for the Expedition 70 crew. Both spacecraft were orbiting 262 miles above the Middle East at the time of this photograph.
ISS042E237341 (02/09/2015) --- Twitter image from US Astronaut Terry Virts of the Red Sea in the Middle East on Feb. 09, 2015. Terry labeled it "earth art." Terry is a flight engineer of Expedition 42 on the International Space Station.
iss071e578476 (Aug. 14, 2024) --- The Nile River runs alongside the Red Sea in this photograph from the International Space Station as it orbited 258 miles above the Middle East. At lower left, is one of the two cymbal-shaped UltraFlex solar arrays that power the Northrop Grumman space freighter.
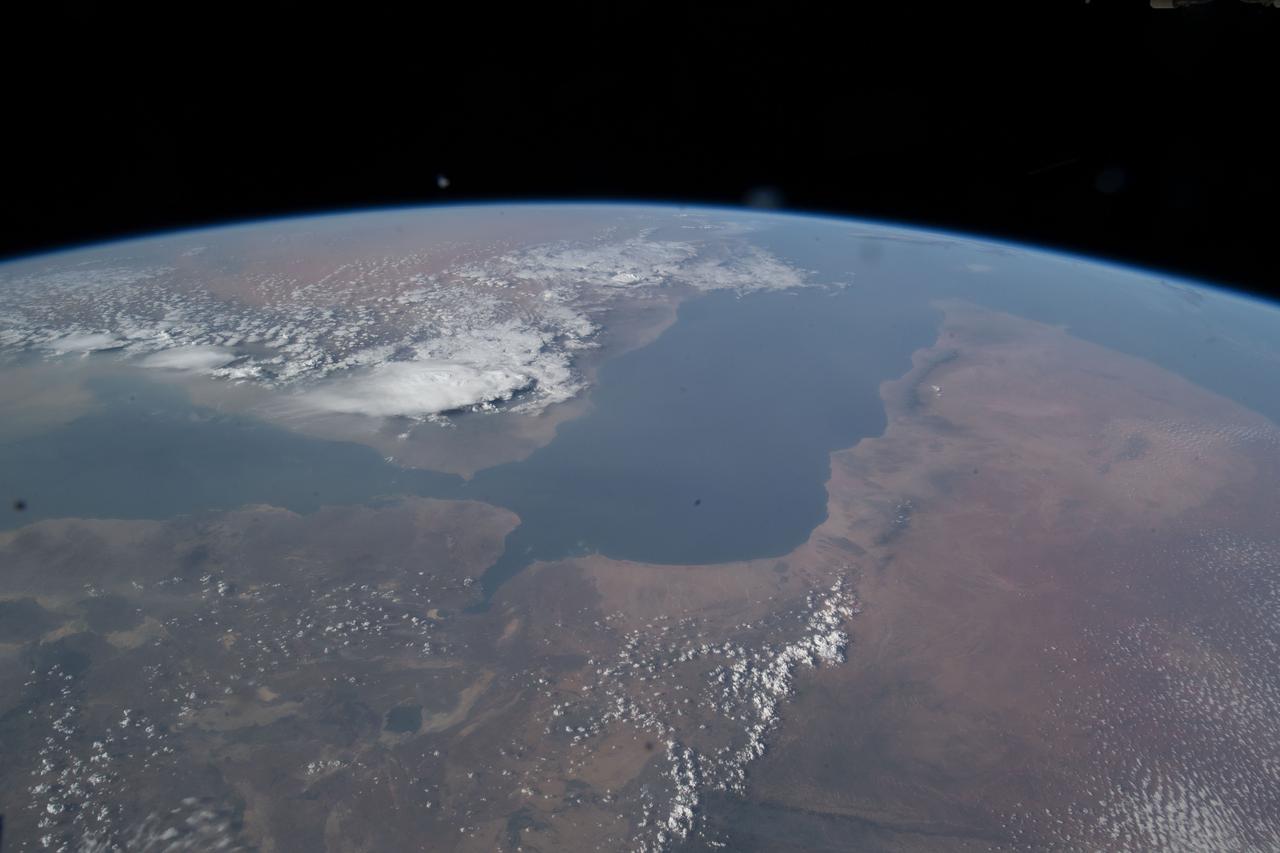
iss069e033356 (July 19, 2023) -- Eastern Africa meets the Middle East as the Red Sea and Gulf of Aden flow between the regions. United Arab Emirates (UAE) Flight Engineer Sultan Alneyadi snapped this photograph during Crew Earth Observation tasks while the International Space Station soared roughly 260 miles above.
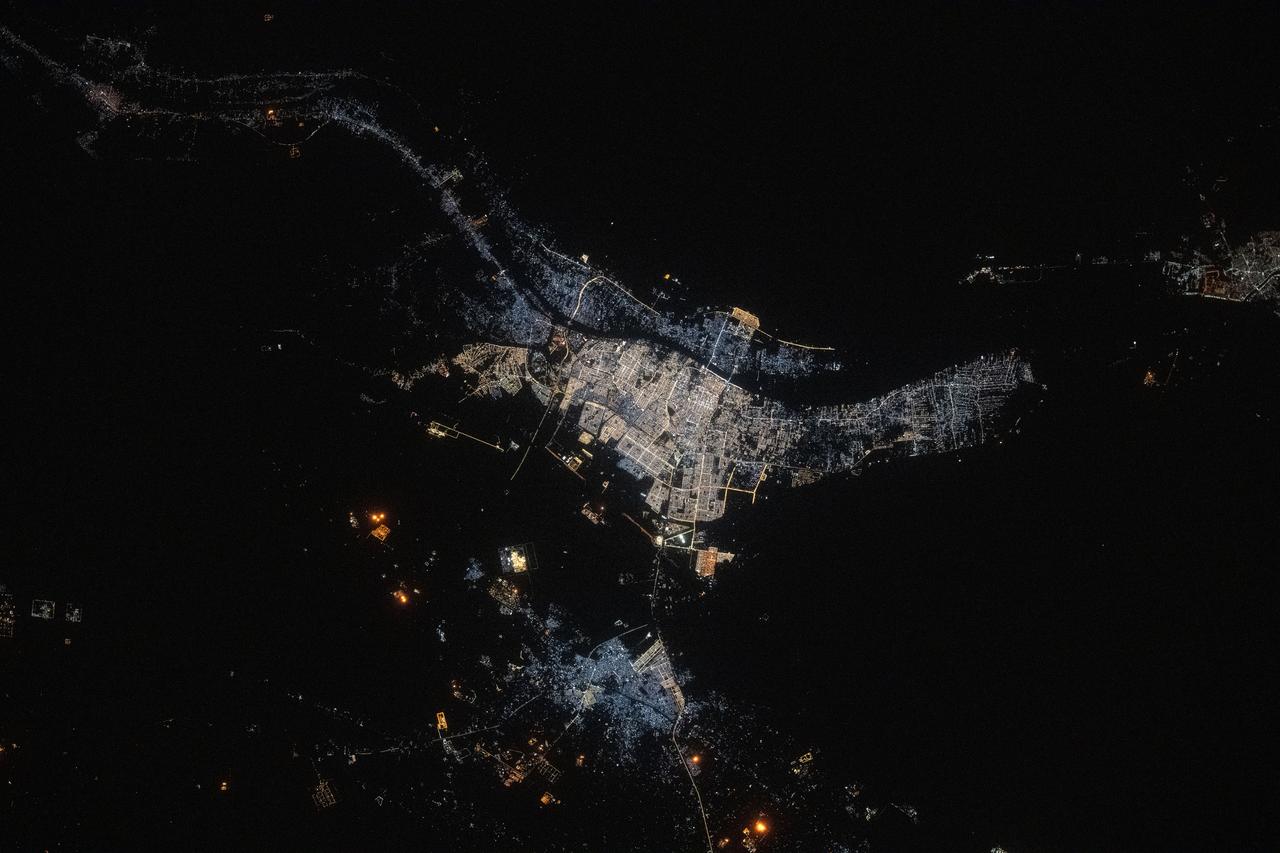
iss073e0134545 (May 22, 2025) --- The port city of Basrah, Iraq, with a population of about 1.49 million near the Persian Gulf and split by the Shatt Al Arab river, is pictured at approximately 10:42 p.m. local time from the International Space Station as it orbited 260 miles above the Middle East.
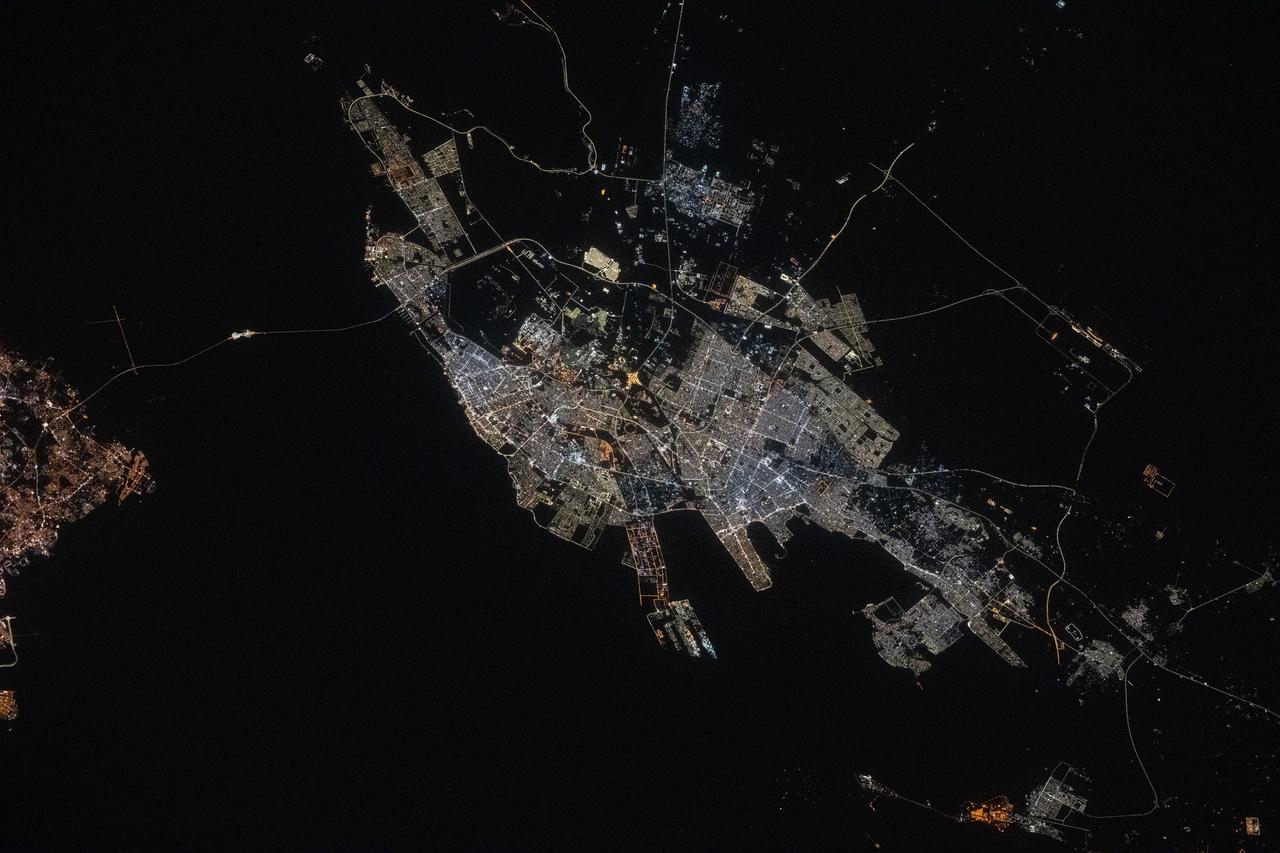
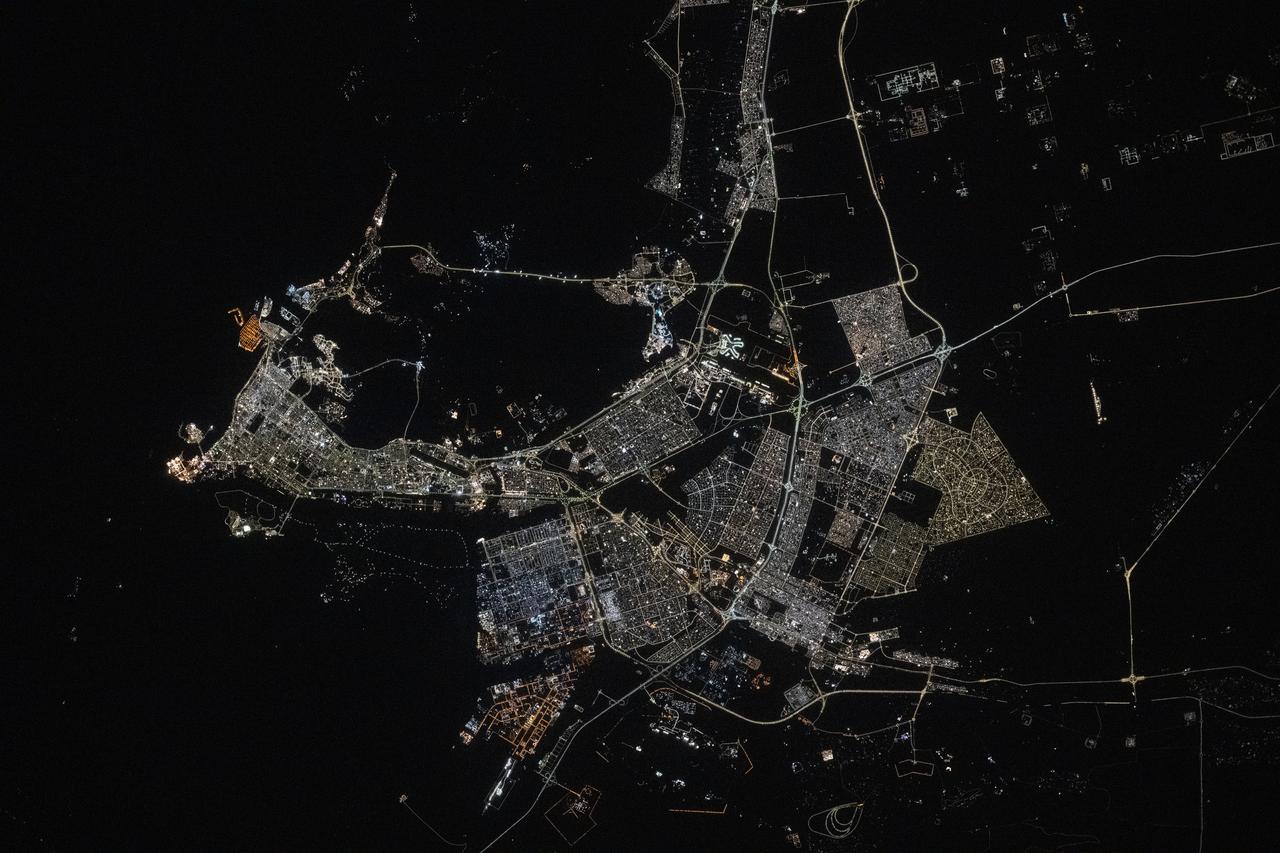
iss073e0134562 (May 22, 2025) --- The port city of Dammam, Saudi Arabia, with a population of about 1.38 million on the Persian Gulf coast, is pictured at approximately 10:43 p.m. local time from the International Space Station as it orbited 259 miles above the Middle East.
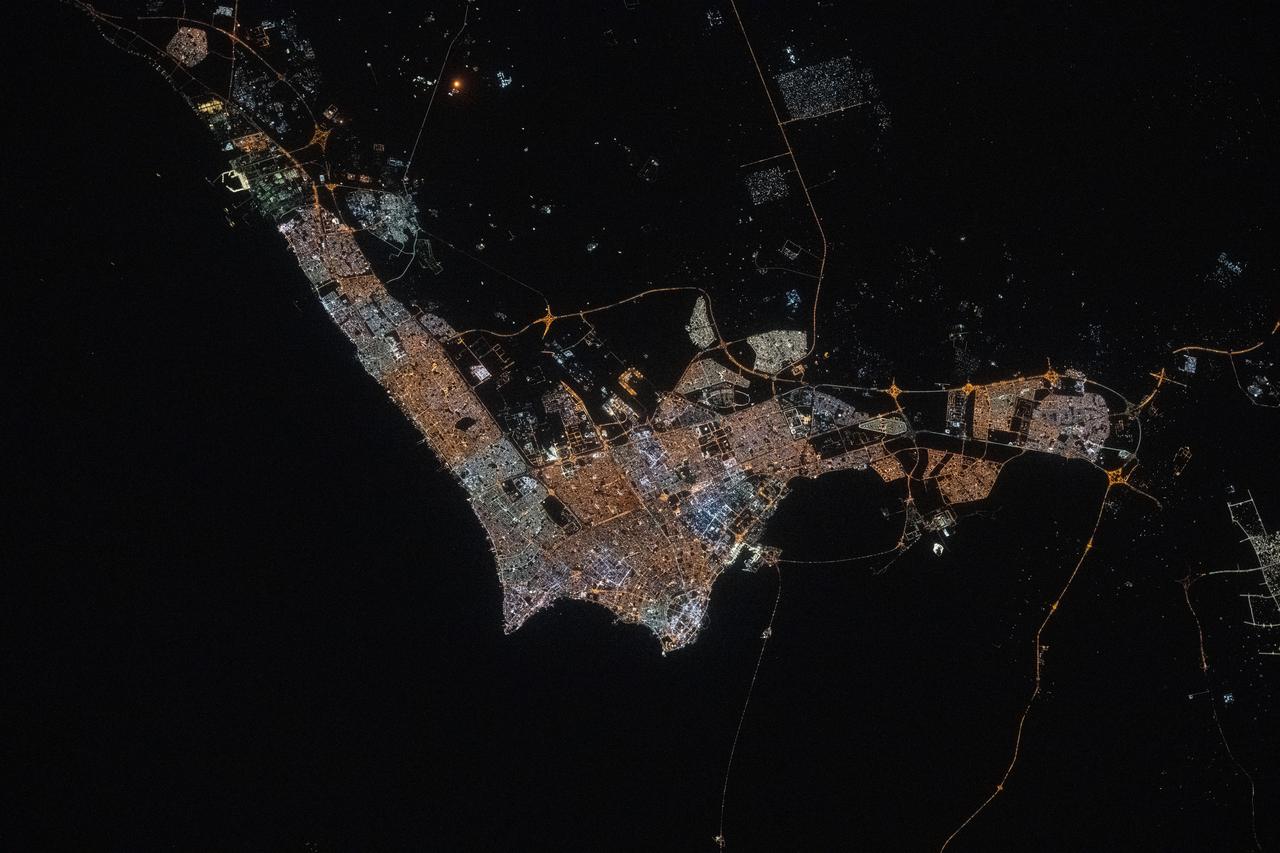
iss073e0134580 (May 22, 2025) --- Abu Dhabi, the capital and second most populous city in the United Arab Emirates with a population of about 1.57 million on the Persian Gulf, is pictured at approximately 10:44 p.m. local time from the International Space Station as it orbited 259 miles above the Middle East.
iss073e0134550 (May 22, 2025) --- Kuwait City, with a population of about 3.5 million and where the majority of Kuwait's citizens reside on the Persian Gulf coast, is pictured at approximately 10:42 p.m. local time from the International Space Station as it orbited 259 miles above the Middle East.
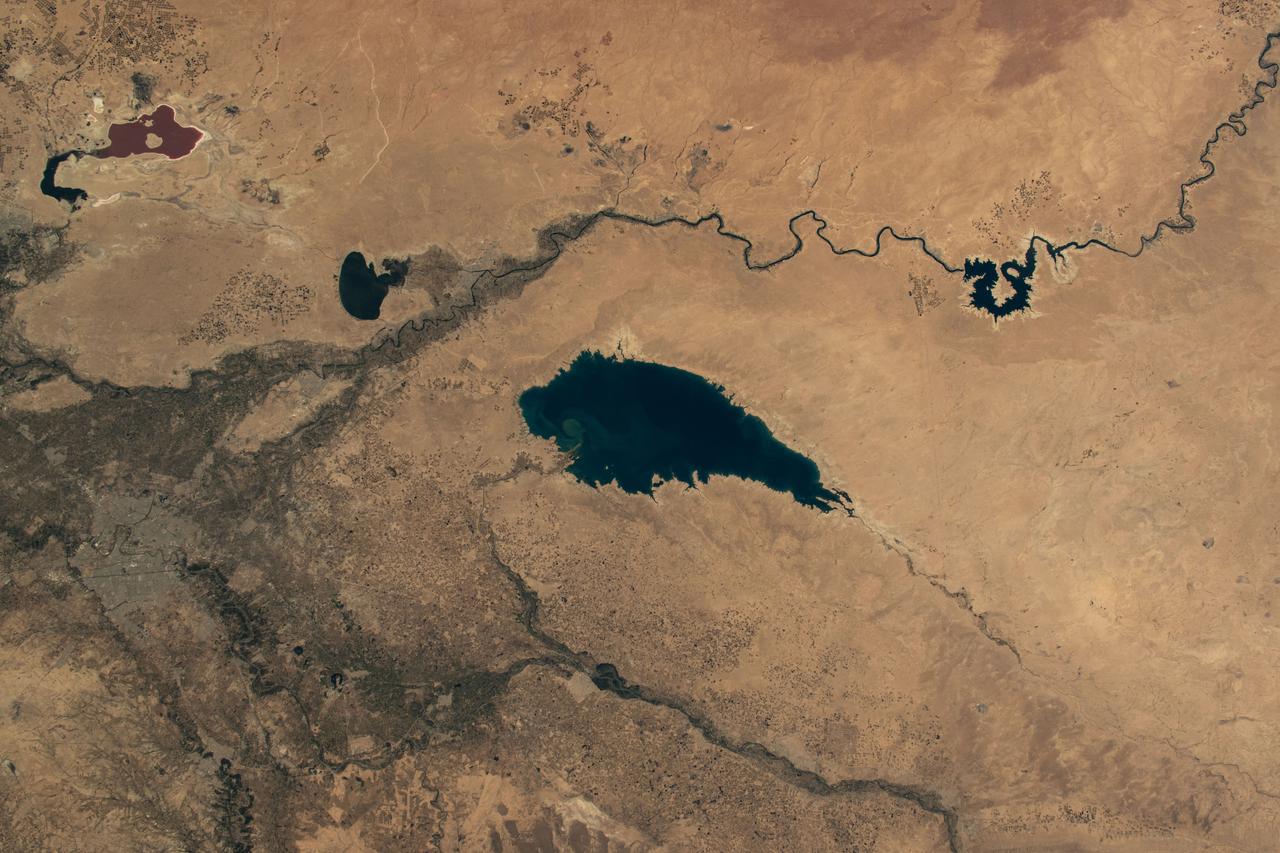
iss071e163367 (June 4, 2024) --- Baghdad, Iraq (lower left), is pictured near several bodies of water including (from left) Razazza Lake, Habbaniyah Lake, Therthar Lake, the Euphrates River, and Lake Qadisiyah created by the damming of the Euphrates. The International Space Station was orbiting 260 miles above the Middle East at the time of this photograph.
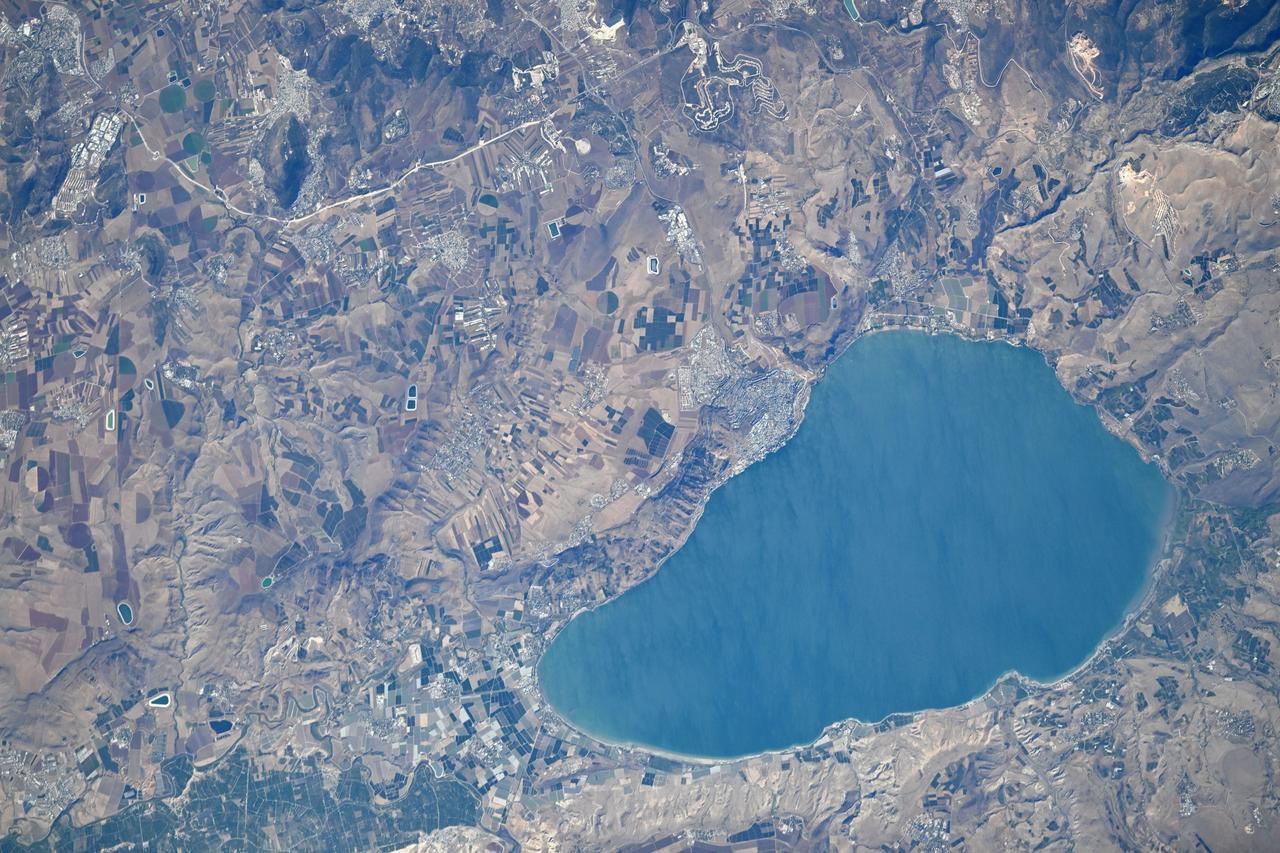
iss073e0343910 (July 19, 2025) --- Israel's Sea of Galilee, the lowest freshwater lake in the world and the second-lowest lake in the world after Israel's Dead Sea, a salt lake, is pictured from the International Space Station as it orbited 260 miles above the Middle East. Credit: Roscosmos
S65-63849 (8 Dec. 1965) --- The eastern Mediterranean area as seen from the National Aeronautics and Space Administration's Gemini-7 spacecraft. The Nile Delta in Egypt is at bottom. The Suez Canal, Gulf of Suez and Red Sea are in the center of the photograph. The Sinai Peninsula is in the upper right corner of the picture. The body of water at the top edge of the photograph is the Gulf of Aqaba. The Dead Sea can be seen at top center. Israel, Palestine, Jordan and Syria are also at top center. The Island of Cyprus is at extreme left. Astronauts Frank Borman and James A. Lovell Jr. took this picture using a modified 70mm Hasselblad camera, with Eastman Kodak, Ektachrome MS (S.O. 217) color film. Photo credit: NASA
Geologists aren't quite sure what to make of the dark splotch in the middle of this image from NASA's Mars Reconnaisance Orbiter (MRO) -- one of several similar dark splotches that extend east and west for over 100 kilometers. From measurements made in infrared, this and other dark splotches have what we call "high thermal inertia," meaning that it heats up and cools down slowly. Scientists use thermal inertia to assess how rocky, sandy, or dusty a place is. A higher thermal inertia than the surrounding area means it's less dusty. Wavy, banded patterns in the dark splotch (possibly due to cross bedding from sand dunes that once occupied the area) were lithified into sandstone, and then eroded away. These clues could help geologists figure out what's going on there. https://photojournal.jpl.nasa.gov/catalog/PIA22042

ISS031-E-095276 (4 June 2012) --- Much of the Middle East is seen in this night time image photographed by one of the Expedition 31 crew members aboard the International Space Station as it flew some 240 miles above the Mediterranean Sea on June 4, 2012. The Nile River Delta is easily recognizable in center frame, and city lights make it easy to see both Cairo and Alexandria, Egypt near the Delta. Two Russian spacecraft -- a Soyuz (left) and a Progress -- appear in the frame while they are docked to the station.
ISS047e057822 (04/14/2016) --- The Middle East is seen from 250 miles above in this photo from the International Space Station. Countries seen left to right along the Mediterranean coast include Egypt, Gaza, Saudi Arabia, Israel, Lebanon, Syria, and Turkey. The major waterways shown from left to right are the Nile River, Gulf of Suez, Gulf of Aqaba, and the Red Sea.
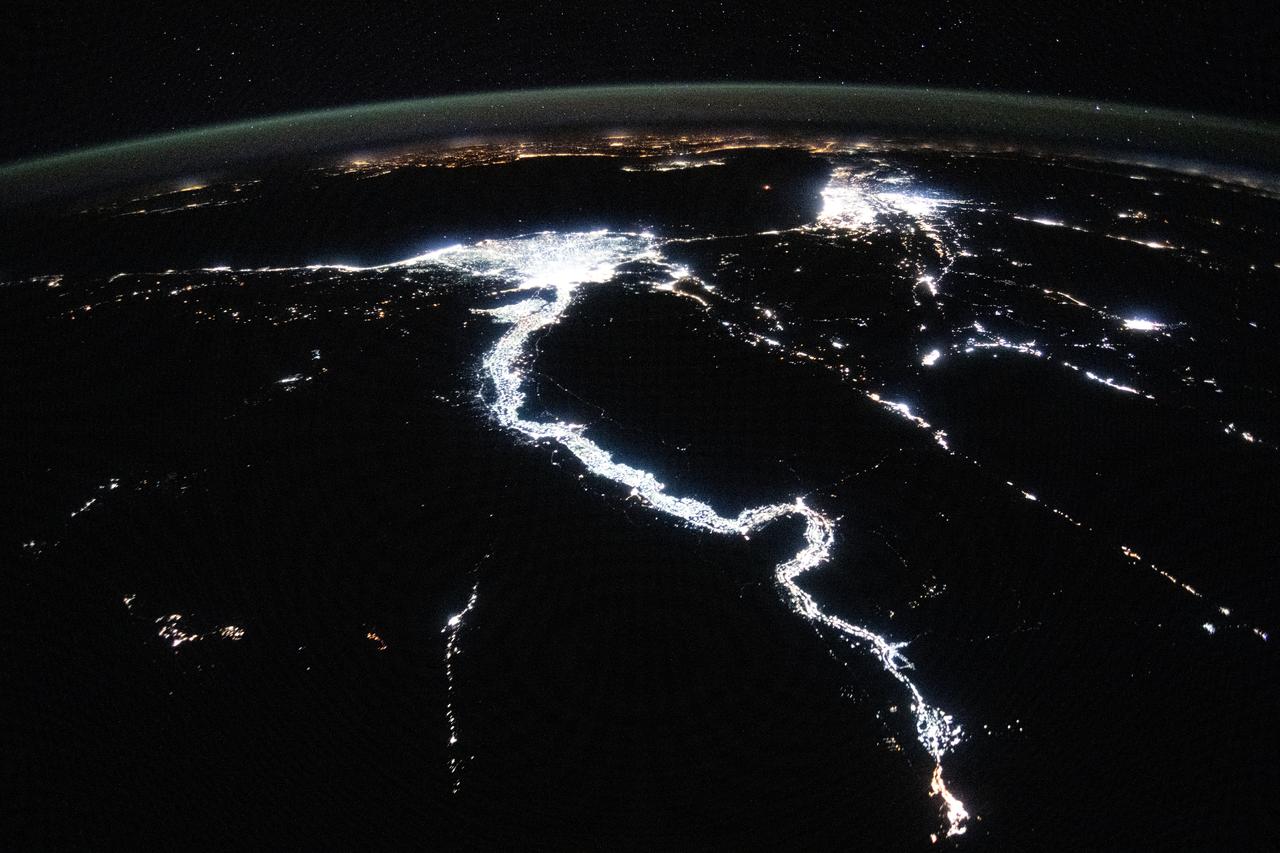
iss071e256968 (June 30, 2024) --- The night lights of civilization highlight the Nile River and dimly outline the shores of the Red Sea, the Gulf of Suez, and the Gulf of Adaba in the Middle East. The nations of Israel, Jordan, and Syria, as well as the Southern European region across the darkness of the Mediterranean Sea also are well lit in this photograph taken from the International Space Station at approximately midnight local time in Cairo, Egypt.
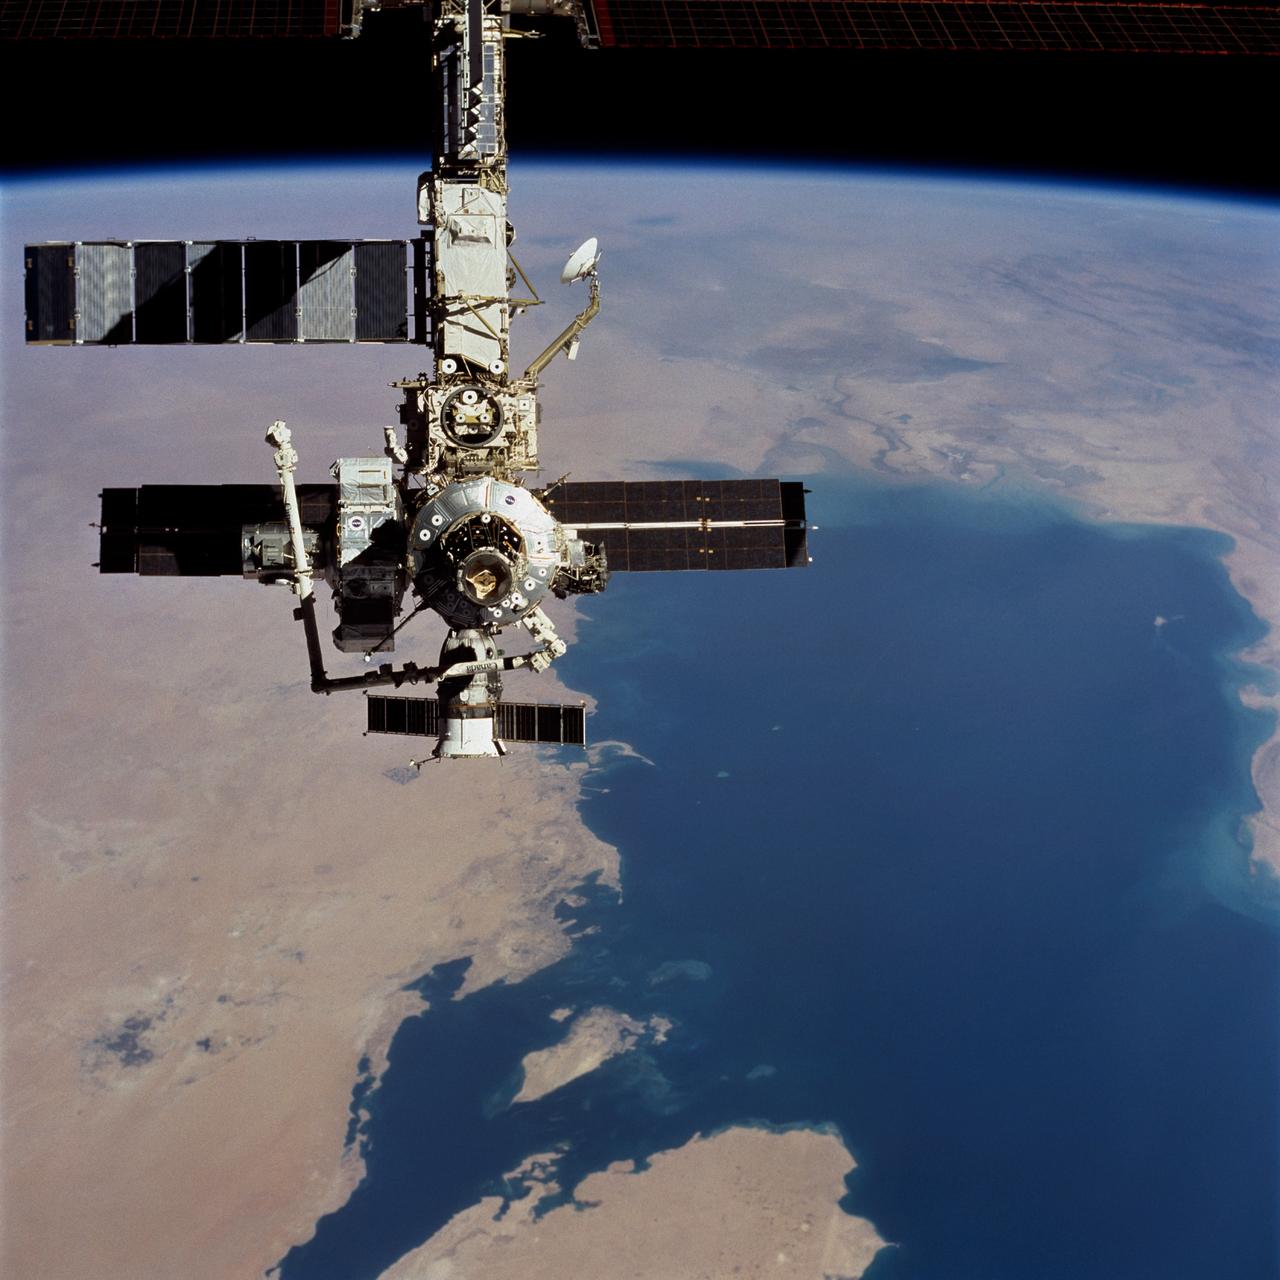
STS104-723-014 (21 July 2001) --- Backdropped over a wide scene of topography in the Middle East, the International Space Station (ISS) passes over the Persian Gulf. The photograph was taken with a 70mm handheld camera during a fly-around inspection by the Space Shuttle Atlantis not long after the two spacecraft separated. Prominent on the starboard side of the outpost is the newly-installed Quest airlock.
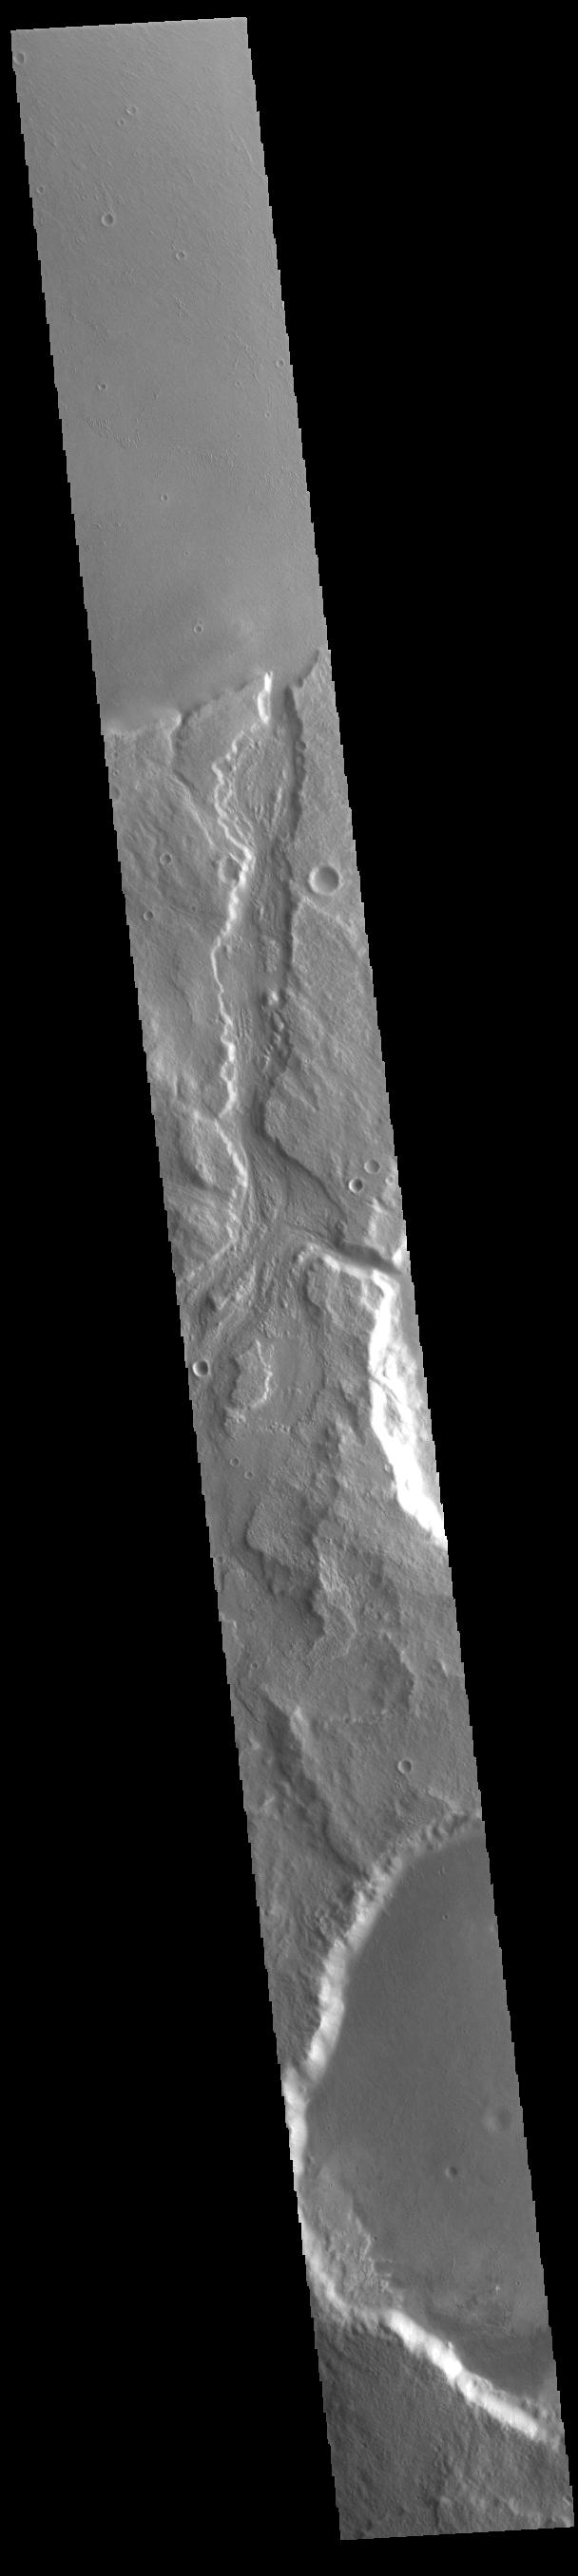
Today's VIS image shows Padus Vallis (middle of image). Located east of Mangala Valles, Padus Vallis is just one of the many small channels that empty into the Medusa Fossae Formation region. Padus Vallis is 57 km (35 miles) long. Orbit Number: 86007 Latitude: -4.81752 Longitude: 210.081 Instrument: VIS Captured: 2021-05-05 02:57 https://photojournal.jpl.nasa.gov/catalog/PIA24220
iss073e0768775 (Sept. 26, 2025) --- The Nile River (top) winds through Egypt, which is separated from Saudi Arabia by the Red Sea. The Red Sea branches into two gulfs: the Gulf of Suez, which leads to the Suez Canal—a strategic and economically vital waterway—and the Gulf of Aqaba. The International Space Station was orbiting 257 miles above the Middle East when this photograph was taken.
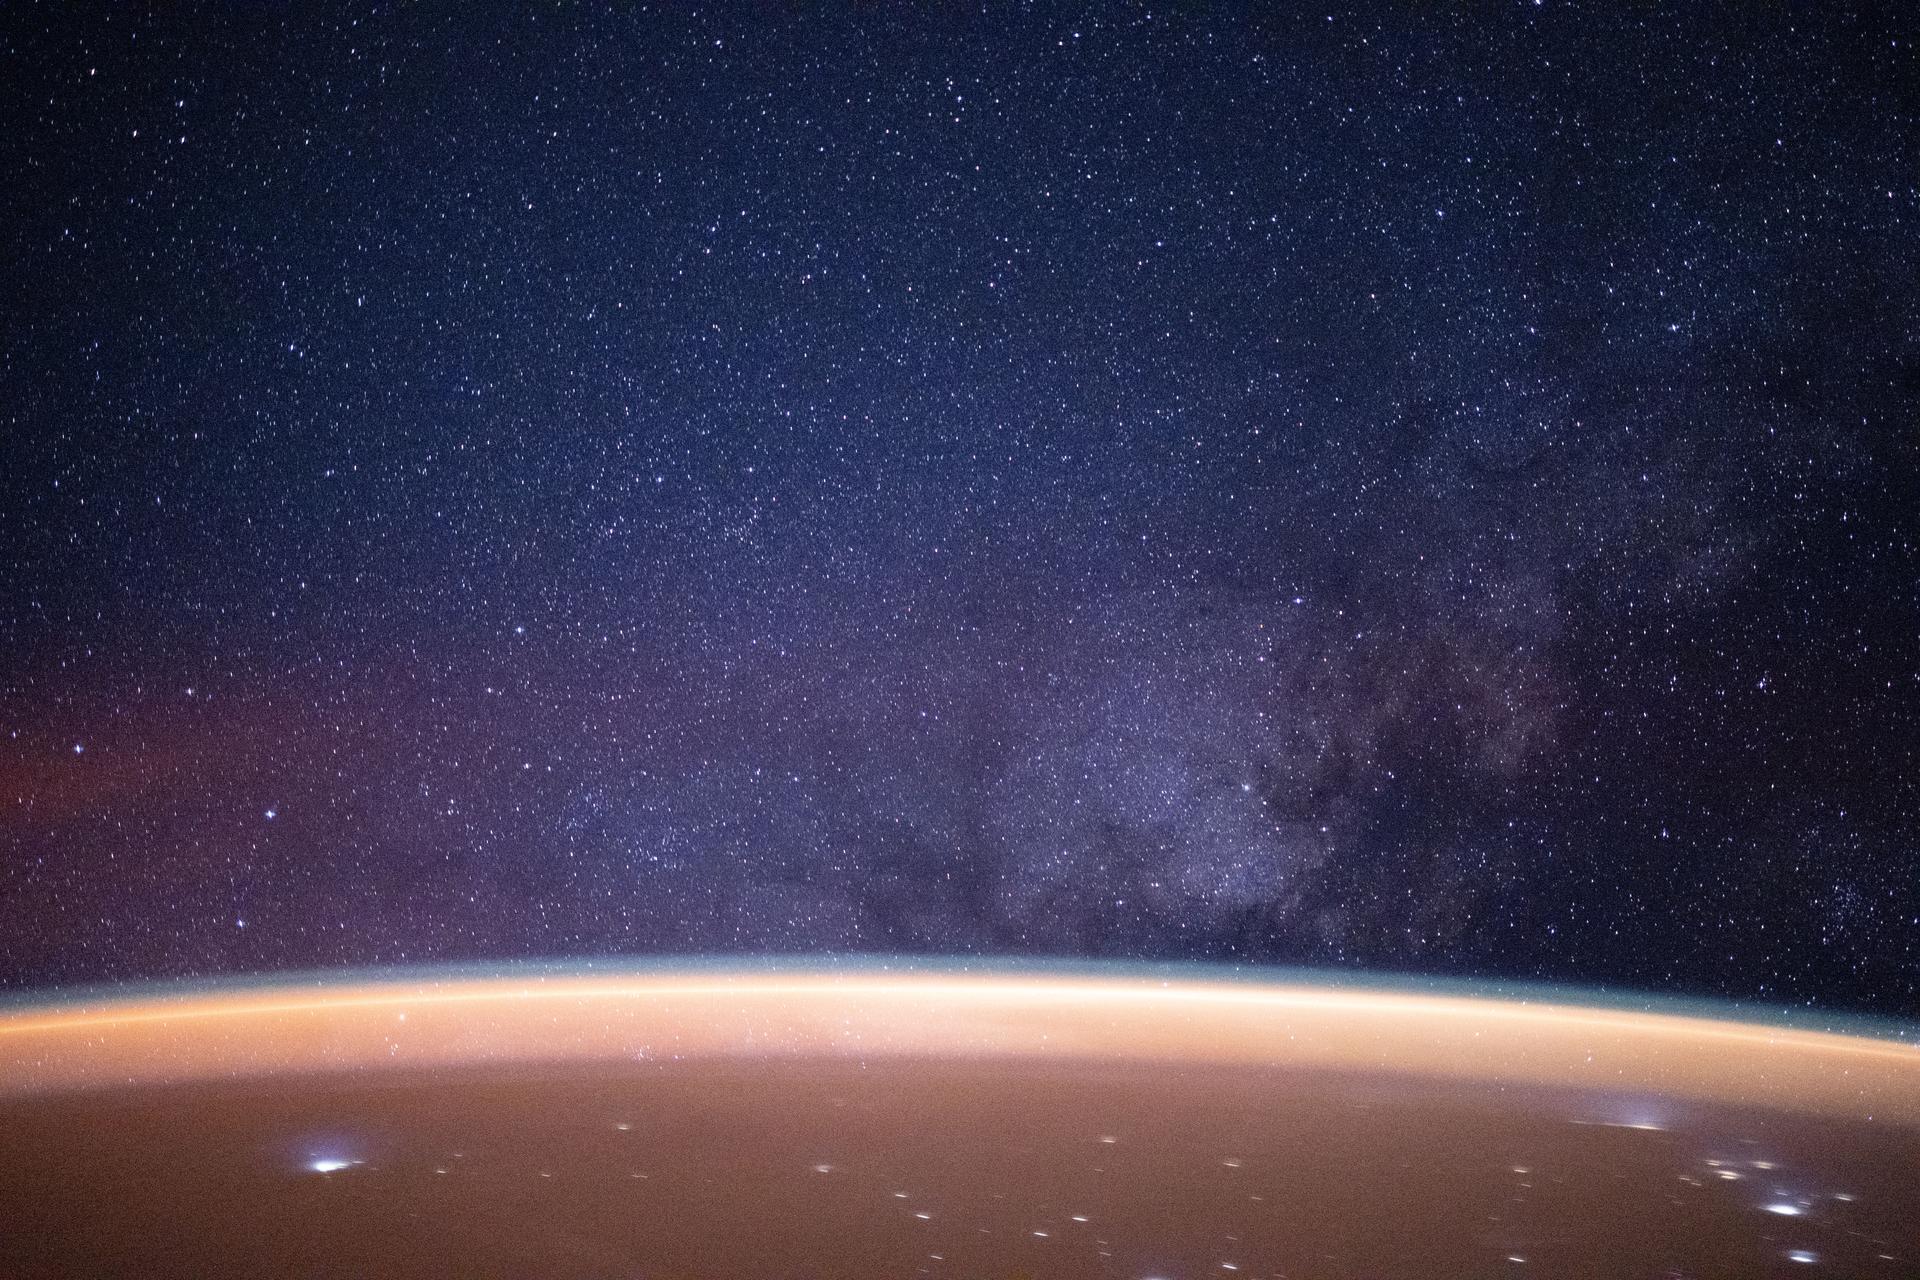
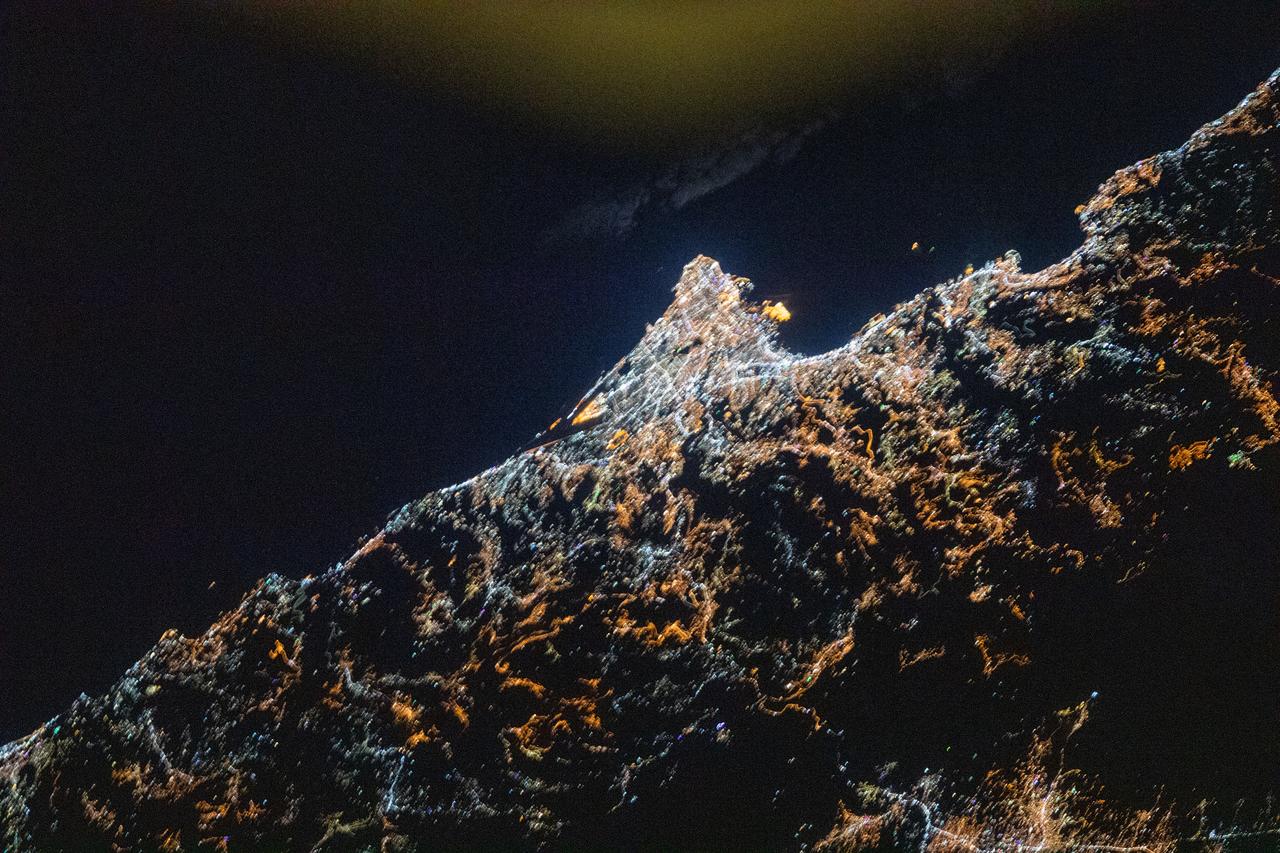
iss073e0982696 (Oct. 25, 2025) --- A reddish airglow blankets Earth beneath a star-filled sky illuminated by the Milky Way. The planet’s surface is sparsely dotted with city lights along the desert coast of the Middle East by the Arabian Sea. The International Space Station was orbiting 258 miles above Earth at approximately 11:34 p.m. local time when this photograph was taken.
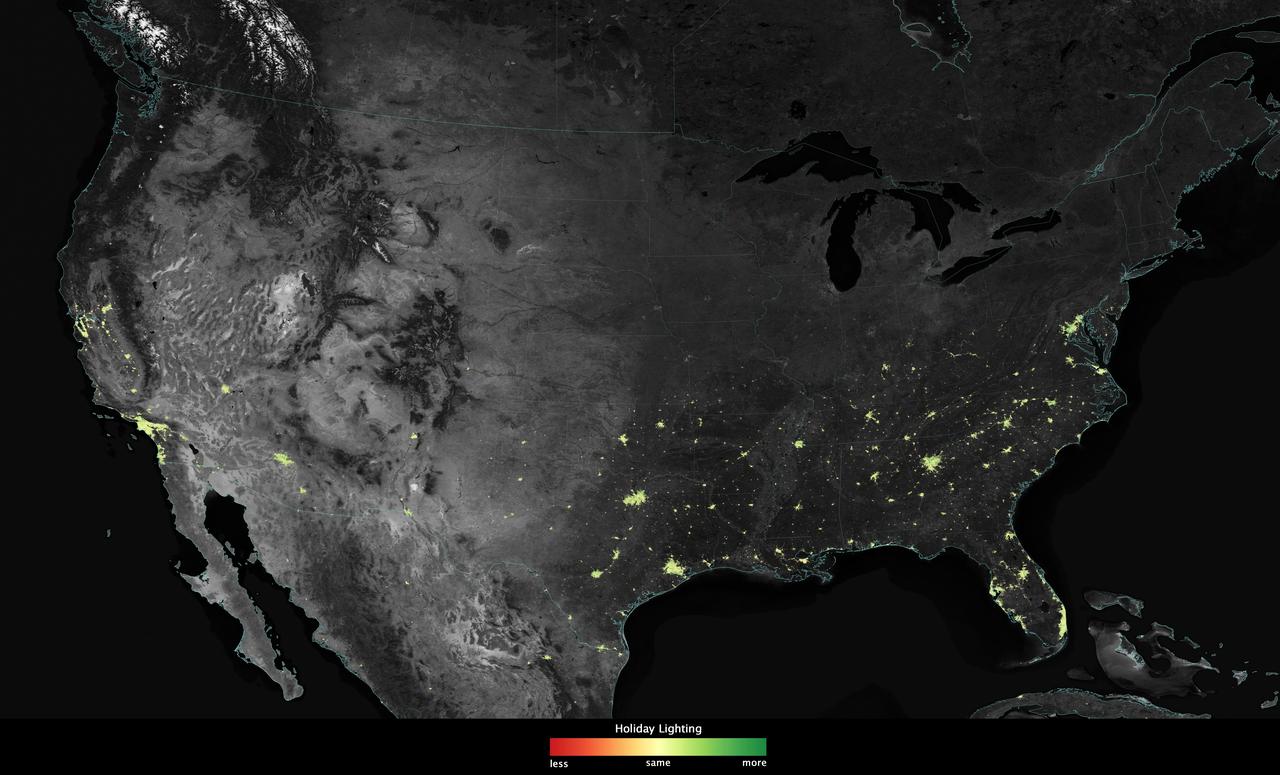
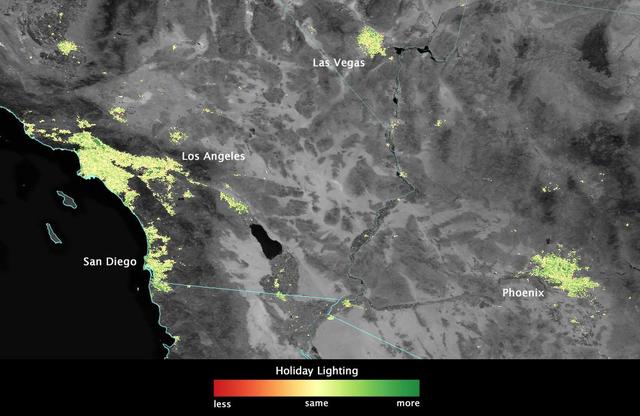
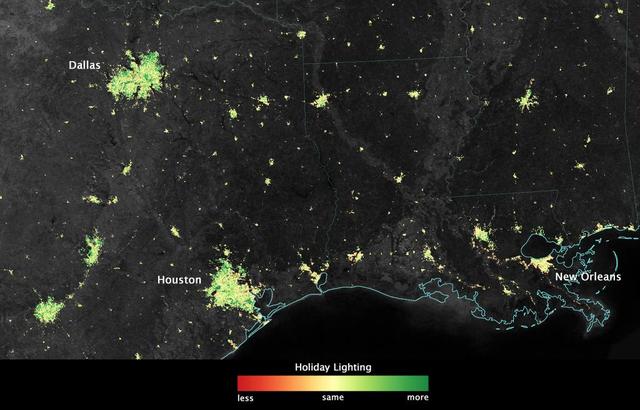
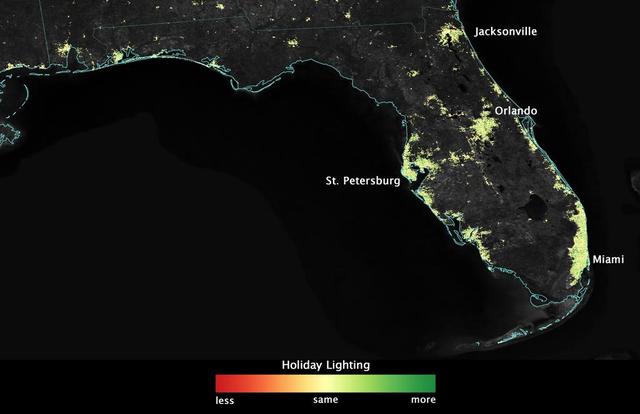
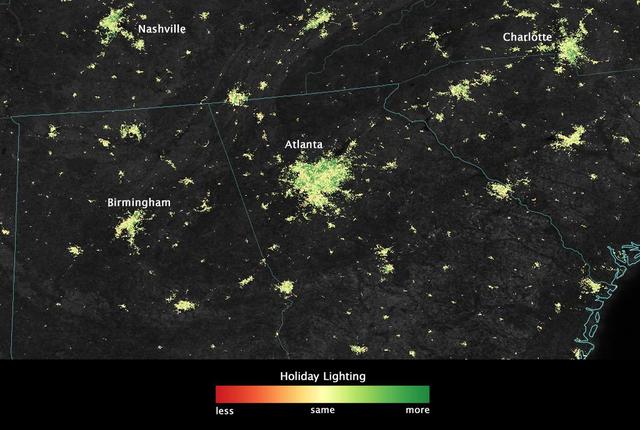
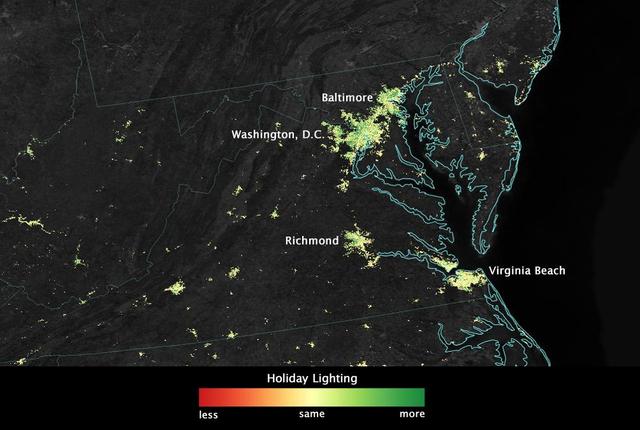
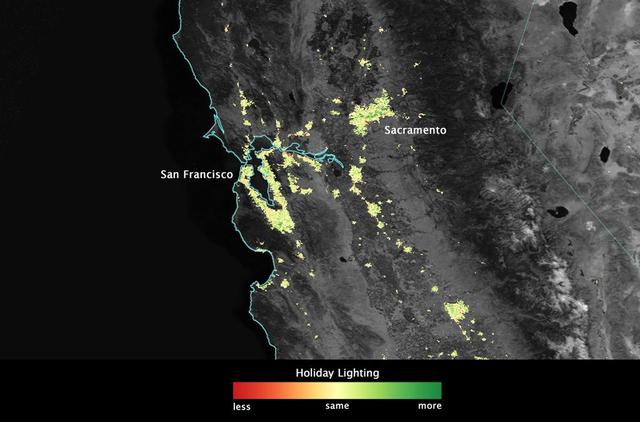
City lights shine brighter during the holidays in the United States when compared with the rest of the year, as shown using a new analysis of daily data from the NASA-NOAA Suomi NPP satellite. Dark green pixels are areas where lights are 50 percent brighter, or more, during December. Because snow reflects so much light, the researchers could only analyze snow-free cities. They focused on the U.S. West Coast from San Francisco and Los Angeles, and cities south of a rough imaginary line from St. Louis to Washington, D.C. Credit: Jesse Allen, NASA’s Earth Observatory Read more: <a href="http://www.nasa.gov/content/goddard/satellite-sees-holiday-lights-brighten-cities." rel="nofollow">www.nasa.gov/content/goddard/satellite-sees-holiday-light...</a>.<b><a href="http://www.nasa.gov/audience/formedia/features/MP_Photo_Guidelines.html" rel="nofollow">NASA image use policy.</a></b> <b><a href="http://www.nasa.gov/centers/goddard/home/index.html" rel="nofollow">NASA Goddard Space Flight Center</a></b> enables NASA’s mission through four scientific endeavors: Earth Science, Heliophysics, Solar System Exploration, and Astrophysics. Goddard plays a leading role in NASA’s accomplishments by contributing compelling scientific knowledge to advance the Agency’s mission. <b>Follow us on <a href="http://twitter.com/NASAGoddardPix" rel="nofollow">Twitter</a></b> <b>Like us on <a href="http://www.facebook.com/pages/Greenbelt-MD/NASA-Goddard/395013845897?ref=tsd" rel="nofollow">Facebook</a></b> <b>Find us on <a href="http://instagram.com/nasagoddard?vm=grid" rel="nofollow">Instagram</a></b>
City lights shine brighter during the holidays in the United States when compared with the rest of the year, as shown using a new analysis of daily data from the NASA-NOAA Suomi NPP satellite. Dark green pixels are areas where lights are 50 percent brighter, or more, during December. Because snow reflects so much light, the researchers could only analyze snow-free cities. They focused on the U.S. West Coast from San Francisco and Los Angeles, and cities south of a rough imaginary line from St. Louis to Washington, D.C. Credit: Jesse Allen, NASA’s Earth Observatory Read more: <a href="http://www.nasa.gov/content/goddard/satellite-sees-holiday-lights-brighten-cities." rel="nofollow">www.nasa.gov/content/goddard/satellite-sees-holiday-light...</a>.<b><a href="http://www.nasa.gov/audience/formedia/features/MP_Photo_Guidelines.html" rel="nofollow">NASA image use policy.</a></b> <b><a href="http://www.nasa.gov/centers/goddard/home/index.html" rel="nofollow">NASA Goddard Space Flight Center</a></b> enables NASA’s mission through four scientific endeavors: Earth Science, Heliophysics, Solar System Exploration, and Astrophysics. Goddard plays a leading role in NASA’s accomplishments by contributing compelling scientific knowledge to advance the Agency’s mission. <b>Follow us on <a href="http://twitter.com/NASAGoddardPix" rel="nofollow">Twitter</a></b> <b>Like us on <a href="http://www.facebook.com/pages/Greenbelt-MD/NASA-Goddard/395013845897?ref=tsd" rel="nofollow">Facebook</a></b> <b>Find us on <a href="http://instagram.com/nasagoddard?vm=grid" rel="nofollow">Instagram</a></b>
City lights shine brighter during the holidays in the United States when compared with the rest of the year, as shown using a new analysis of daily data from the NASA-NOAA Suomi NPP satellite. Dark green pixels are areas where lights are 50 percent brighter, or more, during December. Because snow reflects so much light, the researchers could only analyze snow-free cities. They focused on the U.S. West Coast from San Francisco and Los Angeles, and cities south of a rough imaginary line from St. Louis to Washington, D.C. Credit: Jesse Allen, NASA’s Earth Observatory Read more: <a href="http://www.nasa.gov/content/goddard/satellite-sees-holiday-lights-brighten-cities." rel="nofollow">www.nasa.gov/content/goddard/satellite-sees-holiday-light...</a>.<b><a href="http://www.nasa.gov/audience/formedia/features/MP_Photo_Guidelines.html" rel="nofollow">NASA image use policy.</a></b> <b><a href="http://www.nasa.gov/centers/goddard/home/index.html" rel="nofollow">NASA Goddard Space Flight Center</a></b> enables NASA’s mission through four scientific endeavors: Earth Science, Heliophysics, Solar System Exploration, and Astrophysics. Goddard plays a leading role in NASA’s accomplishments by contributing compelling scientific knowledge to advance the Agency’s mission. <b>Follow us on <a href="http://twitter.com/NASAGoddardPix" rel="nofollow">Twitter</a></b> <b>Like us on <a href="http://www.facebook.com/pages/Greenbelt-MD/NASA-Goddard/395013845897?ref=tsd" rel="nofollow">Facebook</a></b> <b>Find us on <a href="http://instagram.com/nasagoddard?vm=grid" rel="nofollow">Instagram</a></b>
City lights shine brighter during the holidays in the United States when compared with the rest of the year, as shown using a new analysis of daily data from the NASA-NOAA Suomi NPP satellite. Dark green pixels are areas where lights are 50 percent brighter, or more, during December. Because snow reflects so much light, the researchers could only analyze snow-free cities. They focused on the U.S. West Coast from San Francisco and Los Angeles, and cities south of a rough imaginary line from St. Louis to Washington, D.C. Credit: Jesse Allen, NASA’s Earth Observatory Read more: <a href="http://www.nasa.gov/content/goddard/satellite-sees-holiday-lights-brighten-cities." rel="nofollow">www.nasa.gov/content/goddard/satellite-sees-holiday-light...</a>.<b><a href="http://www.nasa.gov/audience/formedia/features/MP_Photo_Guidelines.html" rel="nofollow">NASA image use policy.</a></b> <b><a href="http://www.nasa.gov/centers/goddard/home/index.html" rel="nofollow">NASA Goddard Space Flight Center</a></b> enables NASA’s mission through four scientific endeavors: Earth Science, Heliophysics, Solar System Exploration, and Astrophysics. Goddard plays a leading role in NASA’s accomplishments by contributing compelling scientific knowledge to advance the Agency’s mission. <b>Follow us on <a href="http://twitter.com/NASAGoddardPix" rel="nofollow">Twitter</a></b> <b>Like us on <a href="http://www.facebook.com/pages/Greenbelt-MD/NASA-Goddard/395013845897?ref=tsd" rel="nofollow">Facebook</a></b> <b>Find us on <a href="http://instagram.com/nasagoddard?vm=grid" rel="nofollow">Instagram</a></b>
City lights shine brighter during the holidays in the United States when compared with the rest of the year, as shown using a new analysis of daily data from the NASA-NOAA Suomi NPP satellite. Dark green pixels are areas where lights are 50 percent brighter, or more, during December. Because snow reflects so much light, the researchers could only analyze snow-free cities. They focused on the U.S. West Coast from San Francisco and Los Angeles, and cities south of a rough imaginary line from St. Louis to Washington, D.C. Credit: Jesse Allen, NASA’s Earth Observatory Read more: <a href="http://www.nasa.gov/content/goddard/satellite-sees-holiday-lights-brighten-cities." rel="nofollow">www.nasa.gov/content/goddard/satellite-sees-holiday-light...</a>.<b><a href="http://www.nasa.gov/audience/formedia/features/MP_Photo_Guidelines.html" rel="nofollow">NASA image use policy.</a></b> <b><a href="http://www.nasa.gov/centers/goddard/home/index.html" rel="nofollow">NASA Goddard Space Flight Center</a></b> enables NASA’s mission through four scientific endeavors: Earth Science, Heliophysics, Solar System Exploration, and Astrophysics. Goddard plays a leading role in NASA’s accomplishments by contributing compelling scientific knowledge to advance the Agency’s mission. <b>Follow us on <a href="http://twitter.com/NASAGoddardPix" rel="nofollow">Twitter</a></b> <b>Like us on <a href="http://www.facebook.com/pages/Greenbelt-MD/NASA-Goddard/395013845897?ref=tsd" rel="nofollow">Facebook</a></b> <b>Find us on <a href="http://instagram.com/nasagoddard?vm=grid" rel="nofollow">Instagram</a></b>
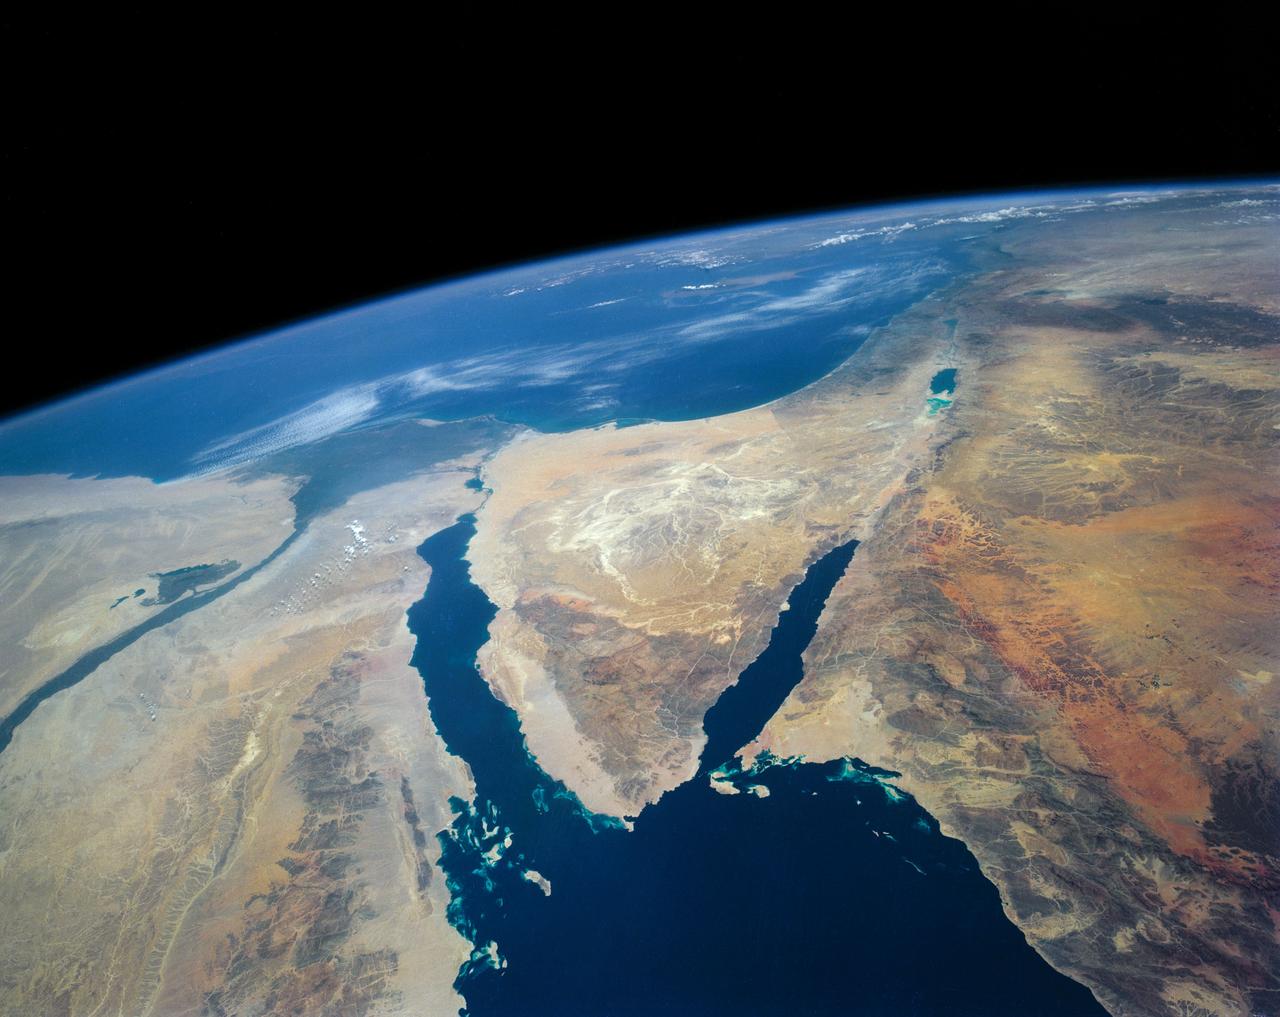
STS040-152-180 (5-24 June 1991) --- The Sinai Peninsula dominates this north-looking, oblique view. According to NASA photo experts studying the STS 40 imagery, the Red Sea in the foreground is clear of river sediment because of the prevailing dry climate of the Middle East. The great rift of the Gulf of Aqaba extends northward to Turkey (top right) through the Dead Sea. The international boundary between Israel and Egypt, reflecting different rural landscapes, stands out clearly. The Nile River runs through the frame. NASA photo experts believe the haze over the Mediterranean to be wind-borne dust. The photo was taken with an Aero-Linhof large format camera.
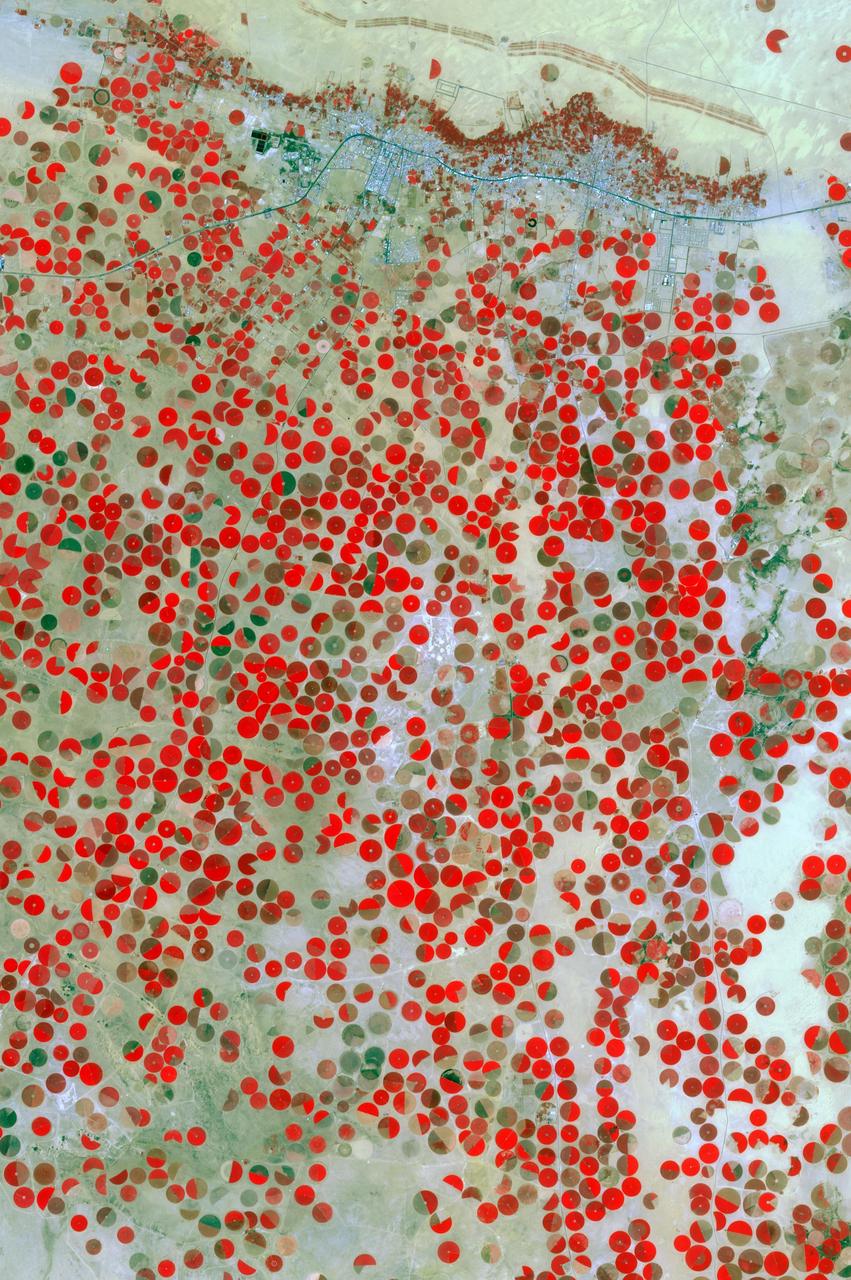
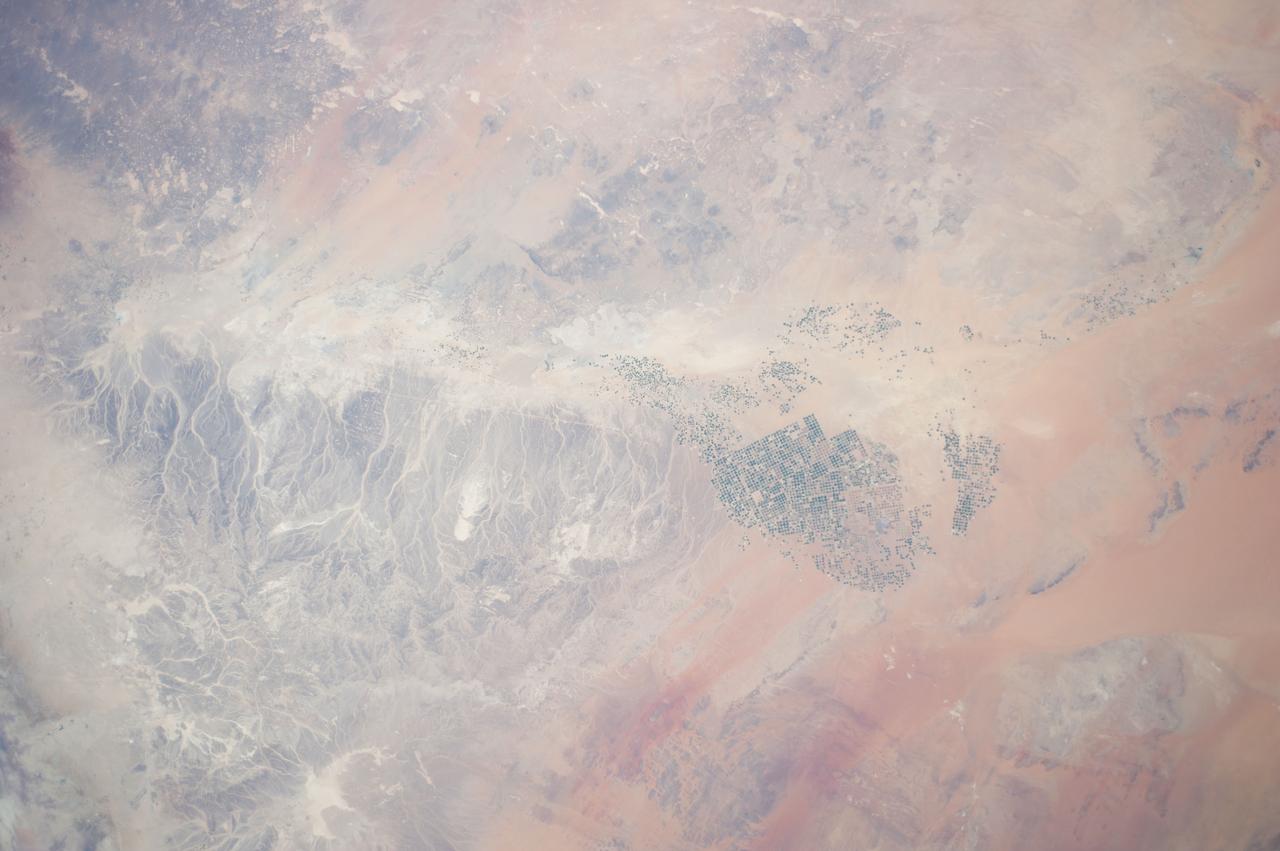
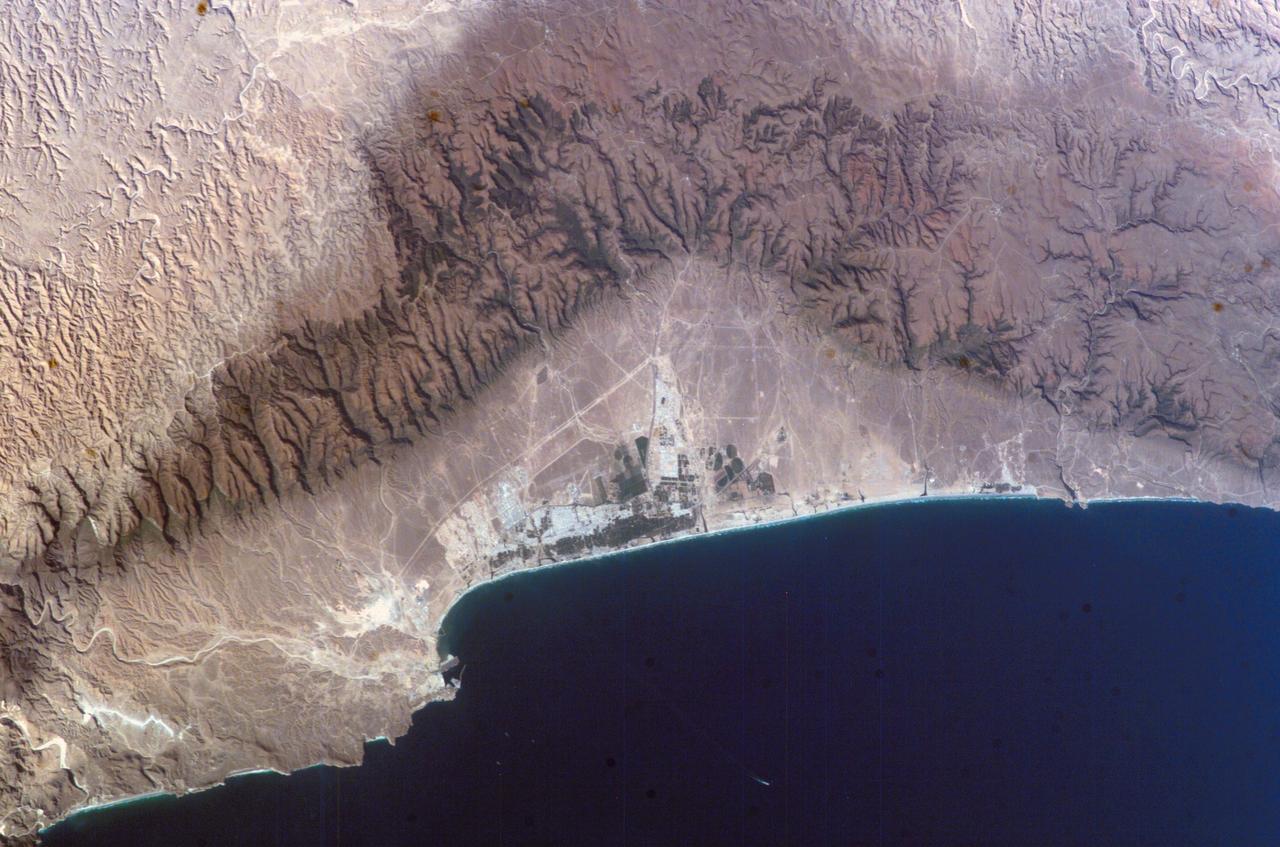
In the middle of the Arabian desert the city Green Oasis Wadi Al Dawasir is being developed as a new urban center for the Wadi Al Dawasir region of Saudi Arabia, as shown in this image from NASA Terra spacecraft. Huge solar fields supply the entire city and the surrounding region with energy. Hundreds of circular agricultural fields are fed by center pivot irrigation apparatus, drawing water from subterranean aquifers. The image was acquired March 30, 2013, covers an area of 30 x 45 km, and is located at 20.2 degrees north, 44.8 degrees east. http://photojournal.jpl.nasa.gov/catalog/PIA20077
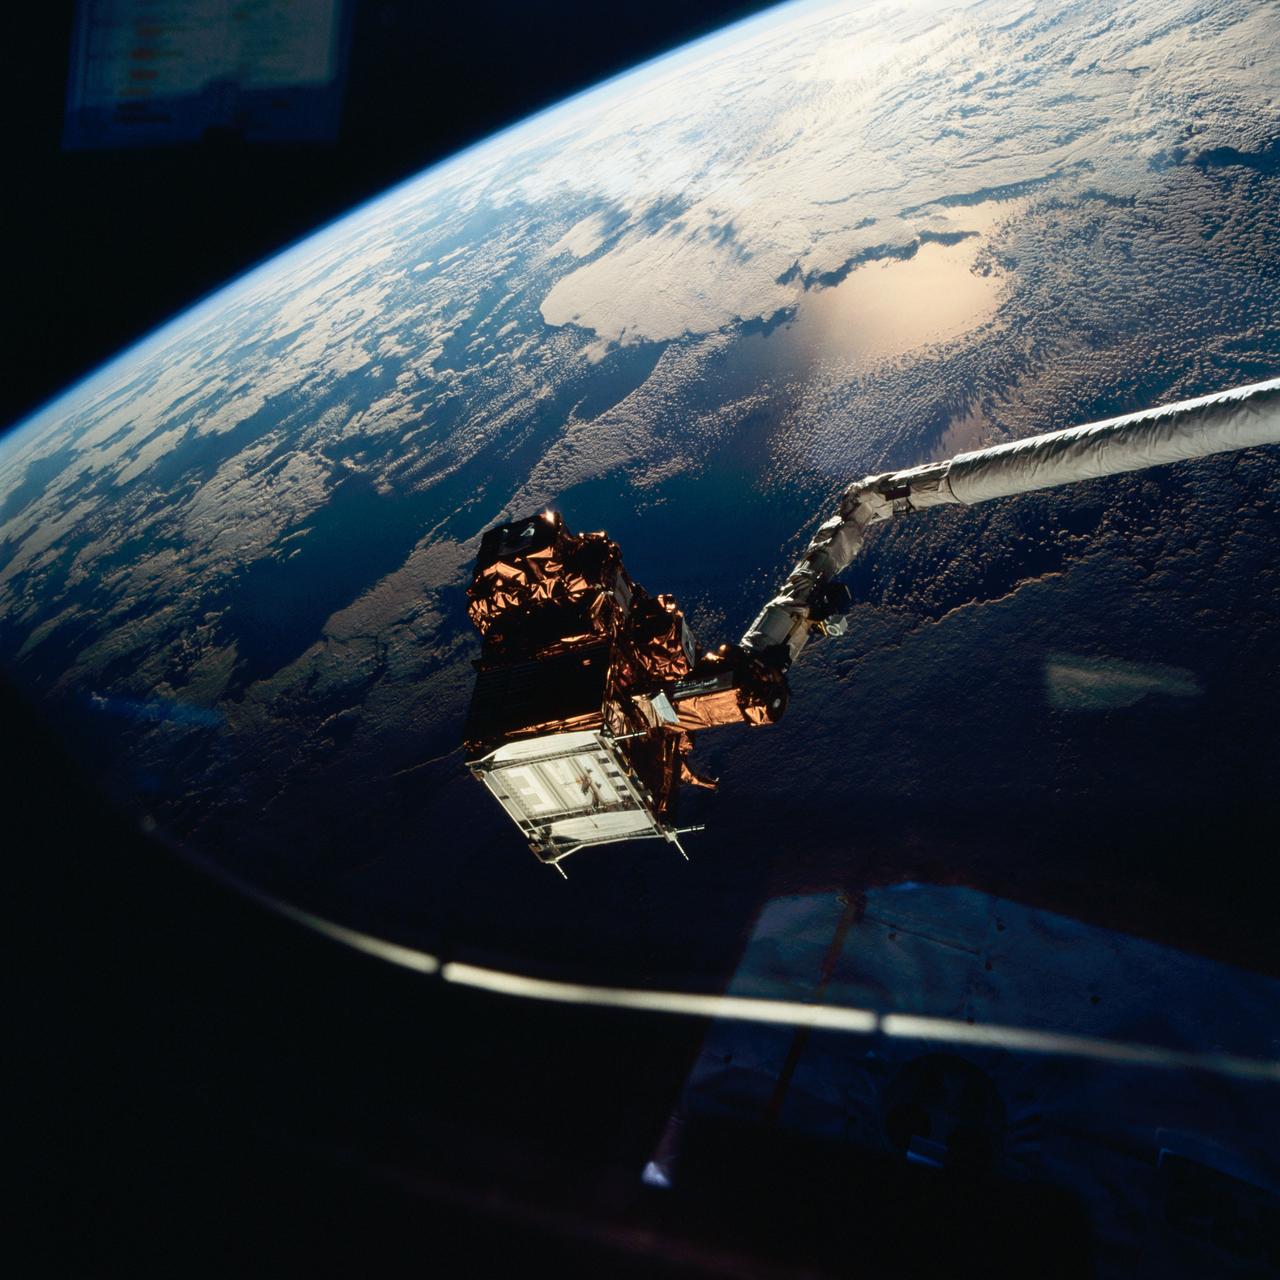
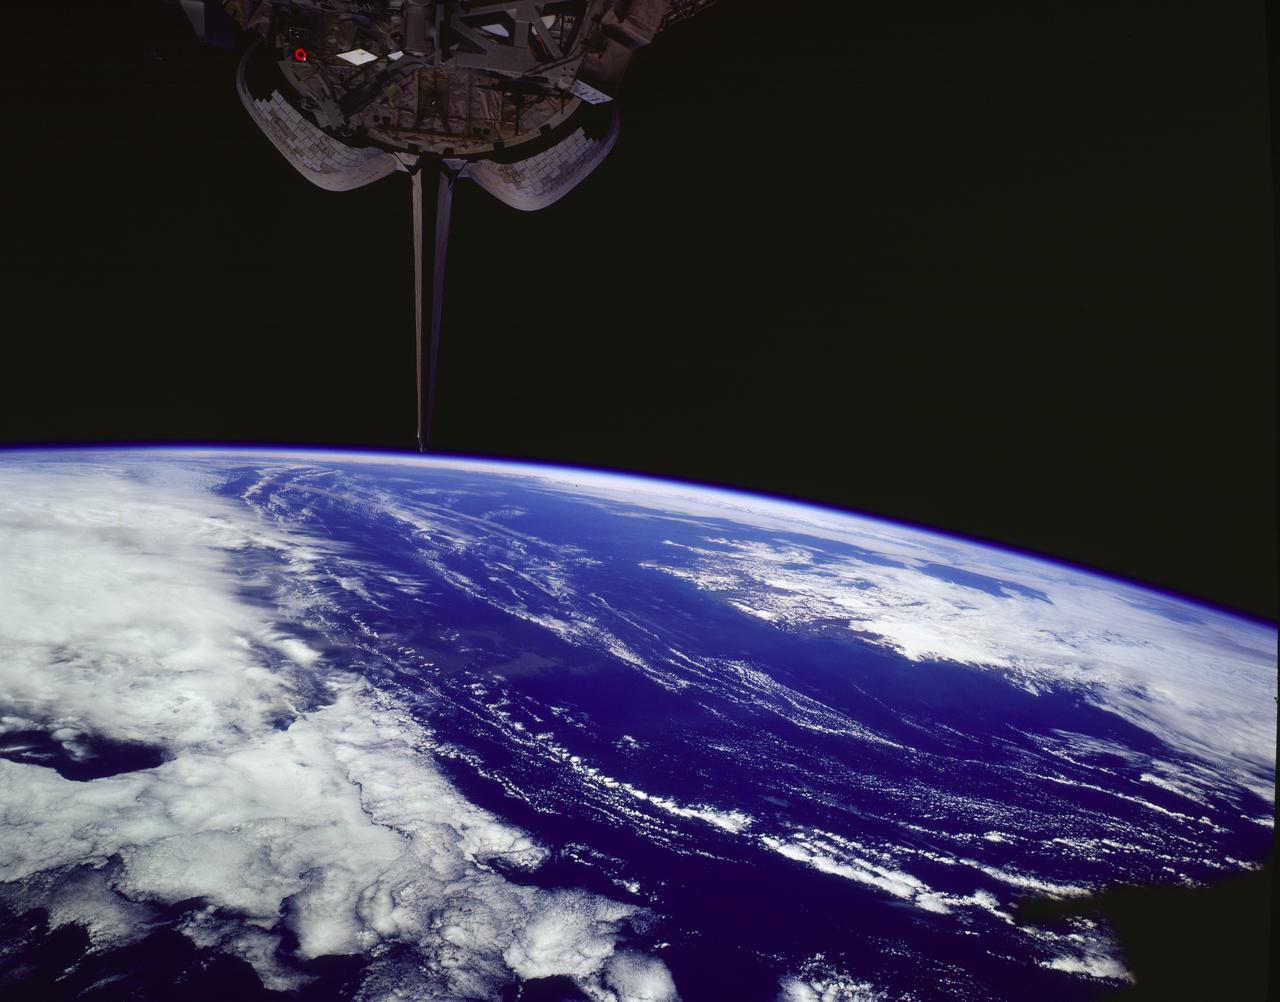
STS077-711-054 (21 May 1996) --- The Spartan 207 free flyer is held in the grasp of the Remote Manipulator System (RMS). As photographed through an overhead window on the Space Shuttle Endeavour?s aft flight deck, the satellite is backdropped against a heavily sunglinted horizon over the Middle East. The Spartan was re-captured by the six crew members on May 21, 1996 following a period of free-flight. The Endeavour crew spent a portion of the flight time in various activities involving the Spartan 207 and the related Inflatable Antenna Experiment (IAE). The Spartan project is managed by NASA?s Goddard Space Flight Center for NASA?s Office of Space Science, Washington, D.C.
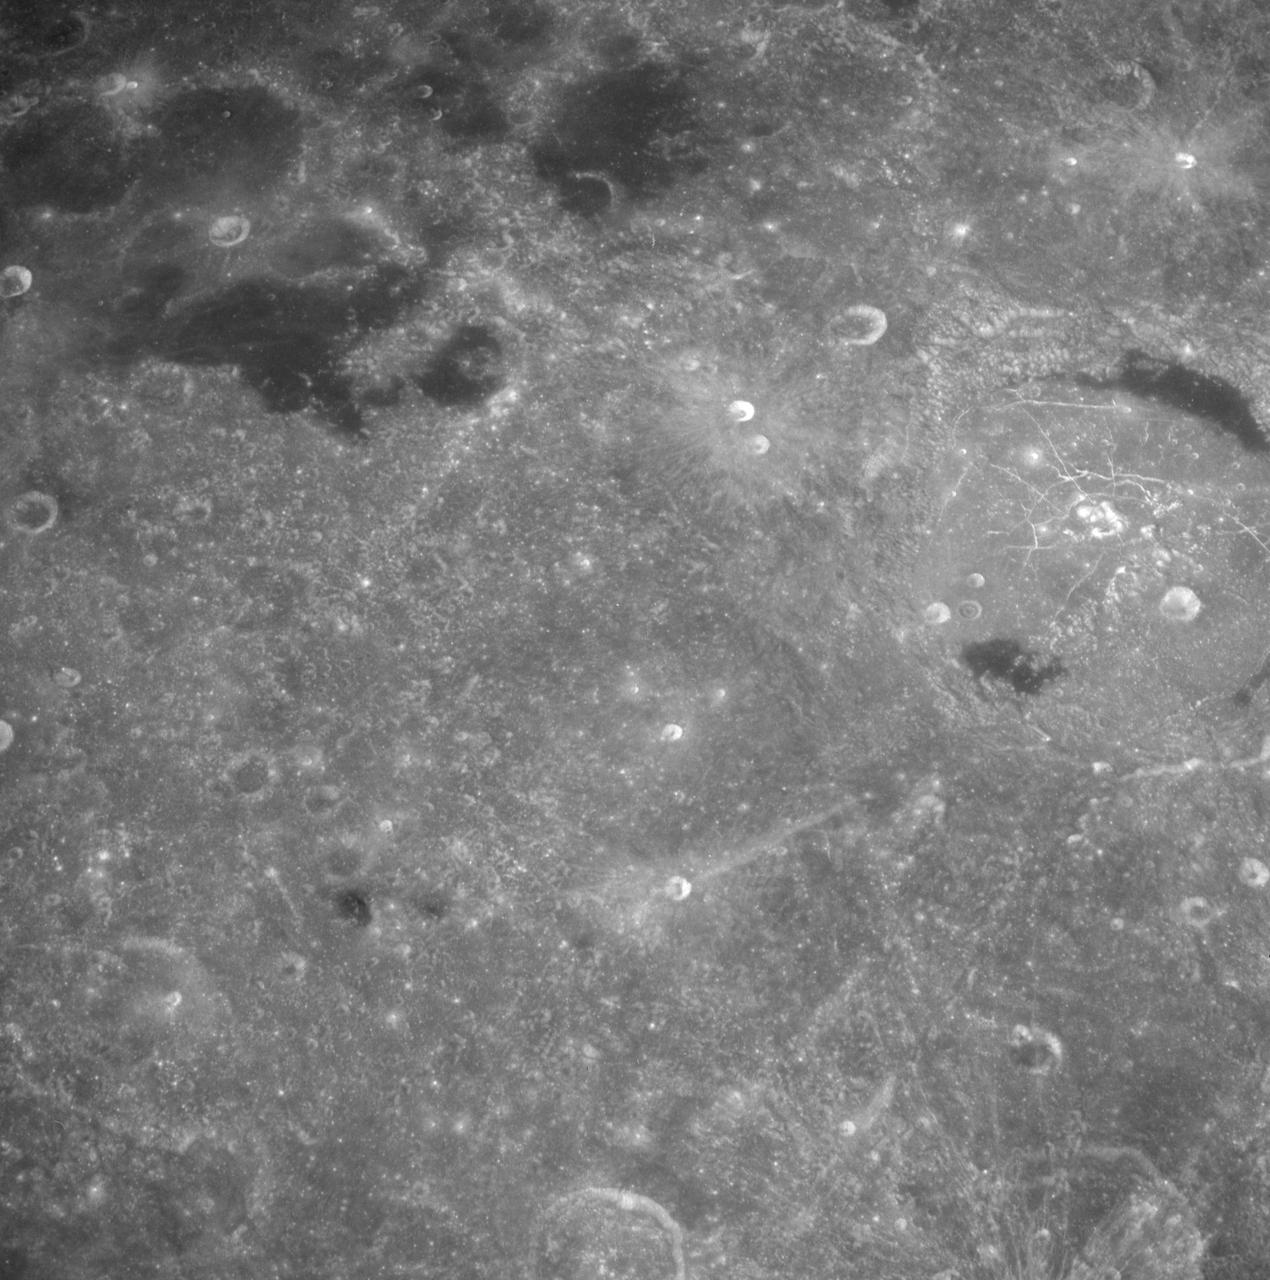
AS08-12-2193 (21-27 Dec. 1968) --- View of the lunar surface taken from the Apollo 8 spacecraft looking southward from high altitude across the Southern Sea. (Hold picture with AS8 number in upper right corner). The bright-rayed crater near the horizon is located near 130 degrees east longitude and 70 degrees south latitude. The dark-floored crater near the middle of the right side of the photograph is about 70 kilometers (45 statute miles) in diameter. Both features are beyond the eastern limb of the moon as viewed from Earth; neither has a name.
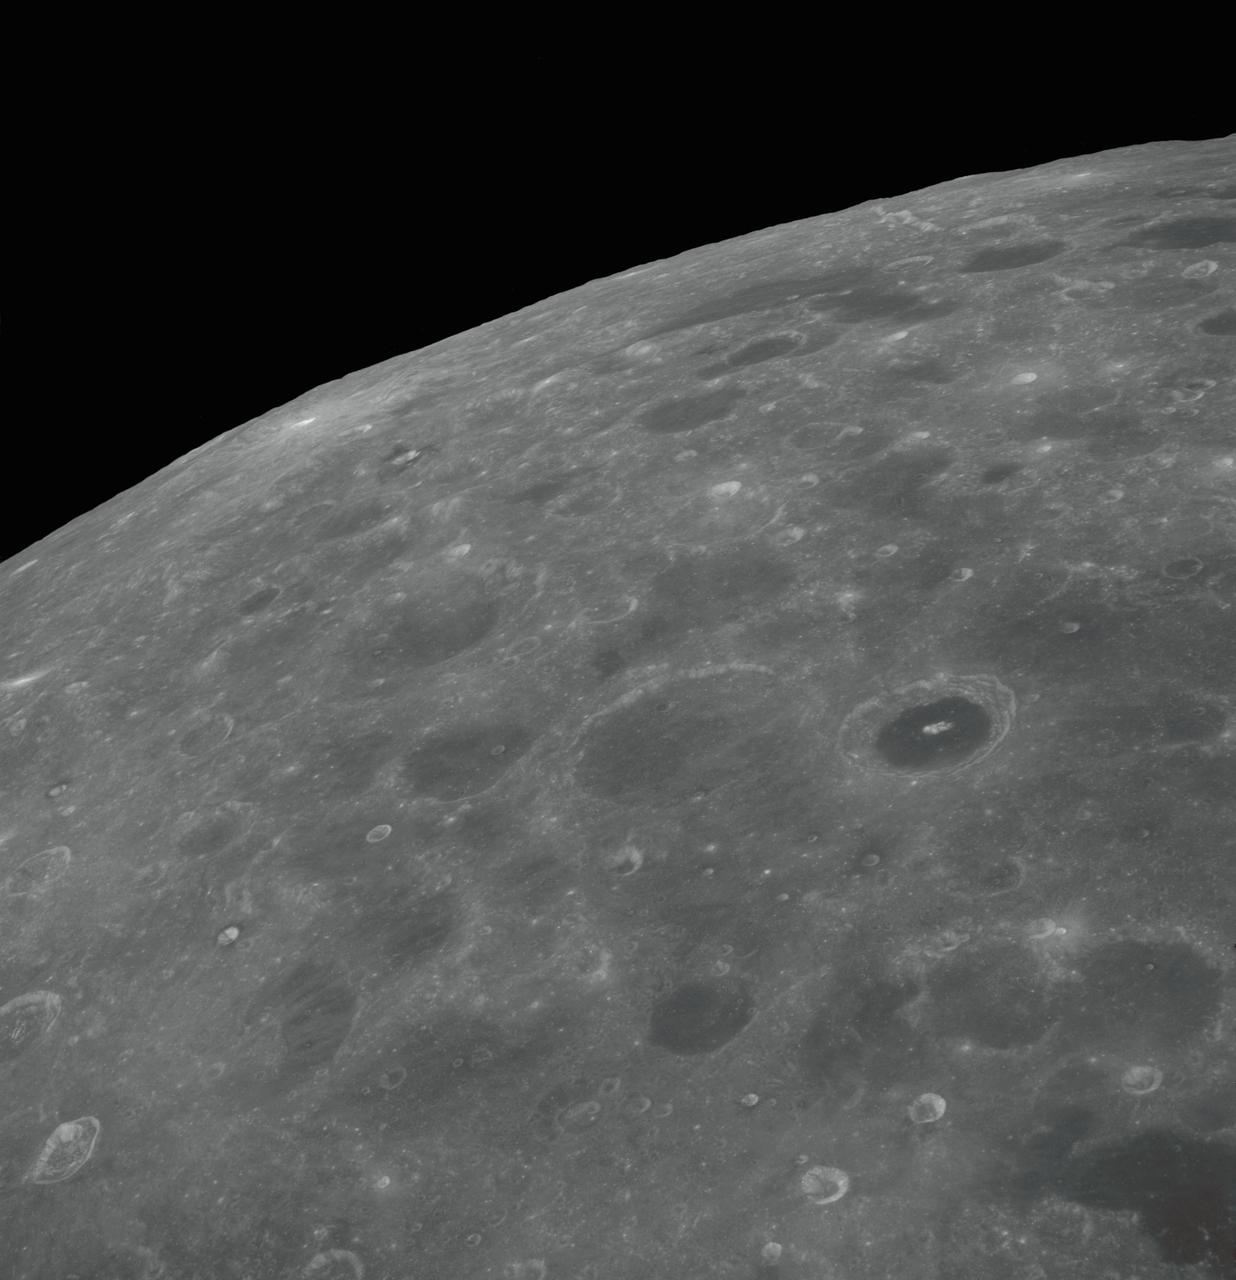
AS08-12-2192 (21-27 Dec. 1968) --- View of the lunar surface taken from the Apollo 8 spacecraft looking southward from high altitude across the Southern Sea. (Hold picture with AS8 number in upper right corner). The bright-rayed crater near the horizon is located near 130 degrees east longitude and 70 degrees south latitude. The dark-floored crater near the middle of the right side of the photograph is about 70 kilometers (45 statute miles) in diameter. Both features are beyond the eastern limb of the moon as viewed from Earth; neither has a name.
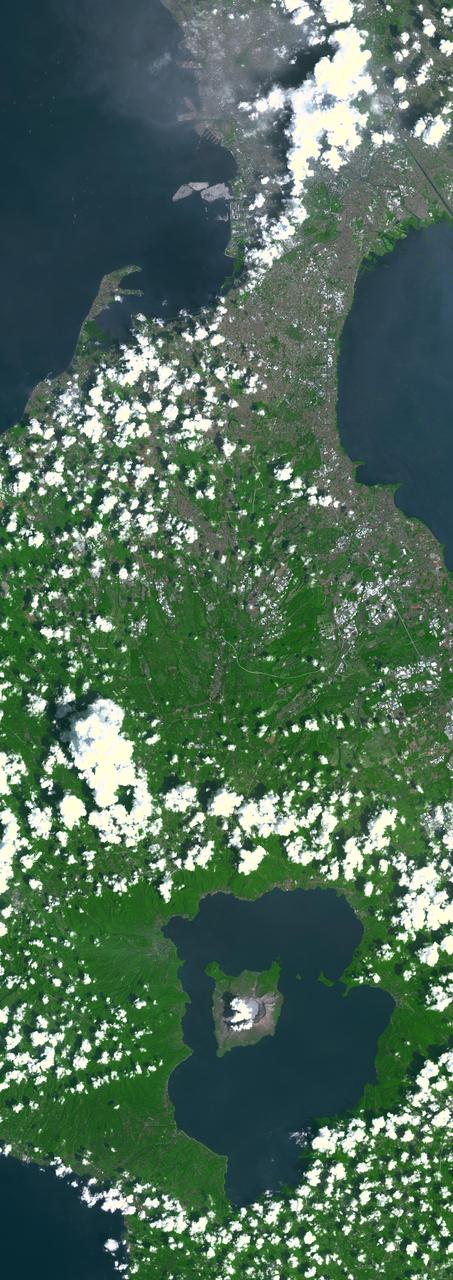
Taal Volcano in the Philippines is about 50 km south of Manila (top of image). It is the second most active volcano in the country, with 38 recorded historic eruptions. The caldera is filled by Taal Lake; Volcano Island is the active cone in the middle of the lake (bottom of image). Eruptions have occurred every year since 2019, with ash and sulfur dioxide vog at times reaching Manila. (Credit: Wikipedia) The image was acquired October 8, 2024, covers an area of 33 by 92.2 km, and is located at 14 degrees north, 121 degrees east. https://photojournal.jpl.nasa.gov/catalog/PIA26506
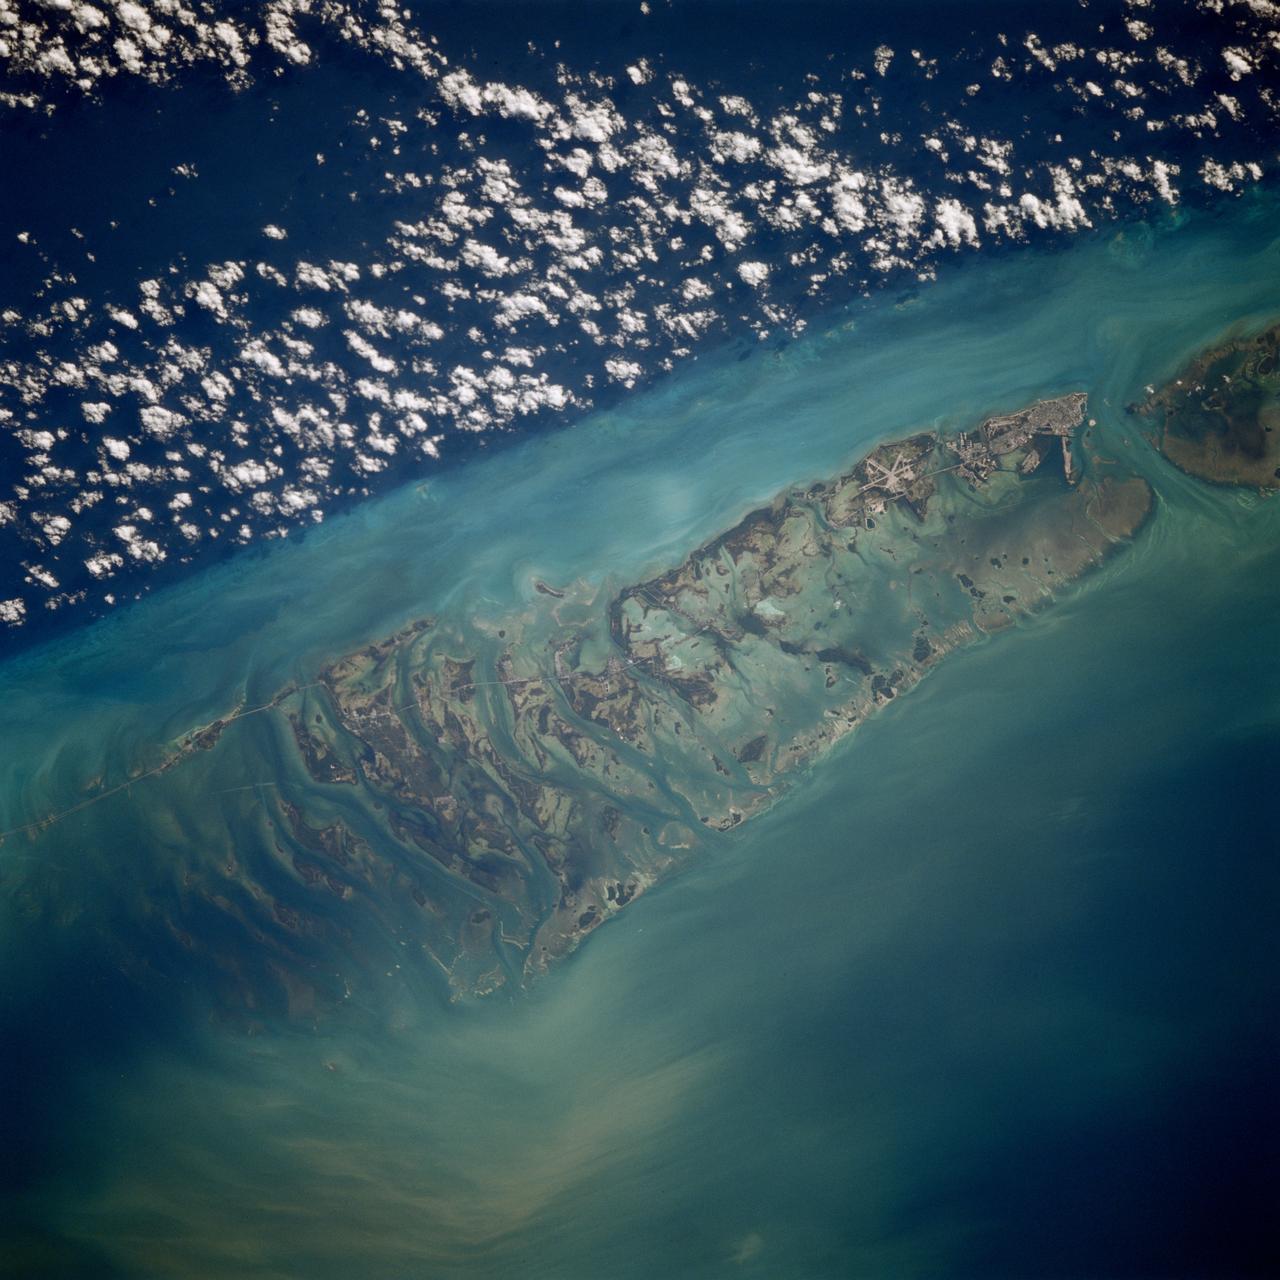
STS080-709-094 (19 Nov.-7 Dec. 1996) --- This is a view of the western portion of the Florida Keys. The view shows the city of Key West, bottom mid-right, with Marathon Key, near top middle left, and the edge of the Straits of Florida, the dark water on the right edge. Clouds form over the cooler waters of the strait. The runways at Boca Chica Key Naval Air Station are seen near Key West. The bottom can be seen clearly in the shallow water, the deeper water has depths of over a half a mile. The thin line of the Overseas Highway can be traced east from Key West. Prior to a hurricane in 1935, this route was a railway line.
City lights shine brighter during the holidays in the United States when compared with the rest of the year, as shown using a new analysis of daily data from the NASA-NOAA Suomi NPP satellite. Dark green pixels are areas where lights are 50 percent brighter, or more, during December. Because snow reflects so much light, the researchers could only analyze snow-free cities. They focused on the U.S. West Coast from San Francisco and Los Angeles, and cities south of a rough imaginary line from St. Louis to Washington, D.C. Credit: Jesse Allen, NASA’s Earth Observatory Read more: <a href="http://www.nasa.gov/content/goddard/satellite-sees-holiday-lights-brighten-cities." rel="nofollow">www.nasa.gov/content/goddard/satellite-sees-holiday-light...</a>.<b><a href="http://www.nasa.gov/audience/formedia/features/MP_Photo_Guidelines.html" rel="nofollow">NASA image use policy.</a></b> <b><a href="http://www.nasa.gov/centers/goddard/home/index.html" rel="nofollow">NASA Goddard Space Flight Center</a></b> enables NASA’s mission through four scientific endeavors: Earth Science, Heliophysics, Solar System Exploration, and Astrophysics. Goddard plays a leading role in NASA’s accomplishments by contributing compelling scientific knowledge to advance the Agency’s mission. <b>Follow us on <a href="http://twitter.com/NASAGoddardPix" rel="nofollow">Twitter</a></b> <b>Like us on <a href="http://www.facebook.com/pages/Greenbelt-MD/NASA-Goddard/395013845897?ref=tsd" rel="nofollow">Facebook</a></b> <b>Find us on <a href="http://instagram.com/nasagoddard?vm=grid" rel="nofollow">Instagram</a></b>
City lights shine brighter during the holidays in the United States when compared with the rest of the year, as shown using a new analysis of daily data from the NASA-NOAA Suomi NPP satellite. Dark green pixels are areas where lights are 50 percent brighter, or more, during December. Because snow reflects so much light, the researchers could only analyze snow-free cities. They focused on the U.S. West Coast from San Francisco and Los Angeles, and cities south of a rough imaginary line from St. Louis to Washington, D.C. Credit: Jesse Allen, NASA’s Earth Observatory Read more: <a href="http://www.nasa.gov/content/goddard/satellite-sees-holiday-lights-brighten-cities." rel="nofollow">www.nasa.gov/content/goddard/satellite-sees-holiday-light...</a>.<b><a href="http://www.nasa.gov/audience/formedia/features/MP_Photo_Guidelines.html" rel="nofollow">NASA image use policy.</a></b> <b><a href="http://www.nasa.gov/centers/goddard/home/index.html" rel="nofollow">NASA Goddard Space Flight Center</a></b> enables NASA’s mission through four scientific endeavors: Earth Science, Heliophysics, Solar System Exploration, and Astrophysics. Goddard plays a leading role in NASA’s accomplishments by contributing compelling scientific knowledge to advance the Agency’s mission. <b>Follow us on <a href="http://twitter.com/NASAGoddardPix" rel="nofollow">Twitter</a></b> <b>Like us on <a href="http://www.facebook.com/pages/Greenbelt-MD/NASA-Goddard/395013845897?ref=tsd" rel="nofollow">Facebook</a></b> <b>Find us on <a href="http://instagram.com/nasagoddard?vm=grid" rel="nofollow">Instagram</a></b>
This portion of a Magellan radar image strip shows a small region on Venus 20 km (12.4 mi.) wide and 75 km (50 mi.) long on the east flank of a major volcanic upland called Beta Regio. The image is centerd at 23 degrees north latitude and 286.7 degrees east longitude. The ridge and valley networkin the middle part of the image is formed by intersection faults which have broken the Venusian crust into a clomplex, deformed type of surface called tessera, the Latin word for tile. The parallel mountains and valleys resemble the Basin and Range Province in the western United States. The irregular dark patch near the top of the image is a smooth surface, probably formed by lava flows in a region about 10 km (6 mi.) across. Similar dark surfaces within the valleys indicate lava flows that are younger than the tessera giving an indication of the geologic time relationships of the events that formed the present surface. The image has a resolution of 120 meters (400 feet).
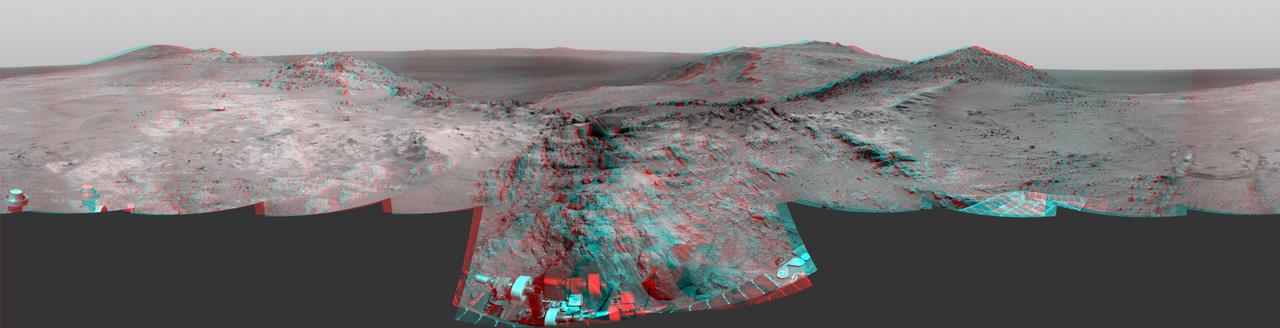
Cumulative driving by NASA's Mars Exploration Rover Opportunity surpassed marathon distance on March 24, 2015, as the rover neared a destination called "Marathon Valley," which is middle ground of this stereo view from early March. The scene appears three-dimensional when viewed through blue-red glasses with the red lens on the left. Olympic marathon distance is 26.219 miles (42.195 kilometers). The left-eye and right-eye cameras of Opportunity's navigation camera collected the component images of this scene during the 3,948th and 3,949th Martian days, or sols, of the rover's work on Mars (March 3 and 4, 2015). The view is centered toward the east-southeast, from a location on Endeavour Crater's western rim overlooking Marathon Valley, with the floor of Endeavour beyond, and the eastern rim in the distance. In the foreground at center, Opportunity's robotic arm is positioned for examination of a blocky rock called "Sergeant Charles Floyd." http://photojournal.jpl.nasa.gov/catalog/PIA19156
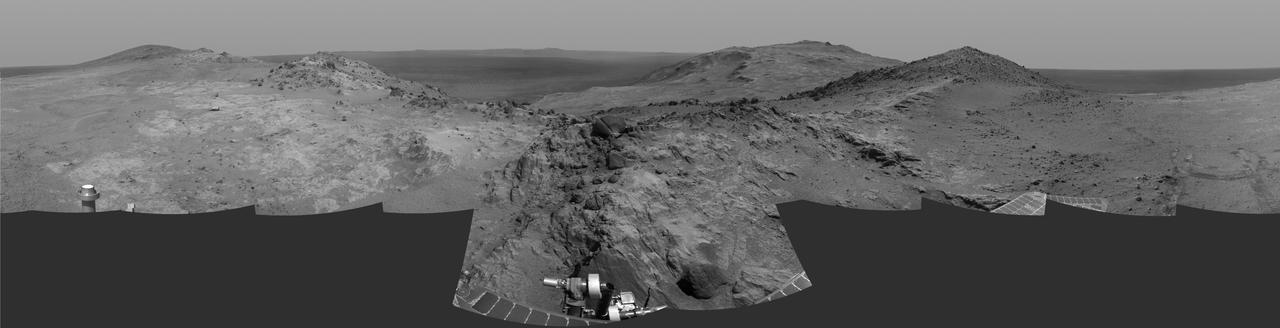
Cumulative driving by NASA's Mars Exploration Rover Opportunity surpassed marathon distance on March 24, 2015, as the rover neared a destination called "Marathon Valley," which is middle ground of this dramatic view from early March. Olympic marathon distance is 26.219 miles (42.195 kilometers). Opportunity's navigation camera collected the component images of this scene during the 3,948th and 3,949th Martian days, or sols, of the rover's work on Mars (March 3 and 4, 2015). The view is centered toward the east-southeast, from a location on Endeavour Crater's western rim overlooking Marathon Valley, with the floor of Endeavour beyond, and the eastern rim in the distance. In the foreground at center, Opportunity's robotic arm is positioned for examination of a blocky rock called "Sergeant Charles Floyd." http://photojournal.jpl.nasa.gov/catalog/PIA19155
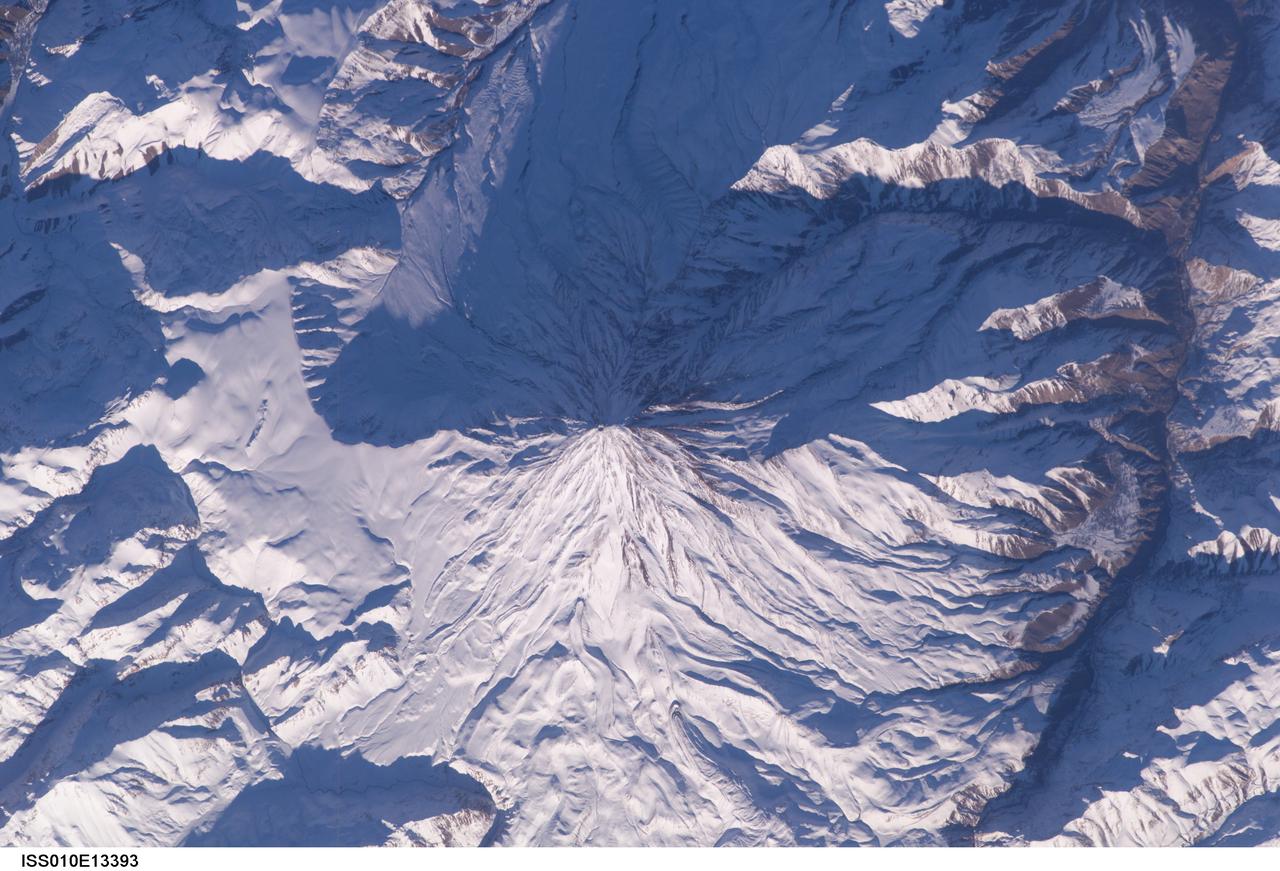
ISS010-E-13393 (15 January 2005) --- Mt. Damavand, Iran is featured in this image photographed by an Expedition 10 crewmember on the International Space Station (ISS). Located approximately 50 kilometers to the northeast of Tehran, Mt. Damavand is an impressive stratovolcano that reaches 5,670 meters (18,598 feet) in elevation. Damavand, which is part of the Alborz mountain range that borders the Caspian Sea to the north, is believed by scientists to be a young volcano that has mostly formed during the Holocene Epoch (over approximately the last 10,000 years). The western flank of the volcano includes solidified lava flows with flow levees – “walls” formed as the side edges of flowing lava cooled rapidly, forming a chute that channeled the hotter interior lava. Two such flows with well-defined levees are highlighted by snow on the mountainside (center). Damavand is the highest peak in Iran and the highest volcano in the Middle East.
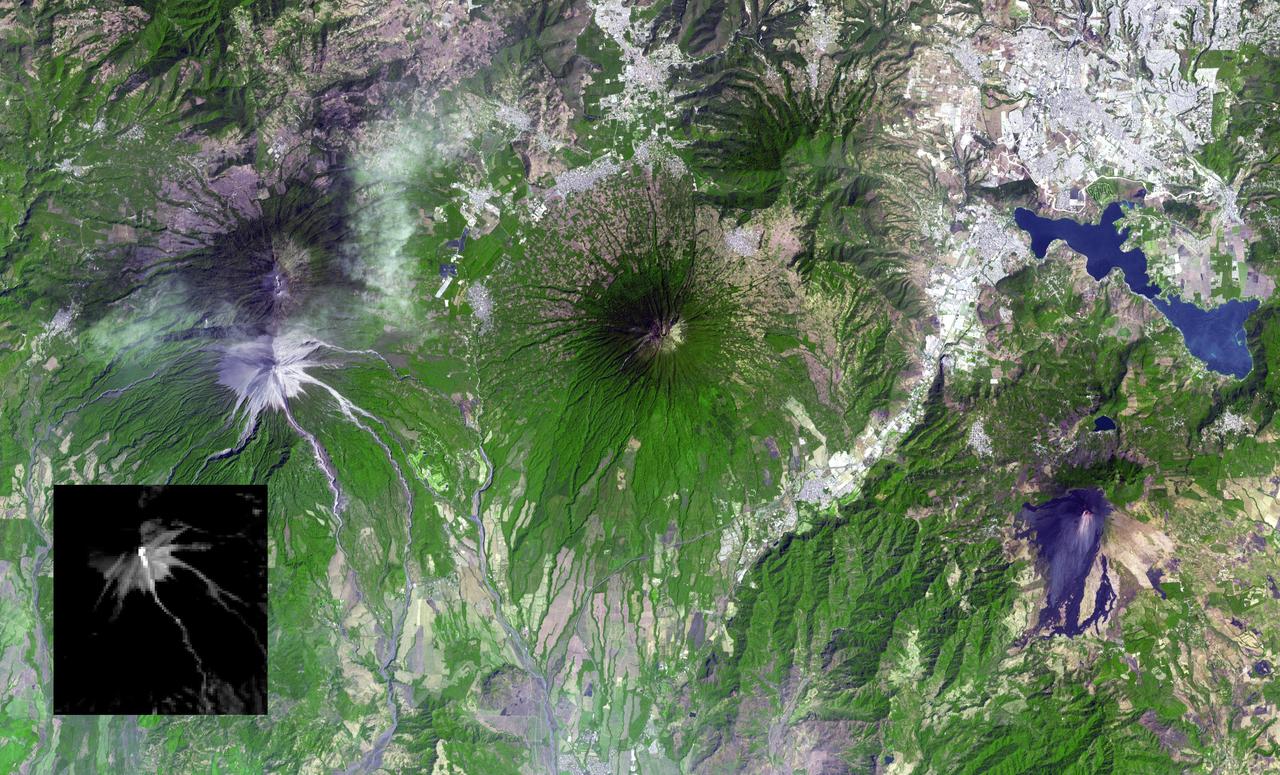
Guatemala's Fuego volcano continued its frequent moderate eruptions in early February 2015. Pyroclastic flows from the eruptions descended multiple drainages, and the eruptions sent ash plumes spewing over Guatemala City 22 miles (35 kilometers) away, and forced closure of the international airport. The Advanced Spaceborne Thermal Emission and Reflection Radiometer (ASTER) instrument onboard NASA's Terra spacecraft captured a new image of the region on February 17. Fuego is on the left side of the image. The thermal infrared inset image shows the summit crater activity (white equals hot), and remnant heat in the flows on the flank. Other active volcanoes shown in the image are Acatenango close by to the north, Volcano de Agua in the middle of the image, and Pacaya volcano to the east. The image covers an area of 19 by 31 miles (30 by 49.5 kilometers), and is located at 14.5 degrees north, 90.9 degrees west. http://photojournal.jpl.nasa.gov/catalog/PIA19297
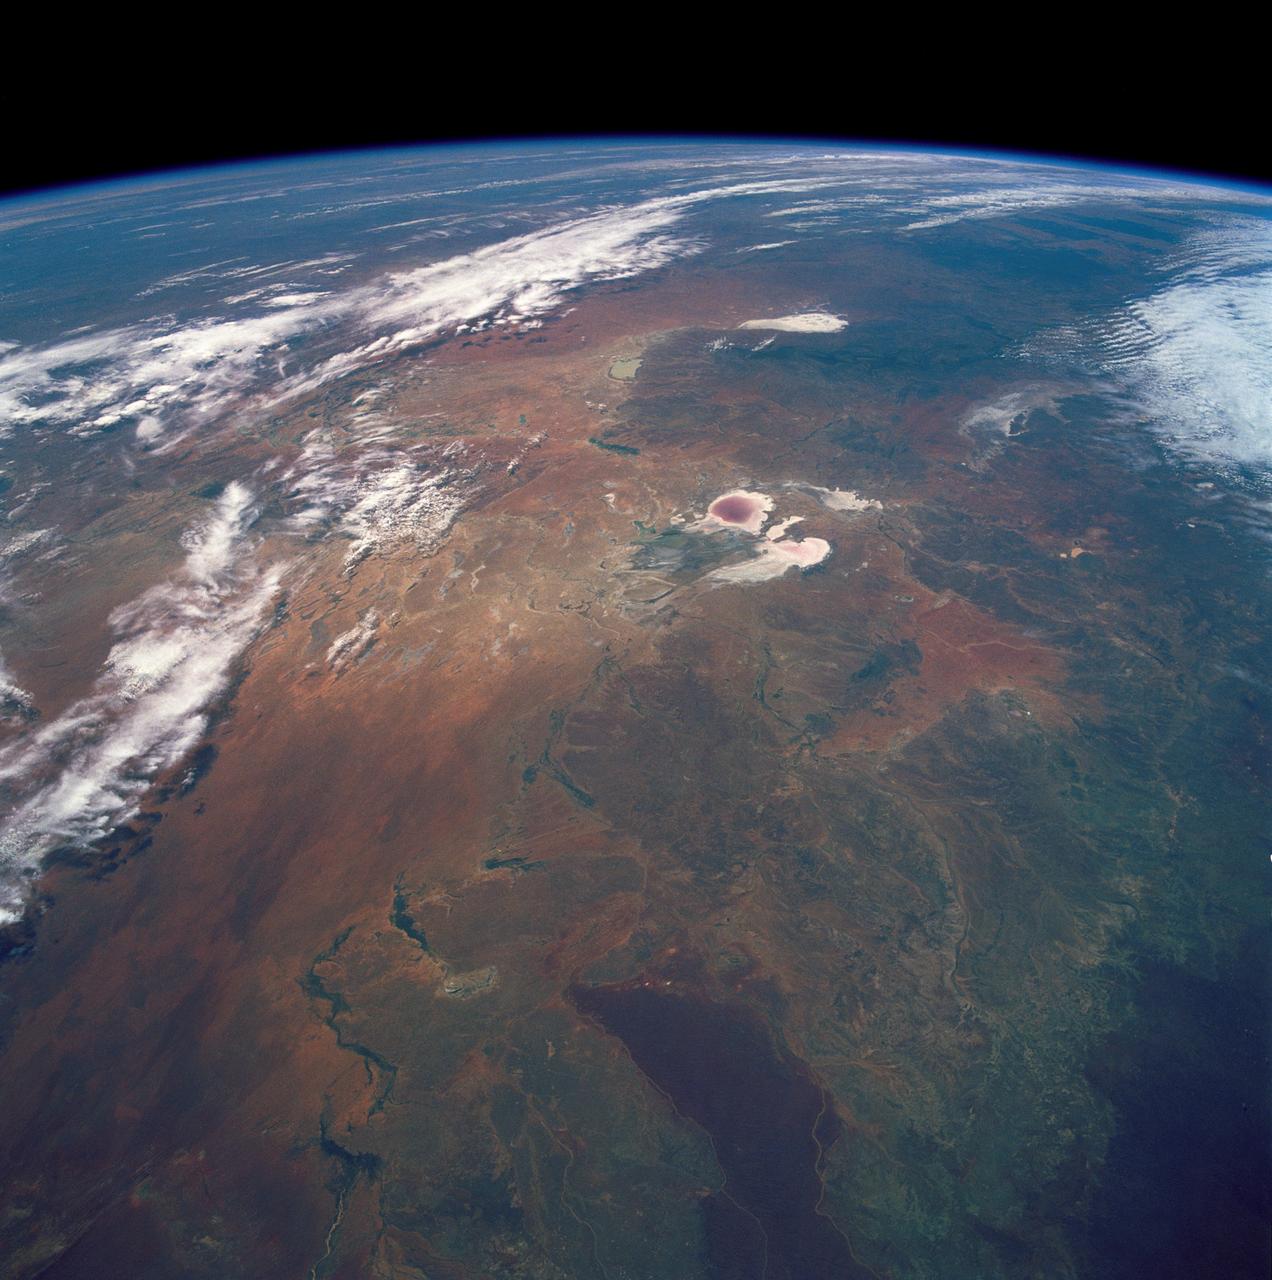
STS035-501-007 (2-10 Dec. 1990) --- The STS-35 crewmembers aboard the Earth-orbiting Space Shuttle Columbia photographed this view of the Arid Simpson Desert of Australia with a handheld Rolleiflex camera. Lake Eyre is normally dry; however, the STS-35 crew was able to recognize water in the lowest parts of the lake (dark pink area) and possibly in Lake Blanche east of Lake Eyre. Lake Frome lies in the distance separated from Lake Torrens (top right) by dark hills of Flinders Range. The Finke River (bottom left to middle) flows into the Eyre basin from the northwest. Although it is the largest river entering the basin, Finke's floods seldom reach Lake Eyre. The dark brown patch in the foreground is an area of ancient, brown lateritic soils partly covered by dunes.
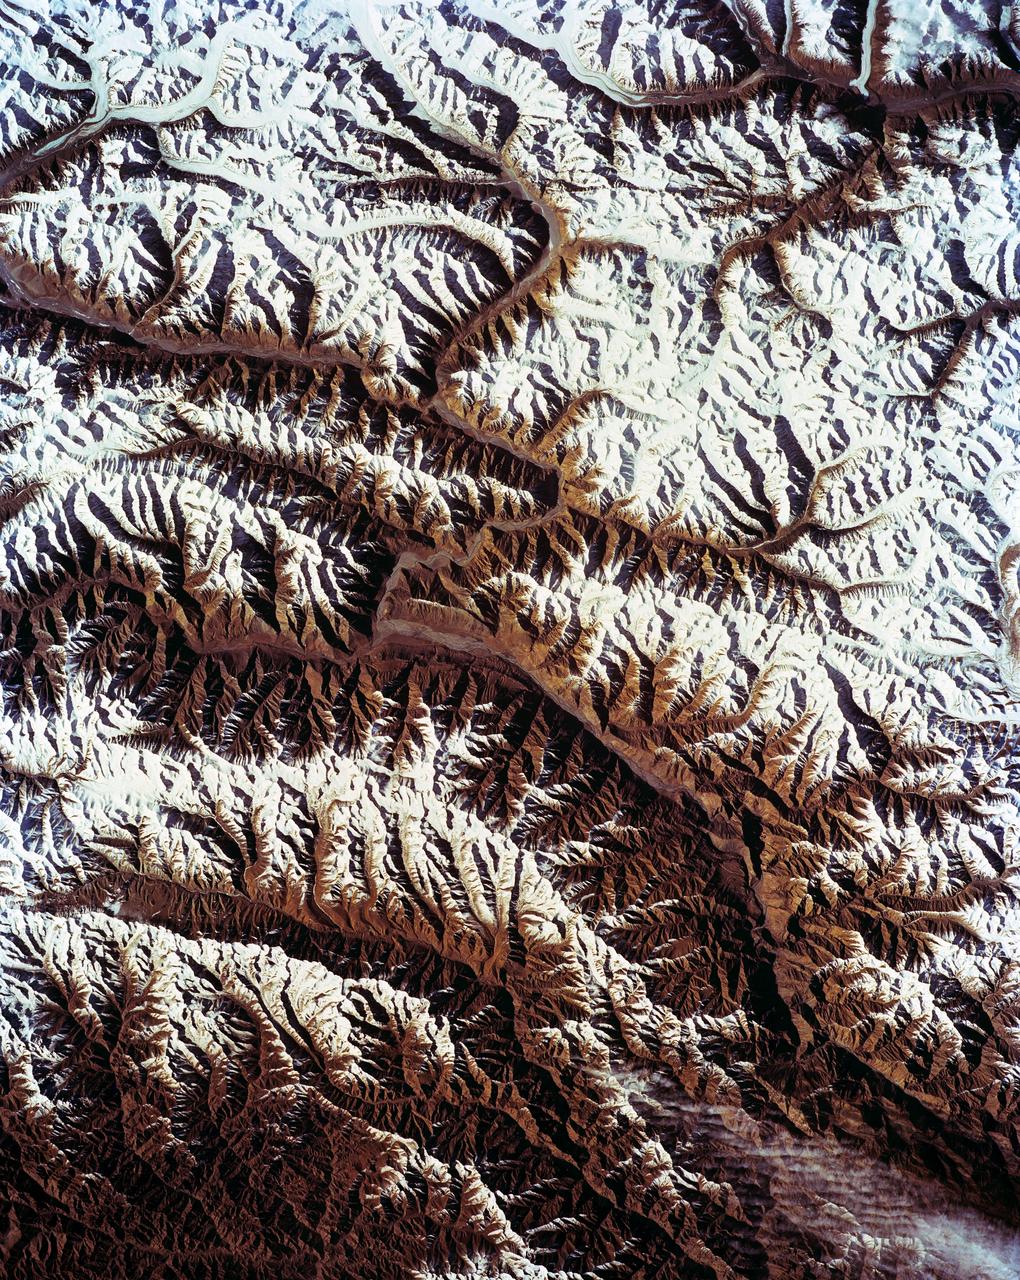
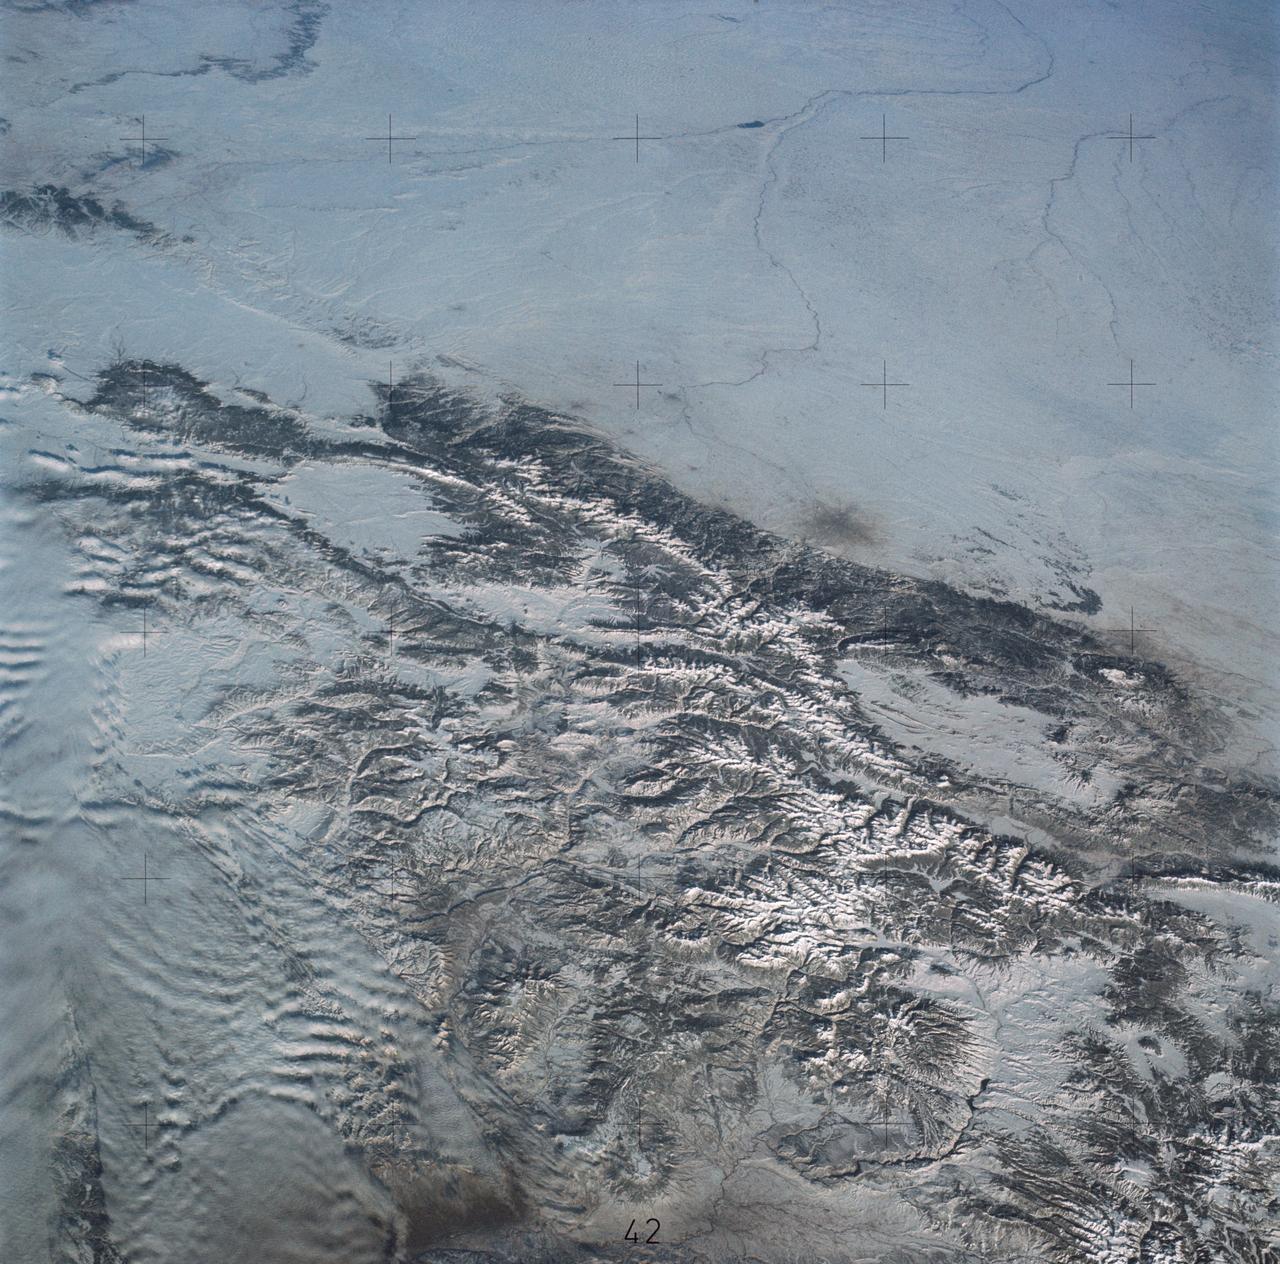
STS-56 Earth observation shows of some of the highest mountain peaks in the world taken from Discovery, Orbiter Vehicle (OV) 103, as it passed over India and China. The top of the view shows one of the snow and ice-covered massifs in the great Karakorum Range of north India. A star-shaped peak at top left reaches 23,850 feet. Glaciers can be seen in valleys at these high elevations. The international border between India to the south (top) and China (bottom) snakes left to right along a river near the top of the scene, then veers into the muntains at top left. Larger valleys, despite their elevation (all in excess of 14,000 feet), are occupied by transport routes joining points in India, China and the southern republics of the CIS. The ancient Silk Route between China and the Middle East lies not far to the north (outside the bottom of the frame).
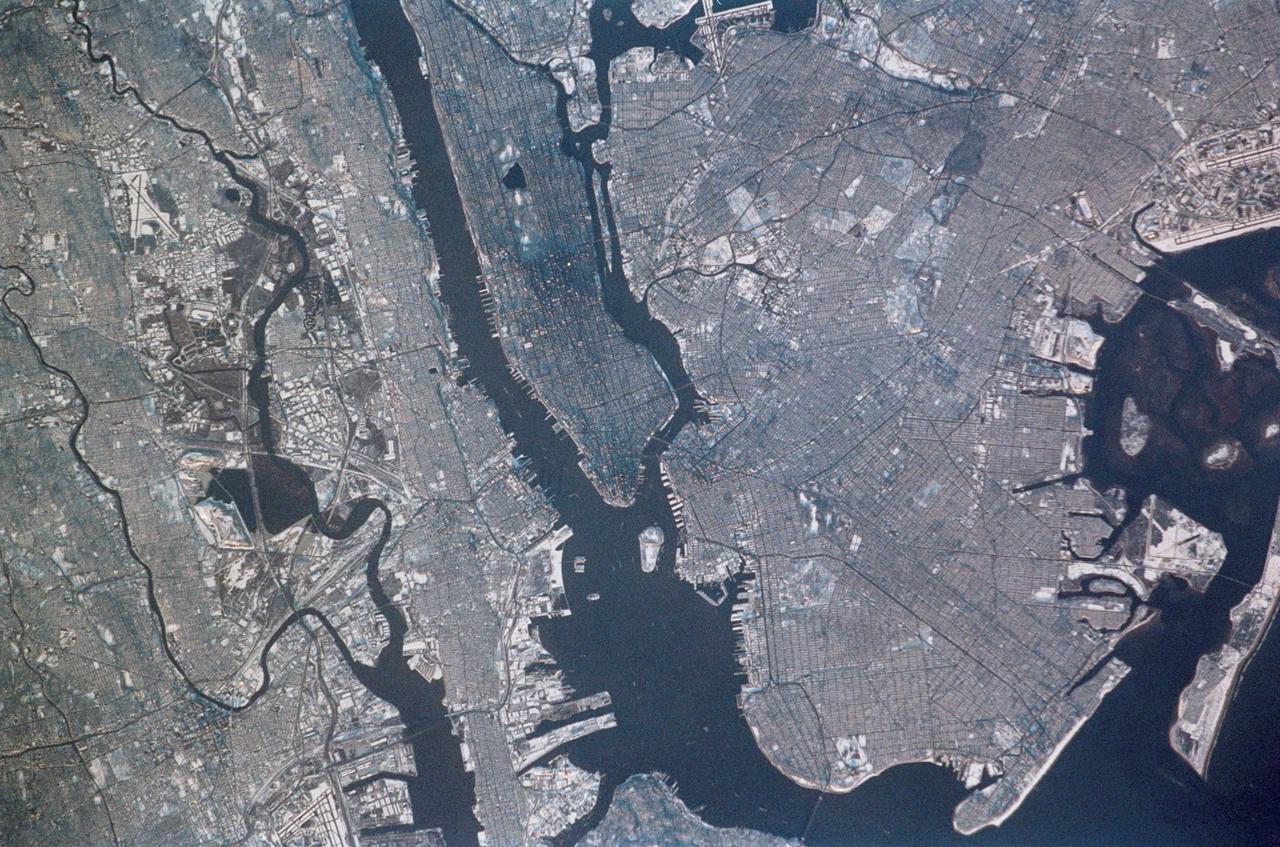
STS113-347-034 (23 November - 7 December 2002) --- The STS-113 crewmembers used a 35mm still camera to record this image of New York City. Manhattan Island appears just left of center, flanked by the lower Hudson River (left), and the East River (right). The lake in Central Park on Manhattan is particularly clear. The Verrazano Narrows Bridge appears center on the bottom margin of the view, dividing upper New York Bay from Lower New York Bay. Newark Bay is the body of water lower left. Three well known islands appear at the north (top) end of Upper New York Bay, the smallest being Liberty Island (with the Statue of Liberty not visible at this resolution), Ellis Island, the middle-sized island, and Governor's Island, the largest. Queens appears top right, and Brooklyn, lower right, with the Naval Air Station on Jamaica Bay on the right margin.
ISS010-E-07210 (16 November 2004) --- Salalah, Sultanate of Oman is featured in this image photographed by an Expedition 10 crewmember on the International Space Station (ISS). The city of Salalah is the capital of the Dhofar region of Oman and is known as the “perfume capital of Arabia”. The city is a popular destination for tourism due to the natural attractions of the al Qara Mountains (Jabal al Qara in Arabic) and abundant stands of frankincense trees lining mountain stream courses. These can be seen as green regions in the Jabal al Qara north of the city (located in the center of this image). The beaches and coastline are also major attractions for scuba diving and bird watching. Modern Oman is also represented by the Port of Salalah, located approximately 15 kilometers to the southwest of the city. The strategic location of this port has made it one of the major entry points to India, the Middle East, and Africa. The rectangular projection into the Arabian Sea visible in this photo is a large shipping container loading/unloading platform.

This is an image of equatorial Africa, centered on the equator at longitude 15degrees east. This image is a mosaic of almost 4,000 separate images obtained in 1996 by the L-band imaging radar onboard the Japanese Earth Resources Satellite. Using radar to penetrate the persistent clouds prevalent in tropical forests, the Japanese Earth Resources Satellite was able for the first time to image at high resolution this continental scale region during single flooding seasons. The area shown covers about 7.4 million square kilometers (2.8 million square miles) of land surface, spans more than 5,000 kilometers(3,100 miles) east and west and some 2,000 kilometers (1,240 miles) north and south. North is up in this image. At the full resolution of the mosaic (100 meters or 330 feet), this image is more than 500 megabytes in size, and was processed from imagery totaling more than 60 gigabytes. Central Africa was imaged twice in 1996, once between January and March, which is the major low-flood season in the Congo Basin, and once between October and November, which is the major high-flood season in the Congo Basin. The red color corresponds to the data from the low-flood season, the green to the high-flood season, and the blue to the "texture" of the low-flood data. The forests appear green as a result, the flooded and palm forests, as well as urban areas, appear yellow, the ocean and lakes appear black, and savanna areas appear blue, black or green, depending on the savanna type, surface topography and other factors. The areas of the image that are black and white were mapped only between January and March 1996. In these areas, the black areas are savanna or open water, the gray are forests, and the white areas are flooded forests or urban areas. The Congo River dominates the middle of the image, where the nearby forests that are periodically flooded by the Congo and its tributaries stand out as yellow. The Nile River flows north from Lake Victoria in the middle right of the color portion of the mosaic. http://photojournal.jpl.nasa.gov/catalog/PIA01348
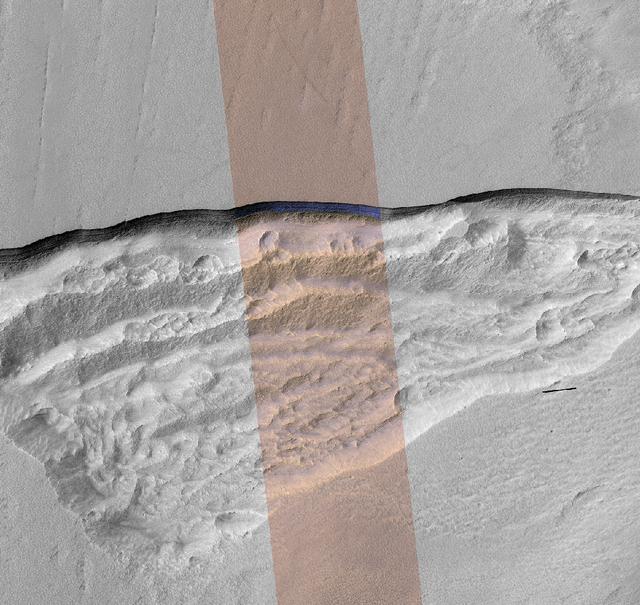
At this wedge-shaped pit on Mars, the steep slope (or scarp) at the northern edge (toward the top of the image) exposes a cross-section of a thick sheet of underground water ice. The image is from the High Resolution Imaging Stereo Experiment (HiRISE) camera on NASA's Mars Reconnaissance Orbiter. The gray-scale portions on left and right are from a single waveband in the red-light portion of the visible spectrum. The middle section, in enhanced color, combines data from red, near-infrared and blue-green wavebands. The scene covers an area about three miles (five kilometers) wide. Figure 1 includes a one-kilometer scale bar. One kilometer is about six-tenths of a mile. The ice-exposing scarp at the northern edge of the pit has a steepness of about 45 to 55 degrees, plunging from the relatively level ground outside the pit. The HiRISE observation ESP_022389_1230 was made on May 7, 2011, at 56.6 degrees south latitude, 114.1 degrees east longitude. In January 2018, in the journal Science, researchers reported finding and studying eight such ice-exposing scarps in the middle latitudes of Mars. The presence of vast underground ice deposits in Mars' middle latitudes was known previously. The report of unusual sites where they are exposed provides new information about their depth and layering. It also identifies potential water resources for future Mars missions and possibilities for studying Martian climate history by examining the ice layers holding a record of past climate cycles. The ice may have been deposited as snow when the tilt of Mars' rotation axis was greater than it is now. https://photojournal.jpl.nasa.gov/catalog/PIA22078
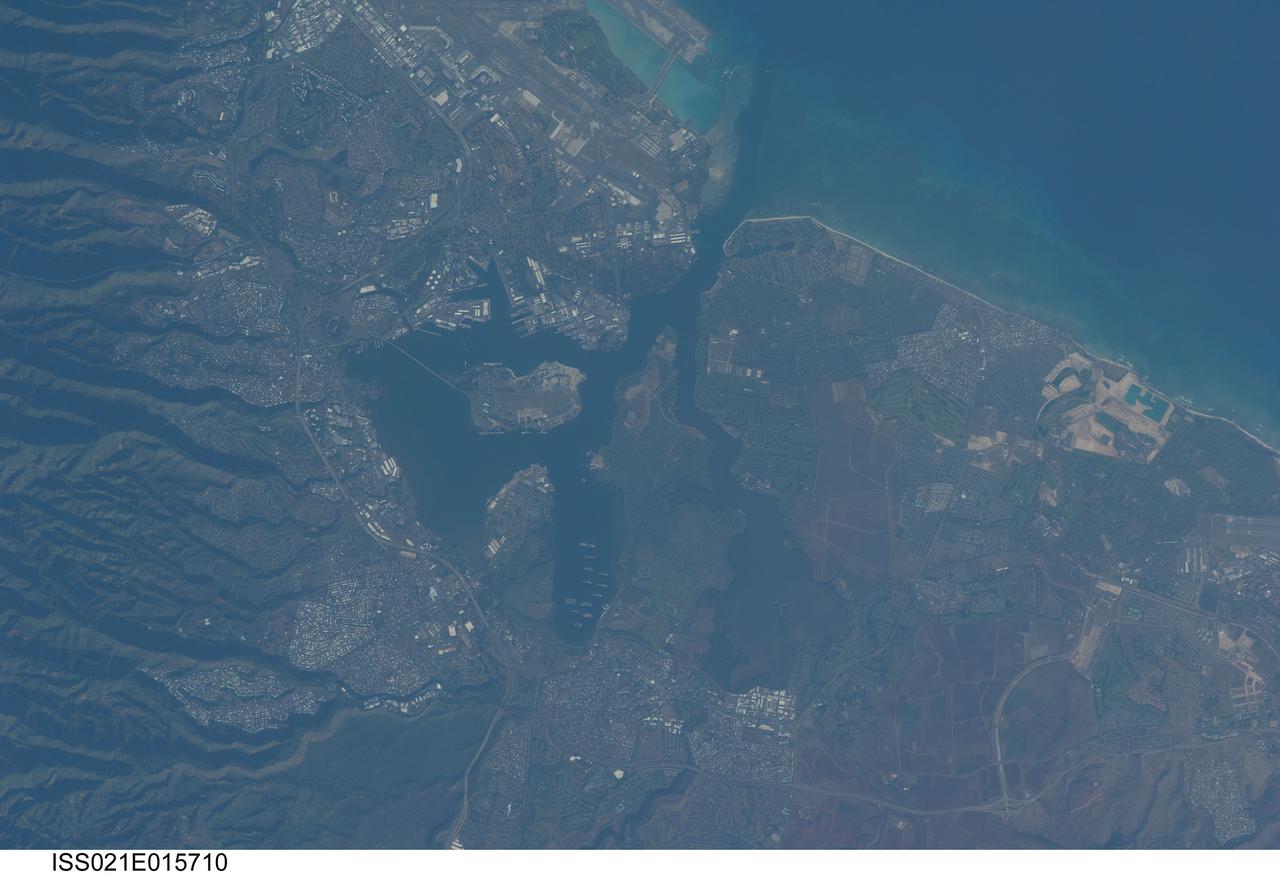
ISS021-E-015710 (27 Oct. 2009) --- Pearl Harbor, Hawaii is featured in this image photographed by an Expedition 21 crew member on the International Space Station. This detailed view illustrates the southern coastline of the Hawaiian island of Oahu including Pearl Harbor. On Dec. 7, 1941 ? 68 years ago ? a surprise attack by the Japanese Navy on Pearl Harbor and other targets on the island of Oahu precipitated the entry of the United States into World War II. Today, Pearl Harbor is still in use as a major United States Navy installation, and with Honolulu is one of the most heavily developed parts of the Island. Comparison between this image and a detailed astronaut photograph of Pearl Harbor taken in 2003 suggests that little observable land use or land cover change has occurred in the area over the past six years. The most significant change is the addition of more naval vessels to the Reserve Fleet anchorage in Middle Loch (center). The urban areas of Waipahu, Pearl City, and Aliamanu border the Harbor to the northwest, north, and east. The built-up areas, recognized by linear streets and white rooftops, contrast sharply with the reddish volcanic soils and green vegetated hillslopes of the surrounding areas.
![Sand dunes are scattered across Mars and one of the larger populations exists in the Southern hemisphere, just west of the Hellas impact basin. The Hellespontus region features numerous collections of dark, dune formations that collect both within depressions such as craters, and among "extra-crater" plains areas. This image displays the middle portion of a large dune field composed primarily of crescent-shaped "barchan" dunes. Here, the steep, sunlit side of the dune, called a slip face, indicates the down-wind side of the dune and direction of its migration. Other long, narrow linear dunes known as "seif" dunes are also here and in other locales to the east. NB: "Seif" comes from the Arabic word meaning "sword." The map is projected here at a scale of 25 centimeters (9.8 inches) per pixel. [The original image scale is 25.5 centimeters (10 inches) per pixel (with 1 x 1 binning); objects on the order of 77 centimeters (30.3 inches) across are resolved.] North is up. http://photojournal.jpl.nasa.gov/catalog/PIA21571](https://images-assets.nasa.gov/image/PIA21571/PIA21571~medium.jpg)
Sand dunes are scattered across Mars and one of the larger populations exists in the Southern hemisphere, just west of the Hellas impact basin. The Hellespontus region features numerous collections of dark, dune formations that collect both within depressions such as craters, and among "extra-crater" plains areas. This image displays the middle portion of a large dune field composed primarily of crescent-shaped "barchan" dunes. Here, the steep, sunlit side of the dune, called a slip face, indicates the down-wind side of the dune and direction of its migration. Other long, narrow linear dunes known as "seif" dunes are also here and in other locales to the east. NB: "Seif" comes from the Arabic word meaning "sword." The map is projected here at a scale of 25 centimeters (9.8 inches) per pixel. [The original image scale is 25.5 centimeters (10 inches) per pixel (with 1 x 1 binning); objects on the order of 77 centimeters (30.3 inches) across are resolved.] North is up. http://photojournal.jpl.nasa.gov/catalog/PIA21571
STS085-502-078 (7 - 19 August 1997) --- The southern coastline of seldom-seen Iceland can be detected under cloud, top right in this dramatic west-looking view. Iceland's capital city, Reykjavik, lies on the cape that projects furthest left (i.e. southwest) in this view. Along the southeast margin (nearest to the viewer), Iceland's largest icecap, Vatnajškull, appears as a white mass with a texture different to the spotty cumulus cloud. At the closest point, Greenland only lies 170 miles to the northwest of Iceland -- and under a hand lens, hundreds of miles of the east coast of Greenland can be seen stretching across the top of this view. Taken with the large format Linhof camera, the enormous clarity of the air on this day allowed the crew to photograph Iceland which lies 400 miles and more north of the northernmost point which the Space Shuttle Discovery attained (57.5 degrees north latitude). Greenland lies more than 700 miles from the orbiter. The nature of the light brown feature in the ocean (middle of the view under the tailfin) is unclear. Part is a reflection off the window, but part shows details characteristic of a plankton bloom.
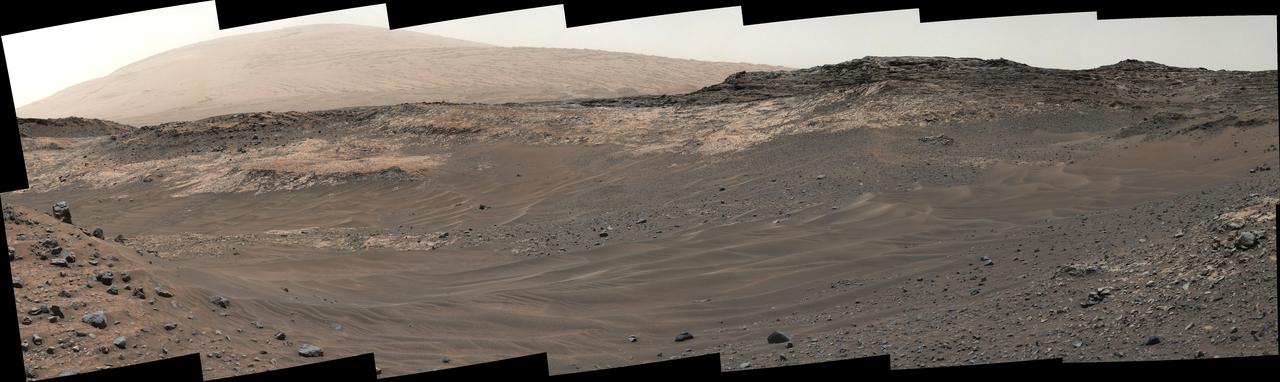
This view southeastward from Curiosity's Mast Camera (Mastcam) shows terrain judged difficult for traversing between the rover and an outcrop in the middle distance where a pale rock unit meets a darker rock unit above it. The Mastcam's left-eye camera captured the component images on May 10, 2015, during the 981st Martian day, or sol, of Curiosity's work on Mars. This observation helped the rover team evaluate routes for driving to that geological contact area where the two rock units meet. The outcrop exposing the contact is in the eastern portion of the "Logan Pass" area. The windblown ripples and the steep ground where ripples are lacking are both poor terrain for the rover to cross. The team subsequently chose to approach a different site where the pale and darker rock units are in contact with each other. That alternative site is in the northern portion of the Logan Pass area, outside of this scene. This panorama spans from east, at left, to south-southwest. The color has been approximately white-balanced to resemble how the scene would appear under daytime lighting conditions on Earth. http://photojournal.jpl.nasa.gov/catalog/PIA19662
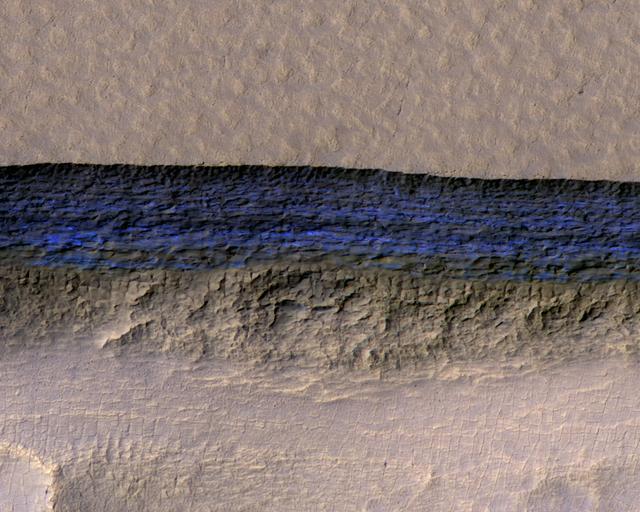
Click on the image for larger version A cross-section of a thick sheet of underground ice is exposed at the steep slope (or scarp) that appears bright blue in this enhanced-color view from the High Resolution Imaging Science Experiment (HiRISE) camera on NASA's Mars Reconnaissance Orbiter. The view covers an area about 550 yards (500 meters) wide. Figure 1 includes a 100-meter (109-yard) scale bar. North is toward the top. The upper third of the image shows level ground that is about 140 yards (130 meters) higher in elevation than the ground in the bottom third. In between, the scarp descends sharply, exposing about 260 vertical feet (80 vertical meters) of water ice. Color is exaggerated to make differences in surface materials easier to see. The presence of exposed water ice at this site was confirmed by observation with the same orbiter's Compact Reconnaissance Imaging Spectrometer for Mars (CRISM). In January 2018, in the journal Science, researchers reported finding and studying eight such ice-exposing scarps in the middle latitudes of Mars. The presence of vast underground ice deposits in Mars' middle latitudes was known previously. The report of unusual sites where they are exposed provides new information about their depth and layering. It also identifies potential water resources for future Mars missions and possibilities for studying Martian climate history by examining the ice layers holding a record of past climate cycles. The ice may have been deposited as snow when the tilt of Mars' rotation axis was greater than it is now. HiRISE observation ESP_022389_1230 was made on May 7, 2011, at 56.6 degrees south latitude, 114.1 degrees east longitude. https://photojournal.jpl.nasa.gov/catalog/PIA22077
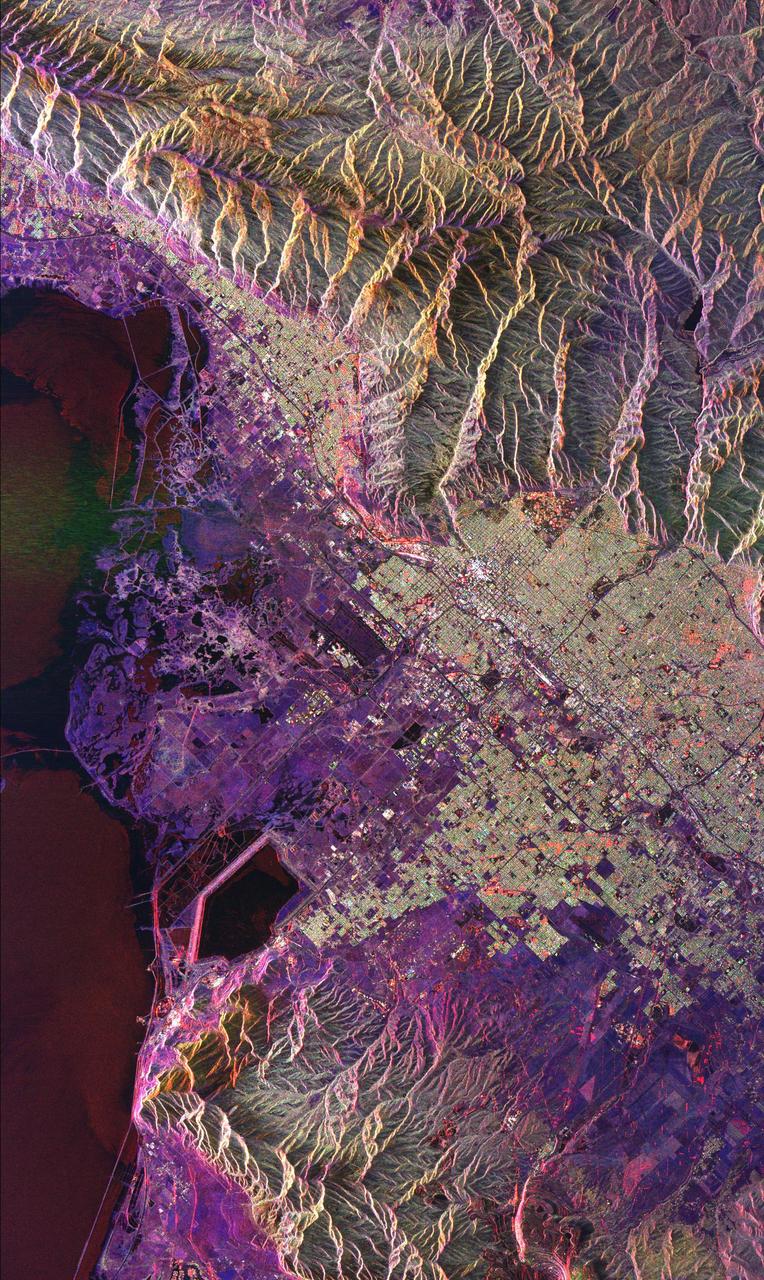
This radar image of Salt Lake City, Utah, illustrates the different land use patterns that are present in the Utah Valley. Salt Lake City lies between the shores of the Great Salt Lake (the dark area on the left side of the image) and the Wasatch Front Range (the mountains in the upper half of the image). The Salt Lake City area is of great interest to urban planners because of the combination of lake, valley and alpine environments that coexist in the region. Much of the southern shore of the Great Salt Lake is a waterfowl management area. The green grid pattern in the right center of the image is Salt Lake City and its surrounding communities. The Salt Lake City airport is visible as the brown rectangle near the center of the image. Interstate Highway 15 runs from the middle right edge to the upper left of the image. The bright white patch east of Interstate 15 is the downtown area, including Temple Square and the state capitol. The University of Utah campus is the yellowish area that lies at the base of the mountains, east of Temple Square. The large reservoir in the lower left center is a mine tailings pond. The semi-circular feature in the mountains at the bottom edge of the image is the Kennecott Copper Mine. The area shown is 60 kilometers by 40 kilometers (37 miles by 25 miles) and is centered at 40.6 degrees north latitude, 112.0 degrees west longitude. North is toward the upper left. This image was acquired by the Spaceborne Imaging Radar-C/X-Band Synthetic Aperture Radar (SIR-C/X-SAR) aboard the space shuttle Endeavour on April 10, 1994. The colors in this image represent the following radar channels and polarizations: red is L-band, horizontally transmitted and received; green is L-band, horizontally transmitted and vertically received; and blue is C-band, horizontally transmitted and vertically received. SIR-C/X-SAR, a joint mission of the German, Italian and United States space agencies, is part of NASA's Mission to Planet Earth program. http://photojournal.jpl.nasa.gov/catalog/PIA01798
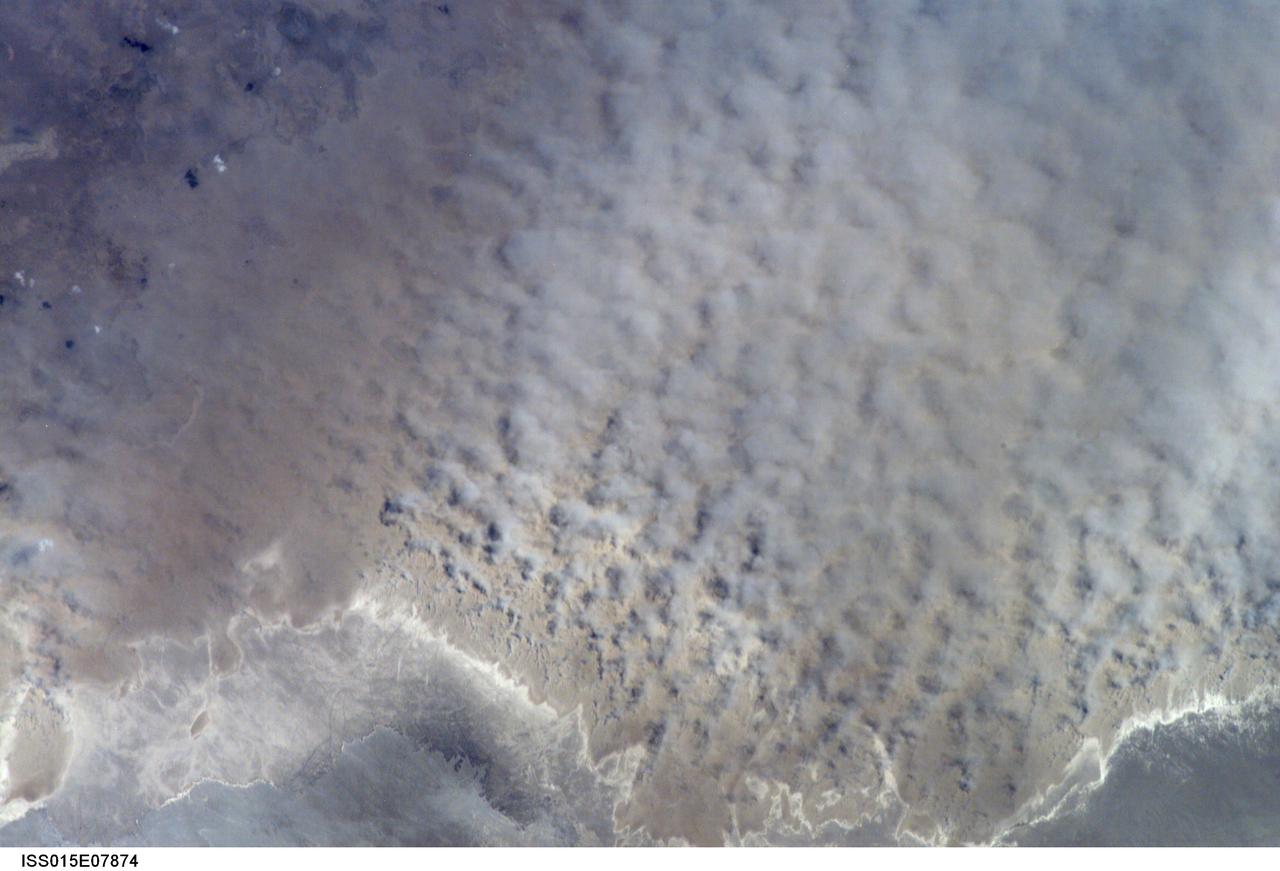
ISS015-E-07874 (12 May 2007) --- A major dust storm (center right) along the east side of the Aral Sea, Kazakhstan, is featured in this image photographed by an Expedition 15 crewmember on the International Space Station while passing over central Asia. The white, irregular lines along the bottom of the image are salt and clay deposits on the present coastline. On the spring day when the ISS crew shot the image, winds were blowing from the west (lower left). The gray, puffy appearance is typical of dust clouds, allowing scientists to distinguish dust from fog and smog. The dust in this image is rising from the sea bed of the Aral Sea, from a point close to the middle of the original Aral Sea of 40--50 years ago, then the fourth largest inland sea on Earth. Heavy extraction of water from the main supply river, the Amu Dary'a, has resulted in rapid shrinking of the sea. According to scientists, dust storms have been occurring in the Aral Sea region for thousands of years, but since the drastic shrinking of the sea over the past half-century an important change in dust composition has occurred. The dust now includes fertilizer and pesticide washed into the Sea from the extensive cotton fields of the Amu Dary'a floodplain. Years of liberal application of agricultural chemicals have resulted in concentration of these pollutants on the sea bed. These are now exposed to the wind and transported hundreds of kilometers in a generally easterly direction. Research suggests that the remobilized chemicals are the cause of high rates of many diseases in the populations along the north, east and southern margins of the Aral Sea. This is one of the unintended consequences of the shrinking of the sea, which has made international news for many years due to the loss of the fishing industry and other significant ecological problems.
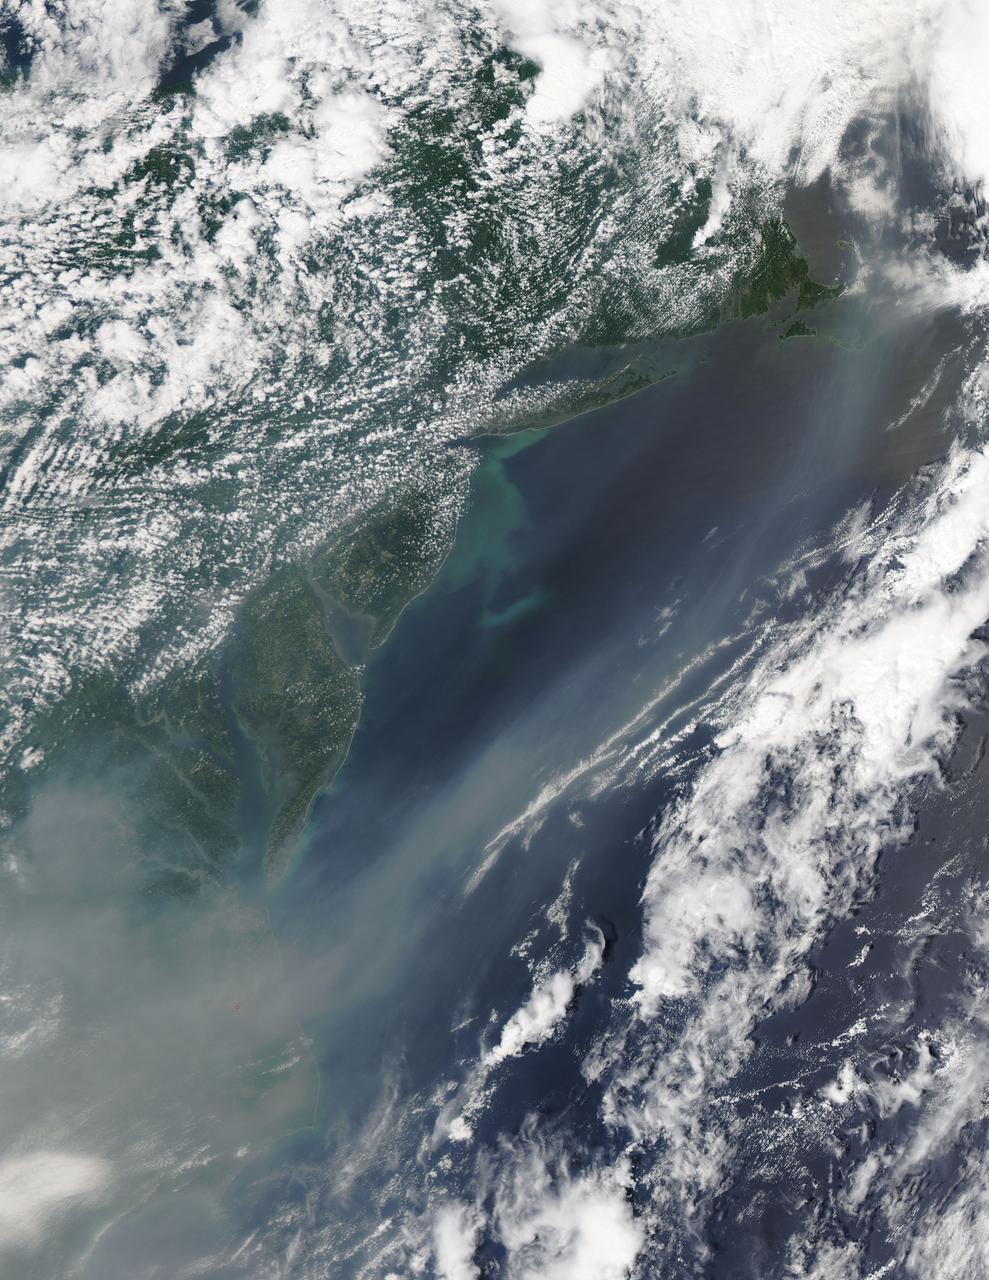
The smoke from the Canadian wildfires that was in the middle of the U.S. on June 30 has drifted its way to the East Coast obscuring parts of the coast from New Jersey to North Carolina. Images taken on June 30 showed the smoke covering states from Minnesota to Tennessee. The jet stream has pushed the smoke along so that by July 1 it reached the U.S. East Coast. Residents of the area will get a preview of July 4th fireworks with redder than usual sunrises and sunsets due to particulates in the air. This natural-color satellite image was collected by the Moderate Resolution Imaging Spectroradiometer (MODIS) aboard the Aqua satellite on July 1, 2015. Credit: NASA/GSFC/Jeff Schmaltz/MODIS Land Rapid Response Team <b><a href="http://www.nasa.gov/audience/formedia/features/MP_Photo_Guidelines.html" rel="nofollow">NASA image use policy.</a></b> <b><a href="http://www.nasa.gov/centers/goddard/home/index.html" rel="nofollow">NASA Goddard Space Flight Center</a></b> enables NASA’s mission through four scientific endeavors: Earth Science, Heliophysics, Solar System Exploration, and Astrophysics. Goddard plays a leading role in NASA’s accomplishments by contributing compelling scientific knowledge to advance the Agency’s mission. <b>Follow us on <a href="http://twitter.com/NASAGoddardPix" rel="nofollow">Twitter</a></b> <b>Like us on <a href="http://www.facebook.com/pages/Greenbelt-MD/NASA-Goddard/395013845897?ref=tsd" rel="nofollow">Facebook</a></b> <b>Find us on <a href="http://instagrid.me/nasagoddard/?vm=grid" rel="nofollow">Instagram</a></b>
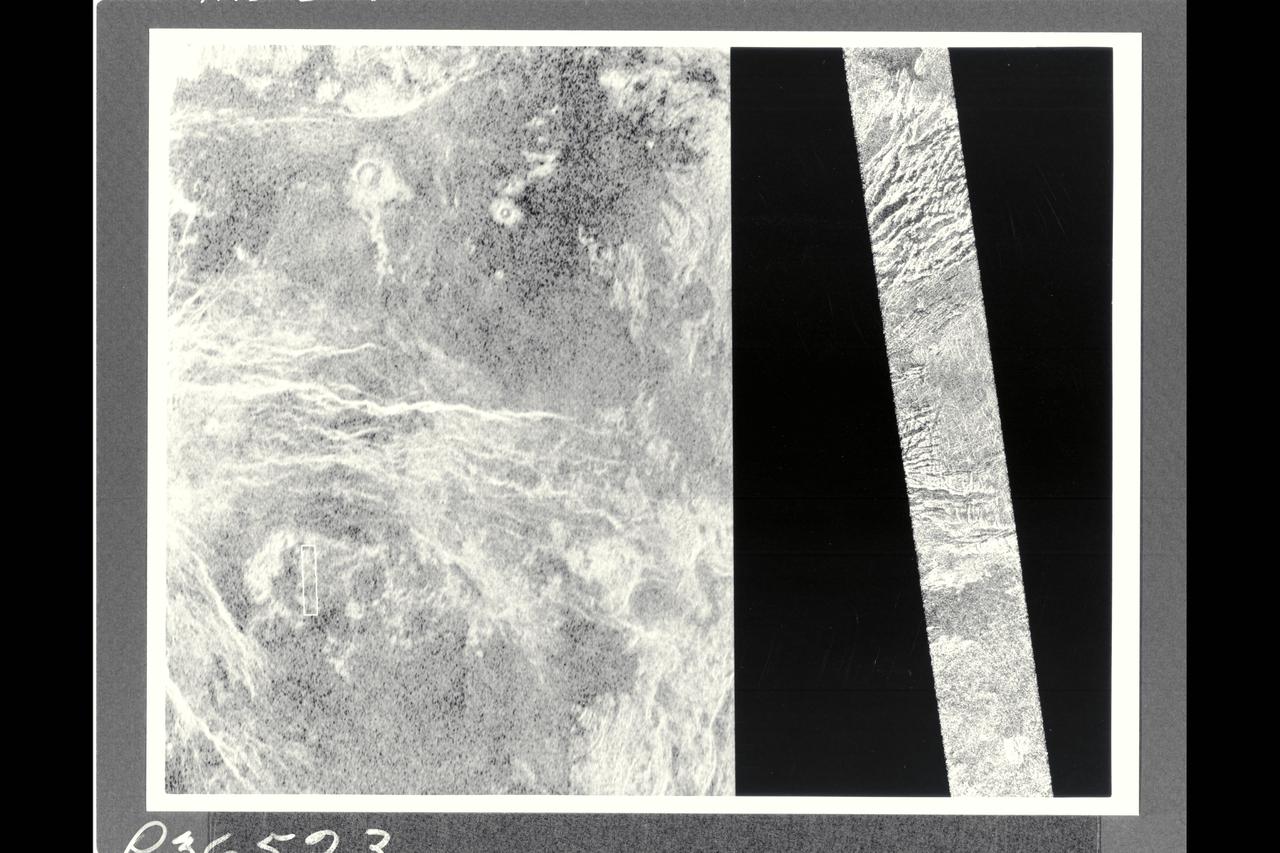
This image shows a comparison between a Magellan image (right) and the highest resolution Earth-based radar image of Venus, obtained by the US National Astronomy and Ionosphere Center's Arecibo Observatory in Puerto Rico. The small white bot in the Arecibo image on the left corresponds to the Magellan image. This portion of a Magellan radar image strip shows a small region on the east flank of a major volcanic upland called Beta Regio. The image is centered a t 23 degrees north latitude and 286.7 degrees east longitude. The ridge and valley network in the middle part of the image is formed by intersecting faults which have broken the Venusian crust into a complex deformed type of surface called tessera, the Latin word for tile. The parallel mountains and valleys resemble the Basin and Range Province kn the western United States. The irregular dark patch near the top of the image is a smooth surface, proboably formed by lava flows in a region about 10 km (6 mi.) across. Similar dark surfaces within the valleys indicate lava flows that are younger than the tessera. The Arecibo image contains probable impact craters, mapped in detail by Magellan. The Magellan image has a resolution of 120 meters, (400 feet). The image segment is 20 km (12.4 mi.) wide adn 150 km (90 mi.) long. The Arecibo image has a resolution of 1-3 km (0.6-1.8 mi.) and is approx. 900 km (550 mi.) across.
SL4-138-3875 (February 1974) --- A color oblique photograph looking east over the Rocky Mountains and Great Plains. This view covers a portion of the States of Colorado, Wyoming, and Nebraska. A Skylab 4 crewmen took this picture with a hand-held 70mm Hasselblad camera. This entire region, covered with a blanket of snow, depicts much of the structural and topographic features of the Rocky Mountain chain. Man's only apparent change to the snow pattern seen here is the (right center) metropolitan areas of Denver and Colorado Springs, Colorado, which can be observed along the eastern edge of the mountain front. Grand Junction, Colorado on the western slope of the Rocky Mountains is just off the photograph at left center bottom. The major inter-montane valleys of South Park (right center), Middle Park (center), and North Park (left center) are clearly visible and separate the Colorado Rockies Front Range from the high rugged mountains can be discovered such as Pikes Peak near right border (center), Mt. Cunnison region, circular feature accentuated by the Cunnison River (dark) in the right center (bottom) of the photograph. The snow covered peaks of Mts. Harvard, Princeton and Yale form the high region of the Collegiate Range which is the pronounced mountain area in the right center. Snow cover not only enhances mountain features but also the drainage patterns. East of Denver (right corner) the sinuous trace of the South Platte River (center) and its junction with the North Platte River near North Platte, Nebraska. Lake McConaughy in Nebraska is the body of water (black) near the river intersection. The trace of the Republic River in southern Nebraska is visible near the right corner of the photography. Geologic and hydro logic studies using this photograph will be conducted by Dr. Roger Morrison, U.S. Geological Survey. Photo credit: NASA
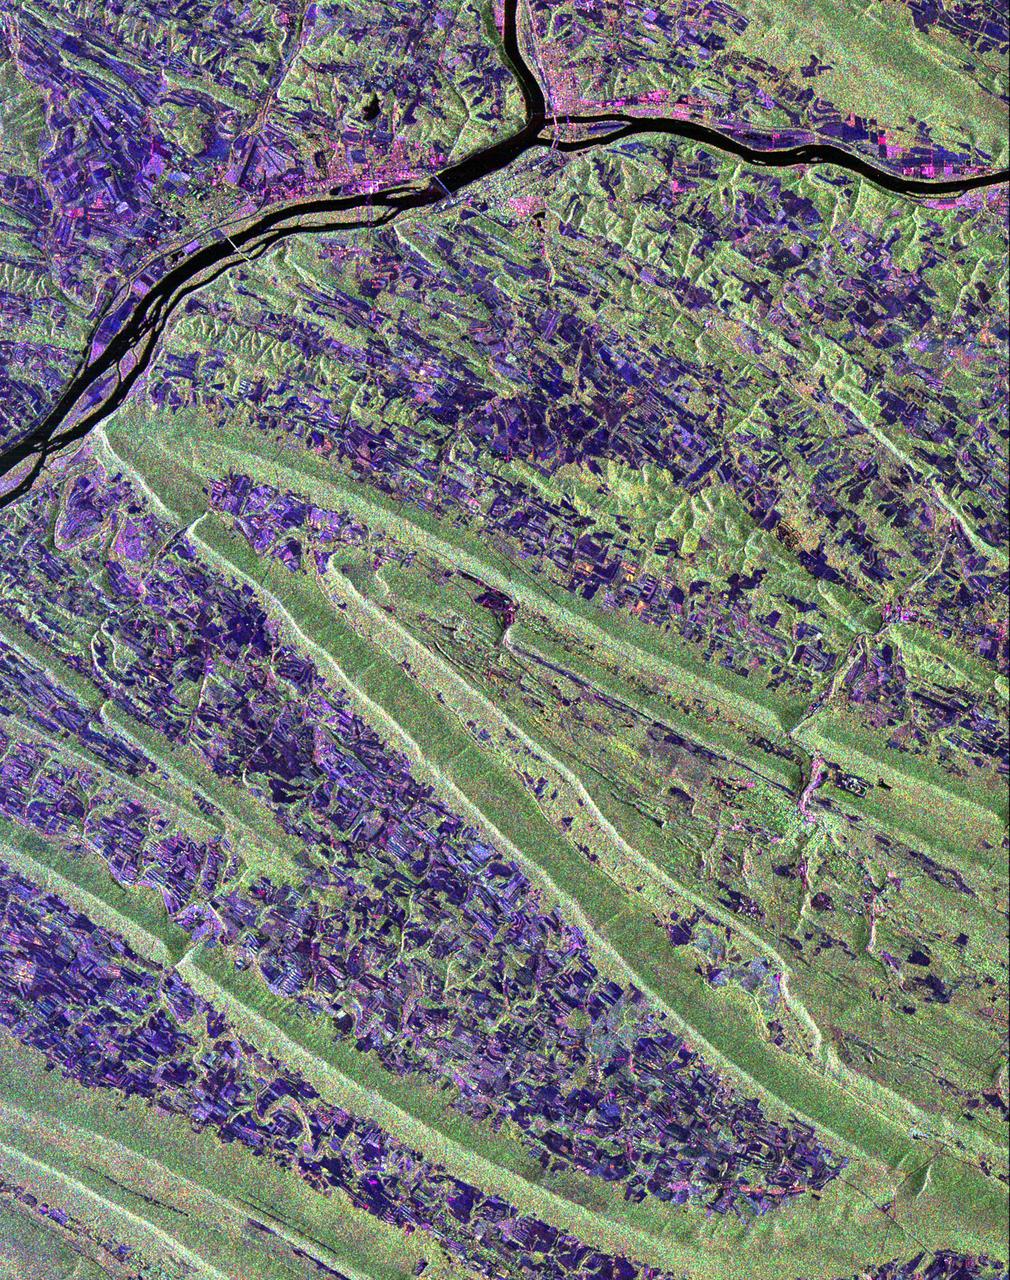
Scientists are using this radar image of the area surrounding Sunbury, Pennsylvania to study the geologic structure and land use patterns in the Appalachian Valley and Ridge province. This image was collected on October 6, 1994 by the Spaceborne Imaging Radar-C/ X-Band Synthetic Aperture Radar (SIR-C/X-SAR) on orbit 102 of the space shuttle Endeavour. The image is centered on latitude 40.85 degrees North latitude and 76.79 degrees West longitude. The area shown is approximately 30.5 km by 38 km. (19 miles by 24 miles). North is towards the upper right of the image. The Valley and Ridge province occurs in the north-central Appalachians, primarily in Pennsylvania, Maryland, and Virginia. It is an area of adjacent valleys and ridges that formed when the Appalachian mountain were created some 370 to 390 million years ago. During the continental collision that formed the Appalachians, the rocks in this area were pushed from the side and buckled much like a rug when pushed from one end. Subsequent erosion has produced the landscape we see in this image. The more resistant rocks, such as sandstone, form the tops of the ridges which appear as forested greenish areas on this image. The less resistant rocks, such as limestone, form the lower valleys which are cleared land and farm fields and are purple in this image. Smaller rivers and streams in the area flow along the valleys and in places cut across the ridges in "water gaps." In addition to defining the geography of this region, the Valley and Ridge province also provides this area with natural resources. The valleys provide fertile farmland and the folded mountains form natural traps for oil and gas accumulation; coal deposits are also found in the mountains. The colors in the image are assigned to different frequencies and polarizations of the SIR-C radar as follows: red is L-band horizontally transmitted, horizontally received; green is L-band horizontally transmitted, vertically received; blue is C-band horizontally transmitted, horizontally received. The river junction near the top of the image is where the West Branch River flows into the Susquehanna River, which then flows to the south-southwest past the state capitol of Harrisburg, 70 km (43 miles) to the south and not visible in this image. The town of Sunbury is shown along the Susquehanna on the east just to the southeast of the junction with West Branch. Three structures that cross the Susquehanna; the northern and southern of these structures are bridges and middle structure is the Shamokin Dam which confines the Susquehanna just south of the junction with West Branch. The prominent S-shaped mountain ridge in the center of the image is, from north to south, Little Mountain (the top of the S), Line Mountain (the middle of the S), and Mahantango Mountain (the bottom of the S). http://photojournal.jpl.nasa.gov/catalog/PIA01306
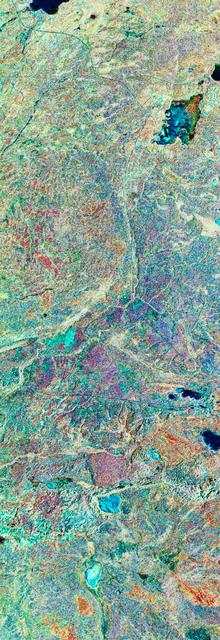
STS059-S-079 (18 April 1994) --- This is a false-color, three frequency image of Prince Albert, Canada, centered at 53.91 north latitude and 104.69 west longitude. It was produced using data from the X-Band, C-Band and L-Band radars that comprise the Spaceborne Imaging Radar-C and X-Band Synthetic Aperture Radar (SIR-C/X-SAR). SIR-C/X-SAR acquired this image on the 20th orbit of the Space Shuttle Endeavour. The area is located 40 kilometers north and 30 kilometers east of the town of Prince Albert in the Saskatchewan province of Canada. The image covers the area east of the Candle Lake, between gravel surface Highways 120 and 106 and west of 106. The area in the middle of the image covers the entire Nipawin (Narrow Hills) provincial park. The look angle of the radar is 30 degrees and the size of the image is approximately 20 by 50 kilometers. The red, green, and blue colors represent L-Band total power, C-Band total power, and XVV respectively. The changes in the intensity of each color are related to various surface conditions such as frozen or thawed forest, fire, deforestation and areas of regrowth. Most of the dark blue areas in the image are the ice covered lakes. The dark area on the top right corner of the image is the White Gull Lake north of the intersection of Highway 120 and 913. The right middle part of the image shows Lake Ispuchaw and Lower Fishing Lake. The deforested areas are shown by light blue in the image. Since most of the logging practice at the Prince Albert area is around the major highways, the deforested areas can be easily detected as small geometrically shaped dark regions along the roads. At the time these data were taken, a major part of the forest was either frozen or undergoing the spring thaw. In such conditions, due to low volume of water in the vegetation, a deeper layer of the canopy is imaged by the radar, revealing valuable information about the type of trees, the amount of vegetation biomass and the condition of the surface. As the frequency increases, the penetration depth in the canopy decreases. Over forest canopies, the X-Band radar contains information about the top of the canopy. Whereas, C-Band and L-Band radar returns show contributions from the crown and trunk areas respectively. The bright areas in the image are dense mixed aspen and old jackpine forests where the return from all three bands is high. The reddish area corresponds to more sparse old jack pine (12 to 17 meters in height and 60 to 75 years old) where the L-Band signal penetrates deeper in the canopy and dominates C-Band and X-Band returns. Comparison of the image with the forest cover map of the area indicates that the three band radar can be used to classify various stands. SIR-C/X-SAR is part of NASA's Mission to Planet Earth (MTPE). SIR-C/X-SAR radars illuminate Earth with microwaves allowing detailed observations at any time, regardless of weather or sunlight conditions. SIR-C/X-SAR uses three microwave wavelengths: L-Band (24 cm), C-Band (6 cm), and X-Band (3 cm). The multi-frequency data will be used by the international scientific community to better understand the global environment and how it is changing. The SIR-C/X-SAR data, complemented by aircraft and ground studies, will give scientists clearer insights into those environmental changes which are caused by nature and those changes which are induced by human activity. SIR-C was developed by NASA's Jet Propulsion Laboratory (JPL). X-SAR was developed by the Dornire and Alenia Spazio Companies for the German Space Agency, Deutsche Agentur fuer Raumfahrtangelegenheiten (DARA), and the Italian Space Agency, Agenzia Spaziale Italiana (ASI). JPL Photo ID: P-43929
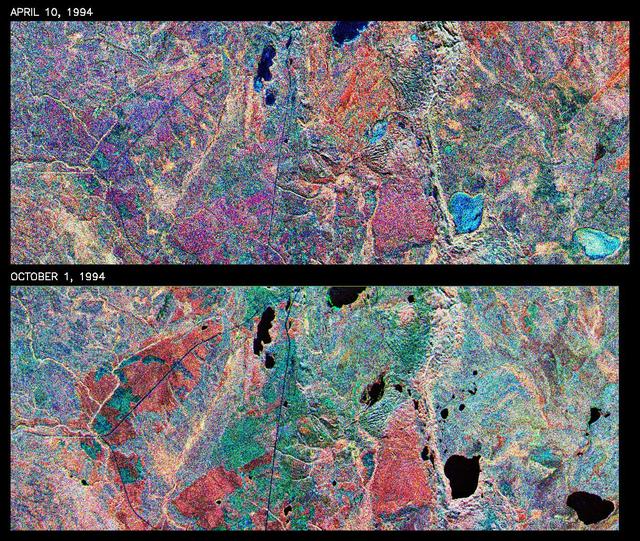
This is a comparison of images over Prince Albert, produced by NASA Spaceborne Imaging Radar-C and X-band Synthetic Aperture Radar aboard the space shuttle Endeavour on its 20th orbit on April 10, 1994. The area is centered at 53.91 degrees north latitude and 104.69 degrees west longitude and is located 40 kilometers (25 miles) north and 30 kilometers (18.5 miles) east of the town of Prince Albert in the Saskatchewan province of Canada. The image covers the area east of Candle Lake, between the gravel highway of 120 and west of highway 106. The area imaged is near the southern limit of the boreal forest. The boreal forest of North America is a continuous vegetation belt at high latitudes stretching across the continent from the Atlantic shoreline of central Labrador and then westward across Canada to the interior mountains and central coastal plains of Alaska. The forest is also part of a larger northern hemisphere circumpolar boreal forest belt. Coniferous trees dominate the entire forest but deciduous trees are also present. During the month of April, the forest experiences seasonal changes from a frozen condition to a thawed condition. The trees are completely frozen over the winter season and the forest floor is covered by snow. As the average temperature rises in the spring, the trees are thawed and the snow melts. This transition has an impact on the rate of moisture evaporation and release of carbon dioxide into the atmosphere. In late September and early October, the boreal forest experiences a relatively different seasonal change. At this time, the leaves on deciduous trees start changing color and dropping off. The soil and trees are quite often moist due to frequent rainfall and cloud cover. The evaporation of moisture and carbon dioxide into the atmosphere also diminishes at this time. SIR-C/X-SAR is sensitive to the moisture of soil and vegetation and can sense this freeze-thaw cycle and the summer-fall seasonal transition over forested areas in particular. Optical sensors, by contrast, are blind to these regions, which are perpetually obscured by thick cloud cover. These changes were detected by comparing the April and October color composite images of L-band data in red, C-band data in green and X-band (vertically received and transmitted) in blue. The changes in intensity of each color over lakes, various forest stands and clear cuts in the two images is striking. Lakes such as Lake Heiberg, Crabtree Lake and Williams Lake, in the right middle part of the image, are frozen in April (appearing in bright blue) and melted (appearing in black) in October. The higher intensity of blue over lakes in April is due to low penetration of the X-band (vertically received and transmitted) and the radar's high sensitivity to surface features. Forest stands also exhibit major changes between the two images. The red areas in the October image are old jack pine canopies that cause higher return at L-band because of their moist condition in late summer compared to their partially frozen condition in April (in purple). Similarly, in the areas near the middle of the image, where black spruce and mixed aspen and jack pine trees dominate, the contrast between blue in October and red and green in April is an indication that the top of the canopy (needles and branches) were frozen in April and moist in October. The changes due to deforestation by logging companies or natural fires can also be detected by comparing the images. For example, the small blue area near the intersection of Harding Road and Highway 120 is the result of logging which occurred after the April data was acquired. The surface area of clear cut is approximately 4 hectares, which is calculated from the high-resolution capability of the radar images and verified by scientists participating in field work during the mission. http://photojournal.jpl.nasa.gov/catalog/PIA01732
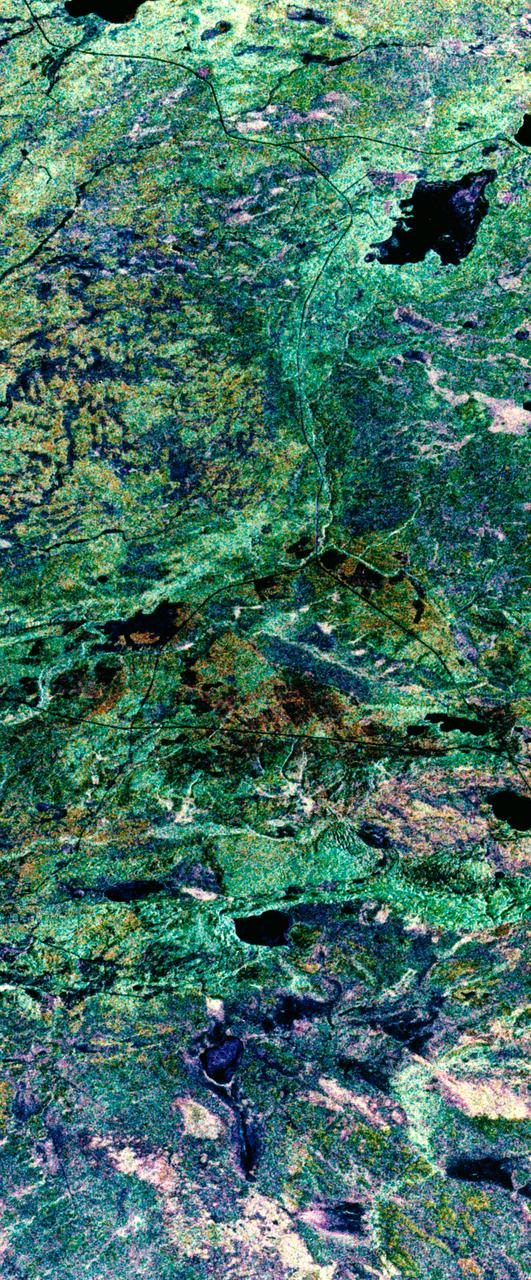
STS059-S-039 (11 April 1994) --- This is a false-color composite of Prince Albert, Canada, centered at 53.91 north latitude and 104.69 west longitude. This image was acquired by the Spaceborne Imaging Radar-C and X-Band Synthetic Aperture Radar (SIR-C/X-SAR) aboard the Space Shuttle Endeavour on its 20th orbit. The area is located 40 kilometers (25 miles) north and 30 kilometers (20 miles) east of the town of Prince Albert in the Saskatchewan province of Canada. The image covers the area east of the Candle Lake, between gravel surface Highways 120 and 106 and west of 106. The area in the middle of the image covers the entire Nipawin (Narrow Hills) provincial park. The look angle of the radar is 30 degrees and the size of the image is approximately 20 kilometers by 50 kilometers (12 by 30 miles). The image was produced by using only the L-Band. The three polarization channels HH, HV and VV are illustrated by red, green and blue respectively. The changes in the intensity of each color are related to various surface conditions such as variations in forest stands, frozen or thawed condition of the surface, disturbances (fire and deforestation), and areas of re-growth. Most of the dark areas in the image are the ice-covered lakes in the region. The dark area on the top right corner of the image is the White Gull Lake north of the intersection of Highway 120 and 913. The right middle part of the image shows Lake Ispuchaw and Lower Fishing Lake. The deforested areas are also shown by dark areas in the image. Since most of the logging practice at the Prince Albert area is around the major highways, the deforested areas can be easily detected as small geometrically shaped dark regions along the roads. At the time of the SIR-C/X-SAR overpass, a major part of the forest is either frozen or undergoing the spring thaw. The L-Band HH shows a high return in the jack pine forest. The reddish areas in the image are old jack pine forest, 12-17 meters (40-55 feet) in height and 60-75 years old. The orange-greenish areas are young jack pine trees, 3-5 meters (10-16 feet) in height and 11-16 years old. The green areas are due to the relative high intensity of the HV channel which is strongly correlated with the amount of biomass. L-Band HV channel shows the biomass variations over the entire region. Most of the green areas, when compared to the forest cover maps are identified as black spruce trees. The dark blue and dark purple colors show recently harvested or re-growth areas respectively. SIR-C/X-SAR is part of NASA's Mission to Planet Earth (MTPE). SIR-C/X-SAR radars illuminate Earth with microwaves allowing detailed observations at any time, regardless of weather or sunlight conditions. SIR-C/X-SAR uses three microwave wavelengths: L-Band (24 cm), C-Band (6 cm), and X-Band (3 cm). The multi-frequency data will be used by the international scientific community to better understand the global environment and how it is changing. The SIR-C/X-SAR data, complemented by aircraft and ground studies, will give scientists clearer insights into those environmental changes which are caused by nature and those changes which are induced by human activity. SIR-C was developed by NASA's Jet Propulsion Laboratory (JPL). X-SAR was developed by the Dornire and Alenia Spazio Companies for the German Space Agency, Deutsche Agentur fuer Raumfahrtangelegenheiten (DARA), and the Italian Space Agency, Agenzia Spaziale Italiana (ASI). JPL Photo ID: P-43886
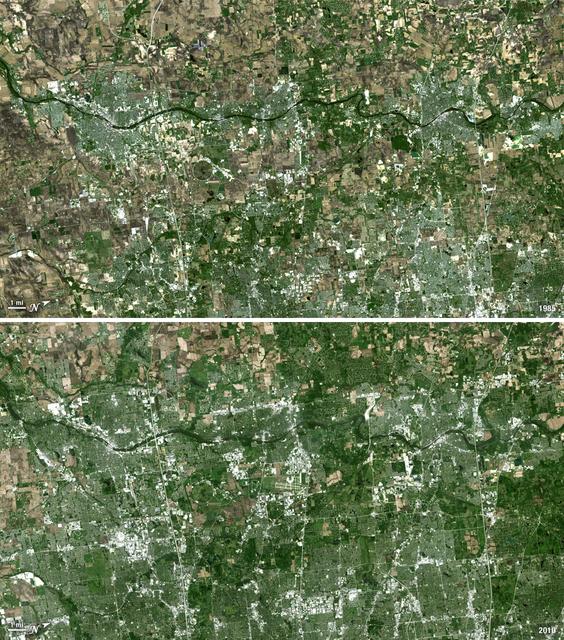
Forty miles west of downtown Chicago, the Fox River meanders its way through what has become the westernmost reaches of metropolitan Chicago, where the sprawling metropolis meets the hinterlands. While Chicago itself has seen a seven percent population decline during the last decade, the population of its metropolitan region, "Chicagoland," has steadily increased. These two natural-color Landsat 5 images acquired a quarter-century apart (on May 2, 1985, and May 23, 2010), stand witness to the soaring growth of this region. Aurora, Illinois’ second largest city, is the silvery-green region to the left hugging the Fox River, just south of the I-88 (North is to the right in this image); Carpentersville is found on the rightmost side, north of the I-90. From 1985 to 2010 a development explosion can been seen as the browns of pasture lands give way to silvery-green suburban areas and large white-colored business districts spring up along and east of the river. A major expansion of Dupage Airport appears in the middle of the 2010 image, and the circular-shaped region north of the I-88 and east of the Fox River, visible on both images, is the Department of Energy’s Fermilab. ---- NASA and the U.S. Department of the Interior through the U.S. Geological Survey (USGS) jointly manage Landsat, and the USGS preserves a 40-year archive of Landsat images that is freely available over the Internet. The next Landsat satellite, now known as the Landsat Data Continuity Mission (LDCM) and later to be called Landsat 8, is scheduled for launch in 2013. In honor of Landsat’s 40th anniversary in July 2012, the USGS released the LandsatLook viewer – a quick, simple way to go forward and backward in time, pulling images of anywhere in the world out of the Landsat archive. <b><a href="http://www.nasa.gov/audience/formedia/features/MP_Photo_Guidelines.html" rel="nofollow">NASA image use policy.</a></b> <b><a href="http://www.nasa.gov/centers/goddard/home/index.html" rel="nofollow">NASA Goddard Space Flight Center</a></b> enables NASA’s mission through four scientific endeavors: Earth Science, Heliophysics, Solar System Exploration, and Astrophysics. Goddard plays a leading role in NASA’s accomplishments by contributing compelling scientific knowledge to advance the Agency’s mission. <b>Follow us on <a href="http://twitter.com/NASA_GoddardPix" rel="nofollow">Twitter</a></b> <b>Like us on <a href="http://www.facebook.com/pages/Greenbelt-MD/NASA-Goddard/395013845897?ref=tsd" rel="nofollow">Facebook</a></b> <b>Find us on <a href="http://instagrid.me/nasagoddard/?vm=grid" rel="nofollow">Instagram</a></b>
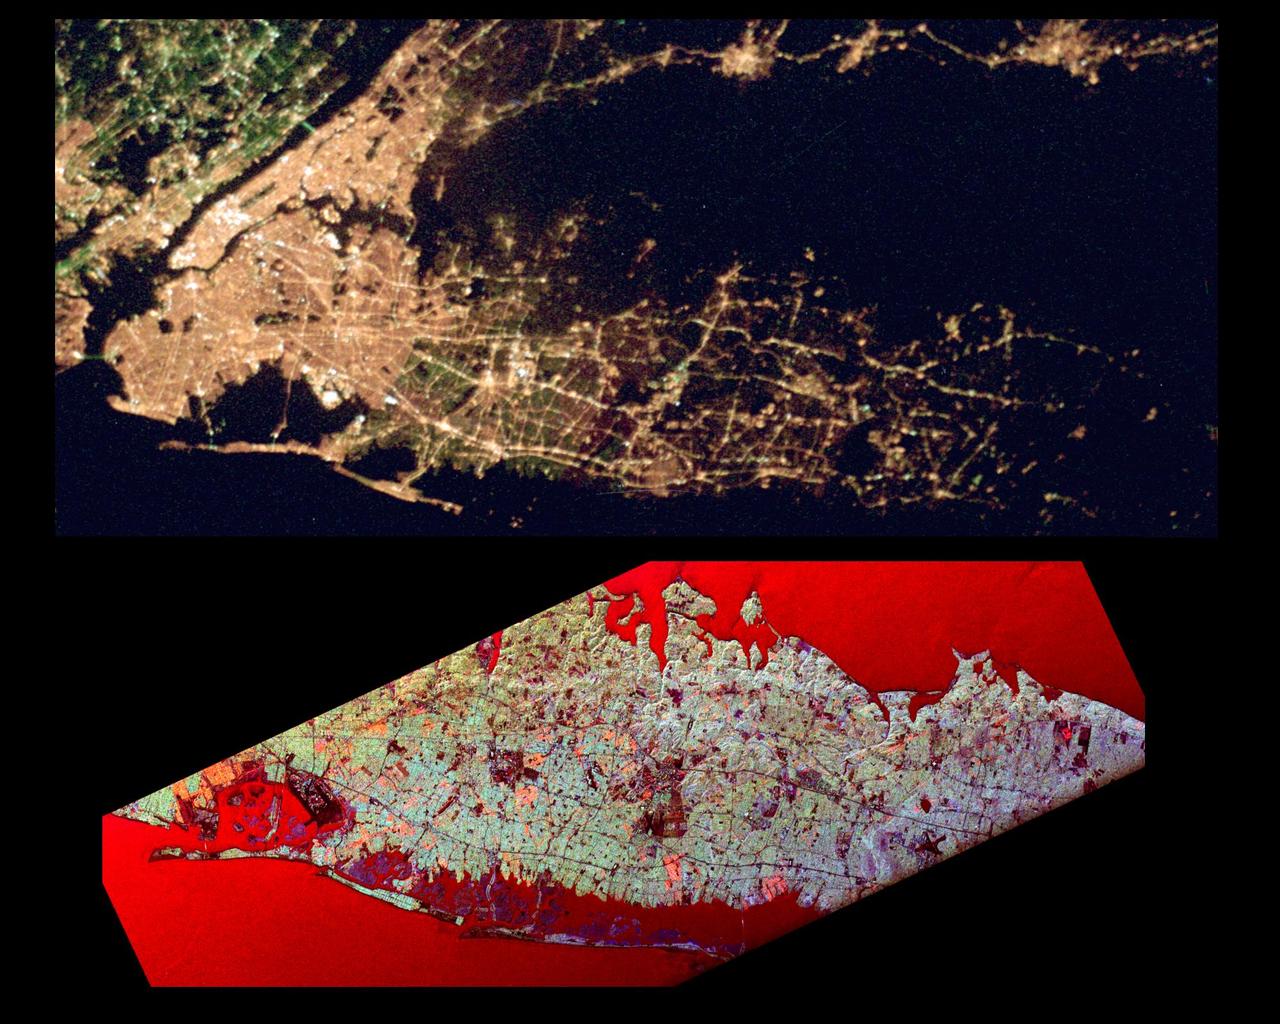
This pair of images of the Long Island, New York region is a comparison of an optical photograph (top) and a radar image (bottom), both taken in darkness in April 1994. The photograph at the top was taken by the Endeavour astronauts at about 3 a.m. Eastern time on April 20, 1994. The image at the bottom was acquired at about the same time four days earlier on April 16,1994 by the Spaceborne Imaging Radar-C/X-Band Synthetic Aperture Radar (SIR-C/X-SAR) system aboard the space shuttle Endeavour. Both images show an area approximately 100 kilometers by 40 kilometers (62 miles by 25 miles) that is centered at 40.7 degrees North latitude and 73.5 degrees West longitude. North is toward the upper right. The optical image is dominated by city lights, which are particularly bright in the densely developed urban areas of New York City located on the left half of the photo. The brightest white zones appear on the island of Manhattan in the left center, and Central Park can be seen as a darker area in the middle of Manhattan. To the northeast (right) of the city, suburban Long Island appears as a less densely illuminated area, with the brightest zones occurring along major transportation and development corridors. Since radar is an active sensing system that provides its own illumination, the radar image shows a great amount of surface detail, despite the night-time acquisition. The colors in the radar image were obtained using the following radar channels: red represents the L-band (horizontally transmitted and received); green represents the L-band (horizontally transmitted and vertically received); blue represents the C-band (horizontally transmitted and vertically received). In this image, the water surface - the Atlantic Ocean along the bottom edge and Long Island Sound shown at the top edge - appears red because small waves at the surface strongly reflect the horizontally transmitted and received L-band radar signal. Networks of highways and railroad lines are clearly visible in the radar image; many of them can also be seen as bright lines i the optical image. The runways of John F. Kennedy International Airport appear as a dark rectangle in Jamaica Bay on the left side of the image. Developed areas appear generally as bright green and orange, while agricultural, protected and undeveloped areas appear darker blue or purple. This contrast can be seen on the barrier islands along the south coast of Long Island, which are heavily developed in the Rockaway and Long Beach areas south and east of Jamaica Bay, but further to the east, the islands are protected and undeveloped. http://photojournal.jpl.nasa.gov/catalog/PIA01785
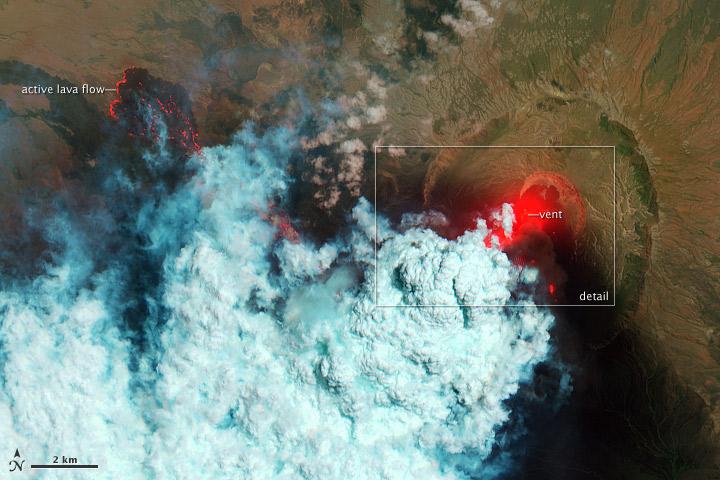
NASA image acquired June 24, 2011 Since it began erupting on June 12, 2011, emissions from Eritrea’s Nabro Volcano have drifted over much of East Africa and the Middle East. Ash has displaced residents living near the volcano and disrupted flights in the region. Despite the volcano’s widespread effects, little is known about the eruption. Nabro is located in an isolated region along the border between Eritrea and Ethiopia, and few English-language reports have been published. Satellite remote sensing is currently the only reliable way to monitor the ongoing eruption. This satellite image is among the first detailed pictures of the erupting vent and lava flows. They were acquired by the Advanced Land Imager (ALI) aboard the Earth Observing-1 (EO-1) satellite on June 24, 2011. The bright red portions of the false-color image (top) indicate hot surfaces. Hot volcanic ash glows above the vent, located in the center of Nabro’s caldera. To the west of the vent, portions of an active lava flow (particularly the front of the flow) are also hot. The speckled pattern on upstream portions of the flow are likely due to the cool, hardened crust splitting and exposing fluid lava as the flow advances. The bulbous blue-white cloud near the vent is likely composed largely of escaping water vapor that condensed as the plume rose and cooled. The whispy, cyan clouds above the lava flow are evidence of degassing from the lava. NASA Earth Observatory image by Robert Simmon, using EO-1 ALI data. Caption by Robert Simmon. Instrument: EO-1 - ALI To download the high res go here: <a href="http://earthobservatory.nasa.gov/IOTD/view.php?id=51216" rel="nofollow">earthobservatory.nasa.gov/IOTD/view.php?id=51216</a> <b><a href="http://www.nasa.gov/centers/goddard/home/index.html" rel="nofollow">NASA Goddard Space Flight Center</a></b> enables NASA’s mission through four scientific endeavors: Earth Science, Heliophysics, Solar System Exploration, and Astrophysics. Goddard plays a leading role in NASA’s accomplishments by contributing compelling scientific knowledge to advance the Agency’s mission. <b>Follow us on <a href="http://twitter.com/NASA_GoddardPix" rel="nofollow">Twitter</a></b> <b>Like us on <a href="http://www.facebook.com/pages/Greenbelt-MD/NASA-Goddard/395013845897?ref=tsd" rel="nofollow">Facebook</a></b> <b>Find us on <a href="http://web.stagram.com/n/nasagoddard/?vm=grid" rel="nofollow">Instagram</a></b>