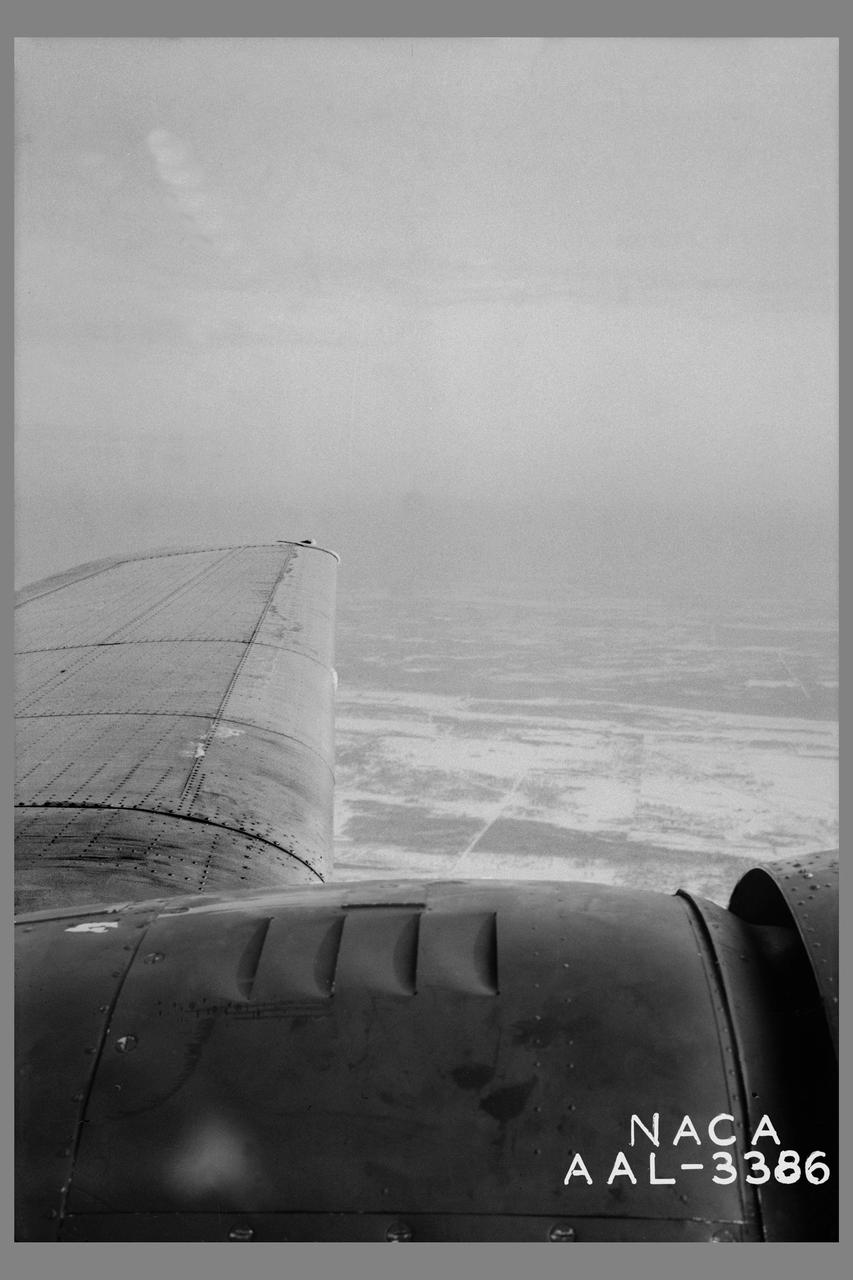
Minneapolis Ice research project: Ice formation on left wing of the Lockheed 12-A during flight after shutting off heat. The wind was completely cleared within 2 minutes after the application of heat.
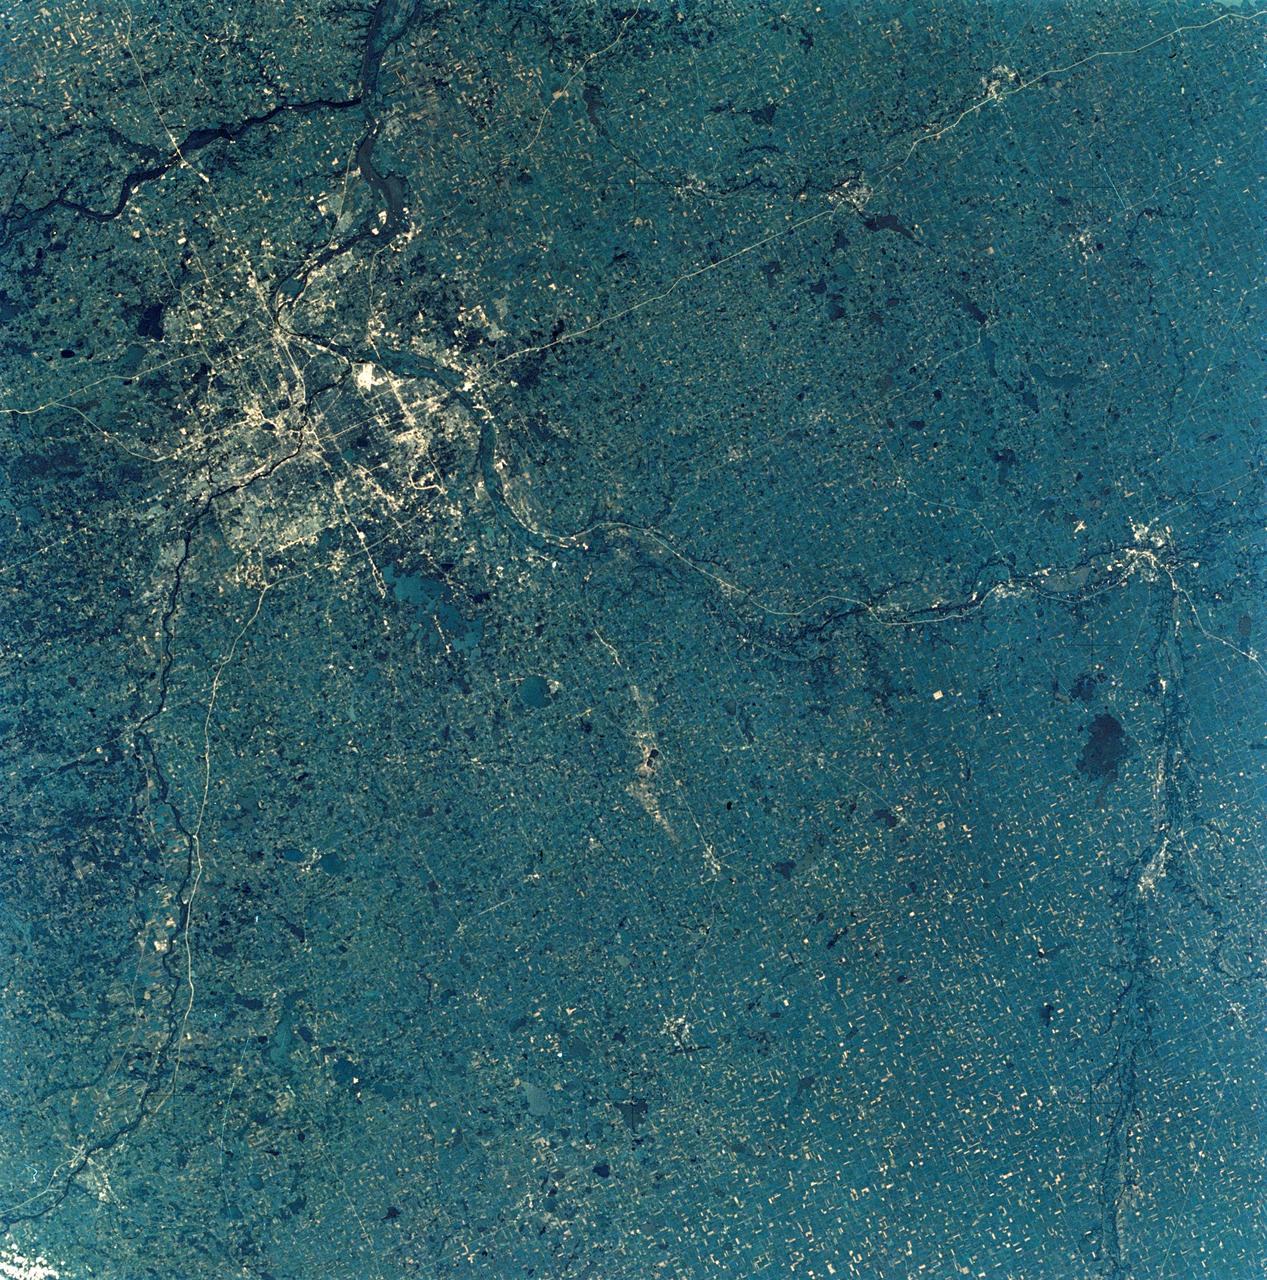
SL3-28-009 (July-September 1973) --- A near vertical view of the Minneapolis-St. Paul, Minnesota area, as photographed from Earth orbit by one of the six lenses of the Itek-furnished S190-A Multispectral Photographic Facility Experiment in the Multiple Docking Adapter of the Skylab space station. A 150mm lens, with SO-356 high definition Ektachrome film, was used to take this picture. The Mississippi River flows southeasterly through this large metropolitan area. Minneapolis is on the west bank of the Mississippi. The Minnesota River makes a large bend at the southern edge of the picture then flows northeasterly to empty into the Mississippi at Minneapolis-St. Paul. The St. Croix River, which serves as a portion of the boundary between Minnesota and Wisconsin, flows into the Mississippi downstream from the twin cities. A long, nearly straight, stretch of Interstate 35 leads southward from Minneapolis-St. Paul. Interstate 94 parallels the Mississippi toward the northwest. The highway and road network in the area is clearly visible. Note the numerous small lakes in the photograph. This view includes the smaller cities of Hastings, Faribault, Owatonna, Mankato, St. Peter, New Ulm and St. Cloud. The S190-A experiment is part of the Skylab Earth Resources Experiments Package. Photo credit: NASA

Landsat satellites collect data along a wide ground track that spans 185 kilometers (115 miles) but with a spatial resolution that allows them to see the human signature on the landscape. Each Landsat pixel covers a 30 by 30 meter area (98 by 98 feet), about the size of a baseball diamond. This visualization shows the Landsat path over Minneapolis, the site of the 2014 Major League Baseball All-Star game, and then zooms in to reveal the individual pixels. The green of the field and the white of the stadium are visible, before fading to an aerial photograph taken March 2010. See close up of stadium here: <a href="https://www.flickr.com/photos/gsfc/14662019381/in/photostream/">www.flickr.com/photos/gsfc/14662019381/in/photostream/</a> Credit: NASA/Goddard/Landsat <b><a href="http://www.nasa.gov/audience/formedia/features/MP_Photo_Guidelines.html" rel="nofollow">NASA image use policy.</a></b> <b><a href="http://www.nasa.gov/centers/goddard/home/index.html" rel="nofollow">NASA Goddard Space Flight Center</a></b> enables NASA’s mission through four scientific endeavors: Earth Science, Heliophysics, Solar System Exploration, and Astrophysics. Goddard plays a leading role in NASA’s accomplishments by contributing compelling scientific knowledge to advance the Agency’s mission. <b>Follow us on <a href="http://twitter.com/NASAGoddardPix" rel="nofollow">Twitter</a></b> <b>Like us on <a href="http://www.facebook.com/pages/Greenbelt-MD/NASA-Goddard/395013845897?ref=tsd" rel="nofollow">Facebook</a></b> <b>Find us on <a href="http://instagram.com/nasagoddard?vm=grid" rel="nofollow">Instagram</a></b>
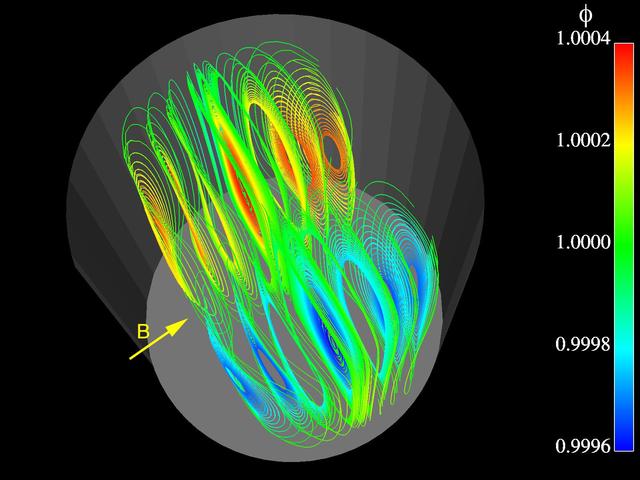
Advanced finite element models are used to study three-dimensional, time-dependent flow and segregation in crystal growth systems. In this image of a prototypical model for melt and crystal growth, pathlines at one instant in time are shown for the flow of heated liquid silicon in a cylindrical container. The container is subjected to g-jitter disturbances along the vertical axis. A transverse magnetic field is applied to control them. Such computations are extremely powerful for understanding melt growth in microgravity where g-jitter drives buoyant flows. The simulation is part of the Theoretical Analysis of 3D, Transient Convection and Segregation in Microgravity Bridgman Crystal Growth investigation by Dr. Jeffrey J. Derby of the University of Mirnesota, Minneapolis.
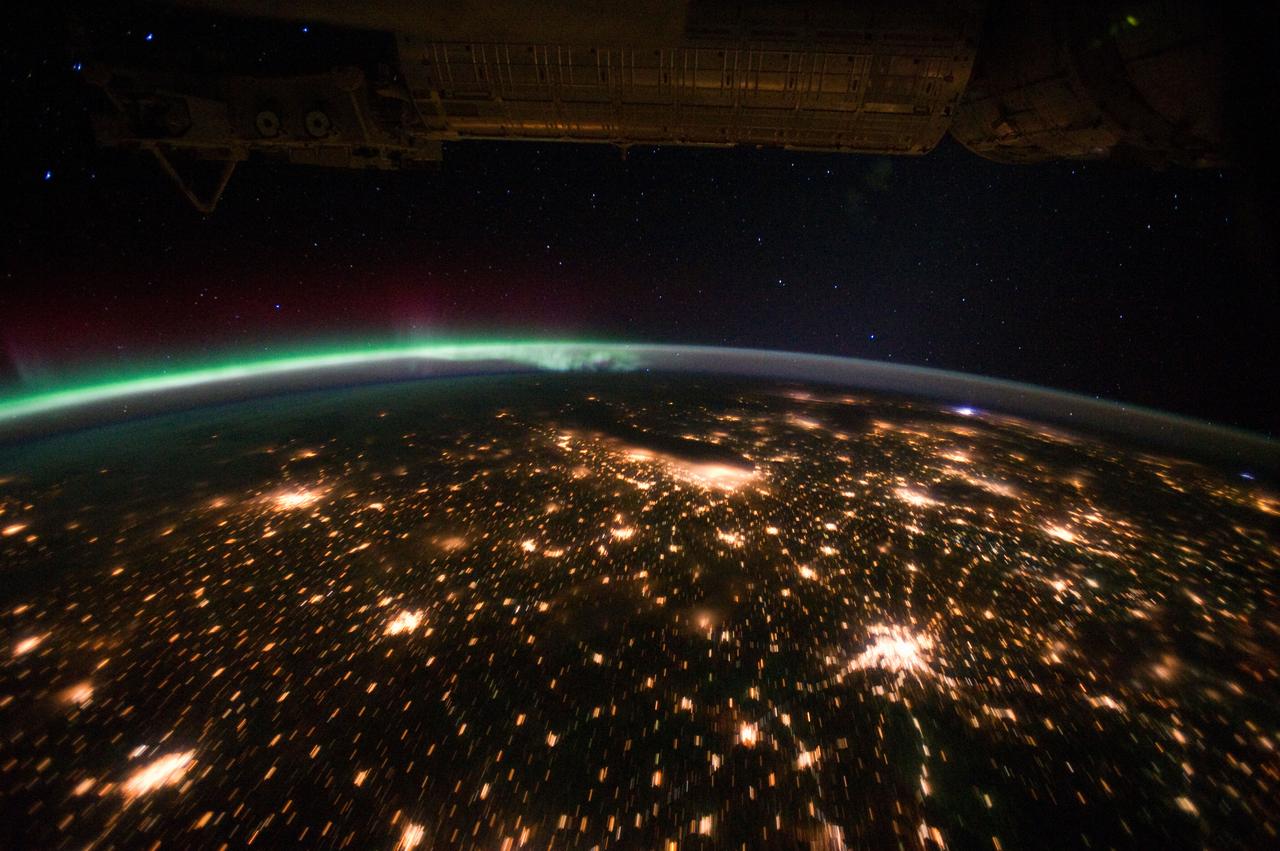
ISS029-E-012564 (29 Sept. 2011) --- The Midwestern United States at night with Aurora Borealis is featured in this image photographed by an Expedition 29 crew member on the International Space Station. The night skies viewed from the space station are illuminated with light from many sources. For example, the Midwestern United States presents a night-time appearance not unlike a patchwork quilt when viewed from orbit. The artificial light from human settlements appears everywhere with a characteristic yellow tinge in this photograph. But green light of the Aurora Borealis also appears strongly in this view (top left)—even seeming to be reflected off Earth’s surface—in Canada—beneath the aurora. A small white patch of light is almost certainly lightning from a storm on the East coast (top right). Part of the International Space Station appears across the top of the image. This photograph highlights the Chicago, IL, metropolitan area as the largest cluster of lights at center, next to the dark patch of Lake Michigan. The other largest metropolitan areas include St. Louis, MO (lower right), Minneapolis–St. Paul, MN (left) and the Omaha–Council Bluffs region on the Nebraska–Iowa border (lower left). City light clusters give an immediate sense of relative city size; demographers have used night time satellite imagery to make estimates of city populations, especially in the developing world where city growth can be very rapid. The U.S. northeast seaboard lies in the most oblique (meaning viewed at an angle) part of the image at top right, just beyond the Appalachian Mts., a dark winding zone without major cities. Scales change significantly in oblique views: Omaha is only 200 kilometers from Des Moines, but appears roughly the same distance from Minneapolis—which is actually 375 kilometers to the north of Des Moines. In addition to the major metropolitan areas, the rectangular NS/EW-oriented pattern of townships is clearly visible in the rural, lower left part of the image. This pattern instantly gives the sense of north orientation (toward the top left corner) and is a distinctive characteristic of the United States, so that ISS crew members can quickly know which continent they are flying over even at night. In contrast to the regular township pattern, interstate highways converge on St. Louis (e.g. Hwy 44), Chicago and other large cities, much like wheel spokes around a central hub. Rivers—major visual features in daylight—become almost invisible at night. The course of the Mississippi River appears as a slightly meandering zone from Minneapolis through St. Louis (dashed line)—the river course continues out of the lower right corner of the image.
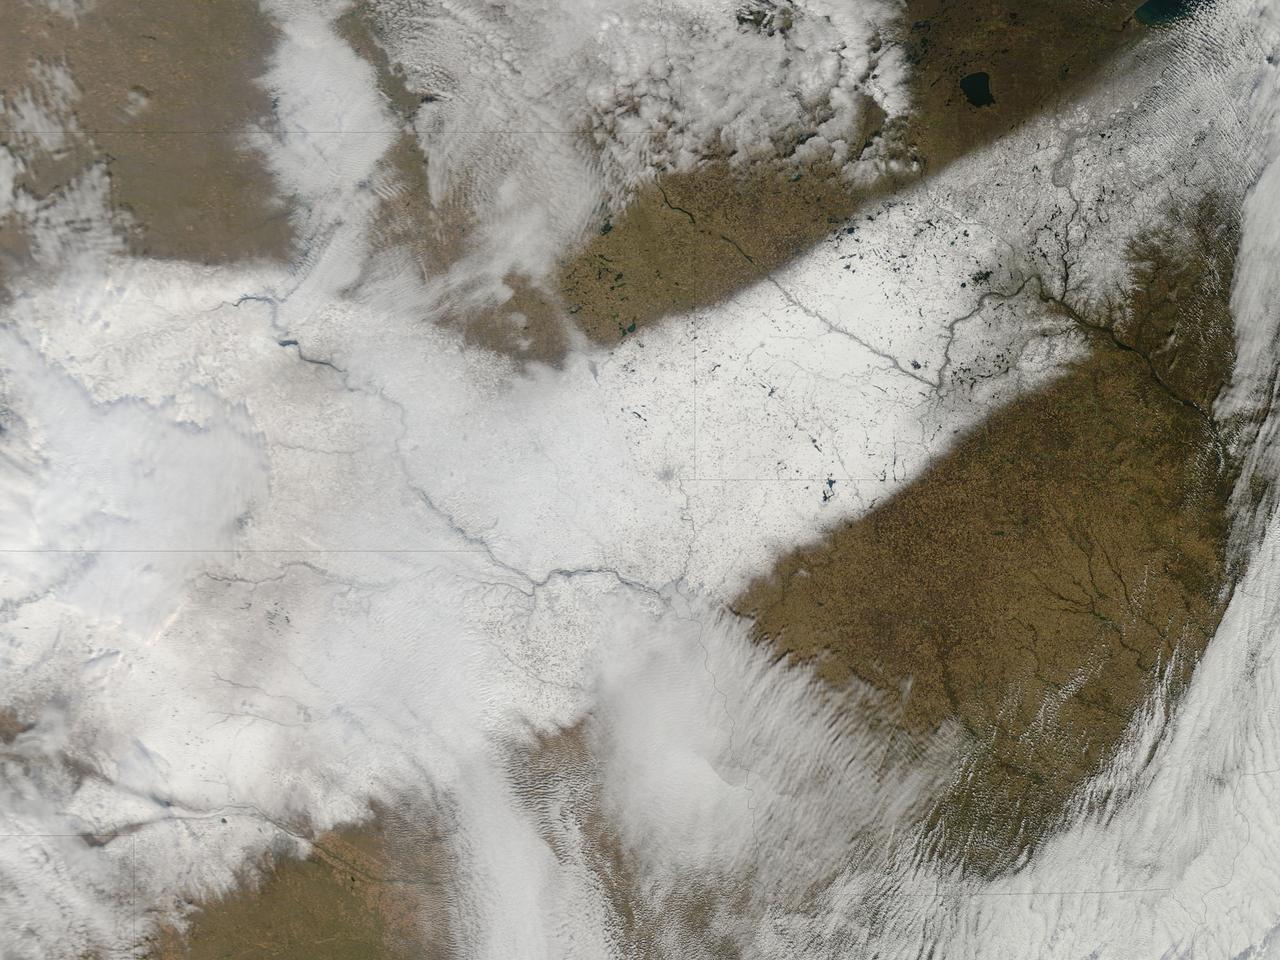
An autumn storm brought the first snow of the season to the Upper Mississippi River Valley and the Midwestern United States in early November, 2013. The Moderate Resolution Imaging Spectroradiometer (MODIS) aboard NASA’s Terra satellite captured this true color image on November 6 just as the storm was clearing. A long band of snow stretching from Colorado in the southwest to Wisconsin in the northeast marked the path of the blowing storm. According to WeatherBug, up to 10 inches blanketed Gordon, Nebraska and Pipestone, Minnesota. Most snow totals in the Central and Northern Plains and Upper Mississippi Valley ranged from 2-5 inches, while Minneapolis-St. Paul metro area picked up 1-2 inches of new snow from the event. Credit: NASA/GSFC/Jeff Schmaltz/MODIS Land Rapid Response Team <b><a href="http://www.nasa.gov/audience/formedia/features/MP_Photo_Guidelines.html" rel="nofollow">NASA image use policy.</a></b> <b><a href="http://www.nasa.gov/centers/goddard/home/index.html" rel="nofollow">NASA Goddard Space Flight Center</a></b> enables NASA’s mission through four scientific endeavors: Earth Science, Heliophysics, Solar System Exploration, and Astrophysics. Goddard plays a leading role in NASA’s accomplishments by contributing compelling scientific knowledge to advance the Agency’s mission. <b>Follow us on <a href="http://twitter.com/NASA_GoddardPix" rel="nofollow">Twitter</a></b> <b>Like us on <a href="http://www.facebook.com/pages/Greenbelt-MD/NASA-Goddard/395013845897?ref=tsd" rel="nofollow">Facebook</a></b> <b>Find us on <a href="http://instagram.com/nasagoddard?vm=grid" rel="nofollow">Instagram</a></b>
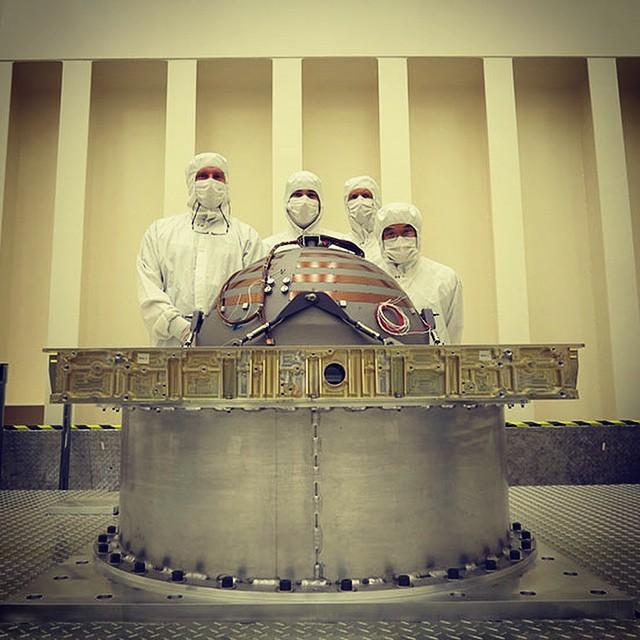
The Soil Moisture Active Passive (SMAP) mission, scheduled for launch on Jan. 29, will measure the moisture in Earth's soil with greater accuracy and higher resolution than any preceding mission, producing a global map of soil moisture every three days. Here are five quick facts about the spacecraft and what it studies. 1. Soil moisture is a tiny fraction of water with a big punch. Only 0.001 percent of Earth's total water is lodged in the top few feet of soil. That tiny percentage, however, affects all living things on land and plays an important role in moving water, carbon and heat between land and atmosphere. 2. Soil moisture can compound water risks. A flood follows a heavy rainfall -- but only if the ground cannot soak up the rain. Waterlogged soil makes a region more flood-prone. Going to the opposite extreme, a drought can parch soil to such an extent that plants are unable to grow even after a few rains have fallen. Knowing soil moisture allows hydrologists to make better decisions related to the risk of flooding and drought, such as how much water to retain in reservoirs. 3. Soil moisture controls the on-off switch for carbon dioxide cleanup. The world's vast northern forests remove carbon dioxide from the air as they grow, helping to clean up our emissions from burning fossil fuels. But when the ground freezes, that process switches off. Carbon dioxide builds up in the atmosphere until the ground thaws in the spring and plants begin growing again. Knowing where and for how long the ground is frozen or thawed is an important part of understanding the role of the northern forests in reducing greenhouse warming. SMAP will map frozen and thawed soils north of 45 degrees north latitude (about the latitude of Minneapolis), around the globe. 4. SMAP is a twofer. The spacecraft's radiometer produces an accurate reading of how much moisture is in the top two inches (five centimeters) of soil, but it has low spatial resolution, that is, one measurement covers a large area. A radar instrument produces an image with higher spatial resolution, but it can't measure soil moisture as accurately as a radiometer. Through sophisticated data processing, SMAP combines observations from the two instruments into a very accurate measurement with high spatial resolution. 5. SMAP has a huge, folding, spinning antenna. At 19 feet 8 inches (6 meters) in diameter, SMAP's rotating mesh antenna dwarfs the size of the instruments and spacecraft and is the largest rotating antenna of its kind that NASA has yet deployed. But the entire dish furls into a cylinder one foot (diameter) by four feet (30 by 120 centimeters) to fit inside the rocket’s fairing for launch, and it weighs only 128 pounds (about 58 kilograms). For more information about SMAP, see: <a href="http://smap.jpl.nasa.gov/" rel="nofollow">smap.jpl.nasa.gov/</a> <a href="http://www.nasa.gov/smap/" rel="nofollow">www.nasa.gov/smap/</a> <b><a href="http://www.nasa.gov/audience/formedia/features/MP_Photo_Guidelines.html" rel="nofollow">NASA image use policy.</a></b> <b><a href="http://www.nasa.gov/centers/goddard/home/index.html" rel="nofollow">NASA Goddard Space Flight Center</a></b> enables NASA’s mission through four scientific endeavors: Earth Science, Heliophysics, Solar System Exploration, and Astrophysics. Goddard plays a leading role in NASA’s accomplishments by contributing compelling scientific knowledge to advance the Agency’s mission. <b>Follow us on <a href="http://twitter.com/NASAGoddardPix" rel="nofollow">Twitter</a></b> <b>Like us on <a href="http://www.facebook.com/pages/Greenbelt-MD/NASA-Goddard/395013845897?ref=tsd" rel="nofollow">Facebook</a></b> <b>Find us on <a href="http://instagram.com/nasagoddard?vm=grid" rel="nofollow">Instagram</a></b>