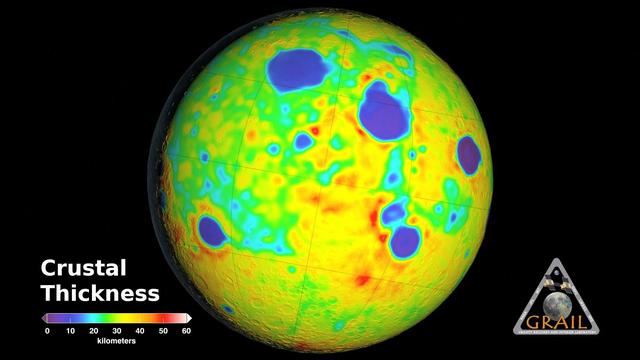
Map of Moon Crust
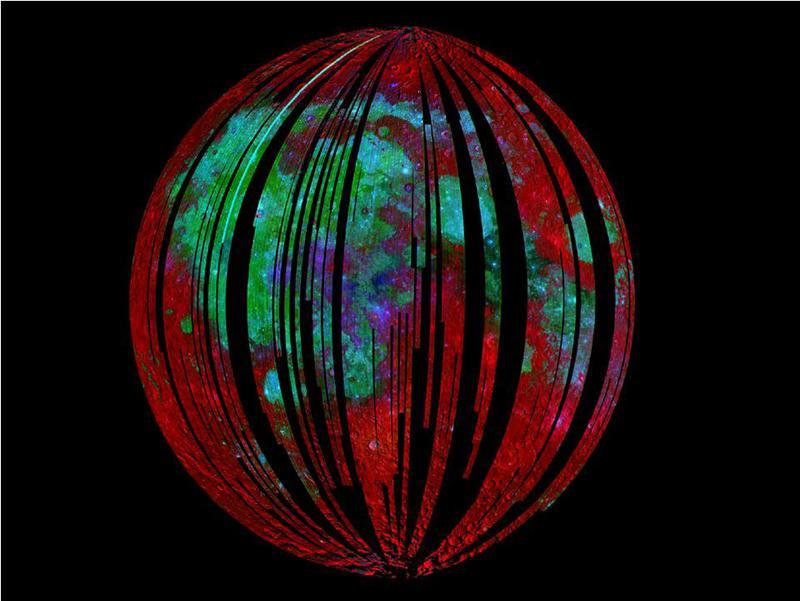
Mineral Mapping the Moon
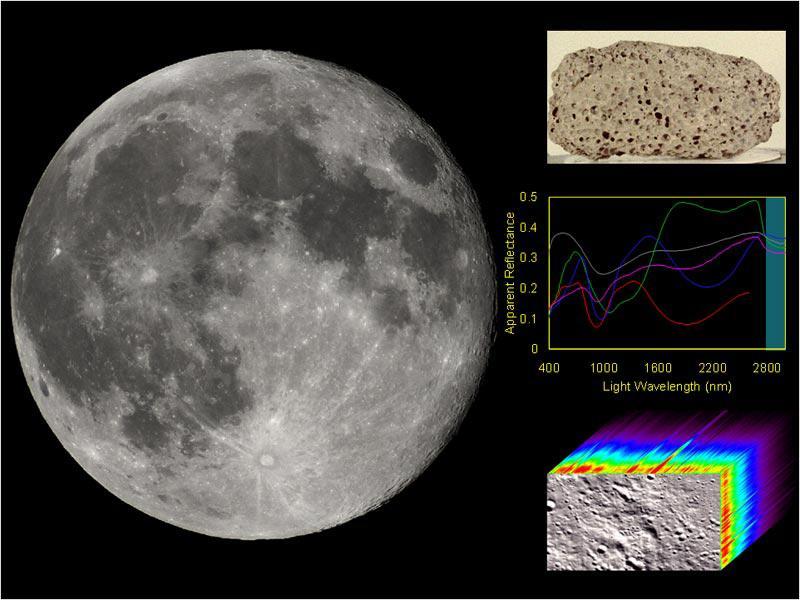
Mapping the Moon, Point by Point
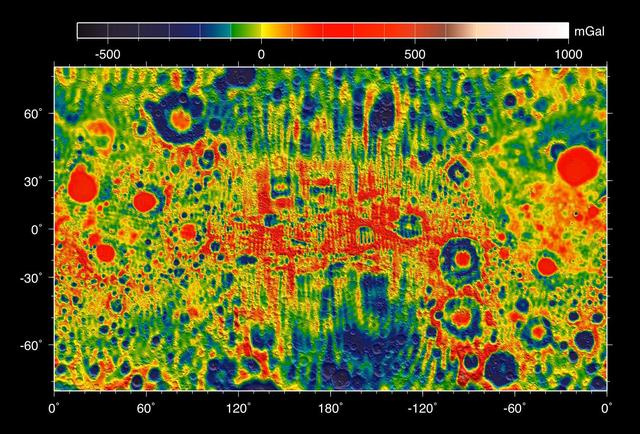
This still image features a free-air gravity map of the Moon's southern latitudes developed by S. Goossens et al. from data returned by the Gravity Recovery and Interior Laboratory (GRAIL) mission. If the Moon were a perfectly smooth sphere of uniform density, the gravity map would be a single, featureless color, indicating that the force of gravity at a given elevation was the same everywhere. But like other rocky bodies in the solar system, including Earth, the Moon has both a bumpy surface and a lumpy interior. Spacecraft in orbit around the Moon experience slight variations in gravity caused by both of these irregularities. The free-air gravity map shows deviations from the mean gravity that a cueball Moon would have. The deviations are measured in milliGals, a unit of acceleration. On the map, purple is at the low end of the range, at around -400 mGals, and red is at the high end near +400 mGals. Yellow denotes the mean. The map shown here extends from the south pole of the Moon up to 50°S and reveals the gravity for that region in even finer detail than the global gravity maps published previously. The image illustrates the very good correlation between the gravity map and topographic features such as peaks and craters, as well as the mass concentration lying beneath the large Schrödinger basin in the center of the frame. The terrain in the image is based on Lunar Reconnaissance Orbiter (LRO) altimeter and camera data. Credit: NASA's Scientific Visualization Studio <b><a href="http://www.nasa.gov/audience/formedia/features/MP_Photo_Guidelines.html" rel="nofollow">NASA image use policy.</a></b> <b><a href="http://www.nasa.gov/centers/goddard/home/index.html" rel="nofollow">NASA Goddard Space Flight Center</a></b> enables NASA’s mission through four scientific endeavors: Earth Science, Heliophysics, Solar System Exploration, and Astrophysics. Goddard plays a leading role in NASA’s accomplishments by contributing compelling scientific knowledge to advance the Agency’s mission. <b>Follow us on <a href="http://twitter.com/NASAGoddardPix" rel="nofollow">Twitter</a></b> <b>Like us on <a href="http://www.facebook.com/pages/Greenbelt-MD/NASA-Goddard/395013845897?ref=tsd" rel="nofollow">Facebook</a></b> <b>Find us on <a href="http://instagram.com/nasagoddard?vm=grid" rel="nofollow">Instagram</a></b>
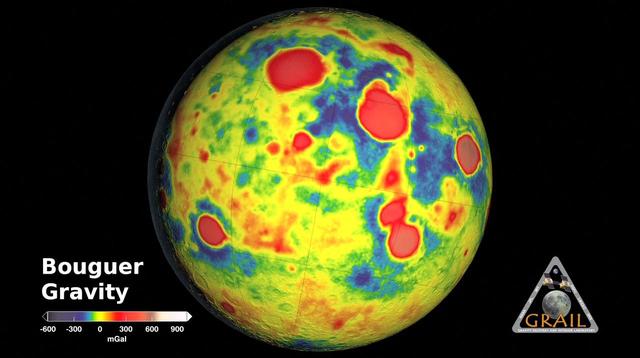
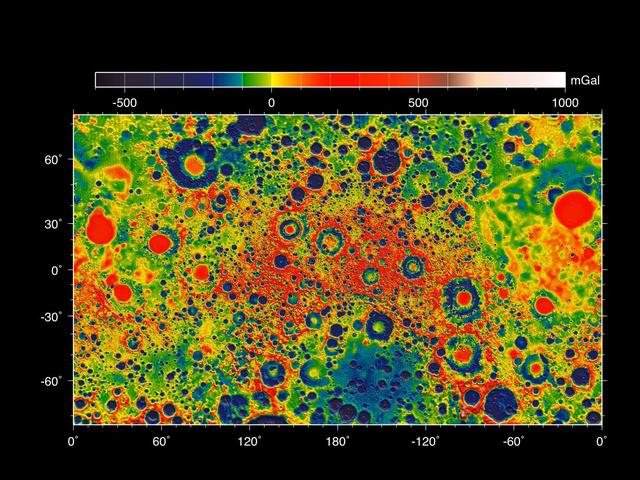
GRAIL Bouguer Gravity Moon Map
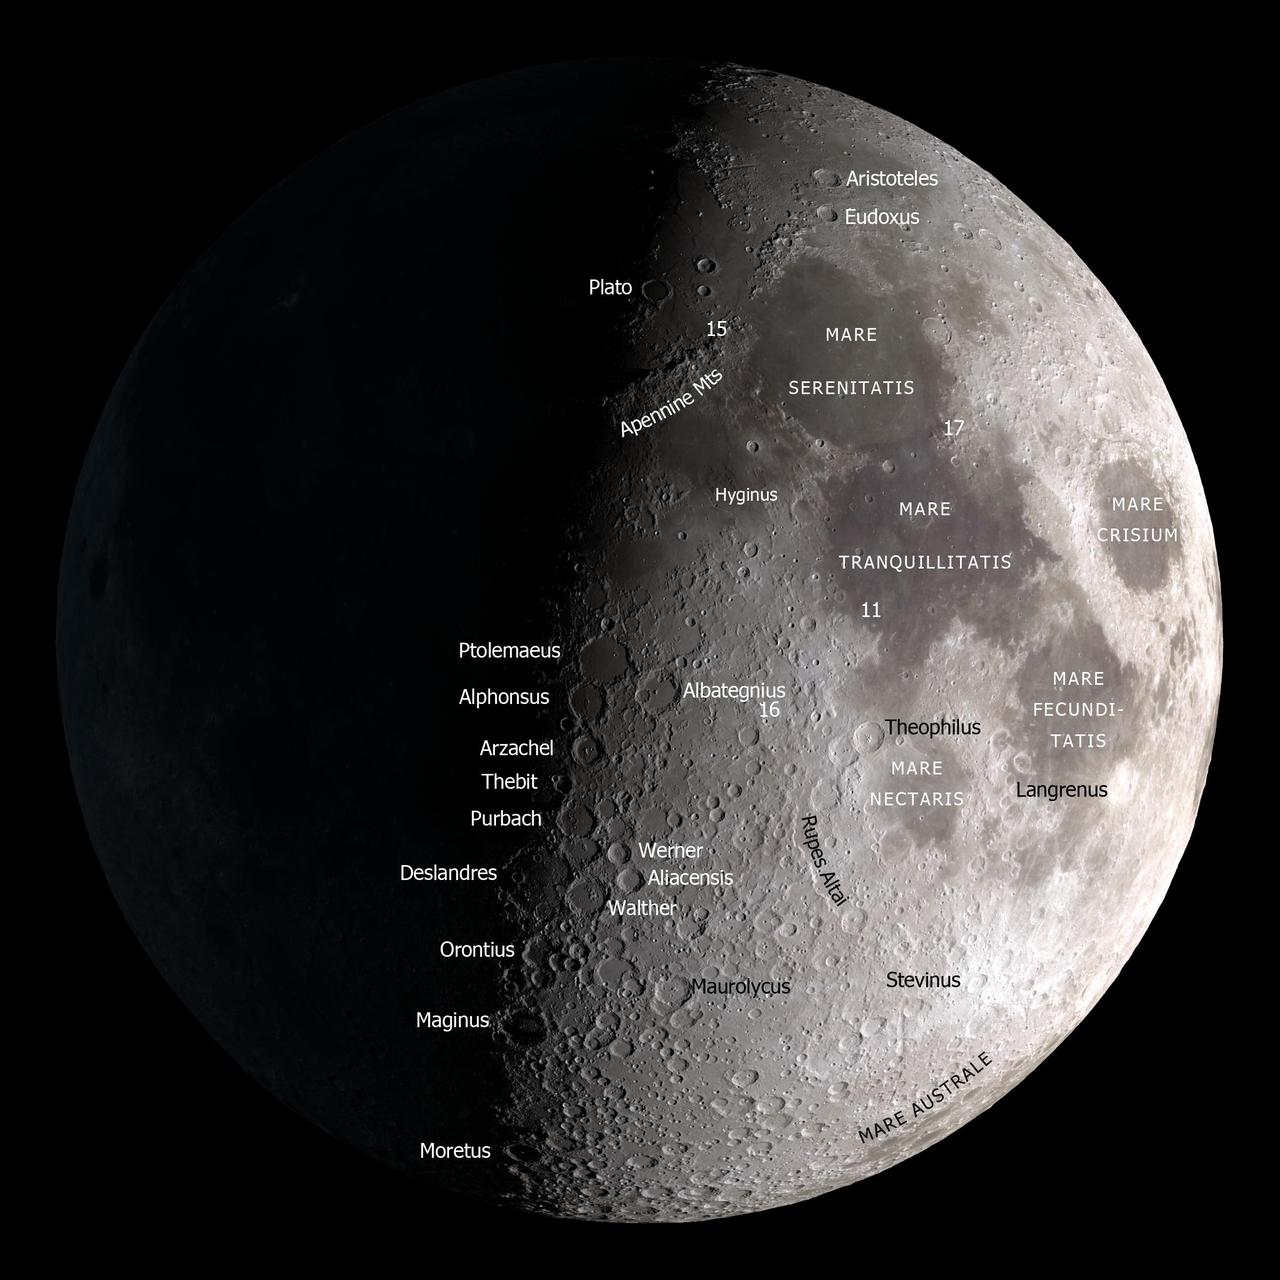
A map of the Moon on a black background for October 12, 2013 at 12:00 UT. Labeled features include maria, craters, a mountain range, a scarp, a rille, and four Apollo landing sites. Credit: NASA's Goddard Space Flight Center Scientific Visualization Studio <b><a href="http://www.nasa.gov/audience/formedia/features/MP_Photo_Guidelines.html" rel="nofollow">NASA image use policy.</a></b> <b><a href="http://www.nasa.gov/centers/goddard/home/index.html" rel="nofollow">NASA Goddard Space Flight Center</a></b> enables NASA’s mission through four scientific endeavors: Earth Science, Heliophysics, Solar System Exploration, and Astrophysics. Goddard plays a leading role in NASA’s accomplishments by contributing compelling scientific knowledge to advance the Agency’s mission. <b>Follow us on <a href="http://twitter.com/NASA_GoddardPix" rel="nofollow">Twitter</a></b> <b>Like us on <a href="http://www.facebook.com/pages/Greenbelt-MD/NASA-Goddard/395013845897?ref=tsd" rel="nofollow">Facebook</a></b> <b>Find us on <a href="http://instagram.com/nasagoddard?vm=grid" rel="nofollow">Instagram</a></b>
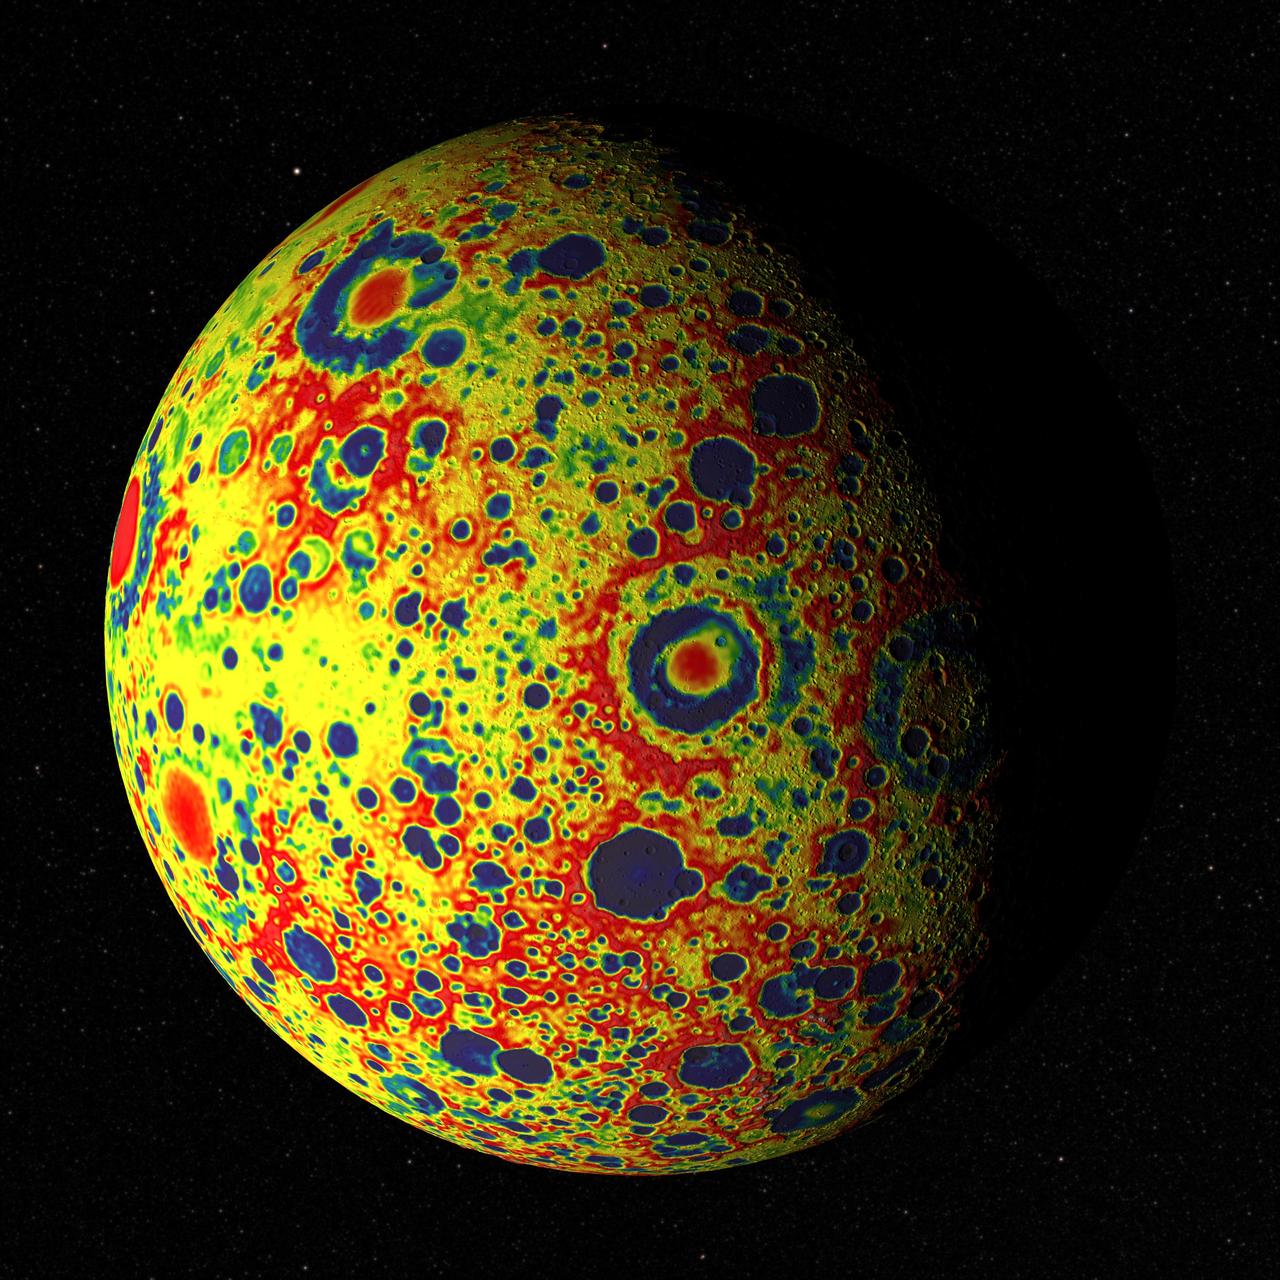
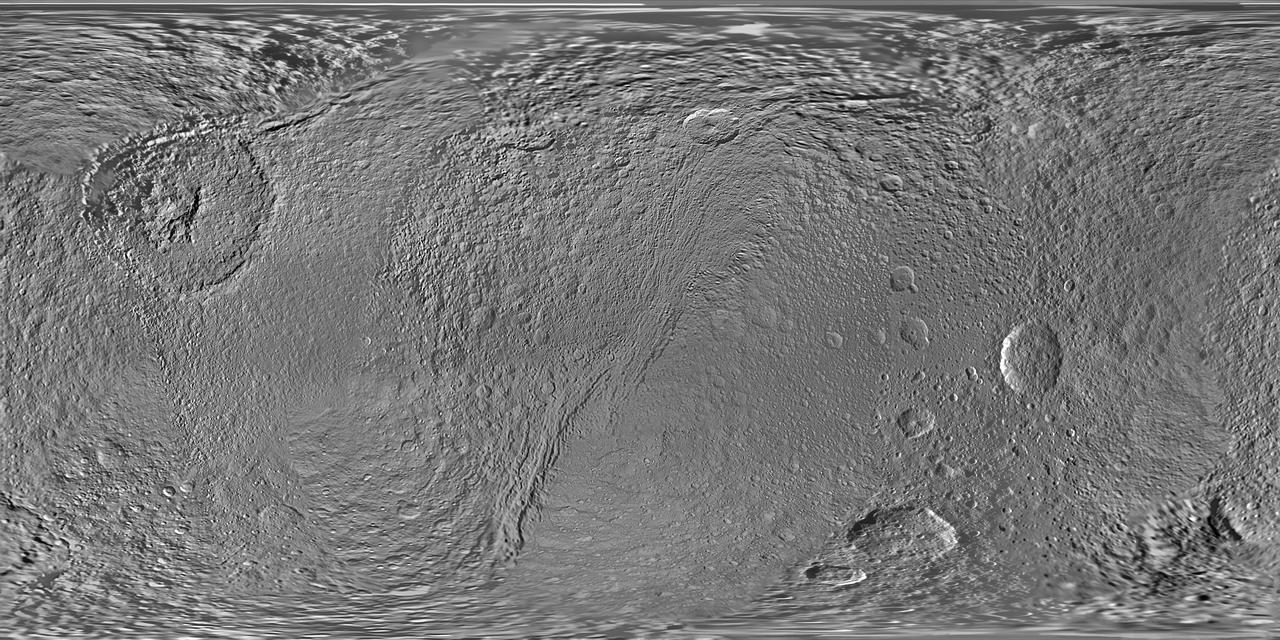
If the Moon were a perfectly smooth sphere of uniform density, the gravity map would be a single, featureless color, indicating that the force of gravity at a given elevation was the same everywhere. But like other rocky bodies in the solar system, including Earth, the Moon has both a bumpy surface and a lumpy interior. Spacecraft in orbit around the Moon experience slight variations in gravity caused by both of these irregularities. The free-air gravity map shows deviations from the mean, the gravity that a cueball Moon would have. The deviations are measured in milliGals, a unit of acceleration. On the map, dark purple is at the low end of the range, at around -400 mGals, and red is at the high end near +400 mGals. Yellow denotes the mean. These views show a part of the Moon's surface that's never visible from Earth. They are centered on lunar coordinates 29°N 142°E. The large, multi-ringed impact feature near the center is Mare Moscoviense. The crater Mendeleev is south of this. The digital elevation model for the terrain is from the Lunar Reconnaissance Orbiter laser altimeter (LOLA). Merely for plausibility, the sun angle and starry background are accurate for specific dates (December 21, 2012, 0:00 UT and January 8, 2013, 14:00 UT, respectively). To see or download more views go to: <a href="http://svs.gsfc.nasa.gov/goto?4041" rel="nofollow">svs.gsfc.nasa.gov/goto?4041</a> Credit: NASA's Goddard Goddard Space Flight Center Scientific Visualization Studio <b><a href="http://www.nasa.gov/audience/formedia/features/MP_Photo_Guidelines.html" rel="nofollow">NASA image use policy.</a></b> <b><a href="http://www.nasa.gov/centers/goddard/home/index.html" rel="nofollow">NASA Goddard Space Flight Center</a></b> enables NASA’s mission through four scientific endeavors: Earth Science, Heliophysics, Solar System Exploration, and Astrophysics. Goddard plays a leading role in NASA’s accomplishments by contributing compelling scientific knowledge to advance the Agency’s mission. <b>Follow us on <a href="http://twitter.com/NASA_GoddardPix" rel="nofollow">Twitter</a></b> <b>Like us on <a href="http://www.facebook.com/pages/Greenbelt-MD/NASA-Goddard/395013845897?ref=tsd" rel="nofollow">Facebook</a></b> <b>Find us on <a href="http://instagram.com/nasagoddard?vm=grid" rel="nofollow">Instagram</a></b>
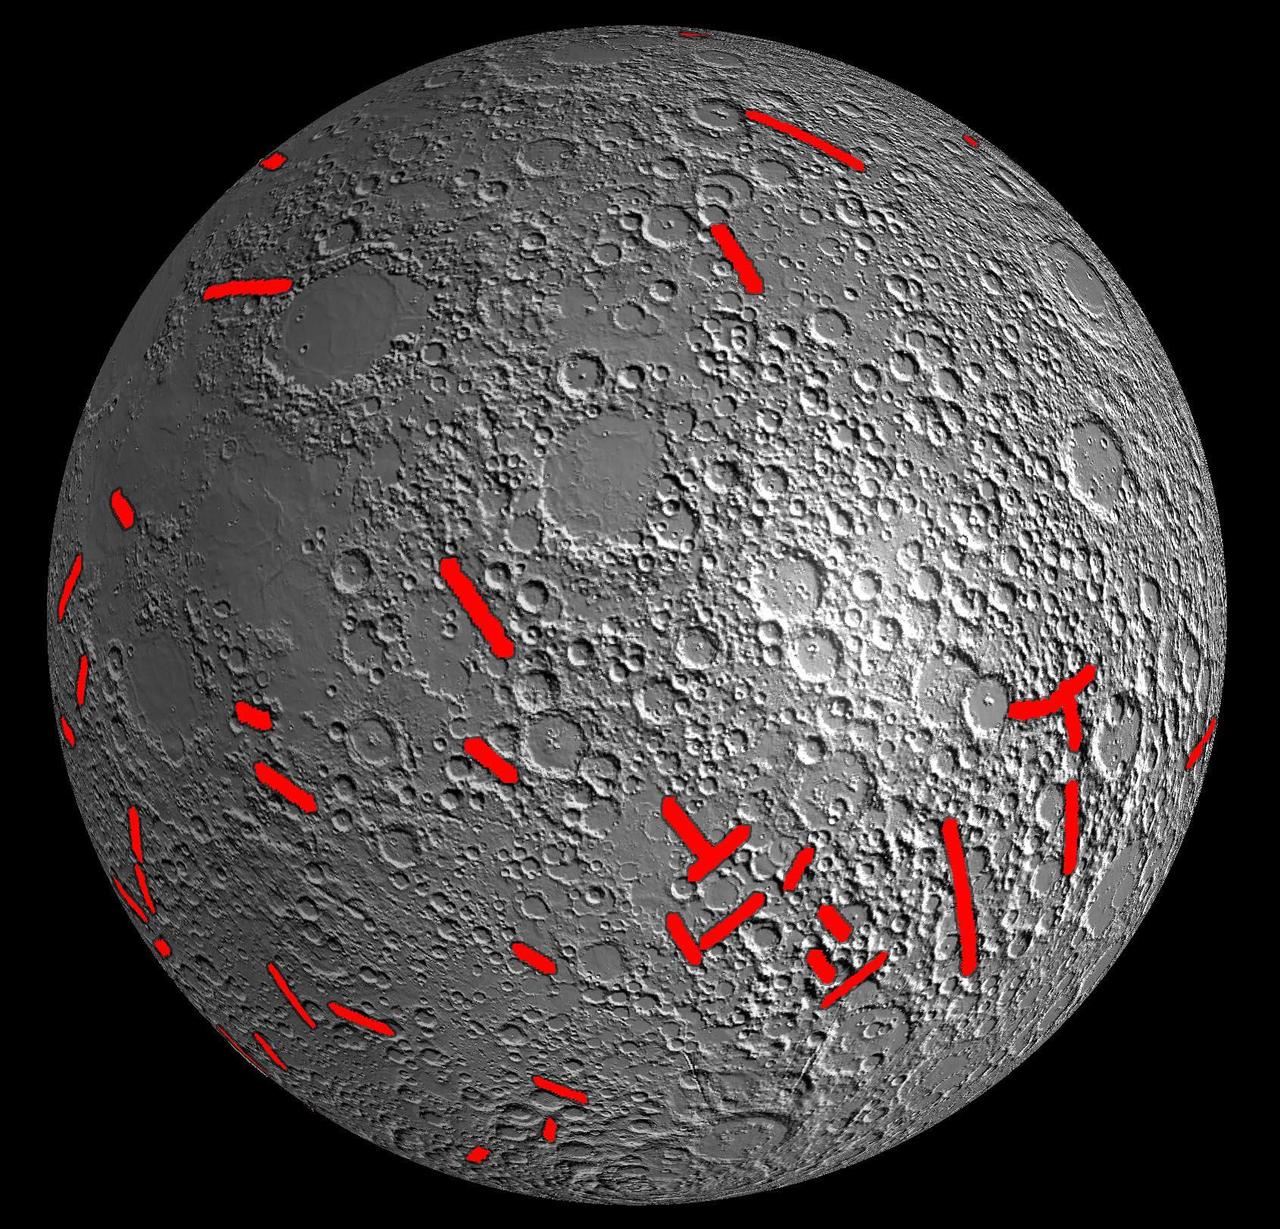
This map of one side of the moon shows the location of some of the giant dikes identified by NASA GRAIL mission.

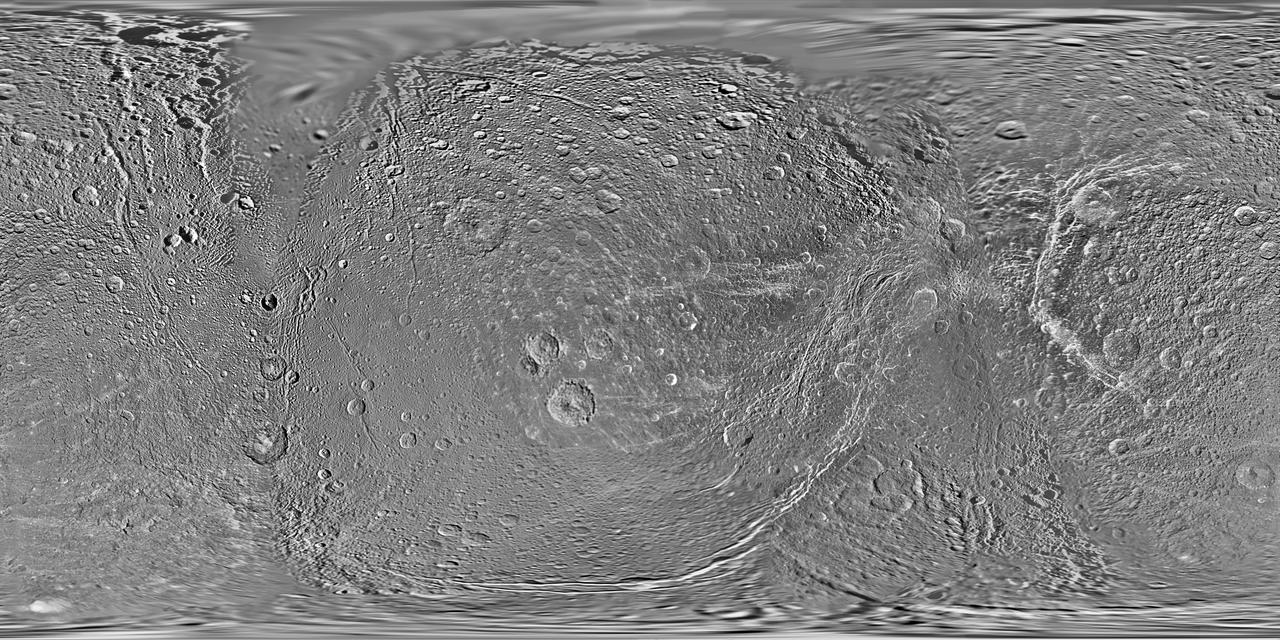
The science team of NASA's New Horizons mission has produced this global map of Pluto's largest moon, Charon. The map includes all available resolved images of the surface acquired between July 7-14, 2015, at pixel resolutions ranging from 40 kilometers (24 miles) on the anti-Pluto facing hemisphere (left and right sides of the map), to 400 meters (1,250 feet) per pixel on portions of the Pluto-facing hemisphere -- the side facing the New Horizons spacecraft when it flew past the dwarf planet -- at map center. Many additional images now stored on the spacecraft's digital data recorders are expected to be transmitted "home" in fall 2015 and these will be used to complete the global map. The map is in simple cylindrical projection, with zero longitude (the Pluto-facing direction) in the center. http://photojournal.jpl.nasa.gov/catalog/PIA19866
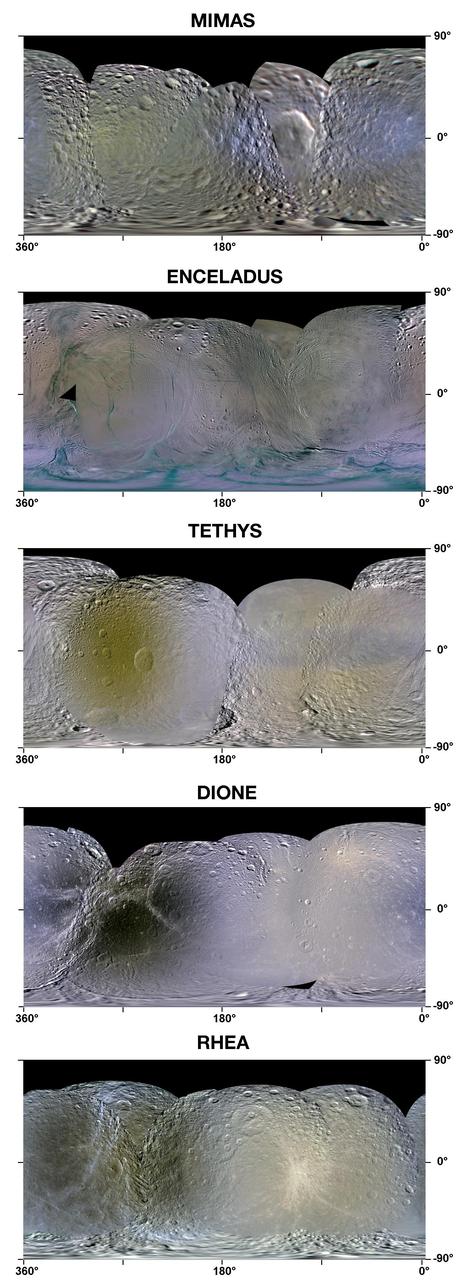
This set of enhanced-color maps made from data obtained by NASA Cassini spacecraft show Saturn moons Mimas, Enceladus, Tethys, Dione and Rhea.
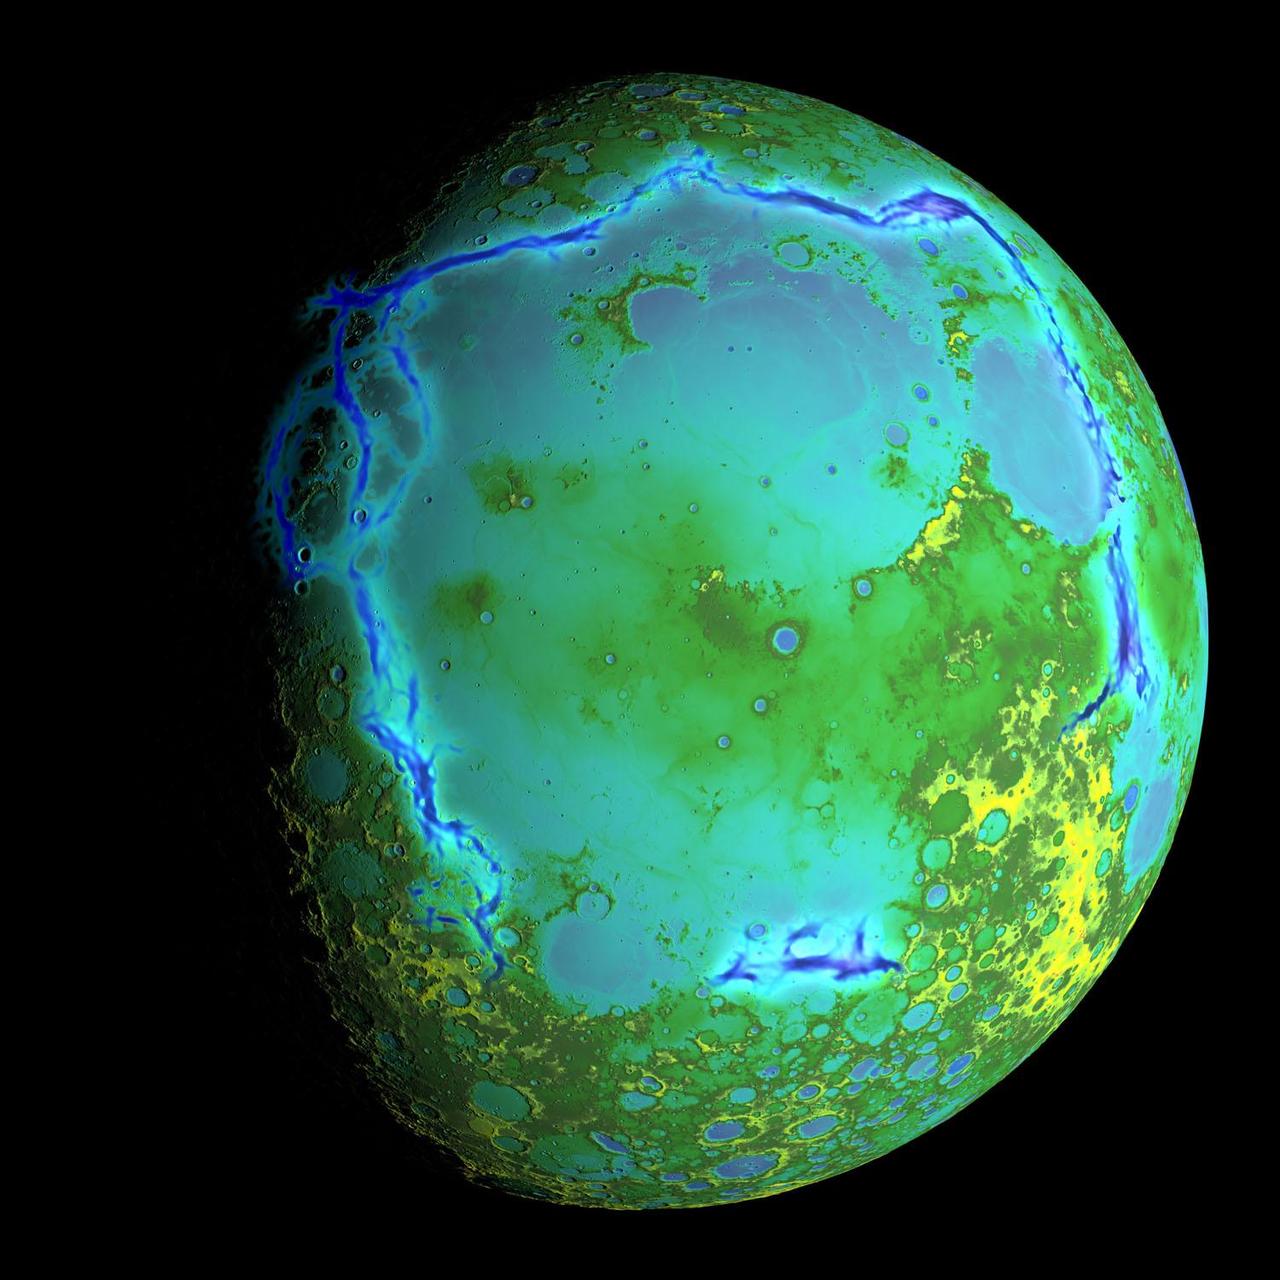
Topography of Earth's moon generated from data collected by the Lunar Orbiter Laser Altimeter, aboard NASA's Lunar Reconnaissance Orbiter, with the gravity anomalies bordering the Procellarum region superimposed in blue. The border structures are shown using gravity gradients calculated with data from NASA's Gravity Recovery and Interior Laboratory (GRAIL) mission. These gravity anomalies are interpreted as ancient lava-flooded rift zones buried beneath the volcanic plains (or maria) on the nearside of the Moon. Launched as GRAIL A and GRAIL B in September 2011, the probes, renamed Ebb and Flow, operated in a nearly circular orbit near the poles of the moon at an altitude of about 34 miles (55 kilometers) until their mission ended in December 2012. The distance between the twin probes changed slightly as they flew over areas of greater and lesser gravity caused by visible features, such as mountains and craters, and by masses hidden beneath the lunar surface. The twin spacecraft flew in a nearly circular orbit until the end of the mission on Dec. 17, 2012, when the probes intentionally were sent into the moon's surface. NASA later named the impact site in honor of late astronaut Sally K. Ride, who was America's first woman in space and a member of the GRAIL mission team. GRAIL's prime and extended science missions generated the highest-resolution gravity field map of any celestial body. The map will provide a better understanding of how Earth and other rocky planets in the solar system formed and evolved. The GRAIL mission was managed by NASA's Jet Propulsion Laboratory (JPL) in Pasadena, California, for NASA's Science Mission Directorate in Washington. The mission was part of the Discovery Program managed at NASA's Marshall Space Flight Center in Huntsville, Alabama. GRAIL was built by Lockheed Martin Space Systems in Denver. For more information about GRAIL, please visit <a href="http://grail.nasa.gov" rel="nofollow">grail.nasa.gov</a>. Credit: NASA/Colorado School of Mines/MIT/GSFC/Scientific Visualization Studio
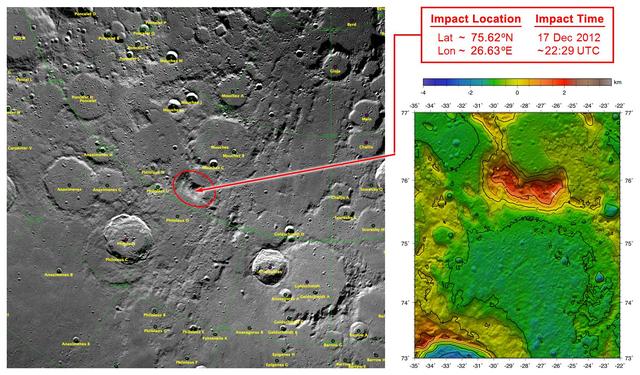
These maps of Earth moon highlight the region where the twin spacecraft of NASA Gravity Recovery and Interior Laboratory GRAIL mission will impact on Dec. 17, marking the end of its successful endeavor to map the moon gravity.
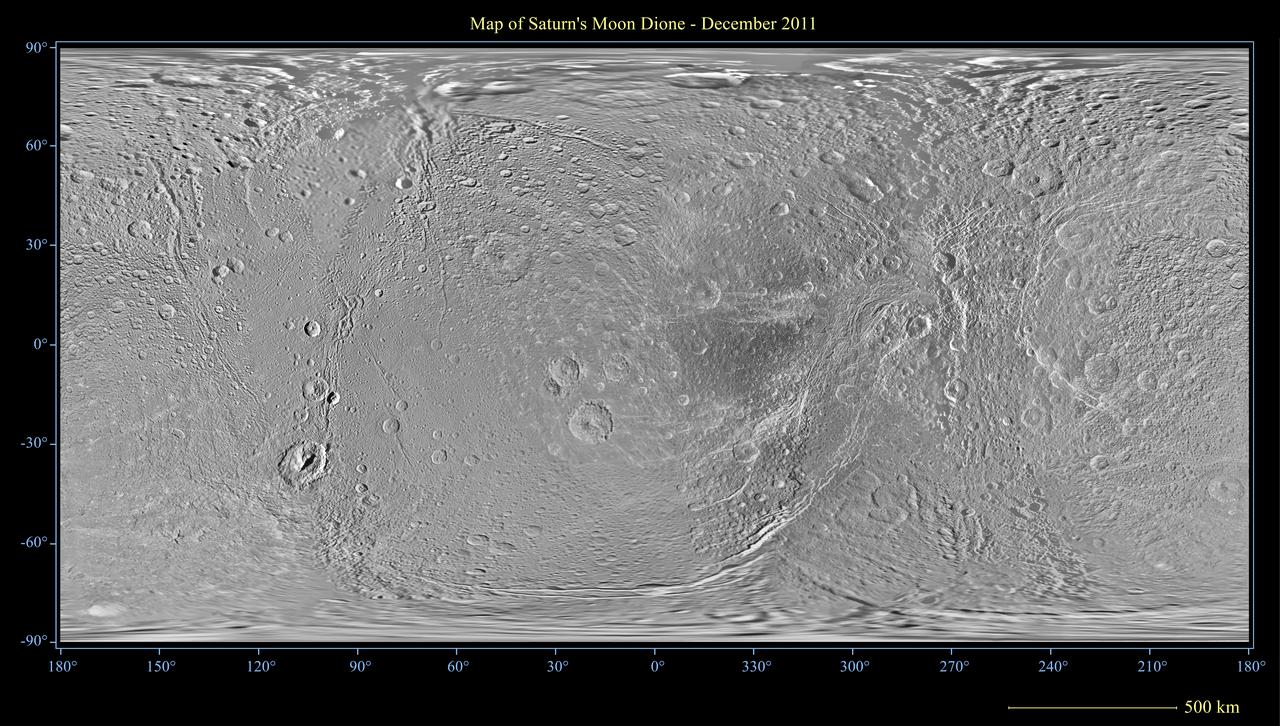
This global map of Saturn moon Dione was created using images taken during flybys by NASA Cassini spacecraft. This global map of Saturn moon Dione was created using images taken during flybys by NASA Cassini spacecraft.
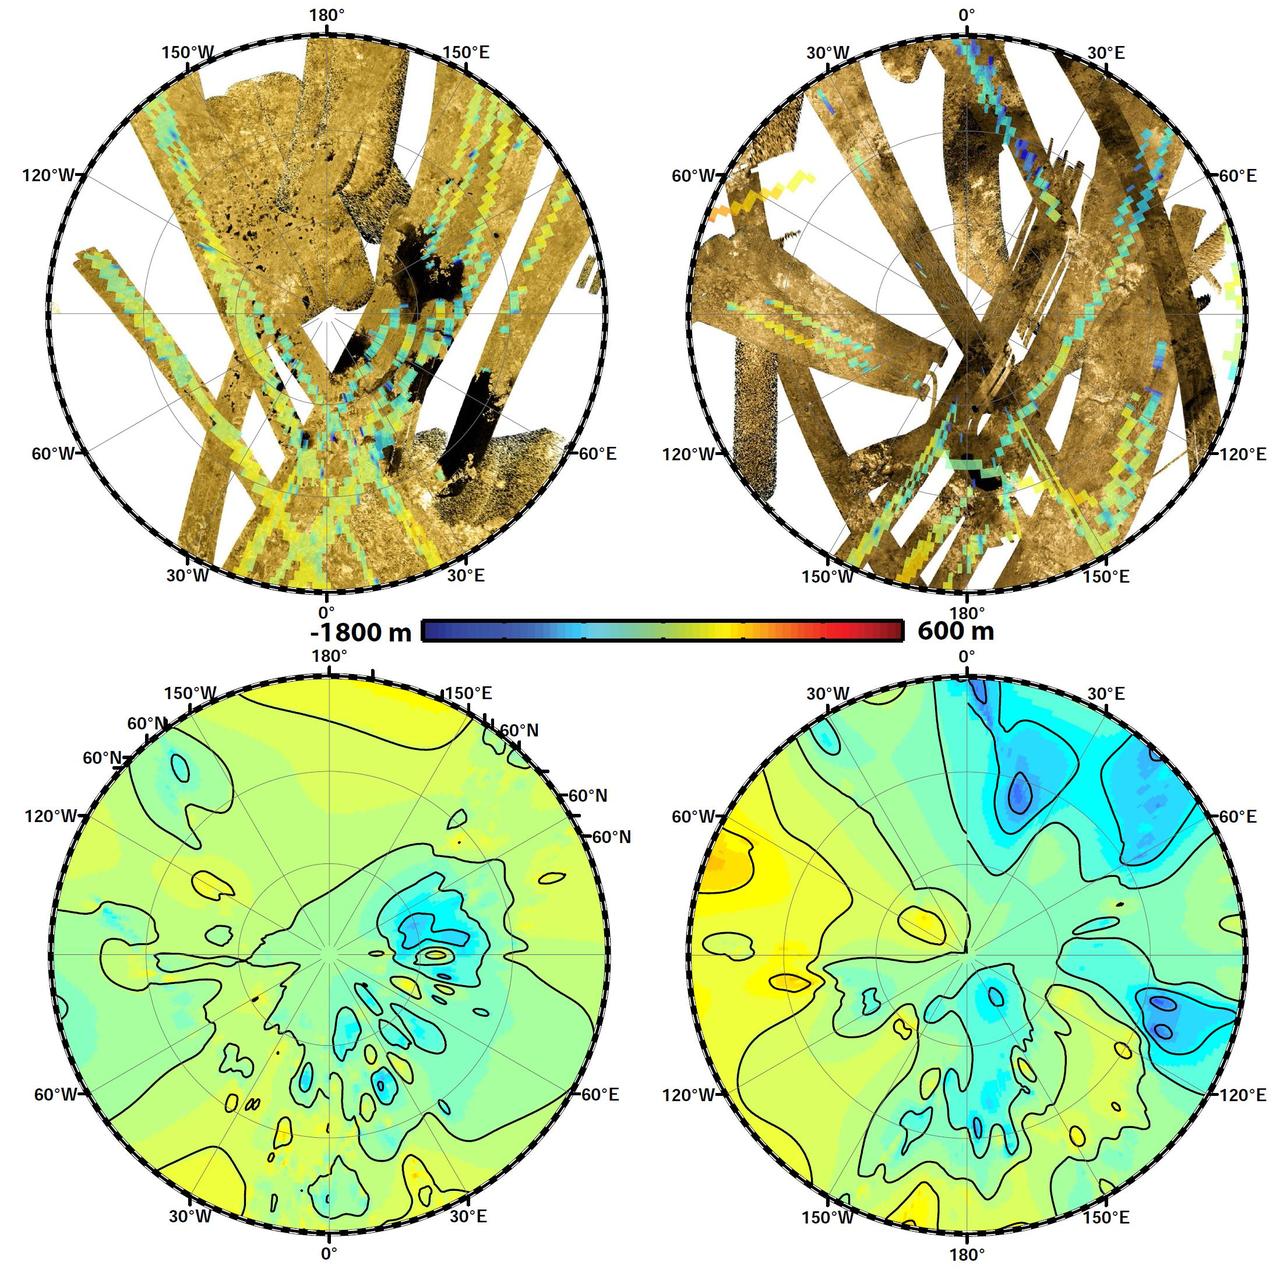
These polar maps show the first global, topographic mapping of Saturn moon Titan, using data from NASA Cassini mission. To create these maps, scientists employed a mathematical process called splining.
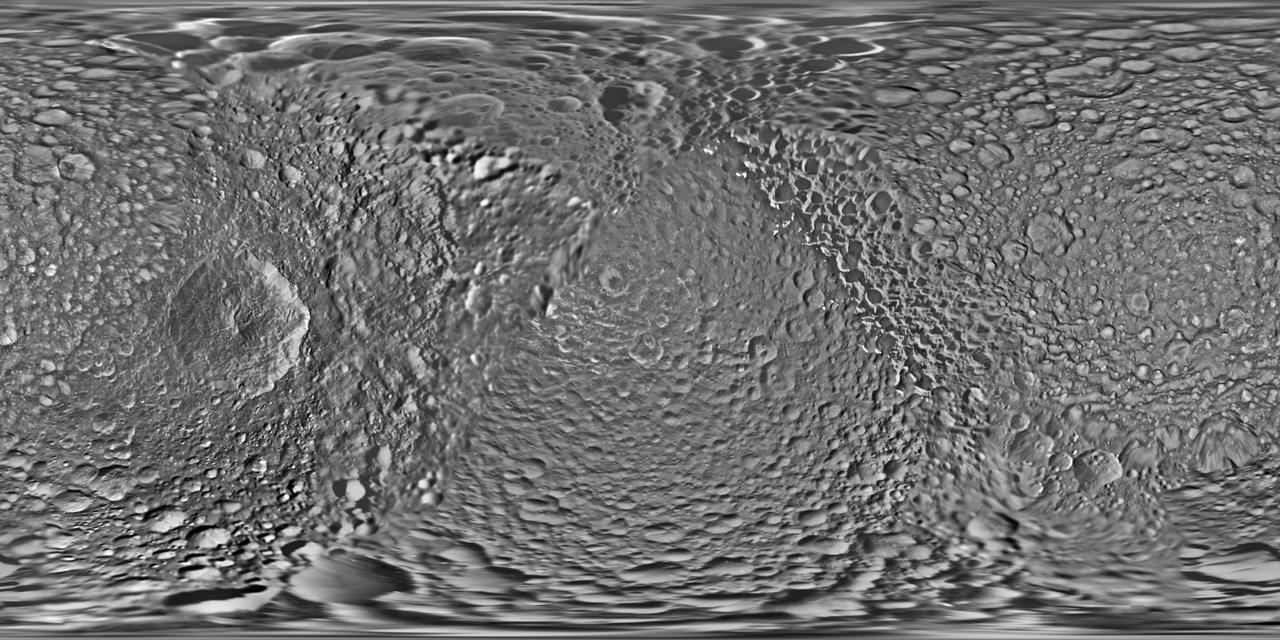
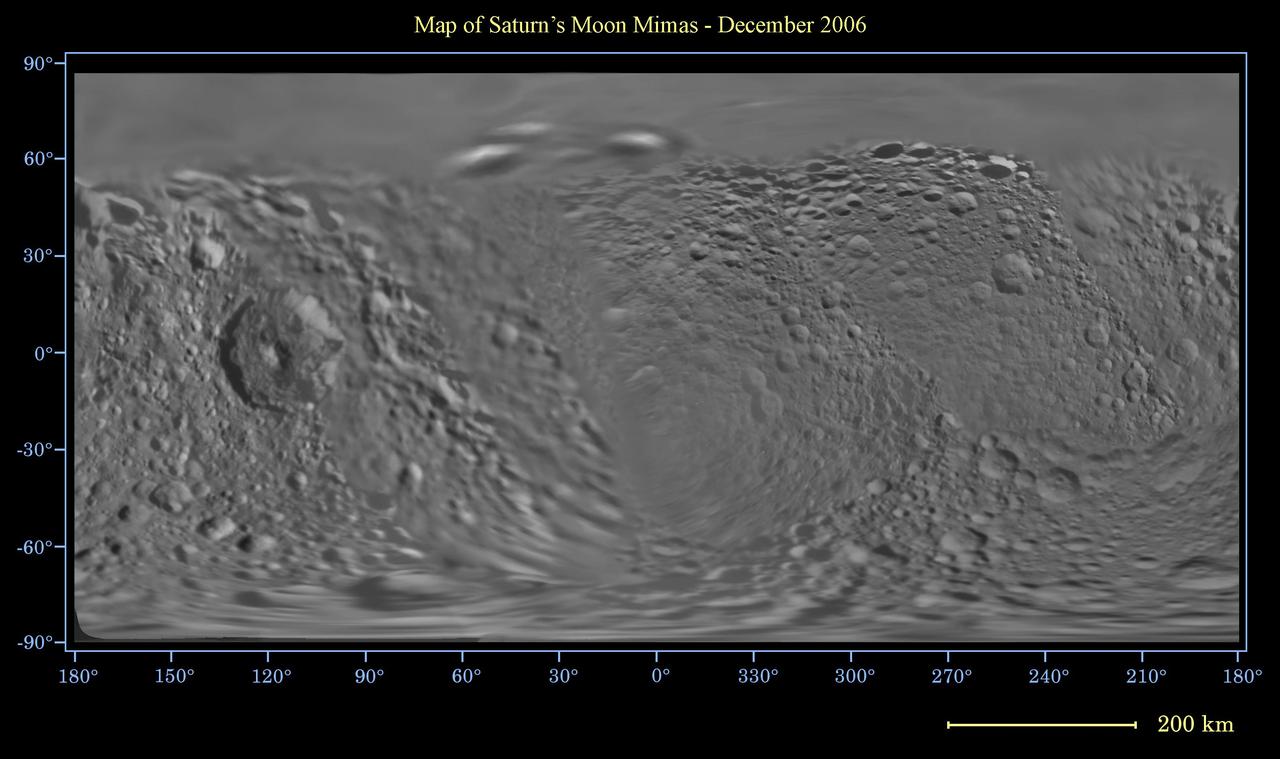
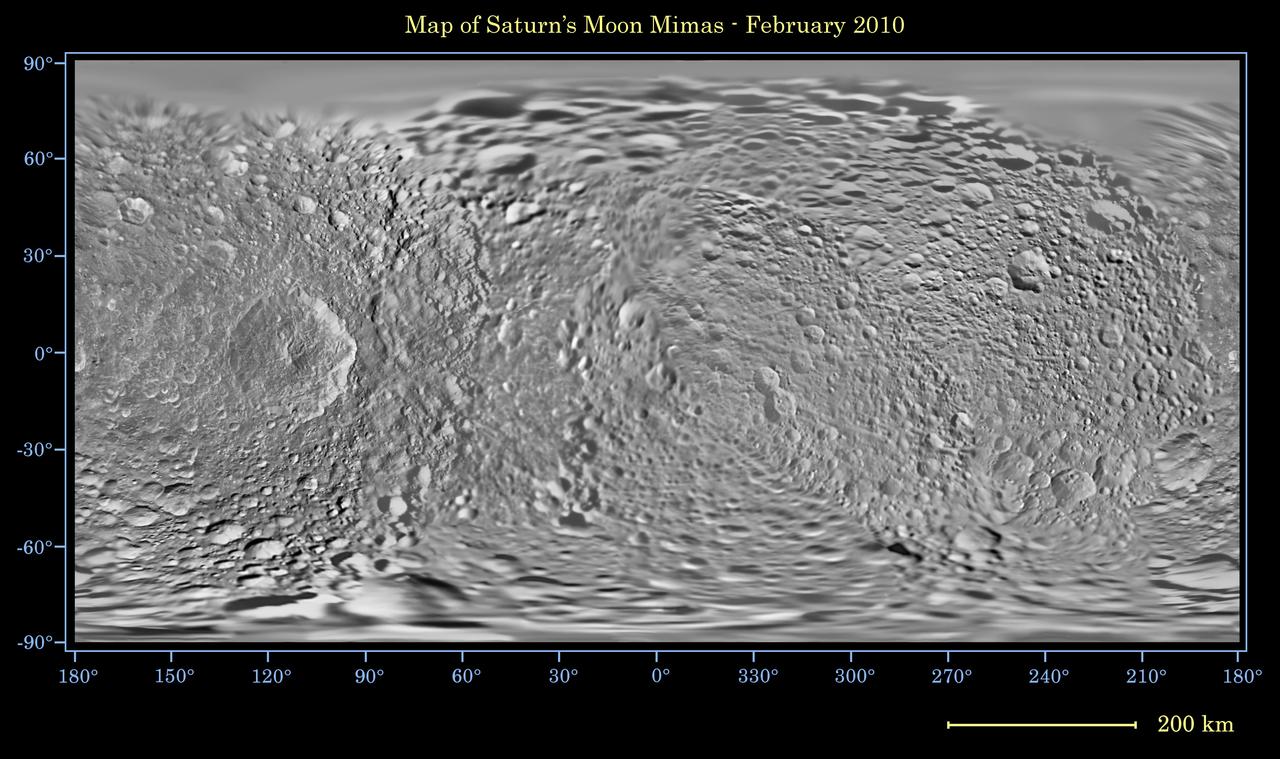
This global map of Saturn's moon Mimas was created using images taken during Cassini spacecraft flybys. The moon's large, distinguishing crater, Herschel, is seen on the map at left. The map is an equidistant (simple cylindrical) projection and has a scale of 710 feet (216 meters) per pixel at the equator. The mean radius of Mimas used for projection of this map is 123.2 miles (198.2 kilometers). The resolution of the map is 16 pixels per degree. The update includes new images for almost half of the moon's surface, with new images from two close flybys, in Nov. 2016 and Feb. 2017. The moon's western hemisphere, south pole and parts of the eastern hemisphere received updates in this version. https://photojournal.jpl.nasa.gov/catalog/PIA17214
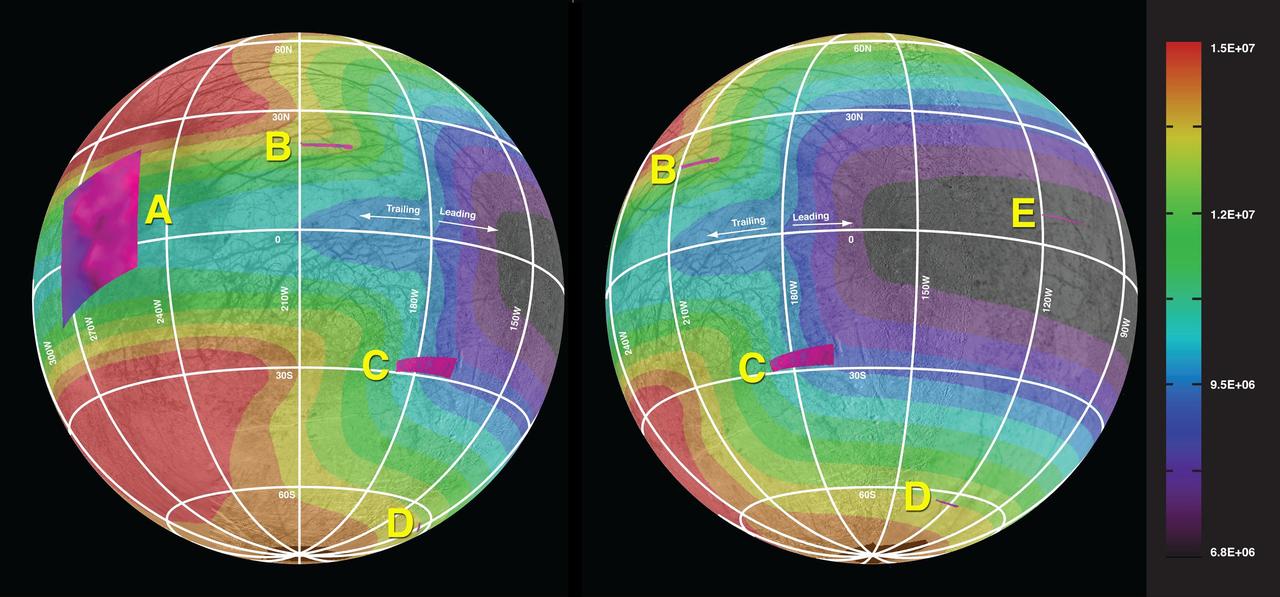
This graphic of Jupiter moon Europa maps a relationship between the amount of energy deposited onto the moon from charged-particle bombardment and chemical contents of ice deposits.
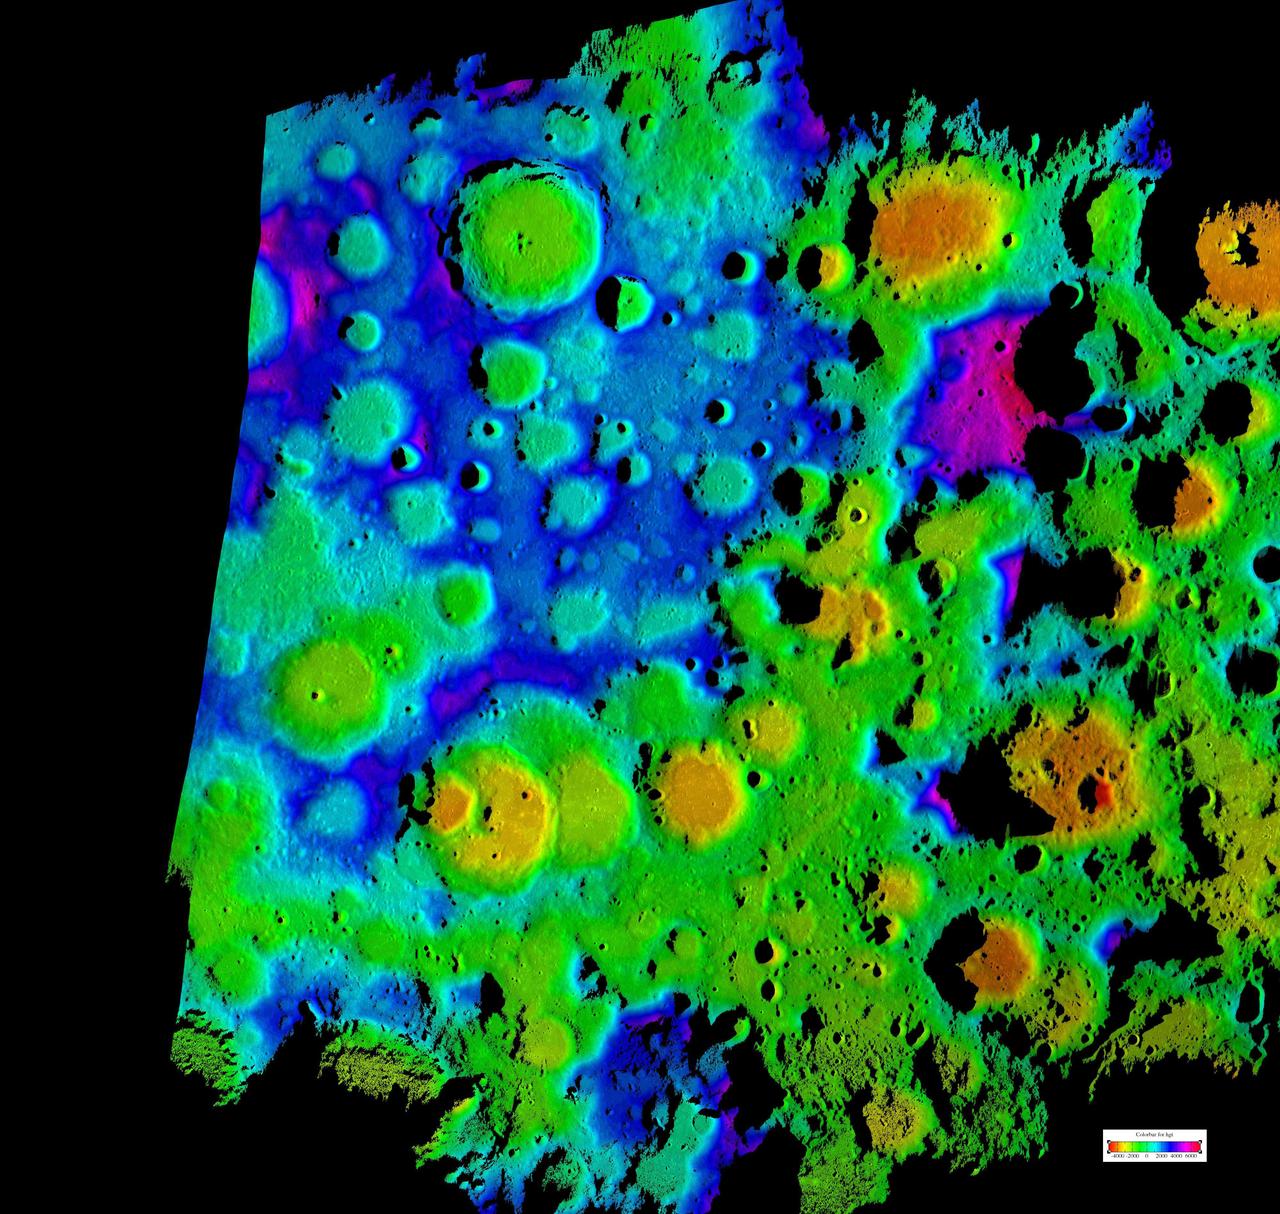
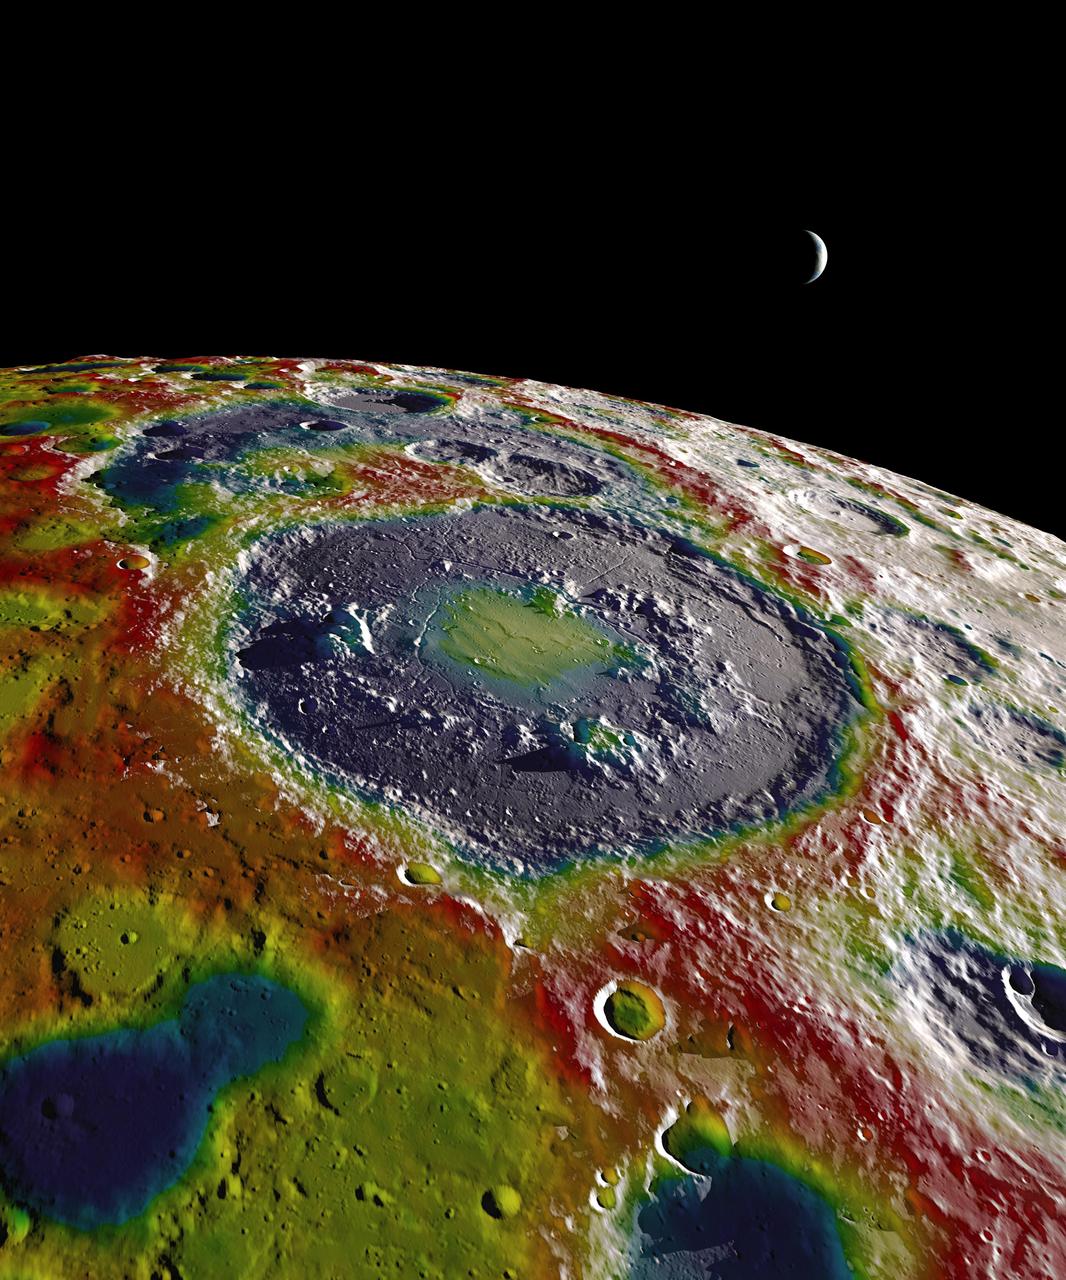
This composite image depicts the moon rugged south polar region in two lights. The color image is the highest resolution topography map to date of the moon south pole.
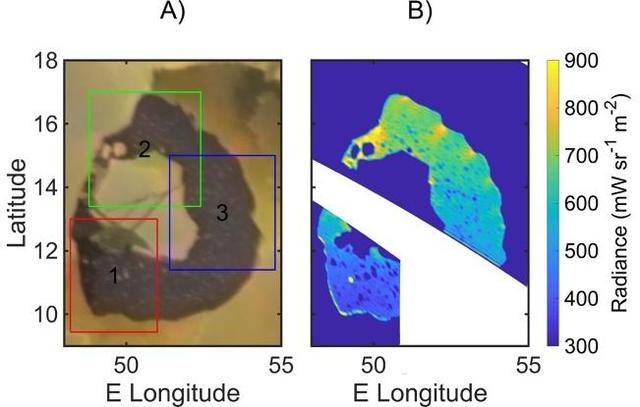
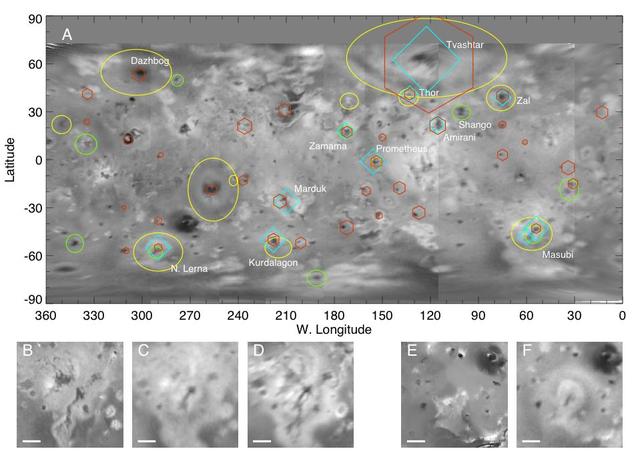
A map of infrared radiance in Loki Patera on Jupiter's moon Io, as measured by the Jovian Infrared Auroral Mapper (JIRAM) instrument aboard NASA's Juno spacecraft, right, and by NASA's Voyager 1, left. https://photojournal.jpl.nasa.gov/catalog/PIA26525

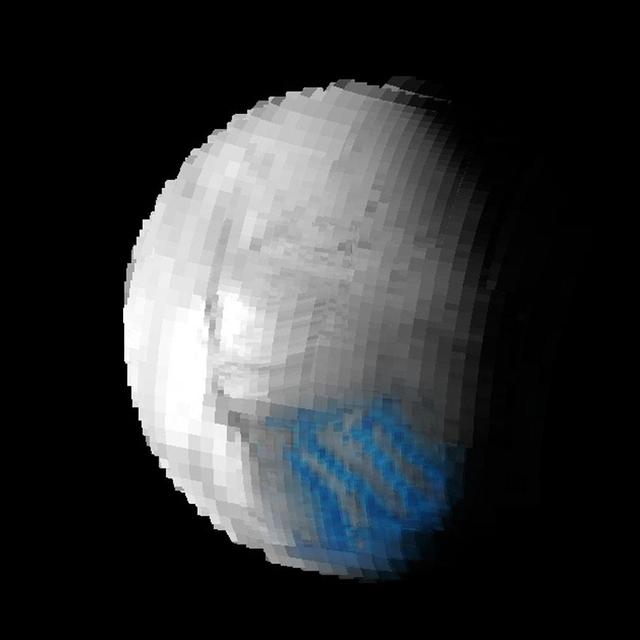
These four images of the Moon are from data acquired by NASA Galileo spacecraft Near-Earth Mapping Spectrometer during Galileo December 1992 Earth/Moon flyby. http://photojournal.jpl.nasa.gov/catalog/PIA00231
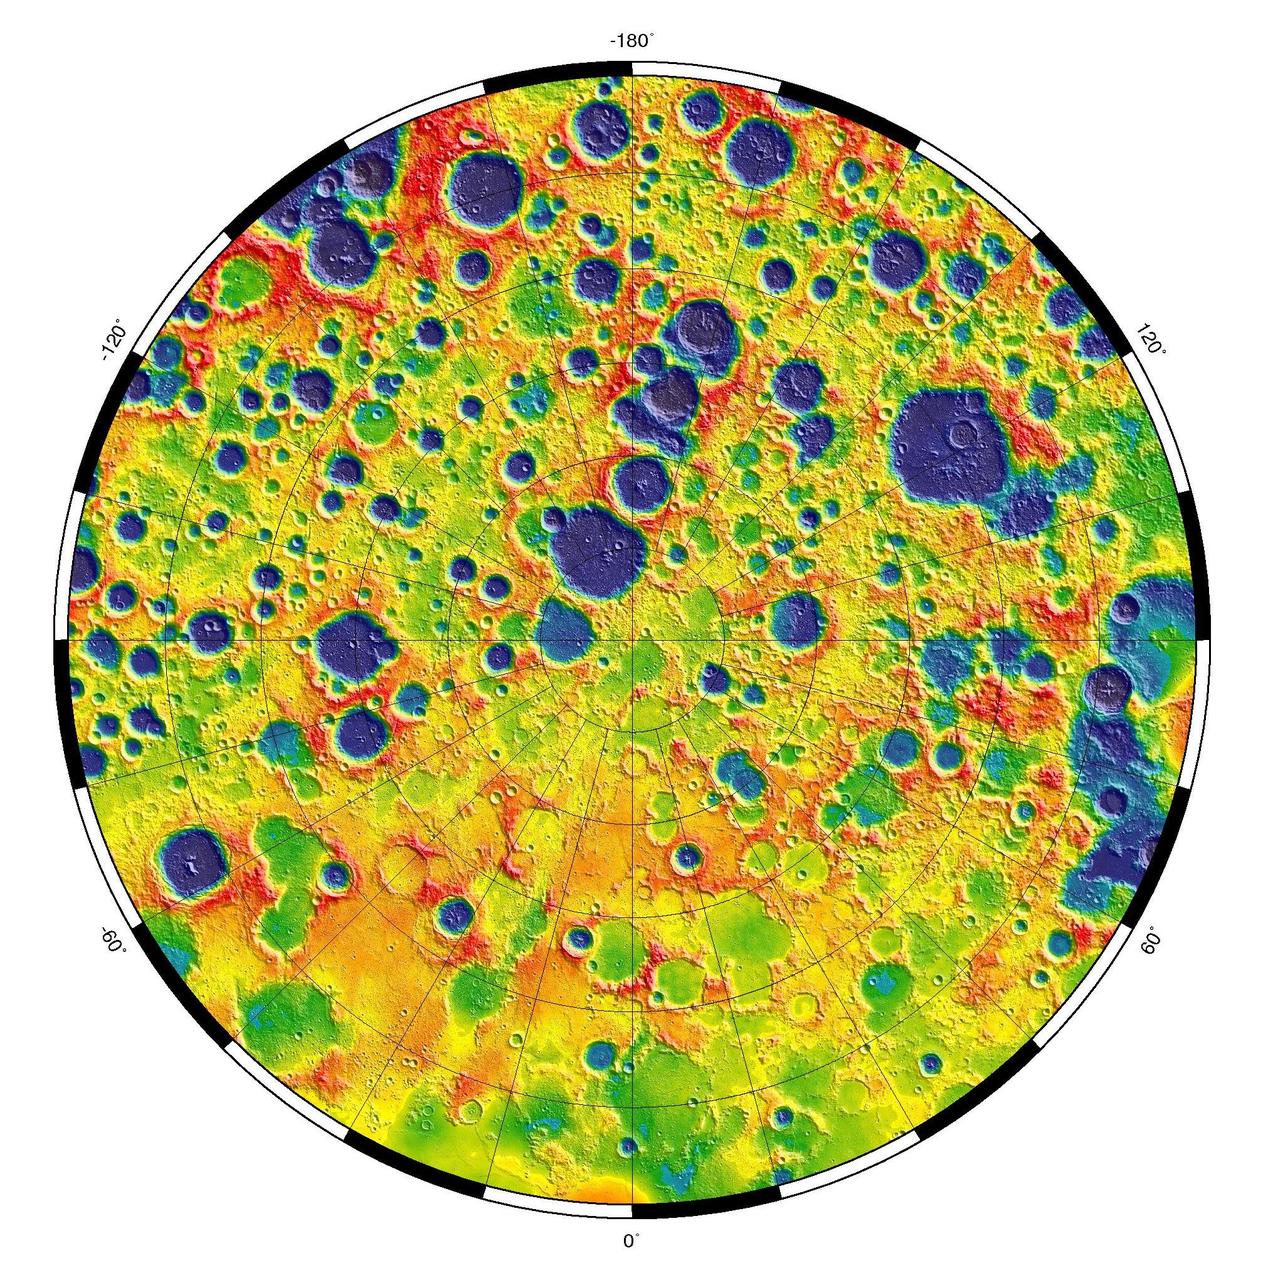
This is a polar stereographic map of gravity of the north polar region of the moon from the Gravity Recovery and Interior Laboratory GRAIL mission. The map displays the region from latitude 60 north to the pole.
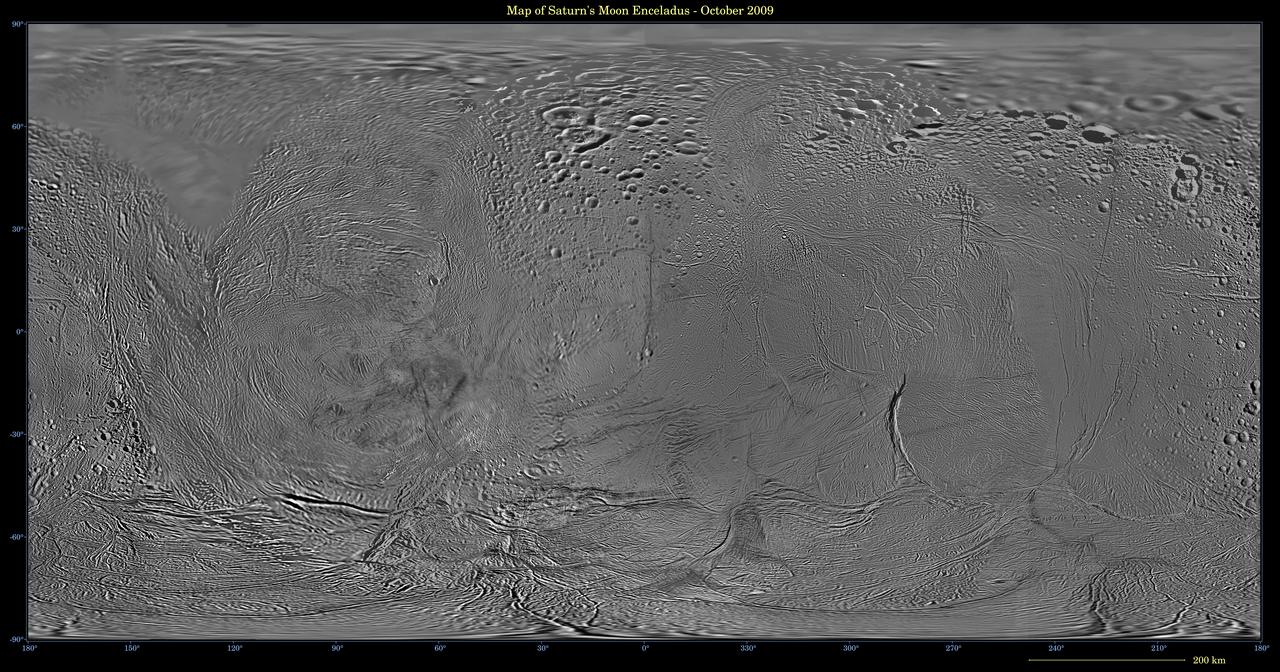
This image shows an updated map of Saturn icy moon Enceladus, generated by NASA Cassini imaging team. The map incorporates new images taken in 2008, with better image processing techniques.
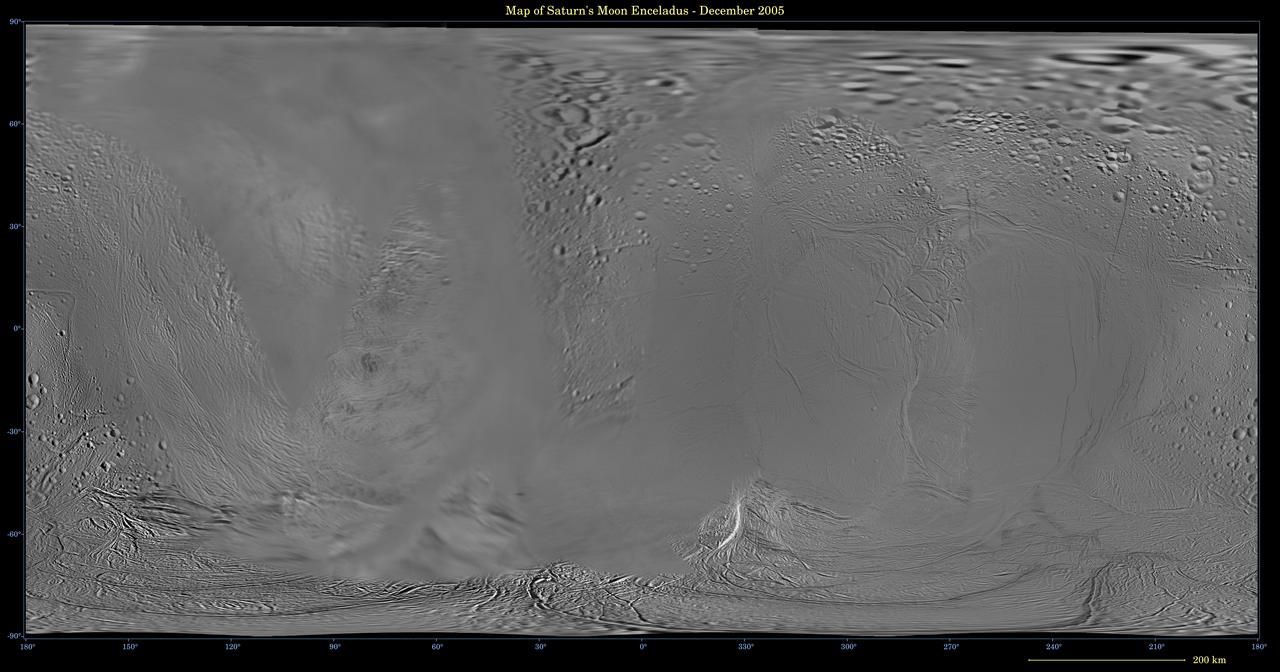
This global digital map of Saturn moon Enceladus was created using data taken during Cassini and Voyager spacecraft flybys. The map is an equidistant projection and has a scale of 110 meters 361 feet per pixel
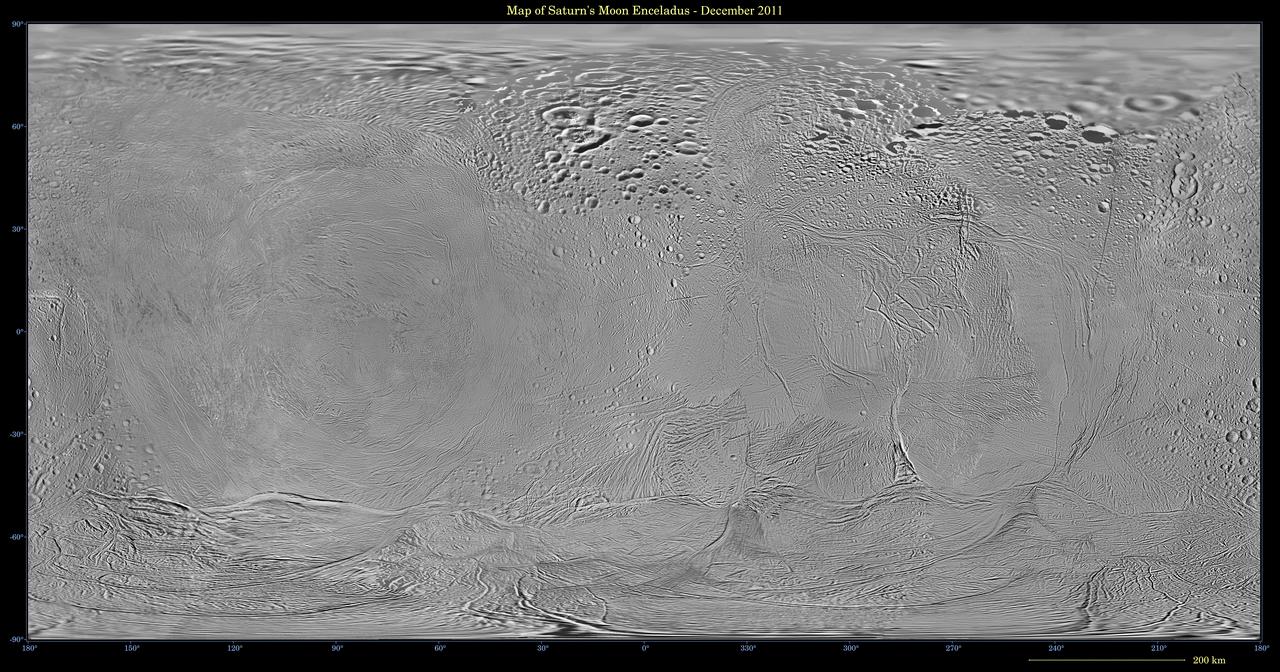
This mosaic shows an updated global map of Saturn icy moon Enceladus, created using images taken during flybys of NASA Cassini spacecraft. The map incorporates new images taken during flybys in December 2011.
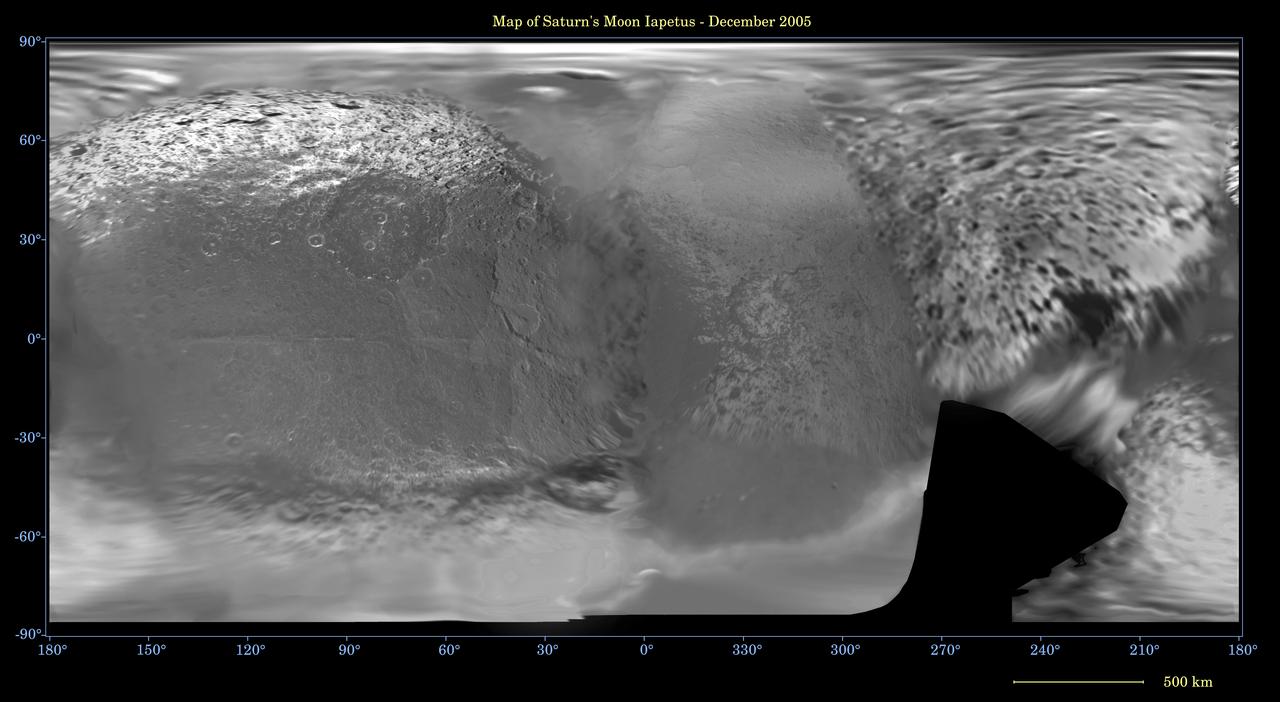
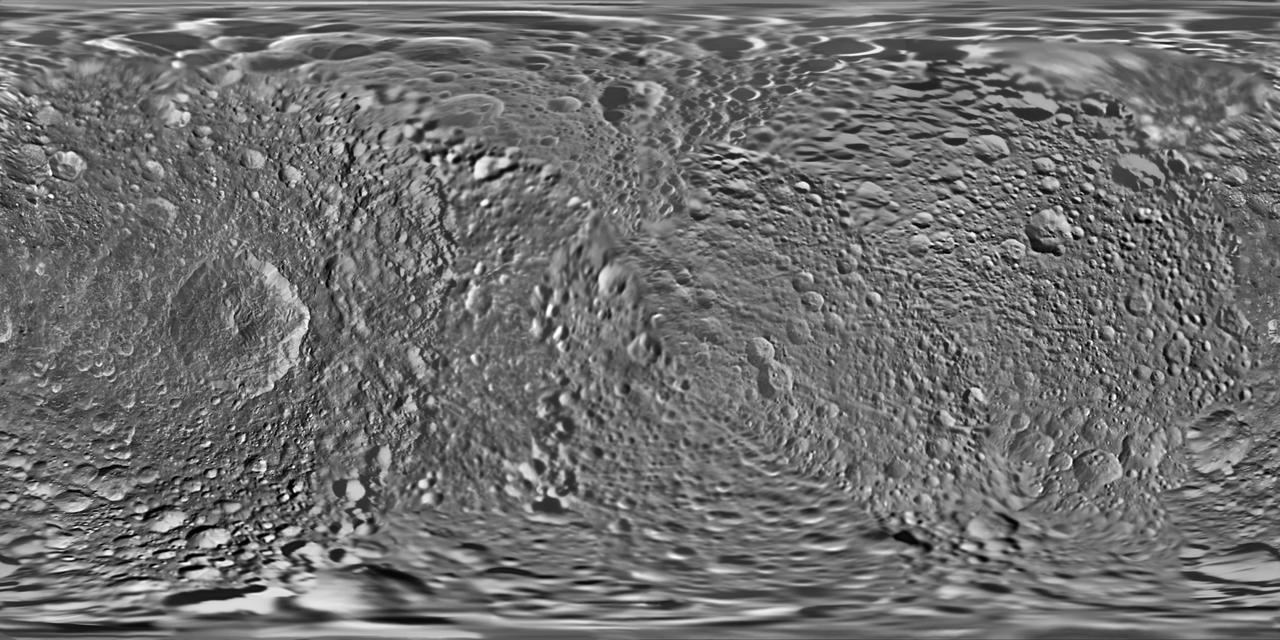
This global digital map of Saturn moon Iapetus was created using data taken during Cassini and Voyager spacecraft flybys. The map is an equidistant projection and has a scale of 641 meters 2,103 feet per pixel
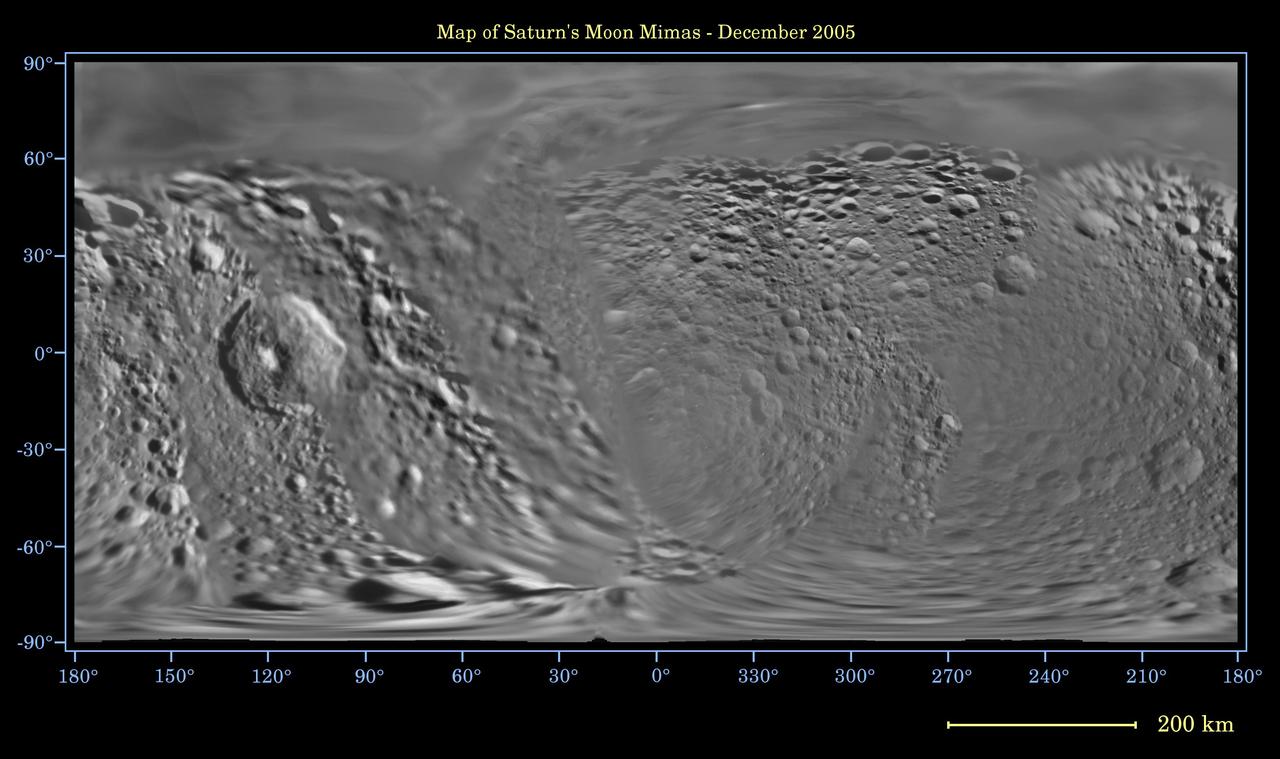
This global digital map of Saturn moon Mimas was created using data taken during Cassini and Voyager spacecraft flybys. The map is an equidistant projection and has a scale of 434 meters 1,424 feet per pixel
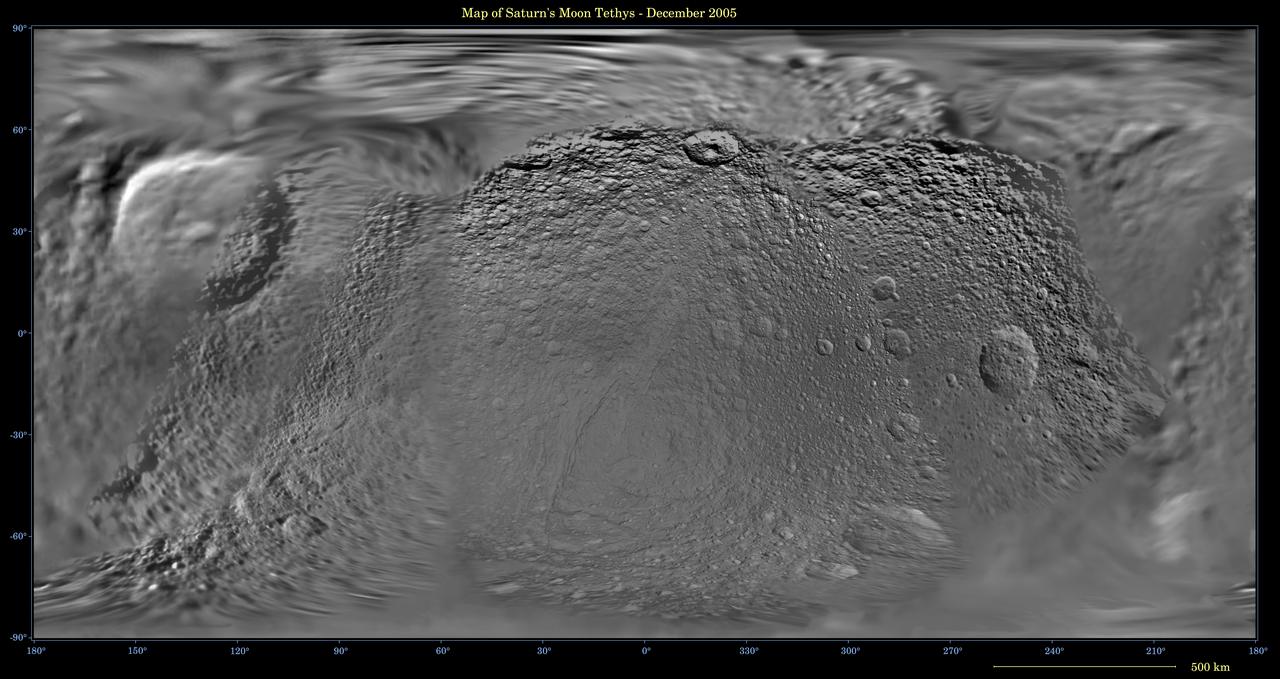
This global digital map of Saturn moon Tethys was created using data taken during Cassini and Voyager spacecraft flybys. The map is an equidistant projection and has a scale of 293 meters 961 feet per pixel
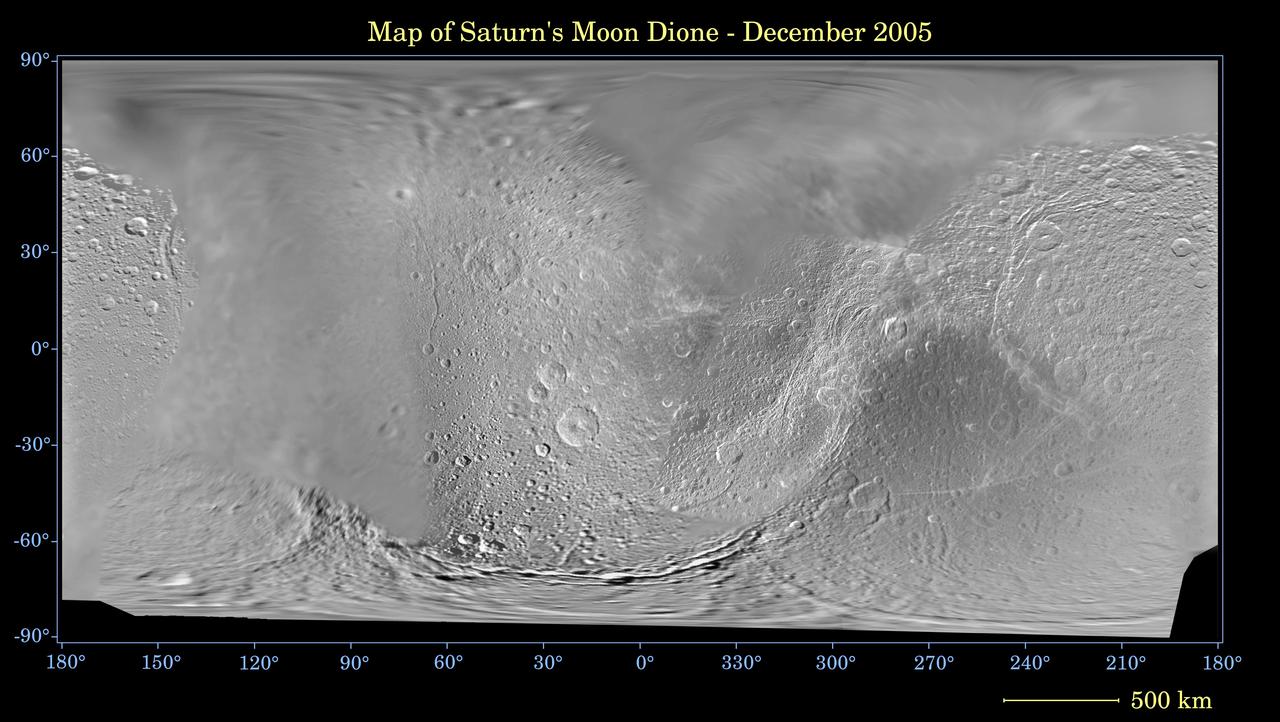
This global digital map of Saturn moon Dione was created using data taken during Cassini and Voyager spacecraft flybys. The map is an equidistant projection and has a scale of 977 meters 3,205 feet per pixel
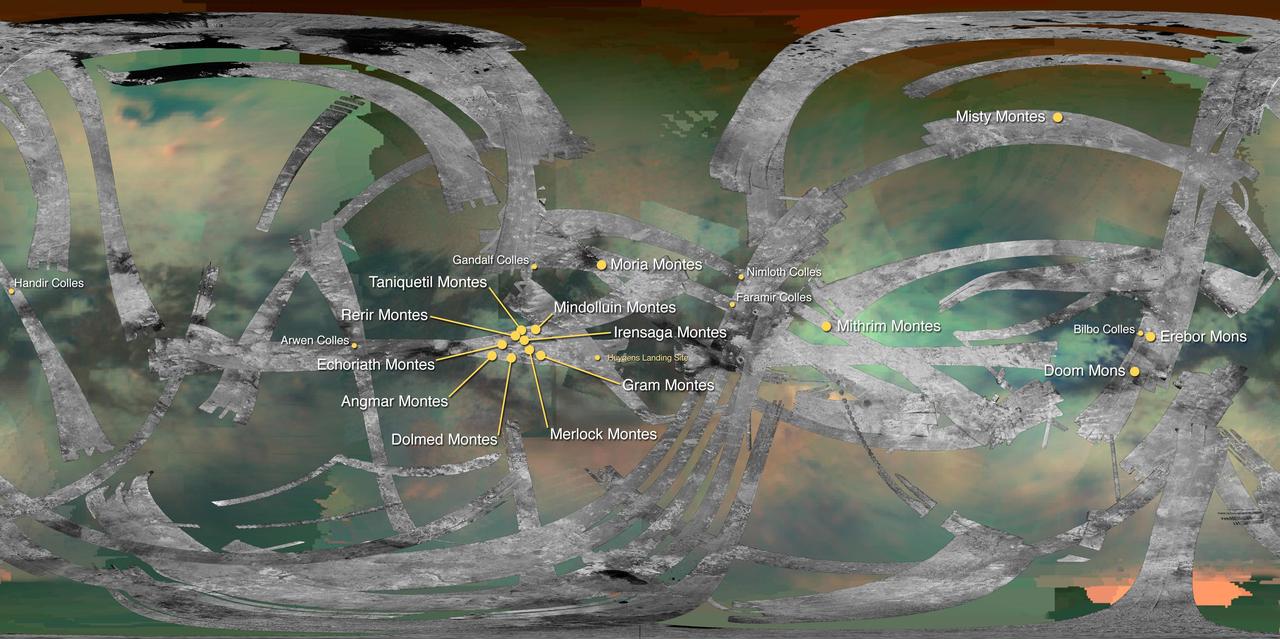
This map of Saturn moon Titan identifies the locations of mountains that have been named by the International Astronomical Union.
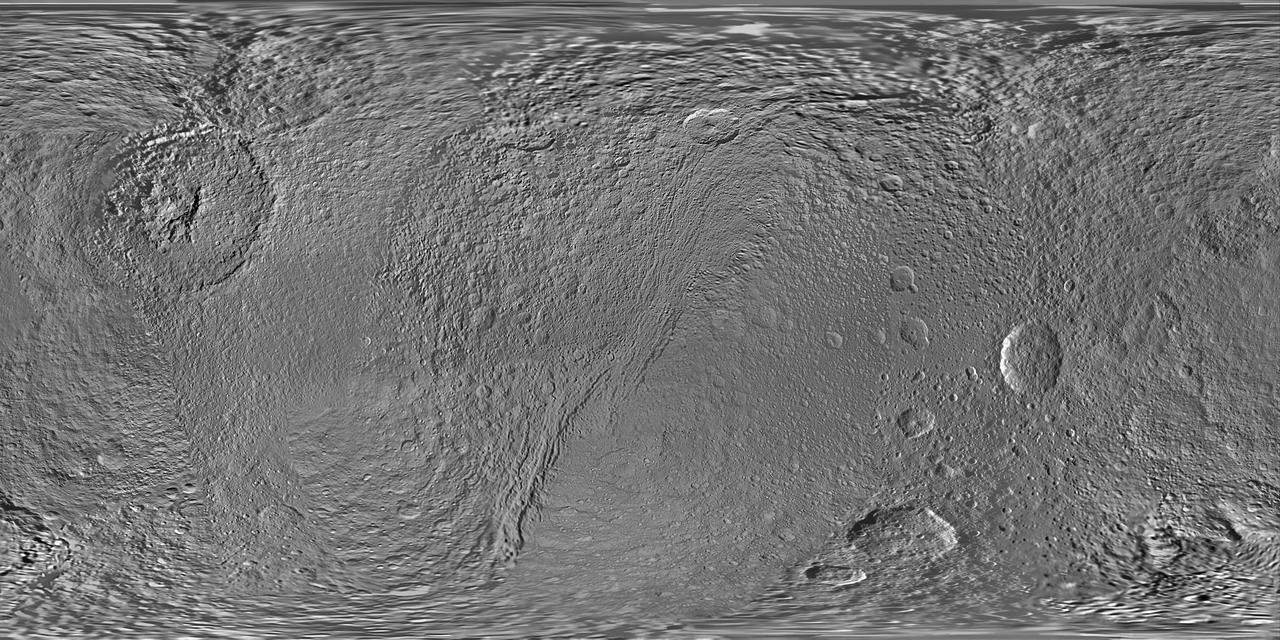
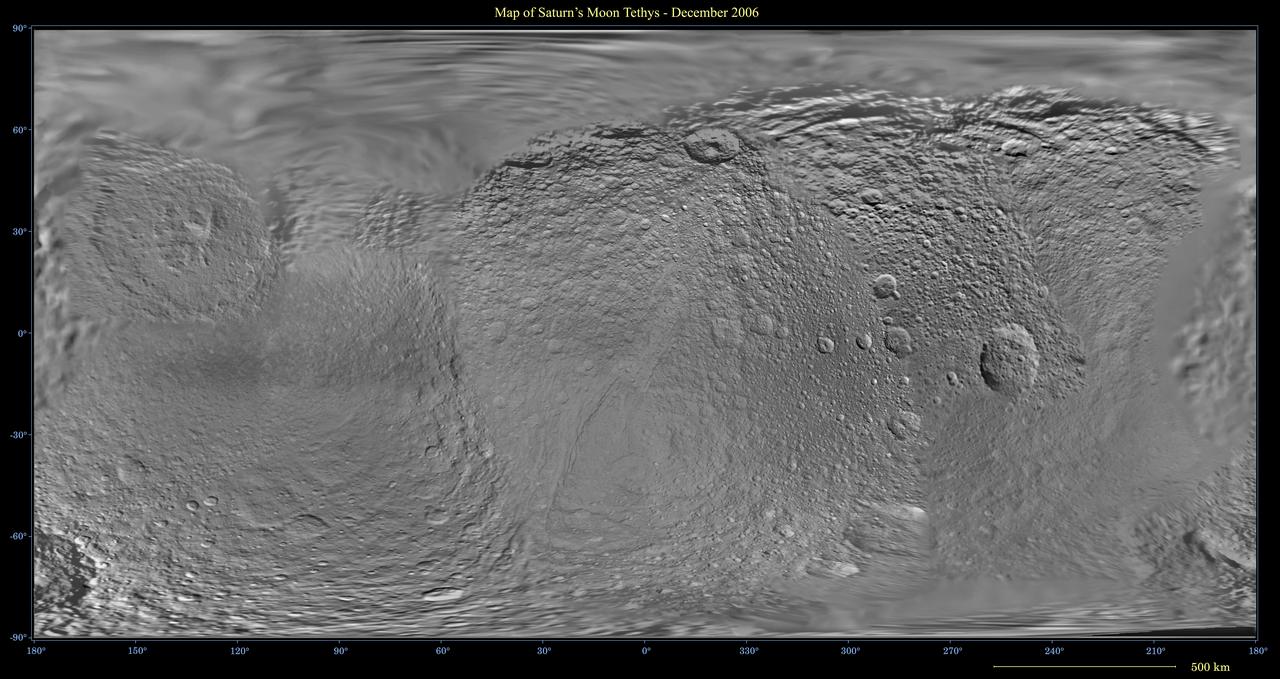
This global map of Saturn moon Tethys was created using images taken during flybys of NASA Cassini spacecraft.
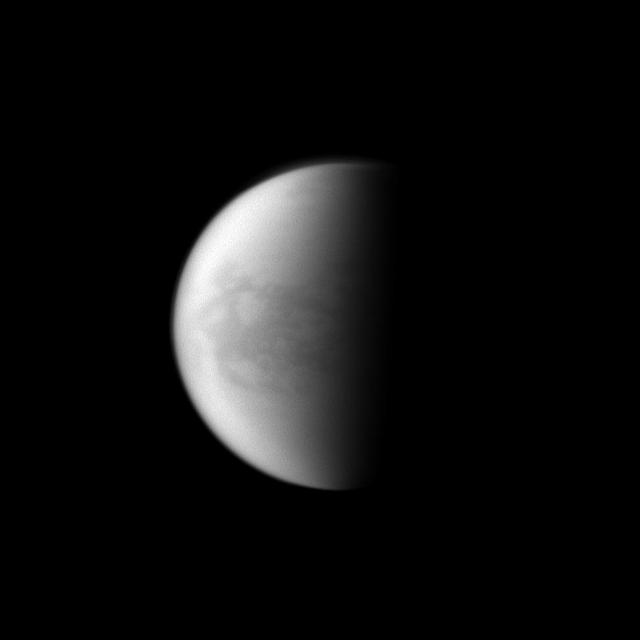
NASA Cassini spacecraft looks toward Saturn largest moon and maps the dark Belet region on Titan.
This updated global map of Saturn moon Tethys was created using images taken by NASA Cassini spacecraft.
This global digital map of Saturn moon Rhea was created using data obtained by NASA Cassini and Voyager spacecraft.
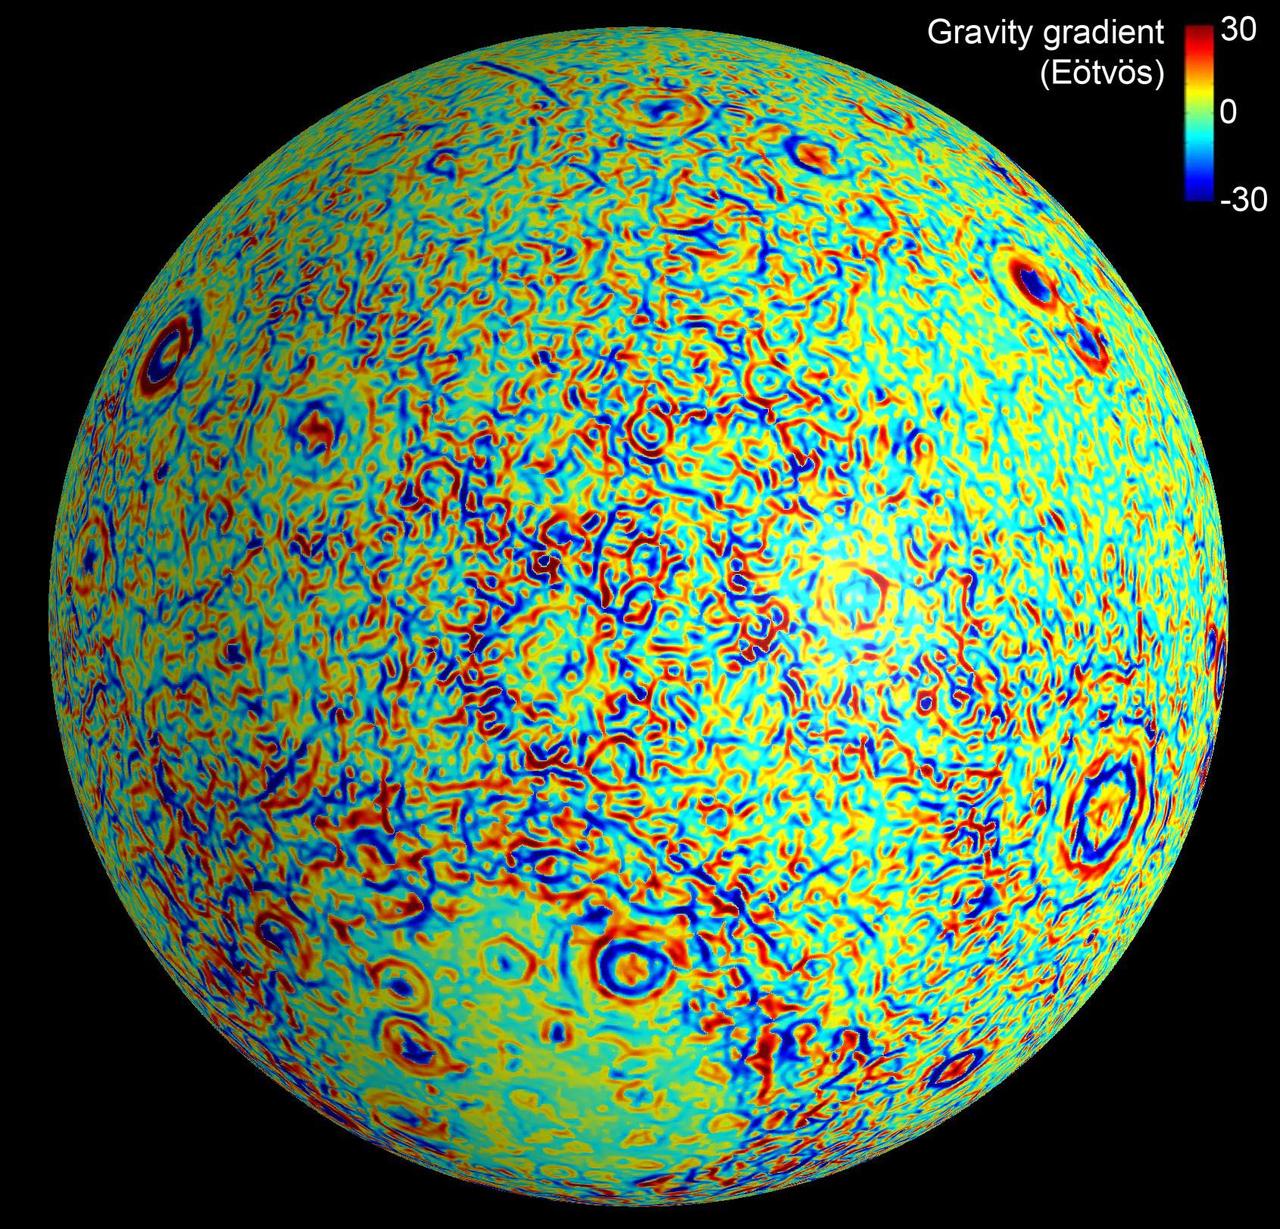
This moon map shows the gravity gradients calculated by NASA GRAIL mission. Red and blue correspond to stronger gravity gradients.
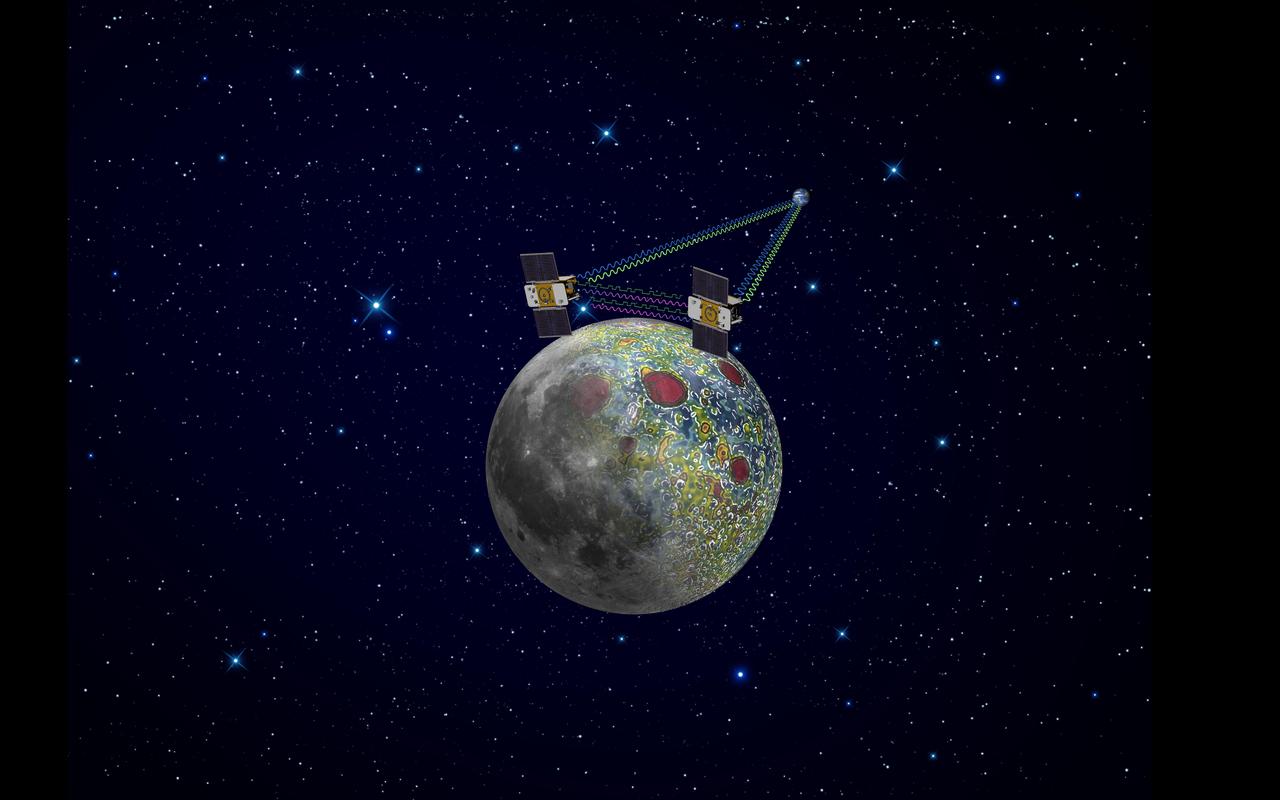
Using a precision formation-flying technique, the twin GRAIL spacecraft maps the moon gravity field, as depicted in this artist rendering.
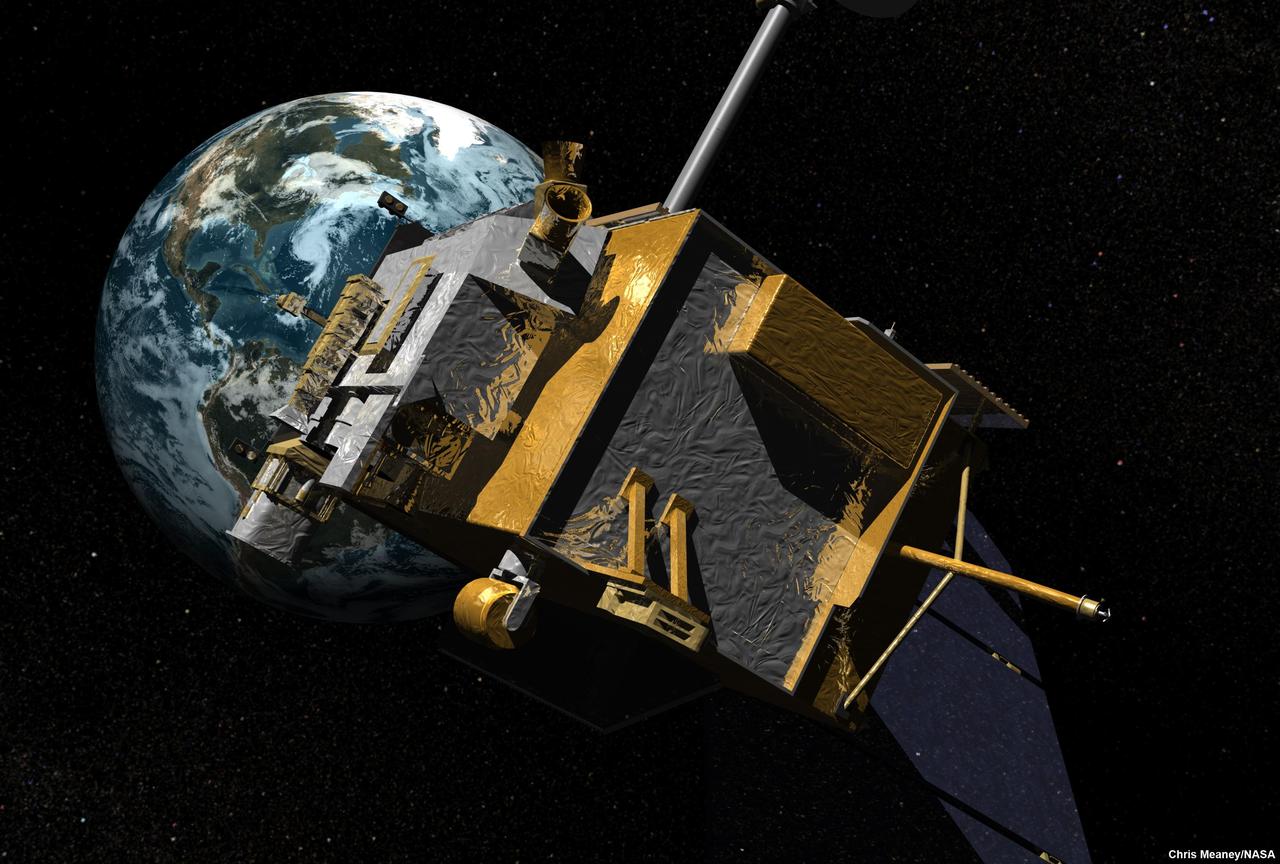
NASA is scheduled to launch the Lunar Reconnaissance Orbiter, an unmanned mission to comprehensively map the entire moon, on June 18, 2009.
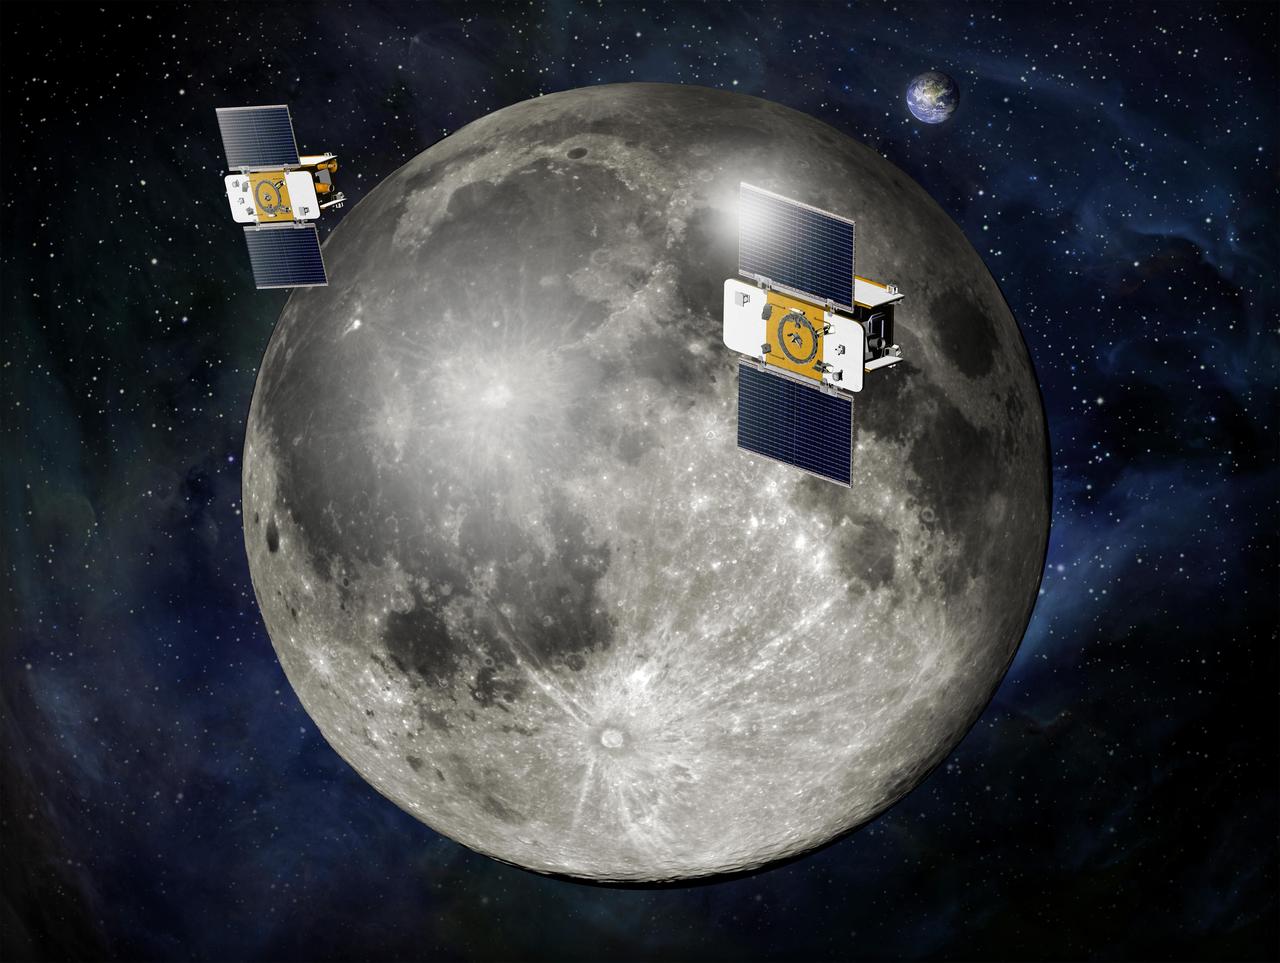
Using a precision formation-flying technique, NASA twin GRAIL spacecraft will map the moon gravity field. This is an artist concept.
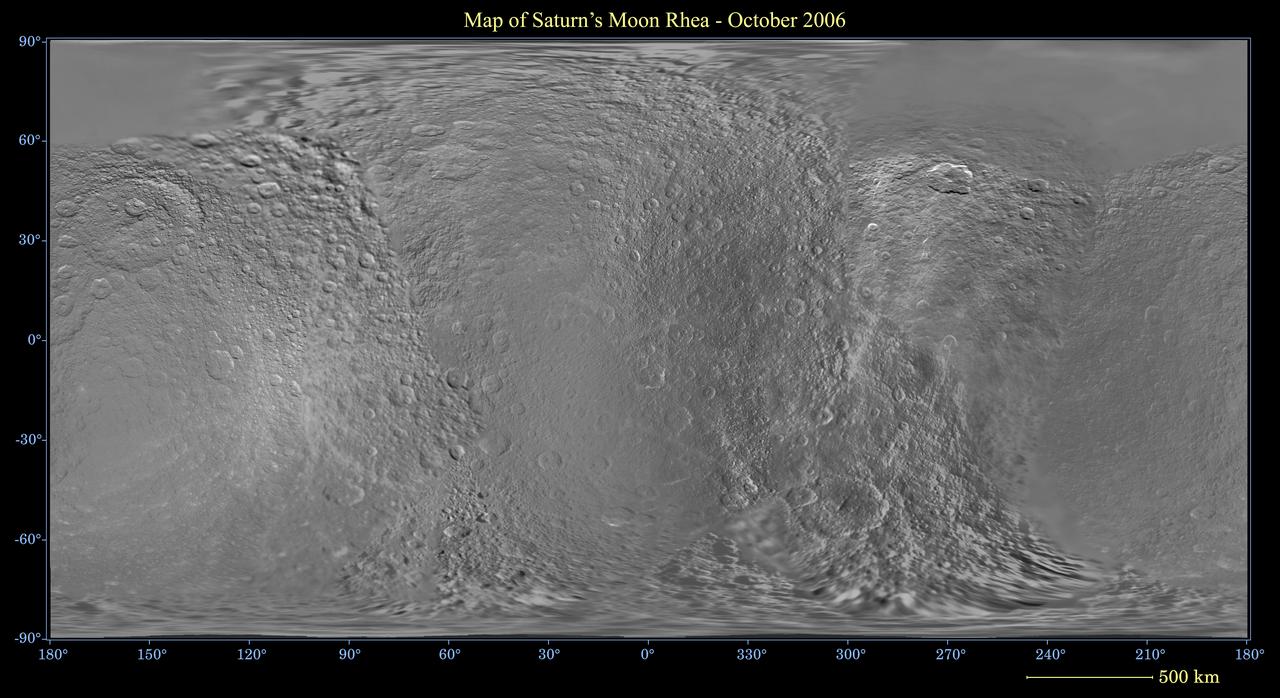
This global digital map of Saturn moon Rhea was created using data taken during NASA Cassini and Voyager spacecraft flybys
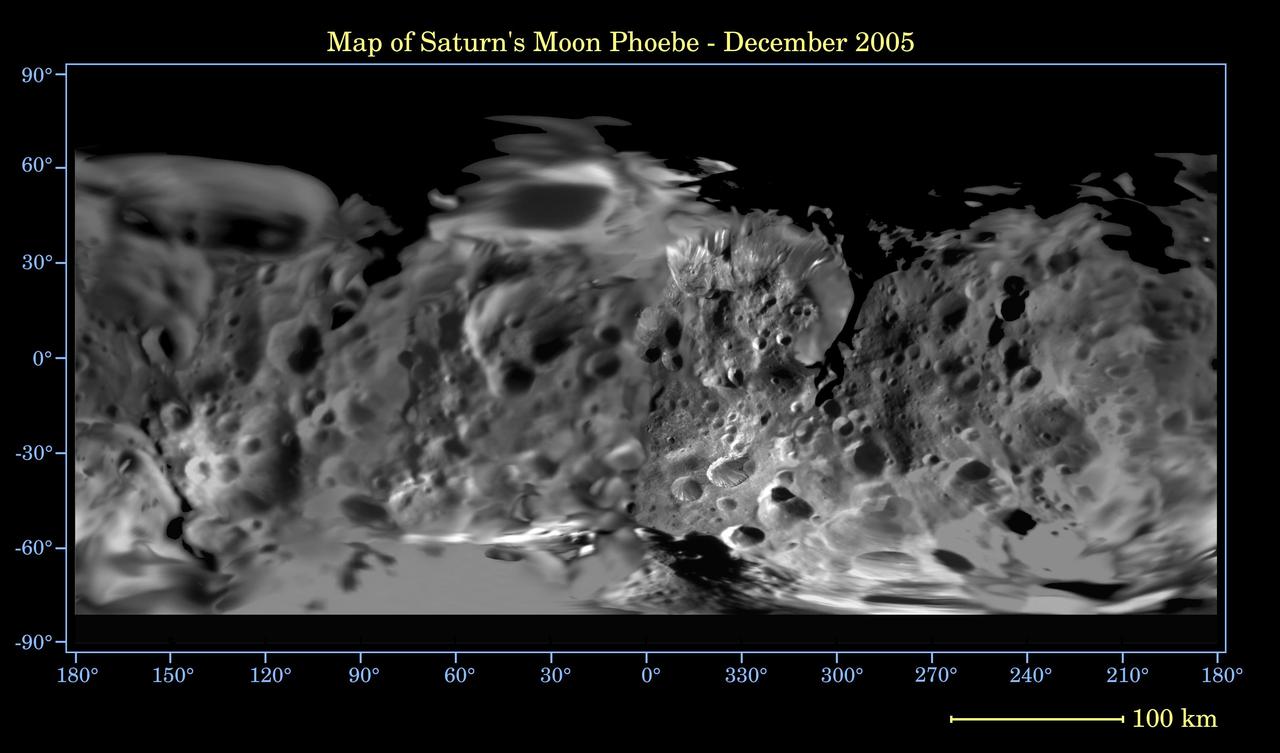
This global digital map of Saturn moon Phoebe was created using data taken during NASA Cassini spacecraft close flyby of the small moon in June 2004. The map is an equidistant projection and has a scale of 233 meters 764 feet per pixel
This map shows the gravity field of the moon from the Lunar Prospector mission. The viewing perspective, known as a Mercator projection, shows the far side of the moon in the center and the nearside as viewed from Earth at either side.

This map shows a dramatically improved view of heat radiation from a warm fissure near the south pole of Saturn icy moon Enceladus. It was obtained by NASA Cassini spacecraft during its Nov. 21, 2009, flyby of that moon.
This map shows the gravity field of the moon as measured by NASA GRAIL mission. The viewing perspective, known as a Mercator projection, shows the far side of the moon in the center and the nearside as viewed from Earth at either side.
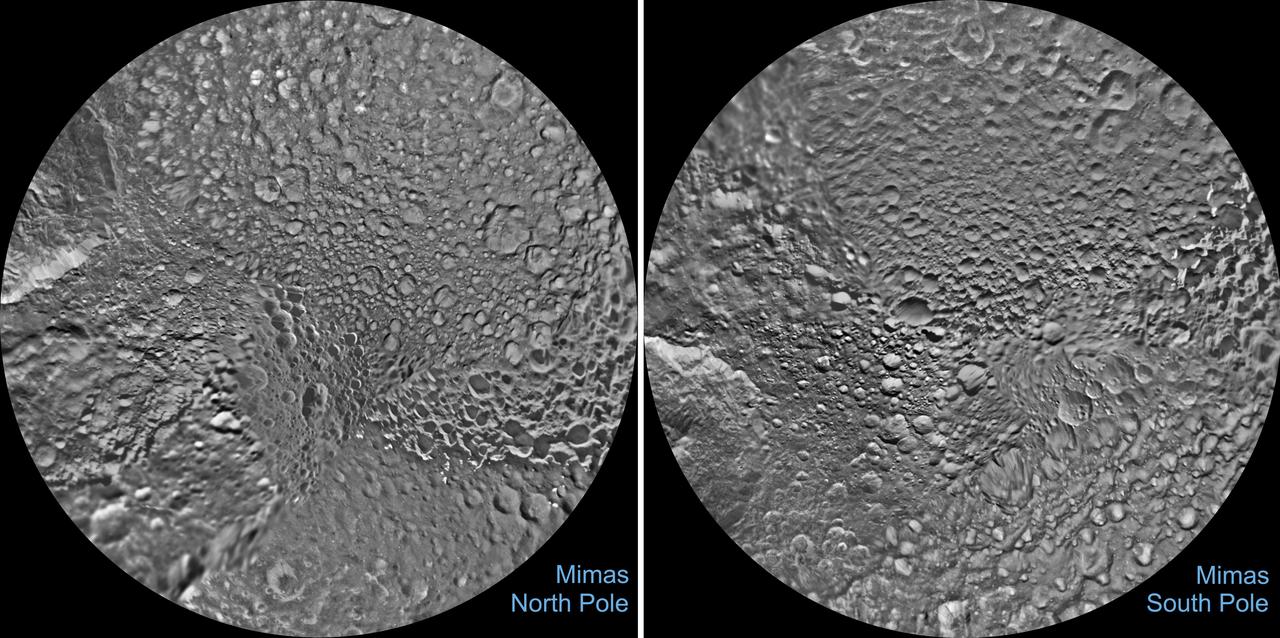
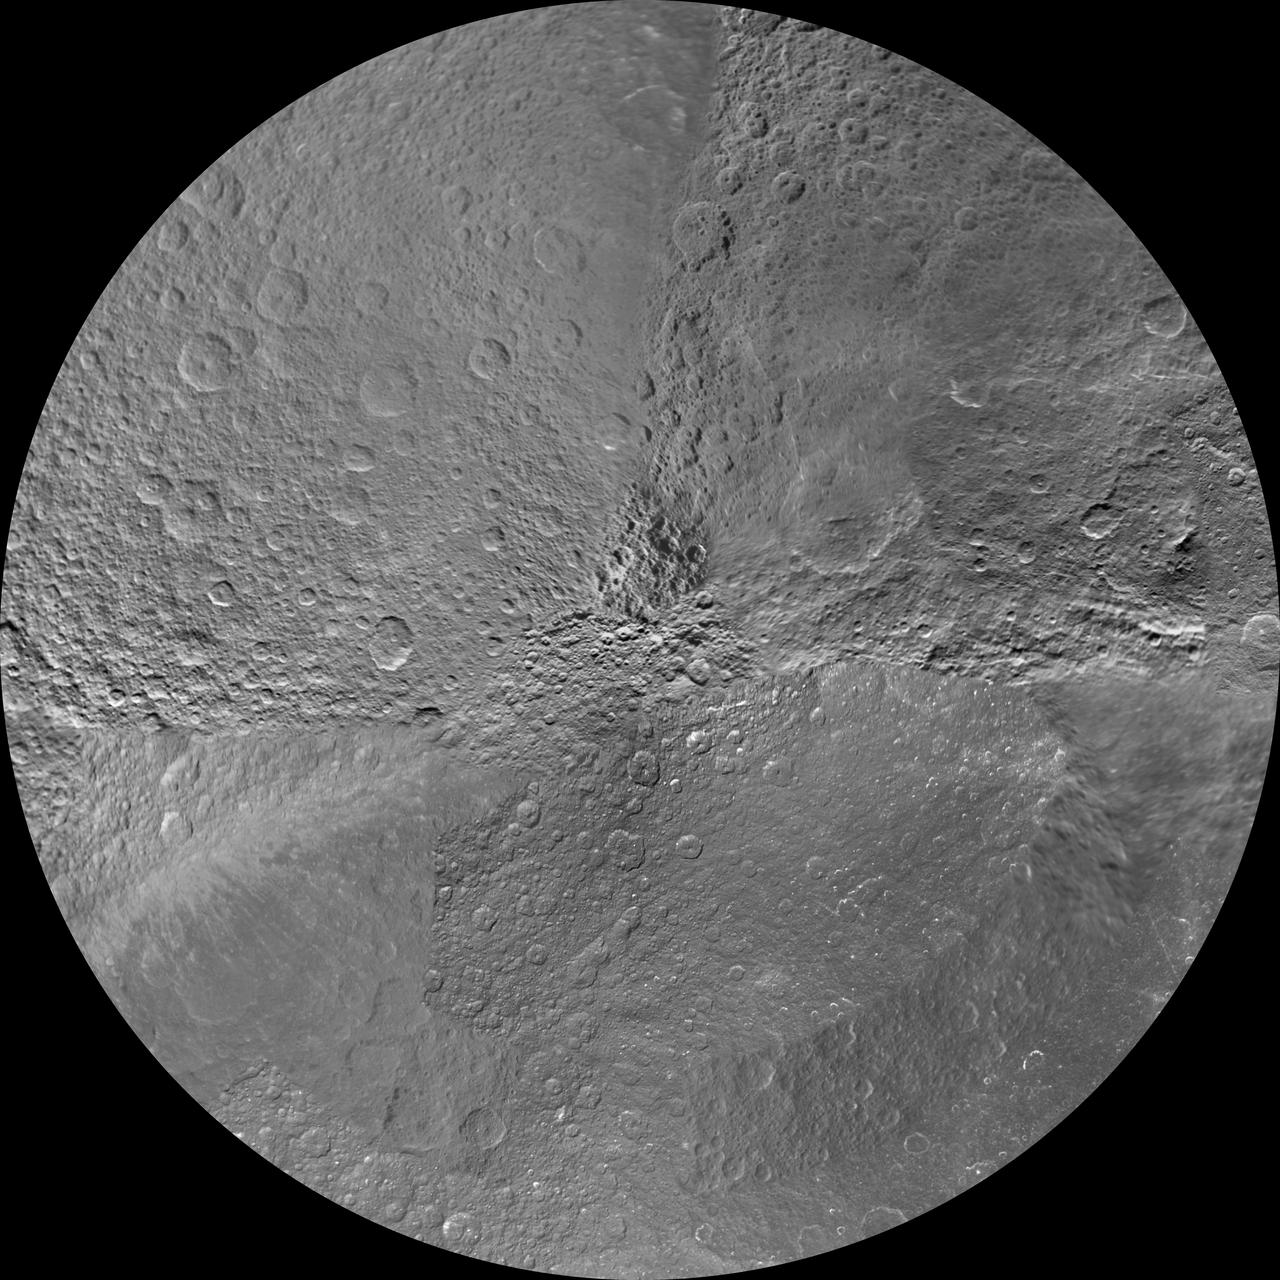
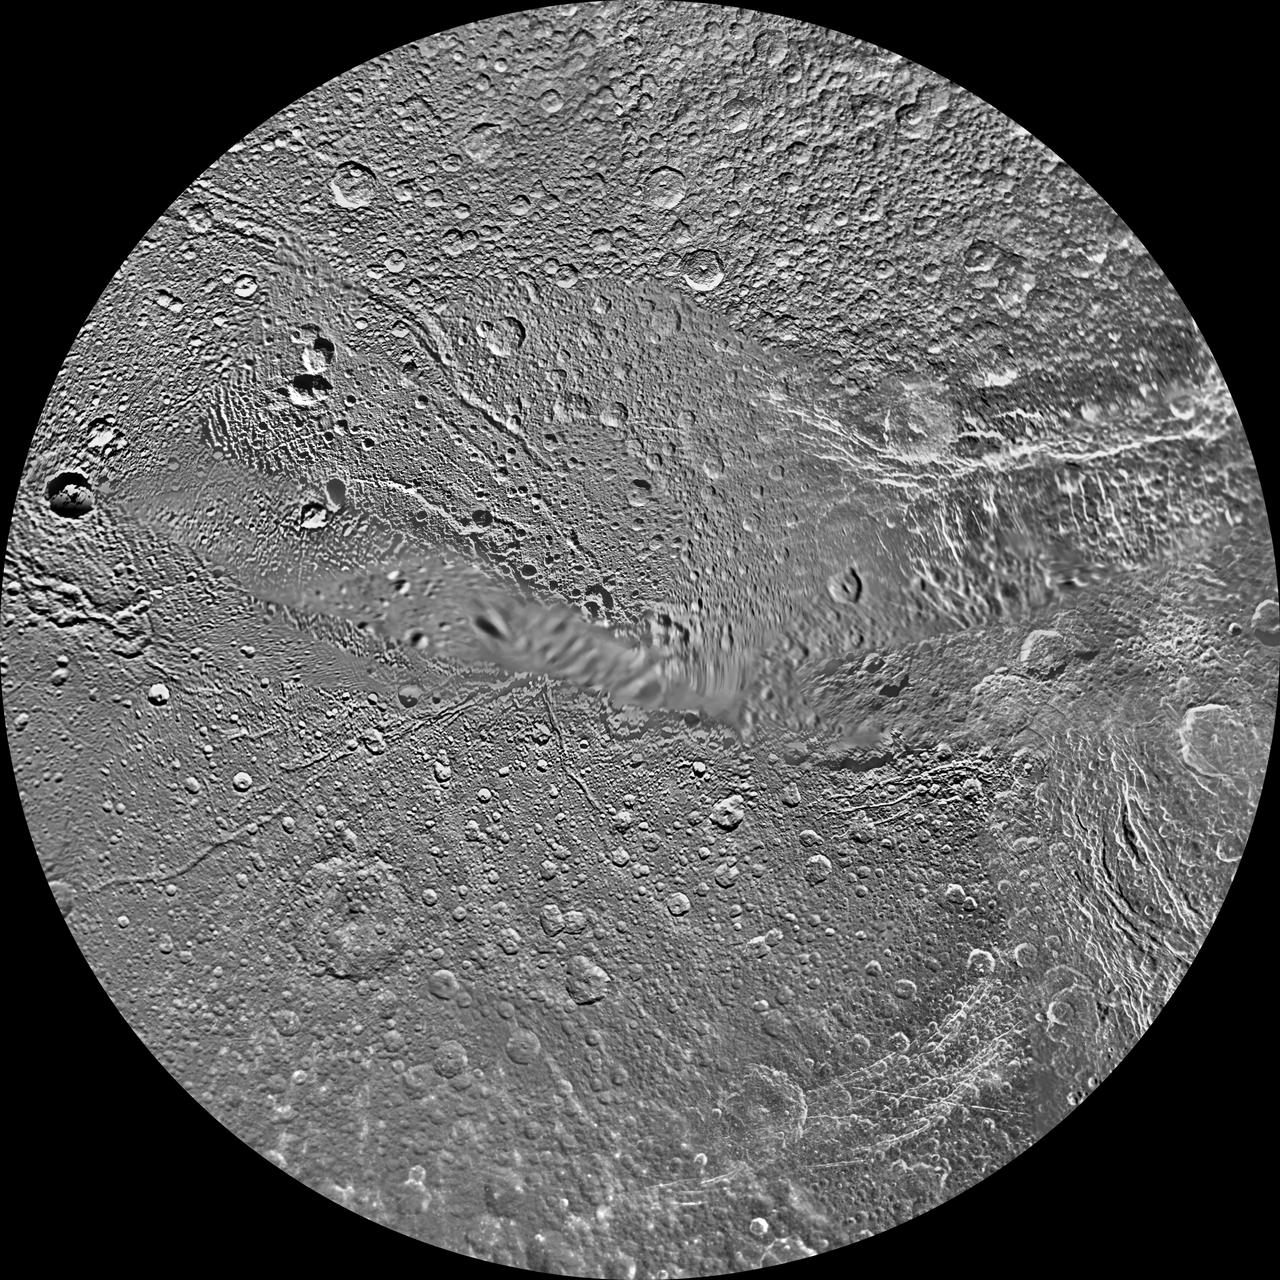
The northern and southern hemispheres of Saturn's moon Mimas are seen in these polar stereographic maps, mosaicked from the best-available Cassini images. Each map is centered on one of the poles, and surface coverage extends to the equator. Grid lines show latitude and longitude in 30-degree increments. Unlabeled versions of these maps are also provided. The scale in the full-size versions of these maps is 710 feet (216 meters) per pixel. The resolution of the map is 16 pixels per degree. The mean radius of Mimas used for projection of these maps is 123.2 miles (198.2 kilometers). The mosaics contain new data from two close flybys of Mimas in Nov. 2016 and Feb. 2017. https://photojournal.jpl.nasa.gov/catalog/PIA17215
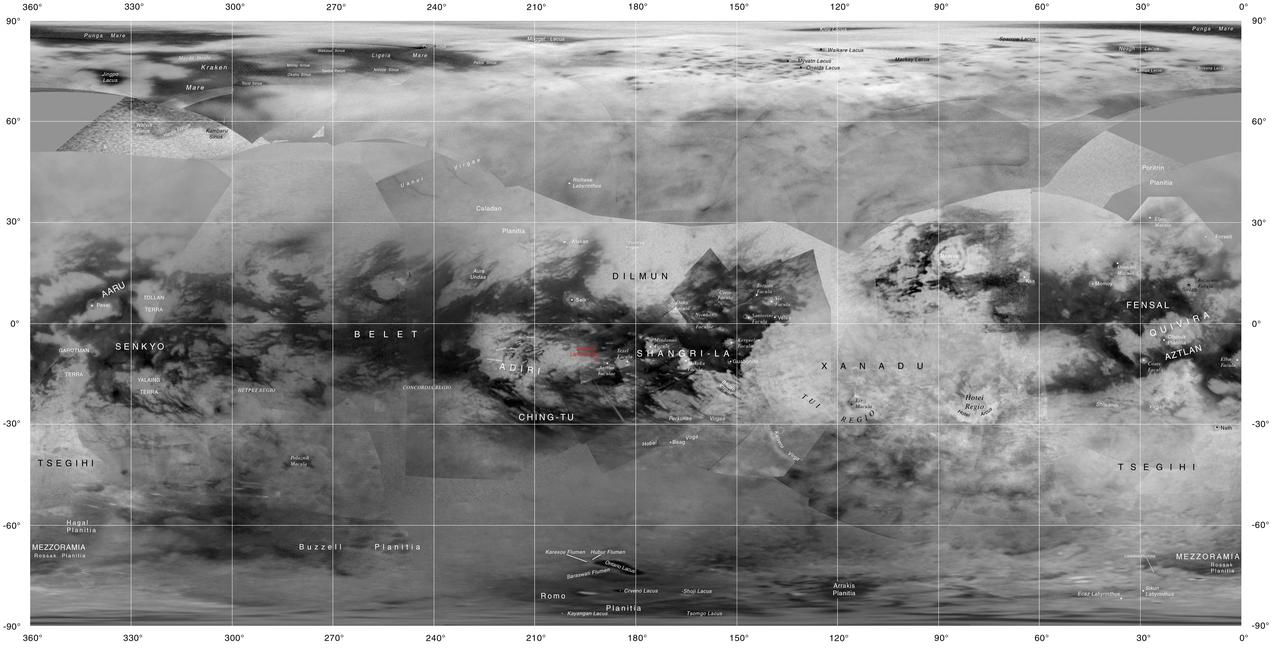
This map of Titan shows the names of many (but not all) features on the Saturnian moon that have been approved by the International Astronomical Union. This map was produced by the USGS Astrogeology Science Center for the International Astronomical Union (IAU) Working Group for Planetary System Nomenclature. http://photojournal.jpl.nasa.gov/catalog/PIA20713
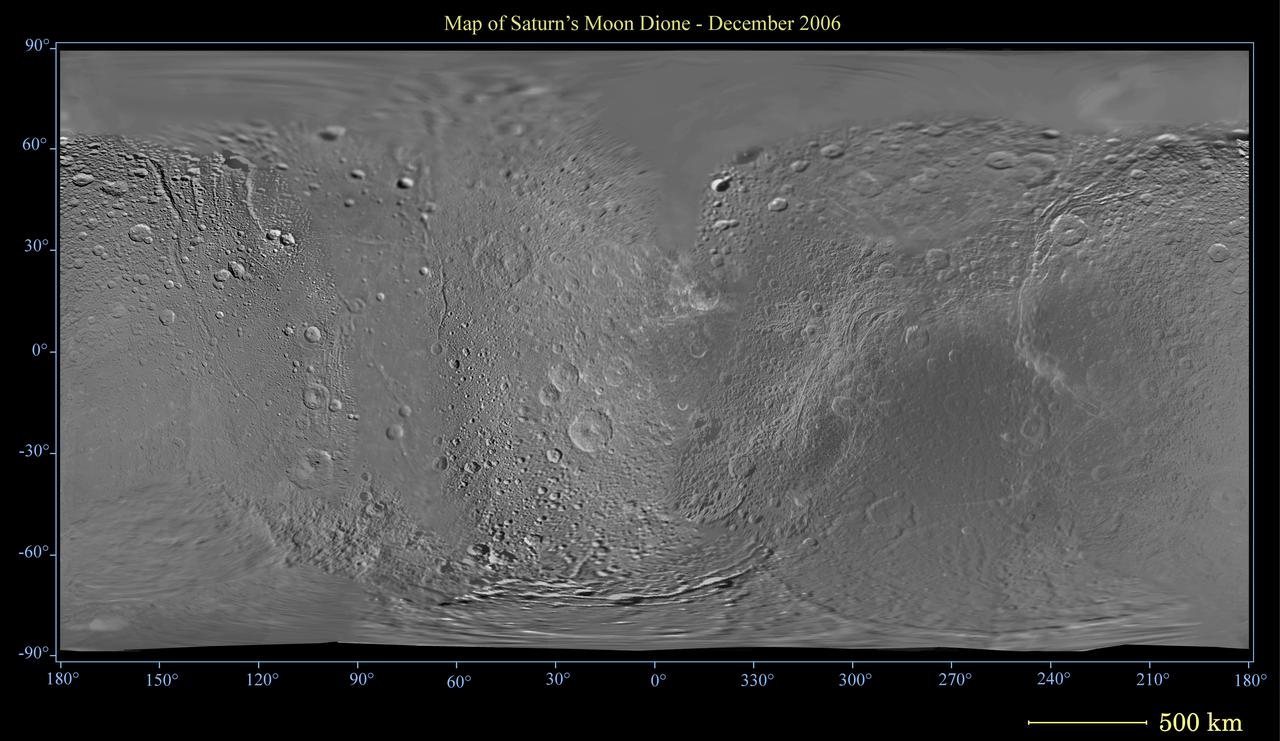
This global digital map of Saturn moon Dione was created using data taken by the Cassini spacecraft, with gaps in coverage filled in by NASA Voyager spacecraft data
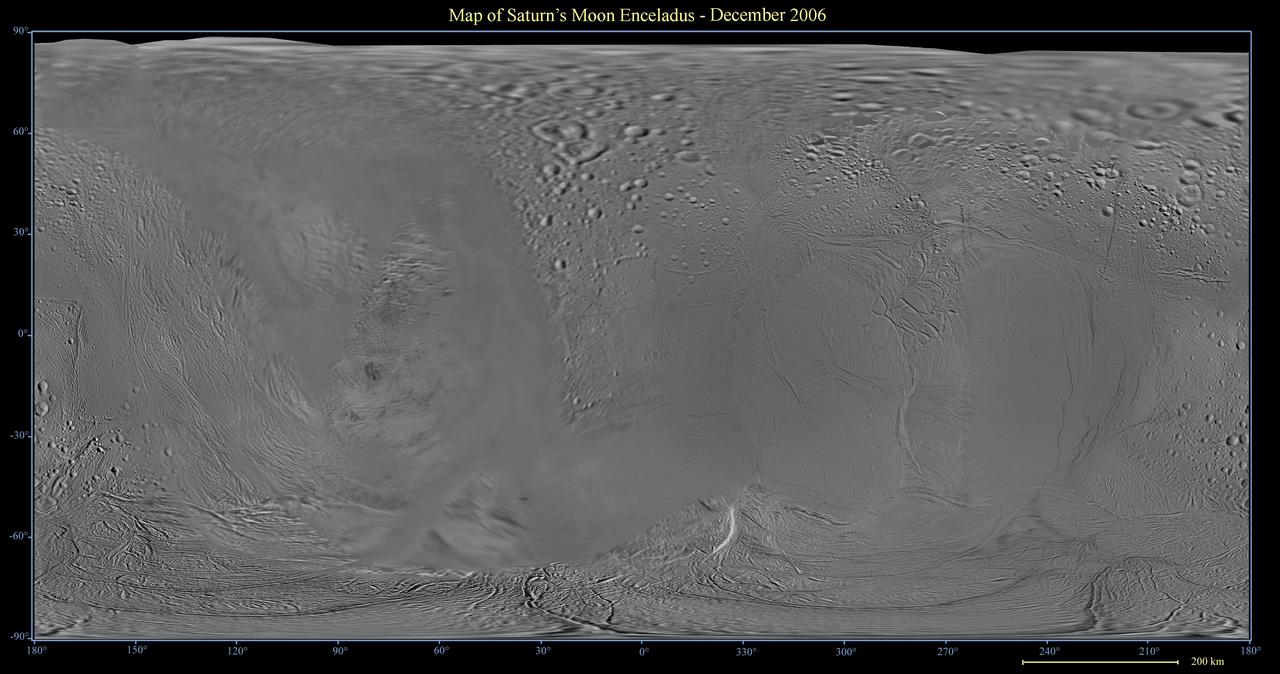
This global digital map of Saturn moon Enceladus was created using data taken by the Cassini spacecraft, with gaps in coverage filled in by NASA Voyager spacecraft data
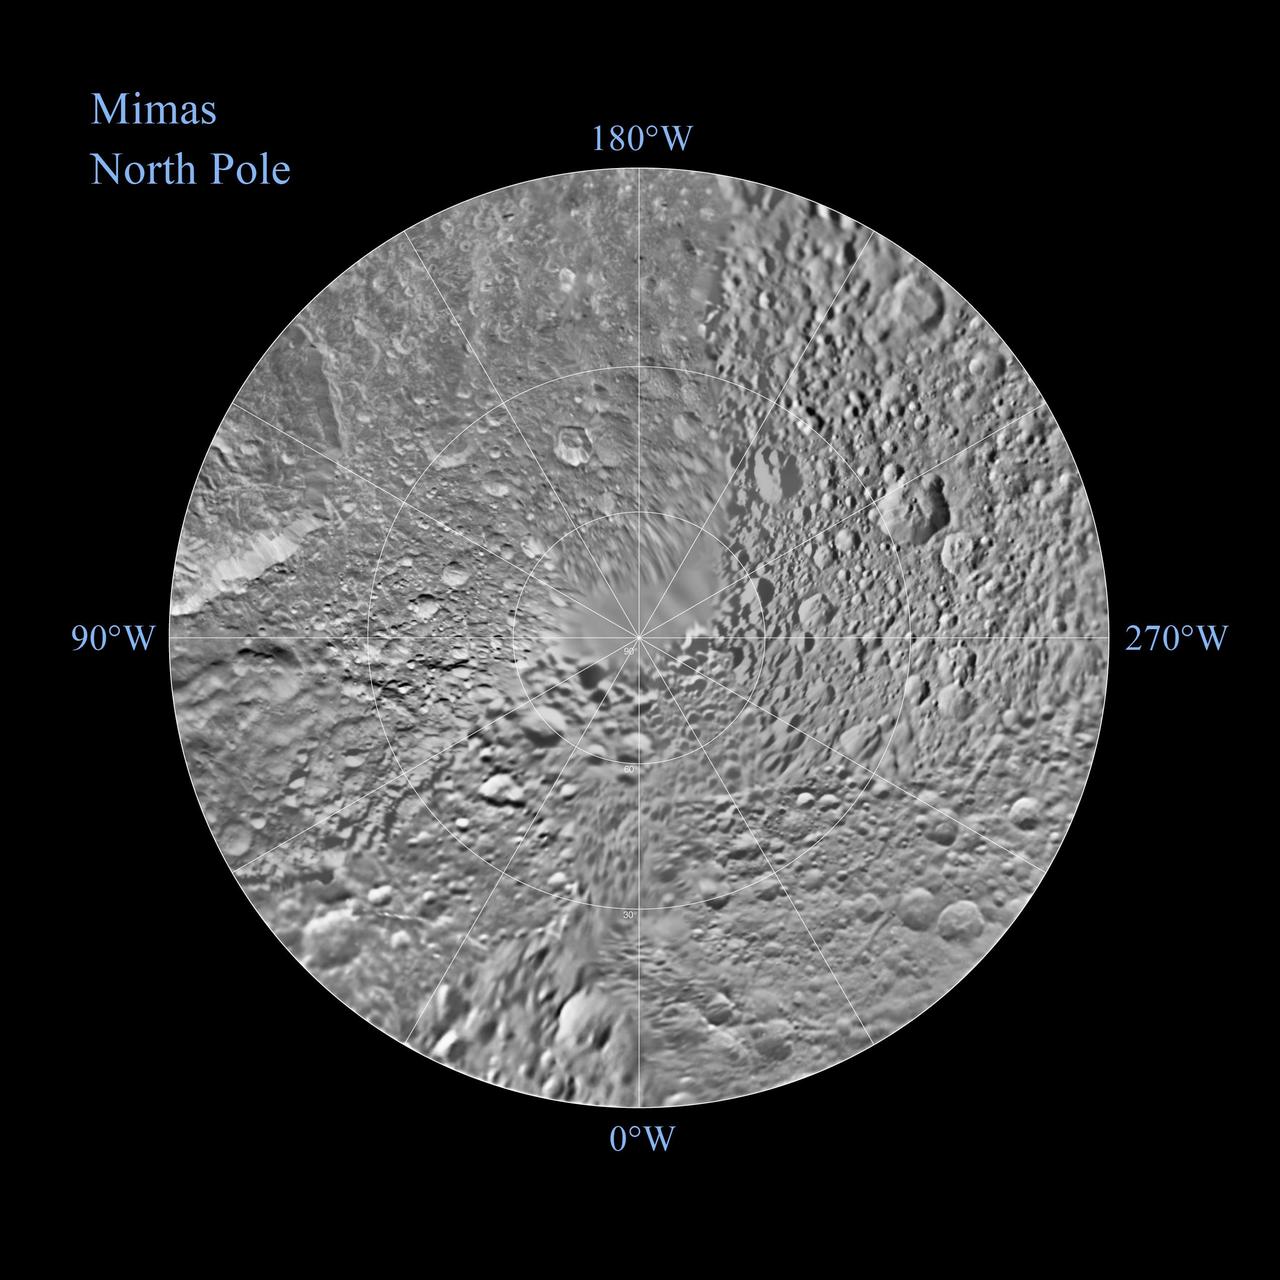
The northern hemisphere of Saturn moon Mimas is seen in these polar stereographic maps, mosaicked from the best-available NASA Cassini and Voyager images.
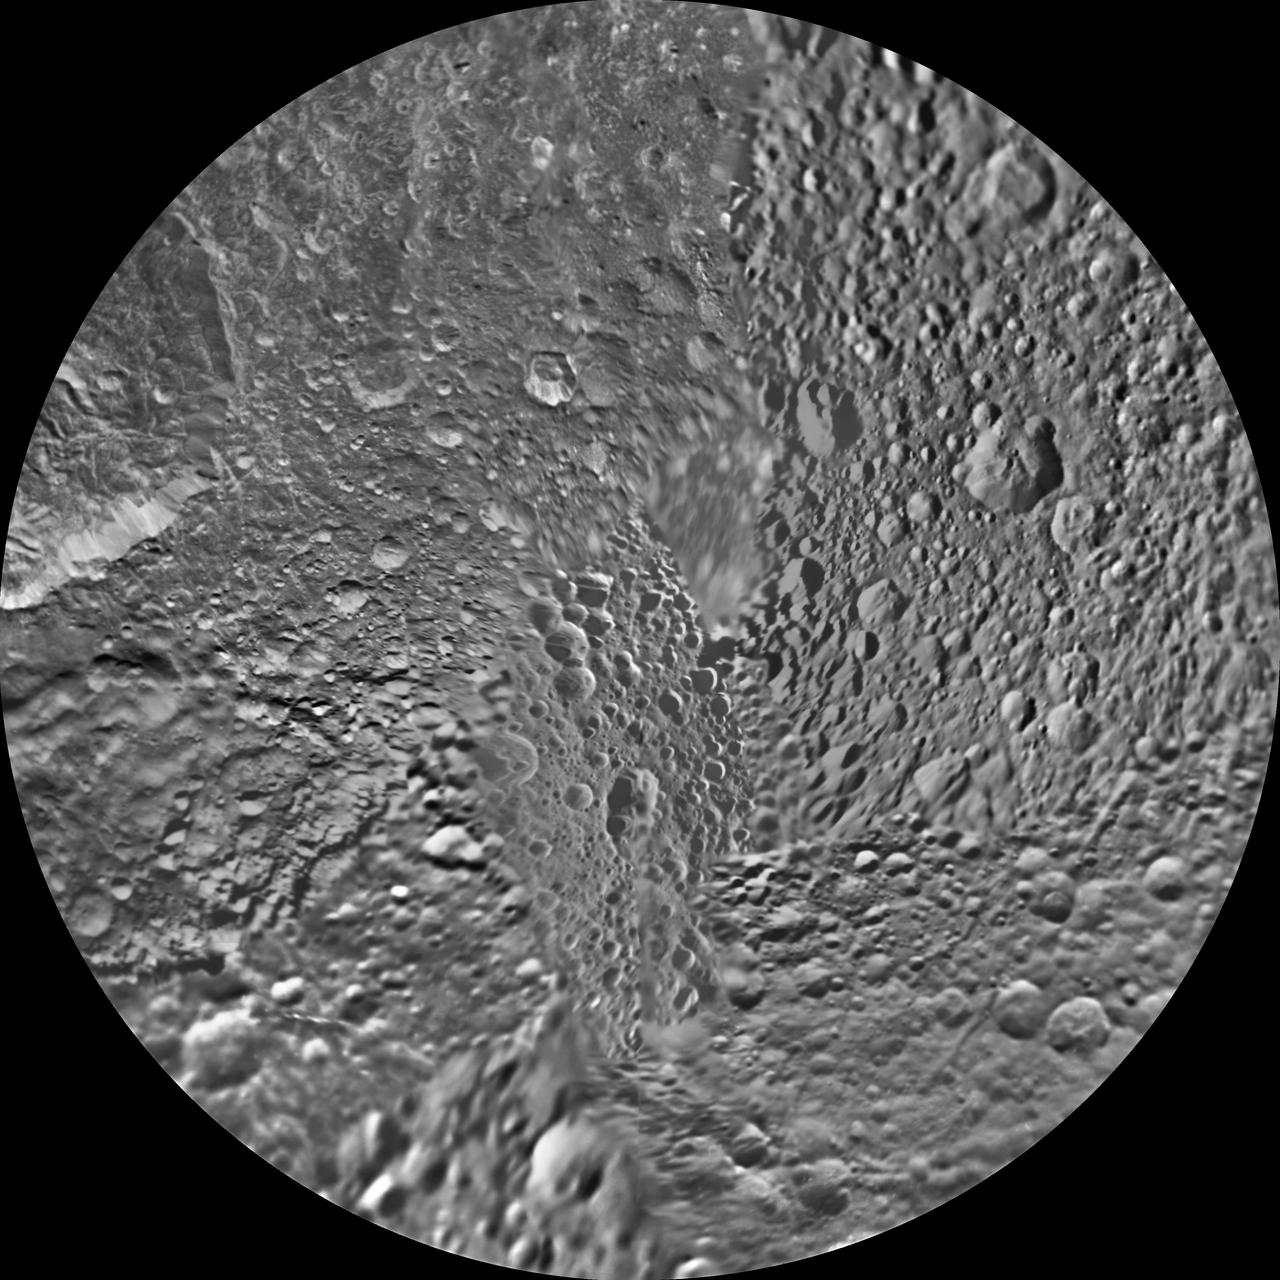
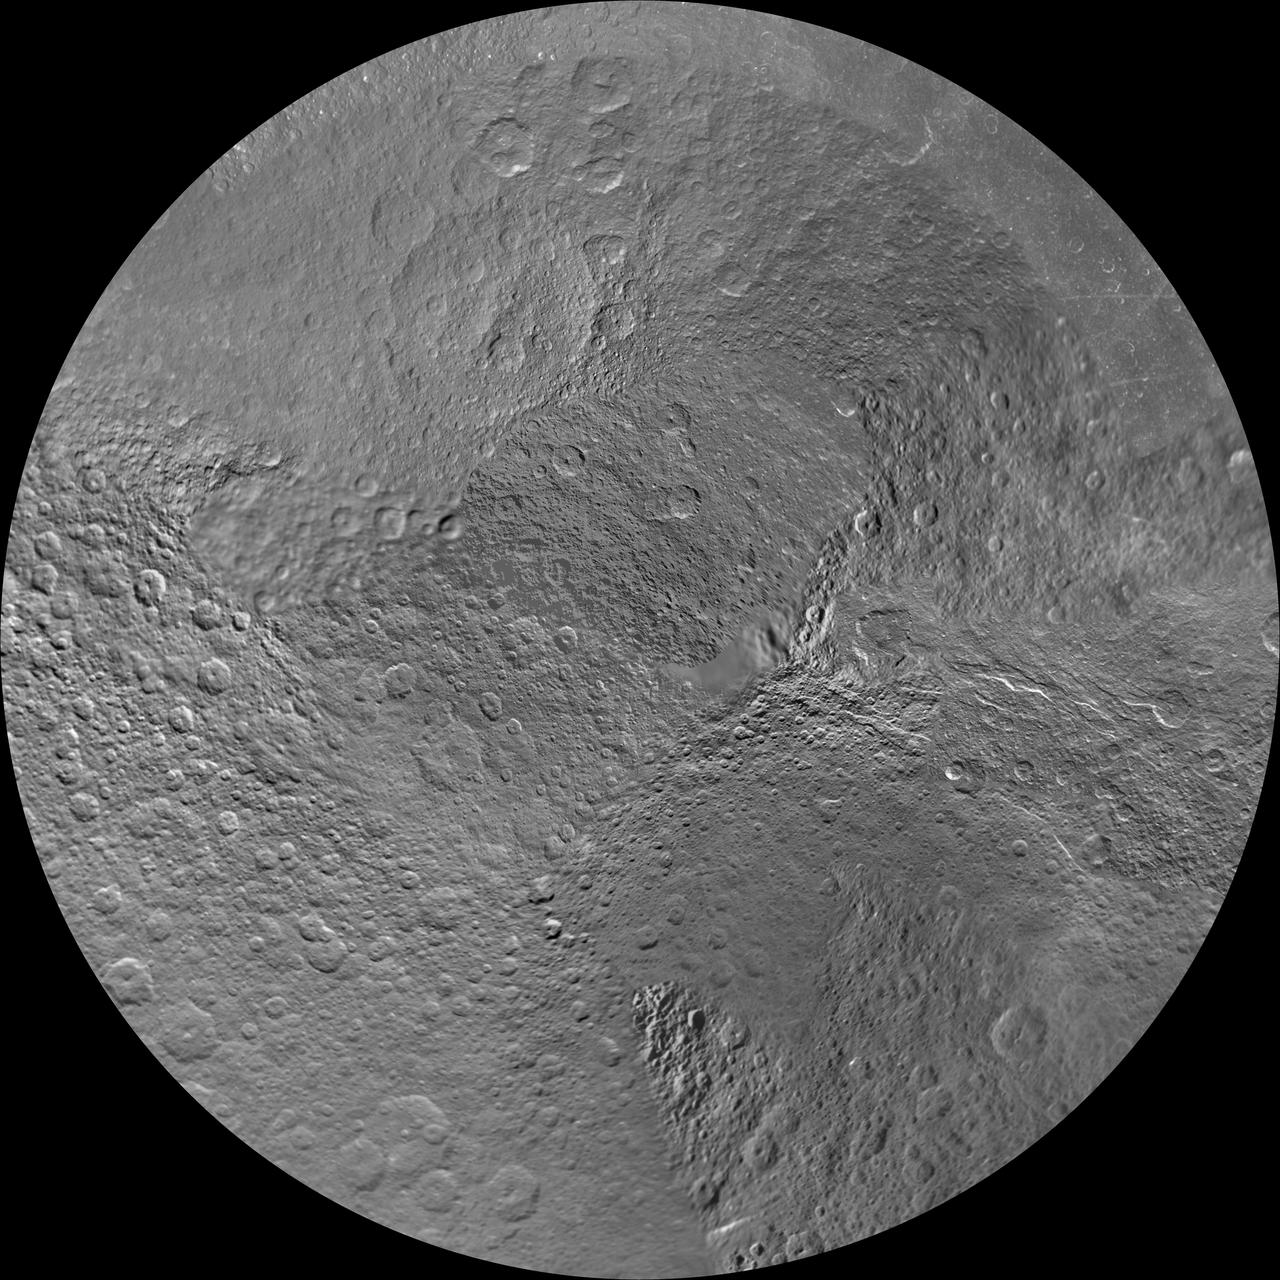
The northern and southern hemispheres of Saturn moon Mimas are seen in these polar stereographic maps, mosaicked from the best-available NASA Cassini and Voyager images.
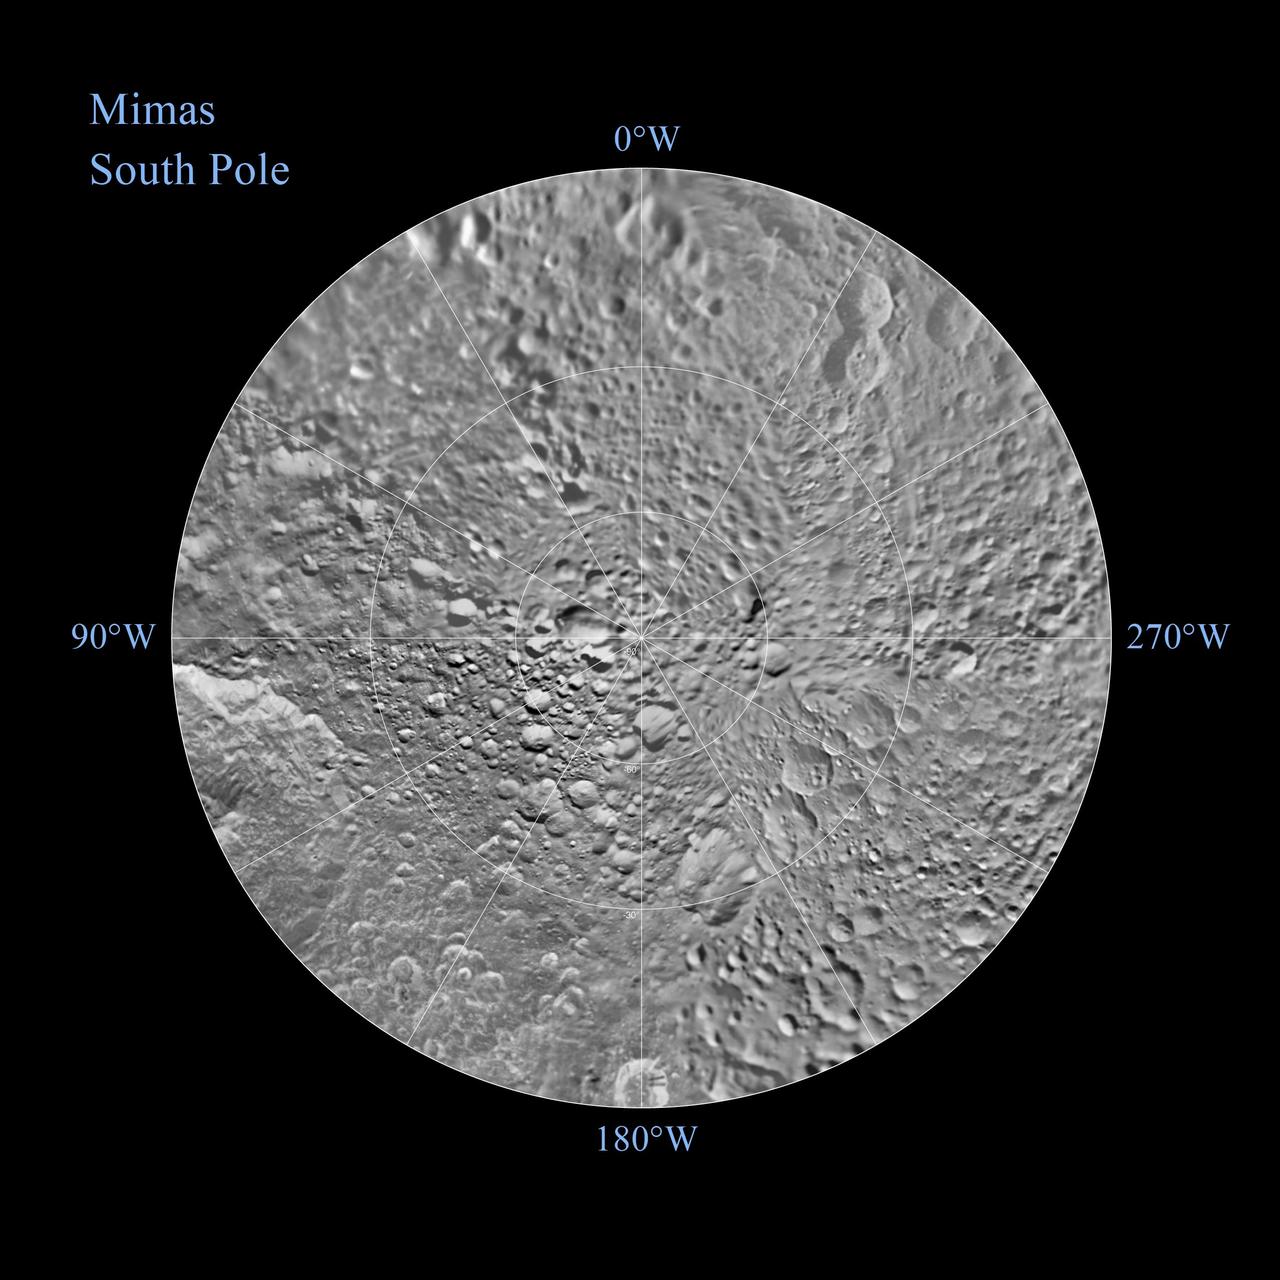
The southern hemisphere of Saturn moon Mimas is seen in these polar stereographic maps, mosaicked from the best-available NASA Cassini and Voyager images.
This global digital map of Saturn moon Tethys was created using data taken by the Cassini spacecraft, with gaps in coverage filled in by NASA Voyager spacecraft data
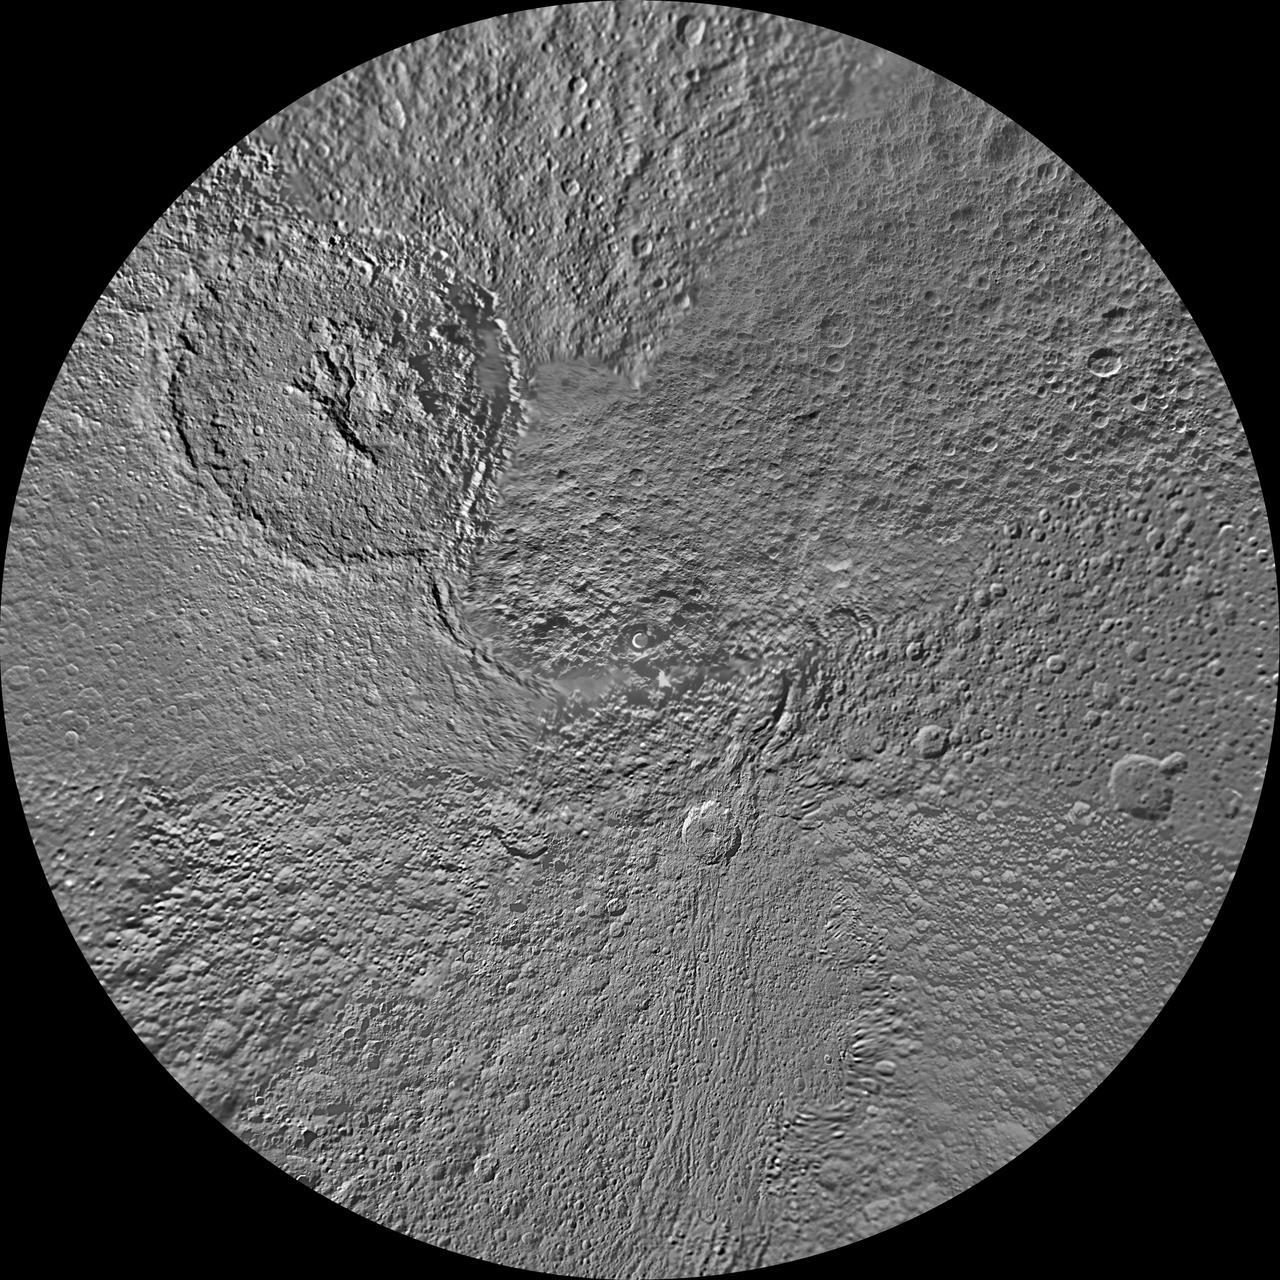
The northern hemisphere of Saturn moon Tethys is seen in this updated polar stereographic map, mosaicked from the best-available images obtained by NASA Cassini spacecraft.
This global digital map of Saturn moon Mimas was created using data taken by the Cassini spacecraft, with gaps in coverage filled in by NASA Voyager spacecraft data

This map shows the temperatures for most of the surface of Ganymede made from data taken by on Jun. 26, 1996 as NASA Galileo approached the sunlit side of the moon.
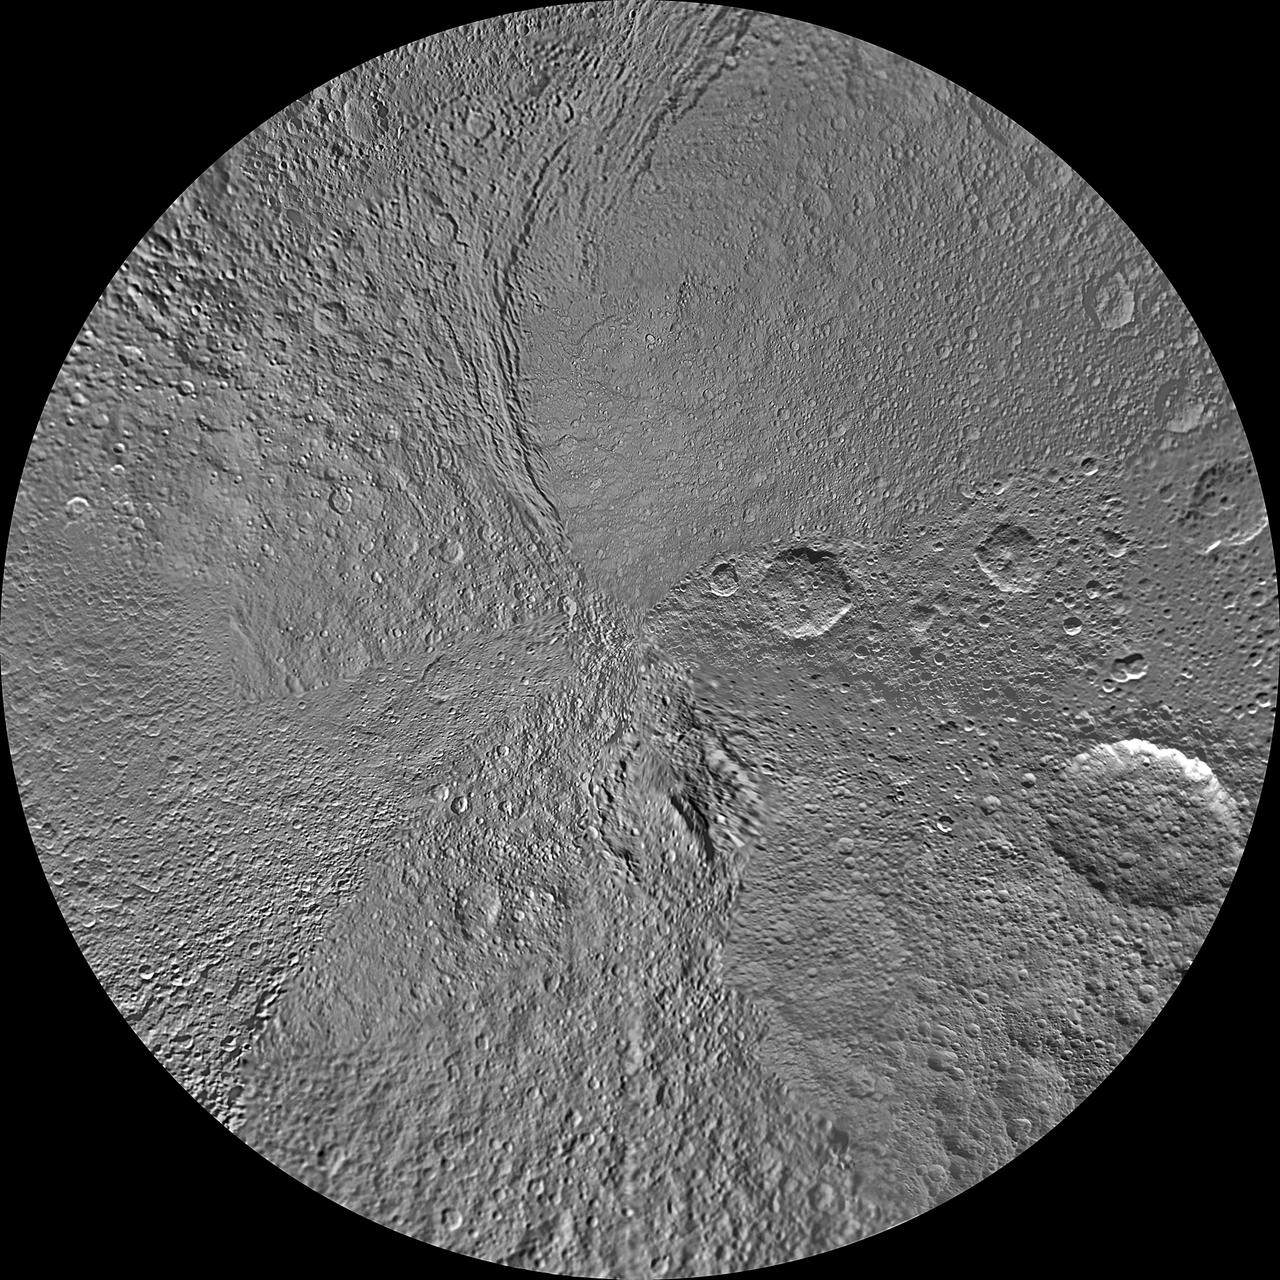
The southern hemisphere of Saturn moon Tethys is seen in this updated polar stereographic maps, mosaicked from the best-available images obtained by NASA Cassini spacecraft.
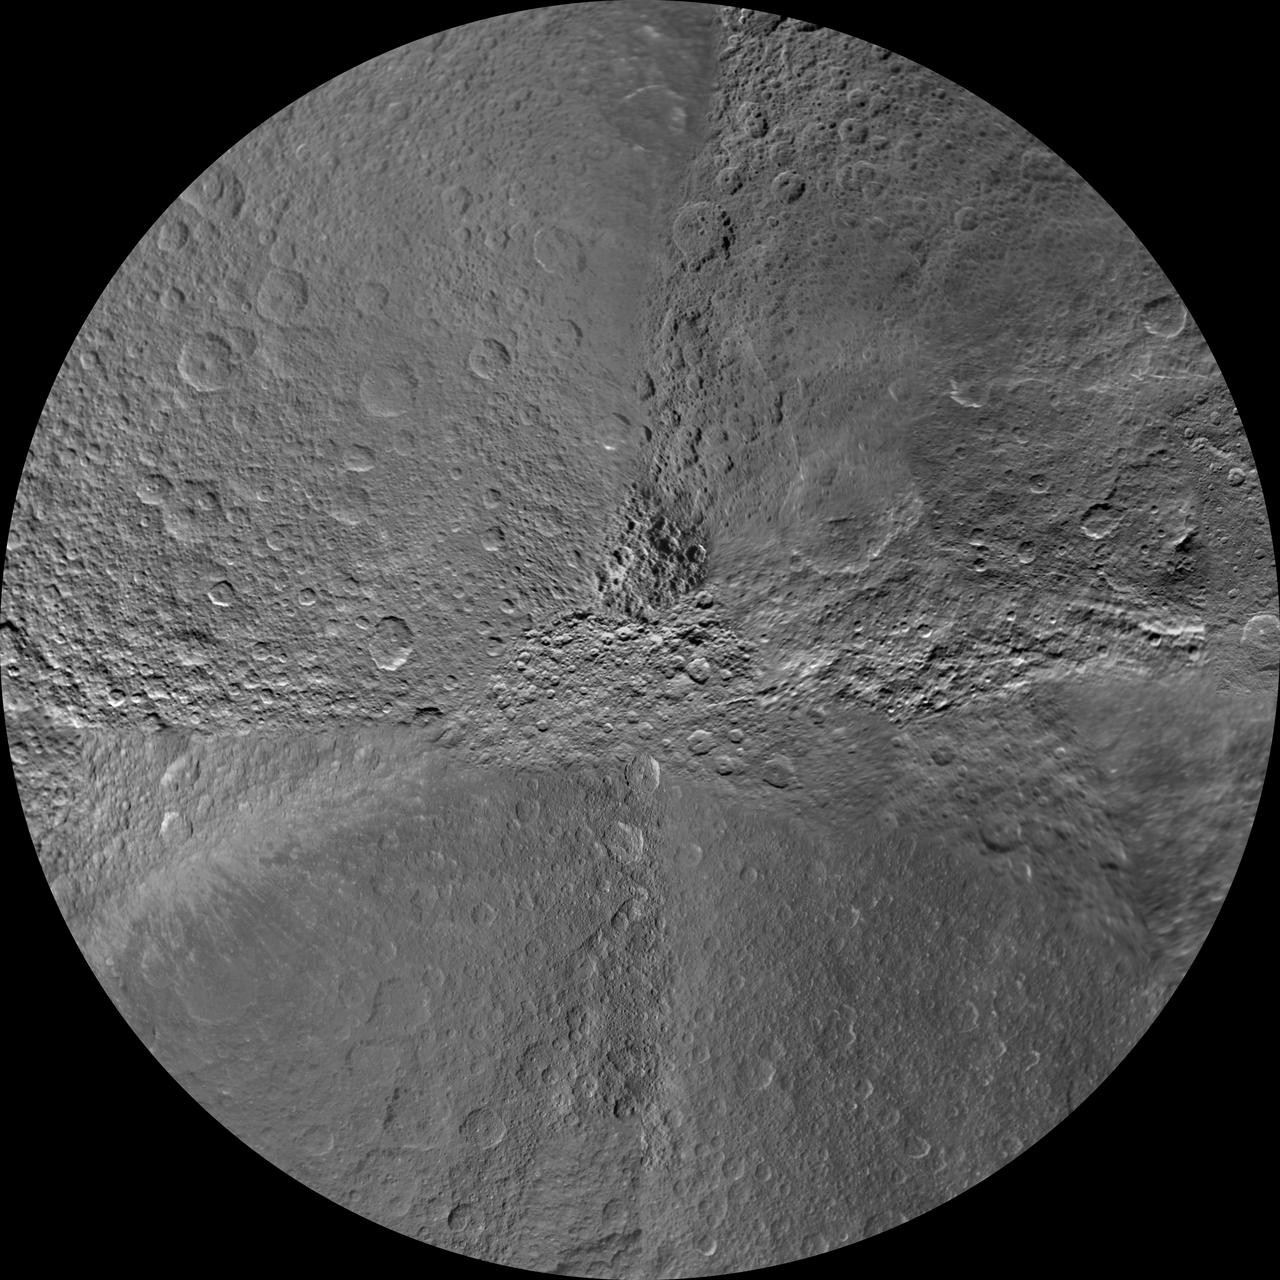
The southern hemisphere of Saturn moon Rhea is seen in this polar stereographic maps, mosaicked from the best-available images obtained by NASA Cassini spacecraft.
The northern hemisphere of Saturn moon Rhea is seen in this polar stereographic map, mosaicked from the best-available images obtained by NASA Cassini and Voyager spacecraft.

Volcanic hot spots are seen in this color temperature map of the Prometheus volcano on Jupiter moon Io created with data obtained by NASA Galileo and Voyager spacecraft.
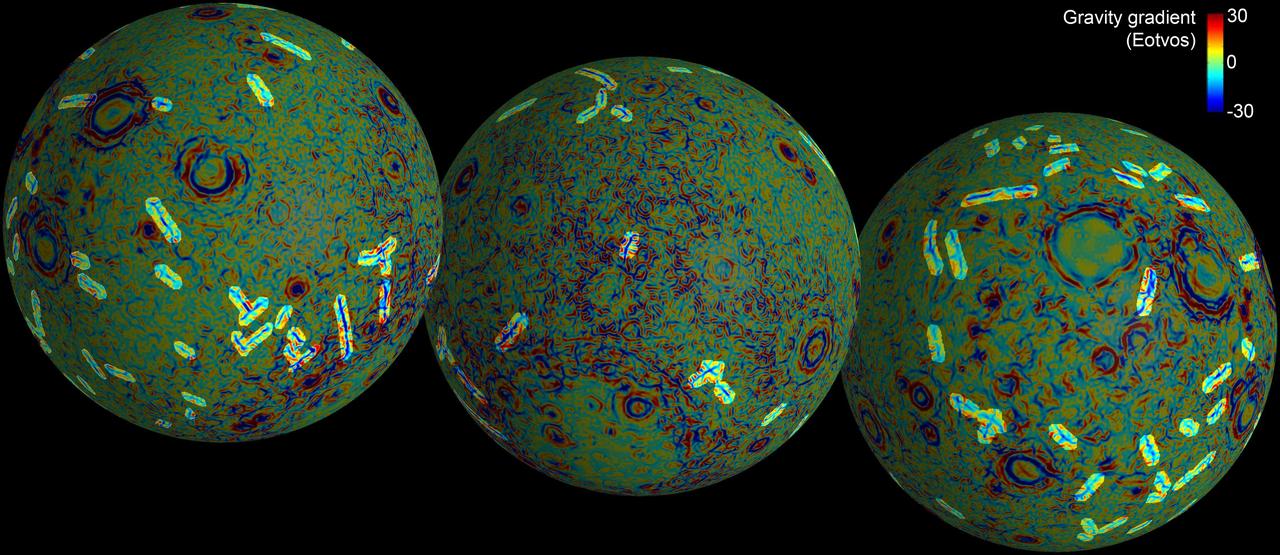
These maps of the near and far side of the moon show the gravity gradients as measured by NASA GRAIL mission, highlighting a population of linear gravity anomalies.

New and older lava flows clustered in the Tvashtar region of Jupiter moon Io appeared as hot spots in a temperature map from NASA Galileo spacecraft in 1999.
This global map of Saturn moon Mimas was created using images taken during NASA Cassini spacecraft flybys, with Voyager images filling in the gaps in Cassini coverage.
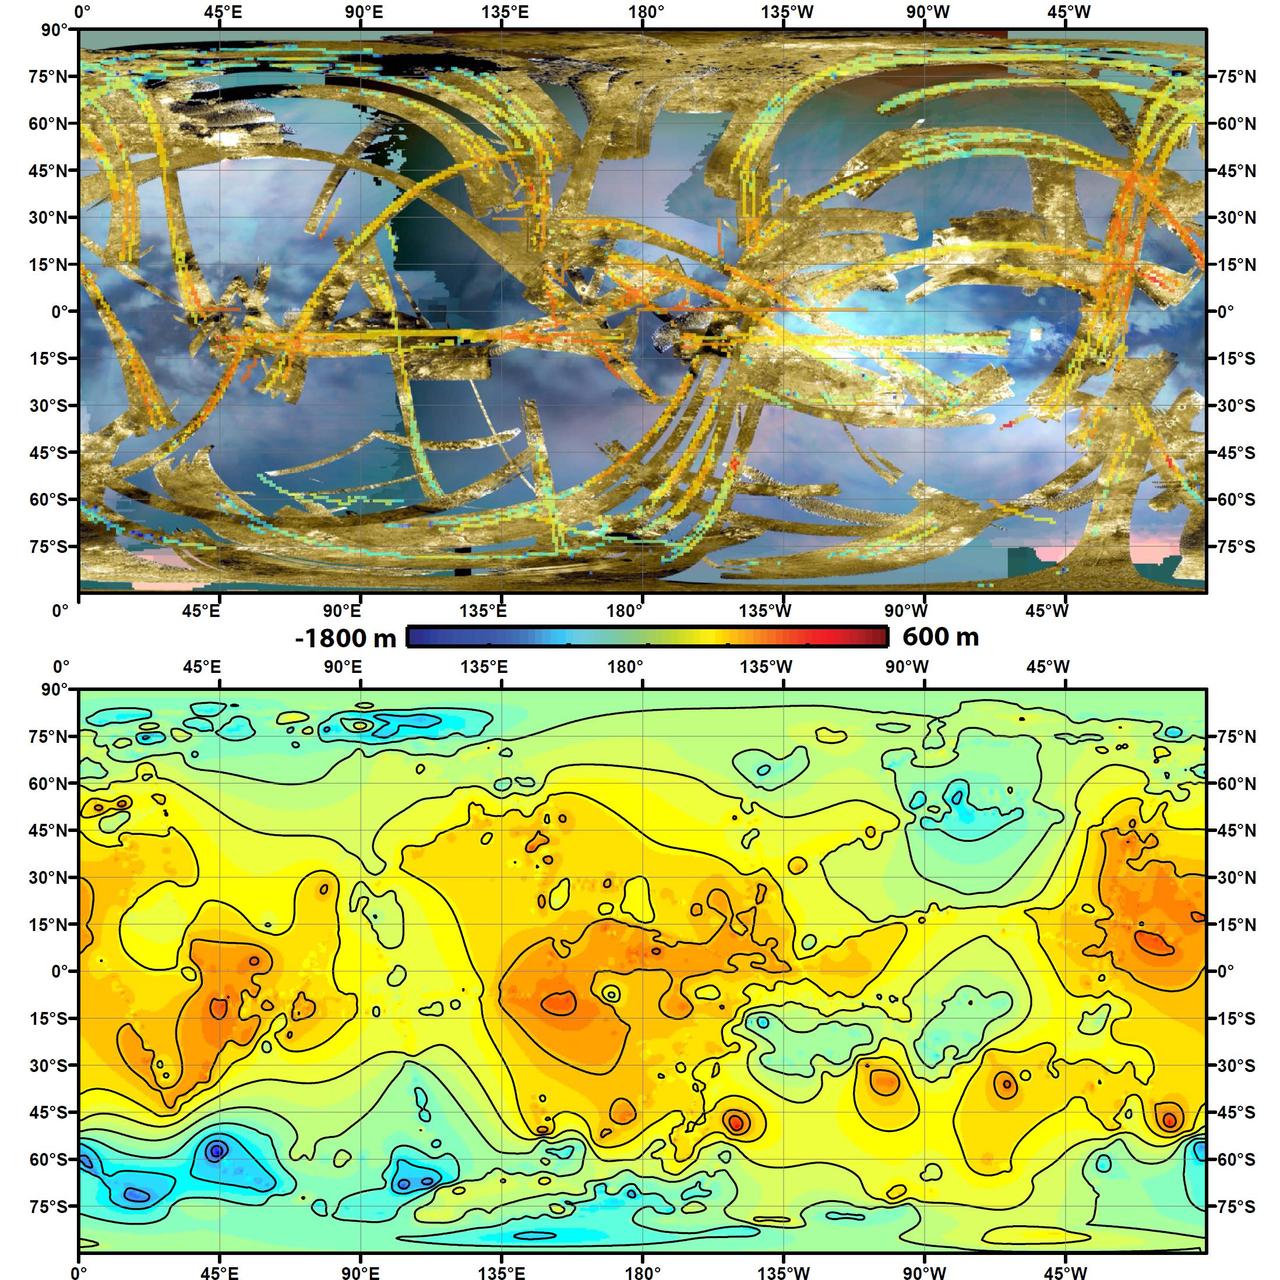
To create the first global, topographic map of Saturn moon Titan, scientists analyzed data from NASA Cassini spacecraft and a mathematical process called splining.
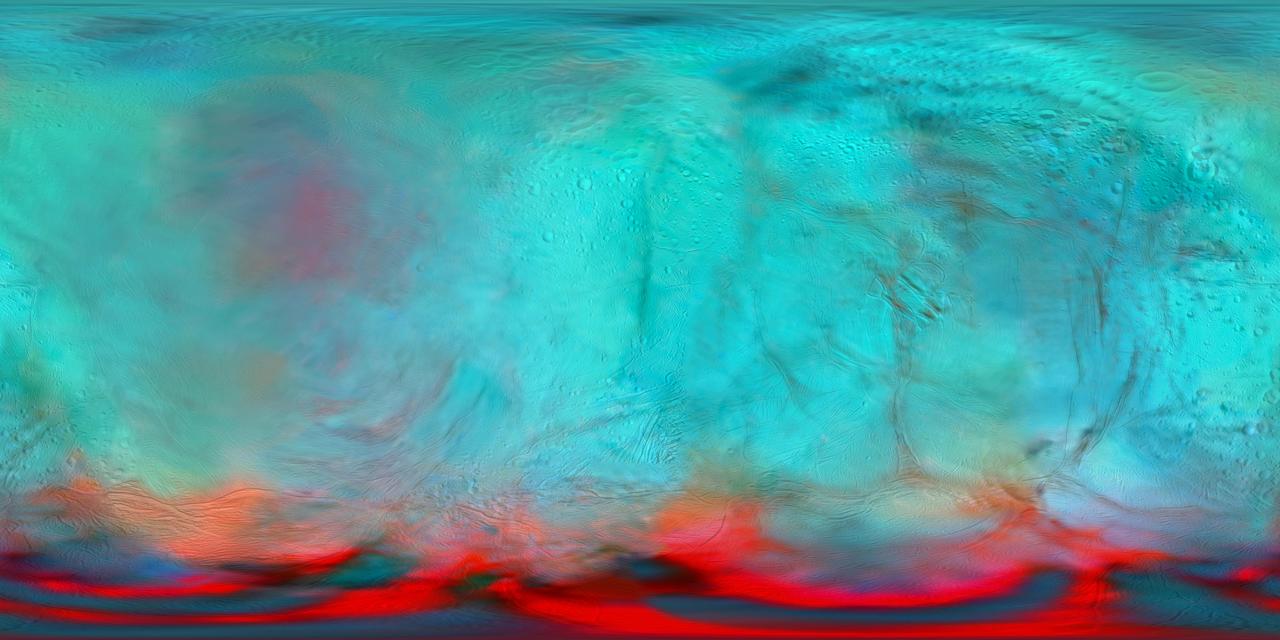
This infrared global map of Saturn's icy moon Enceladus was created using images acquired by NASA's Cassini spacecraft. It is a companion to the global views presented in PIA24023. It combines infrared maps obtained by the spacecraft's Visual and Infrared Mapping Spectrometer (VIMS), published by Robidel et al. (2020), and the visible map from the Imaging Science Subsystem (ISS), published by Bland et al. (2018). The colors used in this map represent infrared data collected by the VIMS instrument. The red color channel corresponds to a ratio of Enceladus' brightness observed at 3.1 microns divided by its brightness at 1.65 microns; the green channel corresponds to the brightness at 2.0 microns; and the blue channel corresponds to the brightness at 1.8 microns. These colors highlight the location of fresh crystalline ice, indicated by a red tint. Researchers also superimposed a high-resolution map of the moon's surface taken with the ISS camera (clear filter images), in order to show geologic features. All seams and spurious artifacts were removed to produce a globally smooth image used in the orthographic views published in PIA24023. This map is an equirectangular projection center at 0° longitude. The mean radius of Enceladus used for the projection of this map is 252.1 km (corresponding to a scale of 200 meters per pixel at the equator). References: - Robidel et al. (2020) - https://doi.org/10.1016/j.icarus.2020.113848 - Bland et al (2018) - https://doi.org/10.1029/2018EA000399 More information about Cassini can be found here: https://solarsystem.nasa.gov/cassini. https://photojournal.jpl.nasa.gov/catalog/PIA24027
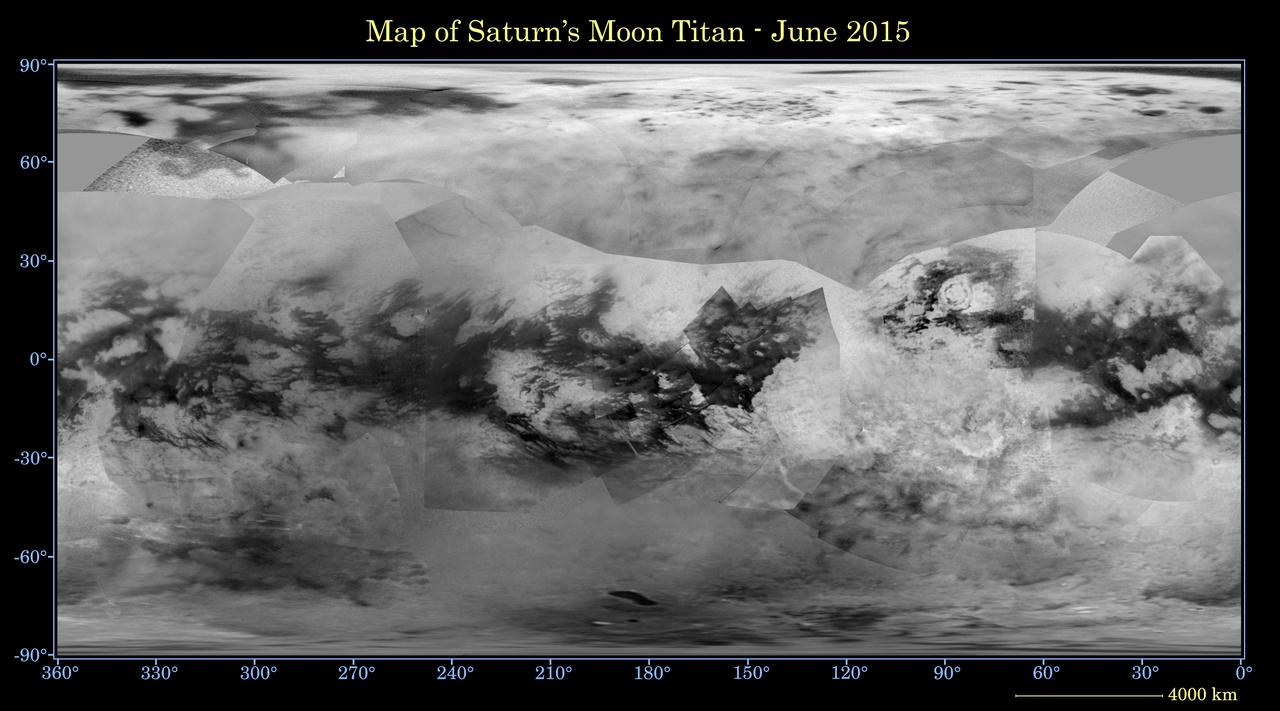
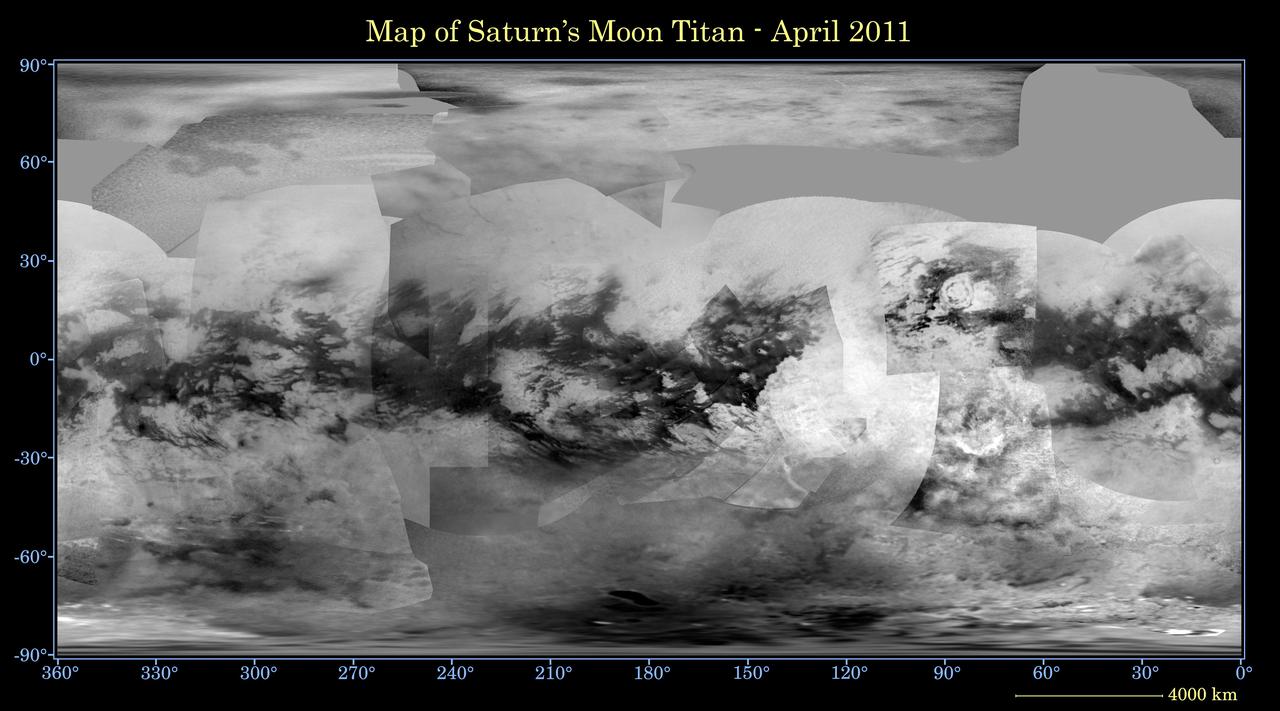
This global digital map of Saturn's moon Titan was created using images taken by NASA's Cassini spacecraft's imaging science subsystem (ISS). The map was produced in June 2015 using data collected through Cassini's flyby on April 7, 2014, known as "T100." The images were taken using a filter centered at 938 nanometers, allowing researchers to examine variations in albedo (or inherent brightness) across the surface of Titan. Because of the scattering of light by Titan's dense atmosphere, no topographic shading is visible in these images. The map is an equidistant projection and has a scale of 2.5 miles (4 kilometers) per pixel. Actual resolution varies greatly across the map, with the best coverage (close to the map scale) along the equator near the center of the map at 180 degrees west longitude. The lowest resolution coverage can be seen in the northern mid-latitudes on the sub-Saturn hemisphere. Mapping coverage in the northern polar region has greatly improved since the previous version of this map in 2011 (see PIA14908). Large dark areas, now known to be liquid-hydrocarbon-filled lakes and seas, have since been documented at high latitudes. Titan's north pole was not well illuminated early in Cassini's mission, because it was winter in the northern hemisphere when the spacecraft arrived at Saturn. Cassini has been better able to observe northern latitudes in more recent years due to seasonal changes in solar illumination. This map is an update to the previous versions released in April 2011 and February 2009 (see PIA11149). Data from the past four years (the most recent data in the map is from April 2014) has completely filled in missing data in the north polar region and replaces the earlier imagery of the Xanadu region with higher quality data. A data gap of about 3 to 5 percent of Titan's surface still remains, located in the northern mid-latitudes on the sub-Saturn hemisphere of Titan. The uniform gray area in the northern hemisphere indicates a gap in the imaging coverage of Titan's surface, to date. The missing data will be imaged by Cassini during flybys on December 15, 2016 and March 5, 2017. The mean radius of Titan used for projection of this map is 1,600 miles (2,575 kilometers). Titan is assumed to be spherical until a control network -- a model of the moon's shape based on multiple images tied together at defined points on the surface -- is created at some point in the future. http://photojournal.jpl.nasa.gov/catalog/PIA19658
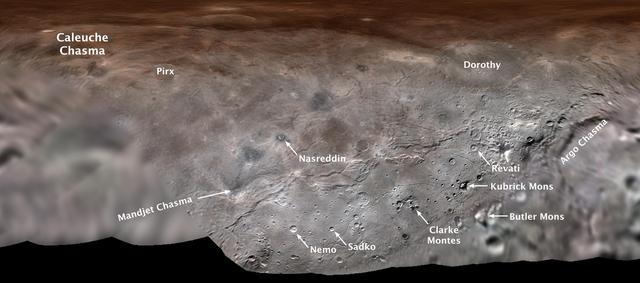
Map projection of Charon, the largest of Pluto's five moons, annotated with its first set of official feature names. With a diameter of about 755 miles, the Texas-sized moon is one of largest known objects in the Kuiper Belt, the region of icy, rocky bodies beyond Neptune. https://photojournal.jpl.nasa.gov/catalog/PIA00442

This view of the volcanic plains of Neptune moon Triton was produced using topographic maps derived from images acquired by NASA Voyager spacecraft during its August 1989 flyby, 20 years ago this week.

The Culann Patera volcano on Jupiter moon Io was observed by the near-infrared mapping spectrometer instrument onboard NASA Galileo spacecraft during its Io flyby on Nov. 25, 1999.
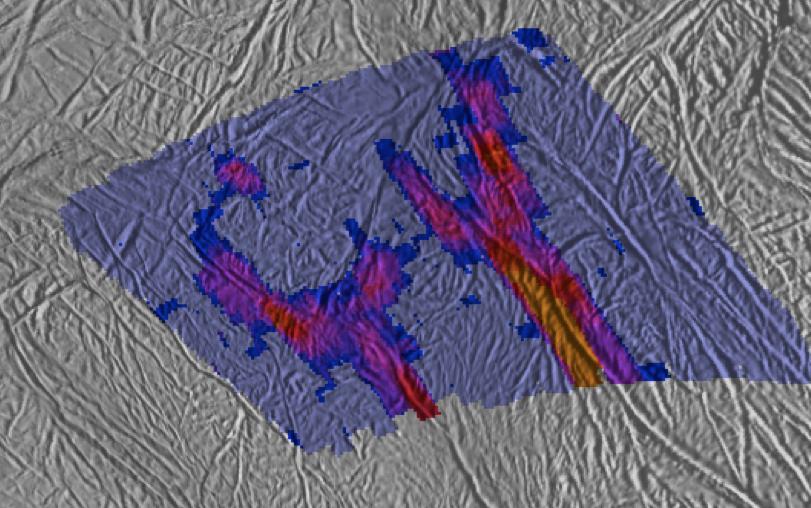
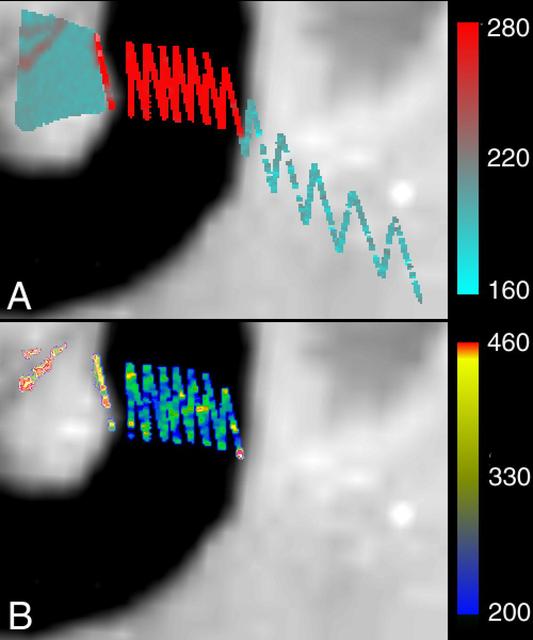
This image shows a high-resolution heat intensity map of part of the south polar region of Saturn moon Enceladus, made from data obtained by NASA Cassini spacecraft.
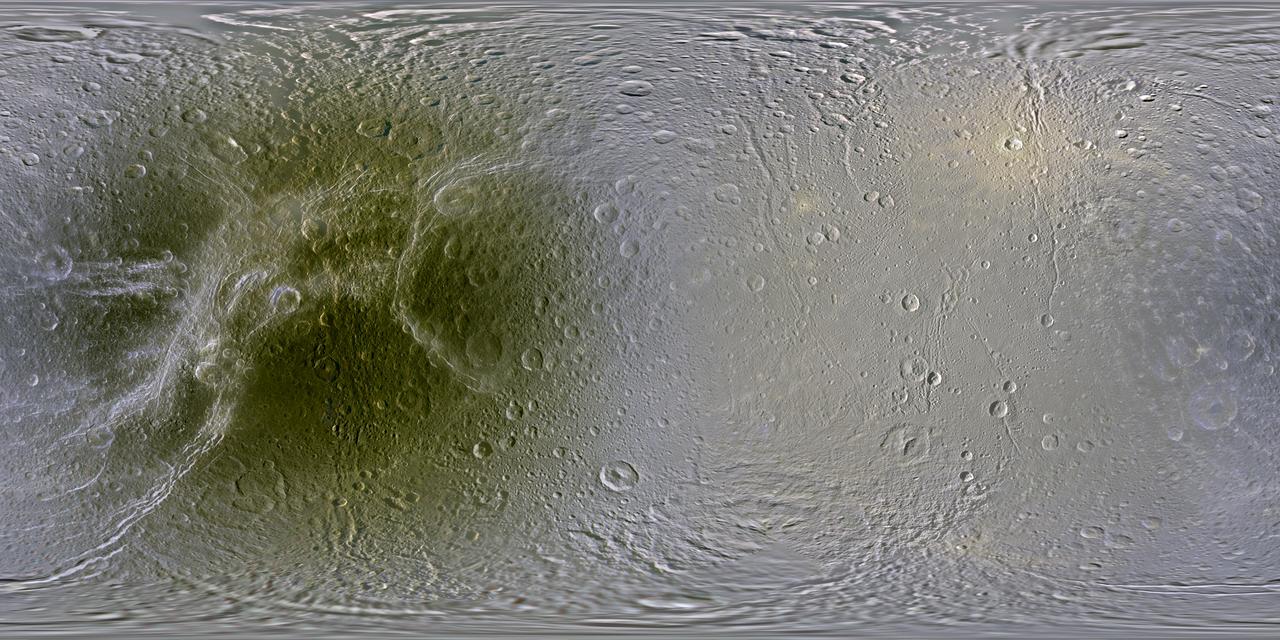
This set of global, color mosaics of Saturn moon Dione taken by NASA Cassini spacecraft during its first ten years exploring the Saturn system; obvious feature on the maps is the difference in color and brightness between the two hemispheres.
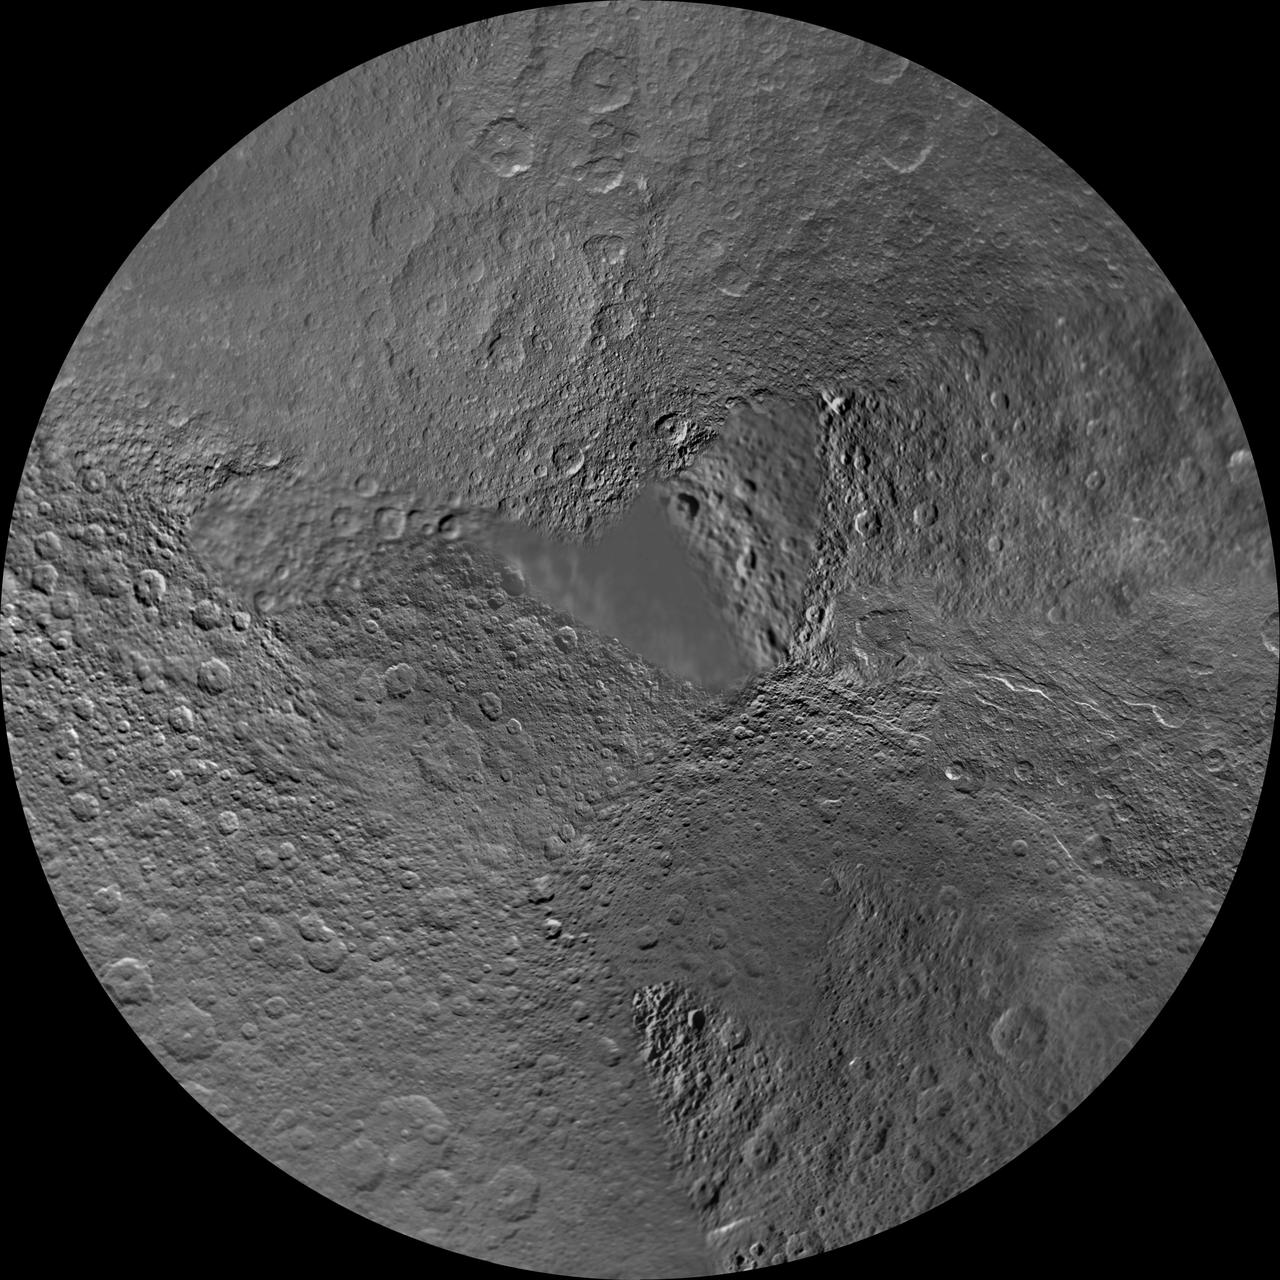
The southern hemisphere of Saturn moon Dione is seen in this polar stereographic maps, mosaicked from the best-available clear-filter images from NASA Cassini and Voyager missions.

This view of the volcanic plains of Neptune moon Triton was produced using topographic maps derived from images acquired by NASA Voyager spacecraft during its August 1989 flyby, 20 years ago this week.
This global digital map of Saturn moon Titan was created using images taken by NASA Cassini spacecraft imaging science subsystem ISS. Because of the scattering of light by Titan dense atmosphere, no topographic shading is visible here.

NASA Voyager 2 spacecraft flew by Triton, a moon of Neptune, in the summer of 1989. Dr. Paul Schenk, a scientist at the Lunar and Planetary Institute in Houston, used Voyager data to construct the best-ever global color map of Triton.
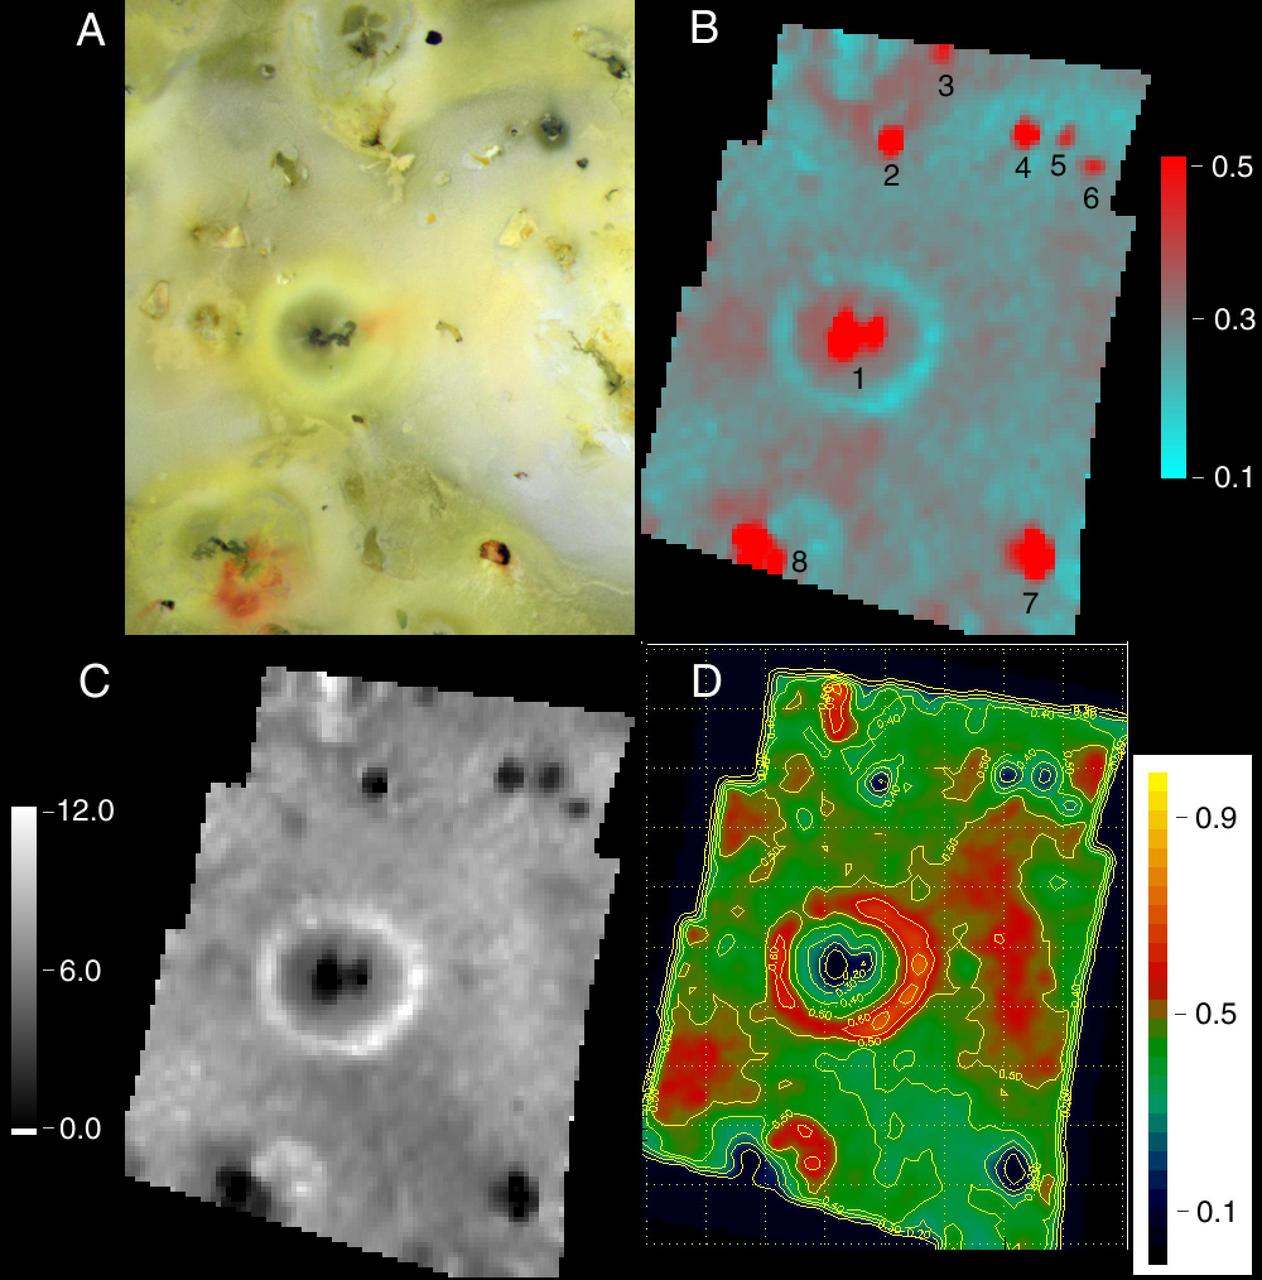
This image of Loki Patera on Jupiter volcanic moon Io shows data taken by the near-infrared mapping spectrometer onboard NASA Galileo spacecraft during its Io flyby on Oct. 10, 1999.
The Prometheus region of Jupiter moon Io was imaged by NASA Galileo spacecraft in 1999. The maps made from spectrometer data show the interplay between hot silicates on the surface and sulfur dioxide frost.
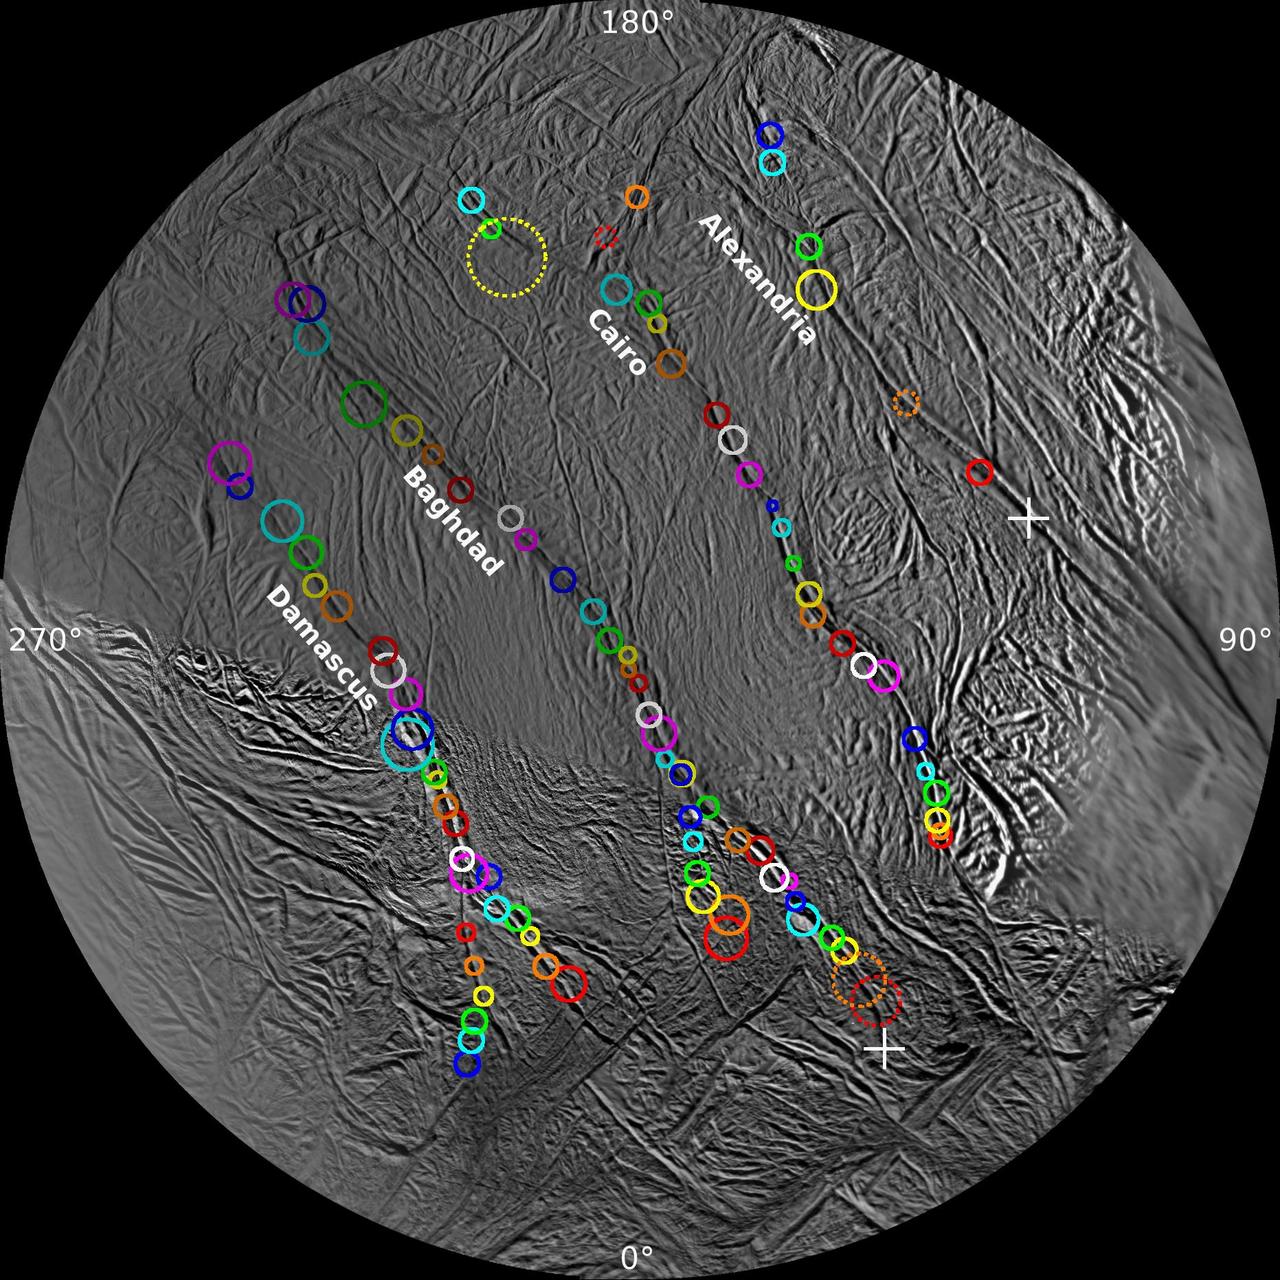
On this polar stereographic map of Enceladus south polar terrain, all 100 geysers have been plotted whose source locations have been determined in NASA Cassini imaging survey of the moon geyser basin.
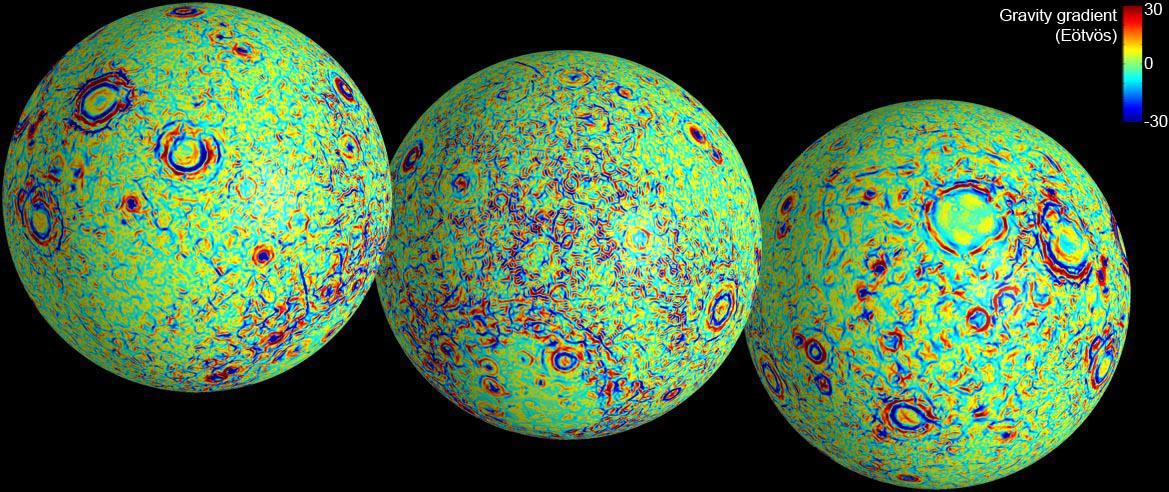
These maps of the near and far side of the moon show gravity gradients as measured by NASA GRAIL mission. Red and blue areas indicate stronger gradients due to underlying mass anomalies.
This visual and infrared mapping spectrometer image captured by NASA Cassini spacecraft of Saturn moon Enceladus, shows the dark cracks at the south pole dubbed tiger stripes for their distinct stripe-like appearance.

This view of the volcanic plains of Neptune moon Triton was produced using topographic maps derived from images acquired by NASA Voyager spacecraft during its August 1989 flyby, 20 years ago this week.
Data from NASA Cassini spacecraft have enabled scientists to make the highest-resolution heat intensity maps yet for the hottest part of a tiger stripe fissure on Saturn moon Enceladus.
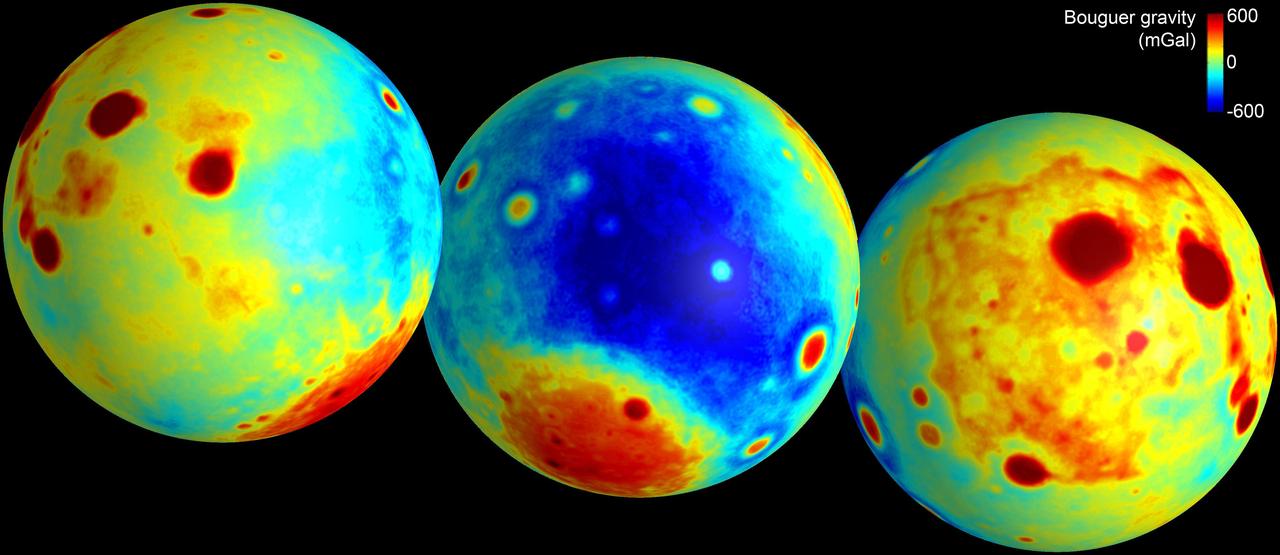
These maps of the moon show the Bouguer gravity anomalies as measured by NASA GRAIL mission. Red areas have stronger gravity, while blue areas have weaker gravity.
A global map of Jupiter moon Io derived from eight images taken by the Long Range Reconnaissance Imager LORRI on the New Horizons spacecraft, as it passed Jupiter on its way to Pluto in late February 2007.
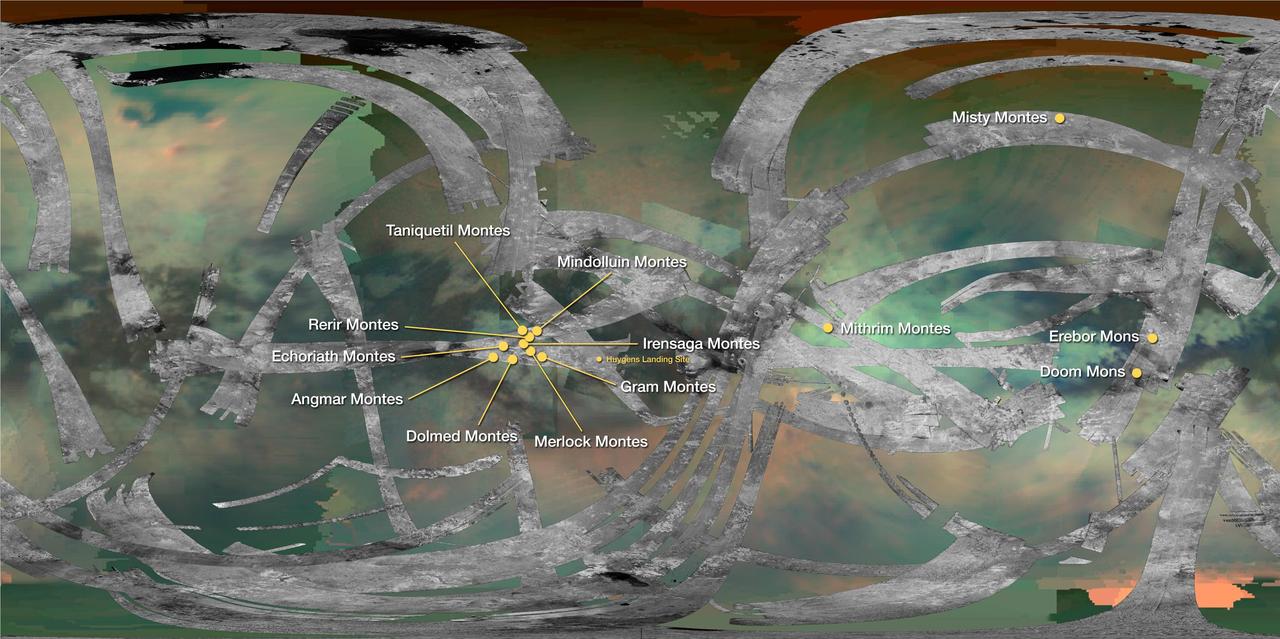
This map of Saturn moon Titan identifies the locations of mountains named by the International Astronomical Union. By convention, mountains on Titan are named for mountains from Middle-earth, the fictional setting in fantasy novels by J.R.R. Tolkien.

This map of Saturn moon Titan by the Cassini radar mapper using its synthetic aperture radar imaging mode. Shown are a variety of geologic features, including impact craters, wind-blown deposits, channels and cryovolcanic features
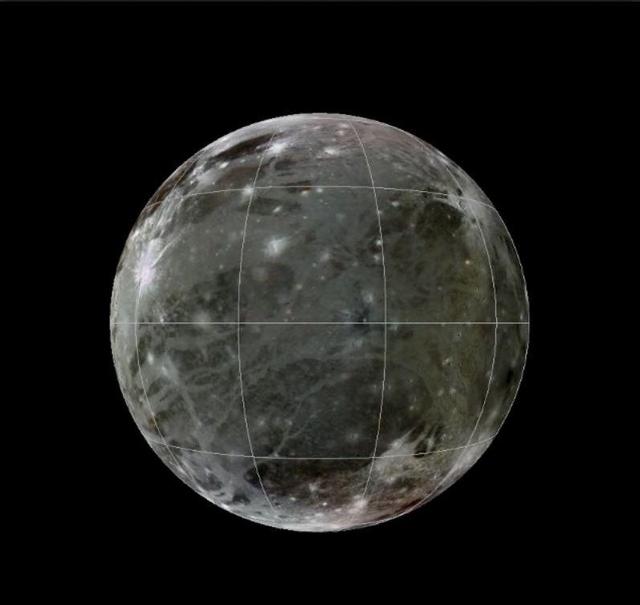
This is a frame from an animation of a rotating globe of Jupiter moon Ganymede, with a geologic map superimposed over a global color mosaic, incorporating the best available imagery from NASA Voyager 1 and 2 spacecraft, and Galileo spacecraft.

NASA Galileo spacecraft, which was used to map the mineral and ice properties over the surfaces of the Jovian moons, producing global spectral images for small selected regions on the satellites in 1996-97.
The northern and southern hemispheres of Rhea are seen in these polar stereographic maps, mosaicked from the best-available NASA Cassini and Voyager images. Six Voyager images fill in gaps in Cassini coverage of the moon north pole.
The northern and southern hemispheres of Rhea are seen in these polar stereographic maps, mosaicked from the best-available NASA Cassini and Voyager images. Six Voyager images fill in gaps in Cassini coverage of the moon north pole.
The northern hemisphere of Saturn moon Dione is seen in this polar stereographic maps, mosaicked from the best-available clear-filter images from NASA Cassini and Voyager missions.
This global map of Saturn moon Mimas was created using images taken during NASA Cassini spacecraft flybys, with NASA Voyager images filling in the gaps in Cassini coverage.
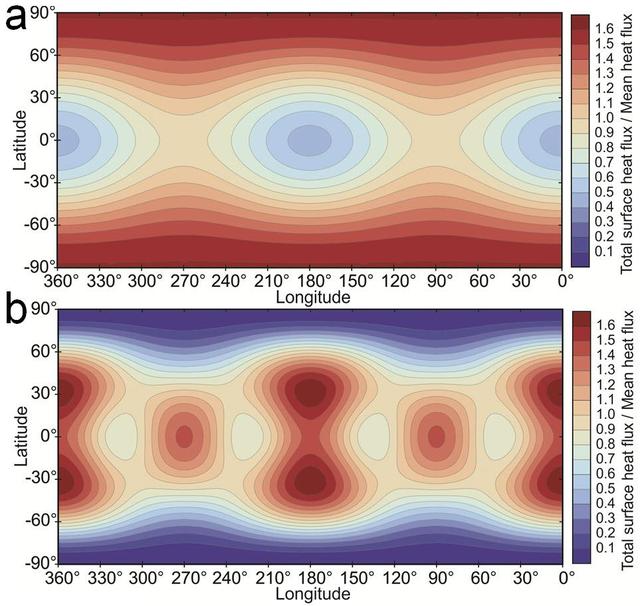
This map shows predicted heat flow at the surface of Jupiter moon Io from two tidal-heating models. Red indicates areas where more heat is expected; blue where less heat is expected.
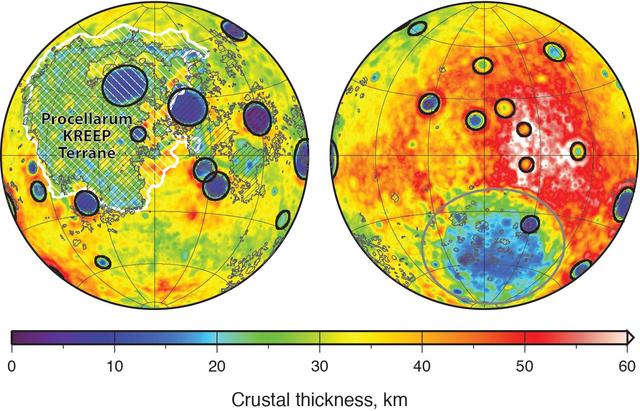
Global map of crustal thickness of the moon derived from gravity data obtained by NASA GRAIL spacecraft. The lunar near side is represented on the left hemisphere. The far side is represented in the right hemisphere.

This simulated voyage over the surface of Neptune large moon Triton was produced using topographic maps derived from images acquired by NASA Voyager spacecraft during its August 1989 flyby, 20 years ago this week.
This global map of Saturn moon Dione was created using images taken during flybys by NASA Cassini spacecraft. Images from NASA Voyager mission fill the gaps in Cassini coverage.
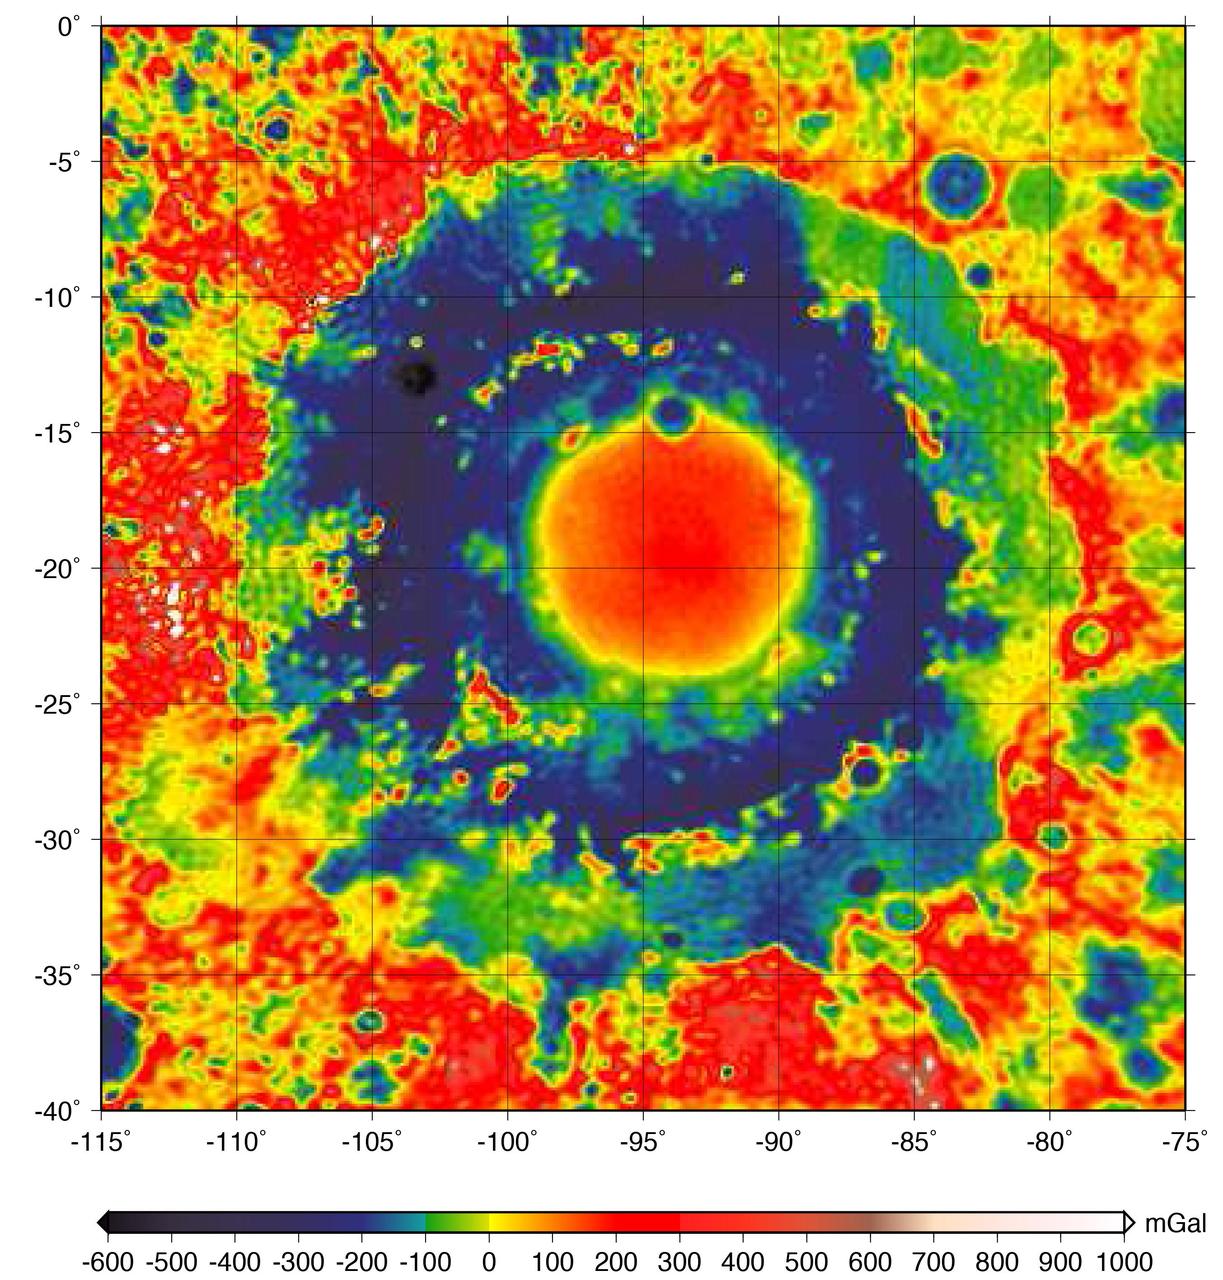
This color-coded map shows the strength of surface gravity around Orientale basin on Earth's moon, derived from data obtained by NASA's GRAIL mission. The GRAIL mission produced a very high-resolution map of gravity over the surface of the entire moon. This plot is zoomed in on the part of that map that features Orientale basin, where the two GRAIL spacecraft flew extremely low near the end of their mission. Their close proximity to the basin made the probes' measurements particularly sensitive to the gravitational acceleration there (due to the inverse squared law). The color scale plots the gravitational acceleration in units of "gals," where 1 gal is one centimeter per second squared, or about 1/1000th of the gravitational acceleration at Earth's surface. (The unit was devised in honor of the astronomer Galileo). Labels on the x and y axes represent latitude and longitude. http://photojournal.jpl.nasa.gov/catalog/PIA21050
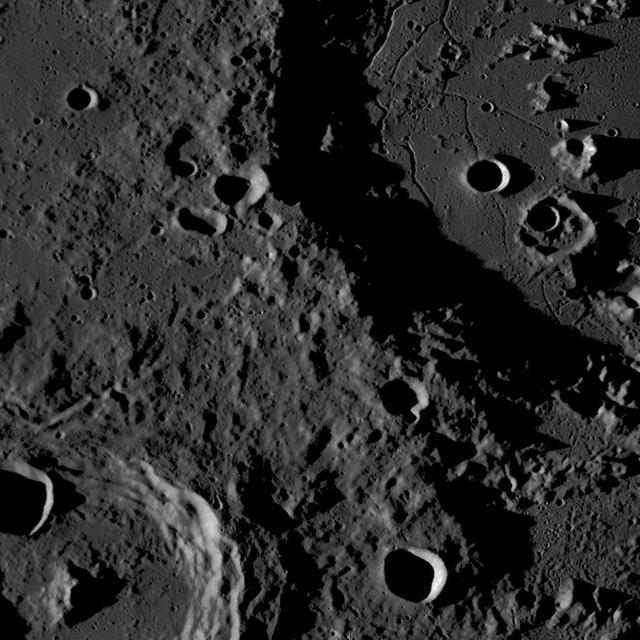
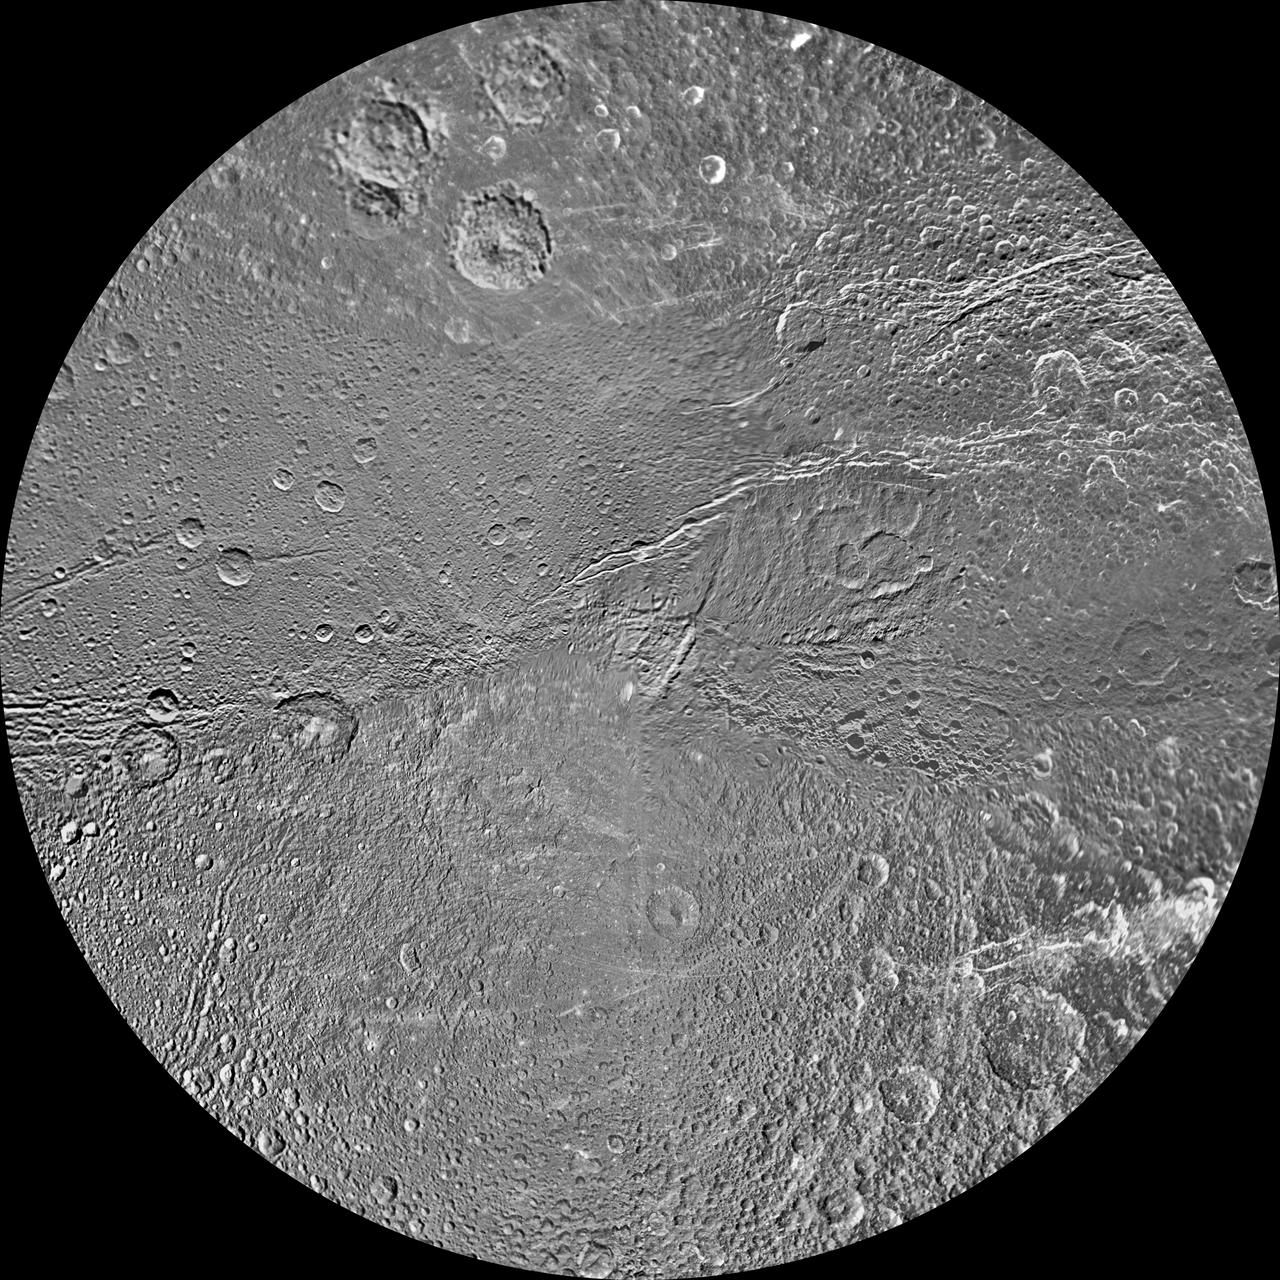
Mosaic of a floor-fractured crater, acquired by the Wide Angle Camera onboard NASA Lunar Reconnaissance Orbiter 560 nm filter. Scene is approximately 160 km across.
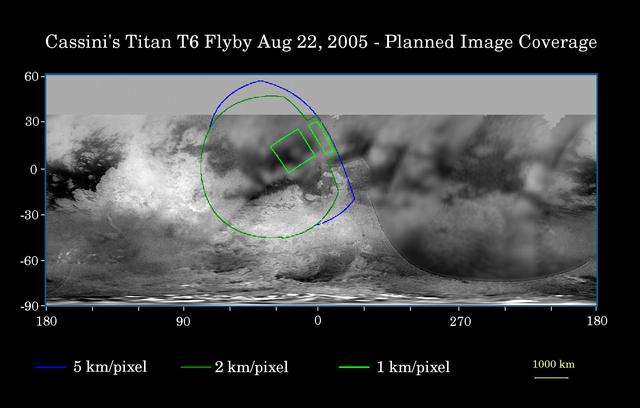
This map of Titan's surface illustrates the regions that will be imaged by Cassini during the spacecraft's close flyby of Titan on Aug. 22, 2005. At closest approach, the spacecraft is expected to pass approximately 3,800 kilometers (2,360 miles) above the moon's surface. At 5,150 kilometers (3,200 miles) across, Titan is one of the solar system's largest moons. The colored lines delineate the regions that will be imaged at differing resolutions. As Cassini continues its reconnaissance of Titan, maps of this haze-enshrouded world continue to improve. Images from this flyby will sharpen the moderate resolution coverage of terrain on the side of Titan that always faces Saturn. The highest resolution image planned for this encounter will cover a 215-kilometer-wide (134-mile) bright feature provisionally named "Bazaruto Facula." (A facula is the name chosen to denote a bright spot on Titan.) At the center of the facula is an 80-kilometer-wide (50-mile) crater (not yet named), seen by Cassini's radar experiment during a Titan flyby in February 2005 (see PIA07368). The imaging cameras and visual and infrared mapping spectrometer images taken in March and April 2005 also show this crater (see PIA06234). The southernmost corner of the highest resolution (1 kilometer per pixel) frame should also cover the northern portion of a large bright feature provisionally known as "Quivira." Wide-angle images obtained during this flyby should cover much of the Tsegihi-Aztlan-Quivira region (also known as the "H" region) at lower resolution. The map shows only brightness variations on Titan's surface (the illumination is such that there are no shadows and no shading from topographic variations). Previous observations indicate that, due to Titan's thick, hazy atmosphere, the sizes of surface features that can be resolved are up to five times larger than the actual pixel scale labeled on the map. The images for this global map were obtained using a narrow-band filter centered at 938 nanometers -- a near-infrared wavelength (invisible to the human eye) at which light can penetrate Titan's atmosphere. The images have been processed to enhance surface details. http://photojournal.jpl.nasa.gov/catalog/PIA07711
The northern and southern hemispheres of Titan are seen in these polar stereographic maps, assembled in 2015 using the best-available images of the giant Saturnian moon from NASA's Cassini mission. The images were taken by Cassini's imaging cameras using a spectral filter centered at 938 nanometers, allowing researchers to examine variations in albedo (or inherent brightness) across the surface of Titan. These maps utilize imaging data collected through Cassini's flyby on April 7, 2014, known as "T100." Titan's north pole was not well illuminated early in Cassini's mission, because it was winter in the northern hemisphere when the spacecraft arrived at Saturn. Cassini has been better able to observe northern latitudes in more recent years due to seasonal changes in solar illumination. Compared to the previous version of Cassini's north polar map (see PIA11146), this map provides much more detail and fills in a large area of missing data. The imaging data in these maps complement Cassini synthetic aperture radar (SAR) mapping of Titan's north pole (see PIA17655). The uniform gray area in the northern hemisphere indicates a gap in the imaging coverage of Titan's surface, to date. The missing data will be imaged by Cassini during flybys on December 15, 2016 and March 5, 2017. Lakes are also seen in the southern hemisphere map, but they are much less common than in the north polar region. Only a lakes have been confirmed in the south. The dark, footprint-shaped feature at 180 degrees west is Ontario Lacus; a smaller lake named Crveno Lacus can be seen as a very dark spot just above Ontario. The dark-albedo area seen at the top of the southern hemisphere map (at 0 degrees west) is an area called Mezzoramia. Each map is centered on one of the poles, and surface coverage extends southward to 60 degrees latitude. Grid lines indicate latitude in 10-degree increments and longitude in 30-degree increments. The scale in the full-size versions of these maps is 4,600 feet (1,400 meters) per pixel. The mean radius of Titan used for projection of these maps is 1,600 miles (2,575 kilometers). http://photojournal.jpl.nasa.gov/catalog/PIA19657
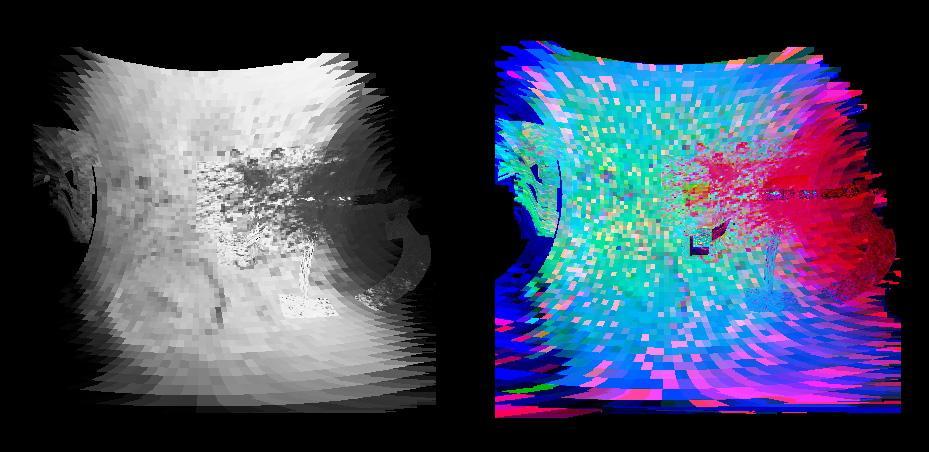
Cassini made a close flyby of Saturn's moon Iapetus on Sept. 10, 2007, and the visual and infrared mapping spectrometer obtained these images during that event. These two images show a higher resolution version of the equatorial region shown in PIA10010. The equatorial region includes the equatorial bulge which shows no differences in these compositions compared to surrounding regions. The color image on the right shows the results of mapping for three components of Iapetus' surface: carbon dioxide that is trapped or adsorbed in the surface (red), water in the form of ice (green), and a newly-discovered effect due to trace amount of dark particles in the ice creating what scientists call Rayleigh scattering (blue). The Rayleigh scattering effect is the main reason why the Earth's sky appears blue. There is a complex transition zone from the dark region, on the right, which is high in carbon dioxide, to the more ice-rich region on the left. Some crater floors are filled with carbon dioxide-rich dark material. As the ice becomes cleaner to the left, the small dark particles become more scattered and increase the Rayleigh scattering effect, again indicative of less than 2 percent dark sub-0.5-micron particles. The visual and infrared mapping spectrometer is like a digital camera, but instead of using three colors, it makes images in 352 colors, or wavelengths, from the ultraviolet to the near-infrared. The many wavelengths produce a continuous spectrum in each pixel, and these spectra measure how light is absorbed by different materials. By analyzing the absorptions expressed in each pixel, a map of the composition at each location on the moon can be constructed. http://photojournal.jpl.nasa.gov/catalog/PIA10011
Seen here are areas mapped on Saturn moon Titan by the Cassini radar mapper using its synthetic aperture radar imaging mode. Shown are a variety of geologic features, including impact craters, wind-blown deposits, channels and cryovolcanic features
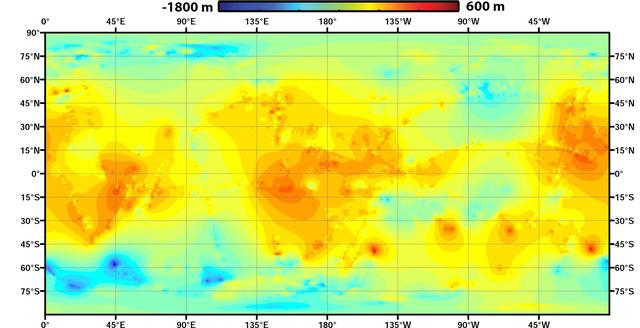
Using data from NASA Cassini spacecraft, scientists have created the first global topographic map of Saturn moon Titan, giving researchers a 3-D tool for learning more about one of the most Earthlike and interesting worlds in the solar system.
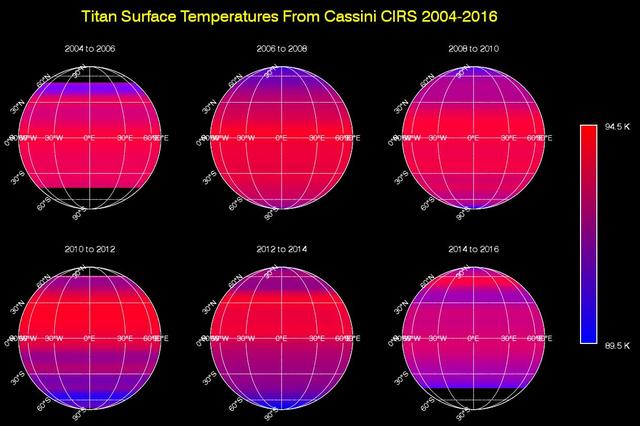
This sequence of maps shows varying surface temperatures on Saturn moon Titan at two-year intervals, from 2004 to 2016. The measurements were made by the Composite Infrared Spectrometer CIRS instrument on NASA Cassini spacecraft. The maps show thermal infrared radiation (heat) coming from Titan's surface at a wavelength of 19 microns, a spectral window at which the moon's otherwise opaque atmosphere is mostly transparent. Temperatures have been averaged around the globe from east to west (longitudinally) to emphasize the seasonal variation across latitudes (from north to south). Black regions in the maps are areas for which there was no data. Titan's surface temperature changes slowly over the course of the Saturn system's long seasons, which each last seven and a half years. As on Earth, the amount of sunlight received at each latitude varies as the sun's illumination moves northward or southward over the course of the 30-year-long Saturnian year. When Cassini arrived at Saturn in 2004, Titan's southern hemisphere was in late summer and was therefore the warmest region. Shortly after the 2009 equinox, in 2010, temperatures were symmetrical across the northern and southern hemispheres, mimicking the distribution observed by Voyager 1 in 1980 (one Titan year earlier). Temperatures subsequently cooled in the south and rose in the north, as southern winter approached. While the overall trend in the temperature shift is clearly evident in these maps, there is narrow banding in several places that is an artifact of making the observations through Titan's atmosphere. The moon's dense, hazy envelope adds noise to the difficult measurement. Although it moves in latitude, the maximum measured temperature on Titan remains around -292 degrees Fahrenheit (-179.6 degrees Celsius, 93.6 Kelvin), with a minimum temperature at the winter pole only 6 degrees Fahrenheit (3.5 degrees Celsius or Kelvin) colder. This is a much smaller contrast than exists between Earth's warmest and coldest temperatures, which can vary by more than 200 degrees Fahrenheit, or more than 100 degrees Celsius. http://photojournal.jpl.nasa.gov/catalog/PIA20020