
Moon seen from the East
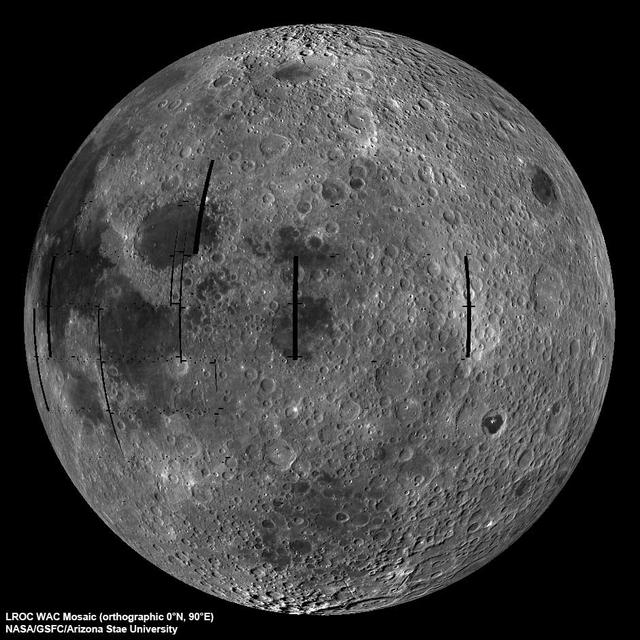
NASA image release September 9, 2010 LROC Wide Angle Camera (WAC) view of the Moon seen from 90° east longitude. Half the nearside is visible to the left, and half the farside to the right. Credit: NASA/GSFC/Arizona State University To read more go to: <a href="http://www.nasa.gov/mission_pages/LRO/multimedia/lroimages/lroc-20100909_mooneast.html" rel="nofollow">www.nasa.gov/mission_pages/LRO/multimedia/lroimages/lroc-...</a> <b><a href="http://www.nasa.gov/centers/goddard/home/index.html" rel="nofollow">NASA Goddard Space Flight Center</a></b> contributes to NASA’s mission through four scientific endeavors: Earth Science, Heliophysics, Solar System Exploration, and Astrophysics. Goddard plays a leading role in NASA’s endeavors by providing compelling scientific knowledge to advance the Agency’s mission. <b>Follow us on <a href="http://twitter.com/NASA_GoddardPix" rel="nofollow">Twitter</a></b> <b>Join us on <a href="http://www.facebook.com/pages/Greenbelt-MD/NASA-Goddard/395013845897?ref=tsd" rel="nofollow">Facebook</a></b>
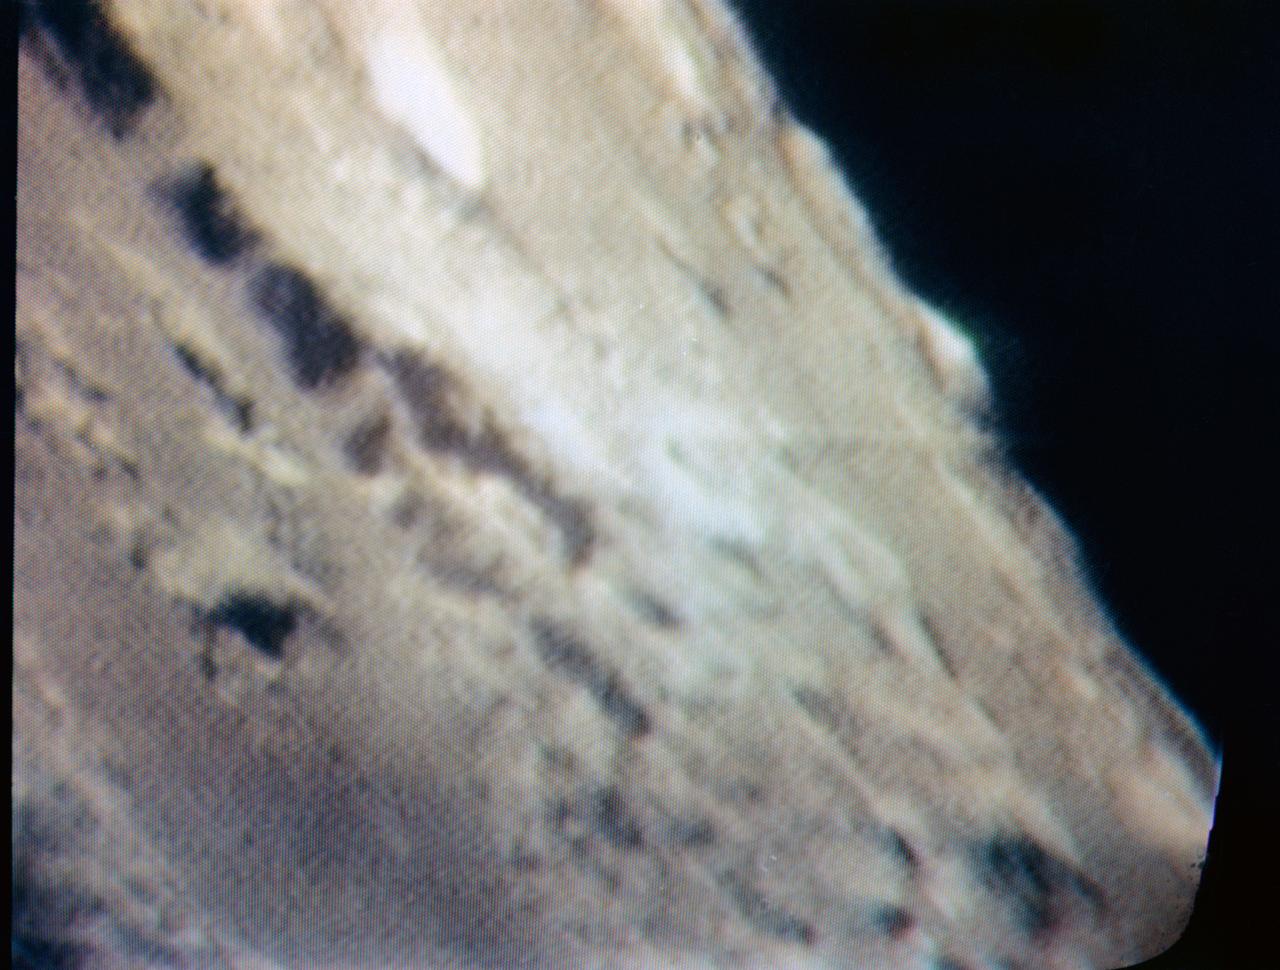
S69-34478 (21 May 1969) --- An oblique view of Barbara Mesa on the lunar nearside is seen in this color reproduction taken from a telecast made by the color television camera aboard the Apollo 10 spacecraft as it orbited the moon. This area is located generally east of Maskelyne crater on the southern edge of the Sea of Tranquility (Mare Tranquillitatis). Barbara Mesa is located at about 32 degrees 45 minutes east longitude and 1 degree 45 minutes north latitude.
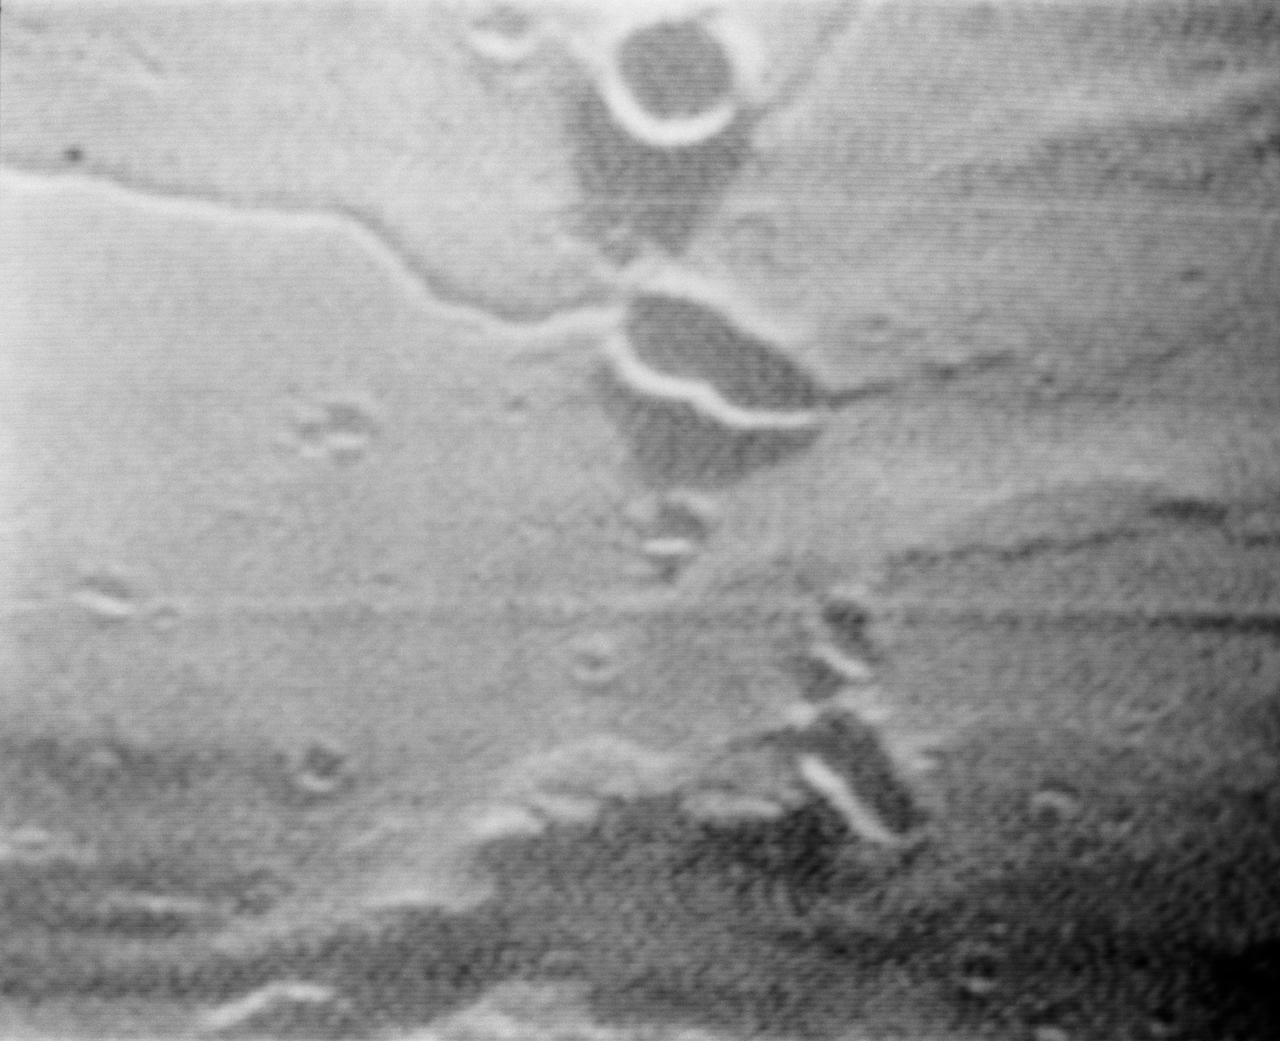
S69-39541 (19 July 1969) --- A near vertical view of Diamondback Rille is seen in this color reproduction taken from the fourth color television transmission from the Apollo 11 spacecraft, during its second revolution of the moon. The center of the picture is located at about 26.9 degrees east longitude and 1.2 degrees north latitude. This area is just east of the Apollo Landing Site 2. The crew of the Apollo 11 lunar landing mission is astronauts Neil A. Armstrong, commander; Michael Collins, command module pilot; and Edwin E. Aldrin Jr., lunar module pilot.
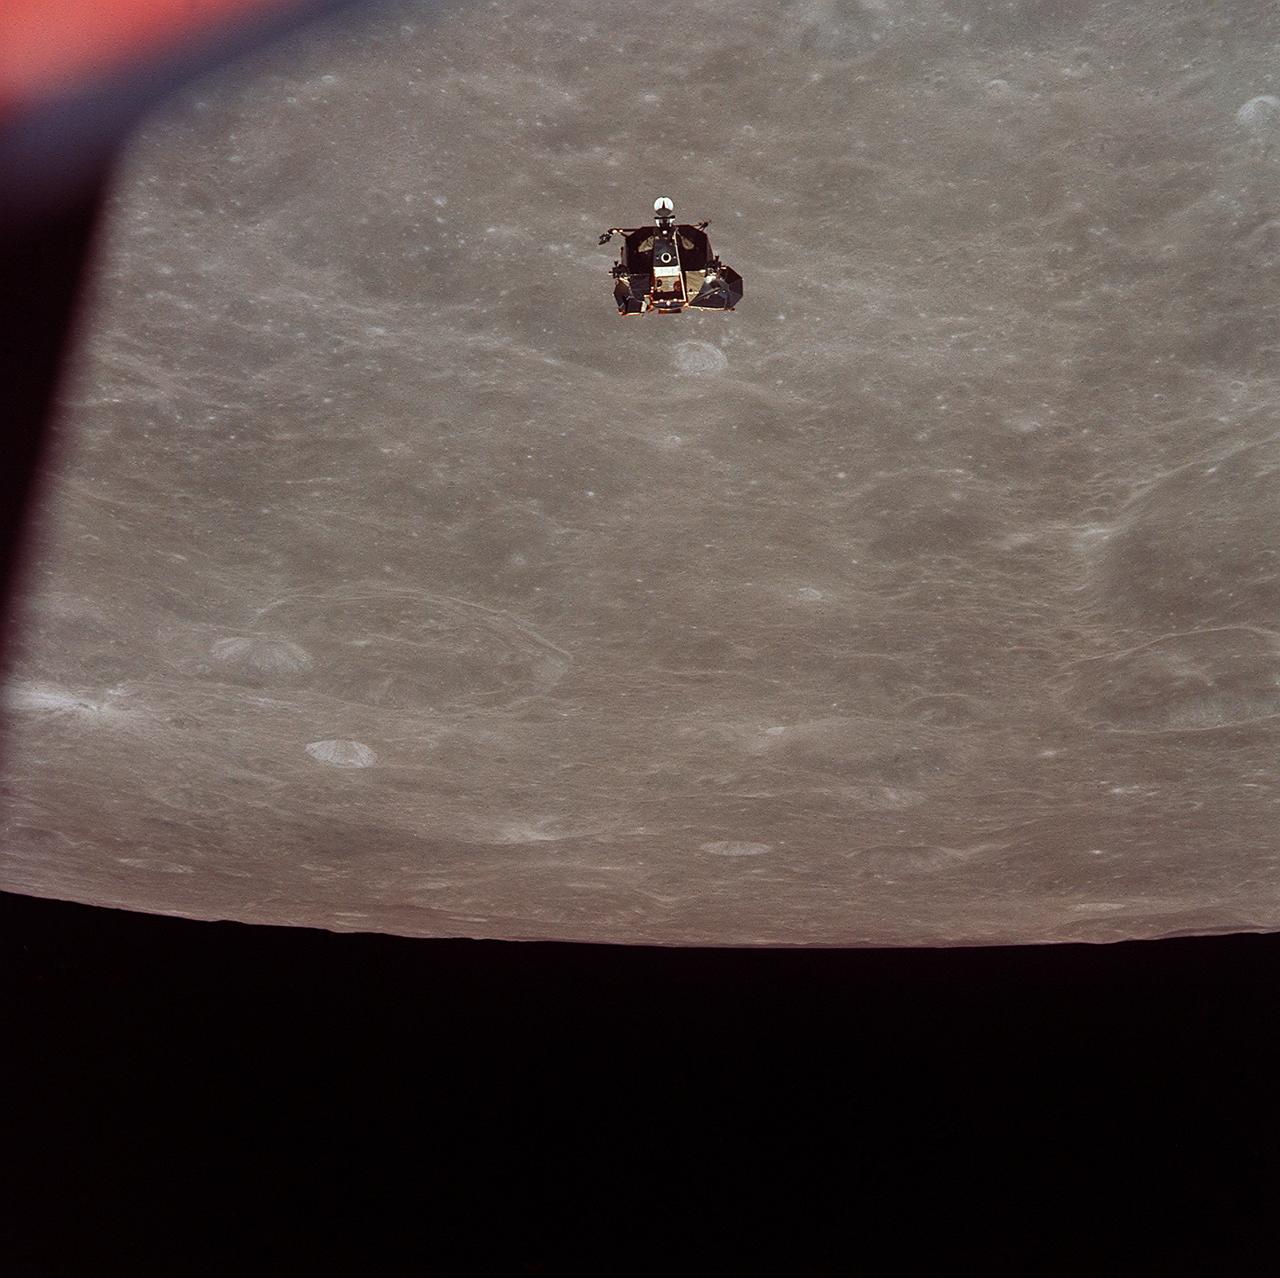
AS11-44-6626 (21 July 1969) --- The Apollo 11 Lunar Module (LM) ascent stage, with astronauts Neil A. Armstrong and Edwin E. Aldrin Jr. aboard, is photographed from the Command and Service Modules (CSM) in lunar orbit. Astronaut Michael Collins, command module pilot, remained with the CSM in lunar orbit while Armstrong and Aldrin explored the moon. The LM is approaching from below. The coordinates of the center of the lunar terrain seen below is located at 102 degrees east longitude and 1 degree north latitude.
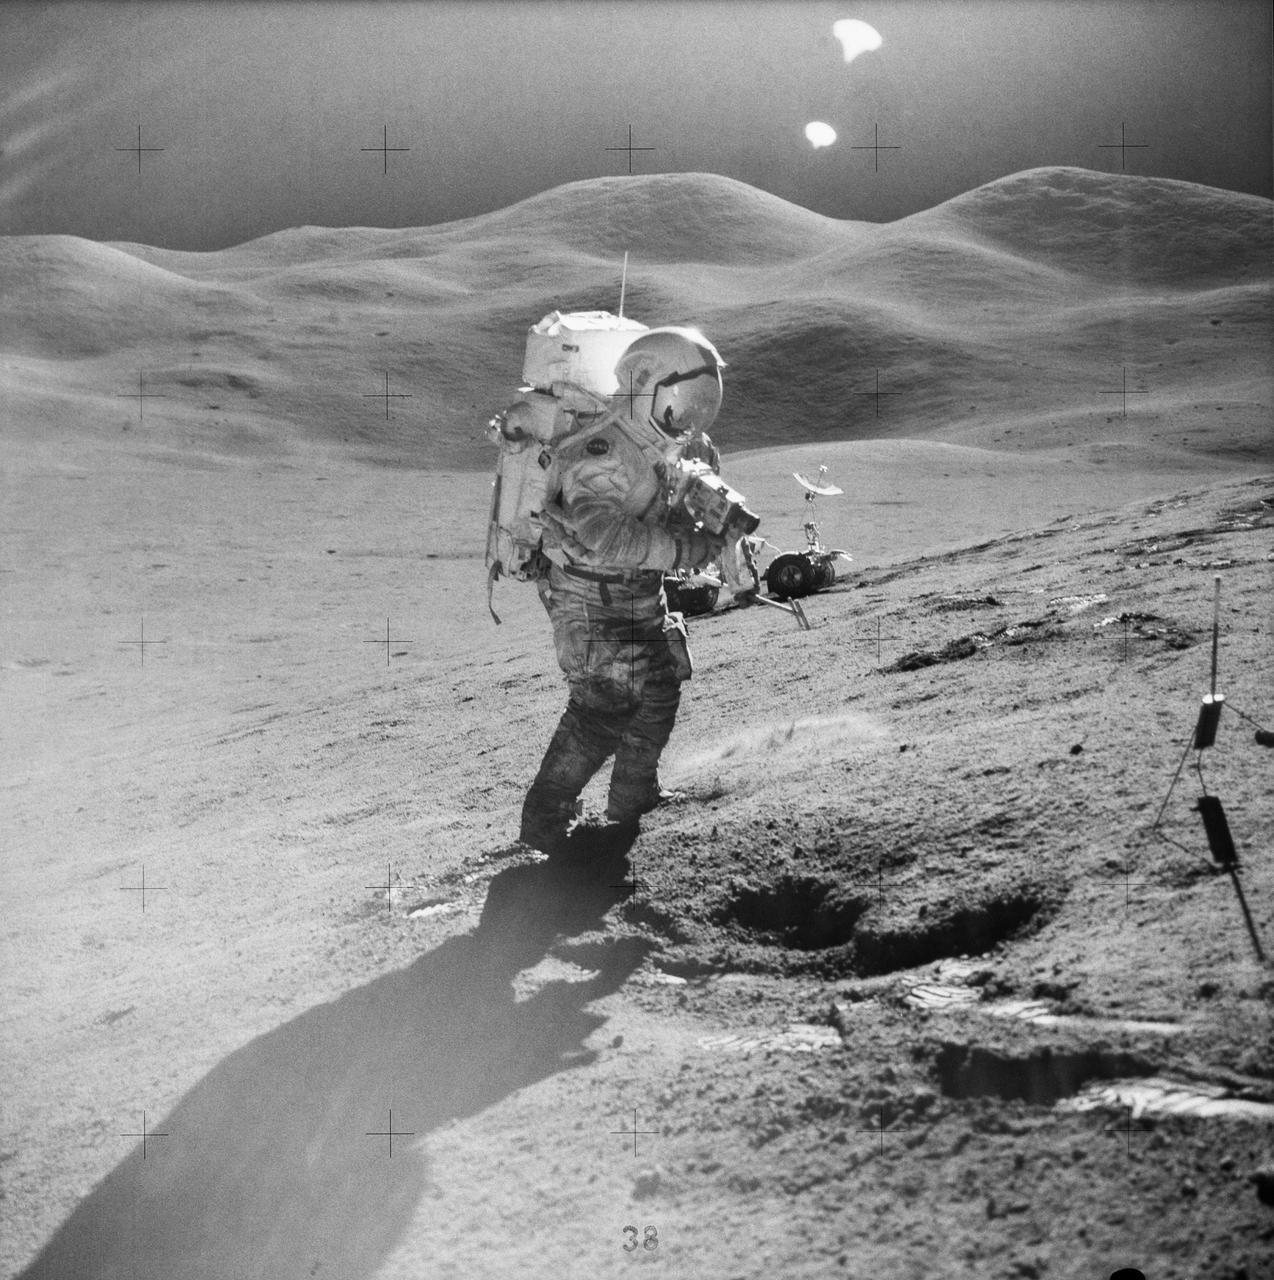
AS15-85-11514 (31 July-2 Aug. 1971) --- Astronaut David R. Scott, commander, standing on the slope of Hadley Delta, uses a 70mm camera during Apollo 15 extravehicular activity (EVA) on the lunar surface. He is 10.5 miles (or 17.5 kilometers) from the base of the Apennine Mountains seen in the background. Scott carries tongs in his left hand. The Lunar Roving Vehicle (LRV) is in the background. This view is looking east. While astronauts Scott and James B. Irwin, lunar module pilot, descended in the Lunar Module (LM) "Falcon" to explore the moon, astronaut Alfred M. Worden, command module pilot, remained with the Command and Service Modules (CSM) in lunar orbit.
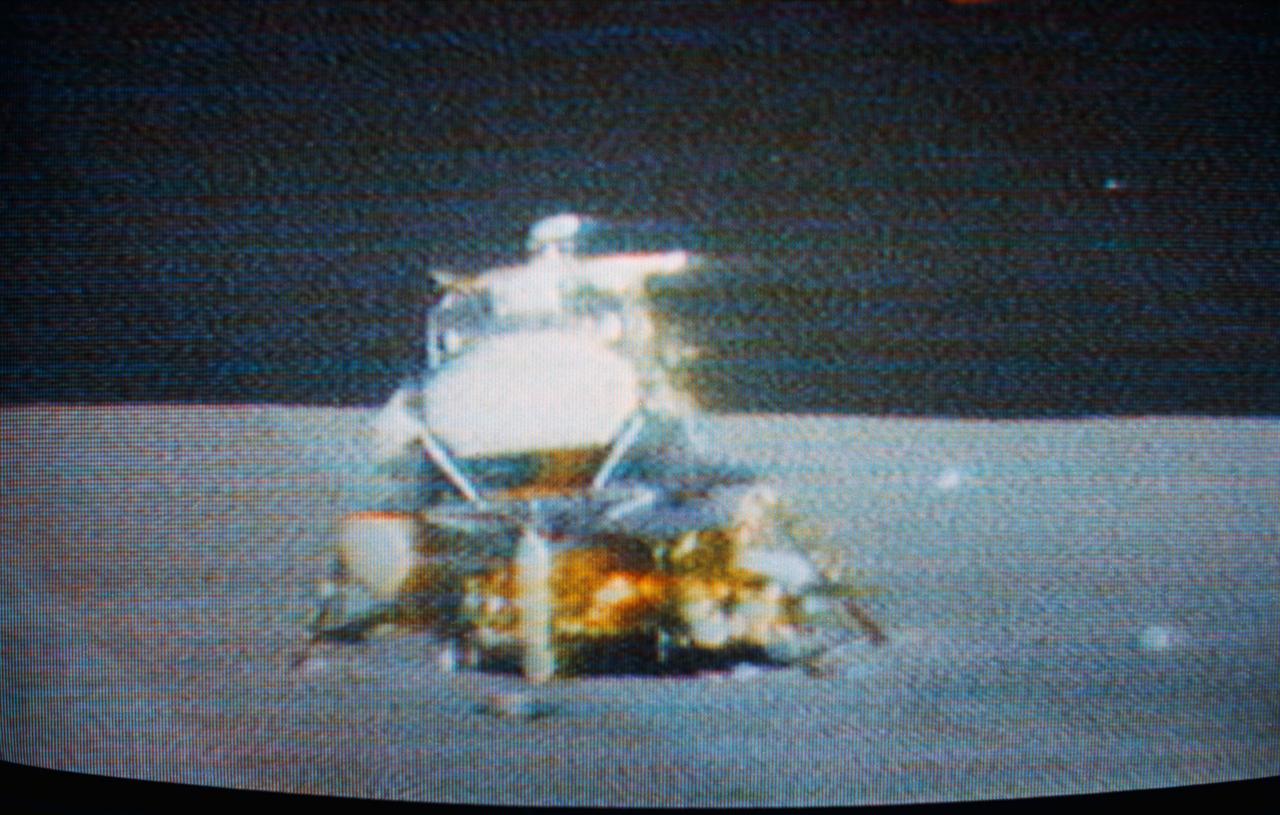
S71-41511 (2 Aug. 1971) --- The Apollo 15 Lunar Module (LM) "Falcon" is seen only seconds before ascent stage liftoff in this color reproduction taken from a transmission made by the RCA color television camera mounted on the Lunar Roving Vehicle (LRV). The LRV was parked about 300 feet east of the LM. The LRV-mounted TV camera, remotely controlled from the Mission Control Center (MCC), made it possible for people on Earth to watch the LM's launch from the moon. The LM liftoff was at 171:37 ground elapsed time. The "Falcon" ascent stage, with astronauts David R. Scott, commander; and James B. Irwin, lunar module pilot, aboard, returned from the lunar surface to rejoin the Command and Service Modules (CSM) orbiting the moon. Astronaut Alfred M. Worden, command module pilot, remained with the CSM in lunar orbit while Scott and Irwin explored the moon. The LM descent stage is used as a launching platform and remains behind on the moon. This is part one of a four-part sequence.
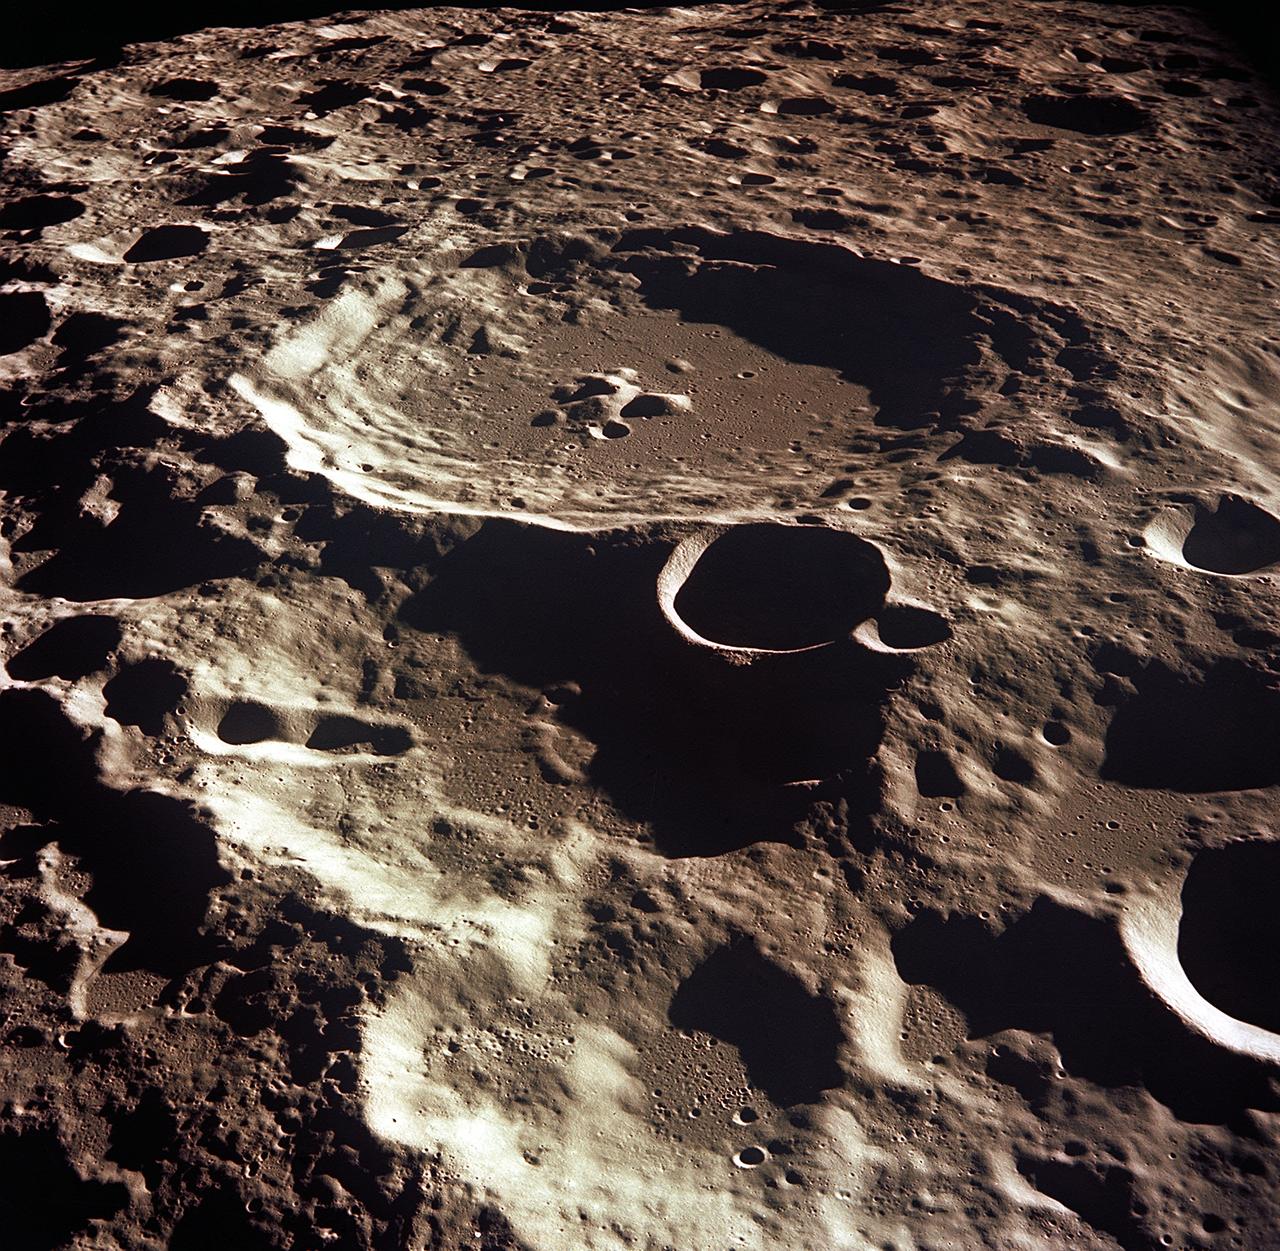
AS11-44-6609 (16-24 July 1969) --- An oblique of the Crater Daedalus on the lunar farside as seen from the Apollo 11 spacecraft in lunar orbit. The view looks southwest. Daedalus (formerly referred to as I.A.U. Crater No. 308) is located at 179 degrees east longitude and 5.5 degrees south latitude. Daedalus has a diameter of about 50 statute miles. This is a typical scene showing the rugged terrain on the farside of the moon. While astronauts Neil A. Armstrong, commander, and Edwin E. Aldrin Jr., lunar module pilot, descended in the Lunar Module (LM) "Eagle" to explore the Sea of Tranquility region of the moon, astronaut Michael Collins, command module pilot, remained with the Command and Service Modules (CSM) "Columbia" in lunar orbit.
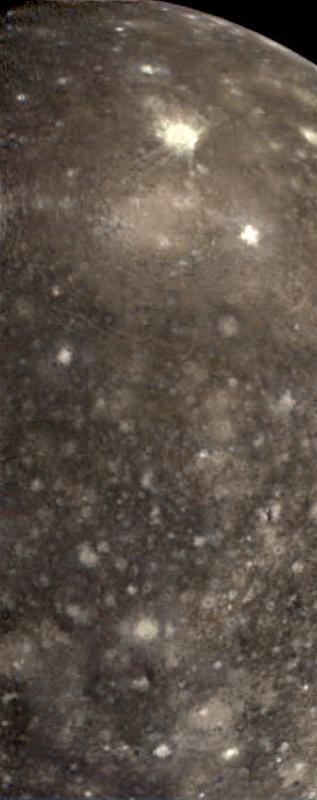
False color view of a portion of the leading hemisphere of Jupiter's moon Callisto as seen through the infrared filters of the Solid State Imaging (CCD) system aboard NASA's Galileo spacecraft. North is to the top of the picture and the sun illuminates the surface from the east. More recent impacts have excavated bright, relatively clean ice from beneath Callisto's battered surface. Callisto's dark mottled appearance may be due to contamination by non-ice components contributed by impactors or concentrated in a residue as ice is removed. This color composite image is centered on longitude 139 West and encompasses an area about 1000 miles (1600 kilometers) by 2470 miles (4000 kilometers). The images were obtained on November 3rd, 1996. http://photojournal.jpl.nasa.gov/catalog/PIA01100
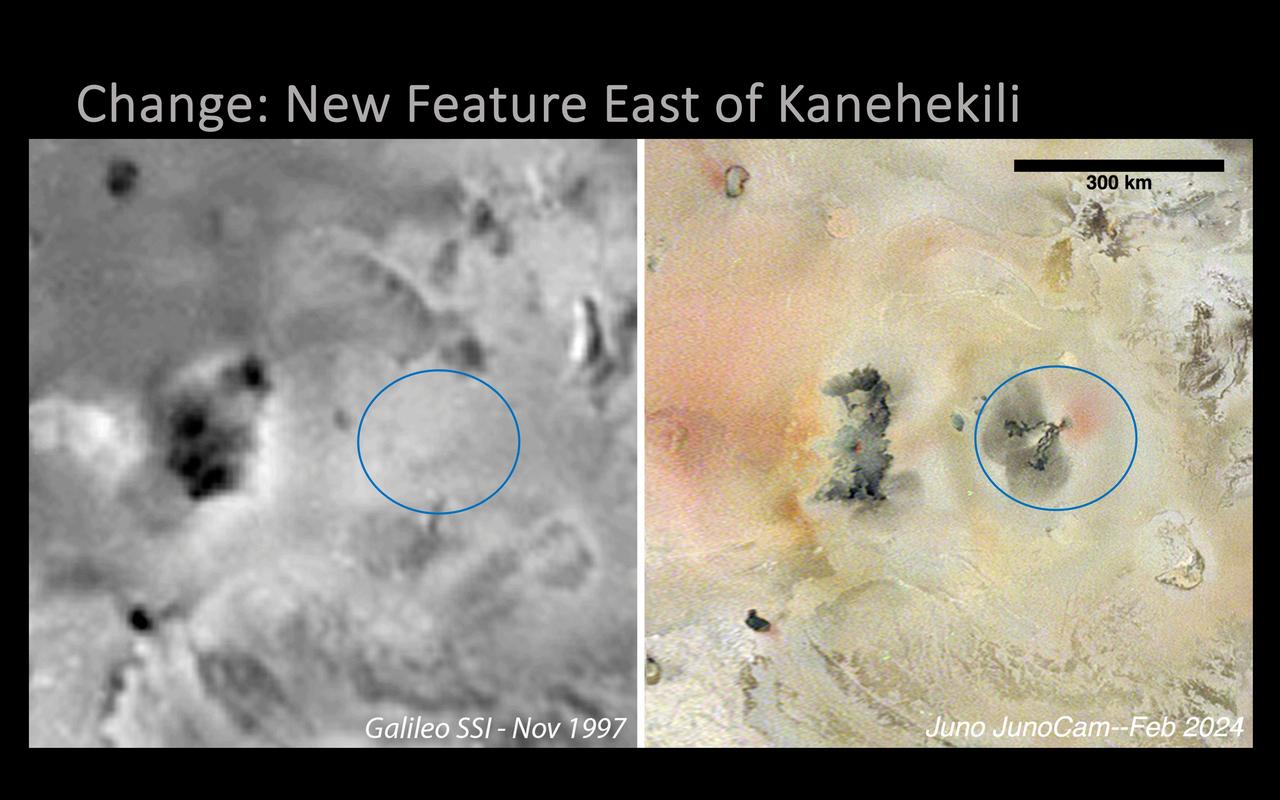
A new volcanic feature east of Kanehekili on Jupiter's moon Io was imaged by NASA's Juno mission during its 58th close flyby of the gas giant on Feb. 3, 2024. The image was captured in Jupiter-shine at 1.1 miles (1.8 kilometers) per pixel by the mission's JunoCam instrument. The feature is new since NASA's Galileo captured the area in 1997 (image at left), and consists of two thin, digitate flows, running roughly to the west and southwest from a common point at 17 degrees 2 minutes south latitude and 21 degrees 9 minutes west longitude. Dark gray diffuse deposits surround the ends of each flow, extending 25 to 34 miles (40 to 55 kilometers) out from the flow termini, perhaps from lava fragmentation during interaction with volatile frosts. A diffuse red deposit is seen wrapping from the eastern to the southern side of the flow field's source in the northeast, similar in appearance to features attributed to elemental sulfur deposits being actively ejected from a vent. https://photojournal.jpl.nasa.gov/catalog/PIA26487

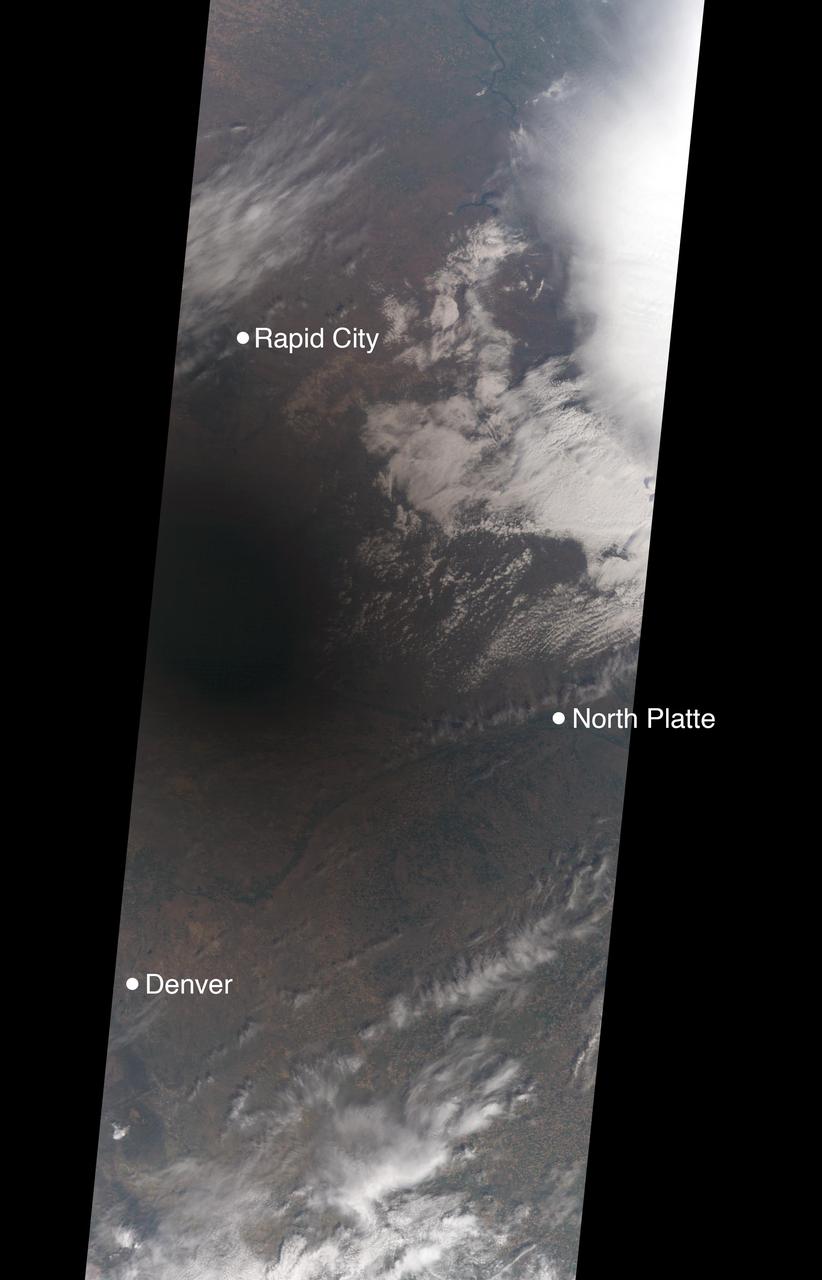
NASA's Wallops Flight Facility is located on Wallops Island, Va. and is the site of tonight's moon mission launch. Satellite imagery from NOAA's GOES-East satellite shows that high pressure remains in control over the Mid-Atlantic region, providing an almost cloud-free sky. This visible image of the Mid-Atlantic was captured by NOAA's GOES-East satellite at 17:31 UTC/1:31 p.m. EDT and shows some fair weather clouds over the Delmarva Peninsula (which consists of the state of Delaware and parts of Maryland and Virginia - which together is "Delmarva") and eastern Virginia and North Carolina. Most of the region is cloud-free, making for a perfect viewing night to see a launch. NOAA operates GOES-East and NASA's GOES Project at the NASA Goddard Space Flight Center in Greenbelt, Md. creates images and animations from the data. NOAA's National Weather Service forecast for tonight, Sept. 6 calls for winds blowing from the east to 11 mph, with clear skies and overnight temperatures dropping to the mid-fifties. The Lunar Atmosphere and Dust Environment Explorer, known as LADEE (pronounced like "laddie"), launches tonight at 11:27 p.m. EDT from Pad 0B at the Mid-Atlantic Regional Spaceport, at NASA Wallops and will be visible along the Mid-Atlantic with tonight's perfect weather conditions. LADEE is managed by NASA's Ames Research Center in Moffett Field, Calif. This will be the first launch to lunar orbit from NASA Wallops and the first launch of a Minotaur V rocket – the biggest ever launched from Wallops. NASA's LADEE is a robotic mission that will orbit the moon to gather detailed information about the lunar atmosphere, conditions near the surface and environmental influences on lunar dust. A thorough understanding of these characteristics will address long-standing unknowns, and help scientists understand other planetary bodies as well. LADEE also carries an important secondary payload, the Lunar Laser Communication Demonstration, or LLCD, which will help us open a new era of space communications by becoming NASA's first high rate, two-way, space laser system. Live coverage of the launch can be seen beginning at 9:30 p.m. EDT on NASA-TV at: <a href="http://www.nasa.gov/ntv" rel="nofollow">www.nasa.gov/ntv</a> For more information about LADEE, visit: <a href="http://www.nasa.gov/ladee" rel="nofollow">www.nasa.gov/ladee</a> <b><a href="http://www.nasa.gov/audience/formedia/features/MP_Photo_Guidelines.html" rel="nofollow">NASA image use policy.</a></b> <b><a href="http://www.nasa.gov/centers/goddard/home/index.html" rel="nofollow">NASA Goddard Space Flight Center</a></b> enables NASA’s mission through four scientific endeavors: Earth Science, Heliophysics, Solar System Exploration, and Astrophysics. Goddard plays a leading role in NASA’s accomplishments by contributing compelling scientific knowledge to advance the Agency’s mission. <b>Follow us on <a href="http://twitter.com/NASA_GoddardPix" rel="nofollow">Twitter</a></b> <b>Like us on <a href="http://www.facebook.com/pages/Greenbelt-MD/NASA-Goddard/395013845897?ref=tsd" rel="nofollow">Facebook</a></b> <b>Find us on <a href="http://instagram.com/nasagoddard?vm=grid" rel="nofollow">Instagram</a></b>
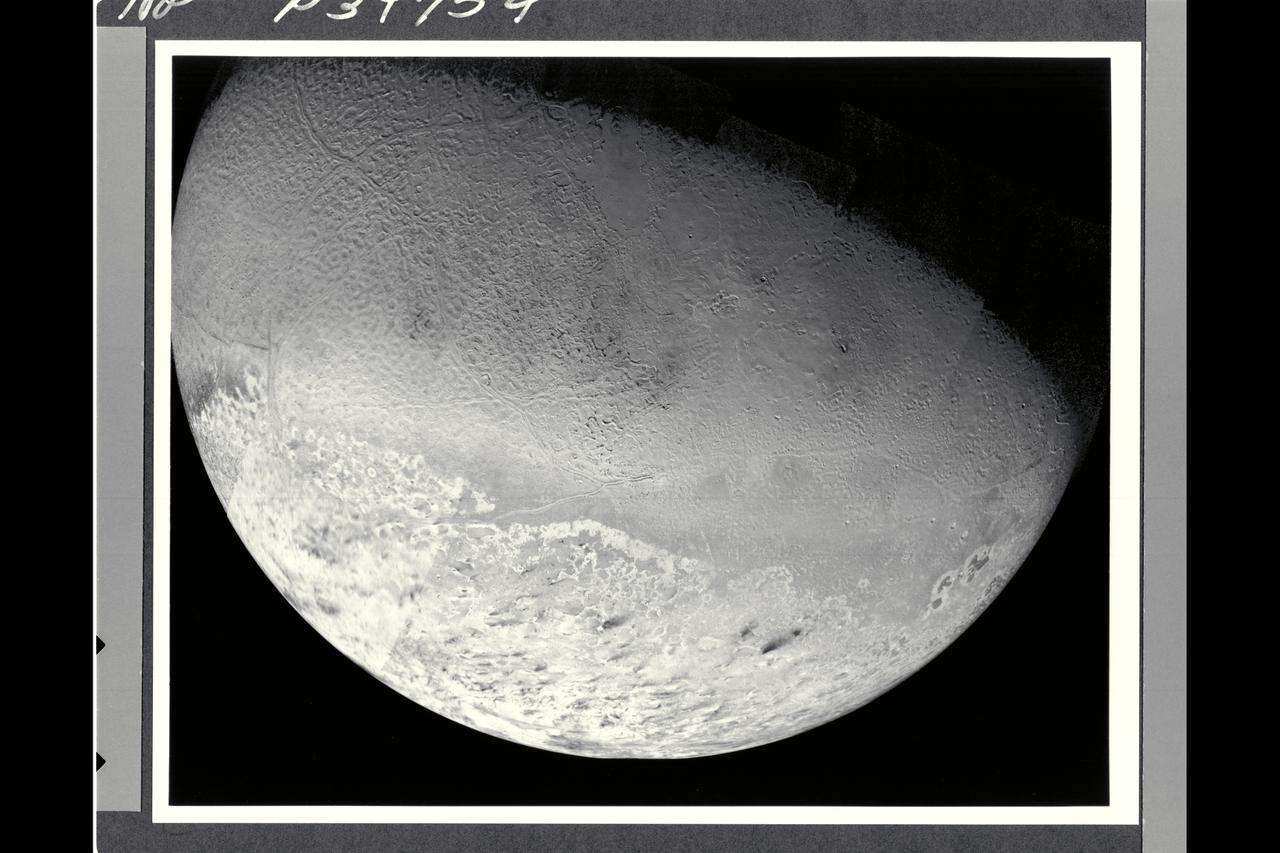
This photomosaic of Triton, assembled from 14 individual frames, shows the great variety of its surface features. At the bottom of the image are remnants of the south polar cap, containing 'dark' streaks generally aligned towards the northeast (upper right in the image). Even though these are darker than other features on Triton, they reflect nearly ten times as much light as the surface of the Earth's moon. North of the cap, in the western (left) half of the disk is the region which has been informally dubbed the 'cantaloupe' terrain. Small dimples with upraised rims and shallow central depressions dot the area. Long fractures have opened allowing some icy material to ooze up and form a central ridge. These criss-cross the region and extend into parts of the polar cap region. Towards the south this terrain has a light covering of frost. Running east to the limb of Triton, just north of the polar cap, is an area of smooth plains and low hills which is the most densely cratered region seen. In the northeast (upper right) of this image are plains which show evidence for extensive resurfacing, including possible extrusions of flowing material onto the surface. This region also contains two large smooth areas reminiscent of the maria of the Earth's moon which were formed by large-scale volcanic flooding. Near the eastern (right) limb of Triton are three darker gray markings with sharply defined brighter borders. These are unlike anything else seen in the solar system, and their origin is not yet understood.
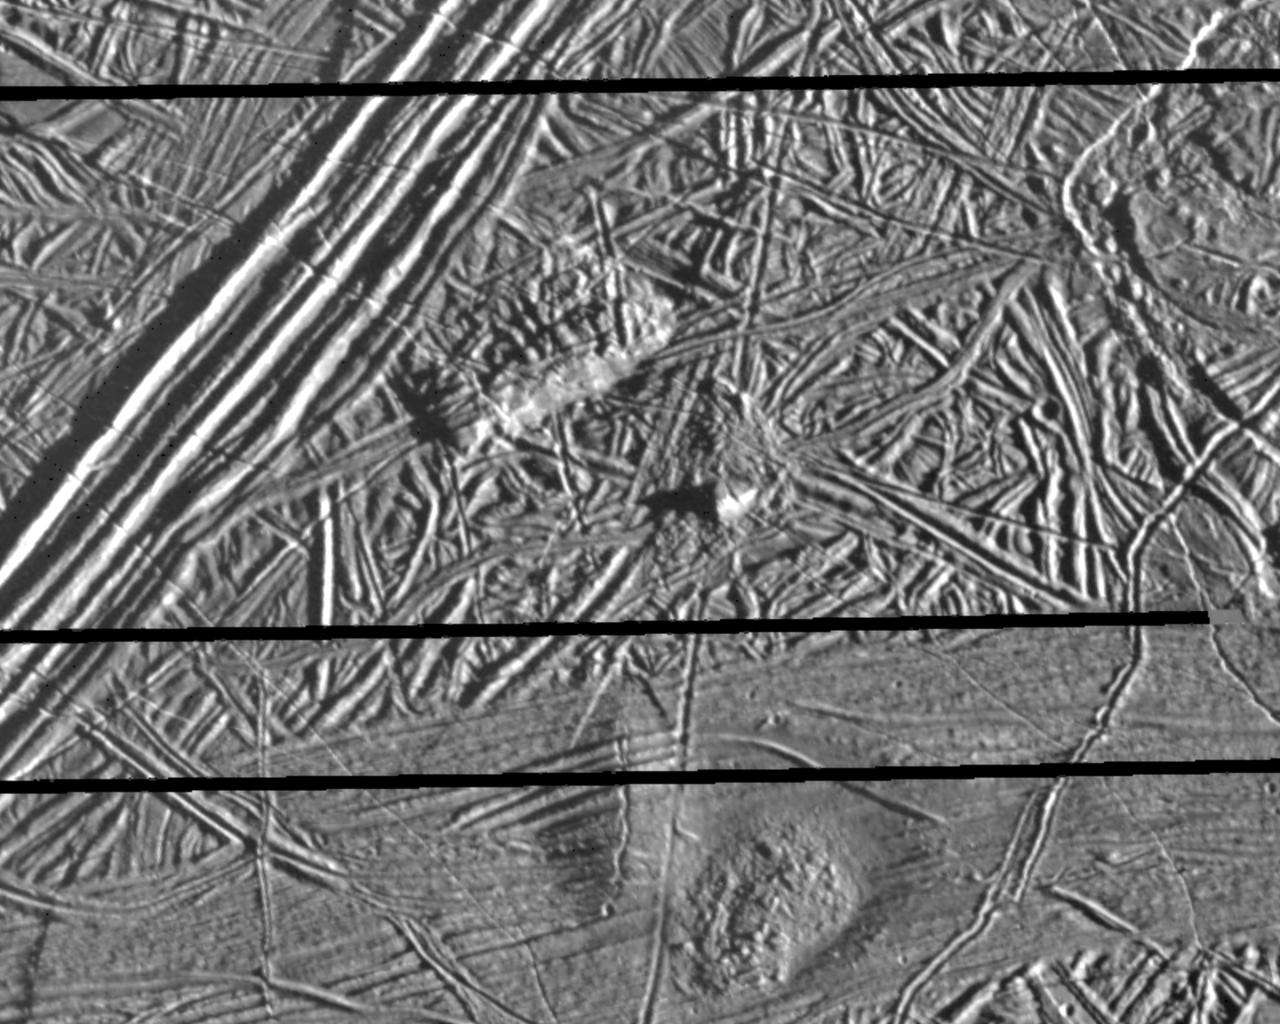
his picture of Europa, a moon of Jupiter, was obtained on February 20, 1997, by the Solid State Imaging system onboard the Galileo spacecraft during its sixth orbit around Jupiter. The area is centered at 9.3 degrees north latitude, 275.7 degrees west longitude, on the trailing hemisphere of Europa. As Europa moves in its orbit around Jupiter, the trailing hemisphere is the portion which is always on the moon's backside opposite to its direction of motion. The area depicted is about 32 kilometers by 40 kilometers (20 miles by 25 miles). Resolution is 54 meters (59 yards). The Sun illuminates the scene from the right (east). A section of a triple band crosses the upper left of the picture and extends for hundreds of miles across the surface. Triple bands derive their name from their appearance at lower resolution as a narrow bright band flanked by a pair of darker bands. At the high resolution of this picture, however, the triple band is much more complex and is composed of a system of ridges 6 kilometers (4 miles) across. Some ridges reach heights of about 180 meters (200 yards). Other features include a hill in the center of the picture about 480 meters (500 yards) high. Two mounds about 6 kilometers across (4 miles) are seen in the bottom of the picture. The ridges, hills and mounds probably all represent uplifts of the icy crust of Europa by processes originating from the interior. http://photojournal.jpl.nasa.gov/catalog/PIA00590
As NASA's Cassini soared above high northern latitudes on Saturn's moon Dione, the spacecraft looked down at a region near the day-night boundary. This view shows the region as a contrast-enhanced image in which features in shadow are illuminated by reflected light from Saturn. Inset just above center is a higher resolution view -- one of the mission's highest-resolution views of the Saturnian moon's icy surface. Territory seen here is just east of a crater named Butes, near an unnamed tectonic structure around 65 degrees north latitude, 25 degrees west longitude. The broader view is from the spacecraft's wide-angle camera (WAC) and includes an inset view from Cassini's narrow-angle camera (NAC). The NAC view (also available here at its full resolution) shows features about 10 times smaller than the WAC view. The unenhanced WAC view is also provided here. The views were obtained near the time of Cassini's closest approach to Dione during the encounter, like PIA19653. The NAC images in these two image releases are the highest resolution views of Dione's surface acquired by Cassini. The views were acquired in visible light at an altitude of 365 miles (588 kilometers) above Dione. The wide-angle camera image has an image scale of about 115 feet (35 meters) per pixel; the narrow-angle camera image has an image scale of about 12 feet (3.5 meters) per pixel. http://photojournal.jpl.nasa.gov/catalog/PIA19654
On Aug. 21, 2017, a total solar eclipse swept across the United States -- the first such eclipse in the contiguous 48 states since 1979, and the first cross-country eclipse since 1918. A partial eclipse was visible in all 50 states, and initial estimates suggest that upwards of 20 million people observed the Moon completely obscuring the Sun in the 70-mile-wide (113-kilometer-wide) path of totality. While viewing a total solar eclipse from the ground is an amazing experience, satellites orbiting Earth see the eclipse from a unique perspective. As the Moon's shadow passed through the United States, the Multi-angle Imaging SpectroRadiometer (MISR) instrument aboard NASA's Terra satellite was capturing images of eastern Wyoming and western Nebraska from its altitude of 438 miles (705 kilometers) above the surface. MISR gathers images on a strip about 249 miles (400 kilometers) wide directly below the path of the satellite. Incredibly, given that the shadow of the Moon took only 90 minutes to cross the entire United States, and Terra itself moves at a brisk 16,700 miles per hour from north to south, MISR happened to be in exactly the right place at the right time to capture totality. From the ground, the moment of totality appears suddenly, sweeping over the sky in just a few seconds. "I was unprepared for just how dark it actually was," says Mika Tosca, a researcher who works with MISR data and who observed the eclipse in Nebraska. "The streetlights even turned on. Everything fell silent, and I swear the temperature dropped." From the vantage point of space, however, it’s possible to see the entire shadow of the Moon, with the completely dark, circular umbra and the more diffuse penumbra. MISR contains nine cameras oriented at different angles, viewing forward, downward, and backward along the flight path, resulting in an approximate seven-minute interval for all nine cameras to image a single location on Earth's surface. This animation combines these nine images into a movie showing the motion of the Moon's shadow during this seven-minute period. In the first image, captured by the camera pointing farthest ahead of the satellite, totality has not quite begun in the area seen by MISR. From the second camera onward, totality sweeps across the image area from west to east, beginning just west of the town of Jay Em, Wyoming, and proceeding about halfway across the MISR swath to the town of Alliance, Nebraska. The motion of the lunar shadow in different pairs of images leads to estimates of the local ground speed ranging between 1,480 and 1,820 miles per hour (2,382 and 2,929 kilometers per hour). The spread in values is a measure of the uncertainty of the estimate. At this location, the predicted speed of the eclipse calculated from lunar orbital motion is about 1,658 miles per hour (2,668 kilometers per hour), which falls in the middle of the range estimated from the MISR images. Tosca's observation that the temperature dropped during the eclipse is a well-known phenomenon. The GLOBE Observer, a phone application dedicated to citizen science and sponsored by NASA, encouraged eclipse-goers to record the local air temperature at regular intervals. Data collected by nearby observers in the path of totality show that, on average, temperatures dropped by 9.3 degrees Fahrenheit (5.2 degrees Celsius) during the eclipse. This compares to an average of 5.4 degrees Fahrenheit drop measured at several Nebraska Mesonet weather stations within the path of totality. The decrease in the amount of sunlight reaching Earth affected more than temperatures. Areas that get a large portion of their power from solar energy were naturally concerned about shortages during the eclipse -- the state of California, though not in the path of totality, estimated that 6,000 megawatts of solar power would be lost during the eclipse. An animation is available at https://photojournal.jpl.nasa.gov/catalog/PIA21957

This composite image shows an infrared view of Saturn's moon Titan from NASA's Cassini spacecraft, acquired during the mission's "T-114" flyby on Nov. 13, 2015. The spacecraft's visual and infrared mapping spectrometer (VIMS) instrument made these observations, in which blue represents wavelengths centered at 1.3 microns, green represents 2.0 microns, and red represents 5.0 microns. A view at visible wavelengths (centered around 0.5 microns) would show only Titan's hazy atmosphere (as in PIA14909). The near-infrared wavelengths in this image allow Cassini's vision to penetrate the haze and reveal the moon's surface. During this Titan flyby, the spacecraft's closest-approach altitude was 6,200 miles (10,000 kilometers), which is considerably higher than those of typical flybys, which are around 750 miles (1,200 kilometers). The high flyby allowed VIMS to gather moderate-resolution views over wide areas (typically at a few kilometers per pixel). The view looks toward terrain that is mostly on the Saturn-facing hemisphere of Titan. The scene features the parallel, dark, dune-filled regions named Fensal (to the north) and Aztlan (to the south), which form the shape of a sideways letter "H." Several places on the image show the surface at higher resolution than elsewhere. These areas, called subframes, show more detail because they were acquired near closest approach. They have finer resolution, but cover smaller areas than data obtained when Cassini was farther away from Titan. Near the limb at left, above center, is the best VIMS view so far of Titan's largest confirmed impact crater, Menrva (first seen by the RADAR instrument in PIA07365). Similarly detailed subframes show eastern Xanadu, the basin Hotei Regio, and channels within bright terrains east of Xanadu. (For Titan maps with named features see http://planetarynames.wr.usgs.gov/Page/TITAN/target.) Due to the changing Saturnian seasons, in this late northern spring view, the illumination is significantly changed from that seen by VIMS during the "T-9" flyby on December 26, 2005 (PIA02145). The sun has moved higher in the sky in Titan's northern hemisphere, and lower in the sky in the south, as northern summer approaches. This change in the sun's angle with respect to Titan's surface has made high southern latitudes appear darker, while northern latitudes appear brighter. http://photojournal.jpl.nasa.gov/catalog/PIA20016
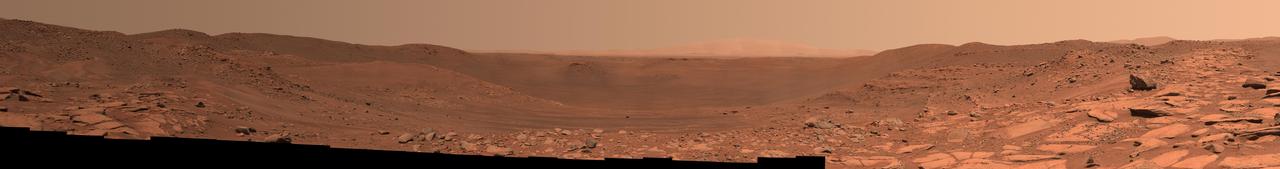
This view of the interior of Belva Crater was generated using data collected by the Mastcam-Z instrument aboard NASA's Perseverance Mars rover on April 22, 2023, the 772nd Martian day, or sol, of the mission. When the 152 individual images that make up this mosaic were taken, the rover was parked at the west side of the crater's rim, on a light-toned rocky outcrop the science team is calling "Echo Creek." Belva Crater is about 0.6 miles (0.9 kilometers) in diameter. The view here is looking across the crater towards the distant east-northeast wall of the much-larger Jezero Crater (center of the image), some 25 miles (40 kilometers) away. Impact craters like Belva can offer grand views and contain vertical cuts that provide important clues to the geologic history of the area. The mosaic shows multiple locations of bedrock exposed in vertical cross-section. One of these exposed sections of bedrock (located on the hill seen between the 60 and 75 hashmarks) is angled steeply downward and is nearly 65 feet (20 meters) tall. Called "dipping beds," such a steeply angled bedrock section could indicate the presence of a large Martian sandbar made of sediment that billions of years ago was deposited by a river flowing into the lake that Jezero Crater once held. The most distant point on Belva Crater's rim (just to the left of center in the mosaic) is about 3,500 feet (1,060 meters) away from the rover. The large boulder seen in the far right of the mosaic is about 65 feet (20 meters) away and is about 5 feet (1.5 meters) in diameter. Arizona State University leads the operations of the Mastcam-Z instrument, working in collaboration with Malin Space Science Systems in San Diego, on the design, fabrication, testing, and operation of the cameras, and in collaboration with the Niels Bohr Institute of the University of Copenhagen on the design, fabrication, and testing of the calibration targets. A key objective for Perseverance's mission on Mars is astrobiology, including the search for signs of ancient microbial life. The rover will characterize the planet's geology and past climate, pave the way for human exploration of the Red Planet, and be the first mission to collect and cache Martian rock and regolith (broken rock and dust). Subsequent NASA missions, in cooperation with ESA (European Space Agency), would send spacecraft to Mars to collect these sealed samples from the surface and return them to Earth for in-depth analysis. The Mars 2020 Perseverance mission is part of NASA's Moon to Mars exploration approach, which includes Artemis missions to the Moon that will help prepare for human exploration of the Red Planet. https://photojournal.jpl.nasa.gov/catalog/PIA25889
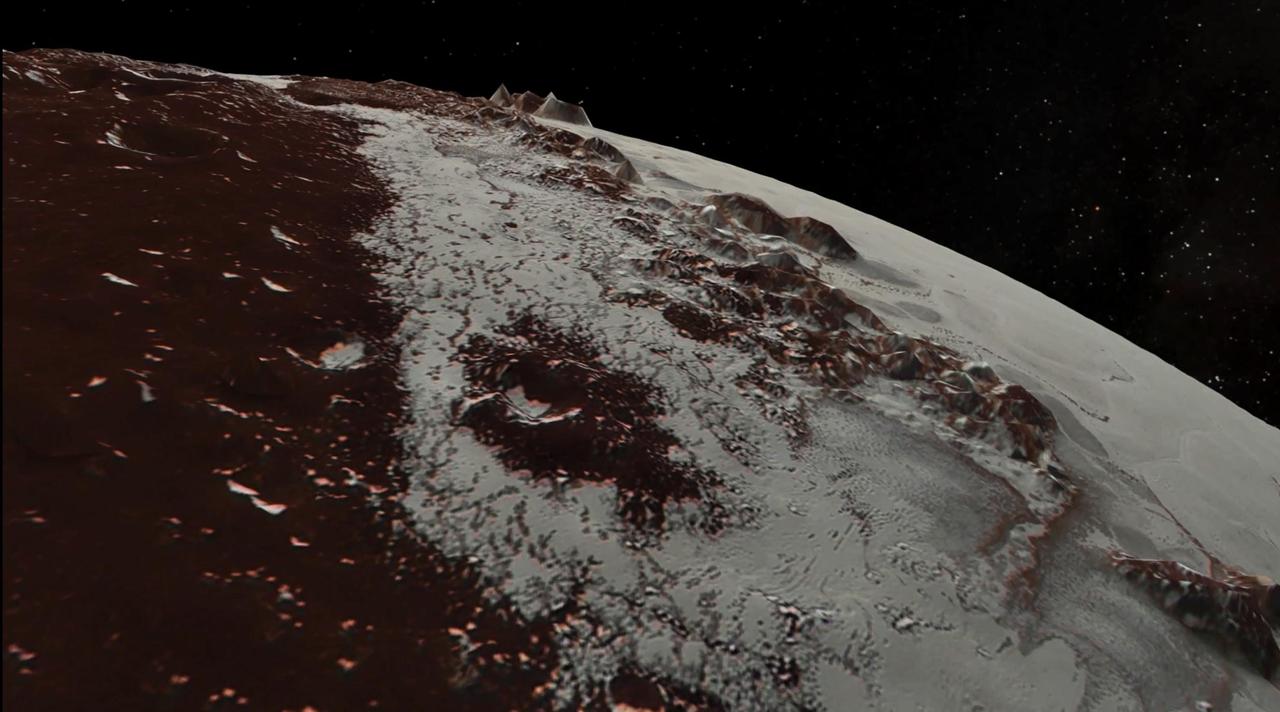
In July 2015, NASA's New Horizons spacecraft sent home the first close-up pictures of Pluto and its moons. Using actual New Horizons data and digital elevation models of Pluto and its largest moon, Charon, mission scientists created flyover movies that offer spectacular new perspectives of the many unusual features that were discovered and which have reshaped our views of the Pluto system -- from a vantage point even closer than a ride on New Horizons itself. The dramatic Pluto flyover begins over the highlands to the southwest of the great expanse of nitrogen ice plain informally named Sputnik Planitia. (Note that all feature names in the Pluto system are informal.) The viewer first passes over the western margin of Sputnik, where it borders the dark, cratered terrain of Cthulhu Macula, with the blocky mountain ranges located within the planitia seen on the right. The tour moves north past the rugged and fractured highlands of Voyager Terra and then turns southward over Pioneer Terra, which exhibits deep and wide pits, before concluding over the bladed terrain of Tartarus Dorsa in the far east of the encounter hemisphere. The topographic relief is exaggerated by a factor of 2 to 3 in these movies to emphasize topography; the surface colors have also been enhanced to bring out detail. Digital mapping and rendering were performed by Paul Schenk and John Blackwell of the Lunar and Planetary Institute in Houston. A video can be viewed at https://photojournal.jpl.nasa.gov/catalog/PIA21863
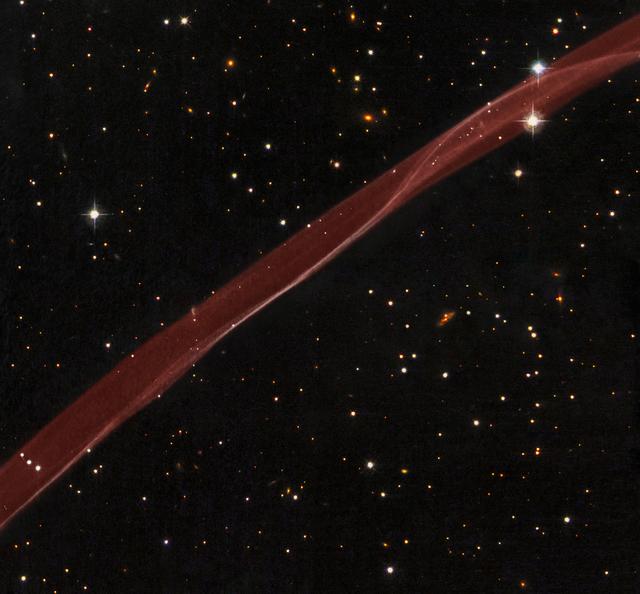
Release date: July 1, 2008 SN 1006 Supernova Remnant (Hubble) A delicate ribbon of gas floats eerily in our galaxy. A contrail from an alien spaceship? A jet from a black-hole? Actually this image, taken by NASA's Hubble Space Telescope, is a very thin section of a supernova remnant caused by a stellar explosion that occurred more than 1,000 years ago. On or around May 1, 1006 A.D., observers from Africa to Europe to the Far East witnessed and recorded the arrival of light from what is now called SN 1006, a tremendous supernova explosion caused by the final death throes of a white dwarf star nearly 7,000 light-years away. The supernova was probably the brightest star ever seen by humans, and surpassed Venus as the brightest object in the night time sky, only to be surpassed by the moon. It was visible even during the day for weeks, and remained visible to the naked eye for at least two and a half years before fading away. It wasn't until the mid-1960s that radio astronomers first detected a nearly circular ring of material at the recorded position of the supernova. The ring was almost 30 arcminutes across, the same angular diameter as the full moon. The size of the remnant implied that the blast wave from the supernova had expanded at nearly 20 million miles per hour over the nearly 1,000 years since the explosion occurred. In 1976, the first detection of exceedingly faint optical emission of the supernova remnant was reported, but only for a filament located on the northwest edge of the radio ring. A tiny portion of this filament is revealed in detail by the Hubble observation. The twisting ribbon of light seen by Hubble corresponds to locations where the expanding blast wave from the supernova is now sweeping into very tenuous surrounding gas. The hydrogen gas heated by this fast shock wave emits radiation in visible light. Hence, the optical emission provides astronomers with a detailed "snapshot" of the actual position and geometry of the shock front at any given time. Bright edges within the ribbon correspond to places where the shock wave is seen exactly edge on to our line of sight. Today we know that SN 1006 has a diameter of nearly 60 light-years, and it is still expanding at roughly 6 million miles per hour. Even at this tremendous speed, however, it takes observations typically separated by years to see significant outward motion of the shock wave against the grid of background stars. In the Hubble image as displayed, the supernova would have occurred far off the lower right corner of the image, and the motion would be toward the upper left. SN 1006 resides within our Milky Way Galaxy. Located more than 14 degrees off the plane of the galaxy's disk, there is relatively little confusion with other foreground and background objects in the field when trying to study this object. In the Hubble image, many background galaxies (orange extended objects) far off in the distant universe can be seen dotting the image. Most of the white dots are foreground or background stars in our Milky Way galaxy. This image is a composite of hydrogen-light observations taken with Hubble's Advanced Camera for Surveys in February 2006 and Wide Field Planetary Camera 2 observations in blue, yellow-green, and near-infrared light taken in April 2008. The supernova remnant, visible only in the hydrogen-light filter was assigned a red hue in the Heritage color image. Credit: NASA, ESA, and the Hubble Heritage Team (STScI/AURA) Acknowledgment: W. Blair (Johns Hopkins University) To learn more about the Hubble Space Telescope go here: <a href="http://www.nasa.gov/mission_pages/hubble/main/index.html" rel="nofollow">www.nasa.gov/mission_pages/hubble/main/index.html</a> <b><a href="http://www.nasa.gov/audience/formedia/features/MP_Photo_Guidelines.html" rel="nofollow">NASA image use policy.</a></b> <b><a href="http://www.nasa.gov/centers/goddard/home/index.html" rel="nofollow">NASA Goddard Space Flight Center</a></b> enables NASA’s mission through four scientific endeavors: Earth Science, Heliophysics, Solar System Exploration, and Astrophysics. Goddard plays a leading role in NASA’s accomplishments by contributing compelling scientific knowledge to advance the Agency’s mission. <b>Follow us on <a href="http://twitter.com/NASAGoddardPix" rel="nofollow">Twitter</a></b> <b>Like us on <a href="http://www.facebook.com/pages/Greenbelt-MD/NASA-Goddard/395013845897?ref=tsd" rel="nofollow">Facebook</a></b> <b>Find us on <a href="http://instagram.com/nasagoddard?vm=grid" rel="nofollow">Instagram</a></b>

The veils of Saturn's most mysterious moon have begun to lift in Cassini's eagerly awaited first glimpse of the surface of Titan, a world where scientists believe organic matter rains from hazy skies and seas of liquid hydrocarbons dot a frigid surface. Surface features previously observed only from Earth-based telescopes are now visible in images of Titan taken in mid-April by Cassini through one of the narrow angle camera's spectral filters specifically designed to penetrate the thick atmosphere. The image scale is 230 kilometers (143 miles) per pixel, and it rivals the best Earth-based images. The two images displayed here show Titan from a vantage point 17 degrees below its equator, yielding a view from 50 degrees north latitude all the way to its south pole. The image on the left was taken four days after the image on the right. Titan rotated 90 degrees in that time. The two images combined cover a region extending halfway around the moon. The observed brightness variations suggest a diverse surface, with variations in average reflectivity on scales of a couple hundred kilometers. The images were taken through a narrow filter centered at 938 nanometers, a spectral region in which the only obstacle to light is the carbon-based, organic haze. Despite the rather long 38-second exposure times, there is no noticeable smear due to spacecraft motion. The images have been magnified 10 times and enhanced in contrast to bring out details. No further processing to remove the effects of the overlying atmosphere has been performed. The superimposed grid over the images illustrates the orientation of Titan -- north is up and rotated 25 degrees to the left -- as well as the geographical regions of the satellite that are illuminated and visible. The yellow curve marks the position of the boundary between day and night on Titan. The enhanced image contrast makes the region within 20 degrees of this day and night division darker than usual. The Sun illuminates Titan from the right at a phase angle of 66 degrees. Because the Sun is in the southern hemisphere as seen from Titan, the north pole is canted relative to the boundary between day and night by 25 degrees. Also shown here is a map of relative surface brightness variations on Titan as measured in images taken in the 1080-nanometer spectral region in 1997 and 1998 by the Near Infrared Camera and Multi-Object Spectrometer on NASA's Hubble Space Telescope. These images have scales of 300 kilometers (186 miles) per pixel. The map colors indicate different surface reflectivities. From darkest to brightest, the color progression is: deep blue (darkest), light blue, green, yellow, red and deep red (brightest). The large, continent-sized, red feature extending from 60 degrees to 150 degrees west longitude is called Xanadu. It is unclear whether Xanadu is a mountain range, giant basin, smooth plain, or a combination of all three. It may be dotted with hydrocarbon lakes but that is also unknown. All that is presently known is that in Earth-based images, it is the brightest region on Titan. A comparison between the Cassini images and the Hubble map indicates that Xanadu is visible as a bright region in the Cassini image on the right. The dark blue northwest-southeast trending feature from 210 degrees to 250 degrees west longitude, and the bright yellow/green region to the east (right) and southeast of it at minus 50 degrees latitude and 180 to 230 degrees west longitude on the Hubble map, can both be seen in the image on the left. It is noteworthy that the surface is visible to Cassini from its present approach viewing geometry, which is not the most favourable for surface viewing. These early Cassini observations are promising for upcoming imaging sequences of Titan in which the resolution improves by a factor of five over the next two months. These results are encouraging for future, in-orbit observations of Titan that will be acquired from lower, more favorable phase angles. The first opportunity to view small-scale features (2 kilometers or 1.2 miles) on the surface comes during a 350,000 kilometer (217,500 mile) flyby over Titan's south pole on July 2, 2004, only 30 hours after Cassini's insertion into orbit around the ringed planet. http://photojournal.jpl.nasa.gov/catalog/PIA05390