
NASA Earth Day 2019 Poster - Web

NASA Earth Day 2019 Poster - Print
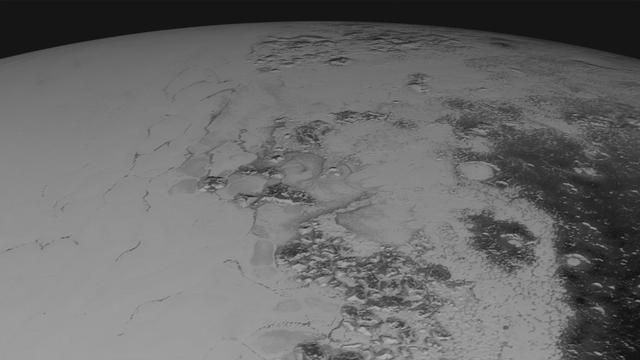
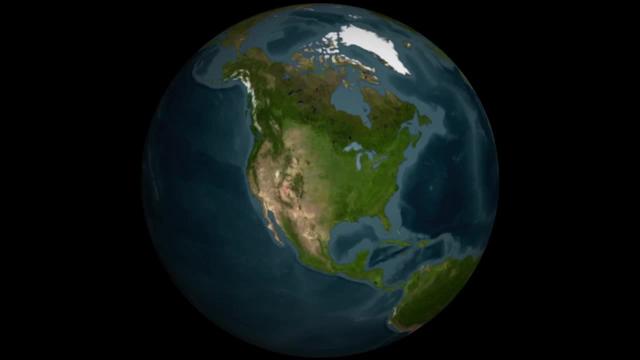
Images downloaded from NASA's New Horizons spacecraft (through Sept. 11, 2015) were stitched together and rendered on a sphere to make a flyover "movie." The animation, made with images from New Horizons' Long Range Reconnaissance Imager (LORRI), begins with a low-altitude look at the informally named Norgay Montes, flies northward over the boundary between informally named Sputnik Planum and Cthulhu Regio, turns, and drifts slowly east. During the animation, the altitude of the observer rises until it is about 10 times higher to show about 80% of the hemisphere New Horizons flew closest to on July 14, 2015. http://photojournal.jpl.nasa.gov/catalog/PIA19951
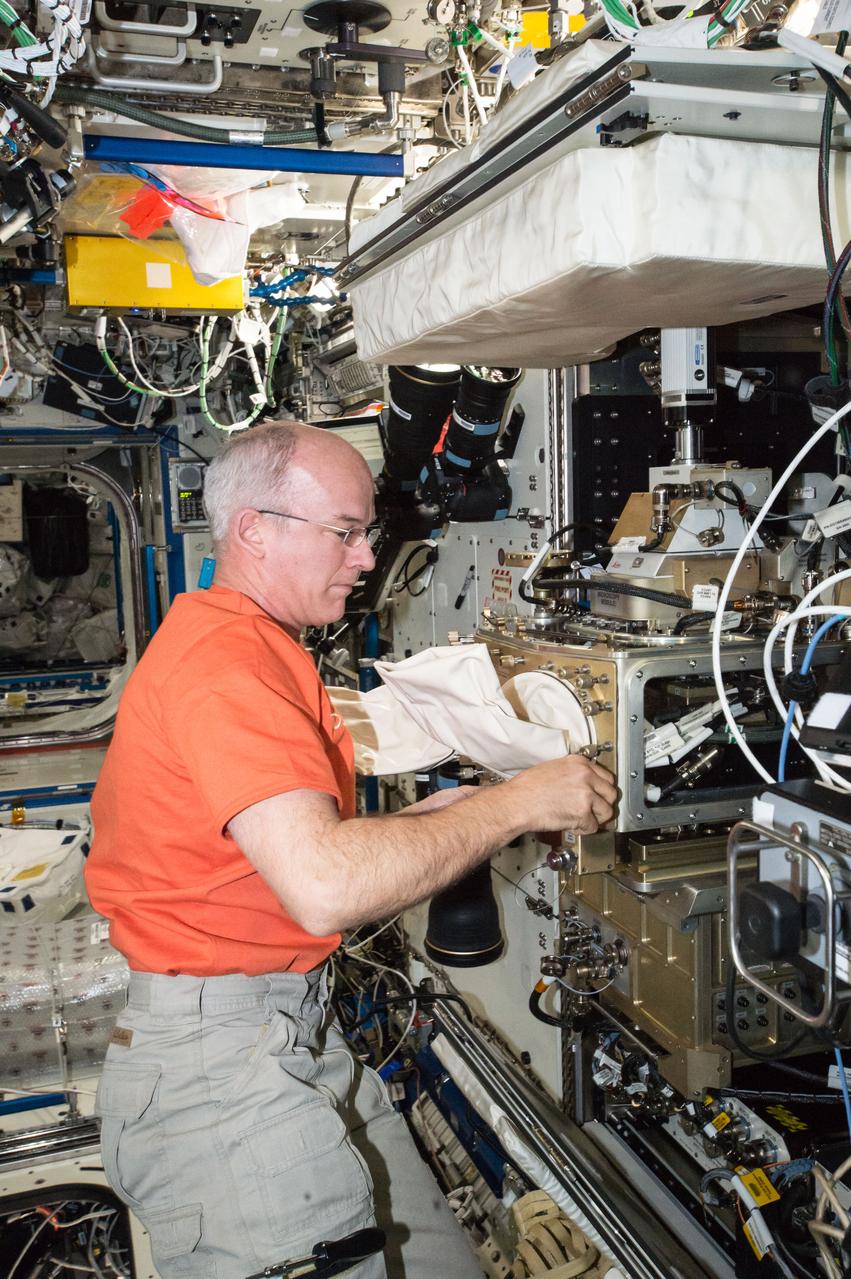
ISS047e066551 (04/18/2016) --- NASA astronaut Jeff Williams configures the station’s Light Microscopy Module (LMM), a modified commercial, highly flexible, state-of-the-art light imaging microscope facility that provides researchers with powerful diagnostic hardware and software. The LMM enables novel research of microscopic phenomena in microgravity, with the capability of remotely acquiring and downloading digital images and videos across many levels of magnification.
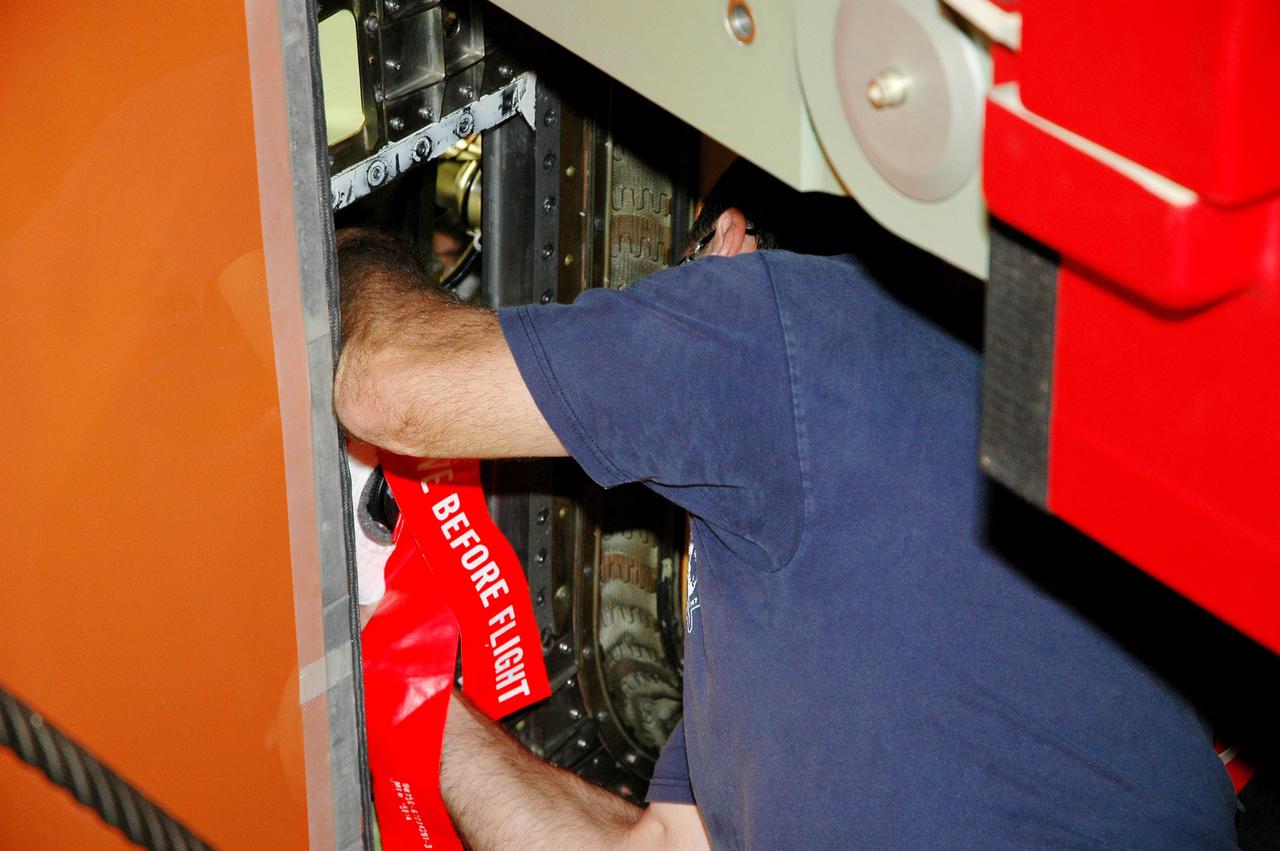
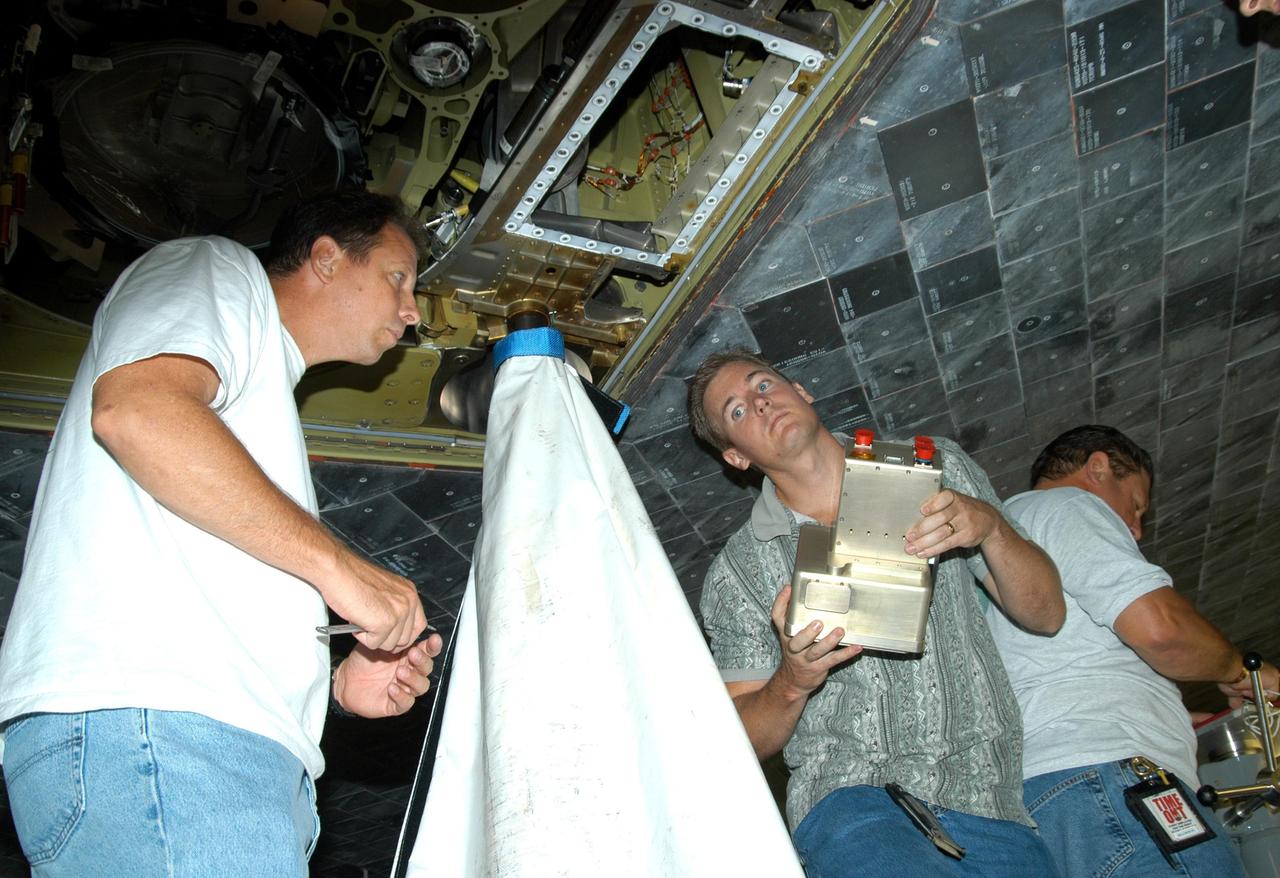
KENNEDY SPACE CENTER, FLA. - In the Vehicle Assembly Building at NASA’s Kennedy Space Center, a worker mounts a digital still camera in the External Tank (ET) umbilical well on the aft end of Space Shuttle Discovery. The camera is being used to obtain and downlink high-resolution images of the disconnect point on the ET following the ET separation from the orbiter after launch. The Kodak camera will record 24 images, at one frame per 1.5 seconds, on a flash memory card. After orbital insertion, the crew will transfer the images from the memory card to a laptop computer. The files will then be downloaded through the Ku-band system to the Mission Control Center in Houston for analysis.
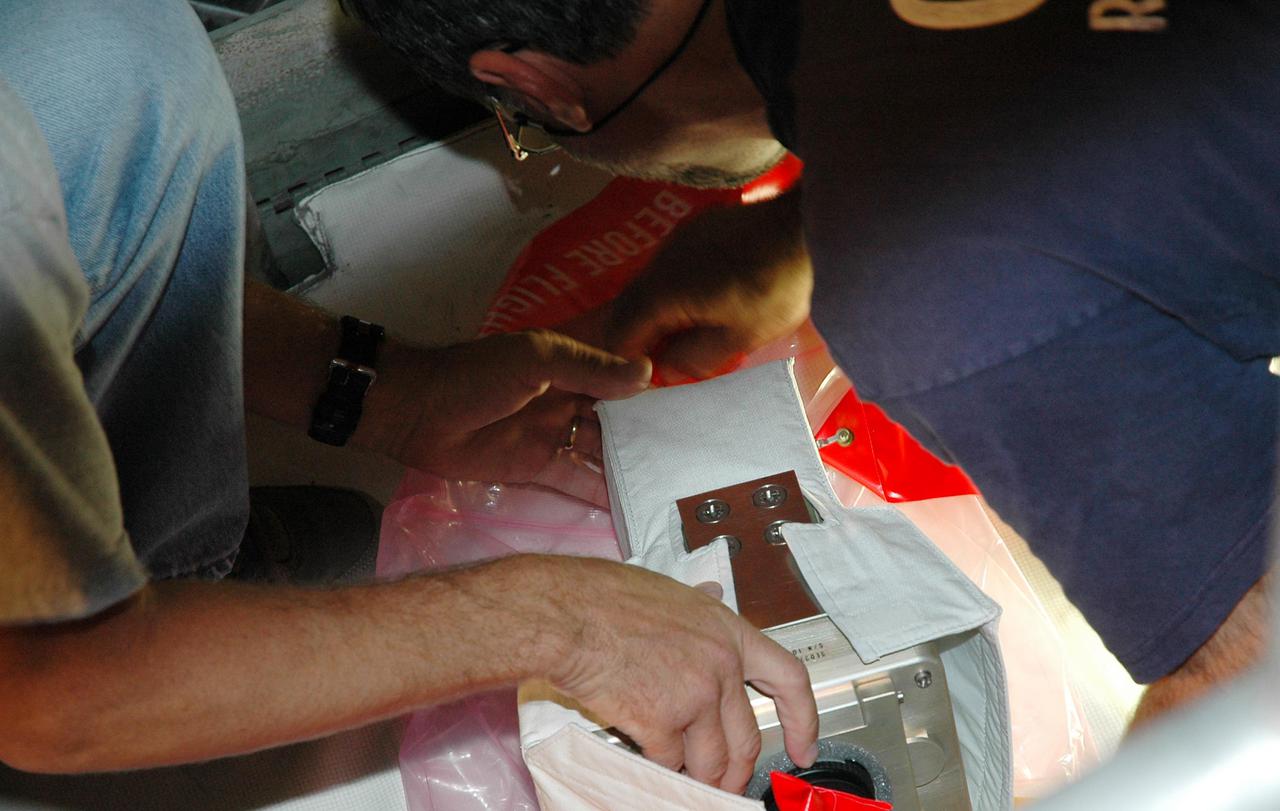
KENNEDY SPACE CENTER, FLA. - In the Vehicle Assembly Building at NASA’s Kennedy Space Center, workers check the digital still camera they will mount in the External Tank (ET) umbilical well on the aft end of Space Shuttle Discovery. The camera is being used to obtain and downlink high-resolution images of the disconnect point on the ET following the tank's separation from the orbiter after launch. The Kodak camera will record 24 images, at one frame per 1.5 seconds, on a flash memory card. After orbital insertion, the crew will transfer the images from the memory card to a laptop computer. The files will then be downloaded through the Ku-band system to the Mission Control Center in Houston for analysis.
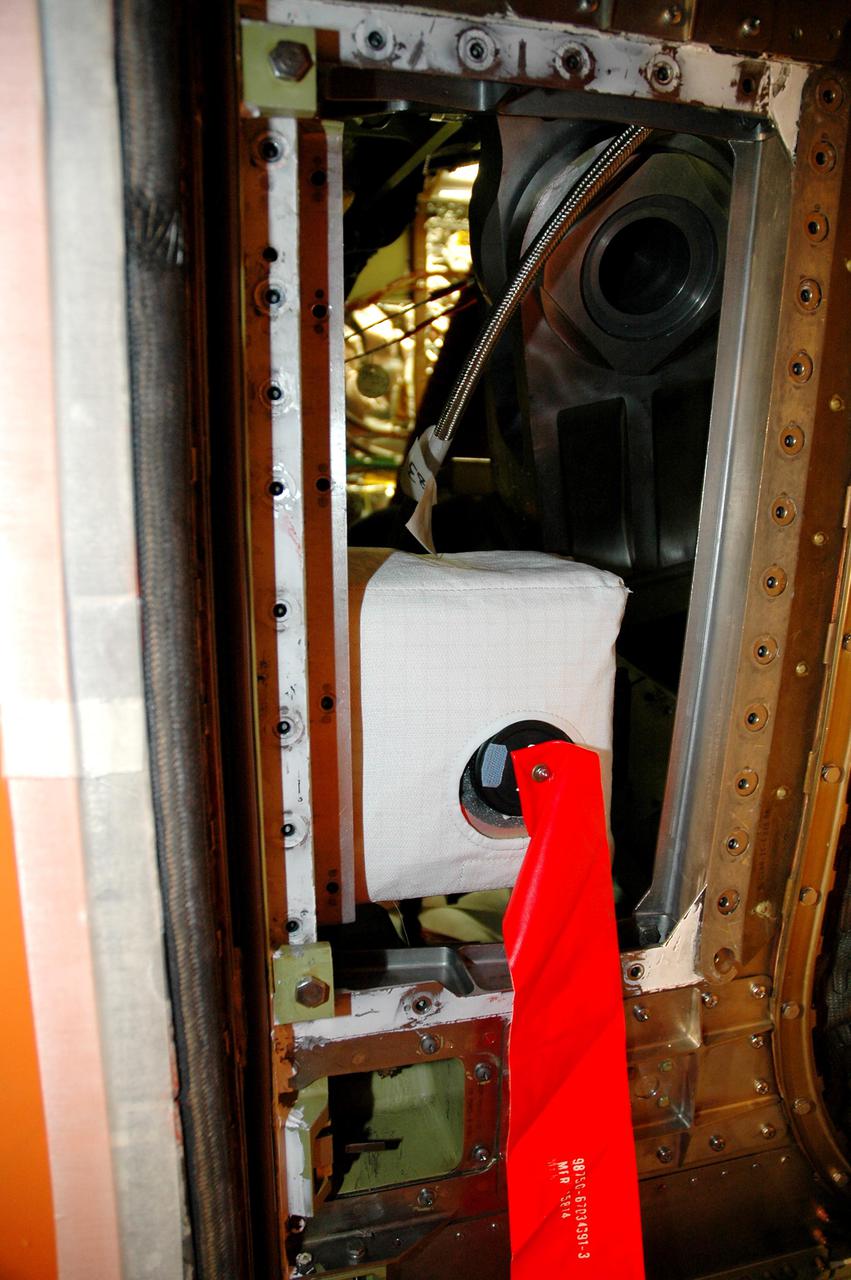
KENNEDY SPACE CENTER, FLA. - In the Vehicle Assembly Building at NASA’s Kennedy Space Center, a digital still camera has been mounted in the External Tank (ET) umbilical well on the aft end of Space Shuttle Discovery. The camera is being used to obtain and downlink high-resolution images of the disconnect point on the ET following ET separation from the orbiter after launch. The Kodak camera will record 24 images, at one frame per 1.5 seconds, on a flash memory card. After orbital insertion, the crew will transfer the images from the memory card to a laptop computer. The files will then be downloaded through the Ku-band system to the Mission Control Center in Houston for analysis.
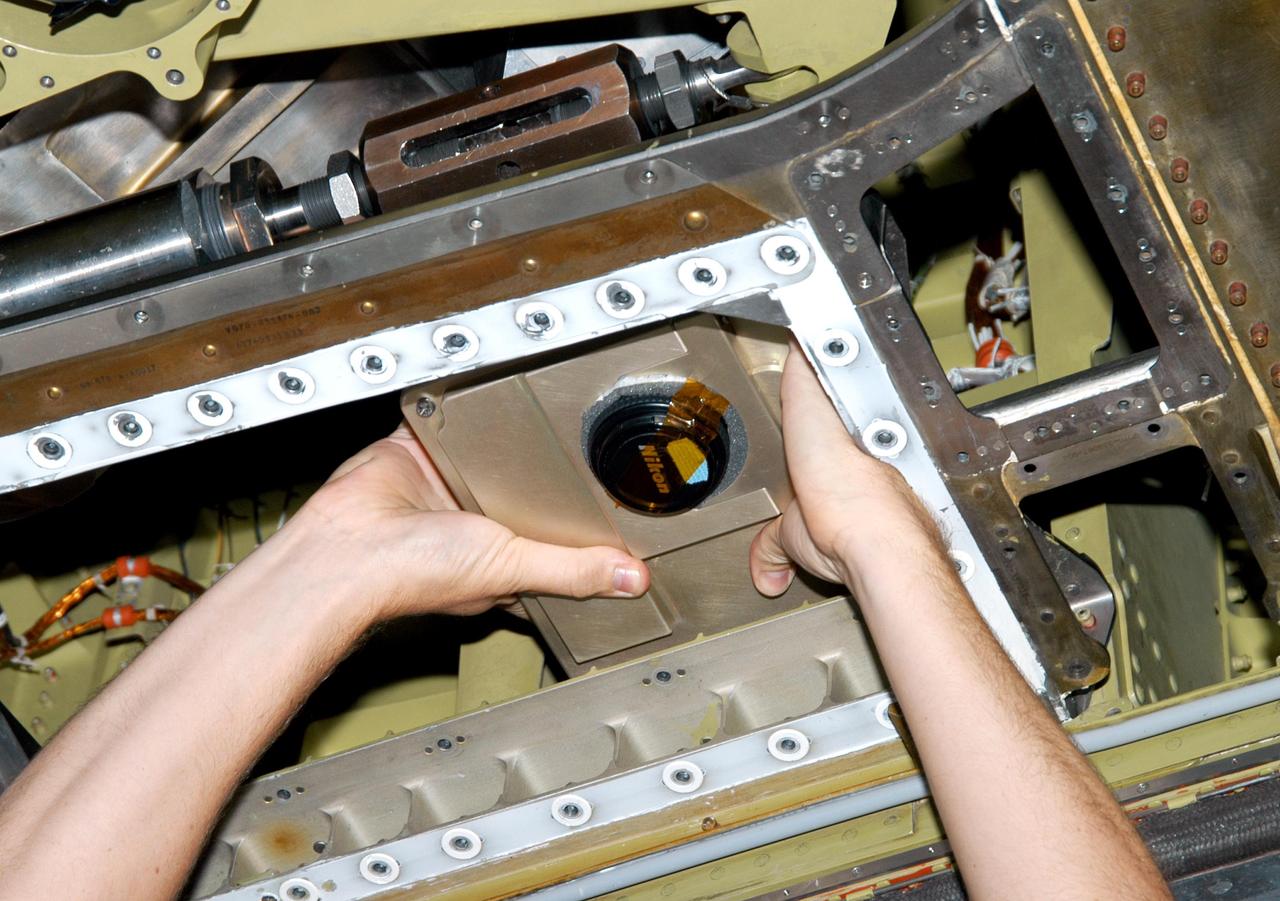
KENNEDY SPACE CENTER, FLA. - In the Orbiter Processing Facility, an External Tank (ET) digital still camera is positioned into the right-hand liquid oxygen umbilical well on Space Shuttle Atlantis to determine if it fits properly. NASA is pursuing use of the camera, beginning with the Shuttle’s Return To Flight, to obtain and downlink high-resolution images of the ET following separation of the ET from the orbiter after launch. The Kodak camera will record 24 images, at one frame per 1.5 seconds, on a flash memory card. After orbital insertion, the crew will transfer the images from the memory card to a laptop computer. The files will then be downloaded through the Ku-band system to the Mission Control Center in Houston for analysis.

KENNEDY SPACE CENTER, FLA. - In the Vehicle Assembly Building at NASA’s Kennedy Space Center, workers prepare a digital still camera they will mount in the External Tank (ET) umbilical well on the aft end of Space Shuttle Discovery. The camera is being used to obtain and downlink high-resolution images of the disconnect point on the ET following its separation from the orbiter after launch. The Kodak camera will record 24 images, at one frame per 1.5 seconds, on a flash memory card. After orbital insertion, the crew will transfer the images from the memory card to a laptop computer. The files will then be downloaded through the Ku-band system to the Mission Control Center in Houston for analysis.
KENNEDY SPACE CENTER, FLA. - In the Vehicle Assembly Building at NASA’s Kennedy Space Center, workers prepare a digital still camera they will mount in the External Tank (ET) umbilical well on the aft end of Space Shuttle Discovery. The camera is being used to obtain and downlink high-resolution images of the disconnect point on the ET following the ET separation from the orbiter after launch. The Kodak camera will record 24 images, at one frame per 1.5 seconds, on a flash memory card. After orbital insertion, the crew will transfer the images from the memory card to a laptop computer. The files will then be downloaded through the Ku-band system to the Mission Control Center in Houston for analysis.
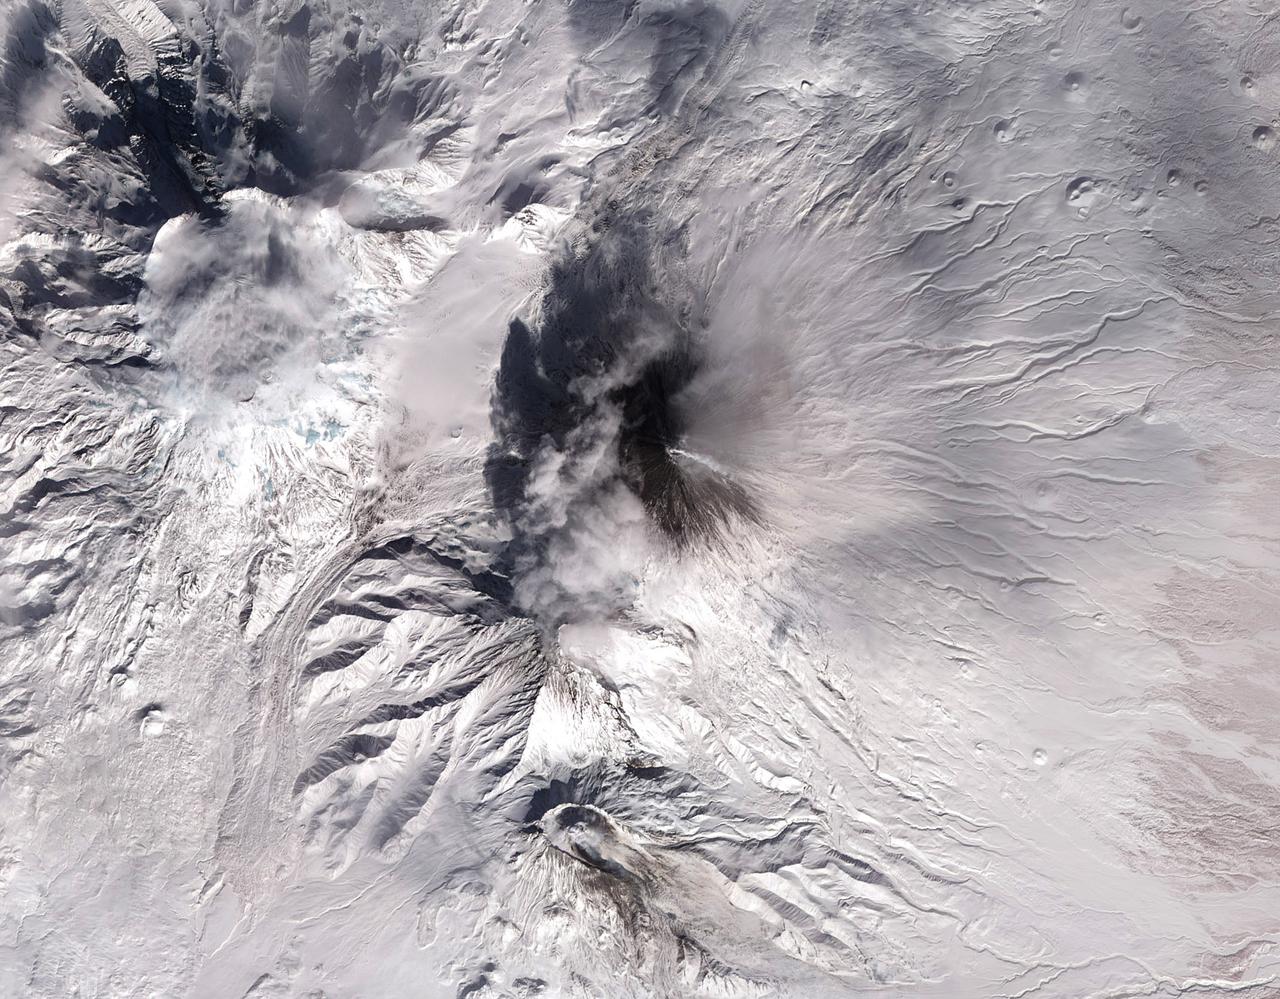
Shiveluch volcano on Russia’s Kamchatka Peninsula. This is a false-color satellite image, acquired by the Advanced Spaceborne Thermal Emission and Reflection Radiometer (ASTER) on March 10, 2010. To download a full high res version of this image and to learn more go to: <a href="http://earthobservatory.nasa.gov/NaturalHazards/view.php?id=43103" rel="nofollow">earthobservatory.nasa.gov/NaturalHazards/view.php?id=43103</a> Credit: NASA Earth Observatory image by Jesse Allen and Robert Simmon, based on data from the NASA/GSFC/METI/ERSDAC/JAROS, and U.S./Japan ASTER Science Team. Instrument: Terra - ASTER For more information about the Goddard Space Flight Center go here: <a href="http://www.nasa.gov/centers/goddard/home/index.html" rel="nofollow">www.nasa.gov/centers/goddard/home/index.html</a>
KENNEDY SPACE CENTER, FLA. - In the Orbiter Processing Facility, from left, United Space Alliance workers Loyd Turner, Craig Meyer and Erik Visser prepare to conduct a fit check of an External Tank (ET) digital still camera in the right-hand liquid oxygen umbilical well on Space Shuttle Atlantis. NASA is pursuing use of the camera, beginning with the Shuttle’s Return To Flight, to obtain and downlink high-resolution images of the ET following separation of the ET from the orbiter after launch. The Kodak camera will record 24 images, at one frame per 1.5 seconds, on a flash memory card. After orbital insertion, the crew will transfer the images from the memory card to a laptop computer. The files will then be downloaded through the Ku-band system to the Mission Control Center in Houston for analysis.
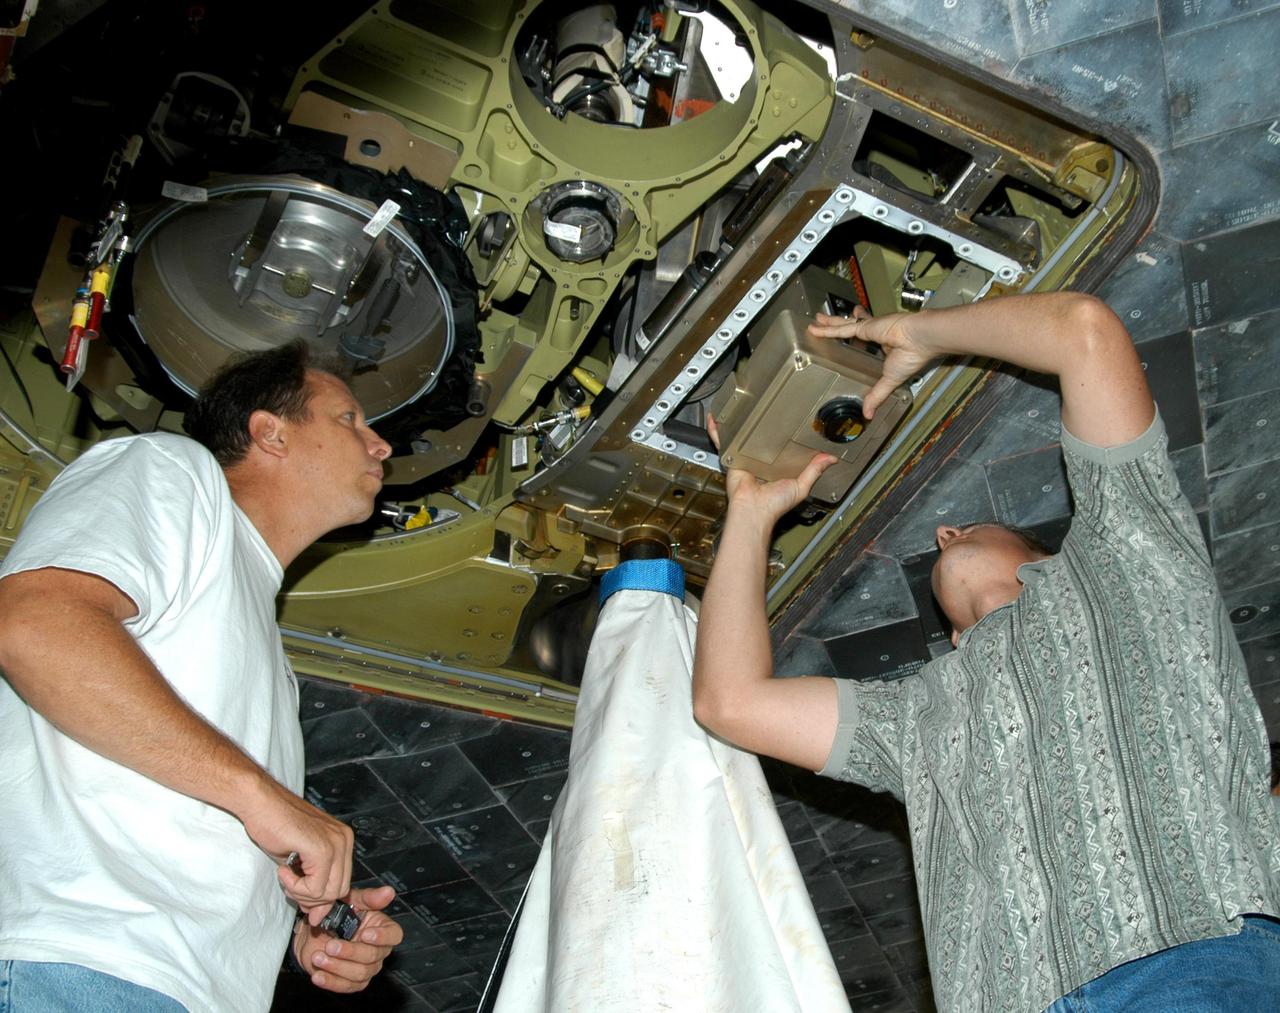
KENNEDY SPACE CENTER, FLA. - In the Orbiter Processing Facility, from left, United Space Alliance workers Loyd Turner, Craig Meyer and Erik Visser conduct a fit check of an External Tank (ET) digital still camera in the right-hand liquid oxygen umbilical well on Space Shuttle Atlantis. NASA is pursuing use of the camera, beginning with the Shuttle’s Return To Flight, to obtain and downlink high-resolution images of the ET following separation of the ET from the orbiter after launch. The Kodak camera will record 24 images, at one frame per 1.5 seconds, on a flash memory card. After orbital insertion, the crew will transfer the images from the memory card to a laptop computer. The files will then be downloaded through the Ku-band system to the Mission Control Center in Houston for analysis.

KENNEDY SPACE CENTER, FLA. - In the Orbiter Processing Facility, United Space Alliance worker Craig Meyer fits an External Tank (ET) digital still camera in the right-hand liquid oxygen umbilical well on Space Shuttle Atlantis. NASA is pursuing use of the camera, beginning with the Shuttle’s Return To Flight, to obtain and downlink high-resolution images of the ET following separation of the ET from the orbiter after launch. The Kodak camera will record 24 images, at one frame per 1.5 seconds, on a flash memory card. After orbital insertion, the crew will transfer the images from the memory card to a laptop computer. The files will then be downloaded through the Ku-band system to the Mission Control Center in Houston for analysis.
This is a visualizations of ozone concentrations over the southern hemisphere. Minimum concentration of ozone in the southern hemisphere for each year from 1979-2013 (there is no data from 1995). Each image is the day of the year with the lowest concentration of ozone. A graph of the lowest ozone amount for each year is shown. Read more/download file: <a href="http://svs.gsfc.nasa.gov/vis/a010000/a011600/a011648/" rel="nofollow">svs.gsfc.nasa.gov/vis/a010000/a011600/a011648/</a> NASA's Goddard Space Flight Center <b><a href="http://www.nasa.gov/audience/formedia/features/MP_Photo_Guidelines.html" rel="nofollow">NASA image use policy.</a></b> <b><a href="http://www.nasa.gov/centers/goddard/home/index.html" rel="nofollow">NASA Goddard Space Flight Center</a></b> enables NASA’s mission through four scientific endeavors: Earth Science, Heliophysics, Solar System Exploration, and Astrophysics. Goddard plays a leading role in NASA’s accomplishments by contributing compelling scientific knowledge to advance the Agency’s mission. <b>Follow us on <a href="http://twitter.com/NASAGoddardPix" rel="nofollow">Twitter</a></b> <b>Like us on <a href="http://www.facebook.com/pages/Greenbelt-MD/NASA-Goddard/395013845897?ref=tsd" rel="nofollow">Facebook</a></b> <b>Find us on <a href="http://instagram.com/nasagoddard?vm=grid" rel="nofollow">Instagram</a></b>

This video highlights the many ways NASA Goddard Space Flight Center explores the universe. So crank up your speakers and let the music be your guide. "My Songs Know What You Did In The Dark (Light Em Up)" Performed by Fall Out Boy Courtesy of Island Def Jam Music Group under license from Universal Music Enterprises Download the video here: <a href="http://svs.gsfc.nasa.gov/goto?11378" rel="nofollow">svs.gsfc.nasa.gov/goto?11378</a> <b><a href="http://www.nasa.gov/audience/formedia/features/MP_Photo_Guidelines.html" rel="nofollow">NASA image use policy.</a></b> <b><a href="http://www.nasa.gov/centers/goddard/home/index.html" rel="nofollow">NASA Goddard Space Flight Center</a></b> enables NASA’s mission through four scientific endeavors: Earth Science, Heliophysics, Solar System Exploration, and Astrophysics. Goddard plays a leading role in NASA’s accomplishments by contributing compelling scientific knowledge to advance the Agency’s mission. <b>Follow us on <a href="http://twitter.com/NASAGoddardPix" rel="nofollow">Twitter</a></b> <b>Like us on <a href="http://www.facebook.com/pages/Greenbelt-MD/NASA-Goddard/395013845897?ref=tsd" rel="nofollow">Facebook</a></b> <b>Find us on <a href="http://instagram.com/nasagoddard?vm=grid" rel="nofollow">Instagram</a></b>

On June 15, NASA's Swift caught the onset of a rare X-ray outburst from a stellar-mass black hole in the binary system V404 Cygni. Astronomers around the world are watching the event. In this system, a stream of gas from a star much like the sun flows toward a 10 solar mass black hole. Instead of spiraling toward the black hole, the gas accumulates in an accretion disk around it. Every couple of decades, the disk switches into a state that sends the gas rushing inward, starting a new outburst. Read more: <a href="http://www.nasa.gov/feature/goddard/nasa-missions-monitor-a-waking-black-hole" rel="nofollow">www.nasa.gov/feature/goddard/nasa-missions-monitor-a-waki...</a> Credits: NASA's Goddard Space Flight Center Download this video in HD formats from NASA Goddard's Scientific Visualization Studio <a href="http://svs.gsfc.nasa.gov/cgi-bin/details.cgi?aid=11110" rel="nofollow">svs.gsfc.nasa.gov/cgi-bin/details.cgi?aid=11110</a>
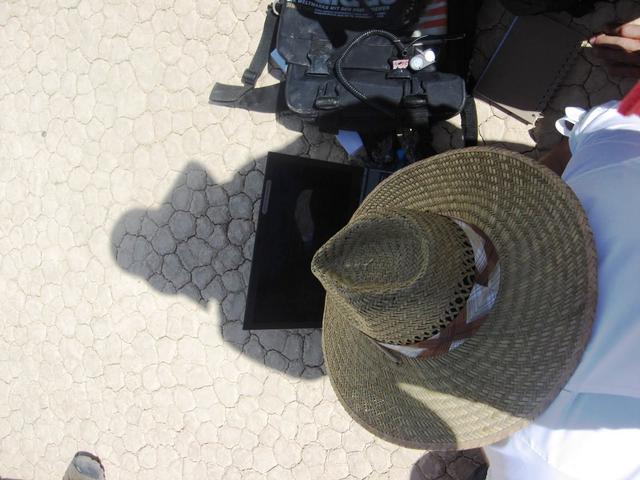
Data from the sensors were downloaded, and then the sensors were reburied. The LPSA team plans to publish a research paper that will present their data and offer their explanation for how the rocks move. Photo credit: NASA/GSFC/Maggie McAdam To read a feature story on the Racetrack Playa go to: <a href="http://www.nasa.gov/topics/earth/features/roving-rocks.html" rel="nofollow">www.nasa.gov/topics/earth/features/roving-rocks.html</a> <b><a href="http://www.nasa.gov/centers/goddard/home/index.html" rel="nofollow">NASA Goddard Space Flight Center</a></b> is home to the nation's largest organization of combined scientists, engineers and technologists that build spacecraft, instruments and new technology to study the Earth, the sun, our solar system, and the universe. <b>Follow us on <a href="http://twitter.com/NASA_GoddardPix" rel="nofollow">Twitter</a></b> <b>Join us on <a href="http://www.facebook.com/pages/Greenbelt-MD/NASA-Goddard/395013845897?ref=tsd" rel="nofollow">Facebook</a><b></b></b>
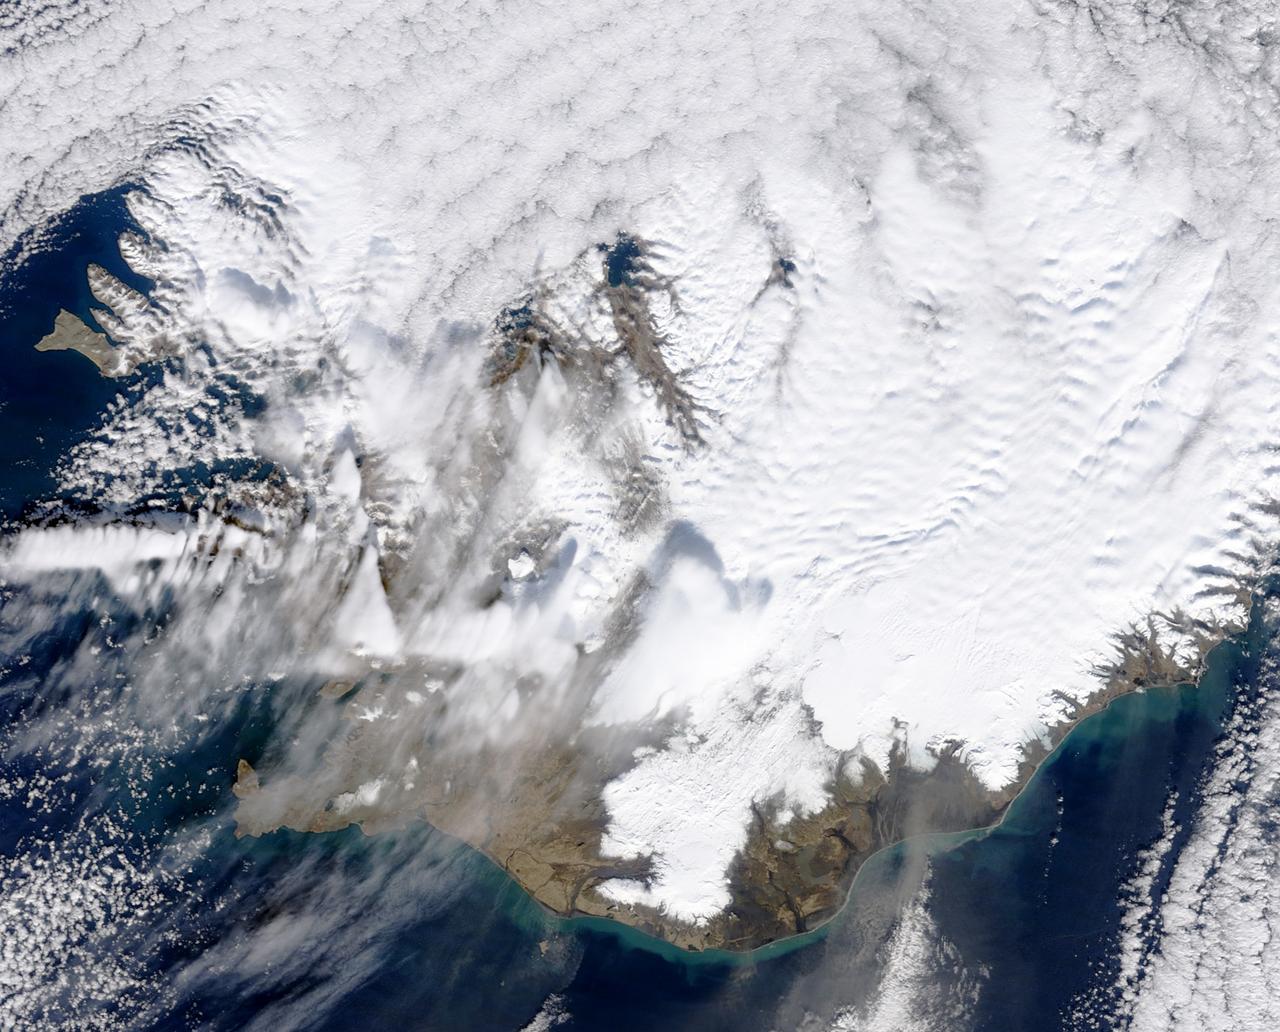
March 31, 2010..The volcanic eruption near Eyjafjallajökull persists into its second week, with continued lava fountaining and lava flows spilling into nearby canyons. The eruption is located at the Fimmvörduháls Pass between the Eyjafjallajökull ice field to the west (left) and the Mýrdalsjökull ice field to the east (right). This natural-color satellite image was acquired on March 26, 2010, by the MODIS aboard NASA’s Terra satellite. Dark ash and scoria cover the northern half of the Fimmvörduháls Pass. White snow covers the rest of the pass, sandwiched between white glaciers. Snow-free land is tan, brown, or dark gray, devoid of vegetation in early spring. To download a high res version of this image go to: <a href="http://modis.gsfc.nasa.gov/gallery/individual.php?db_date=2010-03-31" rel="nofollow">modis.gsfc.nasa.gov/gallery/individual.php?db_date=2010-0...</a> <b><a href="http://www.nasa.gov/centers/goddard/home/index.html" rel="nofollow">NASA Goddard Space Flight Center</a></b> is home to the nation's largest organization of combined scientists, engineers and technologists that build spacecraft, instruments and new technology to study the Earth, the sun, our solar system, and the universe.
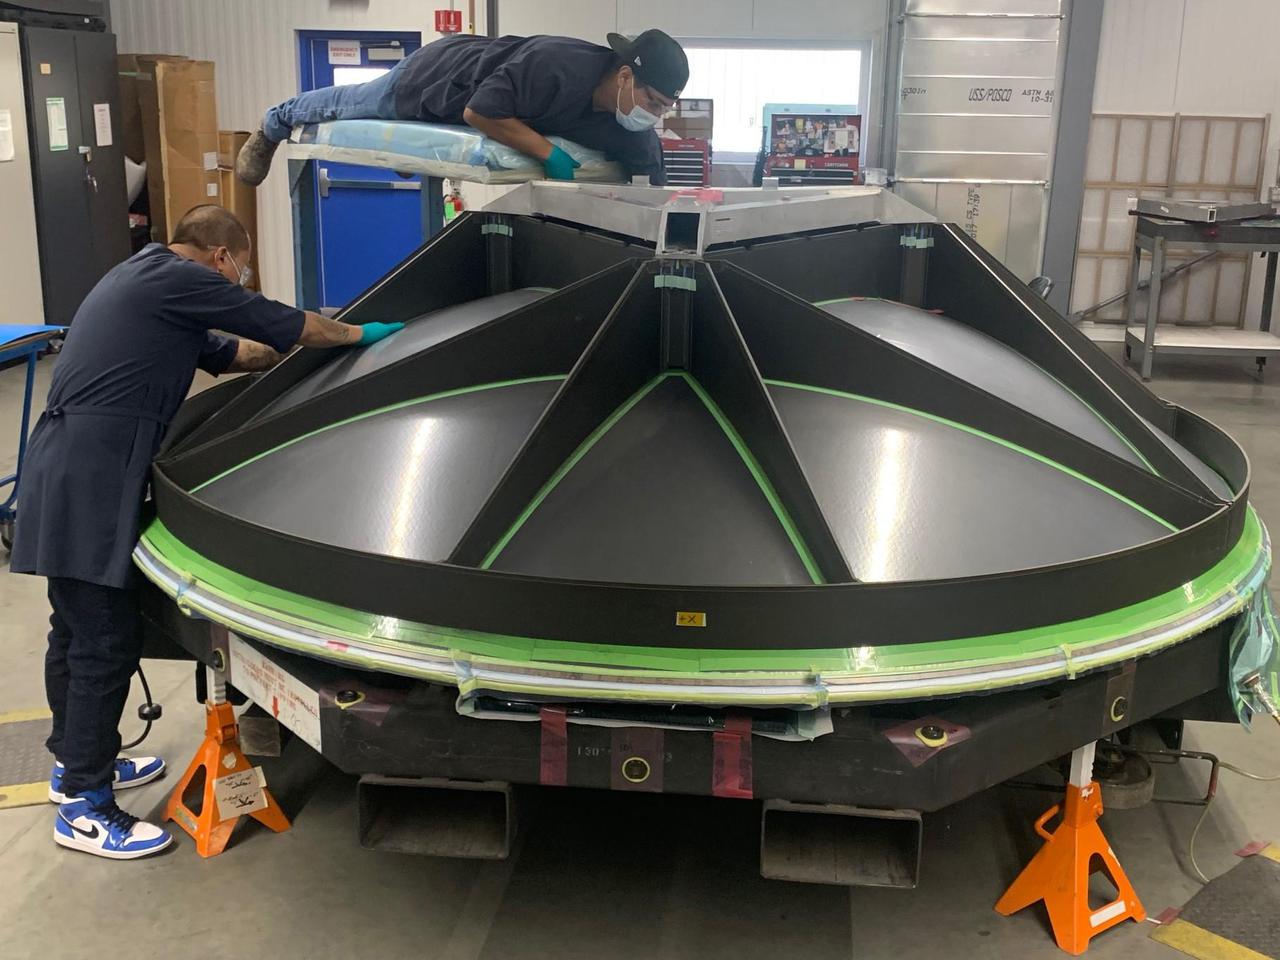
The build of a high-gain antenna, a nearly 10-foot-wide (3-meter-wide) dish, is underway for NASA's Europa Clipper spacecraft. The dish antenna, seen here face down, is being fabricated at aerospace vendor Applied Aerospace Structures Corporation (AASC) in Stockton, California. The antenna was designed by the Johns Hopkins Applied Physics Laboratory (APL) in Laurel, Maryland, and AASC, where it will be integrated along with other telecommunications hardware, into the propulsion module. The antenna downloads science data and allows ground controllers to send and receive commands and data between Earth and the spacecraft in Jupiter orbit – more than a million times farther from Earth than the International Space Station orbits. With an internal global ocean under a thick layer of ice, Jupiter's moon Europa may have the potential to harbor existing life. Europa Clipper will swoop around Jupiter on an elliptical path, dipping close to the moon on each flyby. Understanding Europa's habitability will help scientists better understand how life developed on Earth and the potential for finding life beyond our planet. Europa Clipper is set to launch in 2024. https://photojournal.jpl.nasa.gov/catalog/PIA24785
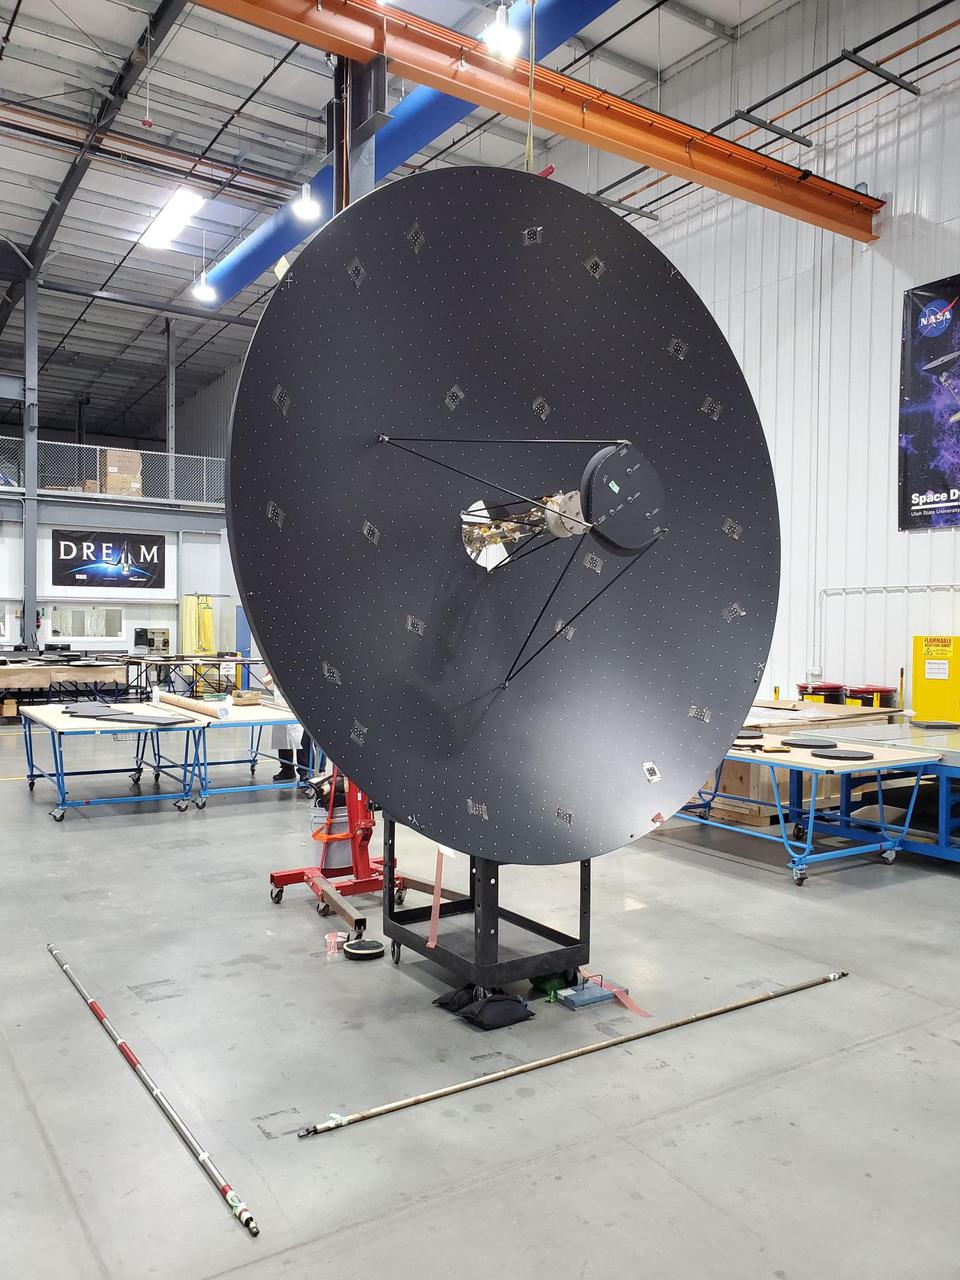
The massive high-gain antenna for NASA's Europa Clipper mission is complete. The antenna is nearly 10 feet (3 meters) wide and will be integrated along with other telecommunications hardware into the spacecraft's propulsion module. The antenna will download science data and allow ground controllers to send and receive commands and data between Earth and the spacecraft in Jupiter orbit – more than a million times farther from Earth than the International Space Station's orbits. It was designed by the Johns Hopkins Applied Physics Laboratory (APL) in Laurel, Maryland, and aerospace vendor Applied Aerospace Structures Corporation (AASC) in Stockton, California. With an internal global ocean under a thick layer of ice, Jupiter's moon Europa may have the potential to harbor existing life. Europa Clipper will swoop around Jupiter in an elliptical orbit, dipping close to the moon on each flyby to collect data. Understanding Europa's habitability will help scientists better understand how life developed on Earth and the potential for finding life beyond our planet. Europa Clipper is set to launch in 2024. https://photojournal.jpl.nasa.gov/catalog/PIA24899
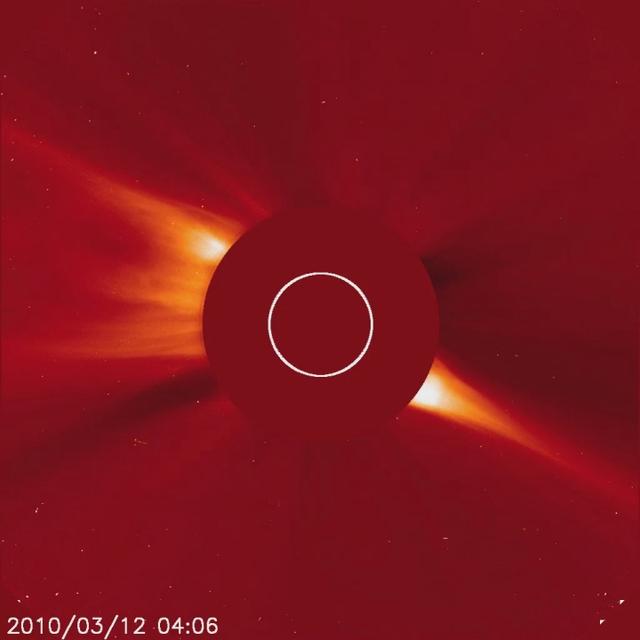
Captured March 12, 2010 The SOHO spacecraft captured a very bright, sungrazing comet as it rocketed towards the Sun (Mar. 12, 2010) and was vaporized. This comet is arguably the brightest comet that SOHO has observed since Comet McNaught in early 2007. The comet is believed to belong to the Kreutz family of comets that broke up from a much larger comet many hundreds of years ago. They are known to orbit close to the Sun. A coronal mass ejection (CME) burst away from the Sun during the bright comet’s approach. Interestingly, a much smaller comet that preceded this one can be seen about half a day earlier on just about the identical route. And another pair of small comets followed the same track into the Sun after the bright one. Such a string of comets has never been witnessed before by SOHO. SOHO's C3 coronagraph instrument blocks out the Sun with an occulting disk; the white circle represents the size of the Sun. The planet Mercury can also be seen moving from left to right just beneath the Sun. To learn more and to download the video and still images go here: <a href="http://sohowww.nascom.nasa.gov/pickoftheweek/old/15mar2010/" rel="nofollow">sohowww.nascom.nasa.gov/pickoftheweek/old/15mar2010/</a> Credit: NASA/GSFC/SOHO

The Mississippi Watershed is the largest drainage basin in North America at 3.2 million square kilometers in area. The USGS has created a database of this area which indicates the direction of waterflow at each point. By assembling these directions into streamflows, it is possible to trace the path of water from every point of the area to the mouth of the Mississippi in the Gulf of Mexico. This animation starts with the points furthest from the Gulf and reveals the streams and rivers as a steady progression towards the mouth of the Mississippi until all the major rivers are revealed. The speed of the reveal of the rivers is not dependent on the actual speed of the water flow. The reveal proceeds at a constant velocity along each river path, timed so that all reveals reach the mouth of the Mississippi at the same time. This animation does not show actual flow rates of the rivers. All rivers are shown with identical rates. The river colors and widths correspond to the relative lengths of river segments. Credit: NASA's Scientific Visualization Studio/Horace Mitchell Go here to download this video: <a href="http://svs.gsfc.nasa.gov/4493" rel="nofollow">svs.gsfc.nasa.gov/4493</a>
Joaquin became a tropical storm Monday evening (EDT) midway between the Bahamas and Bermuda and has now formed into Hurricane Joaquin, the 3rd of the season--the difference is Joaquin could impact the US East Coast. NASA's GPM satellite captured Joaquin Tuesday, September 29th at 21:39 UTC (5:39 pm EDT). Credit: NASA's Scientific Visualization Studio Data provided by the joint NASA/JAXA GPM mission. Download/read more: <a href="http://svs.gsfc.nasa.gov/cgi-bin/details.cgi?aid=4367" rel="nofollow">svs.gsfc.nasa.gov/cgi-bin/details.cgi?aid=4367</a> <b><a href="http://www.nasa.gov/audience/formedia/features/MP_Photo_Guidelines.html" rel="nofollow">NASA image use policy.</a></b> <b><a href="http://www.nasa.gov/centers/goddard/home/index.html" rel="nofollow">NASA Goddard Space Flight Center</a></b> enables NASA’s mission through four scientific endeavors: Earth Science, Heliophysics, Solar System Exploration, and Astrophysics. Goddard plays a leading role in NASA’s accomplishments by contributing compelling scientific knowledge to advance the Agency’s mission. <b>Follow us on <a href="http://twitter.com/NASAGoddardPix" rel="nofollow">Twitter</a></b> <b>Like us on <a href="http://www.facebook.com/pages/Greenbelt-MD/NASA-Goddard/395013845897?ref=tsd" rel="nofollow">Facebook</a></b> <b>Find us on <a href="http://instagrid.me/nasagoddard/?vm=grid" rel="nofollow">Instagram</a></b>
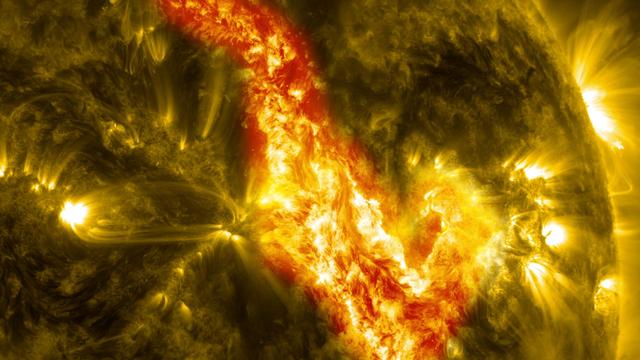
A magnetic filament of solar material erupted on the sun in late September, breaking the quiet conditions in a spectacular fashion. The 200,000 mile long filament ripped through the sun's atmosphere, the corona, leaving behind what looks like a canyon of fire. The glowing canyon traces the channel where magnetic fields held the filament aloft before the explosion. Visualizers at NASA's Goddard Space Flight Center in Greenbelt, Md. combined two days of satellite data to create a short movie of this gigantic event on the sun: <a href="http://bit.ly/166CncU" rel="nofollow">bit.ly/166CncU</a> In reality, the sun is not made of fire, but of something called plasma: particles so hot that their electrons have boiled off, creating a charged gas that is interwoven with magnetic fields. These images were captured on Sept. 29-30, 2013, by NASA's Solar Dynamics Observatory, or SDO, which constantly observes the sun in a variety of wavelengths. Read more/download video: <a href="http://1.usa.gov/1dnrsjF" rel="nofollow">1.usa.gov/1dnrsjF</a> Credit: NASA/SDO <b><a href="http://www.nasa.gov/audience/formedia/features/MP_Photo_Guidelines.html" rel="nofollow">NASA image use policy.</a></b> <b><a href="http://www.nasa.gov/centers/goddard/home/index.html" rel="nofollow">NASA Goddard Space Flight Center</a></b> enables NASA’s mission through four scientific endeavors: Earth Science, Heliophysics, Solar System Exploration, and Astrophysics. Goddard plays a leading role in NASA’s accomplishments by contributing compelling scientific knowledge to advance the Agency’s mission. <b>Follow us on <a href="http://twitter.com/NASA_GoddardPix" rel="nofollow">Twitter</a></b> <b>Like us on <a href="http://www.facebook.com/pages/Greenbelt-MD/NASA-Goddard/395013845897?ref=tsd" rel="nofollow">Facebook</a></b> <b>Find us on <a href="http://instagram.com/nasagoddard?vm=grid" rel="nofollow">Instagram</a></b>
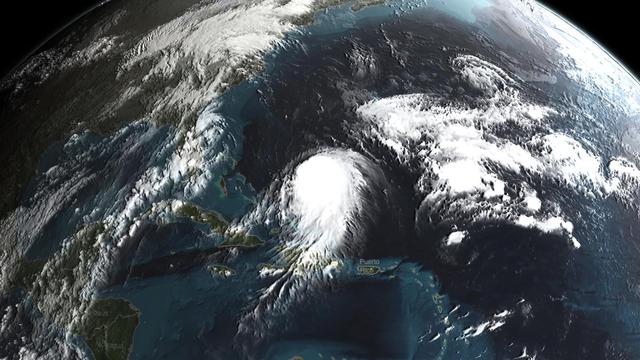
Joaquin became a tropical storm Monday evening (EDT) midway between the Bahamas and Bermuda and has now formed into Hurricane Joaquin, the 3rd of the season--the difference is Joaquin could impact the US East Coast. NASA's GPM satellite captured Joaquin Tuesday, September 29th at 21:39 UTC (5:39 pm EDT). Credit: NASA's Scientific Visualization Studio Data provided by the joint NASA/JAXA GPM mission. Download/read more: <a href="http://svs.gsfc.nasa.gov/cgi-bin/details.cgi?aid=4367" rel="nofollow">svs.gsfc.nasa.gov/cgi-bin/details.cgi?aid=4367</a> <b><a href="http://www.nasa.gov/audience/formedia/features/MP_Photo_Guidelines.html" rel="nofollow">NASA image use policy.</a></b> <b><a href="http://www.nasa.gov/centers/goddard/home/index.html" rel="nofollow">NASA Goddard Space Flight Center</a></b> enables NASA’s mission through four scientific endeavors: Earth Science, Heliophysics, Solar System Exploration, and Astrophysics. Goddard plays a leading role in NASA’s accomplishments by contributing compelling scientific knowledge to advance the Agency’s mission. <b>Follow us on <a href="http://twitter.com/NASAGoddardPix" rel="nofollow">Twitter</a></b> <b>Like us on <a href="http://www.facebook.com/pages/Greenbelt-MD/NASA-Goddard/395013845897?ref=tsd" rel="nofollow">Facebook</a></b> <b>Find us on <a href="http://instagrid.me/nasagoddard/?vm=grid" rel="nofollow">Instagram</a></b>
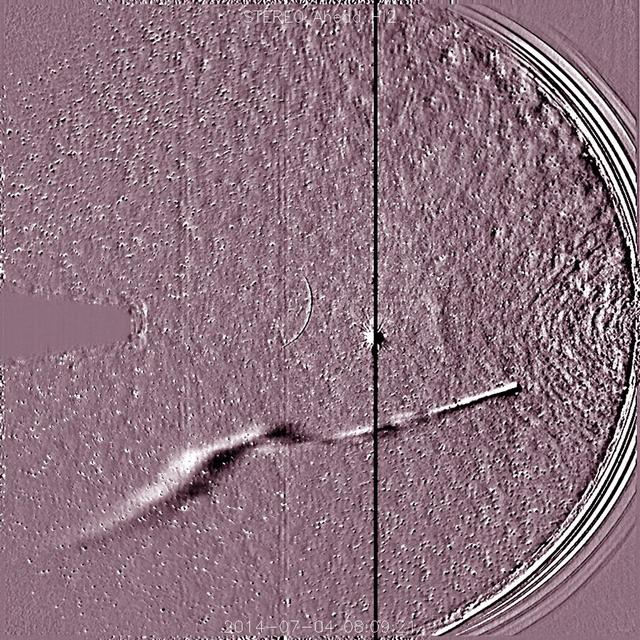
NASA's Solar TErrestrial RElations Observatory, STEREO has observed the recently discovered Comet Jacques as it passed by its nearest approach to the Sun (July 1-6, 2014). The wide field instrument on board STEREO (Ahead) showed the comet with its elongated tail being stretched and pummeled by the gusty solar wind streaming from the Sun. Also visible near the center of the image is the bright planet Venus. The Sun is just out of the field of view to the right. Comet Jacques is traveling through space at about 180,000 km per hour (110,000 mph). It may brighten enough to be seen with the naked eye. Video of this event here: <a href="https://www.flickr.com/photos/gsfc/14730658164/">www.flickr.com/photos/gsfc/14730658164/</a> Download original file: <a href="http://sohowww.nascom.nasa.gov/pickoftheweek/old/11jul2014/" rel="nofollow">sohowww.nascom.nasa.gov/pickoftheweek/old/11jul2014/</a> Credit: NASA/Goddard/STEREO <b><a href="http://www.nasa.gov/audience/formedia/features/MP_Photo_Guidelines.html" rel="nofollow">NASA image use policy.</a></b> <b><a href="http://www.nasa.gov/centers/goddard/home/index.html" rel="nofollow">NASA Goddard Space Flight Center</a></b> enables NASA’s mission through four scientific endeavors: Earth Science, Heliophysics, Solar System Exploration, and Astrophysics. Goddard plays a leading role in NASA’s accomplishments by contributing compelling scientific knowledge to advance the Agency’s mission. <b>Follow us on <a href="http://twitter.com/NASAGoddardPix" rel="nofollow">Twitter</a></b> <b>Like us on <a href="http://www.facebook.com/pages/Greenbelt-MD/NASA-Goddard/395013845897?ref=tsd" rel="nofollow">Facebook</a></b> <b>Find us on <a href="http://instagram.com/nasagoddard?vm=grid" rel="nofollow">Instagram</a></b>
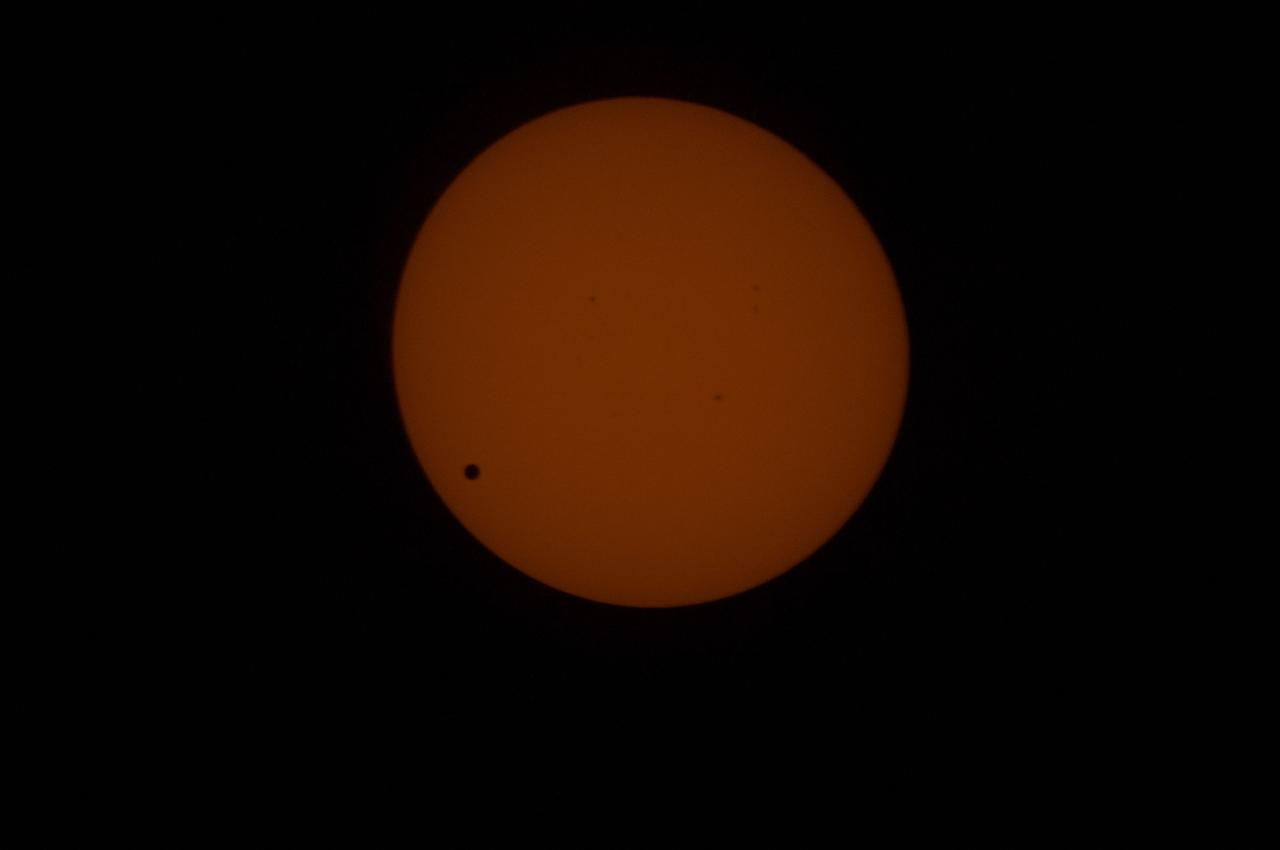
Transit of Venus as seen at 762nm in the CO Module. This image is from NASA Astronaut Don Petttit shot from onboard the International Space Station on June 5, 2012. Petttit, who had the foresight to bring a solar filter for his camera, will be capturing the June 5 Venus Transit from the International Space Station with the images downloading in almost real-time. He will photograph through the European Space Agency-built "cupola", removing the scratch panes to get crisp, clear images. Credit: NASA <b>To read more about the 2012 Venus Transit go to: <a href="http://sunearthday.nasa.gov/transitofvenus" rel="nofollow">sunearthday.nasa.gov/transitofvenus</a> </b> <b>Add your photos of the Transit of Venus to our Flickr Group here: <a href="http://www.flickr.com/groups/venustransit/">www.flickr.com/groups/venustransit/</a> </b> <b><a href="http://www.nasa.gov/audience/formedia/features/MP_Photo_Guidelines.html" rel="nofollow">NASA image use policy.</a></b> <b><a href="http://www.nasa.gov/centers/goddard/home/index.html" rel="nofollow">NASA Goddard Space Flight Center</a></b> enables NASA’s mission through four scientific endeavors: Earth Science, Heliophysics, Solar System Exploration, and Astrophysics. Goddard plays a leading role in NASA’s accomplishments by contributing compelling scientific knowledge to advance the Agency’s mission. <b>Follow us on <a href="http://twitter.com/NASA_GoddardPix" rel="nofollow">Twitter</a></b> <b>Like us on <a href="http://www.facebook.com/pages/Greenbelt-MD/NASA-Goddard/395013845897?ref=tsd" rel="nofollow">Facebook</a></b> <b>Find us on <a href="http://instagrid.me/nasagoddard/?vm=grid" rel="nofollow">Instagram</a></b>
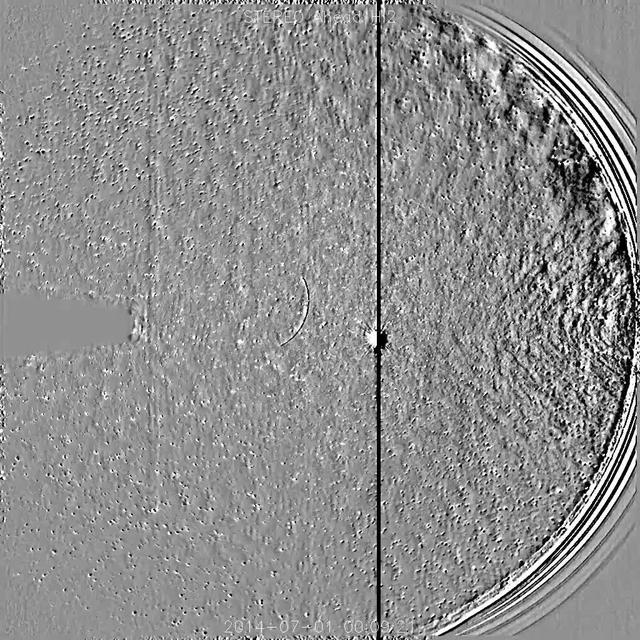
NASA's Solar TErrestrial Relations Observatory, STEREO has observed the recently discovered Comet Jacques as it passed by its nearest approach to the Sun (July 1-6, 2014). The wide field instrument on board STEREO (Ahead) showed the comet with its elongated tail being stretched and pummeled by the gusty solar wind streaming from the Sun. Also visible near the center of the image is the bright planet Venus. The Sun is just out of the field of view to the right. Comet Jacques is traveling through space at about 180,000 km per hour (110,000 mph). It may brighten enough to be seen with the naked eye. High res still here: <a href="https://www.flickr.com/photos/gsfc/14710024276/">www.flickr.com/photos/gsfc/14710024276/</a> Download original file: <a href="http://sohowww.nascom.nasa.gov/pickoftheweek/old/11jul2014/" rel="nofollow">sohowww.nascom.nasa.gov/pickoftheweek/old/11jul2014/</a> Credit: NASA/Goddard/STEREO <b><a href="http://www.nasa.gov/audience/formedia/features/MP_Photo_Guidelines.html" rel="nofollow">NASA image use policy.</a></b> <b><a href="http://www.nasa.gov/centers/goddard/home/index.html" rel="nofollow">NASA Goddard Space Flight Center</a></b> enables NASA’s mission through four scientific endeavors: Earth Science, Heliophysics, Solar System Exploration, and Astrophysics. Goddard plays a leading role in NASA’s accomplishments by contributing compelling scientific knowledge to advance the Agency’s mission. <b>Follow us on <a href="http://twitter.com/NASAGoddardPix" rel="nofollow">Twitter</a></b> <b>Like us on <a href="http://www.facebook.com/pages/Greenbelt-MD/NASA-Goddard/395013845897?ref=tsd" rel="nofollow">Facebook</a></b> <b>Find us on <a href="http://instagram.com/nasagoddard?vm=grid" rel="nofollow">Instagram</a></b>
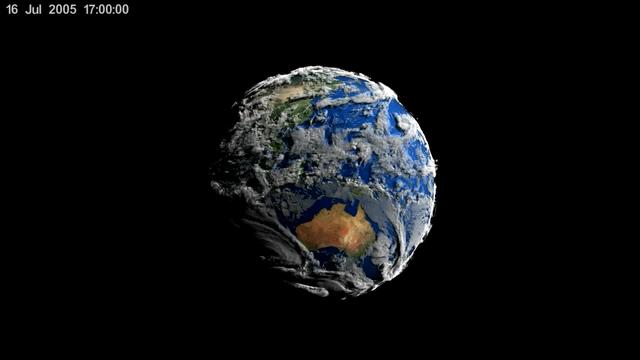
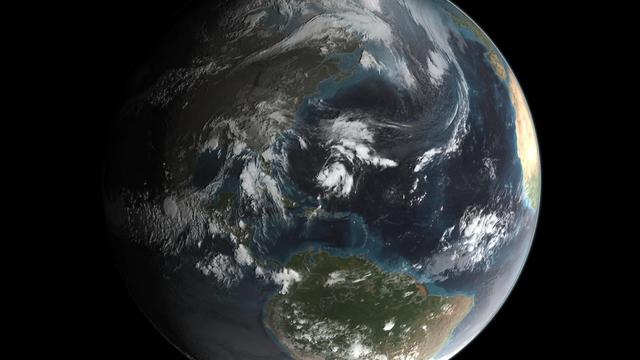
This visualization shows early test renderings of a global computational model of Earth's atmosphere based on data from NASA's Goddard Earth Observing System Model, Version 5 (GEOS-5). This particular run, called Nature Run 2, was run on a supercomputer, spanned 2 years of simulation time at 30 minute intervals, and produced Petabytes of output. The visualization spans a little more than 7 days of simulation time which is 354 time steps. The time period was chosen because a simulated category-4 typhoon developed off the coast of China. The 7 day period is repeated several times during the course of the visualization. Credit: NASA's Scientific Visualization Studio Read more or download here: <a href="http://svs.gsfc.nasa.gov/goto?4180" rel="nofollow">svs.gsfc.nasa.gov/goto?4180</a> <b><a href="http://www.nasa.gov/audience/formedia/features/MP_Photo_Guidelines.html" rel="nofollow">NASA image use policy.</a></b> <b><a href="http://www.nasa.gov/centers/goddard/home/index.html" rel="nofollow">NASA Goddard Space Flight Center</a></b> enables NASA’s mission through four scientific endeavors: Earth Science, Heliophysics, Solar System Exploration, and Astrophysics. Goddard plays a leading role in NASA’s accomplishments by contributing compelling scientific knowledge to advance the Agency’s mission. <b>Follow us on <a href="http://twitter.com/NASAGoddardPix" rel="nofollow">Twitter</a></b> <b>Like us on <a href="http://www.facebook.com/pages/Greenbelt-MD/NASA-Goddard/395013845897?ref=tsd" rel="nofollow">Facebook</a></b> <b>Find us on <a href="http://instagram.com/nasagoddard?vm=grid" rel="nofollow">Instagram</a></b>
UT154 solar test CO 934_0253 This is a sample low res test image from NASA Astronaut Don Petttit shot from onboard the International Space Station on June 5, 2012. Petttit, who had the foresight to bring a solar filter for his camera, will be capturing the June 5 Venus Transit from the International Space Station with the images downloading in almost real-time. He will photograph through the European Space Agency-built "cupola", removing the scratch panes to get crisp, clear images. Credit: NASA <b>To read more about the 2012 Venus Transit go to: <a href="http://sunearthday.nasa.gov/transitofvenus" rel="nofollow">sunearthday.nasa.gov/transitofvenus</a> </b> <b>Add your photos of the Transit of Venus to our Flickr Group here: <a href="http://www.flickr.com/groups/venustransit/">www.flickr.com/groups/venustransit/</a> </b> <b><a href="http://www.nasa.gov/audience/formedia/features/MP_Photo_Guidelines.html" rel="nofollow">NASA image use policy.</a></b> <b><a href="http://www.nasa.gov/centers/goddard/home/index.html" rel="nofollow">NASA Goddard Space Flight Center</a></b> enables NASA’s mission through four scientific endeavors: Earth Science, Heliophysics, Solar System Exploration, and Astrophysics. Goddard plays a leading role in NASA’s accomplishments by contributing compelling scientific knowledge to advance the Agency’s mission. <b>Follow us on <a href="http://twitter.com/NASA_GoddardPix" rel="nofollow">Twitter</a></b> <b>Like us on <a href="http://www.facebook.com/pages/Greenbelt-MD/NASA-Goddard/395013845897?ref=tsd" rel="nofollow">Facebook</a></b> <b>Find us on <a href="http://instagrid.me/nasagoddard/?vm=grid" rel="nofollow">Instagram</a></b>

The sun emitted a mid-level solar flare, peaking at 3:01 p.m. EDT on Oct. 2, 2014. NASA's Solar Dynamics Observatory, which watches the sun 24-hours a day, captured images of the flare. Solar flares are powerful bursts of radiation. Harmful radiation from a flare cannot pass through Earth's atmosphere to physically affect humans on the ground, however -- when intense enough -- they can disturb the atmosphere in the layer where GPS and communications signals travel. This flare is classified as an M7.3 flare. M-class flares are one-tenth as powerful as the most powerful flares, which are designated X-class flares. Download high res: <a href="http://svs.gsfc.nasa.gov/cgi-bin/details.cgi?aid=11670" rel="nofollow">svs.gsfc.nasa.gov/cgi-bin/details.cgi?aid=11670</a> Credit: NASA's Goddard Space Flight Center <b><a href="http://www.nasa.gov/audience/formedia/features/MP_Photo_Guidelines.html" rel="nofollow">NASA image use policy.</a></b> <b><a href="http://www.nasa.gov/centers/goddard/home/index.html" rel="nofollow">NASA Goddard Space Flight Center</a></b> enables NASA’s mission through four scientific endeavors: Earth Science, Heliophysics, Solar System Exploration, and Astrophysics. Goddard plays a leading role in NASA’s accomplishments by contributing compelling scientific knowledge to advance the Agency’s mission. <b>Follow us on <a href="http://twitter.com/NASAGoddardPix" rel="nofollow">Twitter</a></b> <b>Like us on <a href="http://www.facebook.com/pages/Greenbelt-MD/NASA-Goddard/395013845897?ref=tsd" rel="nofollow">Facebook</a></b> <b>Find us on <a href="http://instagram.com/nasagoddard?vm=grid" rel="nofollow">Instagram</a></b>

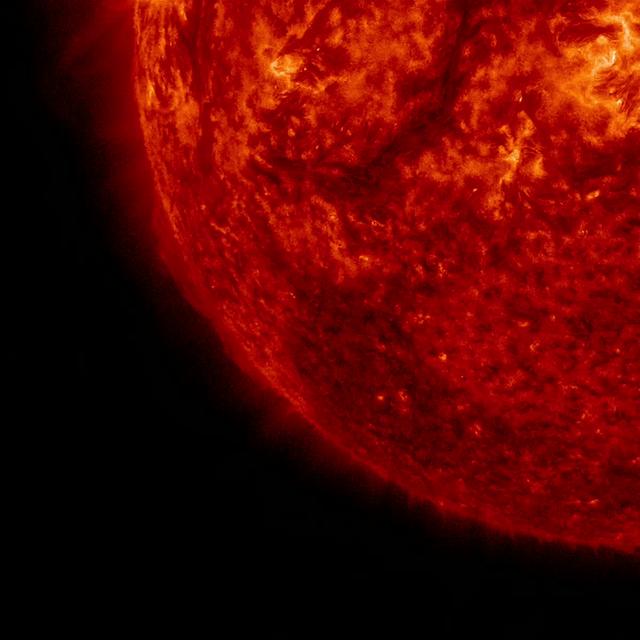
NASA’s Solar Dynamics Observatory caught this image of an eruption on the side of the sun on June 18, 2015. The eruption ultimately escaped the sun, growing into a substantial coronal mass ejection, or CME — a giant cloud of solar material traveling through space. This imagery is shown in the 304 Angstrom wavelength of extreme ultraviolet light, a wavelength that highlights material in the low parts of the sun’s atmosphere and that is typically colorized in red. The video clip covers about four hours of the event. Credit: NASA/Goddard/SDO Download: <a href="http://svs.gsfc.nasa.gov/goto?11908" rel="nofollow">svs.gsfc.nasa.gov/goto?11908</a> <b><a href="http://www.nasa.gov/audience/formedia/features/MP_Photo_Guidelines.html" rel="nofollow">NASA image use policy.</a></b> <b><a href="http://www.nasa.gov/centers/goddard/home/index.html" rel="nofollow">NASA Goddard Space Flight Center</a></b> enables NASA’s mission through four scientific endeavors: Earth Science, Heliophysics, Solar System Exploration, and Astrophysics. Goddard plays a leading role in NASA’s accomplishments by contributing compelling scientific knowledge to advance the Agency’s mission. <b>Follow us on <a href="http://twitter.com/NASAGoddardPix" rel="nofollow">Twitter</a></b> <b>Like us on <a href="http://www.facebook.com/pages/Greenbelt-MD/NASA-Goddard/395013845897?ref=tsd" rel="nofollow">Facebook</a></b> <b>Find us on <a href="http://instagrid.me/nasagoddard/?vm=grid" rel="nofollow">Instagram</a></b>
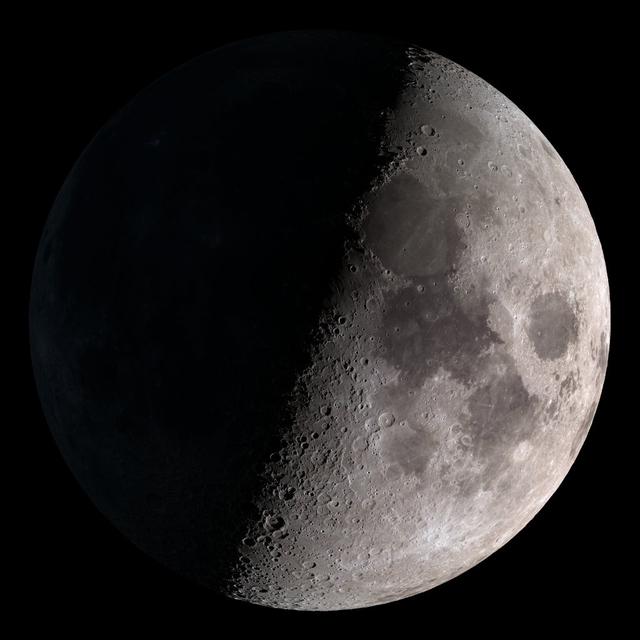
First quarter. Visible high in the southern sky in early evening. NASA's Lunar Reconnaissance Orbiter (LRO) has been in orbit around the Moon since the summer of 2009. Its laser altimeter (LOLA) and camera (LROC) are recording the rugged, airless lunar terrain in exceptional detail, making it possible to visualize the Moon with unprecedented fidelity. This is especially evident in the long shadows cast near the terminator, or day-night line. The pummeled, craggy landscape thrown into high relief at the terminator would be impossible to recreate in the computer without global terrain maps like those from LRO. To download, learn more about this visualization, or to see what the Moon will look like at any hour in 2015, visit <a href="http://svs.gsfc.nasa.gov/goto?4236" rel="nofollow">svs.gsfc.nasa.gov/goto?4236</a> <b><a href="http://www.nasa.gov/audience/formedia/features/MP_Photo_Guidelines.html" rel="nofollow">NASA image use policy.</a></b> <b><a href="http://www.nasa.gov/centers/goddard/home/index.html" rel="nofollow">NASA Goddard Space Flight Center</a></b> enables NASA’s mission through four scientific endeavors: Earth Science, Heliophysics, Solar System Exploration, and Astrophysics. Goddard plays a leading role in NASA’s accomplishments by contributing compelling scientific knowledge to advance the Agency’s mission. <b>Follow us on <a href="http://twitter.com/NASAGoddardPix" rel="nofollow">Twitter</a></b> <b>Like us on <a href="http://www.facebook.com/pages/Greenbelt-MD/NASA-Goddard/395013845897?ref=tsd" rel="nofollow">Facebook</a></b> <b>Find us on <a href="http://instagram.com/nasagoddard?vm=grid" rel="nofollow">Instagram</a></b>
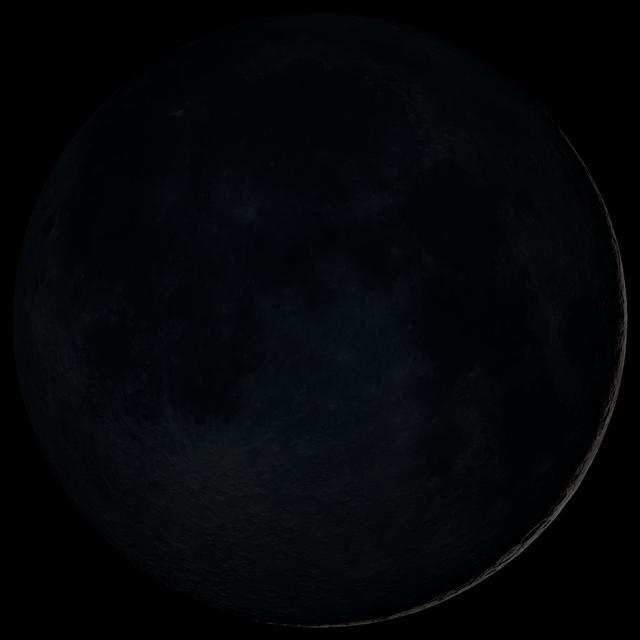
New Moon. By the modern definition, New Moon occurs when the Moon and Sun are at the same geocentric ecliptic longitude. The part of the Moon facing us is completely in shadow then. Pictured here is the traditional New Moon, the earliest visible waxing crescent, which signals the start of a new month in many lunar and lunisolar calendars. NASA's Lunar Reconnaissance Orbiter (LRO) has been in orbit around the Moon since the summer of 2009. Its laser altimeter (LOLA) and camera (LROC) are recording the rugged, airless lunar terrain in exceptional detail, making it possible to visualize the Moon with unprecedented fidelity. This is especially evident in the long shadows cast near the terminator, or day-night line. The pummeled, craggy landscape thrown into high relief at the terminator would be impossible to recreate in the computer without global terrain maps like those from LRO. To download, learn more about this visualization, or to see what the Moon will look like at any hour in 2015, visit <a href="http://svs.gsfc.nasa.gov/goto?4236" rel="nofollow">svs.gsfc.nasa.gov/goto?4236</a> <b><a href="http://www.nasa.gov/audience/formedia/features/MP_Photo_Guidelines.html" rel="nofollow">NASA image use policy.</a></b> <b><a href="http://www.nasa.gov/centers/goddard/home/index.html" rel="nofollow">NASA Goddard Space Flight Center</a></b> enables NASA’s mission through four scientific endeavors: Earth Science, Heliophysics, Solar System Exploration, and Astrophysics. Goddard plays a leading role in NASA’s accomplishments by contributing compelling scientific knowledge to advance the Agency’s mission. <b>Follow us on <a href="http://twitter.com/NASAGoddardPix" rel="nofollow">Twitter</a></b> <b>Like us on <a href="http://www.facebook.com/pages/Greenbelt-MD/NASA-Goddard/395013845897?ref=tsd" rel="nofollow">Facebook</a></b> <b>Find us on <a href="http://instagram.com/nasagoddard?vm=grid" rel="nofollow">Instagram</a></b>
The Sun blew out a coronal mass ejection along with part of a solar filament over a three-hour period (Feb. 24, 2015). While some of the strands fell back into the Sun, a substantial part raced into space in a bright cloud of particles (as observed by the SOHO spacecraft). The activity was captured in a wavelength of extreme ultraviolet light. Because this occurred way over near the edge of the Sun, it was unlikely to have any effect on Earth. Download high res/video file: <a href="http://sdo.gsfc.nasa.gov/gallery/potw/item/603" rel="nofollow">sdo.gsfc.nasa.gov/gallery/potw/item/603</a> Credit: NASA/Solar Dynamics Observatory <b><a href="http://www.nasa.gov/audience/formedia/features/MP_Photo_Guidelines.html" rel="nofollow">NASA image use policy.</a></b> <b><a href="http://www.nasa.gov/centers/goddard/home/index.html" rel="nofollow">NASA Goddard Space Flight Center</a></b> enables NASA’s mission through four scientific endeavors: Earth Science, Heliophysics, Solar System Exploration, and Astrophysics. Goddard plays a leading role in NASA’s accomplishments by contributing compelling scientific knowledge to advance the Agency’s mission. <b>Follow us on <a href="http://twitter.com/NASAGoddardPix" rel="nofollow">Twitter</a></b> <b>Like us on <a href="http://www.facebook.com/pages/Greenbelt-MD/NASA-Goddard/395013845897?ref=tsd" rel="nofollow">Facebook</a></b> <b>Find us on <a href="http://instagram.com/nasagoddard?vm=grid" rel="nofollow">Instagram</a></b>
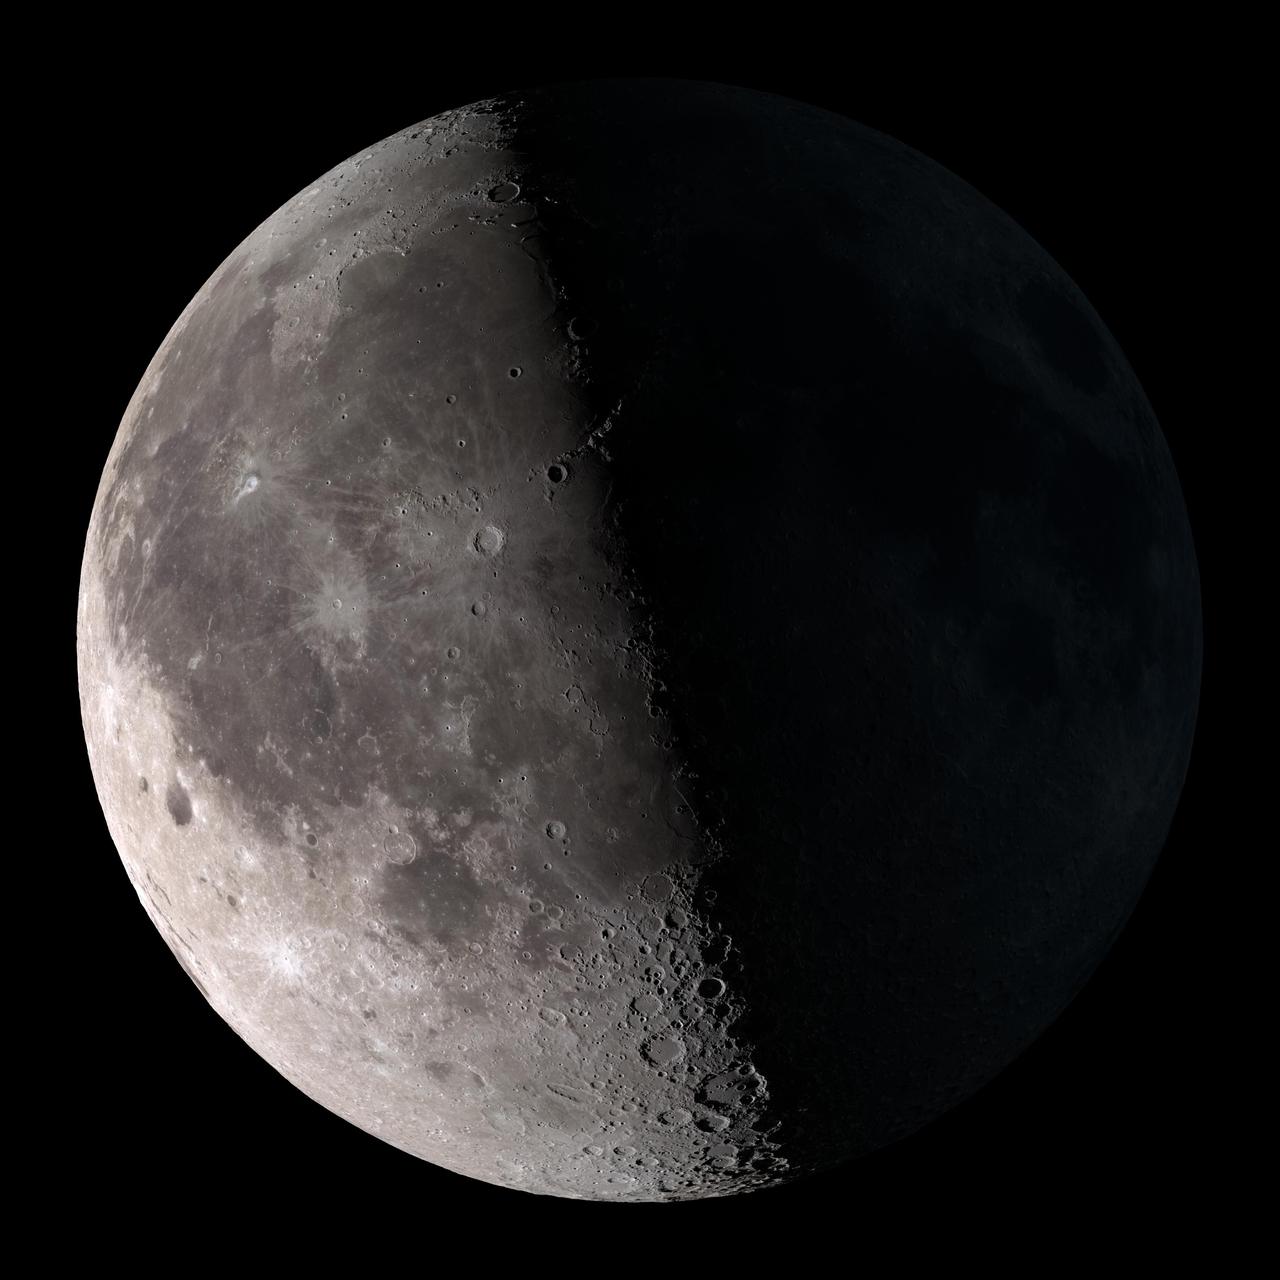
Third quarter. Rises around midnight, visible to the south after sunrise. NASA's Lunar Reconnaissance Orbiter (LRO) has been in orbit around the Moon since the summer of 2009. Its laser altimeter (LOLA) and camera (LROC) are recording the rugged, airless lunar terrain in exceptional detail, making it possible to visualize the Moon with unprecedented fidelity. This is especially evident in the long shadows cast near the terminator, or day-night line. The pummeled, craggy landscape thrown into high relief at the terminator would be impossible to recreate in the computer without global terrain maps like those from LRO. To download, learn more about this visualization, or to see what the Moon will look like at any hour in 2015, visit <a href="http://svs.gsfc.nasa.gov/goto?4236" rel="nofollow">svs.gsfc.nasa.gov/goto?4236</a> <b><a href="http://www.nasa.gov/audience/formedia/features/MP_Photo_Guidelines.html" rel="nofollow">NASA image use policy.</a></b> <b><a href="http://www.nasa.gov/centers/goddard/home/index.html" rel="nofollow">NASA Goddard Space Flight Center</a></b> enables NASA’s mission through four scientific endeavors: Earth Science, Heliophysics, Solar System Exploration, and Astrophysics. Goddard plays a leading role in NASA’s accomplishments by contributing compelling scientific knowledge to advance the Agency’s mission. <b>Follow us on <a href="http://twitter.com/NASAGoddardPix" rel="nofollow">Twitter</a></b> <b>Like us on <a href="http://www.facebook.com/pages/Greenbelt-MD/NASA-Goddard/395013845897?ref=tsd" rel="nofollow">Facebook</a></b> <b>Find us on <a href="http://instagram.com/nasagoddard?vm=grid" rel="nofollow">Instagram</a></b>
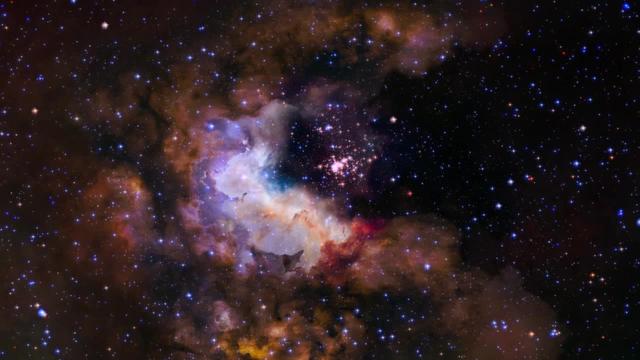
This visualization provides a three-dimensional perspective on Hubble's 25th anniversary image of the nebula Gum 29 with the star cluster Westerlund 2 at its core. The flight traverses the foreground stars and approaches the lower left rim of the nebula Gum 29. Passing through the wispy darker clouds on the near side, the journey reveals bright gas illuminated by the intense radiation of the newly formed stars of cluster Westerlund 2. Within the nebula, several pillars of dark, dense gas are being shaped by the energetic light and strong stellar winds from the brilliant cluster of thousands of stars. Note that the visualization is intended to be a scientifically reasonable interpretation and that distances within the model are significantly compressed. Download here: <a href="http://hubblesite.org/newscenter/archive/releases/2015/12/video/" rel="nofollow">hubblesite.org/newscenter/archive/releases/2015/12/video/</a> Credit: NASA, ESA, G. Bacon, L. Frattare, Z. Levay, and F. Summers (Viz3D Team, STScI), and J. Anderson (STScI) Acknowledgment: The Hubble Heritage Team (STScI/AURA), A. Nota (ESA/STScI), the Westerlund 2 Science Team, and ESO <b><a href="http://www.nasa.gov/audience/formedia/features/MP_Photo_Guidelines.html" rel="nofollow">NASA image use policy.</a></b> <b><a href="http://www.nasa.gov/centers/goddard/home/index.html" rel="nofollow">NASA Goddard Space Flight Center</a></b> enables NASA’s mission through four scientific endeavors: Earth Science, Heliophysics, Solar System Exploration, and Astrophysics. Goddard plays a leading role in NASA’s accomplishments by contributing compelling scientific knowledge to advance the Agency’s mission. <b>Follow us on <a href="http://twitter.com/NASAGoddardPix" rel="nofollow">Twitter</a></b> <b>Like us on <a href="http://www.facebook.com/pages/Greenbelt-MD/NASA-Goddard/395013845897?ref=tsd" rel="nofollow">Facebook</a></b> <b>Find us on <a href="http://instagrid.me/nasagoddard/?vm=grid" rel="nofollow">Instagram</a></b>
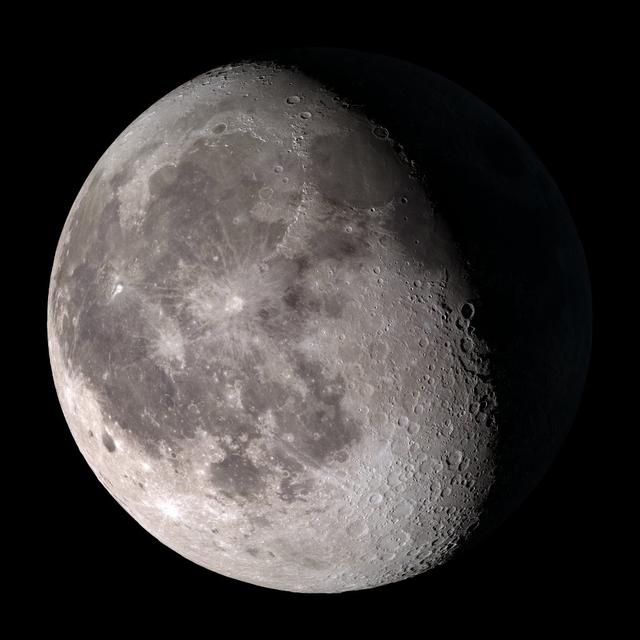
Waning gibbous. Rises after sunset, high in the sky after midnight, visible to the southwest after sunrise. NASA's Lunar Reconnaissance Orbiter (LRO) has been in orbit around the Moon since the summer of 2009. Its laser altimeter (LOLA) and camera (LROC) are recording the rugged, airless lunar terrain in exceptional detail, making it possible to visualize the Moon with unprecedented fidelity. This is especially evident in the long shadows cast near the terminator, or day-night line. The pummeled, craggy landscape thrown into high relief at the terminator would be impossible to recreate in the computer without global terrain maps like those from LRO. To download, learn more about this visualization, or to see what the Moon will look like at any hour in 2015, visit <a href="http://svs.gsfc.nasa.gov/goto?4236" rel="nofollow">svs.gsfc.nasa.gov/goto?4236</a> <b><a href="http://www.nasa.gov/audience/formedia/features/MP_Photo_Guidelines.html" rel="nofollow">NASA image use policy.</a></b> <b><a href="http://www.nasa.gov/centers/goddard/home/index.html" rel="nofollow">NASA Goddard Space Flight Center</a></b> enables NASA’s mission through four scientific endeavors: Earth Science, Heliophysics, Solar System Exploration, and Astrophysics. Goddard plays a leading role in NASA’s accomplishments by contributing compelling scientific knowledge to advance the Agency’s mission. <b>Follow us on <a href="http://twitter.com/NASAGoddardPix" rel="nofollow">Twitter</a></b> <b>Like us on <a href="http://www.facebook.com/pages/Greenbelt-MD/NASA-Goddard/395013845897?ref=tsd" rel="nofollow">Facebook</a></b> <b>Find us on <a href="http://instagram.com/nasagoddard?vm=grid" rel="nofollow">Instagram</a></b>
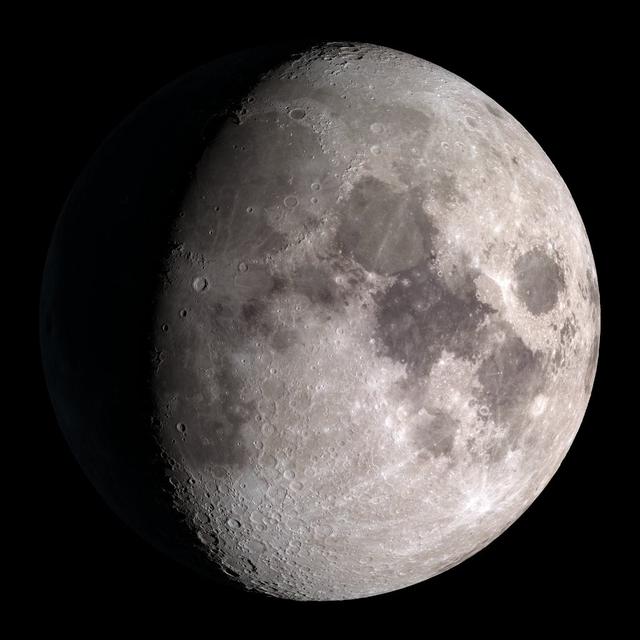
Waxing gibbous. Visible to the southeast in early evening, up for most of the night. NASA's Lunar Reconnaissance Orbiter (LRO) has been in orbit around the Moon since the summer of 2009. Its laser altimeter (LOLA) and camera (LROC) are recording the rugged, airless lunar terrain in exceptional detail, making it possible to visualize the Moon with unprecedented fidelity. This is especially evident in the long shadows cast near the terminator, or day-night line. The pummeled, craggy landscape thrown into high relief at the terminator would be impossible to recreate in the computer without global terrain maps like those from LRO. To download, learn more about this visualization, or to see what the Moon will look like at any hour in 2015, visit <a href="http://svs.gsfc.nasa.gov/goto?4236" rel="nofollow">svs.gsfc.nasa.gov/goto?4236</a> <b><a href="http://www.nasa.gov/audience/formedia/features/MP_Photo_Guidelines.html" rel="nofollow">NASA image use policy.</a></b> <b><a href="http://www.nasa.gov/centers/goddard/home/index.html" rel="nofollow">NASA Goddard Space Flight Center</a></b> enables NASA’s mission through four scientific endeavors: Earth Science, Heliophysics, Solar System Exploration, and Astrophysics. Goddard plays a leading role in NASA’s accomplishments by contributing compelling scientific knowledge to advance the Agency’s mission. <b>Follow us on <a href="http://twitter.com/NASAGoddardPix" rel="nofollow">Twitter</a></b> <b>Like us on <a href="http://www.facebook.com/pages/Greenbelt-MD/NASA-Goddard/395013845897?ref=tsd" rel="nofollow">Facebook</a></b> <b>Find us on <a href="http://instagram.com/nasagoddard?vm=grid" rel="nofollow">Instagram</a></b>
Waning crescent. Low to the east before sunrise. NASA's Lunar Reconnaissance Orbiter (LRO) has been in orbit around the Moon since the summer of 2009. Its laser altimeter (LOLA) and camera (LROC) are recording the rugged, airless lunar terrain in exceptional detail, making it possible to visualize the Moon with unprecedented fidelity. This is especially evident in the long shadows cast near the terminator, or day-night line. The pummeled, craggy landscape thrown into high relief at the terminator would be impossible to recreate in the computer without global terrain maps like those from LRO. To download, learn more about this visualization, or to see what the Moon will look like at any hour in 2015, visit <a href="http://svs.gsfc.nasa.gov/goto?4236" rel="nofollow">svs.gsfc.nasa.gov/goto?4236</a> <b><a href="http://www.nasa.gov/audience/formedia/features/MP_Photo_Guidelines.html" rel="nofollow">NASA image use policy.</a></b> <b><a href="http://www.nasa.gov/centers/goddard/home/index.html" rel="nofollow">NASA Goddard Space Flight Center</a></b> enables NASA’s mission through four scientific endeavors: Earth Science, Heliophysics, Solar System Exploration, and Astrophysics. Goddard plays a leading role in NASA’s accomplishments by contributing compelling scientific knowledge to advance the Agency’s mission. <b>Follow us on <a href="http://twitter.com/NASAGoddardPix" rel="nofollow">Twitter</a></b> <b>Like us on <a href="http://www.facebook.com/pages/Greenbelt-MD/NASA-Goddard/395013845897?ref=tsd" rel="nofollow">Facebook</a></b> <b>Find us on <a href="http://instagram.com/nasagoddard?vm=grid" rel="nofollow">Instagram</a></b>
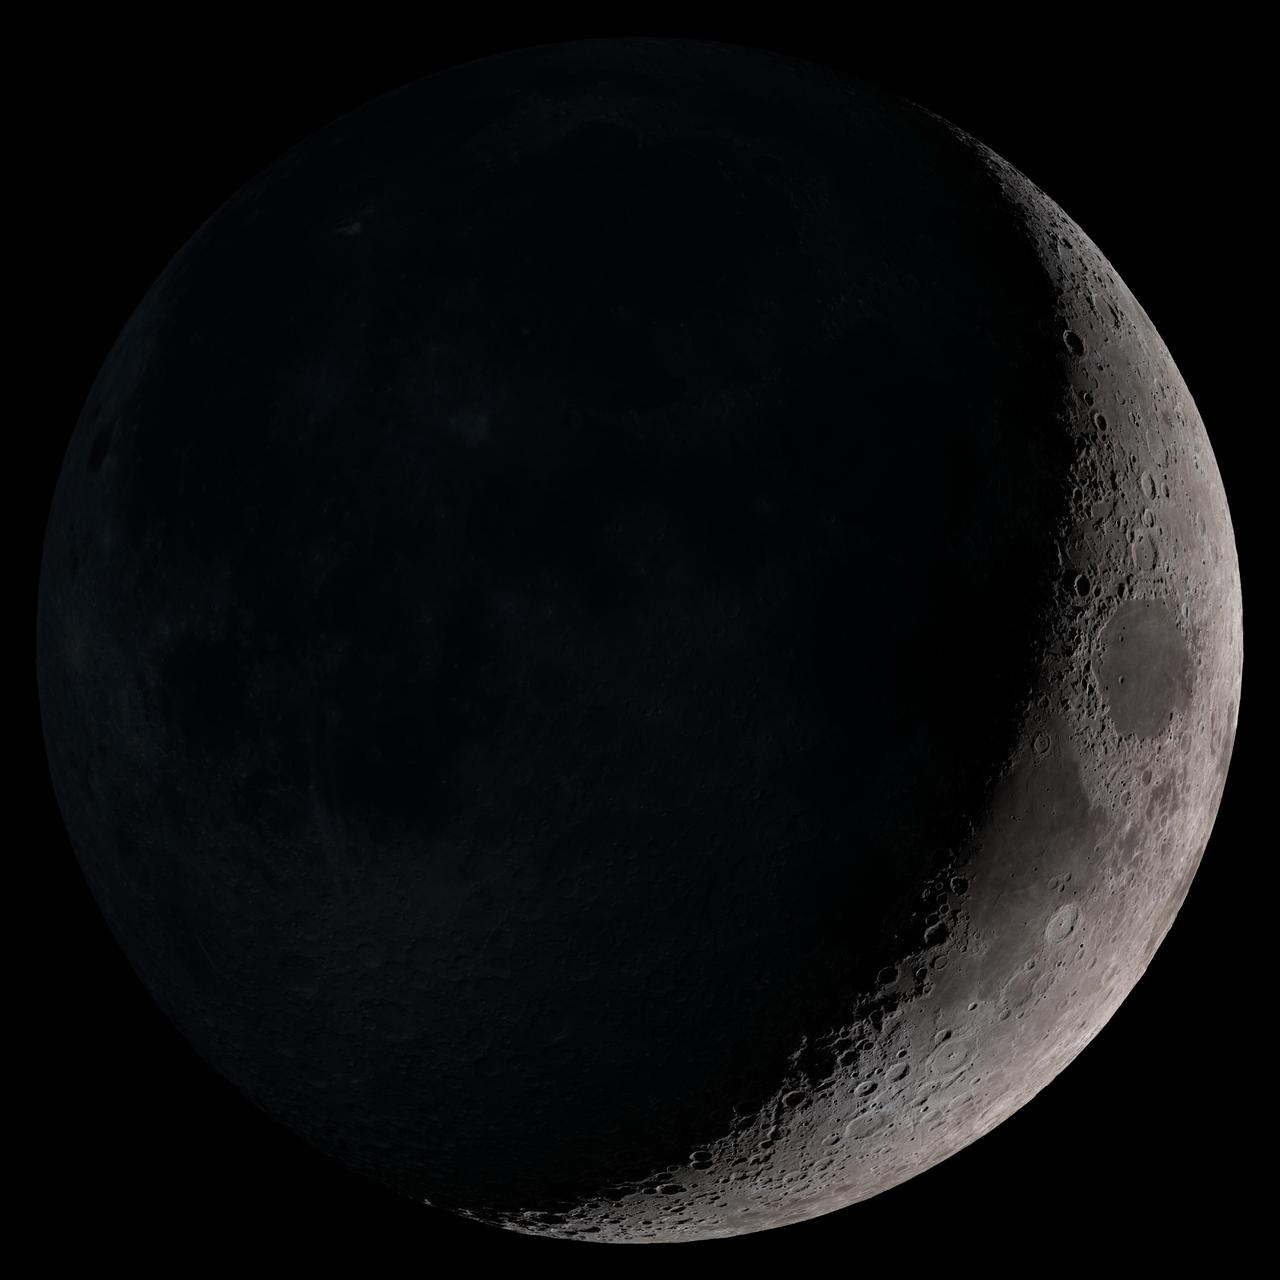
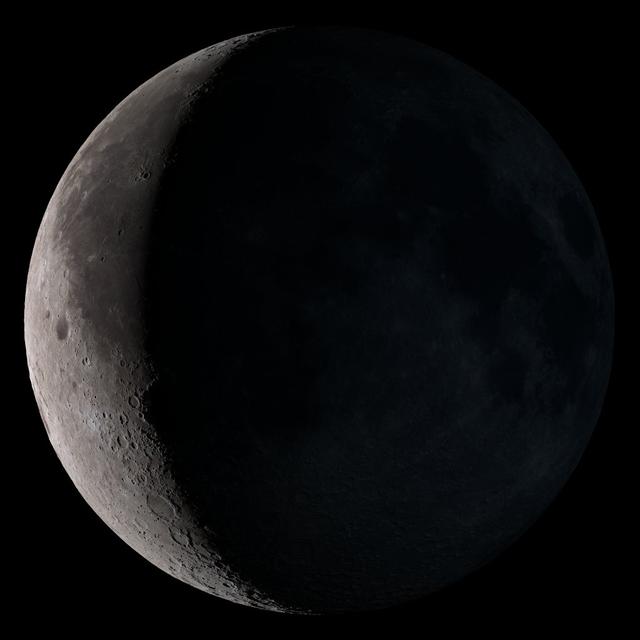
Waxing crescent. Visible toward the southwest in early evening. NASA's Lunar Reconnaissance Orbiter (LRO) has been in orbit around the Moon since the summer of 2009. Its laser altimeter (LOLA) and camera (LROC) are recording the rugged, airless lunar terrain in exceptional detail, making it possible to visualize the Moon with unprecedented fidelity. This is especially evident in the long shadows cast near the terminator, or day-night line. The pummeled, craggy landscape thrown into high relief at the terminator would be impossible to recreate in the computer without global terrain maps like those from LRO. To download, learn more about this visualization, or to see what the Moon will look like at any hour in 2015, visit <a href="http://svs.gsfc.nasa.gov/goto?4236" rel="nofollow">svs.gsfc.nasa.gov/goto?4236</a> <b><a href="http://www.nasa.gov/audience/formedia/features/MP_Photo_Guidelines.html" rel="nofollow">NASA image use policy.</a></b> <b><a href="http://www.nasa.gov/centers/goddard/home/index.html" rel="nofollow">NASA Goddard Space Flight Center</a></b> enables NASA’s mission through four scientific endeavors: Earth Science, Heliophysics, Solar System Exploration, and Astrophysics. Goddard plays a leading role in NASA’s accomplishments by contributing compelling scientific knowledge to advance the Agency’s mission. <b>Follow us on <a href="http://twitter.com/NASAGoddardPix" rel="nofollow">Twitter</a></b> <b>Like us on <a href="http://www.facebook.com/pages/Greenbelt-MD/NASA-Goddard/395013845897?ref=tsd" rel="nofollow">Facebook</a></b> <b>Find us on <a href="http://instagram.com/nasagoddard?vm=grid" rel="nofollow">Instagram</a></b>

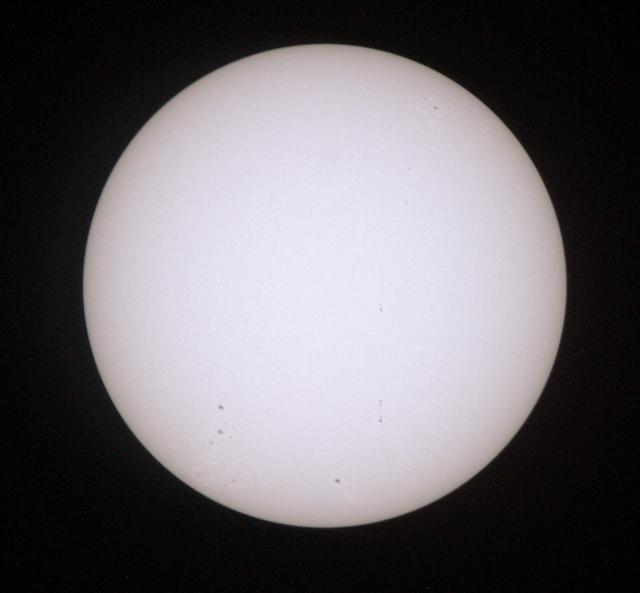
Less than once per decade, Mercury passes between the Earth and the sun in a rare astronomical event known as a planetary transit. The 2016 Mercury transit occurred on May 9th, between roughly 7:12 a.m. and 2:42 p.m. EDT. The images in this video are from NASA’s Solar Dynamics Observatory Music: Encompass by Mark Petrie For more info on the Mercury transit go to: <a href="http://www.nasa.gov/transit" rel="nofollow">www.nasa.gov/transit</a> This video is public domain and may be downloaded at: <a href="http://svs.gsfc.nasa.gov/12235" rel="nofollow">svs.gsfc.nasa.gov/12235</a> <b><a href="http://www.nasa.gov/audience/formedia/features/MP_Photo_Guidelines.html" rel="nofollow">NASA image use policy.</a></b> <b><a href="http://www.nasa.gov/centers/goddard/home/index.html" rel="nofollow">NASA Goddard Space Flight Center</a></b> enables NASA’s mission through four scientific endeavors: Earth Science, Heliophysics, Solar System Exploration, and Astrophysics. Goddard plays a leading role in NASA’s accomplishments by contributing compelling scientific knowledge to advance the Agency’s mission. <b>Follow us on <a href="http://twitter.com/NASAGoddardPix" rel="nofollow">Twitter</a></b> <b>Like us on <a href="http://www.facebook.com/pages/Greenbelt-MD/NASA-Goddard/395013845897?ref=tsd" rel="nofollow">Facebook</a></b> <b>Find us on <a href="http://instagrid.me/nasagoddard/?vm=grid" rel="nofollow">Instagram</a></b>
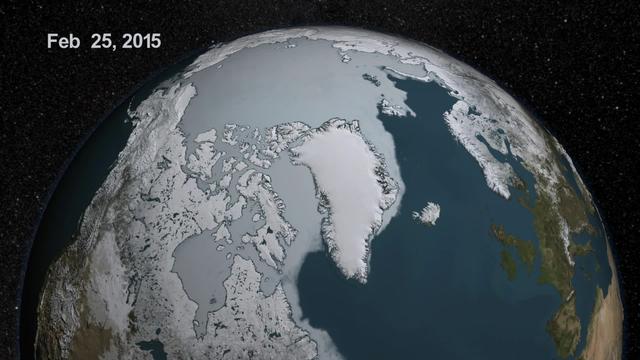
As the sun sets over the Arctic, the end of this year’s melt season is quickly approaching and the sea ice cover has already shrunk to the fourth lowest in the satellite record. With possibly some days of melting left, the sea ice extent could still drop to the second or third lowest on record. Arctic sea ice, which regulates the planet’s temperature by bouncing solar energy back to space, has been on a steep decline for the last two decades. This animation shows the evolution of Arctic sea ice in 2015, from its annual maximum wintertime extent, reached on February 25, to September 6. Credit: NASA Scientific Visualization Studio DOWNLOAD THIS VIDEO HERE: <a href="https://svs.gsfc.nasa.gov/cgi-bin/details.cgi?aid=11999" rel="nofollow">svs.gsfc.nasa.gov/cgi-bin/details.cgi?aid=11999</a> <b><a href="http://www.nasa.gov/audience/formedia/features/MP_Photo_Guidelines.html" rel="nofollow">NASA image use policy.</a></b> <b><a href="http://www.nasa.gov/centers/goddard/home/index.html" rel="nofollow">NASA Goddard Space Flight Center</a></b> enables NASA’s mission through four scientific endeavors: Earth Science, Heliophysics, Solar System Exploration, and Astrophysics. Goddard plays a leading role in NASA’s accomplishments by contributing compelling scientific knowledge to advance the Agency’s mission. <b>Follow us on <a href="http://twitter.com/NASAGoddardPix" rel="nofollow">Twitter</a></b> <b>Like us on <a href="http://www.facebook.com/pages/Greenbelt-MD/NASA-Goddard/395013845897?ref=tsd" rel="nofollow">Facebook</a></b> <b>Find us on <a href="http://instagrid.me/nasagoddard/?vm=grid" rel="nofollow">Instagram</a></b>
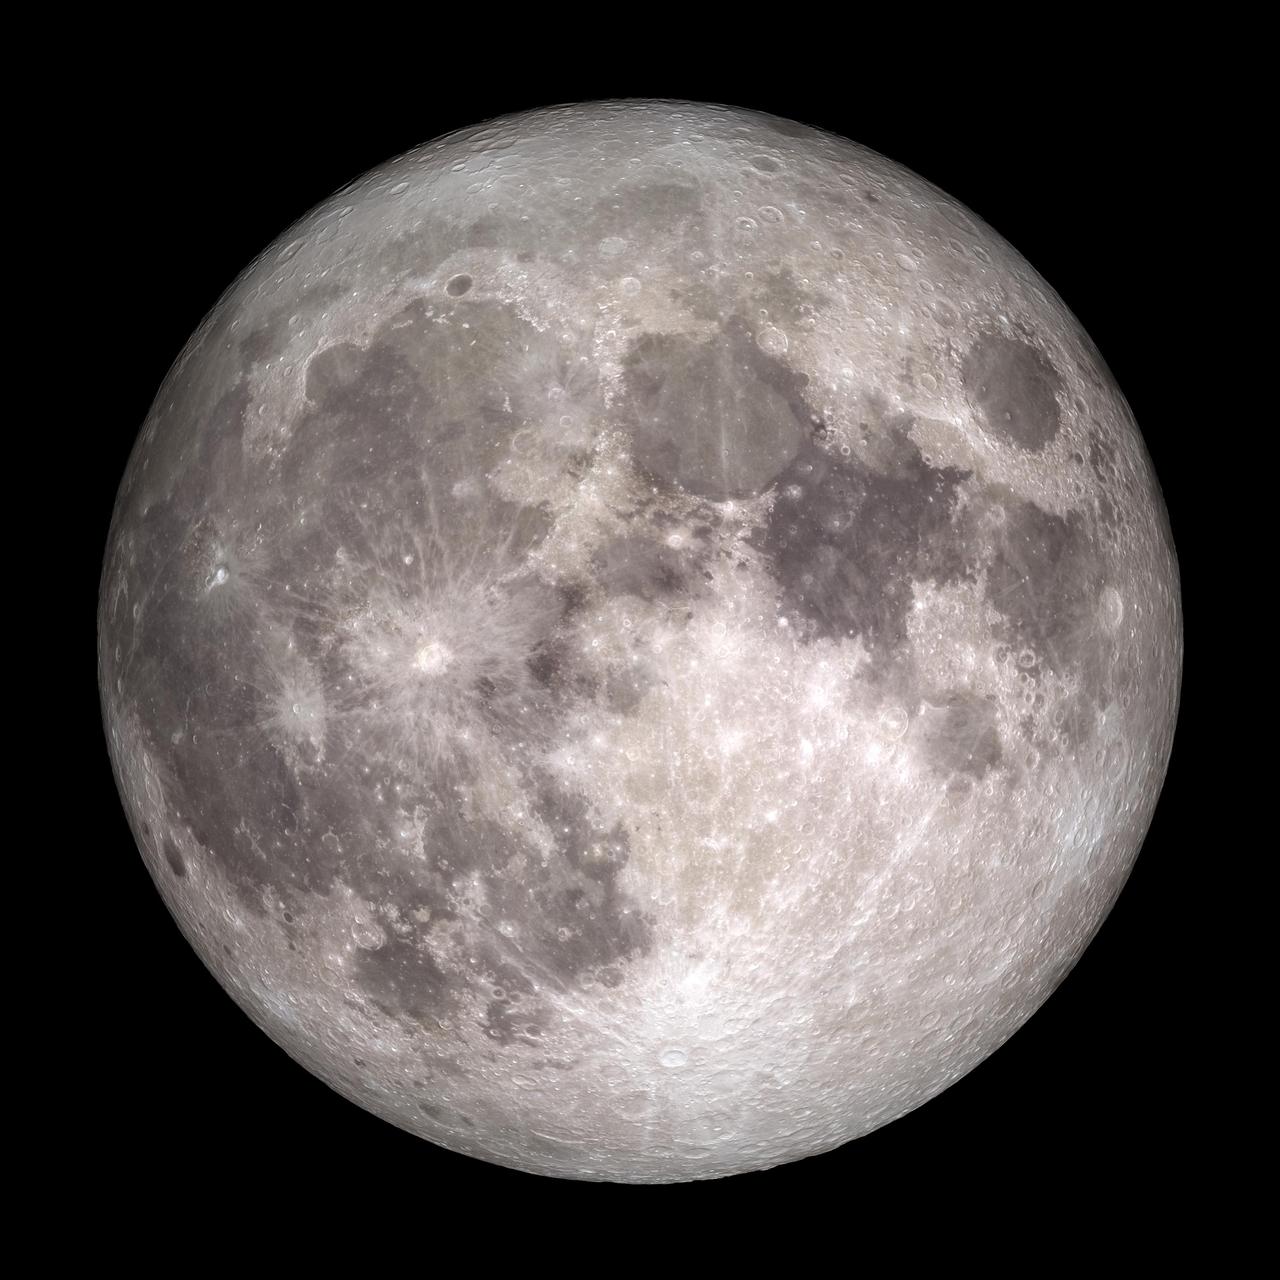
Full Moon. Rises at sunset, high in the sky around midnight. Visible all night. NASA's Lunar Reconnaissance Orbiter (LRO) has been in orbit around the Moon since the summer of 2009. Its laser altimeter (LOLA) and camera (LROC) are recording the rugged, airless lunar terrain in exceptional detail, making it possible to visualize the Moon with unprecedented fidelity. This is especially evident in the long shadows cast near the terminator, or day-night line. The pummeled, craggy landscape thrown into high relief at the terminator would be impossible to recreate in the computer without global terrain maps like those from LRO. To download, learn more about this visualization, or to see what the Moon will look like at any hour in 2015, visit <a href="http://svs.gsfc.nasa.gov/goto?4236" rel="nofollow">svs.gsfc.nasa.gov/goto?4236</a> <b><a href="http://www.nasa.gov/audience/formedia/features/MP_Photo_Guidelines.html" rel="nofollow">NASA image use policy.</a></b> <b><a href="http://www.nasa.gov/centers/goddard/home/index.html" rel="nofollow">NASA Goddard Space Flight Center</a></b> enables NASA’s mission through four scientific endeavors: Earth Science, Heliophysics, Solar System Exploration, and Astrophysics. Goddard plays a leading role in NASA’s accomplishments by contributing compelling scientific knowledge to advance the Agency’s mission. <b>Follow us on <a href="http://twitter.com/NASAGoddardPix" rel="nofollow">Twitter</a></b> <b>Like us on <a href="http://www.facebook.com/pages/Greenbelt-MD/NASA-Goddard/395013845897?ref=tsd" rel="nofollow">Facebook</a></b> <b>Find us on <a href="http://instagram.com/nasagoddard?vm=grid" rel="nofollow">Instagram</a></b>
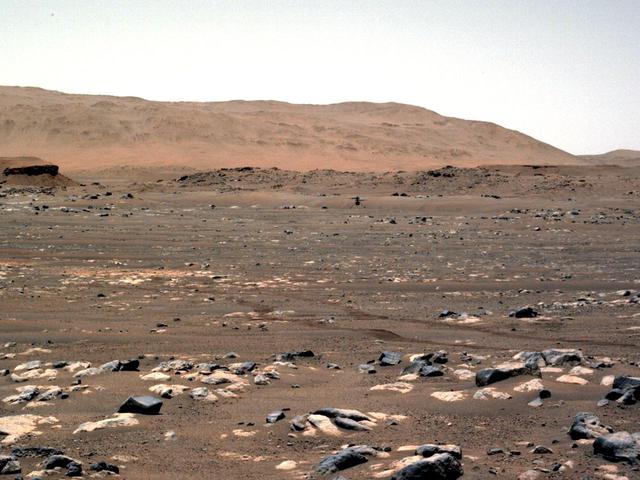
NASA's Ingenuity Mars Helicopter achieves powered, controlled flight for the first time on another planet, hovering for several seconds before touching back down on April 19, 2021. The image was taken by the left Navigation Camera, or Navcam, aboard the agency's Perseverance Mars rover from a distance of 210 feet (64 meters). A short movie was also recorded and can be downloaded here as a GIF. The Ingenuity Mars Helicopter was built by JPL, which also manages this technology demonstration project for NASA Headquarters. It is supported by NASA's Science Mission Directorate, Aeronautics Research Mission Directorate, and Space Technology Mission Directorate. NASA's Ames Research Center and Langley Research Center provided significant flight performance analysis and technical assistance during Ingenuity's development. A key objective for Perseverance's mission on Mars is astrobiology, including the search for signs of ancient microbial life. The rover will characterize the planet's geology and past climate, pave the way for human exploration of the Red Planet, and be the first mission to collect and cache Martian rock and regolith (broken rock and dust). Subsequent NASA missions, in cooperation with ESA (European Space Agency), would send spacecraft to Mars to collect these sealed samples from the surface and return them to Earth for in-depth analysis. The Mars 2020 Perseverance mission is part of NASA's Moon to Mars exploration approach, which includes Artemis missions to the Moon that will help prepare for human exploration of the Red Planet. Animation available at https://photojournal.jpl.nasa.gov/catalog/PIA24586
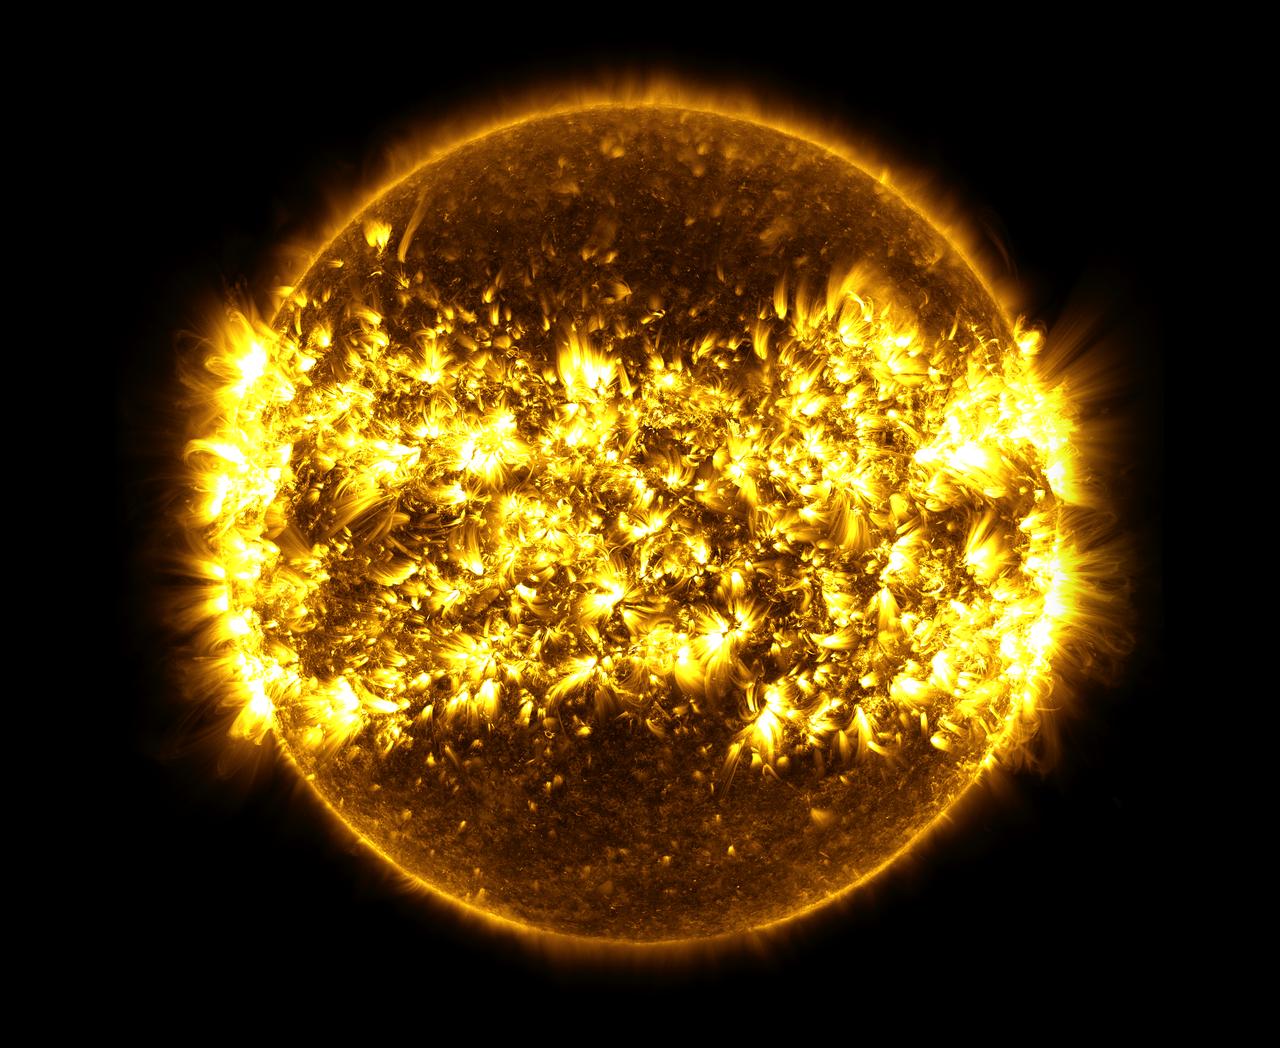
This image, is a composite of 23 separate images spanning the period of January 11, 2015 to January 21, 2016. It uses the SDO AIA wavelength of 171 angstroms and reveals the zones on the sun where active regions are most common during this part of the solar cycle. There are wallpapers sized for some phones and tablets available to download here: <a href="https://svs.gsfc.nasa.gov/cgi-bin/details.cgi?aid=12144#.Vr4_WtIQzrs.twitter" rel="nofollow">svs.gsfc.nasa.gov/cgi-bin/details.cgi?aid=12144#.Vr4_WtIQ...</a> Credit: NASA's Goddard Space Flight Center/SDO/S. Wiessinger <b><a href="http://www.nasa.gov/audience/formedia/features/MP_Photo_Guidelines.html" rel="nofollow">NASA image use policy.</a></b> <b><a href="http://www.nasa.gov/centers/goddard/home/index.html" rel="nofollow">NASA Goddard Space Flight Center</a></b> enables NASA’s mission through four scientific endeavors: Earth Science, Heliophysics, Solar System Exploration, and Astrophysics. Goddard plays a leading role in NASA’s accomplishments by contributing compelling scientific knowledge to advance the Agency’s mission. <b>Follow us on <a href="http://twitter.com/NASAGoddardPix" rel="nofollow">Twitter</a></b> <b>Like us on <a href="http://www.facebook.com/pages/Greenbelt-MD/NASA-Goddard/395013845897?ref=tsd" rel="nofollow">Facebook</a></b> <b>Find us on <a href="http://instagrid.me/nasagoddard/?vm=grid" rel="nofollow">Instagram</a></b>

This visualization shows the Moon's phase and libration at hourly intervals throughout 2015, as viewed from the northern hemisphere. Each frame represents one hour. Lunar Reconnaissance Orbiter (LRO) has been in orbit around the Moon since the summer of 2009. Its laser altimeter (LOLA) and camera (LROC) are recording the rugged, airless lunar terrain in exceptional detail, making it possible to visualize the Moon with unprecedented fidelity. This is especially evident in the long shadows cast near the terminator, or day-night line. The pummeled, craggy landscape thrown into high relief at the terminator would be impossible to recreate in the computer without global terrain maps like those from LRO. To download, learn more about this visualization, or to see what the Moon will look like at any hour in 2015, visit <a href="http://svs.gsfc.nasa.gov/goto?4236" rel="nofollow">svs.gsfc.nasa.gov/goto?4236</a> <b><a href="http://www.nasa.gov/audience/formedia/features/MP_Photo_Guidelines.html" rel="nofollow">NASA image use policy.</a></b> <b><a href="http://www.nasa.gov/centers/goddard/home/index.html" rel="nofollow">NASA Goddard Space Flight Center</a></b> enables NASA’s mission through four scientific endeavors: Earth Science, Heliophysics, Solar System Exploration, and Astrophysics. Goddard plays a leading role in NASA’s accomplishments by contributing compelling scientific knowledge to advance the Agency’s mission. <b>Follow us on <a href="http://twitter.com/NASAGoddardPix" rel="nofollow">Twitter</a></b> <b>Like us on <a href="http://www.facebook.com/pages/Greenbelt-MD/NASA-Goddard/395013845897?ref=tsd" rel="nofollow">Facebook</a></b> <b>Find us on <a href="http://instagram.com/nasagoddard?vm=grid" rel="nofollow">Instagram</a></b>

Aug 30, 2011 USGS has released a new mosaic of the Chesapeake Bay. Using six Landsat 5 images collected in July 2009 and 2011 a beautiful, seamless mosaic of the Chesapeake Bay region was created by the USGS Landsat team. The Washington D.C.-Baltimore-Philadelphia-New York City corridor can be clearly seen (look for silvery purple) as can the Chesapeake and Delaware Bays and the coastal Atlantic barrier islands from Fishermans Island, Virginia to Sandy Hook, New Jersey. To download the full high res go to: <a href="http://landsat.gsfc.nasa.gov/news/news-archive/news_0387.html" rel="nofollow">landsat.gsfc.nasa.gov/news/news-archive/news_0387.html</a> Credit: NASA/USGS/Landsat 5 <b><a href="http://www.nasa.gov/centers/goddard/home/index.html" rel="nofollow">NASA Goddard Space Flight Center</a></b> enables NASA’s mission through four scientific endeavors: Earth Science, Heliophysics, Solar System Exploration, and Astrophysics. Goddard plays a leading role in NASA’s accomplishments by contributing compelling scientific knowledge to advance the Agency’s mission. <b>Follow us on <a href="http://twitter.com/NASA_GoddardPix" rel="nofollow">Twitter</a></b> <b>Like us on <a href="http://www.facebook.com/pages/Greenbelt-MD/NASA-Goddard/395013845897?ref=tsd" rel="nofollow">Facebook</a></b> <b>Find us on <a href="http://instagrid.me/nasagoddard/?vm=grid" rel="nofollow">Instagram</a></b>
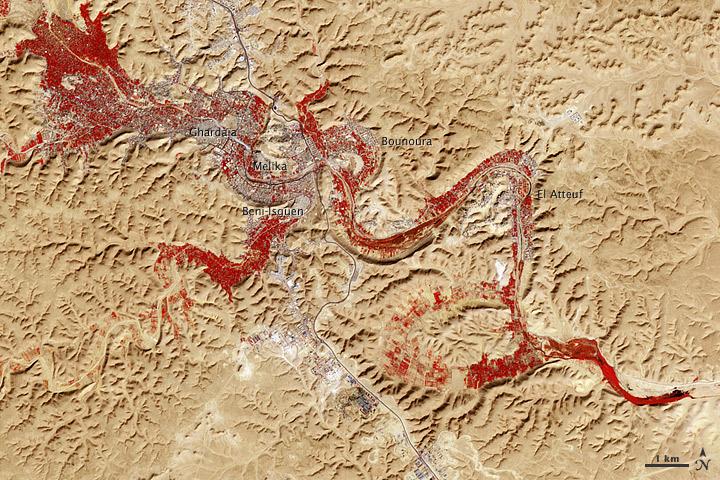
NASA image acquired Feb. 9, 2011 Less than 5 percent of Algeria’s land surface is suitable for growing crops, and most precipitation falls on the Atlas Mountains along the coast. Inland, dust-laden winds blow over rocky plains and sand seas. However, in north central Algeria—off the tip of Grand Erg Occidental and about 450 kilometers (280 miles) south of Algiers—lies a serpentine stretch of vegetation. It is the M’zab Valley, filled with palm groves and dotted with centuries-old settlements. The Advanced Spaceborne Thermal Emission and Reflection Radiometer (ASTER) on NASA’s Terra satellite captured this image of M’zab Valley on February 9, 2011. ASTER combines infrared, red, and green wavelengths of light. Bare rock ranges in color from beige to peach. Buildings and paved surfaces appear gray. Vegetation is red, and brighter shades of red indicate more robust vegetation. This oasis results from water that is otherwise in short supply in the Sahara Desert, thanks to the valley’s approximately 3,000 wells. Chemical analysis of Algerian aquifers, as well studies of topography in Algeria and Tunisia, suggest this region experienced a cooler climate in the late Pleistocene, and potentially heavy monsoon rains earlier in the Holocene. The M’zab region shows evidence of meandering rivers and pinnate drainage patterns. The vegetation lining M’zab Valley highlights this old river valley’s contours. Cool summer temperatures and monsoon rains had long since retreated from the region by eleventh century, but this valley nevertheless supported the establishment of multiple fortified settlements, or ksours. Between 1012 A.D. and 1350 A.D., locals established the ksours of El-Atteuf, Bounoura, Melika, Ghardaïa, and Beni-Isguen. Collectively these cities are now a United Nations Educational, Scientific, and Cultural Organization (UNESCO) World Heritage site. NASA Earth Observatory image by Robert Simmon and Jesse Allen, using data from the GSFC/METI/ERSDAC/JAROS, and U.S./Japan ASTER Science Team. Caption by Michon Scott. Instrument: Terra - ASTER <b>To download the full high res file go <a href="http://earthobservatory.nasa.gov/IOTD/view.php?id=51296" rel="nofollow"> here</a></b>

Flight Test in the Roverscape (N-269) at NASA's Ames Research Center, the project team tests the DJI Matrice 600 Unmanned Aerial Vehicle (UAV) equipped with a radio tracking receiver to study the invasive asian carp in the Mississippi River.
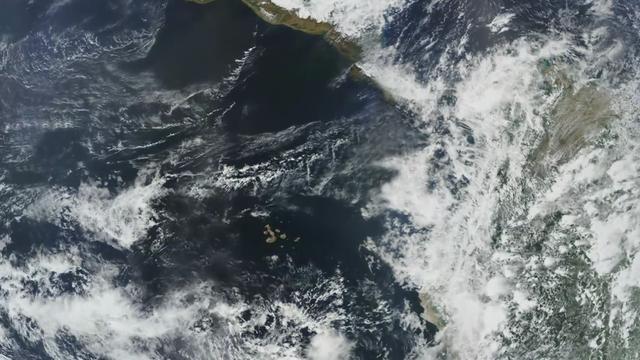
Completed: 07-16-2009 Straddling the equator approximately 1000 kilometers to the west of the South American mainland, the Galapagos Islands lie within the heart of the equatorial current system. Rising from the sea floor, the volcanic islands of the Galapagos are set on top of a large submarine platform. The main portion of the Galapagos platform is relatively flat and less than 1000 meters in depth. The steepest slopes are found along the western and southern flanks of the platform with a gradual slope towards the east. The interactions of the Galapagos and the oceanic currents create vastly different environmental regimes which not only isolates one part of the Archipelago from the other but allows penguins to live along the equator on the western part of the Archipelago and tropical corals around the islands to the north. The islands are relatively new in geologic terms with the youngest islands in the west still exhibiting periodic eruptions from their massive volcanic craters. Please give credit for this item to: NASA/Goddard Space Flight Center, The SeaWiFS Project and GeoEye, Scientific Visualization Studio. NOTE: All SeaWiFS images and data presented on this web site are for research and educational use only. All commercial use of SeaWiFS data must be coordinated with GeoEye (http://www.geoeye.com). To download this video go to: <a href="http://svs.gsfc.nasa.gov/goto?3628" rel="nofollow">svs.gsfc.nasa.gov/goto?3628</a> <b><a href="http://www.nasa.gov/centers/goddard/home/index.html" rel="nofollow">NASA Goddard Space Flight Center</a></b> is home to the nation's largest organization of combined scientists, engineers and technologists that build spacecraft, instruments and new technology to study the Earth, the sun, our solar system, and the universe.
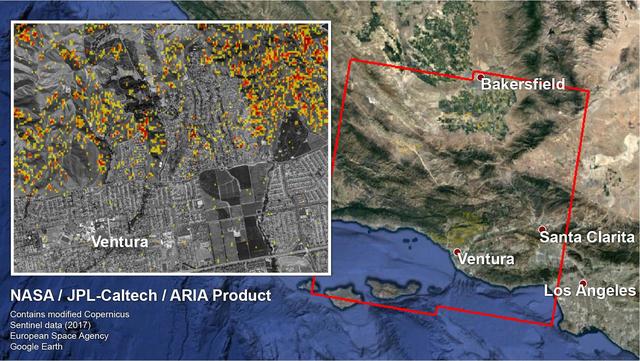
The Advanced Rapid Imaging and Analysis (ARIA) team at NASA's Jet Propulsion Laboratory in Pasadena, California, and Caltech, also in Pasadena, created a Damage Proxy Map (DPM) depicting areas in Southern California that are likely damaged (shown by red and yellow pixels) as a result of recent wildfires, including the Thomas Fire in Ventura and Santa Barbara Counties, highlighted in the attached image taken from the DPM. The map is derived from synthetic aperture radar (SAR) images from the Copernicus Sentinel-1 satellites, operated by the European Space Agency (ESA). The images were taken before (Nov. 28, 2017, 6 a.m. PST) and after (Dec. 10, 2017, 6 a.m. PST) the onset of the fires. The map covers an area of 107 by 107 miles (172 by 172 kilometers), shown by the large red polygon. Each pixel measures about 33 yards (30 meters) across. The color variation from yellow to red indicates increasingly more significant ground surface change. Preliminary validation was done by comparing the map to optical satellite imagery from DigitalGlobe. This damage proxy map should be used as guidance to identify damaged areas, and may be less reliable over vegetated areas. For example, the colored pixels seen over mountainous areas may seem a little scattered even though the reality could be that the contiguous areas were burned. Patches of farmland can also appear as signals due to plowing or irrigation. The full map is available to download from https://aria-share.jpl.nasa.gov/events/20171210-SoCal_Fire/. https://photojournal.jpl.nasa.gov/catalog/PIA22191

NASA image acquired September 6, 2010 The Matusevich Glacier flows toward the coast of East Antarctica, pushing through a channel between the Lazarev Mountains and the northwestern tip of the Wilson Hills. Constrained by surrounding rocks, the river of ice holds together. But stresses resulting from the glacier’s movement make deep crevasses, or cracks, in the ice. After passing through the channel, the glacier has room to spread out as it floats on the ocean. The expanded area and the jostling of ocean waves prompts the ice to break apart, which it often does along existing crevasses. On September 6, 2010, the Advanced Land Imager (ALI) on NASA’s Earth Observing-1 (EO-1) satellite captured this natural-color image of the margin of Matusevich Glacier. Shown here just past the rock-lined channel, the glacier is calving large icebergs. Low-angled sunlight illuminates north-facing surfaces and casts long shadows to the south. Fast ice anchored to the shore surrounds both the glacier tongue and the icebergs it has calved. Compared to the glacier and icebergs, the fast ice is thinner with a smoother surface. Out to sea (image left), the sea ice is even thinner and moves with winds and currents. Matusevich Glacier does not drain a significant amount of ice off of the Antarctic continent, so the glacier’s advances and retreats lack global significance. Like other Antarctic glaciers, however, Matusevich helps glaciologists form a larger picture of Antarctica’s glacial health and ice sheet volume. NASA Earth Observatory image created by Jesse Allen and Robert Simmon, using EO-1 ALI data provided courtesy of the NASA EO-1 team. Caption by Michon Scott based on image interpretation by Robert Bindschadler, NASA Goddard Space Flight Center, and Walt Meier, National Snow and Ice Data Center. Instrument: EO-1 - ALI Credit: <b><a href="http://www.earthobservatory.nasa.gov/" rel="nofollow"> NASA Earth Observatory</a></b> <b><a href="http://www.nasa.gov/centers/goddard/home/index.html" rel="nofollow">NASA Goddard Space Flight Center</a></b> enables NASA’s mission through four scientific endeavors: Earth Science, Heliophysics, Solar System Exploration, and Astrophysics. Goddard plays a leading role in NASA’s accomplishments by contributing compelling scientific knowledge to advance the Agency’s mission. <b>Follow us on <a href="http://twitter.com/NASA_GoddardPix" rel="nofollow">Twitter</a></b> <b>Join us on <a href="http://www.facebook.com/pages/Greenbelt-MD/NASA-Goddard/395013845897?ref=tsd" rel="nofollow">Facebook</a></b> To download the full resolution image go to: <a href="http://earthobservatory.nasa.gov/IOTD/view.php?id=46840" rel="nofollow">earthobservatory.nasa.gov/IOTD/view.php?id=46840</a>
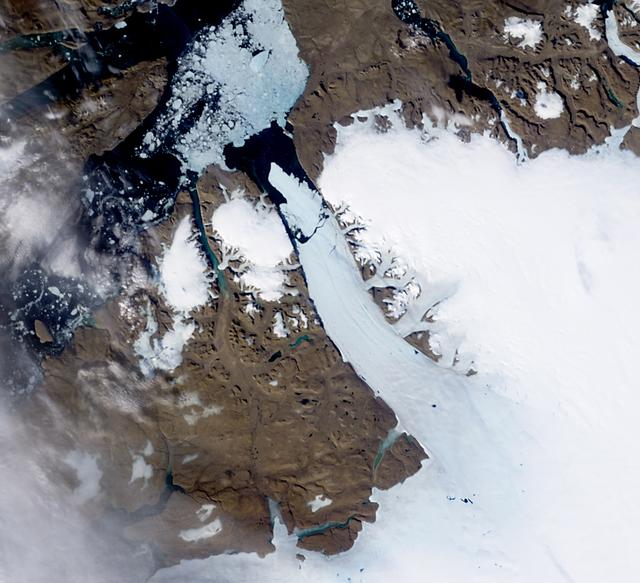
NASA image acquired August 5, 2010 On August 5, 2010, an enormous chunk of ice, roughly 97 square miles (251 square kilometers) in size, broke off the Petermann Glacier, along the northwestern coast of Greenland. The Canadian Ice Service detected the remote event within hours in near real-time data from the Moderate Resolution Imaging Spectroradiometer (MODIS) on NASA’s Aqua satellite. The Peterman Glacier lost about one-quarter of its 70-kilometer (40-mile) long floating ice shelf, said researchers who analyzed the satellite data at the University of Delaware. The Moderate Resolution Imaging Spectroradiometer (MODIS) on NASA’s Terra satellite captured these natural-color images of Petermann Glacier 18:05 UTC on August 5, 2010 (top), and 17:15 UTC on July 28, 2010 (bottom). The Terra image of the Petermann Glacier on August 5 was acquired almost 10 hours after the Aqua observation that first recorded the event. By the time Terra took this image, skies were less cloudy than they had been earlier in the day, and the oblong iceberg had broken free of the glacier and moved a short distance down the fjord. Icebergs calving off the Petermann Glacier are not unusual. Petermann Glacier’s floating ice tongue is the Northern Hemisphere’s largest, and it has occasionally calved large icebergs. The recently calved iceberg is the largest to form in the Arctic since 1962, said the University of Delaware. To read more and or to download the high res go here: <a href="http://www.nasa.gov/topics/earth/features/petermann-calve.html" rel="nofollow">www.nasa.gov/topics/earth/features/petermann-calve.html</a> or Click here to see more images from <b><a href="#//earthobservatory.nasa.gov/" rel="nofollow"> NASA Goddard’s Earth Observatory</a></b> NASA Earth Observatory image created by Jesse Allen and Robert Simmon, using data obtained from the Goddard Level 1 and Atmospheric Archive and Distribution System (LAADS). Caption by Holli Riebeek and Michon Scott. Instrument: Terra - MODIS <b><a href="http://www.nasa.gov/centers/goddard/home/index.html" rel="nofollow">NASA Goddard Space Flight Center</a></b> is home to the nation's largest organization of combined scientists, engineers and technologists that build spacecraft, instruments and new technology to study the Earth, the sun, our solar system, and the universe. <b>Follow us on <a href="http://twitter.com/NASA_GoddardPix" rel="nofollow">Twitter</a></b> <b>Join us on <a href="http://www.facebook.com/pages/Greenbelt-MD/NASA-Goddard/395013845897?ref=tsd" rel="nofollow">Facebook</a><b></b></b>
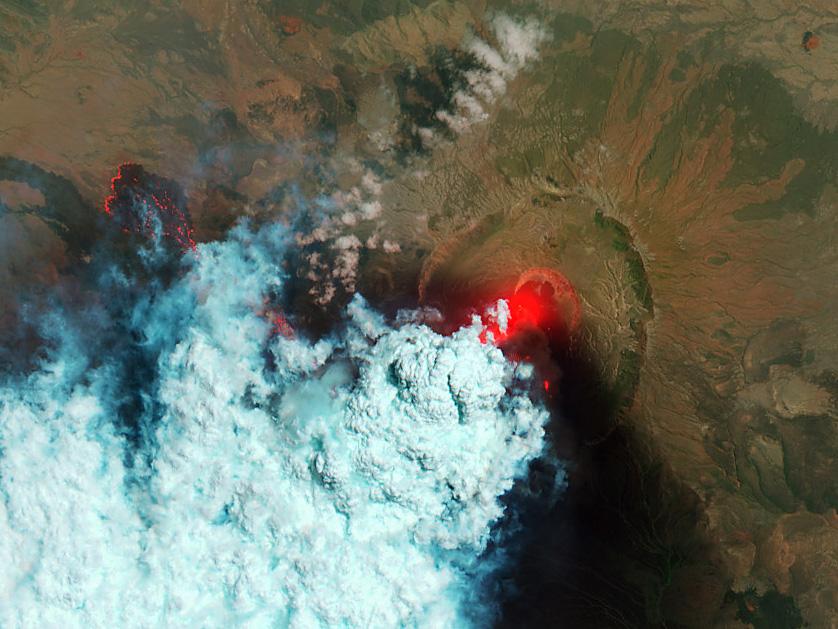
NASA image acquired June 24, 2011 Since it began erupting on June 12, 2011, emissions from Eritrea’s Nabro Volcano have drifted over much of East Africa and the Middle East. Ash has displaced residents living near the volcano and disrupted flights in the region. Despite the volcano’s widespread effects, little is known about the eruption. Nabro is located in an isolated region along the border between Eritrea and Ethiopia, and few English-language reports have been published. Satellite remote sensing is currently the only reliable way to monitor the ongoing eruption. This satellite image is among the first detailed pictures of the erupting vent and lava flows. They were acquired by the Advanced Land Imager (ALI) aboard the Earth Observing-1 (EO-1) satellite on June 24, 2011. The bright red portions of the false-color image (top) indicate hot surfaces. Hot volcanic ash glows above the vent, located in the center of Nabro’s caldera. To the west of the vent, portions of an active lava flow (particularly the front of the flow) are also hot. The speckled pattern on upstream portions of the flow are likely due to the cool, hardened crust splitting and exposing fluid lava as the flow advances. The bulbous blue-white cloud near the vent is likely composed largely of escaping water vapor that condensed as the plume rose and cooled. The whispy, cyan clouds above the lava flow are evidence of degassing from the lava. NASA Earth Observatory image by Robert Simmon, using EO-1 ALI data. Caption by Robert Simmon. Instrument: EO-1 - ALI To download the high res go here: <a href="http://earthobservatory.nasa.gov/IOTD/view.php?id=51216" rel="nofollow">earthobservatory.nasa.gov/IOTD/view.php?id=51216</a> <b><a href="http://www.nasa.gov/centers/goddard/home/index.html" rel="nofollow">NASA Goddard Space Flight Center</a></b> enables NASA’s mission through four scientific endeavors: Earth Science, Heliophysics, Solar System Exploration, and Astrophysics. Goddard plays a leading role in NASA’s accomplishments by contributing compelling scientific knowledge to advance the Agency’s mission. <b>Follow us on <a href="http://twitter.com/NASA_GoddardPix" rel="nofollow">Twitter</a></b> <b>Like us on <a href="http://www.facebook.com/pages/Greenbelt-MD/NASA-Goddard/395013845897?ref=tsd" rel="nofollow">Facebook</a></b> <b>Find us on <a href="http://web.stagram.com/n/nasagoddard/?vm=grid" rel="nofollow">Instagram</a></b>
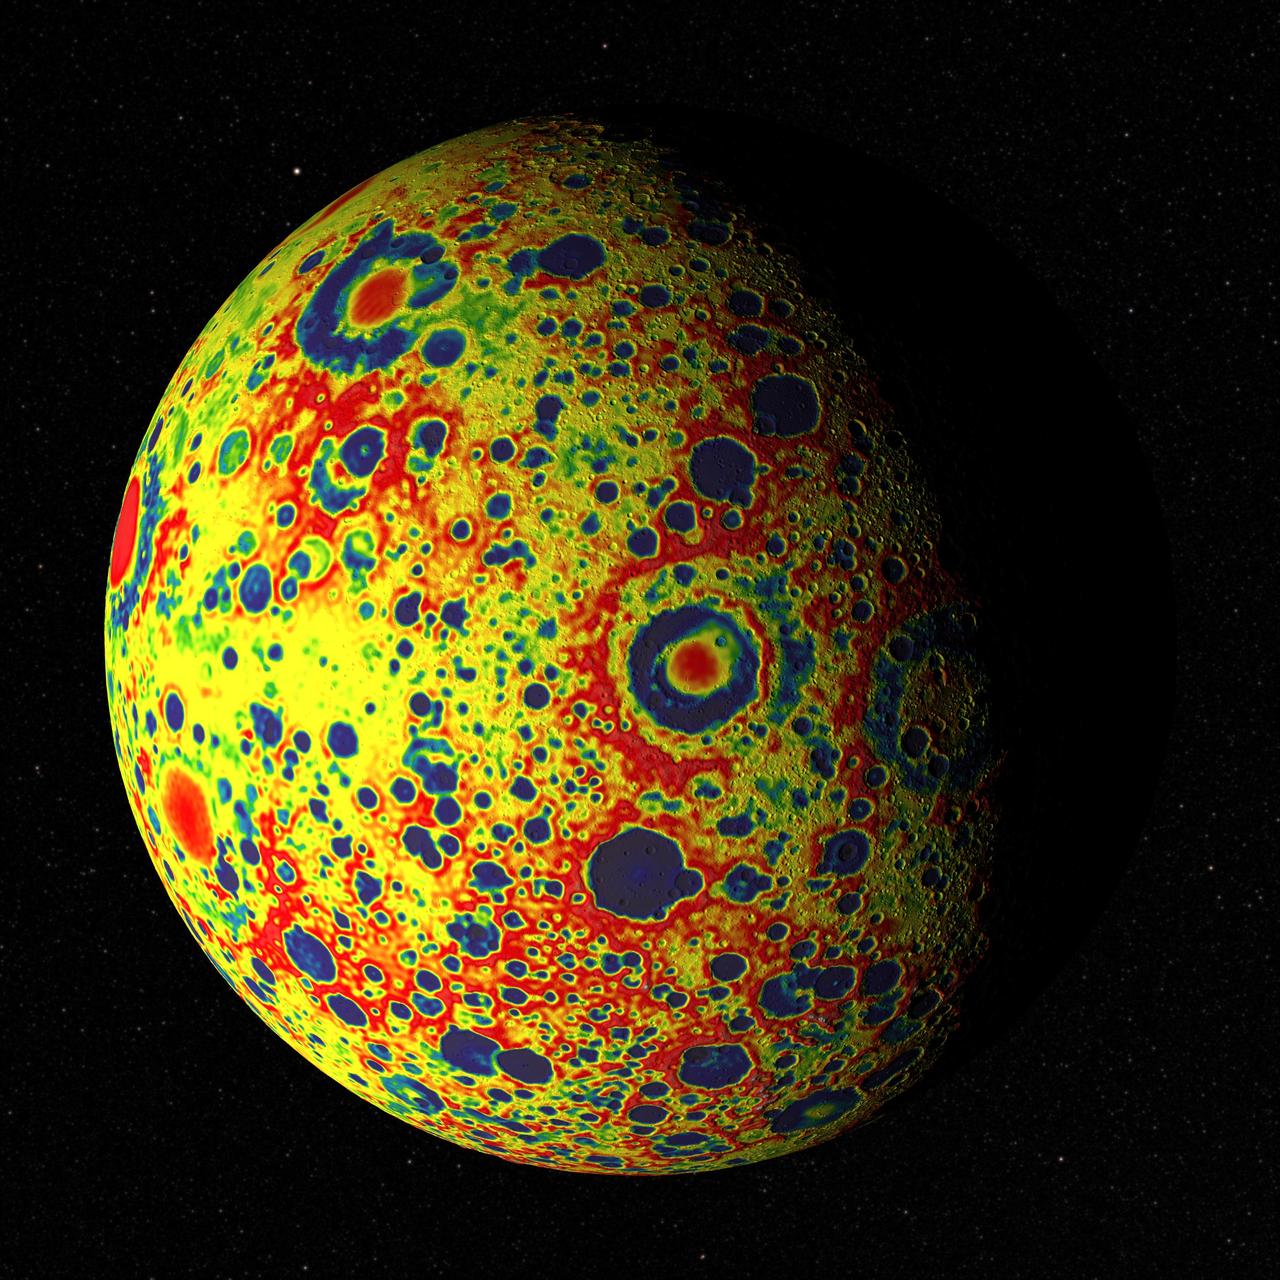
If the Moon were a perfectly smooth sphere of uniform density, the gravity map would be a single, featureless color, indicating that the force of gravity at a given elevation was the same everywhere. But like other rocky bodies in the solar system, including Earth, the Moon has both a bumpy surface and a lumpy interior. Spacecraft in orbit around the Moon experience slight variations in gravity caused by both of these irregularities. The free-air gravity map shows deviations from the mean, the gravity that a cueball Moon would have. The deviations are measured in milliGals, a unit of acceleration. On the map, dark purple is at the low end of the range, at around -400 mGals, and red is at the high end near +400 mGals. Yellow denotes the mean. These views show a part of the Moon's surface that's never visible from Earth. They are centered on lunar coordinates 29°N 142°E. The large, multi-ringed impact feature near the center is Mare Moscoviense. The crater Mendeleev is south of this. The digital elevation model for the terrain is from the Lunar Reconnaissance Orbiter laser altimeter (LOLA). Merely for plausibility, the sun angle and starry background are accurate for specific dates (December 21, 2012, 0:00 UT and January 8, 2013, 14:00 UT, respectively). To see or download more views go to: <a href="http://svs.gsfc.nasa.gov/goto?4041" rel="nofollow">svs.gsfc.nasa.gov/goto?4041</a> Credit: NASA's Goddard Goddard Space Flight Center Scientific Visualization Studio <b><a href="http://www.nasa.gov/audience/formedia/features/MP_Photo_Guidelines.html" rel="nofollow">NASA image use policy.</a></b> <b><a href="http://www.nasa.gov/centers/goddard/home/index.html" rel="nofollow">NASA Goddard Space Flight Center</a></b> enables NASA’s mission through four scientific endeavors: Earth Science, Heliophysics, Solar System Exploration, and Astrophysics. Goddard plays a leading role in NASA’s accomplishments by contributing compelling scientific knowledge to advance the Agency’s mission. <b>Follow us on <a href="http://twitter.com/NASA_GoddardPix" rel="nofollow">Twitter</a></b> <b>Like us on <a href="http://www.facebook.com/pages/Greenbelt-MD/NASA-Goddard/395013845897?ref=tsd" rel="nofollow">Facebook</a></b> <b>Find us on <a href="http://instagram.com/nasagoddard?vm=grid" rel="nofollow">Instagram</a></b>
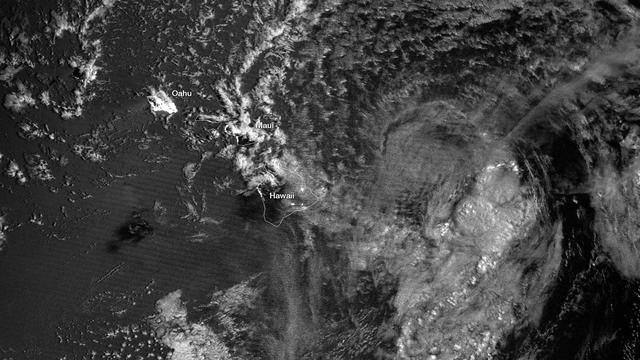
The enhanced capabilities of the Suomi NPP satellite's day-night band are really becoming clear, as was seen this week when Tropical Storm Flossie was heading toward Hawaii. On Monday, July 29th, the lack of organization of the system made it difficult to understand the storm’s central circulation. Infrared data, though able to provide cloud imagery during the night, is best at measuring cloud-top properties. Flossie, however, had a lower-level circulation that was evident in visible imagery earlier in the day. At nighttime that information was lost using traditional satellite technology, such as GOES West. The day-night-band on Suomi NPP provides visible-like information during nighttime hours when only moonlight is available. When Suomi NPP passed over the storm around 1:00am (local), the day-night band imagery allowed forecasters to identify a center of circulation that was more north than previously estimated. Two passes from Suomi NPP (at 11 and 12z, respectively) are shown here. The spiral of the lower level clouds and center of circulation can be seen northwest of Hawaii, whereas the more detailed and higher cloud top areas are due east of the Big Island. Also visible are the nighttime lights of Honolulu on Oahu, along with other cities throughout the island chain. Credit NASA/NOAA An unlabeled version may be downloaded here: <a href="http://1.usa.gov/1bOjhN6" rel="nofollow">1.usa.gov/1bOjhN6</a> <b><a href="http://www.nasa.gov/audience/formedia/features/MP_Photo_Guidelines.html" rel="nofollow">NASA image use policy.</a></b> <b><a href="http://www.nasa.gov/centers/goddard/home/index.html" rel="nofollow">NASA Goddard Space Flight Center</a></b> enables NASA’s mission through four scientific endeavors: Earth Science, Heliophysics, Solar System Exploration, and Astrophysics. Goddard plays a leading role in NASA’s accomplishments by contributing compelling scientific knowledge to advance the Agency’s mission. <b>Follow us on <a href="http://twitter.com/NASA_GoddardPix" rel="nofollow">Twitter</a></b> <b>Like us on <a href="http://www.facebook.com/pages/Greenbelt-MD/NASA-Goddard/395013845897?ref=tsd" rel="nofollow">Facebook</a></b> <b>Find us on <a href="http://instagram.com/nasagoddard?vm=grid" rel="nofollow">Instagram</a></b>
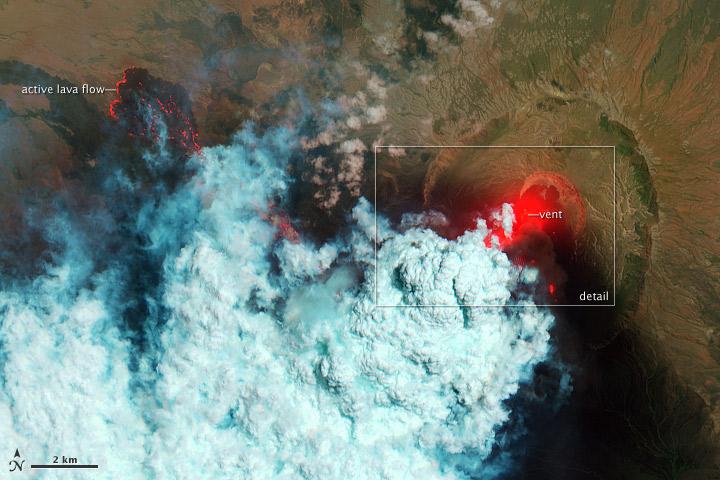
NASA image acquired June 24, 2011 Since it began erupting on June 12, 2011, emissions from Eritrea’s Nabro Volcano have drifted over much of East Africa and the Middle East. Ash has displaced residents living near the volcano and disrupted flights in the region. Despite the volcano’s widespread effects, little is known about the eruption. Nabro is located in an isolated region along the border between Eritrea and Ethiopia, and few English-language reports have been published. Satellite remote sensing is currently the only reliable way to monitor the ongoing eruption. This satellite image is among the first detailed pictures of the erupting vent and lava flows. They were acquired by the Advanced Land Imager (ALI) aboard the Earth Observing-1 (EO-1) satellite on June 24, 2011. The bright red portions of the false-color image (top) indicate hot surfaces. Hot volcanic ash glows above the vent, located in the center of Nabro’s caldera. To the west of the vent, portions of an active lava flow (particularly the front of the flow) are also hot. The speckled pattern on upstream portions of the flow are likely due to the cool, hardened crust splitting and exposing fluid lava as the flow advances. The bulbous blue-white cloud near the vent is likely composed largely of escaping water vapor that condensed as the plume rose and cooled. The whispy, cyan clouds above the lava flow are evidence of degassing from the lava. NASA Earth Observatory image by Robert Simmon, using EO-1 ALI data. Caption by Robert Simmon. Instrument: EO-1 - ALI To download the high res go here: <a href="http://earthobservatory.nasa.gov/IOTD/view.php?id=51216" rel="nofollow">earthobservatory.nasa.gov/IOTD/view.php?id=51216</a> <b><a href="http://www.nasa.gov/centers/goddard/home/index.html" rel="nofollow">NASA Goddard Space Flight Center</a></b> enables NASA’s mission through four scientific endeavors: Earth Science, Heliophysics, Solar System Exploration, and Astrophysics. Goddard plays a leading role in NASA’s accomplishments by contributing compelling scientific knowledge to advance the Agency’s mission. <b>Follow us on <a href="http://twitter.com/NASA_GoddardPix" rel="nofollow">Twitter</a></b> <b>Like us on <a href="http://www.facebook.com/pages/Greenbelt-MD/NASA-Goddard/395013845897?ref=tsd" rel="nofollow">Facebook</a></b> <b>Find us on <a href="http://web.stagram.com/n/nasagoddard/?vm=grid" rel="nofollow">Instagram</a></b>
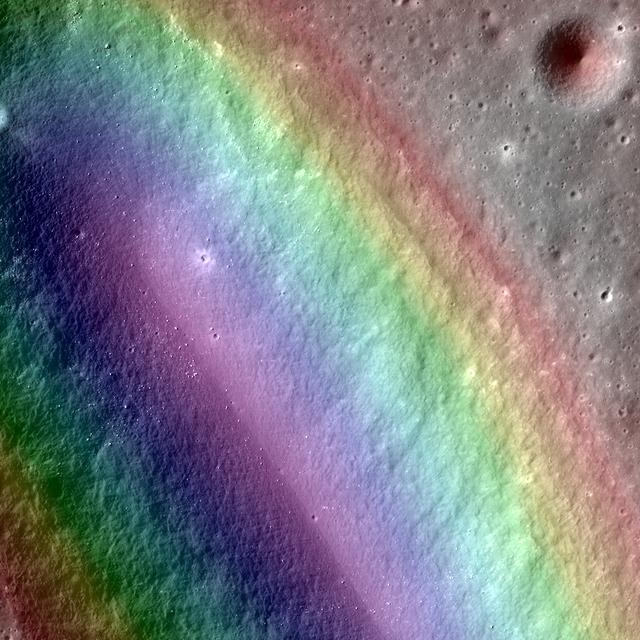
This false color image of Birt E crater shows the topography of the moon and it is thought to be the source region for lava that carved out Rima Birt, a rille in Mare Nubium. This mare is older than 3.4 billion years, and so is this vent! LROC NAC M1144849711L/R with the a color DTM overlaid; North is up. Download high res: <a href="http://lroc.sese.asu.edu/posts/794" rel="nofollow">lroc.sese.asu.edu/posts/794</a> Credit: NASA/GSFC/Arizona State University More info: Birt E crater was not created like most craters on the Moon; there was no meteorite impact. Lava sputtered out of this pyroclastic vent in Mare Nubium over 3.4 billion years ago, dispersing lava onto the surface and leaving the crater we see today. How can we tell it is a volcanic vent and not an impact crater? Impact craters and volcanic vents can be differentiated because vents often have an irregular or elongated shape (as with Birt E). Impact craters are usually circular in shape, created by the shockwave during an impact event. Also, the vee-shape of this crater is likely a product of the formation mechanism. Vee-shaped vents are thought to be formed from a pyroclastic eruption. Gasses fractionating out of the liquid rock create violent events during eruptions. Explosive eruptions created the shape that we see today, but Birt E could have had a complex history with effusive eruptions forming Rima Birt, a rille flowing from Birt E to the SE. Over long enough time scales Birt E will be filled in with ejecta from newly formed craters around Mare Nubium or by mass wasting of the walls into the crater. Let’s enjoy this ancient crater today while we still can! <b><a href="http://www.nasa.gov/audience/formedia/features/MP_Photo_Guidelines.html" rel="nofollow">NASA image use policy.</a></b> <b><a href="http://www.nasa.gov/centers/goddard/home/index.html" rel="nofollow">NASA Goddard Space Flight Center</a></b> enables NASA’s mission through four scientific endeavors: Earth Science, Heliophysics, Solar System Exploration, and Astrophysics. Goddard plays a leading role in NASA’s accomplishments by contributing compelling scientific knowledge to advance the Agency’s mission. <b>Follow us on <a href="http://twitter.com/NASAGoddardPix" rel="nofollow">Twitter</a></b> <b>Like us on <a href="http://www.facebook.com/pages/Greenbelt-MD/NASA-Goddard/395013845897?ref=tsd" rel="nofollow">Facebook</a></b> <b>Find us on <a href="http://instagram.com/nasagoddard?vm=grid" rel="nofollow">Instagram</a></b>

<b>To view a video of the Gradient Sun go to: <a href="http://www.flickr.com/photos/gsfc/8103212817">www.flickr.com/photos/gsfc/8103212817</a></b> Looking at a particularly beautiful image of the sun helps show how the lines between science and art can sometimes blur. But there is more to the connection between the two disciplines: science and art techniques are often quite similar, indeed one may inform the other or be improved based on lessons from the other arena. One such case is a technique known as a "gradient filter" – recognizable to many people as an option available on a photo-editing program. Gradients are, in fact, a mathematical description that highlights the places of greatest physical change in space. A gradient filter, in turn, enhances places of contrast, making them all the more obviously different, a useful tool when adjusting photos. Scientists, too, use gradient filters to enhance contrast, using them to accentuate fine structures that might otherwise be lost in the background noise. On the sun, for example, scientists wish to study a phenomenon known as coronal loops, which are giant arcs of solar material constrained to travel along that particular path by the magnetic fields in the sun's atmosphere. Observations of the loops, which can be more or less tangled and complex during different phases of the sun's 11-year activity cycle, can help researchers understand what's happening with the sun's complex magnetic fields, fields that can also power great eruptions on the sun such as solar flares or coronal mass ejections. The still here shows an unfiltered image from the sun next to one that has been processed using a gradient filter. Note how the coronal loops are sharp and defined, making them all the more easy to study. On the other hand, gradients also make great art. NASA/Goddard Space Flight Center To download this video go to: <a href="http://svs.gsfc.nasa.gov/goto?11112" rel="nofollow">svs.gsfc.nasa.gov/goto?11112</a> <b><a href="http://www.nasa.gov/audience/formedia/features/MP_Photo_Guidelines.html" rel="nofollow">NASA image use policy.</a></b> <b><a href="http://www.nasa.gov/centers/goddard/home/index.html" rel="nofollow">NASA Goddard Space Flight Center</a></b> enables NASA’s mission through four scientific endeavors: Earth Science, Heliophysics, Solar System Exploration, and Astrophysics. Goddard plays a leading role in NASA’s accomplishments by contributing compelling scientific knowledge to advance the Agency’s mission. <b>Follow us on <a href="http://twitter.com/NASA_GoddardPix" rel="nofollow">Twitter</a></b> <b>Like us on <a href="http://www.facebook.com/pages/Greenbelt-MD/NASA-Goddard/395013845897?ref=tsd" rel="nofollow">Facebook</a></b> <b>Find us on <a href="http://instagrid.me/nasagoddard/?vm=grid" rel="nofollow">Instagram</a></b>

NASA Image acquired March 24, 2010 To learn more and to download a high res version of this image go here: <a href="http://earthobservatory.nasa.gov/IOTD/view.php?id=43252" rel="nofollow">earthobservatory.nasa.gov/IOTD/view.php?id=43252</a> Iceland’s Eyjafjallajökull Volcano burst into life for the first time in 190 years on March 20, 2010. A 500-meter- (2,000-foot) long fissure opened in the Fimmvörduháls pass to the west of the ice-covered summit of Eyjafjallajökull. Lava fountains erupted fluid magma, which quickly built several hills of bubble-filled lava rocks (scoria) along the vent. A lava flow spread northeast, spilling into Hrunagil Gully. This natural-color satellite image shows lava fountains, lava flows, a volcanic plume, and steam from vaporized snow. The image was acquired on March 24, 2010, by the Advanced Land Imager (ALI) aboard NASA’s Earth Observing-1 (EO-1) satellite. The lava fountains are orange-red, barely visible at the 10-meter (33-foot) resolution of the satellite. The scoria cones surrounding the fissure are black, as is the lava flow extending to the northeast. White volcanic gases escape from the vent and erupting lava, while a steam plume rises where the hot lava meets snow. (The bright green color along the edge of the lava flow is an artifact of the sensor.) The eruption of Eyjafjallajökull was presaged by a series of earthquakes starting in early March. Over time, the earthquakes rose towards the surface, and land near the volcano rose at least 40 millimeters (2 inches)—both indications that magma was moving underneath the volcano. The eruption continued through at least March 26th, and may continue for several more months. Previous eruptions in the area have caused flooding due to the melting of glacial ice (a Jökulhlaup), but the current eruption is in an area covered by winter snow, not permanent ice. Although some past eruptions of Eyjafjallajökull were followed by larger, explosive eruptions at nearby Katla Volcano, there is currently no sign of activity at Katla. NASA image by Robert Simmon, using ALI data from the EO-1 team. Caption by Robert Simmon. Instrument: EO-1 - ALI <b><a href="http://www.nasa.gov/centers/goddard/home/index.html" rel="nofollow">NASA Goddard Space Flight Center</a></b> is home to the nation's largest organization of combined scientists, engineers and technologists that build spacecraft, instruments and new technology to study the Earth, the sun, our solar system, and the universe.

This supercomputer simulation shows one of the most violent events in the universe: a pair of neutron stars colliding, merging and forming a black hole. A neutron star is the compressed core left behind when a star born with between eight and 30 times the sun's mass explodes as a supernova. Neutron stars pack about 1.5 times the mass of the sun — equivalent to about half a million Earths — into a ball just 12 miles (20 km) across. As the simulation begins, we view an unequally matched pair of neutron stars weighing 1.4 and 1.7 solar masses. They are separated by only about 11 miles, slightly less distance than their own diameters. Redder colors show regions of progressively lower density. As the stars spiral toward each other, intense tides begin to deform them, possibly cracking their crusts. Neutron stars possess incredible density, but their surfaces are comparatively thin, with densities about a million times greater than gold. Their interiors crush matter to a much greater degree densities rise by 100 million times in their centers. To begin to imagine such mind-boggling densities, consider that a cubic centimeter of neutron star matter outweighs Mount Everest. By 7 milliseconds, tidal forces overwhelm and shatter the lesser star. Its superdense contents erupt into the system and curl a spiral arm of incredibly hot material. At 13 milliseconds, the more massive star has accumulated too much mass to support it against gravity and collapses, and a new black hole is born. The black hole's event horizon — its point of no return — is shown by the gray sphere. While most of the matter from both neutron stars will fall into the black hole, some of the less dense, faster moving matter manages to orbit around it, quickly forming a large and rapidly rotating torus. This torus extends for about 124 miles (200 km) and contains the equivalent of 1/5th the mass of our sun. Scientists think neutron star mergers like this produce short gamma-ray bursts (GRBs). Short GRBs last less than two seconds yet unleash as much energy as all the stars in our galaxy produce over one year. The rapidly fading afterglow of these explosions presents a challenge to astronomers. A key element in understanding GRBs is getting instruments on large ground-based telescopes to capture afterglows as soon as possible after the burst. The rapid notification and accurate positions provided by NASA's Swift mission creates a vibrant synergy with ground-based observatories that has led to dramatically improved understanding of GRBs, especially for short bursts. This video is public domain and can be downloaded at: : <a href="http://svs.gsfc.nasa.gov/goto?11530" rel="nofollow">svs.gsfc.nasa.gov/goto?11530</a>
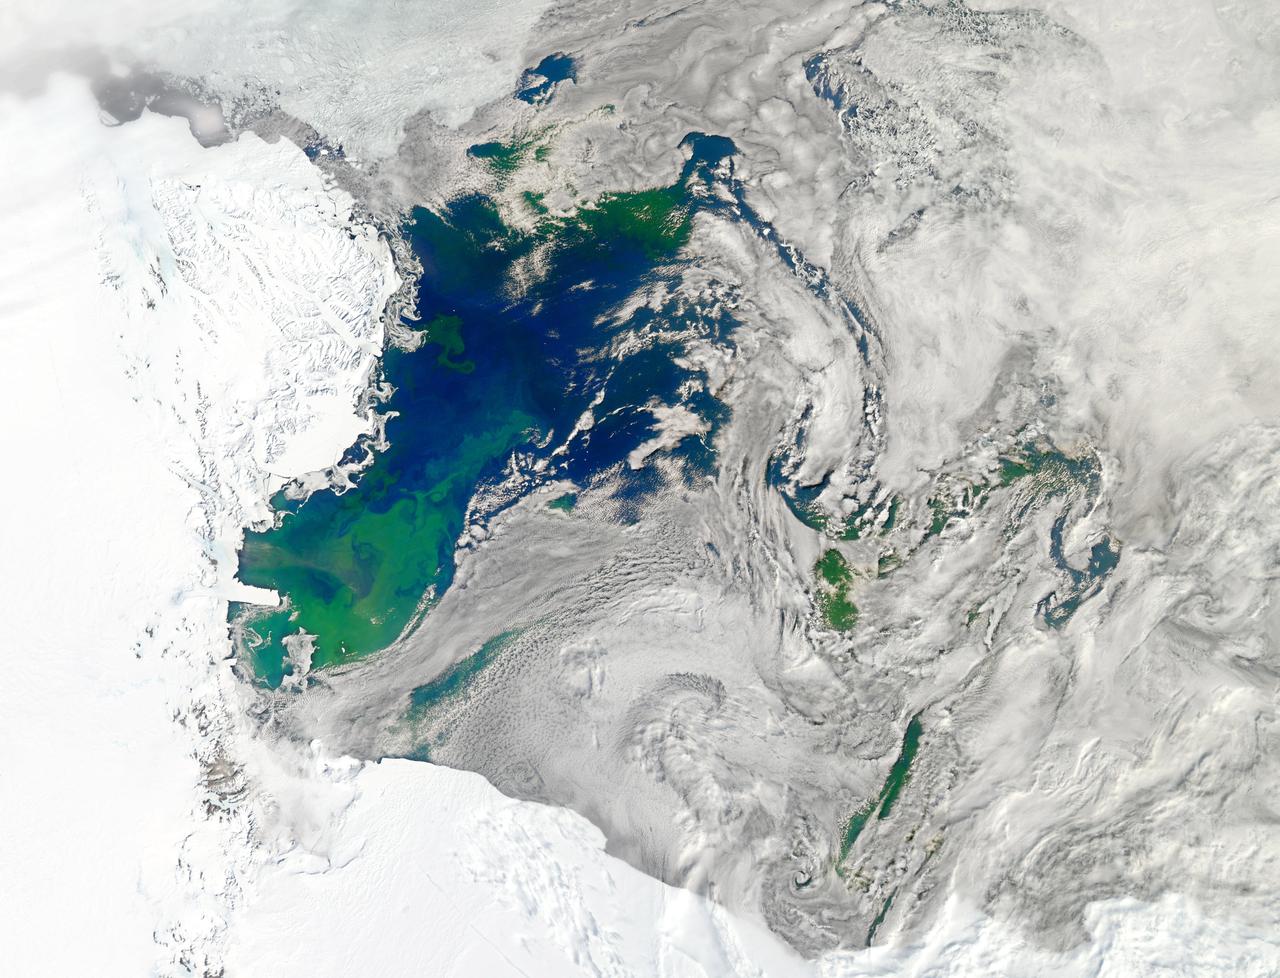
NASA image acquired January 22, 2011 Every southern spring and summer, after the Sun has risen into its 24-hour circuit around the skies of Antarctica, the Ross Sea bursts with life. Floating, microscopic plants, known as phytoplankton, soak up the sunlight and the nutrients stirring in the Southern Ocean and grow into prodigious blooms. Those blooms become a great banquet for krill, fish, penguins, whales, and other marine species who carve out a living in the cool waters of the far south. This true-color image captures such a bloom in the Ross Sea on January 22, 2011, as viewed by the Moderate Resolution Imaging Spectroradiometer (MODIS) on NASA’s Aqua satellite. Bright greens of plant-life have replaced the deep blues of open ocean water. The Ross Sea is a relatively shallow bay in the Antarctic coastline and due south from New Zealand. As the spring weather thaws the sea ice around Antarctica, areas of open water surrounded by ice—polynyas—open up on the continental shelf. In this open water, sunlight provides the fuel and various current systems provide nutrients from deeper waters to form blooms that can stretch 100 to 200 kilometers (60 to 120 miles). These blooms are among the largest in extent and abundance in the world. Scientists have hypothesized that the Modified Circumpolar Deep Water is the engine behind the blooms, stirring up just the right mix of trace metals and minerals from the deep to sustain plankton growth. This month, researchers aboard the U.S. icebreaking ship Nathaniel B. Palmer are cruising in the Ross Sea in search of the signatures of this current system. NASA image courtesy Norman Kuring, Ocean Color Team at NASA Goddard Space Flight Center. Caption by Mike Carlowicz, with information from Hugh Powell, COSEE-NOW. Instrument: Aqua - MODIS Go here to download the full high res file: <a href="http://earthobservatory.nasa.gov/IOTD/view.php?id=48949" rel="nofollow">earthobservatory.nasa.gov/IOTD/view.php?id=48949</a> Credit: <b><a href="http://www.earthobservatory.nasa.gov/" rel="nofollow"> NASA Earth Observatory</a></b> <b><a href="http://www.nasa.gov/audience/formedia/features/MP_Photo_Guidelines.html" rel="nofollow">NASA image use policy.</a></b> <b><a href="http://www.nasa.gov/centers/goddard/home/index.html" rel="nofollow">NASA Goddard Space Flight Center</a></b> enables NASA’s mission through four scientific endeavors: Earth Science, Heliophysics, Solar System Exploration, and Astrophysics. Goddard plays a leading role in NASA’s accomplishments by contributing compelling scientific knowledge to advance the Agency’s mission. <b>Follow us on <a href="http://twitter.com/NASA_GoddardPix" rel="nofollow">Twitter</a></b> <b>Like us on <a href="http://www.facebook.com/pages/Greenbelt-MD/NASA-Goddard/395013845897?ref=tsd" rel="nofollow">Facebook</a></b> <b>Find us on <a href="http://instagrid.me/nasagoddard/?vm=grid" rel="nofollow">Instagram</a></b>

NASA image acquired July 27, 2001 In southwestern Jordan lies an unusual landscape. Mountains of granite and sandstone rise next to valleys filled with red sand. Some of the mountains reach a height of about 1,700 meters (5,600 feet) above sea level, and many have near-vertical slopes. So alien is this landscape, it’s nicknamed “Valley of the Moon,” and it has served as the film set for a movie about Mars. Yet nomadic people have lived here for thousands of years. Declared a protected area in 1998, this unearthly landscape is Wadi Rum. The Advanced Land Imager (ALI) on NASA’s Earth Observing-1 (EO-1) satellite captured this natural-color image on July 27, 2001. The scene includes part of Wadi Rum and an adjacent area to the east. East of the protected area, fields with center-pivot irrigation make circles of green and brown (image upper right). As the earth tones throughout the image attest, the area is naturally arid, receiving little annual precipitation and supporting only sparse vegetation. Between rocky peaks, the sandy valleys range in color from beige to brick. Ancient granite rocks dating from the Precambrian underlie younger rocks, and some of these basement rocks have eroded into rugged, steep-sloped mountains. The granite mountains have risen thanks partly to crisscrossing fault lines under the park. Overlying the granite are sandstones from the Cambrian and Ordovician Periods, as well as loose sands. Lawrence of Arabia, who fought in the Arab Revolt of 1917–1918, made frequent references to Wadi Rum in his book The Seven Pillars of Wisdom. Likewise, a prominent feature of the protected area is named after the book. Several popular sites in Wadi Rum bear Lawrence of Arabia’s name, but whether he actually visited those sites is uncertain. To download the full high res go to: <a href="http://earthobservatory.nasa.gov/IOTD/view.php?id=49945" rel="nofollow">earthobservatory.nasa.gov/IOTD/view.php?id=49945</a> NASA Earth Observatory image created by Jesse Allen and Robert Simmon, using EO-1 ALI data provided courtesy of the NASA EO-1 team and the United States Geological Survey. Caption by Michon Scott. Instrument: EO-1 - ALI Credit: <b><a href="http://www.earthobservatory.nasa.gov/" rel="nofollow"> NASA Earth Observatory</a></b> <b><a href="http://www.nasa.gov/centers/goddard/home/index.html" rel="nofollow">NASA Goddard Space Flight Center</a></b> enables NASA’s mission through four scientific endeavors: Earth Science, Heliophysics, Solar System Exploration, and Astrophysics. Goddard plays a leading role in NASA’s accomplishments by contributing compelling scientific knowledge to advance the Agency’s mission. <b>Follow us on <a href="http://twitter.com/NASA_GoddardPix" rel="nofollow">Twitter</a></b> <b>Join us on <a href="http://www.facebook.com/pages/Greenbelt-MD/NASA-Goddard/395013845897?ref=tsd" rel="nofollow">Facebook</a></b>

Simulation frames from this NASA Goddard neutron star merger animation: <a href="http://bit.ly/1jolBYY" rel="nofollow">bit.ly/1jolBYY</a> Credit: NASA's Goddard Space Flight Center This supercomputer simulation shows one of the most violent events in the universe: a pair of neutron stars colliding, merging and forming a black hole. A neutron star is the compressed core left behind when a star born with between eight and 30 times the sun's mass explodes as a supernova. Neutron stars pack about 1.5 times the mass of the sun — equivalent to about half a million Earths — into a ball just 12 miles (20 km) across. As the simulation begins, we view an unequally matched pair of neutron stars weighing 1.4 and 1.7 solar masses. They are separated by only about 11 miles, slightly less distance than their own diameters. Redder colors show regions of progressively lower density. As the stars spiral toward each other, intense tides begin to deform them, possibly cracking their crusts. Neutron stars possess incredible density, but their surfaces are comparatively thin, with densities about a million times greater than gold. Their interiors crush matter to a much greater degree densities rise by 100 million times in their centers. To begin to imagine such mind-boggling densities, consider that a cubic centimeter of neutron star matter outweighs Mount Everest. By 7 milliseconds, tidal forces overwhelm and shatter the lesser star. Its superdense contents erupt into the system and curl a spiral arm of incredibly hot material. At 13 milliseconds, the more massive star has accumulated too much mass to support it against gravity and collapses, and a new black hole is born. The black hole's event horizon — its point of no return — is shown by the gray sphere. While most of the matter from both neutron stars will fall into the black hole, some of the less dense, faster moving matter manages to orbit around it, quickly forming a large and rapidly rotating torus. This torus extends for about 124 miles (200 km) and contains the equivalent of 1/5th the mass of our sun. Scientists think neutron star mergers like this produce short gamma-ray bursts (GRBs). Short GRBs last less than two seconds yet unleash as much energy as all the stars in our galaxy produce over one year. The rapidly fading afterglow of these explosions presents a challenge to astronomers. A key element in understanding GRBs is getting instruments on large ground-based telescopes to capture afterglows as soon as possible after the burst. The rapid notification and accurate positions provided by NASA's Swift mission creates a vibrant synergy with ground-based observatories that has led to dramatically improved understanding of GRBs, especially for short bursts. This video is public domain and can be downloaded at: <a href="http://svs.gsfc.nasa.gov/vis/a010000/a011500/a011530/index.html" rel="nofollow">svs.gsfc.nasa.gov/vis/a010000/a011500/a011530/index.html</a> <b><a href="http://www.nasa.gov/audience/formedia/features/MP_Photo_Guidelines.html" rel="nofollow">NASA image use policy.</a></b> <b><a href="http://www.nasa.gov/centers/goddard/home/index.html" rel="nofollow">NASA Goddard Space Flight Center</a></b> enables NASA’s mission through four scientific endeavors: Earth Science, Heliophysics, Solar System Exploration, and Astrophysics. Goddard plays a leading role in NASA’s accomplishments by contributing compelling scientific knowledge to advance the Agency’s mission. <b>Follow us on <a href="http://twitter.com/NASAGoddardPix" rel="nofollow">Twitter</a></b> <b>Like us on <a href="http://www.facebook.com/pages/Greenbelt-MD/NASA-Goddard/395013845897?ref=tsd" rel="nofollow">Facebook</a></b> <b>Find us on <a href="http://instagram.com/nasagoddard?vm=grid" rel="nofollow">Instagram</a></b>

Simulation frames from this NASA Goddard neutron star merger animation: <a href="http://bit.ly/1jolBYY" rel="nofollow">bit.ly/1jolBYY</a> Credit: NASA's Goddard Space Flight Center This supercomputer simulation shows one of the most violent events in the universe: a pair of neutron stars colliding, merging and forming a black hole. A neutron star is the compressed core left behind when a star born with between eight and 30 times the sun's mass explodes as a supernova. Neutron stars pack about 1.5 times the mass of the sun — equivalent to about half a million Earths — into a ball just 12 miles (20 km) across. As the simulation begins, we view an unequally matched pair of neutron stars weighing 1.4 and 1.7 solar masses. They are separated by only about 11 miles, slightly less distance than their own diameters. Redder colors show regions of progressively lower density. As the stars spiral toward each other, intense tides begin to deform them, possibly cracking their crusts. Neutron stars possess incredible density, but their surfaces are comparatively thin, with densities about a million times greater than gold. Their interiors crush matter to a much greater degree densities rise by 100 million times in their centers. To begin to imagine such mind-boggling densities, consider that a cubic centimeter of neutron star matter outweighs Mount Everest. By 7 milliseconds, tidal forces overwhelm and shatter the lesser star. Its superdense contents erupt into the system and curl a spiral arm of incredibly hot material. At 13 milliseconds, the more massive star has accumulated too much mass to support it against gravity and collapses, and a new black hole is born. The black hole's event horizon — its point of no return — is shown by the gray sphere. While most of the matter from both neutron stars will fall into the black hole, some of the less dense, faster moving matter manages to orbit around it, quickly forming a large and rapidly rotating torus. This torus extends for about 124 miles (200 km) and contains the equivalent of 1/5th the mass of our sun. Scientists think neutron star mergers like this produce short gamma-ray bursts (GRBs). Short GRBs last less than two seconds yet unleash as much energy as all the stars in our galaxy produce over one year. The rapidly fading afterglow of these explosions presents a challenge to astronomers. A key element in understanding GRBs is getting instruments on large ground-based telescopes to capture afterglows as soon as possible after the burst. The rapid notification and accurate positions provided by NASA's Swift mission creates a vibrant synergy with ground-based observatories that has led to dramatically improved understanding of GRBs, especially for short bursts. This video is public domain and can be downloaded at: <a href="http://svs.gsfc.nasa.gov/vis/a010000/a011500/a011530/index.html" rel="nofollow">svs.gsfc.nasa.gov/vis/a010000/a011500/a011530/index.html</a> <b><a href="http://www.nasa.gov/audience/formedia/features/MP_Photo_Guidelines.html" rel="nofollow">NASA image use policy.</a></b> <b><a href="http://www.nasa.gov/centers/goddard/home/index.html" rel="nofollow">NASA Goddard Space Flight Center</a></b> enables NASA’s mission through four scientific endeavors: Earth Science, Heliophysics, Solar System Exploration, and Astrophysics. Goddard plays a leading role in NASA’s accomplishments by contributing compelling scientific knowledge to advance the Agency’s mission. <b>Follow us on <a href="http://twitter.com/NASAGoddardPix" rel="nofollow">Twitter</a></b> <b>Like us on <a href="http://www.facebook.com/pages/Greenbelt-MD/NASA-Goddard/395013845897?ref=tsd" rel="nofollow">Facebook</a></b> <b>Find us on <a href="http://instagram.com/nasagoddard?vm=grid" rel="nofollow">Instagram</a></b>
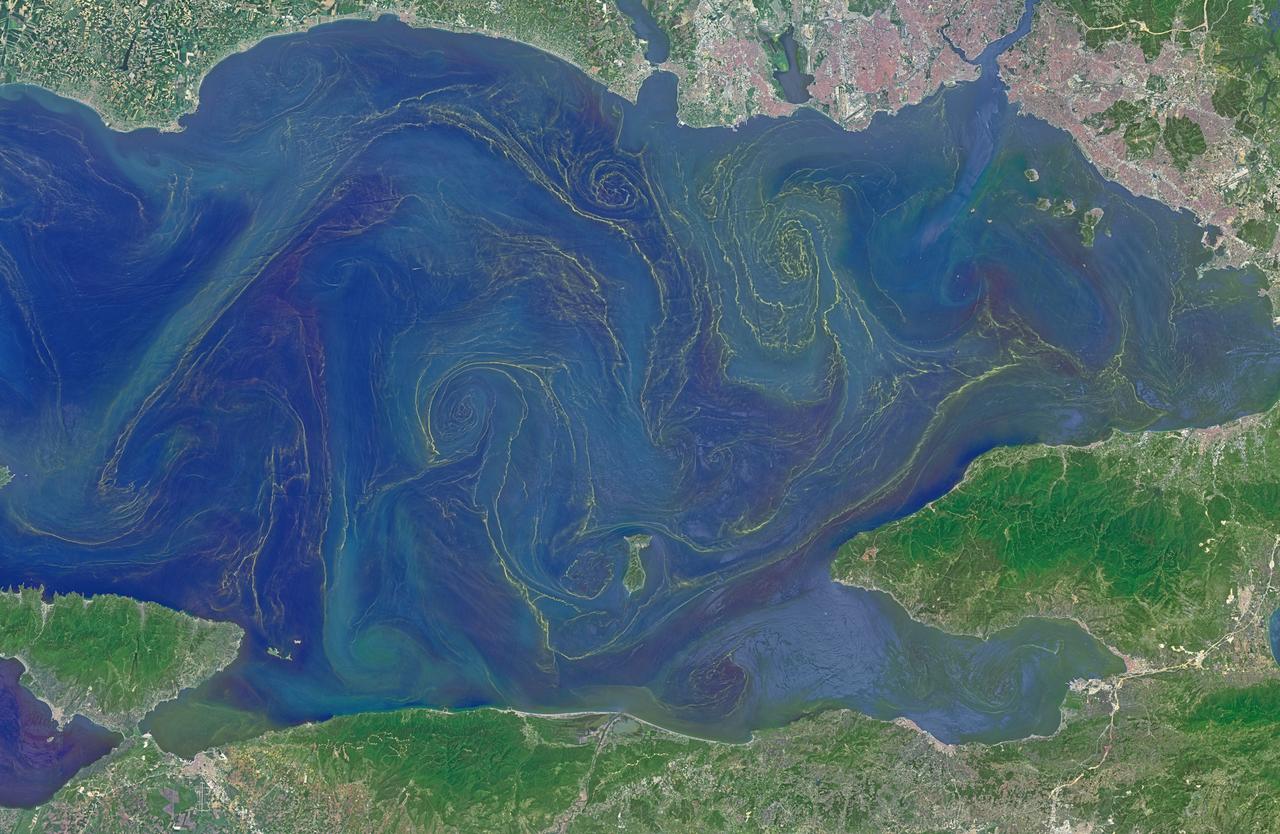
Situated between the Black Sea and the Aegean Sea, the Sea of Marmara is full of a rich soup of nutrients and life and surrounded by a rich history of civilization. Like the Black Sea to its northeast, the Marmara has an unusual layered structure with fresher water near the surface and much saltier water near the bottom. That fresh surface is fed by exchanges with the Black Sea and by flows from the Susurluk, Biga, and Gonen Rivers. The fresh water (just two thirds the salinity of the ocean) makes it easier for floating, plant-like organisms—phytoplankton—to grow, as does the abundance of nutrients pouring into the seas from European and Turkish rivers. The Operational Land Imager on the Landsat 8 satellite captured this image of a phytoplankton bloom in the Sea of Marmara on May 17, 2015. The sea is surrounded on all sides by the nation of Turkey. The swirling shapes on the water are phytoplankton, with the yellow-green and red-purple filaments likely (but not necessarily) representing different species. Those wavy colored lines not only show where the densest concentrations of plankton are floating, but also reveal the eddies and currents within the small sea. Waters rushing in through the narrow Bosphorous Strait (at Istanbul) and Dardanelles Strait (off the left side of the image), as well as a jagged coastline and tectonically fractured seafloor on this edge of the Asian and European continents, all conspire to create intricate mixing patterns. If you download the large image and open it in full resolution, you also can see ship tracks crossing the bloom lines. “I often see features in imagery and wonder: what could be causing that?” said Norman Kuring, an ocean color specialist at NASA Goddard. “Remote sensing is great for the big picture, but it still needs data from the surface for validation and interpretation.” According to scientists Baris Salihoglu of Turkey’s Institute of Marine Sciences and Ahsen Yuksek of Istanbul University, the blooms in the satellite image are mostly Prorocentrum micans and Noctiluca scintillans. They recently sampled the waters of the Marmara and found that Prorocentrum bloomed first, though Noctiluca eventually dominated. According to Ajit Subramaniam of the Lamont Doherty Earth Observatory, both species are dinoflagellates, known to discolor the water (red tides). Neither is directly toxic to humans, but they can kill marine life by becoming caught in fish gills, depleting the sea of oxygen, or excreting ammonia into the water. “Noctiluca is phagotrophic—a really interesting beast since it eats other phytoplankton that can then change its color,” Subramaniam noted. “It switches from being photosynthetic to becoming heterotrophic.” The Moderate Resolution Imaging Spectroradiometer (MODIS) on NASA’s Terra satellite captured wider views of bloom events in the Sea of Marmara on on May 23 and May 25. Credit: <b><a href="http://www.earthobservatory.nasa.gov/" rel="nofollow"> NASA Earth Observatory</a></b> Read more: <a href="http://earthobservatory.nasa.gov/IOTD/view.php?id=85947" rel="nofollow">earthobservatory.nasa.gov/IOTD/view.php?id=85947</a> <b><a href="http://www.nasa.gov/audience/formedia/features/MP_Photo_Guidelines.html" rel="nofollow">NASA image use policy.</a></b> <b><a href="http://www.nasa.gov/centers/goddard/home/index.html" rel="nofollow">NASA Goddard Space Flight Center</a></b> enables NASA’s mission through four scientific endeavors: Earth Science, Heliophysics, Solar System Exploration, and Astrophysics. Goddard plays a leading role in NASA’s accomplishments by contributing compelling scientific knowledge to advance the Agency’s mission. <b>Follow us on <a href="http://twitter.com/NASAGoddardPix" rel="nofollow">Twitter</a></b> <b>Like us on <a href="http://www.facebook.com/pages/Greenbelt-MD/NASA-Goddard/395013845897?ref=tsd" rel="nofollow">Facebook</a></b> <b>Find us on <a href="http://instagrid.me/nasagoddard/?vm=grid" rel="nofollow">Instagram</a></b>

Simulation frames from this NASA Goddard neutron star merger animation: <a href="http://bit.ly/1jolBYY" rel="nofollow">bit.ly/1jolBYY</a> Credit: NASA's Goddard Space Flight Center This supercomputer simulation shows one of the most violent events in the universe: a pair of neutron stars colliding, merging and forming a black hole. A neutron star is the compressed core left behind when a star born with between eight and 30 times the sun's mass explodes as a supernova. Neutron stars pack about 1.5 times the mass of the sun — equivalent to about half a million Earths — into a ball just 12 miles (20 km) across. As the simulation begins, we view an unequally matched pair of neutron stars weighing 1.4 and 1.7 solar masses. They are separated by only about 11 miles, slightly less distance than their own diameters. Redder colors show regions of progressively lower density. As the stars spiral toward each other, intense tides begin to deform them, possibly cracking their crusts. Neutron stars possess incredible density, but their surfaces are comparatively thin, with densities about a million times greater than gold. Their interiors crush matter to a much greater degree densities rise by 100 million times in their centers. To begin to imagine such mind-boggling densities, consider that a cubic centimeter of neutron star matter outweighs Mount Everest. By 7 milliseconds, tidal forces overwhelm and shatter the lesser star. Its superdense contents erupt into the system and curl a spiral arm of incredibly hot material. At 13 milliseconds, the more massive star has accumulated too much mass to support it against gravity and collapses, and a new black hole is born. The black hole's event horizon — its point of no return — is shown by the gray sphere. While most of the matter from both neutron stars will fall into the black hole, some of the less dense, faster moving matter manages to orbit around it, quickly forming a large and rapidly rotating torus. This torus extends for about 124 miles (200 km) and contains the equivalent of 1/5th the mass of our sun. Scientists think neutron star mergers like this produce short gamma-ray bursts (GRBs). Short GRBs last less than two seconds yet unleash as much energy as all the stars in our galaxy produce over one year. The rapidly fading afterglow of these explosions presents a challenge to astronomers. A key element in understanding GRBs is getting instruments on large ground-based telescopes to capture afterglows as soon as possible after the burst. The rapid notification and accurate positions provided by NASA's Swift mission creates a vibrant synergy with ground-based observatories that has led to dramatically improved understanding of GRBs, especially for short bursts. This video is public domain and can be downloaded at: <a href="http://svs.gsfc.nasa.gov/vis/a010000/a011500/a011530/index.html" rel="nofollow">svs.gsfc.nasa.gov/vis/a010000/a011500/a011530/index.html</a> <b><a href="http://www.nasa.gov/audience/formedia/features/MP_Photo_Guidelines.html" rel="nofollow">NASA image use policy.</a></b> <b><a href="http://www.nasa.gov/centers/goddard/home/index.html" rel="nofollow">NASA Goddard Space Flight Center</a></b> enables NASA’s mission through four scientific endeavors: Earth Science, Heliophysics, Solar System Exploration, and Astrophysics. Goddard plays a leading role in NASA’s accomplishments by contributing compelling scientific knowledge to advance the Agency’s mission. <b>Follow us on <a href="http://twitter.com/NASAGoddardPix" rel="nofollow">Twitter</a></b> <b>Like us on <a href="http://www.facebook.com/pages/Greenbelt-MD/NASA-Goddard/395013845897?ref=tsd" rel="nofollow">Facebook</a></b> <b>Find us on <a href="http://instagram.com/nasagoddard?vm=grid" rel="nofollow">Instagram</a></b>

Simulation frames from this NASA Goddard neutron star merger animation: <a href="http://bit.ly/1jolBYY" rel="nofollow">bit.ly/1jolBYY</a> Credit: NASA's Goddard Space Flight Center This supercomputer simulation shows one of the most violent events in the universe: a pair of neutron stars colliding, merging and forming a black hole. A neutron star is the compressed core left behind when a star born with between eight and 30 times the sun's mass explodes as a supernova. Neutron stars pack about 1.5 times the mass of the sun — equivalent to about half a million Earths — into a ball just 12 miles (20 km) across. As the simulation begins, we view an unequally matched pair of neutron stars weighing 1.4 and 1.7 solar masses. They are separated by only about 11 miles, slightly less distance than their own diameters. Redder colors show regions of progressively lower density. As the stars spiral toward each other, intense tides begin to deform them, possibly cracking their crusts. Neutron stars possess incredible density, but their surfaces are comparatively thin, with densities about a million times greater than gold. Their interiors crush matter to a much greater degree densities rise by 100 million times in their centers. To begin to imagine such mind-boggling densities, consider that a cubic centimeter of neutron star matter outweighs Mount Everest. By 7 milliseconds, tidal forces overwhelm and shatter the lesser star. Its superdense contents erupt into the system and curl a spiral arm of incredibly hot material. At 13 milliseconds, the more massive star has accumulated too much mass to support it against gravity and collapses, and a new black hole is born. The black hole's event horizon — its point of no return — is shown by the gray sphere. While most of the matter from both neutron stars will fall into the black hole, some of the less dense, faster moving matter manages to orbit around it, quickly forming a large and rapidly rotating torus. This torus extends for about 124 miles (200 km) and contains the equivalent of 1/5th the mass of our sun. Scientists think neutron star mergers like this produce short gamma-ray bursts (GRBs). Short GRBs last less than two seconds yet unleash as much energy as all the stars in our galaxy produce over one year. The rapidly fading afterglow of these explosions presents a challenge to astronomers. A key element in understanding GRBs is getting instruments on large ground-based telescopes to capture afterglows as soon as possible after the burst. The rapid notification and accurate positions provided by NASA's Swift mission creates a vibrant synergy with ground-based observatories that has led to dramatically improved understanding of GRBs, especially for short bursts. This video is public domain and can be downloaded at: <a href="http://svs.gsfc.nasa.gov/vis/a010000/a011500/a011530/index.html" rel="nofollow">svs.gsfc.nasa.gov/vis/a010000/a011500/a011530/index.html</a> <b><a href="http://www.nasa.gov/audience/formedia/features/MP_Photo_Guidelines.html" rel="nofollow">NASA image use policy.</a></b> <b><a href="http://www.nasa.gov/centers/goddard/home/index.html" rel="nofollow">NASA Goddard Space Flight Center</a></b> enables NASA’s mission through four scientific endeavors: Earth Science, Heliophysics, Solar System Exploration, and Astrophysics. Goddard plays a leading role in NASA’s accomplishments by contributing compelling scientific knowledge to advance the Agency’s mission. <b>Follow us on <a href="http://twitter.com/NASAGoddardPix" rel="nofollow">Twitter</a></b> <b>Like us on <a href="http://www.facebook.com/pages/Greenbelt-MD/NASA-Goddard/395013845897?ref=tsd" rel="nofollow">Facebook</a></b> <b>Find us on <a href="http://instagram.com/nasagoddard?vm=grid" rel="nofollow">Instagram</a></b>

Simulation frames from this NASA Goddard neutron star merger animation: <a href="http://bit.ly/1jolBYY" rel="nofollow">bit.ly/1jolBYY</a> Credit: NASA's Goddard Space Flight Center This supercomputer simulation shows one of the most violent events in the universe: a pair of neutron stars colliding, merging and forming a black hole. A neutron star is the compressed core left behind when a star born with between eight and 30 times the sun's mass explodes as a supernova. Neutron stars pack about 1.5 times the mass of the sun — equivalent to about half a million Earths — into a ball just 12 miles (20 km) across. As the simulation begins, we view an unequally matched pair of neutron stars weighing 1.4 and 1.7 solar masses. They are separated by only about 11 miles, slightly less distance than their own diameters. Redder colors show regions of progressively lower density. As the stars spiral toward each other, intense tides begin to deform them, possibly cracking their crusts. Neutron stars possess incredible density, but their surfaces are comparatively thin, with densities about a million times greater than gold. Their interiors crush matter to a much greater degree densities rise by 100 million times in their centers. To begin to imagine such mind-boggling densities, consider that a cubic centimeter of neutron star matter outweighs Mount Everest. By 7 milliseconds, tidal forces overwhelm and shatter the lesser star. Its superdense contents erupt into the system and curl a spiral arm of incredibly hot material. At 13 milliseconds, the more massive star has accumulated too much mass to support it against gravity and collapses, and a new black hole is born. The black hole's event horizon — its point of no return — is shown by the gray sphere. While most of the matter from both neutron stars will fall into the black hole, some of the less dense, faster moving matter manages to orbit around it, quickly forming a large and rapidly rotating torus. This torus extends for about 124 miles (200 km) and contains the equivalent of 1/5th the mass of our sun. Scientists think neutron star mergers like this produce short gamma-ray bursts (GRBs). Short GRBs last less than two seconds yet unleash as much energy as all the stars in our galaxy produce over one year. The rapidly fading afterglow of these explosions presents a challenge to astronomers. A key element in understanding GRBs is getting instruments on large ground-based telescopes to capture afterglows as soon as possible after the burst. The rapid notification and accurate positions provided by NASA's Swift mission creates a vibrant synergy with ground-based observatories that has led to dramatically improved understanding of GRBs, especially for short bursts. This video is public domain and can be downloaded at: <a href="http://svs.gsfc.nasa.gov/vis/a010000/a011500/a011530/index.html" rel="nofollow">svs.gsfc.nasa.gov/vis/a010000/a011500/a011530/index.html</a> <b><a href="http://www.nasa.gov/audience/formedia/features/MP_Photo_Guidelines.html" rel="nofollow">NASA image use policy.</a></b> <b><a href="http://www.nasa.gov/centers/goddard/home/index.html" rel="nofollow">NASA Goddard Space Flight Center</a></b> enables NASA’s mission through four scientific endeavors: Earth Science, Heliophysics, Solar System Exploration, and Astrophysics. Goddard plays a leading role in NASA’s accomplishments by contributing compelling scientific knowledge to advance the Agency’s mission. <b>Follow us on <a href="http://twitter.com/NASAGoddardPix" rel="nofollow">Twitter</a></b> <b>Like us on <a href="http://www.facebook.com/pages/Greenbelt-MD/NASA-Goddard/395013845897?ref=tsd" rel="nofollow">Facebook</a></b> <b>Find us on <a href="http://instagram.com/nasagoddard?vm=grid" rel="nofollow">Instagram</a></b>
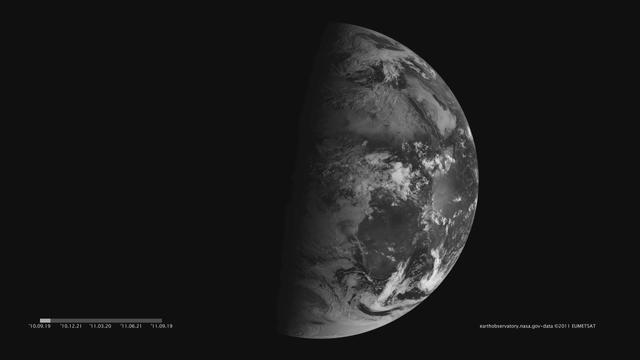
Images acquired December 21, 2010 - September 20, 2011. To download the high res and learn more go to: <a href="http://earthobservatory.nasa.gov/IOTD/view.php?id=52248" rel="nofollow">earthobservatory.nasa.gov/IOTD/view.php?id=52248</a> One of the most frequently misunderstood concepts in science is the reason for Earth’s seasons. As we experience the September equinox today—anyone try to balance an egg yet?—we thought we’d offer a space-based view of what’s going on. Around 6 a.m. local time each day, the Sun, Earth, and any geosynchronous satellite form a right angle, affording a nadir (straight down) view of the terminator, where the shadows of nightfall meet the sunlight of dusk and dawn. The shape of this line between night and day varies with the seasons, which means different lengths of days and differing amounts of warming sunshine. (The line is actually a curve because the Earth is round, but satellite images only show it in two-dimensions.) The Spinning Enhanced Visible and Infrared Imager (SEVIRI) on EUMETSAT's Meteosat-9 captured these four views of the day-night terminator on December 21, 2010, and March 20, June 21, and September 20, 2011. Each image was taken at 6:12 a.m. local time. On March 20 and September 20, the terminator is a straight north-south line, and the Sun is said to sit directly above the equator. On December 21, the Sun resides directly over the Tropic of Capricorn when viewed from the ground, and sunlight spreads over more of the Southern Hemisphere. On June 21, the Sun sits above the Tropic of Cancer, spreading more sunlight in the north and turning the tables on the south. The bulge of our spherical Earth blocks sunlight from the far hemisphere at the solstices; that same curvature allows the Sun’s rays to spread over more area near the top and bottom of the globe. Of course, it is not the Sun that is moving north or south through the seasons, but a change in the orientation and angles between the Earth and its nearest star. The axis of the Earth is tilted 23.5 degrees relative to the Sun and the ecliptic plane. The axis is tilted away from the Sun at the December solstice and toward the Sun at the June solstice, spreading more and less light on each hemisphere. At the equinoxes, the tilt is at a right angle to the Sun and the light is spread evenly. The equinox and changing of the seasons occurs on September 23, 2011 at 9:05 a.m. Universal Time. (Our September image above is a few days early.) Equinox means "equal night" in Latin, capturing the idea that daytime and nighttime are equal lengths everywhere on the planet. That is true of the Sun's presence above the horizon, though it does not account for twilight, when the Sun's rays extend from beyond the horizon to illuminate our gas-filled atmosphere. <b>NASA images and animation by Robert Simmon, using data ©2010 EUMETSAT. Caption by Mike Carlowicz.</b> Instrument: Meteosat Credit: <b><a href="http://www.earthobservatory.nasa.gov/" rel="nofollow"> NASA Earth Observatory</a></b> <b><a href="http://www.nasa.gov/audience/formedia/features/MP_Photo_Guidelines.html" rel="nofollow">NASA image use policy.</a></b> <b><a href="http://www.nasa.gov/centers/goddard/home/index.html" rel="nofollow">NASA Goddard Space Flight Center</a></b> enables NASA’s mission through four scientific endeavors: Earth Science, Heliophysics, Solar System Exploration, and Astrophysics. Goddard plays a leading role in NASA’s accomplishments by contributing compelling scientific knowledge to advance the Agency’s mission. <b>Follow us on <a href="http://twitter.com/NASAGoddardPix" rel="nofollow">Twitter</a></b> <b>Like us on <a href="http://www.facebook.com/pages/Greenbelt-MD/NASA-Goddard/395013845897?ref=tsd" rel="nofollow">Facebook</a></b> <b>Find us on <a href="http://instagrid.me/nasagoddard/?vm=grid" rel="nofollow">Instagram</a></b>

This side-by-side comparison shows observations of the Southern Ring Nebula in near-infrared light, at left, and mid-infrared light, at right, from NASA’s Webb Telescope. This scene was created by a white dwarf star – the remains of a star like our Sun after it shed its outer layers and stopped burning fuel though nuclear fusion. Those outer layers now form the ejected shells all along this view. In the Near-Infrared Camera (NIRCam) image, the white dwarf appears to the lower left of the bright, central star, partially hidden by a diffraction spike. The same star appears – but brighter, larger, and redder – in the Mid-Infrared Instrument (MIRI) image. This white dwarf star is cloaked in thick layers of dust, which make it appear larger. The brighter star in both images hasn’t yet shed its layers. It closely orbits the dimmer white dwarf, helping to distribute what it’s ejected. Over thousands of years and before it became a white dwarf, the star periodically ejected mass – the visible shells of material. As if on repeat, it contracted, heated up – and then, unable to push out more material, pulsated. Stellar material was sent in all directions – like a rotating sprinkler – and provided the ingredients for this asymmetrical landscape. Today, the white dwarf is heating up the gas in the inner regions – which appear blue at left and red at right. Both stars are lighting up the outer regions, shown in orange and blue, respectively. The images look very different because NIRCam and MIRI collect different wavelengths of light. NIRCam observes near-infrared light, which is closer to the visible wavelengths our eyes detect. MIRI goes farther into the infrared, picking up mid-infrared wavelengths. The second star more clearly appears in the MIRI image, because this instrument can see the gleaming dust around it, bringing it more clearly into view. The stars – and their layers of light – steal more attention in the NIRCam image, while dust plays the lead in the MIRI image, specifically dust that is illuminated. Peer at the circular region at the center of both images. Each contains a wobbly, asymmetrical belt of material. This is where two “bowls” that make up the nebula meet. (In this view, the nebula is at a 40-degree angle.) This belt is easier to spot in the MIRI image – look for the yellowish circle – but is also visible in the NIRCam image. The light that travels through the orange dust in the NIRCam image – which look like spotlights – disappear at longer infrared wavelengths in the MIRI image. In near-infrared light, stars have more prominent diffraction spikes because they are so bright at these wavelengths. In mid-infrared light, diffraction spikes also appear around stars, but they are fainter and smaller (zoom in to spot them). Physics is the reason for the difference in the resolution of these images. NIRCam delivers high-resolution imaging because these wavelengths of light are shorter. MIRI supplies medium-resolution imagery because its wavelengths are longer – the longer the wavelength, the coarser the images are. But both deliver an incredible amount of detail about every object they observe – providing never-before-seen vistas of the universe. For a full array of Webb’s first images and spectra, including downloadable files, please visit: https://webbtelescope.org/news/first-images NIRCam was built by a team at the University of Arizona and Lockheed Martin’s Advanced Technology Center. MIRI was contributed by ESA and NASA, with the instrument designed and built by a consortium of nationally funded European Institutes (The MIRI European Consortium) in partnership with JPL and the University of Arizona.

Thousands of galaxies flood this near-infrared image of galaxy cluster SMACS 0723. High-resolution imaging from NASA’s James Webb Space Telescope combined with a natural effect known as gravitational lensing made this finely detailed image possible. First, focus on the galaxies responsible for the lensing: the bright white elliptical galaxy at the center of the image and smaller white galaxies throughout the image. Bound together by gravity in a galaxy cluster, they are bending the light from galaxies that appear in the vast distances behind them. The combined mass of the galaxies and dark matter act as a cosmic telescope, creating magnified, contorted, and sometimes mirrored images of individual galaxies. Clear examples of mirroring are found in the prominent orange arcs to the left and right of the brightest cluster galaxy. These are lensed galaxies – each individual galaxy is shown twice in one arc. Webb’s image has fully revealed their bright cores, which are filled with stars, along with orange star clusters along their edges. Not all galaxies in this field are mirrored – some are stretched. Others appear scattered by interactions with other galaxies, leaving trails of stars behind them. Webb has refined the level of detail we can observe throughout this field. Very diffuse galaxies appear like collections of loosely bound dandelion seeds aloft in a breeze. Individual “pods” of star formation practically bloom within some of the most distant galaxies – the clearest, most detailed views of star clusters in the early universe so far. One galaxy speckled with star clusters appears near the bottom end of the bright central star’s vertical diffraction spike – just to the right of a long orange arc. The long, thin ladybug-like galaxy is flecked with pockets of star formation. Draw a line between its “wings” to roughly match up its star clusters, mirrored top to bottom. Because this galaxy is so magnified and its individual star clusters are so crisp, researchers will be able to study it in exquisite detail, which wasn’t previously possible for galaxies this distant. The galaxies in this scene that are farthest away – the tiniest galaxies that are located well behind the cluster – look nothing like the spiral and elliptical galaxies observed in the local universe. They are much clumpier and more irregular. Webb’s highly detailed image may help researchers measure the ages and masses of star clusters within these distant galaxies. This might lead to more accurate models of galaxies that existed at cosmic “spring,” when galaxies were sprouting tiny “buds” of new growth, actively interacting and merging, and had yet to develop into larger spirals. Ultimately, Webb’s upcoming observations will help astronomers better understand how galaxies form and grow in the early universe. NIRCam was built by a team at the University of Arizona and Lockheed Martin’s Advanced Technology Center. For a full array of Webb’s first images and spectra, including downloadable files, please visit: https://webbtelescope.org/news/first-images

NASA image acquired September 2, 2011 To download the full high res go to: <a href="http://earthobservatory.nasa.gov/IOTD/view.php?id=52059" rel="nofollow">earthobservatory.nasa.gov/IOTD/view.php?id=52059</a> Nearly a week after Hurricane Irene drenched New England with rainfall in late August 2011, the Connecticut River was spewing muddy sediment into Long Island Sound and wrecking the region's farmland just before harvest. The Thematic Mapper on the Landsat 5 satellite acquired this true-color satellite image on September 2, 2011. With its headwaters near the Canadian border, the Connecticut River drains nearly 11,000 square miles (28,500 square kilometers) and receives water from at least 33 tributaries in Vermont, New Hampshire, Massachusetts, and Connecticut. The 410-mile river—New England's longest—enters Long Island Sound near Old Lyme, Connecticut, and is estimated to provide 70 percent of the fresh water entering the Sound. When Irene blew through the region on August 27-28, substantial portions of the Connecticut River watershed received more than 6 to 8 inches (15-20 centimeters) of rainfall, and several locations received more than 10 inches (25 centimeters). Whole towns were cut off from overland transportation—particularly upstream in Vermont, which suffered its worst flooding in 80 years. Thousands of people saw their homes flooded, if not washed off their foundations, at a time of year when rivers are usually at their lowest. Preliminary estimates of river flow at Thompsonville, Connecticut, (not shown in this image) reached 128,000 cubic feet per second (cfs) on August 30, nearly 64 times the usual flow (2,000 cfs) for early fall and the highest flow rate since May 1984. At the mouth of the river—where flow is tidal, and therefore not gauged—the peak water height reached 6.9 feet (2.1 meters) above sea level, almost a foot higher than at any time in the past 10 years. According to Suzanne O'Connell, an environmental scientist working along the Connecticut River at Wesleyan University, the torrent of water coursing through New England picked up silt and clay from the river valleys, giving it the tan color shown in the image above. At Essex, Connecticut, the turbidity (muddiness) of the water was 50 times higher than pre-Irene values. To the east, the Thames River appears to be carrying very little sediment at all on September 2. According to O'Connell, the Thames "drains glaciated terrain, so fine sediment was removed long ago." Most of the land surface in the Thames basin is "just bedrock, till, and glacial erratics." Unlike the Connecticut, areas within the Thames watershed only received 2 to 4 inches of rain in most locations. The flooding that occurred in the aftermath of Hurricane Irene inundated farmland in Massachusetts and Connecticut just before harvest time, the Associated Press noted. Crops were drowned under inches to feet of water. The substantial amounts of soil, sediment, and water deposited on land during the flood could also pose trouble for farmers in coming seasons. "It's notable that whole segments of river bank are just gone," said Andrew Fisk of the Connecticut River Watershed Council. "That's not just loss of sediment. That's land disappearing down river." <b>NASA Earth Observatory image by Robert Simmon, using Landsat 5 data from the U.S. Geological Survey Global Visualization Viewer. Caption by Michael Carlowicz, with interpretation help from Suzanne O'Connell, Wesleyan University, and Andrew Fisk, Connecticut River Watershed Council.</b> Instrument: Landsat 5 - TM Credit: <b><a href="http://www.earthobservatory.nasa.gov/" rel="nofollow"> NASA Earth Observatory</a></b> <b><a href="http://www.nasa.gov/centers/goddard/home/index.html" rel="nofollow">NASA Goddard Space Flight Center</a></b> enables NASA’s mission through four scientific endeavors: Earth Science, Heliophysics, Solar System Exploration, and Astrophysics. Goddard plays a leading role in NASA’s accomplishments by contributing compelling scientific knowledge to advance the Agency’s mission. <b>Follow us on <a href="http://twitter.com/NASA_GoddardPix" rel="nofollow">Twitter</a></b> <b>Like us on <a href="http://www.facebook.com/pages/Greenbelt-MD/NASA-Goddard/395013845897?ref=tsd" rel="nofollow">Facebook</a></b> <b>Find us on <a href="http://web.stagram.com/n/nasagoddard/?vm=grid" rel="nofollow">Instagram</a></b>

Images acquired December 21, 2010 - September 20, 2011. To view a HD animation of this go to: <a href="http://www.flickr.com/photos/gsfc/6175313242/in/photostream/">www.flickr.com/photos/gsfc/6175313242/in/photostream/</a> To download the high res and learn more go to: <a href="http://earthobservatory.nasa.gov/IOTD/view.php?id=52248" rel="nofollow">earthobservatory.nasa.gov/IOTD/view.php?id=52248</a> One of the most frequently misunderstood concepts in science is the reason for Earth’s seasons. As we experience the September equinox today—anyone try to balance an egg yet?—we thought we’d offer a space-based view of what’s going on. Around 6 a.m. local time each day, the Sun, Earth, and any geosynchronous satellite form a right angle, affording a nadir (straight down) view of the terminator, where the shadows of nightfall meet the sunlight of dusk and dawn. The shape of this line between night and day varies with the seasons, which means different lengths of days and differing amounts of warming sunshine. (The line is actually a curve because the Earth is round, but satellite images only show it in two-dimensions.) The Spinning Enhanced Visible and Infrared Imager (SEVIRI) on EUMETSAT's Meteosat-9 captured these four views of the day-night terminator on December 21, 2010, and March 20, June 21, and September 20, 2011. Each image was taken at 6:12 a.m. local time. On March 20 and September 20, the terminator is a straight north-south line, and the Sun is said to sit directly above the equator. On December 21, the Sun resides directly over the Tropic of Capricorn when viewed from the ground, and sunlight spreads over more of the Southern Hemisphere. On June 21, the Sun sits above the Tropic of Cancer, spreading more sunlight in the north and turning the tables on the south. The bulge of our spherical Earth blocks sunlight from the far hemisphere at the solstices; that same curvature allows the Sun’s rays to spread over more area near the top and bottom of the globe. Of course, it is not the Sun that is moving north or south through the seasons, but a change in the orientation and angles between the Earth and its nearest star. The axis of the Earth is tilted 23.5 degrees relative to the Sun and the ecliptic plane. The axis is tilted away from the Sun at the December solstice and toward the Sun at the June solstice, spreading more and less light on each hemisphere. At the equinoxes, the tilt is at a right angle to the Sun and the light is spread evenly. The equinox and changing of the seasons occurs on September 23, 2011 at 9:05 a.m. Universal Time. (Our September image above is a few days early.) Equinox means "equal night" in Latin, capturing the idea that daytime and nighttime are equal lengths everywhere on the planet. That is true of the Sun's presence above the horizon, though it does not account for twilight, when the Sun's rays extend from beyond the horizon to illuminate our gas-filled atmosphere. NASA images and animation by Robert Simmon, using data ©2010 EUMETSAT. Caption by Mike Carlowicz. Instrument: Meteosat Credit: <b><a href="http://www.earthobservatory.nasa.gov/" rel="nofollow"> NASA Earth Observatory</a></b> <b><a href="http://www.nasa.gov/audience/formedia/features/MP_Photo_Guidelines.html" rel="nofollow">NASA image use policy.</a></b> <b><a href="http://www.nasa.gov/centers/goddard/home/index.html" rel="nofollow">NASA Goddard Space Flight Center</a></b> enables NASA’s mission through four scientific endeavors: Earth Science, Heliophysics, Solar System Exploration, and Astrophysics. Goddard plays a leading role in NASA’s accomplishments by contributing compelling scientific knowledge to advance the Agency’s mission. <b>Follow us on <a href="http://twitter.com/NASAGoddardPix" rel="nofollow">Twitter</a></b> <b>Like us on <a href="http://www.facebook.com/pages/Greenbelt-MD/NASA-Goddard/395013845897?ref=tsd" rel="nofollow">Facebook</a></b> <b>Find us on <a href="http://instagrid.me/nasagoddard/?vm=grid" rel="nofollow">Instagram</a></b>

NASA image release March 11, 2011 Caption: The lunar farside as never seen before! LROC WAC orthographic projection centered at 180° longitude, 0° latitude. Credit: NASA/Goddard/Arizona State University. Because the moon is tidally locked (meaning the same side always faces Earth), it was not until 1959 that the farside was first imaged by the Soviet Luna 3 spacecraft (hence the Russian names for prominent farside features, such as Mare Moscoviense). And what a surprise - unlike the widespread maria on the nearside, basaltic volcanism was restricted to a relatively few, smaller regions on the farside, and the battered highlands crust dominated. A different world from what we saw from Earth. Of course, the cause of the farside/nearside asymmetry is an interesting scientific question. Past studies have shown that the crust on the farside is thicker, likely making it more difficult for magmas to erupt on the surface, limiting the amount of farside mare basalts. Why is the farside crust thicker? That is still up for debate, and in fact several presentations at this week's Lunar and Planetary Science Conference attempt to answer this question. The Clementine mission obtained beautiful mosaics with the sun high in the sky (low phase angles), but did not have the opportunity to observe the farside at sun angles favorable for seeing surface topography. This WAC mosaic provides the most complete look at the morphology of the farside to date, and will provide a valuable resource for the scientific community. And it's simply a spectacular sight! The Lunar Reconnaissance Orbiter Camera (LROC) Wide Angle Camera (WAC) is a push-frame camera that captures seven color bands (321, 360, 415, 566, 604, 643, and 689 nm) with a 57-km swath (105-km swath in monochrome mode) from a 50 km orbit. One of the primary objectives of LROC is to provide a global 100 m/pixel monochrome (643 nm) base map with incidence angles between 55°-70° at the equator, lighting that is favorable for morphological interpretations. Each month, the WAC provides nearly complete coverage of the Moon under unique lighting. As an added bonus, the orbit-to-orbit image overlap provides stereo coverage. Reducing all these stereo images into a global topographic map is a big job, and is being led by LROC Team Members from the German Aerospace Center (Deutsches Zentrum für Luft- und Raumfahrt; DLR). Several preliminary WAC topographic products have appeared in LROC featured images over the past year (Orientale basin, Sinus Iridum). For a sneak preview of the WAC global DEM with the WAC global mosaic, view a rotating composite moon (70 MB video from ASU's LROC website). The WAC topographic dataset will be completed and released later this year. The global mosaic released today is comprised of over 15,000 WAC images acquired between November 2009 and February 2011. The non-polar images were map projected onto the GLD100 shape model (WAC derived 100 m/pixel DTM), while polar images were map projected on the LOLA shape model. In addition, the LOLA derived crossover corrected ephemeris, and an improved camera pointing, provide accurate positioning (better than 100 m) of each WAC image. As part of the March 2011 PDS release, the LROC team posted the global map in ten regional tiles. Eight of the tiles are equirectangular projections that encompass 60° latitude by 90° longitude. In addition, two polar stereographic projections are available for each pole from ±60° to the pole. These reduced data records (RDR) products will be available for download on March 15, 2011. As the mission progresses, and our knowledge of the lunar photometric function increases, improved and new mosaics will be released! Work your way around the moon with these six orthographic projections constructed from WAC mosaics. The nearside view linked below is different from that released on 21 February. To read more con't here: <a href="http://www.nasa.gov/mission_pages/LRO/news/lro-farside.html" rel="nofollow">www.nasa.gov/mission_pages/LRO/news/lro-farside.html</a> <b><a href="http://www.nasa.gov/centers/goddard/home/index.html" rel="nofollow">NASA Goddard Space Flight Center</a></b> enables NASA’s mission through four scientific endeavors: Earth Science, Heliophysics, Solar System Exploration, and Astrophysics. Goddard plays a leading role in NASA’s accomplishments by contributing compelling scientific knowledge to advance the Agency’s mission. <b>Follow us on <a href="http://twitter.com/NASA_GoddardPix" rel="nofollow">Twitter</a></b> <b>Join us on <a href="http://www.facebook.com/pages/Greenbelt-MD/NASA-Goddard/395013845897?ref=tsd" rel="nofollow">Facebook</a></b>